PASBO presentation
38
PRM CONSULTING GROUP, INC • 3206 TOWER OAKS BOULEVARD, SUITE 400 • ROCKVILLE, MD 20852 • 301.951.5104 Statewide Health Care Study: Review of Findings So What’s Next? Date: March 11, 2016 Presented to: PASBO
-
Upload
adam-reese -
Category
Healthcare
-
view
123 -
download
0
Transcript of PASBO presentation

PRM CONSULTING GROUP, INC • 3206 TOWER OAKS BOULEVARD, SUITE 400 • ROCKVILLE, MD 20852 • 301.951.5104
Statewide Health Care Study:
Review of Findings
So What’s Next?
Date: March 11, 2016
Presented to: PASBO

Background
Senate Resolution 250 directed a study of
the feasibility and cost effectiveness of
merging public school district health
plans.
2
The study included medical, dental, vision, and prescription drug benefits and addresses eleven areas:

SR 250 Had 11 Study Areas
3
1. Analysis of the specific health benefits, policies and contracts provided by at least 50 percent of the school entities throughout the Commonwealth
2. Cost of current benefits for the next five years
3. Cost of current school employee contribution or average per employee.
4. Impact on PSERS and SERS
5. Comparison of coverage with average taxpayer in the relevant region.
6. Regionalization versus one health care plan.
7. Cost savings realized with consortia
8. Administrative, staffing, and technology costs associated with forming mergers.
9. Comparison of school employees with Commonwealth employees
10. Cost of least used benefits by school employees
11. Cost impact of Health Care Reform (PPACA)

Today I’ll focus on the findings from these 6
4
1. Analysis of the specific health benefits, policies and contracts provided by at least 50 percent of the school entities throughout the Commonwealth
2. Cost of current school employee contribution or average per employee
3. Comparison of coverage with average taxpayer in the relevant region
4. Comparison of school employees with Commonwealth employees
5. Regionalization versus savings from one state-wide health care plan
6. Cost impact of Health Care Reform (PPACA)
Following set of slides provide the findings on 1. and 2.

Analysis of School Health Benefit Plans
Information was gathered from a variety of sources, including school districts,
health care consortia, health insurance companies and interviews with key
stakeholders.
5
Data Provided
• The survey was administered to all 500 school districts
• Respondents provided copies of their CBAs, SPDs and health plan rates
• 27 of the 37 Consortia provided claims data for last 5 years
PA-taxpayer health insurance information
from:
• Aetna
• Capital Blue Cross
• Geisinger Health System
• Highmark Blue Cross Blue Shield
• Independence Blue Cross
Stakeholder interviews
• PEBTF
• PASBO
• PSEA
• PAIU
• PSERS
• SERS
• Philadelphia Federation of Teachers H&W Fund
• Department of Education
• State Board of Education
• Governor’s Office of Administration
• Pennsylvania Association of Health Underwriters

Survey Respondents
6
269 (54%) schools submitted responses

Key Findings
Most school districts obtain coverage through a consortium
Over 85% of schools participate in one of 37 Consortia
Consortia have experienced below average healthcare cost trends
Some are implementing novel cost-saving programs
7

Key Findings
8
25%
18%
4%5%
48%
EE only
EE + Spouse
EE + Child
EE + Children
EE + Family
88%
50%43%
0%
10%
20%
30%
40%
50%
60%
70%
80%
90%
100%
Medical Dental Vision
Employee Contributions Required
$128
$106
$57
$0 $20 $40 $60 $80 $100 $120 $140
EE + Family
EE + Spouse
EE only
Average Monthly Medical Contribution

Key Findings
9
38%
57%
60%
85%
86%
86%
0% 10% 20% 30% 40% 50% 60% 70% 80% 90% 100%
Grandfathered Plan
Dental coverage is self-insured
Vision coverage is self-insured
Medical coverage is self-insured
School districts participating in a consortium
Prescription Drugs included w/ Medical Plan

Medical Plan Designs
10
Percentiles 10% 25% Median 75% 90%
Summary across all plans, including plans with no deductibles
Individual coverage cost-sharing
In-Network Deductible $- $- $100 $350 $1,300
Out of Network Deductible $200 $250 $400 $700 $1,500
In Network Out-of-Pocket maximum $515 $1,888 $6,350 $6,350 unlimited
In Network Coinsurance 100% 100% 100% 100% 100%
Out of Network Coinsurance 100% 80% 80% 80% 70%
Summary across only plans with deductibles
In-Network Deductible $100 $231 $350 $713 $1,300
Out of Network Deductible $200 $250 $450 $700 $1,500
In Network Out-of-Pocket maximum $515 $1,888 $6,350 $6,350unlimite
d

Medical Plan Designs
11
Percentiles 10% 25% Median 75% 90%
Summary across all plans, including plans with no copays
Office Visits
Primary Care Physician $- $- $10 $20 $20Specialist $- $10 $20 $25 $30Emergency Room $- $- $35 $75 $100Routine Lab $- $- $- $- $10
Radiology $- $- $- $- $10Summary across only those plans with copays
Office Visits
Primary Care Physician $10 $10 $15 $20 $25
Specialist $10 $15 $20 $25 $30
Emergency Room $25 $35 $50 $100 $100
Routine Lab $10 $10 $15 $20 $21
Radiology $10 $10 $15 $20 $26
Hospital and Outpatient Copays
Hospital In Network Per Admission $22 $38 $100 $250 $365
Hospital In Network Per Day Copay $75 $75 $75 $88 $150
Outpatient In Network Copay $13 $20 $30 $75 $100

Prescription Drug Plan Designs
12
Percentiles 10% 25% Median 75% 90%
Summary across only those plans using copays
Retail
Generic Copay $5 $5 $8 $10 $10
Brand Formulary Copay $10 $15 $20 $30 $35
Brand Non-Formulary Copay $15 $25 $35 $50 $60
Specialty Copay $15 $25 $35 $50 $70
Mail Order
MO Generic Copay $7 $10 $12 $20 $20
MO Brand Formulary Copay $20 $25 $40 $50 $70
MO Brand Non-Formulary Copay $20 $35 $60 $90 $110

Prescription Drug Plan Designs
13
Percentiles 10% 25% Median 75% 90%
Summary across only those plans using coinsurance
Retail Generic 18% 20% 20% 20% 20%
Retail Brand Formulary 20% 20% 20% 20% 25%
Retail Brand Non-Formulary 20% 20% 20% 20% 40%
MO Generic 18% 20% 20% 20% 20%
MO Brand Formulary 20% 20% 20% 20% 22%
MO Brand Non-Formulary 20% 20% 20% 20% 40%

Health Plan Actuarial Values
14
Definition – the estimated percentage of a typical policyholder’s healthcare
bills that the plan is expected to pay. The smaller the member’s out-of-
pocket costs the larger the plan’s actuarial value.
Under PPACA, employer plans must have a minimum actuarial value of 60%
to avoid an employer penalty.
On the healthcare exchanges, to facilitate comparison shopping, healthcare
plans must have an actuarial value that fits one of four metal tiers:
Platinum = 90%
Gold = 80%
Silver = 70%
Bronze = 60%
Individual plan AV’s can be no more than +2% or -2% from these values to
be eligible for the Exchanges.

Actuarial Values of School Health Plans
15
Actuarial Value Percent of SchoolHealth Plans
Platinum plus Over 92% 71%
Platinum 88% to 92% 14%
Gold plus >82% and <88% 14%
Gold 78% to 82% 1%
Silver plus >72% and <78% 1%
Silver 68% to 72% 0%
Bronze & bronze plus >60% and <68% 0%
85% of SD’s have health plans with an actuarial value of 90% or more, with
over 70% more generous than is permitted for a plan to be marketed on the
Exchanges.
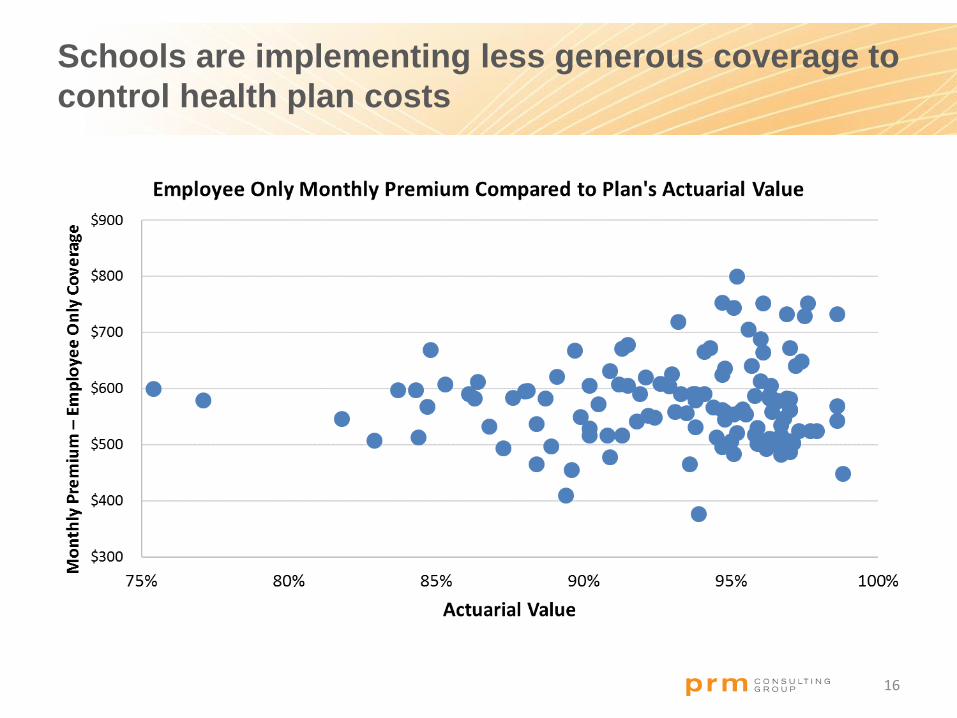
Schools are implementing less generous coverage to
control health plan costs
16

Healthcare costs varied substantially among consortia.
The largest consortium (ACSHIC) had the lowest cost.
17
An
nu
al
Co
st
Number of Covered Lives

Next we’ll compare how the school health
plans compare to the average tax payer
18
3. Comparison of coverage with average taxpayer in the relevant region

Average Taxpayer Coverage
19
Health Plan Coverage Level Actuarial Value Group PoliciesIndividual
PoliciesTotal
Platinum plus Above 92% 223,409 - 223,409
Platinum 88% to 92% 605,974 31,772 637,746
Gold plus 82.1% to 87.9% 486,272 43 486,315
Gold 78% to 82% 464,245 81,296 545,541
Silver plus 72.1% to 77.9% 296,712 8,632 305,344
Silver 68% to 72% 174,118 265,607 439,725
Bronze & bronze plus 60% to 67.9% 104,570 58,484 163,054
Total 2,355,300 445,834 2,801,134
Average Actuarial Value 82.9% 72.7% 81.3%
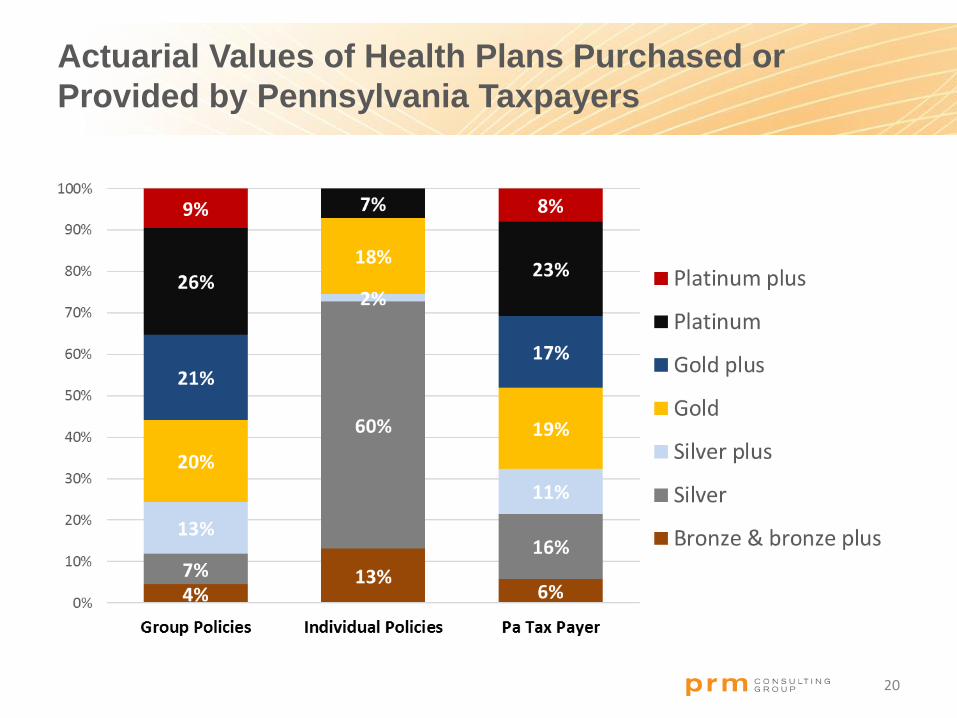
Actuarial Values of Health Plans Purchased or
Provided by Pennsylvania Taxpayers
20

Comparison of Actuarial Values of Pa Tax Payer
Coverage with School Health Plans
21

Comparison of Actuarial Values of Health Plans of Pa
Tax Payers by Region
22
85.4% 85.2%83.4%
80.7%
60%
65%
70%
75%
80%
85%
90%
Western Northeastern Central Southeastern
Group Policies
73.7%75.9%
73.7%71.1%
60%
65%
70%
75%
80%
85%
90%
Western Northeastern Central Southeastern
Individual Policies
Group policies are more generous in the Western and Northeastern parts of
the Commonwealth. For both Group and Individual policies, less generous
plans are purchased or provided in the Southeastern area. This may be a
consequence of the higher cost of healthcare in Philadelphia and
surrounding suburbs.

Comparison of School Employee Benefits
to State Employee Benefits
23
4. Comparison of school employees with Commonwealth employees

School & State Employees
Plan Design Comparison
24
In-Network Out-of-Network / Non-Network Providers
Plan Feature/Benefit School Median Plan
State PPO Plan
School Median Plan State PPO Plan
Deductible—Individual $ 300 None $ 750 $400
—Family $500 None $1,500 $400 per person
Member Coinsurance 20% 0% 20% 30%
Out-of-pocket limit—Individual $1,300 $6,600 $3,000 $1,900
—Family $1,500 $13,200 $6,000 $3,000 excluding deductible
Hospital inpatient (member pays) 100% 100% 20% 30%
Outpatient care (member pays) 20% $15 20% 40%
Emergency room $85 $50 $50
Urgent care facility 20%
Office visit—Primary care (member pays) 20% $15 $25 30%
—Specialist (member pays) 20% $25 $40 30%

School & State Employees
Plan Design Comparison
25
In-Network
Plan Feature/Benefit School Median Plan State PPO Plan
Retail copays
Generic drugs $7 $10
Formulary $12 $18 +
Non-Formulary $20 $36
Mail Order Copays
Generic drugs $5 $15
Formulary $20 $27 +
Non-Formulary $30 $54
+ Plus pay the difference between the cost of the generic and the brand drug.
Median School Health Plan State PPO Plan
Actuarial Value 95% 96%

Comparison of School Employee Benefits to State
Employee Benefits – Dental Benefits
26
School Dental Benefits State
Percent Paid by Plan 100% 80% to 90% 60% to 75% 50%Schools Average
PEBTF
Preventive Services 96% 3% 1% 0% 98% 100%
Basic Restorative Services 83% 14% 3% 0% 95% 90%
Major Restorative Services 21% 29% 6% 44% 66% 60%
Maximum benefit $1,215 $1,000
Average deductible $27 $50
Most, but not all, schools provide dental coverage. Almost all (96 percent) of school districts cover
preventive services at 100 percent. Most (83 percent) school districts cover basic restorative services at
100 percent. Only 21 percent of school districts cover major restorative services at 100 percent, with
the most common level at 50 percent.

Comparison of School Employee Benefits to State
Employee Benefits – Vision Benefits
PEBTF Participating Provider Non-Participating Provider
Yearly vision examination 100% covered Allowance of up to $28
Glaucoma test 100% covered Allowance of up to $3
LensesStandard glass/plastic
are covered in full
Single vision: $15Bifocals: $24.50
Ex-Bifocals: $26.50Trifocals: $31.00Aphakic: $60.00
Frames – up to $20Covered in full up to a
maximum of $20 $20.00
Frames – above $20 80% covered $20.00
27

Comparison of School Employee Benefits to State
Employee Benefits – Vision Benefits
28
Vision Coverages School District Plans PEBTF
25th Percentile Median 75th Percentile
Vision exam-amount plan pays (where not 100%) $30 $39 $58.75 $28
Standard single lenses amount plan pays 24 30 60 15
Bifocal lenses-amount plan pays 36 40 73 24.50
Trifocal lenses-amount plan pays 46 60 94 31
Frames-amount plan pays 24 55 62 20
Medically necessary contact lenses-amount plan pays 70 160 250
Elective contact lenses-amount plan pays 73.50 80 125

Comparison of school employees with Commonwealth
employees – average annual employee premiums
29PEBTF cost based on salary of $55,450

Almost finished – lets review the potential
cost-savings from mergers
30
5. Regionalization versus savings from one state-wide health care plan

State-wide Pharmacy Benefit Program
Pharmacy benefits carved out from each medical plan.
Three or four benefit levels – to minimize copay differences moving from
current design to the state-wide program.
Each school district (or Consortium) could choose the benefit level(s) they
want for the first year of operation. School districts could move to one of the
alternative designs at open enrollment.
Single PBM to administer the program. PBM selected through a
competitive bidding process.
Could also include member choice from among 3 networks – with savings
passed on to participants.
31

Pharmacy Benefits – Current Benefit Levels
Schools Pharmacy Copays PEBTF KFF
10th MEDIAN 90th
Retail Generic Copay $5 $8 $10 $10 $11
Retail Brand Formulary Copay $10 $20 $35 $18 $31
Retail Brand Non-Formulary Copay $15 $35 $60 $36 $54
Retail Specialty $15 $35 $70 $36 $93
32
Smaller variation in pharmacy plan design across schools than in medical
Median plan design comparable to the PEBTF plan
90th percentile plan design comparable to private sector (KFF)
Only 14% of SDs have carved out prescription drugs
Opportunity to capitalize on bulk purchasing power if pharmacy is carved out of
all healthcare plans and competitively bid with 3-4 plan designs

State-wide Pharmacy Benefit Program
Straw man plan designs
Superior High Standard Basic
Generic $5 $10 $10 $10
Preferred brand $10 $20 $35 20% ($25 min. and $75 max.)
Non-preferred brand $15 $35 $60 50% ($50 min. and $100 max.)
Specialty $25 $40 $75 50% ($50 min. and $100 max.)
Mail Order 90 day supply at equivalent of 2 copays rather than 3
33
Network Choices
Broad PBM’s full network of pharmacies
Performance PBM’s performance network
Performance plus PBM’s performance network plus maintenance drugs must be purchased through mail-order.
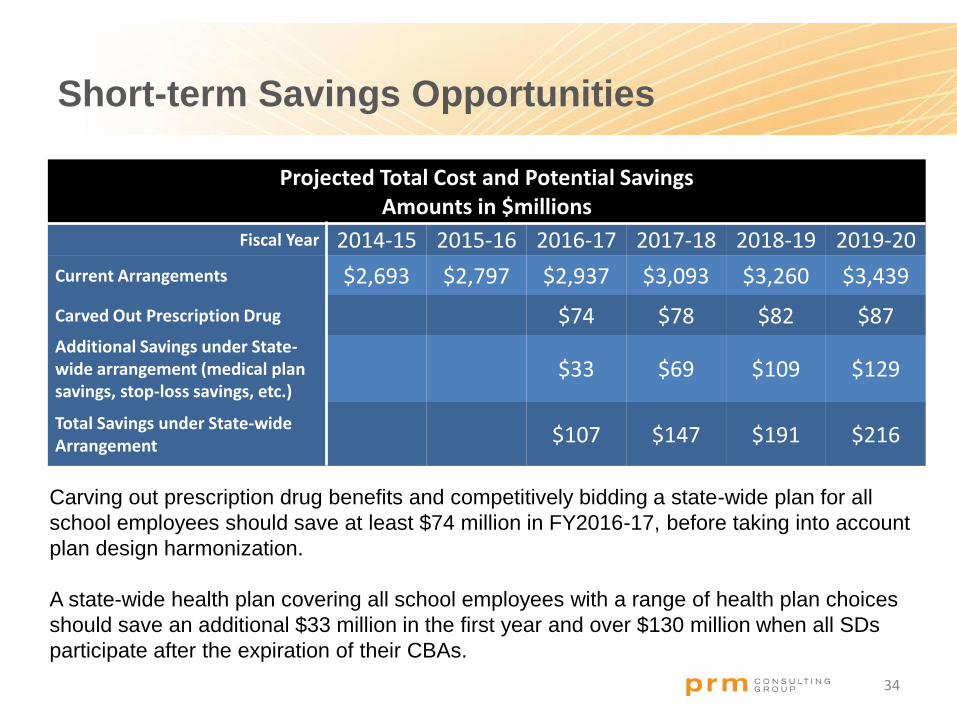
Short-term Savings Opportunities
Projected Total Cost and Potential Savings Amounts in $millions
Fiscal Year 2014-15 2015-16 2016-17 2017-18 2018-19 2019-20
Current Arrangements $2,693 $2,797 $2,937 $3,093 $3,260 $3,439
Carved Out Prescription Drug $74 $78 $82 $87Additional Savings under State-wide arrangement (medical plan savings, stop-loss savings, etc.)
$33 $69 $109 $129
Total Savings under State-wide Arrangement $107 $147 $191 $216
34
Carving out prescription drug benefits and competitively bidding a state-wide plan for all
school employees should save at least $74 million in FY2016-17, before taking into account
plan design harmonization.
A state-wide health plan covering all school employees with a range of health plan choices
should save an additional $33 million in the first year and over $130 million when all SDs
participate after the expiration of their CBAs.

Lastly, we identified an opportunity to
mitigate costs from PPACA
35
6. Cost impact of Health Care Reform (PPACA)

Longer-term Savings Opportunities
36
Healthcare Reform added an Excise Tax on high-cost health plans. The tax is
40% of the excess of the cost above a threshold of $10,200 for self-only
coverage and $27,500 for “other than self-only coverage”. Implementation date
of 2018 has been postponed to 2020, with the likelihood of more plans hitting
the threshold in the first year of operation.
If SDs participated in a multiemployer plan, the threshold is $27,500 (indexed)
for all employees, which has the effect of reducing the amount of the tax. The
savings are significant as illustrated in the table below (projected cost in 2027)
of $2,500 per employee – about 6% of the premium cost.
Threshold Cost Excess Tax Employees Total tax
Self $12,309 $16,823 $4,514 $1,806 30 $54,168
Other $33,187 $45,355 $12,168 $4,867 70 $340,704
Total single employer $394,872
Multiemployer $33,187 $36,796 $3,609 $1,444 100 $144,360
Savings if SDs participate in a multiemployer plan $250,512

Next Steps
Establish a statewide pharmacy program but who leads:
PEBTF? PSERS-HOP? PSEA?
Regional health plan:
Merging of “small” consortia
Merging of “high cost” consortia to avoid/defer Cadillac Tax
Implementing best practices:
Cost effective plan design options
Narrow networks
Contribution policies
Statewide health plan
Would likely need to be legislated, rather than voluntary to be
successful
37

Questions?
I would be happy to answer any questions you may have now, or after the
conference
Adam Reese FSA, FCA, MAAA
(301) 951.5107
38