PARTNERSHIPS FOR HEA LTHY DIETS AND NUTRITION IN …
25
1 | The Kanyanya food challenge PARTNERSHIPS FOR HEALTHY DIETS AND NUTRITION IN URBAN AFRICAN FOOD SYSTEMS – EVIDENCE AND STRATEGIES “THE KANYANYA FOOD CHALLENGE – FOOD SYSTEMS MAPPING” PROGRESS REPORT DELIVERABLE WP1: NOURICITY - KAMPALA Vincent Linderhof, Youri Dijkxhoorn (both Wageningen Economic Research), Joel Onyango (BoP innovation centre), Andrea Fongar (Bioversity International), and Martha Nalweyiso Date of the report 31-12-2019 Acknowledgement: The authors are grateful for financial support from the Netherlands Ministry of Agriculture, Nature and Food Quality (grant number BO-43-003.02-009 as part of LEAP-Agri program), and the flagship program Food Systems for Healthier Diets of the CGIAR program Agriculture for Nutrition and Health (A4NH).
Transcript of PARTNERSHIPS FOR HEA LTHY DIETS AND NUTRITION IN …

1 | The Kanyanya food challenge
PARTNERSHIPS FOR HEALTHY DIETS AND NUTRITION IN URBAN AFRICAN FOOD SYSTEMS
– EVIDENCE AND STRATEGIES
“THE KANYANYA FOOD CHALLENGE – FOOD SYSTEMS MAPPING”
PROGRESS REPORT
DELIVERABLE WP1: NOURICITY - KAMPALA
Vincent Linderhof, Youri Dijkxhoorn (both Wageningen Economic Research), Joel Onyango (BoP innovation centre), Andrea Fongar (Bioversity International), and Martha Nalweyiso Date of the report 31-12-2019 Acknowledgement: The authors are grateful for financial support from the Netherlands Ministry of Agriculture, Nature and Food Quality (grant number BO-43-003.02-009 as part of LEAP-Agri program), and the flagship program Food Systems for Healthier Diets of the CGIAR program Agriculture for Nutrition and Health (A4NH).

2 | The Kanyanya food challenge
Contents Glossary ............................................................................................................................ 3
List of figures ..................................................................................................................... 5
List of tables ...................................................................................................................... 6
1 Introduction ................................................................................................................. 7
2 Desk study ................................................................................................................... 8
1.1 2.1 Description of Kampala .................................................................................... 8
1.2 2.2 Food security................................................................................................ 10
1.3 2.3 Food systems ............................................................................................... 10
2.1.1 2.3.1 Food supply ........................................................................................... 11
2.1.2 2.3.2 Food demand ......................................................................................... 11
1.4 2.4 Relevant policies on food and nutrition security ................................................. 11
3 Case study ................................................................................................................. 12
1.5 3.1 Introduction ................................................................................................. 12
1.6 3.2 Field trip for site selection .............................................................................. 12
1.7 3.3 Selection of parish: Kanyanya ......................................................................... 14
1.8 3.4 Food flow mapping and stakeholder consultation ............................................... 15
3.1.1 3.4.1. Stakeholders mapping Kanyanya .............................................................. 15
3.1.2 3.4.2 Stakeholder consultation .......................................................................... 16
3.1.3 3.4.3 Workshop outcomes ................................................................................ 17
3.1.4 3.4.4.Food system maps .................................................................................. 18
1.9 3.5 Migration ..................................................................................................... 20
4 Next steps and activities for 2020 .................................................................................. 21
References ...................................................................................................................... 22
Annex 1 Questions of semi-structured interviews .................................................................. 24
Annex 2 Related projects ................................................................................................... 25
1.10 Food4Cities (LEAP-AGRI) ..................................................................................... 25
1.11 SmallFishFood (LEAP-AGRI) ................................................................................. 25
1.12 NUTRIFOODS (LEAP-AGRI) .................................................................................. 25
1.13 Feeding cities and migration................................................................................. 25

3 | The Kanyanya food challenge
Glossary Acronym Organisation ARC Agricultural Resources Centre in Kjanya ASSP Agriculture Sector Strategic Plan CGIAR Consultative Group on International Agricultural Research CRFS City Region Food Systems DSIP Agriculture Sector Development Strategy and Investment Plan FAO Food and Agriculture Organization of the United Nations HLPE High-Level Panel of Experts KCCA Kampala Capital City Authority KDDP Kampala District Development Plan LEAP-Agri A joint Europe Africa Research and Innovation (R&I) initiative related to Food
and Nutrition Security and Sustainable Agriculture (FNSSA). MAAIF Ministry of Agriculture, Animal Industry and Fisheries MOH Ministry of Health NAADS National Agricultural Advisory Services NARO National Agricultural Research Organization NDPII 2nd National Development Plan NFNC National Food and Nutrition Council PEAP Poverty Eradication Action Plan PMA Plan for Modernization of Agriculture PRSP Poverty Reduction Strategy Plan TVA Traders and vendors Association UBOS Uganda Bureau of Statistics UFNP Uganda Food and Nutrition Policy UFS Urban Food System UN United Nations UNAP Uganda Nutrition Action Plan UNEP United Nations Environment Programme UPA Urban and peri-urban agriculture WHO World Health Organization
4 | The Kanyanya food challenge
5 | The Kanyanya food challenge
List of figures Figure 1: Population in Kampala per division (Uganda Bureau of Statistics 2017) ..................... 8 Figure 2: Framework of the food system approach (van Berkum, Dengerink, and Ruben 2018) 10 Figure 3: Retail shops (RS) in Kanyanya parish ................................................................. 18 Figure 4: Supermarkets (SS), Markets (MM) and hotels in Kanyanya parish .......................... 19 Figure 5: Food kiosks (K) in Kanyanya parish ................................................................... 19

6 | The Kanyanya food challenge
List of tables Table 1: Number of villages, parishes and sub-counties of the five Divisions of Kampala (Uganda
Bureau of Statistics 2017) ...................................................................................... 9 Table 2: Main population characteristics per district of Kampala according to National Population
and Housing Census 2014 (Uganda Bureau of Statistics 2017) ..................................... 9 Table 3: Main housing characteristics per district of Kampala according to the National Population
and Housing Census 2014 (Uganda Bureau of Statistics 2017) ..................................... 9 Table 4: List of plans and policies relevant for urban food security in Kampala ......................... 11 Table 5: Descriptive statistics of selected parishes (Uganda Bureau of Statistics 2017) .............. 12 Table 6: List of key stakeholders with general overview of the involvement* ............................ 15 Table 7: List of key activities ............................................................................................. 21

7 | The Kanyanya food challenge
1 Introduction NOURICITY is a LEAP-agri funded project and its objective is to initiate and implement partnership agreements between stakeholders of the urban food system on healthier food choices. The project is explored in Accra (Ghana), Cape Town (South Africa) and Kampala (Uganda). The project is funded by the EU and national donors. For the Kampala case, the project is led by Wageningen Economic Research and executed together with Bioversity International, and BoP innovation centres. Wageningen Economic Research is funded by the Dutch Ministry of Agriculture, Nature and Food Quality. This progress report describes the results of various activities of WP1 of the NOURICITY project implemented in the year 2019. One of the greatest challenges in development is ensuring that people have reliable access to quality and sufficient to ensure food and nutrition security. The agriculture system has been proposed as a key driver in addressing food and nutrition security (Hazell and Wood 2008). Although in aggregate the global agricultural system is producing adequate food, access to affordable and enough nutritious food has been lacking in both developed and developing countries (HLPE 2017; FAO and WHO 2013). In the Uganda National Development Plan (NDP), the government recognises that the country’s food security situation has been unsatisfactory since 1992 (Republic of Uganda 2015a). Further, millions of Ugandans are classified as either food-insecure, hungry or vulnerable (Tusiime, Renard, and Smets 2013). The Agriculture Sector Development Strategy and Investment Plan (DSIP) states that the number of people who are food insecure increased from 12 million in 1992 to 17.7 million in 2007 (MAAIF 2010). The population increase notwithstanding, this represents a big proportion of food-insecure people for a small country like Uganda. It generally means that more than half of Uganda’s population is food insecure. As such, the nutrition security of many people in Uganda remains worrying. In 1963, the caloric intake in Uganda was 2,356 kcal per person per day (Cleave 1968), while based on the 2005/06 Uganda National Household Survey data, report the caloric intake of 1,970 per capita per day (Ssewanyana and Kasirye 2010). As such, in 2006 a population of 17.5 million Ugandans in 3.1 million households were unable to meet the minimum caloric requirement. The prevalence of chronic malnutrition (i.e. stunting) for children under 5 years of age (38% in 2006) placed the country at a high level of malnutrition (Schinca 2009). By 2017, the Uganda Bureau of Statistics reported that at least 11.1 million Ugandans (accounting for 30% of the population) eat food described as "unacceptable" for human development (Mwesigwa 2017). According to Action Aid, millions of Ugandans are classified as either food-insecure, hungry or vulnerable (Action Aid Uganda 2019). Chapter 2 discusses the results of the desk study which explored to address the urgencies in the food system in Kampala and the food systems approach. In Chapter 3, we present the information and selection of the Parish to conduct our field experiment with the interventions to promote healthier and sustainable diets. This includes the results of field trips, interviews and the workshop. Finally, Chapter 4 presents the next steps.

8 | The Kanyanya food challenge
2 Desk study
2.1 Description of Kampala
Kampala is the capital and the largest city of Uganda. The city has grown at a remarkable rate over the last several decades. Originally a small township of 0.7 km2, an average annual spatial growth rate of 6 % since 1902 has produced a city of 189 km2 (KCCA 2015). In 2014, the city counted two million inhabitants (Uganda Bureau of Statistics, 2017) which was 31 % of the total urban population of Uganda (KCCA 2015), while the total metropolitan population was approximately four million (KCCA 2015). Uganda as a whole has experienced one of the world’s highest population growth rates and, as with like many African countries, the population is expected to reach 100 million by 2050 (Uganda Bureau of Statistics 2017). The city has expanded in all directions with growth primarily concentrated along main roads, as such, between 1989 and 2010 the total built-up area increased exponentially, a result of both natural increase and migration (Uganda Bureau of Statistics 2017).
Figure 1: Population in Kampala per division (Uganda Bureau of Statistics 2017)
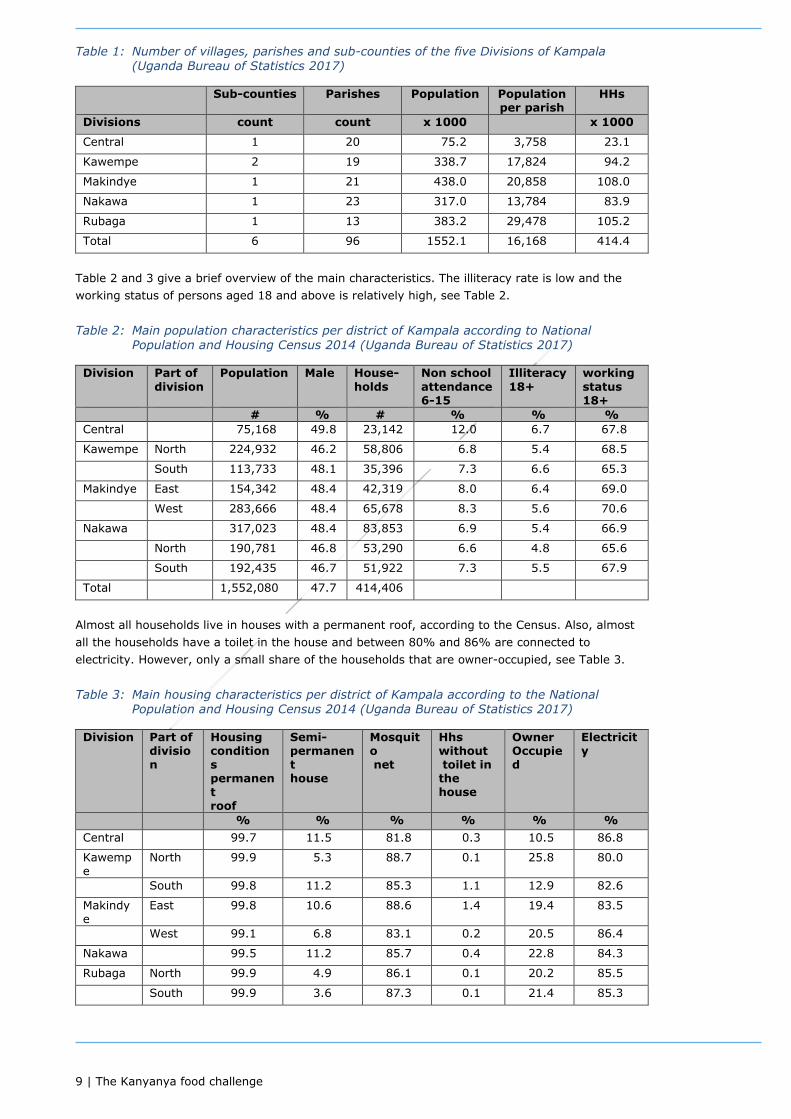
Kampala is divided into 5 boroughs that oversee local planning Kampala Central Division, Kawempe Division, Makindye Division, Nakawa Division and Rubaga Division which forms Kampala District, see Figure 1. Except Kawempe division, which has two subcounties, the divisions consist of one subcounty. Each subcounty of Kampala is divided into parishes, which are further divided into villages. Table 1 gives an overview of the number of parishes and the number of villages. At the east of Nakawa division, there is the rapidly growing Wakiso District (Uganda Bureau of Statistics 2017). The average population per parish ranges from 3568 in Kampala Central Division to almost 30,000 in Rubaga Division, see Table 1.
9 | The Kanyanya food challenge
Table 1: Number of villages, parishes and sub-counties of the five Divisions of Kampala (Uganda Bureau of Statistics 2017)
Sub-counties Parishes Population Population
per parish HHs
Divisions count count x 1000 x 1000
Central 1 20 75.2 3,758 23.1
Kawempe 2 19 338.7 17,824 94.2
Makindye 1 21 438.0 20,858 108.0
Nakawa 1 23 317.0 13,784 83.9
Rubaga 1 13 383.2 29,478 105.2
Total 6 96 1552.1 16,168 414.4
Table 2 and 3 give a brief overview of the main characteristics. The illiteracy rate is low and the working status of persons aged 18 and above is relatively high, see Table 2. Table 2: Main population characteristics per district of Kampala according to National
Population and Housing Census 2014 (Uganda Bureau of Statistics 2017)
Division Part of division
Population Male House- holds
Non school attendance 6-15
Illiteracy 18+
working status 18+
# % # % % % Central 75,168 49.8 23,142 12.0 6.7 67.8
Kawempe North 224,932 46.2 58,806 6.8 5.4 68.5
South 113,733 48.1 35,396 7.3 6.6 65.3
Makindye East 154,342 48.4 42,319 8.0 6.4 69.0
West 283,666 48.4 65,678 8.3 5.6 70.6
Nakawa 317,023 48.4 83,853 6.9 5.4 66.9
North 190,781 46.8 53,290 6.6 4.8 65.6
South 192,435 46.7 51,922 7.3 5.5 67.9
Total 1,552,080 47.7 414,406
Almost all households live in houses with a permanent roof, according to the Census. Also, almost all the households have a toilet in the house and between 80% and 86% are connected to electricity. However, only a small share of the households that are owner-occupied, see Table 3. Table 3: Main housing characteristics per district of Kampala according to the National
Population and Housing Census 2014 (Uganda Bureau of Statistics 2017)
Division Part of division
Housing conditions permanent roof
Semi- permanent house
Mosquito net
Hhs without toilet in the house
Owner Occupied
Electricity
% % % % % % Central
99.7 11.5 81.8 0.3 10.5 86.8
Kawempe
North 99.9 5.3 88.7 0.1 25.8 80.0
South 99.8 11.2 85.3 1.1 12.9 82.6
Makindye
East 99.8 10.6 88.6 1.4 19.4 83.5
West 99.1 6.8 83.1 0.2 20.5 86.4
Nakawa
99.5 11.2 85.7 0.4 22.8 84.3
Rubaga North 99.9 4.9 86.1 0.1 20.2 85.5
South 99.9 3.6 87.3 0.1 21.4 85.3
10 | The Kanyanya food challenge
2.2 Food security
Uganda wants to address issues of food security and nutrition and to promote development, according to the Uganda Food and Nutrition Policy of 2003 (Republic of Uganda 2003). Food security promotes good nutrition and good nutrition is key to good health and the socio-economic wellbeing of a population. Food security and nutrition are mutually reinforcing; social and economic factors have overriding influences on either one or both of them (Kennedy, Nantel, and Shetty 2004). The government of Uganda is committed to the good health and nutrition of its entire people, and therefore, formulated the UFNP to promote food security and adequate nutrition for the population (Republic of Uganda 2003).
2.3 Food systems
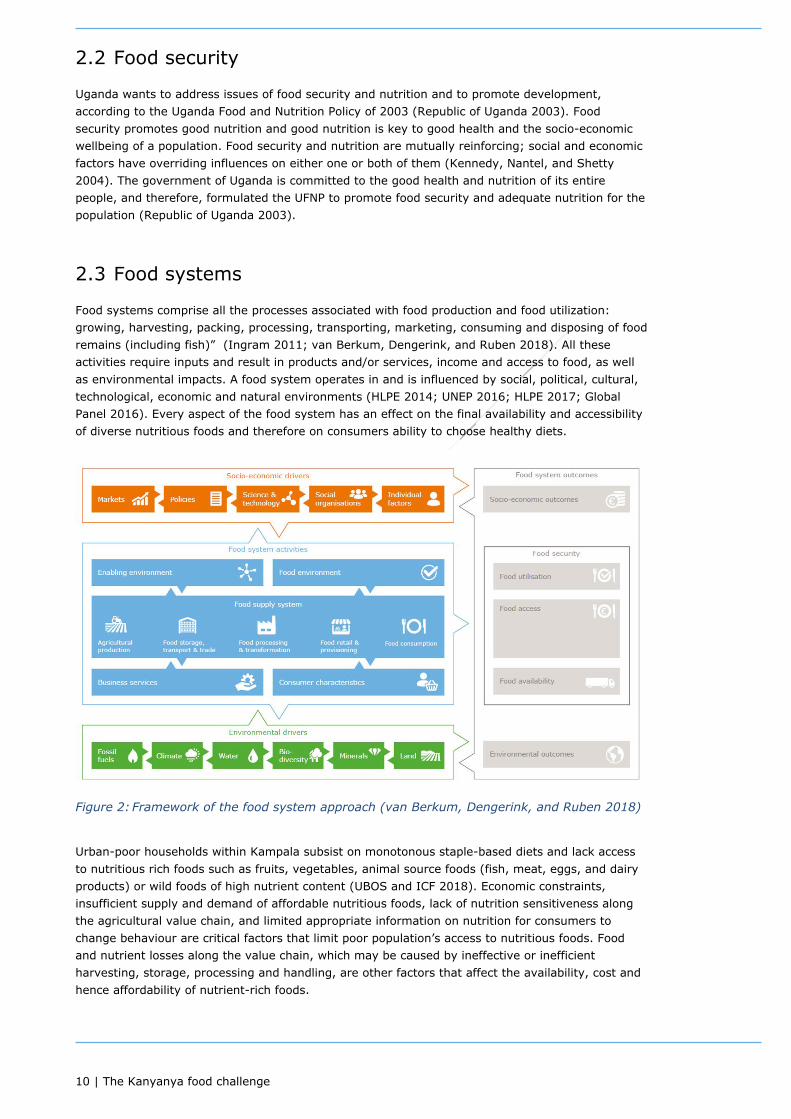
Food systems comprise all the processes associated with food production and food utilization: growing, harvesting, packing, processing, transporting, marketing, consuming and disposing of food remains (including fish)” (Ingram 2011; van Berkum, Dengerink, and Ruben 2018). All these activities require inputs and result in products and/or services, income and access to food, as well as environmental impacts. A food system operates in and is influenced by social, political, cultural, technological, economic and natural environments (HLPE 2014; UNEP 2016; HLPE 2017; Global Panel 2016). Every aspect of the food system has an effect on the final availability and accessibility of diverse nutritious foods and therefore on consumers ability to choose healthy diets.
Figure 2: Framework of the food system approach (van Berkum, Dengerink, and Ruben 2018)
Urban-poor households within Kampala subsist on monotonous staple-based diets and lack access to nutritious rich foods such as fruits, vegetables, animal source foods (fish, meat, eggs, and dairy products) or wild foods of high nutrient content (UBOS and ICF 2018). Economic constraints, insufficient supply and demand of affordable nutritious foods, lack of nutrition sensitiveness along the agricultural value chain, and limited appropriate information on nutrition for consumers to change behaviour are critical factors that limit poor population’s access to nutritious foods. Food and nutrient losses along the value chain, which may be caused by ineffective or inefficient harvesting, storage, processing and handling, are other factors that affect the availability, cost and hence affordability of nutrient-rich foods.

11 | The Kanyanya food challenge
2.3.1 Food supply
The diets in Kampala mainly is composed of Plantain (Matoke), starchy roots (cassava, sweet potatoes, yams) and cereals (maize, beans, millet, sorghum, rice and wheat), pulses, nuts and green leafy vegetables compliment diets (FAO 2010). In the last decades, there has been increased urbanization (from less than 1 km2 in 1902 to 189 km2 in 2017) and the growth in population (from less than 10,000 inhabitants 1902 to two million residents in 2017) which is brought by the migration of the people from the rural areas to the city (KCCA 2015; Uganda Bureau of Statistics 2017). This has created the need for more food supply as the areas that would have been used for Agriculture are now being used for settlement. Kampala depends on the food supply from different parts of the country and across the region. Due to the climatic conditions of different areas parts of the country specialize in different food production . In Kampala District, there are several markets where traders, farmers from within the country and the region bring the produce for sale. This markets include Nakasero which is the biggest fresh produce market in Kampala, Owino/ St Balikudembe market, Nakawa Market, Kalerwe Market and recently constructed markets like Wandegeya and Usafi markets with the aim of organising market streets and sales (KCCA 2015). Most of these markets are controlled by the Kampala City Council Authority (KCCA) with the assistance from Vendors and Traders Associations Ltd that help with the day to day management of the market and the vendors.
2.3.2 Food demand The government through the ministries have very low control of the food system in Kampala, the main role of the government bodies is to oversee the implementation of the policies. KCCA, the local council at both village and parish level, and the private sector including the traders have more control over the food system in Kampala.
2.4 Relevant policies on food and nutrition security
We compiled a list with the most relevant food and nutrition policies in Kampala, see table below. Table 4: List of plans and policies relevant for urban food security in Kampala
Full name Acronym Organisation Reference Poverty Eradication Action Plan PEAP Ministry of Finance,
Planning and Economic Development
(Republic of Uganda 2000)
Uganda Food and Nutrition Policy UFNP Republic of Uganda (Republic of Uganda 2003)
Uganda Nutrition Action Plan 2011–2016 Scaling Up Multi -Sectoral Efforts to Establish a Strong Nutrition Foundation for Uganda’s Development
UNAP Republic of Uganda (Republic of Uganda 2011)
2nd National Development Plan 2015/16-2019/20 NDPII Republic of Uganda (Republic of Uganda 2015a)
National Nutrition Planning Guidelines for Uganda NNPG National Planning Authority
(Republic of Uganda 2015b)
Kampala District Development Plan KDDP KCCA (KCCA 2015) Agriculture Sector Strategic Plan ASSP (Republic of
Uganda 2016) Agriculture Sector Development Strategy and Investment Plan
DSIP (MAAIF 2010)
12 | The Kanyanya food challenge
3 Case study 3.1 Introduction
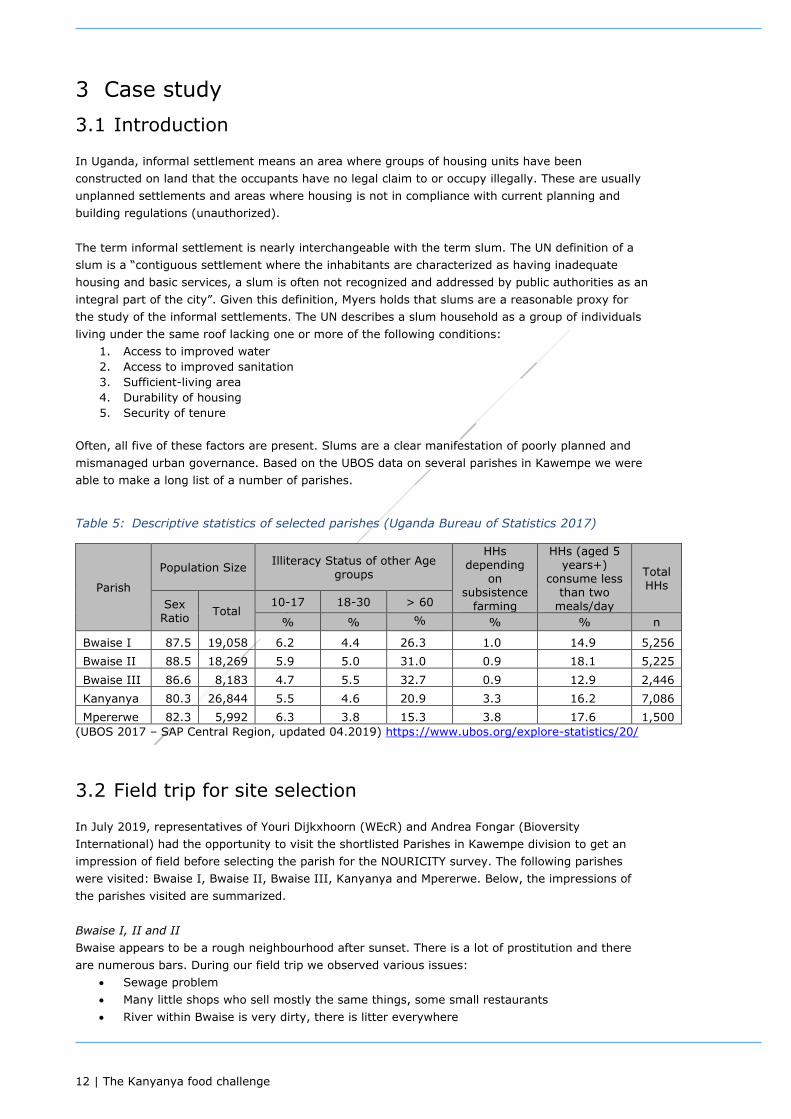
In Uganda, informal settlement means an area where groups of housing units have been constructed on land that the occupants have no legal claim to or occupy illegally. These are usually unplanned settlements and areas where housing is not in compliance with current planning and building regulations (unauthorized). The term informal settlement is nearly interchangeable with the term slum. The UN definition of a slum is a “contiguous settlement where the inhabitants are characterized as having inadequate housing and basic services, a slum is often not recognized and addressed by public authorities as an integral part of the city”. Given this definition, Myers holds that slums are a reasonable proxy for the study of the informal settlements. The UN describes a slum household as a group of individuals living under the same roof lacking one or more of the following conditions:
1. Access to improved water 2. Access to improved sanitation 3. Sufficient-living area 4. Durability of housing 5. Security of tenure
Often, all five of these factors are present. Slums are a clear manifestation of poorly planned and mismanaged urban governance. Based on the UBOS data on several parishes in Kawempe we were able to make a long list of a number of parishes.
Table 5: Descriptive statistics of selected parishes (Uganda Bureau of Statistics 2017)
Parish
Population Size Illiteracy Status of other Age groups
HHs depending
on subsistence
farming
HHs (aged 5 years+)
consume less than two
meals/day
Total HHs
Sex Ratio Total
10-17 18-30 > 60
% % % % % n
Bwaise I 87.5 19,058 6.2 4.4 26.3 1.0 14.9 5,256 Bwaise II 88.5 18,269 5.9 5.0 31.0 0.9 18.1 5,225 Bwaise III 86.6 8,183 4.7 5.5 32.7 0.9 12.9 2,446 Kanyanya 80.3 26,844 5.5 4.6 20.9 3.3 16.2 7,086 Mpererwe 82.3 5,992 6.3 3.8 15.3 3.8 17.6 1,500
(UBOS 2017 – SAP Central Region, updated 04.2019) https://www.ubos.org/explore-statistics/20/
3.2 Field trip for site selection
In July 2019, representatives of Youri Dijkxhoorn (WEcR) and Andrea Fongar (Bioversity International) had the opportunity to visit the shortlisted Parishes in Kawempe division to get an impression of field before selecting the parish for the NOURICITY survey. The following parishes were visited: Bwaise I, Bwaise II, Bwaise III, Kanyanya and Mpererwe. Below, the impressions of the parishes visited are summarized. Bwaise I, II and II Bwaise appears to be a rough neighbourhood after sunset. There is a lot of prostitution and there are numerous bars. During our field trip we observed various issues:
• Sewage problem • Many little shops who sell mostly the same things, some small restaurants • River within Bwaise is very dirty, there is litter everywhere

13 | The Kanyanya food challenge
• Overflooding problems within rainy seasons or after heavy rainfall • Other people stated that the river running through Bwaise is also used for cooling
vegetables during warmer periods of the year We talked to a few different occupants:
• A small shop owner who sells refreshments (homemade juice with sugar, soft drinks and water), some vegetables and fruits:
o People buy small quantities from her for their daily meals, bigger quantities are not affordable for most of the people in the area;
o Small sweet bananas are too expensive for the people o Shop owner gets her products from the market called Kalerwe Market
• Small food stall owner (Ibra’s best Chapati): o Many chapati businesses around, they share of costumers o Most business in the evening and mostly chapatis (500 Uganda shillings) o Those people with more money go to small restaurants
• Market Lady (Nabukalu Market/ growers market): o She gets her products from Western Uganda with a food truck which comes to the
roadside • Food cart owner (Man sells tomatoes and passion fruits; normally only fruits, but this day
not all fruits were available in Kalerwe Market): o Gets to Kalerwe Market very early (5 am) to pick up fruits and sells them on the
street o Washes cart on a weekly basis o Normally sells fruits within slum/ lower class areas
Kanyanya Key observations Kanyanya:
• Quite organized, well-structured homes and pit latrines, permanent homes • Littre problem, but still clean • Some urban farming visible • No flooding problems within the rainy season
We talked to different ladies who own a food stall:
• Food stall owner (the lady sells a few vegetables and cooked meals) o Her shop was located inside the parish o Buys her vegetables at Kalerwe Market o Prices at the market have not changed, same as two years ago, but people cannot
afford anymore, they do not have enough money to buy food, therefore very few customers and her products dry out
o Prepares cooked meals (cassava and beans) for 500 Uganda shillings • Food stall owner (a large variety of different vegetables, fruit and staples)
o Located just off the main road in the parish o Business is so so (as it is god’s plan) o Local, but also walk-in customers o Re-buys/restokes approx. 3 times a week her product, always when one product is
finished o Settled to Kampala one year ago and opened her business
• Shop owner (young lady sells cold drinks, vegetables, fruits, and also homemade juice, and snacks)
o Opened her shop 2 years ago, came to Kampala from central region cause of work o Good business, local and walk-in customers o Homemade juice/tea (tea leaves, pineapple, ginger, sugar – 500-1,000 Uganda
shillings for a 500 ml bottle) o Store looked very well organized and clean, very energetic women
Mpererwe
14 | The Kanyanya food challenge
On Thursday, July 18, 2019 we visited Mpererwe Parish and we made the following observations: • Very busy town centre, many small and medium businesses, including food stalls, small
supermarkets, restaurants • Off the main street, very well structured (large) permanent homes with home gardens and
space for urban farming – assumption: homeowners and long term occupants • No problems of flooding within the rainy season
We did not interview/talked to anyone in this parish, people close to the main road were very busy and within the living area, occupants were not at home or not accessible (high walls around the houses).
3.3 Selection of parish: Kanyanya
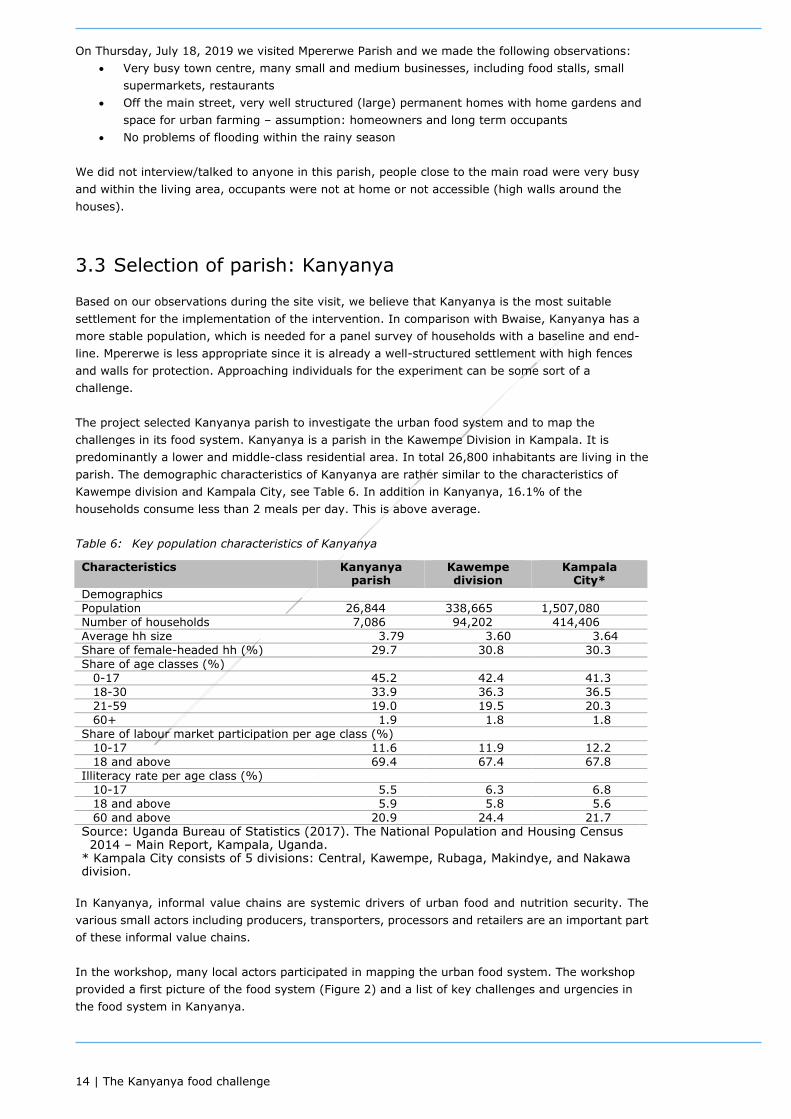
Based on our observations during the site visit, we believe that Kanyanya is the most suitable settlement for the implementation of the intervention. In comparison with Bwaise, Kanyanya has a more stable population, which is needed for a panel survey of households with a baseline and end-line. Mpererwe is less appropriate since it is already a well-structured settlement with high fences and walls for protection. Approaching individuals for the experiment can be some sort of a challenge. The project selected Kanyanya parish to investigate the urban food system and to map the challenges in its food system. Kanyanya is a parish in the Kawempe Division in Kampala. It is predominantly a lower and middle-class residential area. In total 26,800 inhabitants are living in the parish. The demographic characteristics of Kanyanya are rather similar to the characteristics of Kawempe division and Kampala City, see Table 6. In addition in Kanyanya, 16.1% of the households consume less than 2 meals per day. This is above average. Table 6: Key population characteristics of Kanyanya
In Kanyanya, informal value chains are systemic drivers of urban food and nutrition security. The various small actors including producers, transporters, processors and retailers are an important part of these informal value chains. In the workshop, many local actors participated in mapping the urban food system. The workshop provided a first picture of the food system (Figure 2) and a list of key challenges and urgencies in the food system in Kanyanya.
Characteristics Kanyanya parish
Kawempe division
Kampala City*
Demographics Population 26,844 338,665 1,507,080 Number of households 7,086 94,202 414,406 Average hh size 3.79 3.60 3.64 Share of female-headed hh (%) 29.7 30.8 30.3 Share of age classes (%)
0-17 45.2 42.4 41.3 18-30 33.9 36.3 36.5 21-59 19.0 19.5 20.3 60+ 1.9 1.8 1.8
Share of labour market participation per age class (%) 10-17 11.6 11.9 12.2 18 and above 69.4 67.4 67.8
Illiteracy rate per age class (%) 10-17 5.5 6.3 6.8 18 and above 5.9 5.8 5.6 60 and above 20.9 24.4 21.7
Source: Uganda Bureau of Statistics (2017). The National Population and Housing Census 2014 – Main Report, Kampala, Uganda.
* Kampala City consists of 5 divisions: Central, Kawempe, Rubaga, Makindye, and Nakawa division.
15 | The Kanyanya food challenge
3.4 Food flow mapping and stakeholder consultation
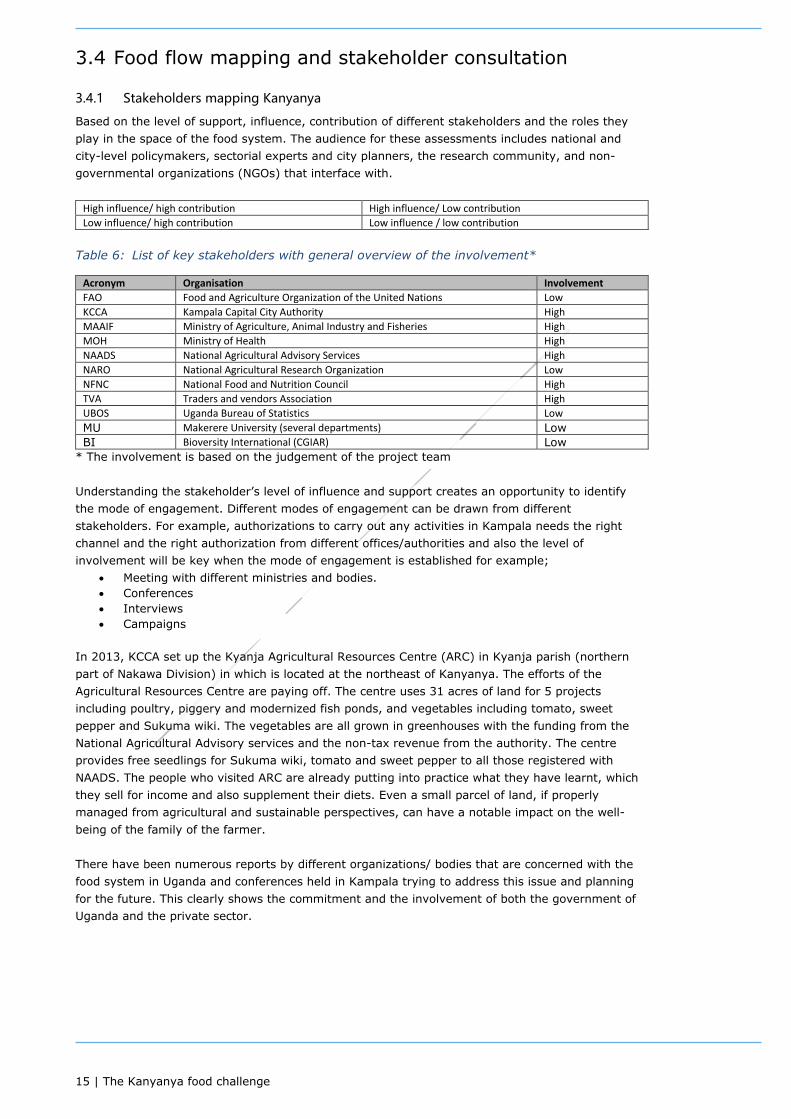
3.4.1 Stakeholders mapping Kanyanya
Based on the level of support, influence, contribution of different stakeholders and the roles they play in the space of the food system. The audience for these assessments includes national and city-level policymakers, sectorial experts and city planners, the research community, and non-governmental organizations (NGOs) that interface with.
High influence/ high contribution High influence/ Low contribution Low influence/ high contribution Low influence / low contribution
Table 6: List of key stakeholders with general overview of the involvement*
Acronym Organisation Involvement FAO Food and Agriculture Organization of the United Nations Low KCCA Kampala Capital City Authority High MAAIF Ministry of Agriculture, Animal Industry and Fisheries High MOH Ministry of Health High NAADS National Agricultural Advisory Services High NARO National Agricultural Research Organization Low NFNC National Food and Nutrition Council High TVA Traders and vendors Association High UBOS Uganda Bureau of Statistics Low MU Makerere University (several departments) Low BI Bioversity International (CGIAR) Low
* The involvement is based on the judgement of the project team Understanding the stakeholder’s level of influence and support creates an opportunity to identify the mode of engagement. Different modes of engagement can be drawn from different stakeholders. For example, authorizations to carry out any activities in Kampala needs the right channel and the right authorization from different offices/authorities and also the level of involvement will be key when the mode of engagement is established for example;
• Meeting with different ministries and bodies. • Conferences • Interviews • Campaigns
In 2013, KCCA set up the Kyanja Agricultural Resources Centre (ARC) in Kyanja parish (northern part of Nakawa Division) in which is located at the northeast of Kanyanya. The efforts of the Agricultural Resources Centre are paying off. The centre uses 31 acres of land for 5 projects including poultry, piggery and modernized fish ponds, and vegetables including tomato, sweet pepper and Sukuma wiki. The vegetables are all grown in greenhouses with the funding from the National Agricultural Advisory services and the non-tax revenue from the authority. The centre provides free seedlings for Sukuma wiki, tomato and sweet pepper to all those registered with NAADS. The people who visited ARC are already putting into practice what they have learnt, which they sell for income and also supplement their diets. Even a small parcel of land, if properly managed from agricultural and sustainable perspectives, can have a notable impact on the well-being of the family of the farmer. There have been numerous reports by different organizations/ bodies that are concerned with the food system in Uganda and conferences held in Kampala trying to address this issue and planning for the future. This clearly shows the commitment and the involvement of both the government of Uganda and the private sector.

16 | The Kanyanya food challenge
3.4.2 Stakeholder consultation
Residents of Kanyanya Parish were interviewed according to the different local stakeholder categories that the project had earlier mapped out i.e. local leaders, local food retailers, local food traders, consumer representatives, producers, suppliers, community health representatives and the people responsible for water and sanitation in this area. The purpose of this was to ascertain the under-researched but key components of food value chains which are small and informal actors of the urban food system. Kanyanya Parish comprises of zones: Wampamba, Lutuunda, Kitambuza, Kikuubo and Kiyanja. A total of twelve interviews were purposively conducted with the local leaders from the five different villages within the parish in order to have a general overview of what transpires within their respective villages. The interviews were semi-structured. A part of the interview were prepared, see Annex 1. Response from the Parish and Village leaders The local leader’s response was that a typical diet consists of posho, matooke, rice with beans and that the food consumption does not vary with the growing season because Kalerwe market with fresh fruit and vegetables is nearby. Kalwere market is at the south of the Kampala Northern Bypass Highway, while Kanyanya is located at the north side. By car, Kalerwe market is about 2 km away from the southern border of Kanyanya parish via Gayaza-Kampala Road. However, this road is not safe for walking, so that the walking distance is much longer (approximately 4 km for a safe route). Most importantly, quantity of portion is considered when buying food cited reason being that “most of them have extended families that they need to take care of,” however, those that are wealthier consider the nutrient composition of the different foods. The challenges faced while buying healthy food in Kanyanya parish is the affordability to most of the low-income earners. There are also campaigns on proper nutrition by a few Non- Governmental Organisations (Living goods) and various women groups which mostly target pregnant women and parents with infants. Although the people from this parish are able to grow vegetables, limited access to land emerges, considering that the areas are becoming urbanised as the habitants of the area increase. The respondents also pointed out that in their opinion, traffic is not a limiting factor to the distribution of healthy and fresh food because it is a walkable distance from Kanyanya to Kalerwe market. Responses from the consumer representatives (women’s groups) The leader of the women group responded that a typical diet consisted of matooke, rice and posho with beef, dry fish, mukene, greens and cabbage, but the youth preferred posho and beans. She said that the consumption of food varies with the seasons. During the wet seasons, people prefer beans and matooke while posho, beans and chapatti are consumed in the dry season. The resident’s knowledge of how a healthy diet looks is dependent upon the income status of the individuals. The main source of food in Kanyanya parish is Kalerwe market and people consider the price and quantity while buying food. There are no challenges in obtaining healthy food because of the nearby market. There have not been any campaigns for choosing a healthy diet except for pregnant and nursing mothers who always get that information from hospitals. There are gardens within the parish but owned by only those who have some influence and land rights. Responses from a producer A typical diet in her opinion entails matooke, posho and rice with beans and groundnut sauce. The food consumption varies with the growing season because she grows different food crops each season. The main source of food is either Kalerwe or Mperewe market. Quantity is most important when people are buying food that’s why they walk all the way to either of the markets. Those that have land grow the crops but none the less those without enough land use old jerrycans to grow vegetables. Responses from the community health worker A typical diet consists of matooke, rice and beans and probably beef on the weekend. The consumption of the food is independent of the season because of the accessibility of the nearby market. There are also people who hawk food from the markets so it makes it easier for them to
17 | The Kanyanya food challenge
buy. People consider quantity when buying food other than nutrients. There is a non-governmental organisation (NGO) called Living Goods that teaches people on how they should eat when pregnant and also how to feed their infants. She would have planted vegetables but she sold off all her land. Responses from the local food traders and retailers Matooke, rice, posho, cassava with beans, beef and groundnuts is what the people of Kanyanya Parish consume. They just eat in order to get satisfied but not based on nutritional value. People also consider quality when buying food and the nutritional component comes in later. Since Kanyanya parish is between two markets, it is easier for the locals to purchase food of their own choice in bigger quantities regardless of their nutritional value. These people have access to all the food types of their own preference. Being an urbanised parish most people have an idea of what healthy diets look like and the middle class consider the nutritional value of food while purchasing it. The campaigns in this area mainly target vulnerable groups in particular pregnant women and infants. Those that have some land are able to grow vegetables on a small scale in old jerry cans and tyres. Traffic jam is not a limiting factor to healthy food distribution because most of these locals walk to and from the market areas which makes it easy for them to access the food of their choice.
3.4.3 Workshop outcomes
After the stakeholder consultation, we organized a 2-day workshop on October 17-18, 2019 at the Grand Global hotel in Kampala. Many local actors participated in addressing the key issues and mapping the urban food system, see the workshop report (Linderhof et al. 2019). The workshop provided a first picture of the food system and a list of key challenges and urgencies in the food system in Kanyanya (Linderhof et al. 2019). Serious food safety challenges were identified. Many issues have been mentioned by the workshop participants related to serious food safety risks, availability of healthy food and affordability of healthy food. Some of the key issues mentioned on food safety risks are the overuse and misuse of pesticides at the farm level, the handling of the food by traders and retailers, and the unhygienic way of preparing food. Healthy food is not widely available and affordable. The availability of healthy food and the seasonality are mentioned as key constraints, but also issues like the lack of storage. The price of healthy food (affordability) is considered a major constraint. Poor people in Kanyanya often can only afford one meal and they do not have the opportunity to set aside some budget for buying vegetables. In addition, the preparation of a meal is also costly since it requires charcoal and this is expensive. Food processing and manufacturing is present. The participants in the workshop identified various (food) processing activities in Kanyanya. The processing activities range from small to large and serve the local market but also the international market. Surface water is contaminated. Participants informed us that Kanyanya has many hills and that the downstream flows of rainwater are creating serious environmental issues during the rainy season. Also, the use of pit latrines is contaminating the water during the rainy season due to overflowing. People consume poor dietary meals. The people in Kanyanya eat traditional meals (matooke and posho). These meals are carbohydrate-rich and not divers in nutrients. Micro-nutrient-rich food (vegetables) is expensive and unavailable due to the low income, attitude, mindset, and ignorance. Meals are usually prepared at home. Those home meals lack micro-nutrients due to long cooking times. Out of home consumption is gaining importance because it is often cheaper than preparing own food. Food is hardly wasted. It is often used for making juices or animal feed. Regular waste is collected by a service provider at a charge. People, therefore, tend to dispose of their waste at their own land or on the streets, creating environmental and health issues.
18 | The Kanyanya food challenge
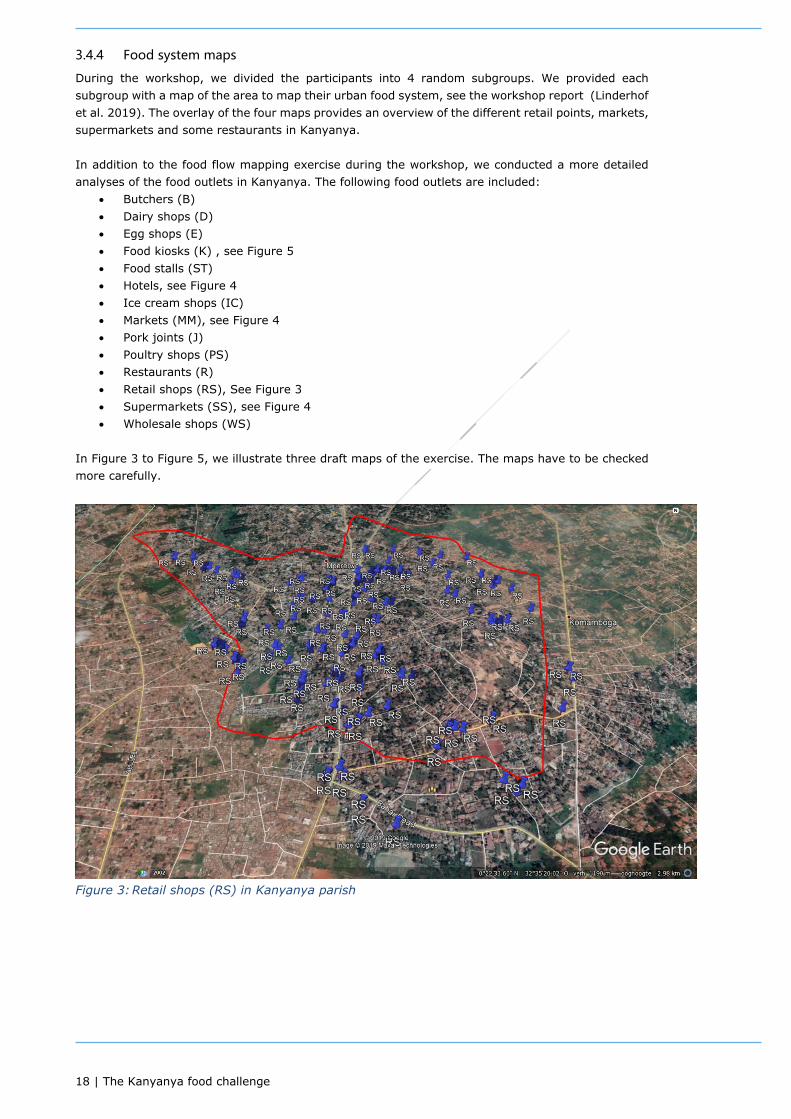
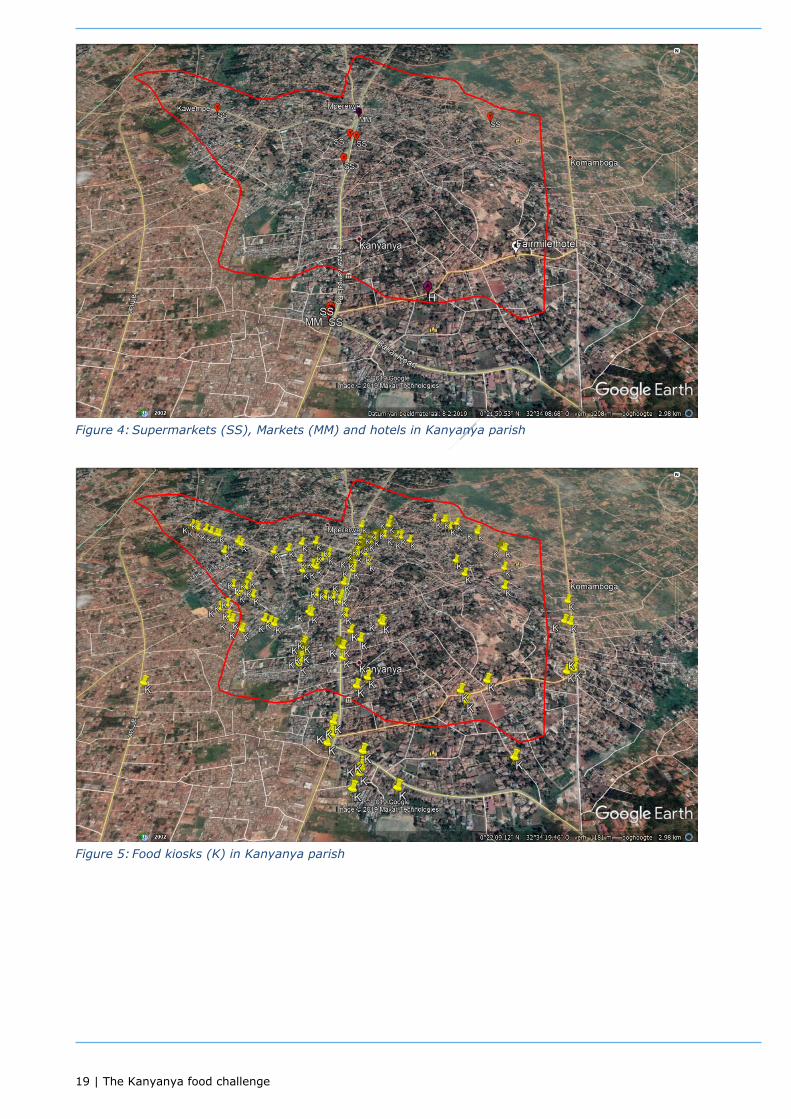
3.4.4 Food system maps
During the workshop, we divided the participants into 4 random subgroups. We provided each subgroup with a map of the area to map their urban food system, see the workshop report (Linderhof et al. 2019). The overlay of the four maps provides an overview of the different retail points, markets, supermarkets and some restaurants in Kanyanya. In addition to the food flow mapping exercise during the workshop, we conducted a more detailed analyses of the food outlets in Kanyanya. The following food outlets are included:
• Butchers (B) • Dairy shops (D) • Egg shops (E) • Food kiosks (K) , see Figure 5 • Food stalls (ST) • Hotels, see Figure 4 • Ice cream shops (IC) • Markets (MM), see Figure 4 • Pork joints (J) • Poultry shops (PS) • Restaurants (R) • Retail shops (RS), See Figure 3 • Supermarkets (SS), see Figure 4 • Wholesale shops (WS)
In Figure 3 to Figure 5, we illustrate three draft maps of the exercise. The maps have to be checked more carefully.
Figure 3: Retail shops (RS) in Kanyanya parish
19 | The Kanyanya food challenge
Figure 4: Supermarkets (SS), Markets (MM) and hotels in Kanyanya parish
Figure 5: Food kiosks (K) in Kanyanya parish
20 | The Kanyanya food challenge
3.5 Migration
In collaboration with the WEcR team of the project "Food system and migration", financed by the Dutch ministry of Agriculture, Nature and Food Quality, we addressed a number of questions on migration in Uganda and how it affects the food system. There are three different flows of migration distinguished:
• People from rural areas that move to the urban centres. • People intentionally moving from abroad to Uganda for jobs • People unintentionally moving from abroad to Uganda (and urban centres) due to ethnical,
political or other conflicts in their former areas of residence such as the Democratic Republic of Congo, South-Sudan, and Rwanda amongst others.
The project "Food system and migration" focuses on the rural-urban migration and its consequences with Kampala being the urban centre of research. There is no clear distinction whether or not the rural migrations are refugees or not. The first observation during the workshop was that rural-urban migration studies show that population in Kampala will grow with 60% in the coming decades. The highest rates of population growth are recorded in the central region, and most particularly in Kampala. With the current patterns of growth, Kampala will become a mega-city with a population of more than 10 million people within the next 20 years (The World Bank 2015). The food supply in large cities like Kampala have changed and continue to change due to the urbanisation development. The second observation was that when we look at Kampala, the city is continuously changing including the food system in the city. The third observation was that the urbanisation and the rural-urban migration are mainly due to the liberal policies in Uganda. There is a large number of youths coming into cities (https://www.newvision.co.ug/new_vision/news/1320719/youth-migrating-kampala-report) and there is migration from refugees from rural to urban areas. In Uganda, refugees are offered cash-based transfers for their cost of living – through phones to buy food – growing market to look at à they get money to buy food The fourth observation is that there do exist differences in demand for food. People from different areas within Uganda have different eating habits, which are often due to the availability of food in the area of origin. In a personal communication with a lady of the Uganda National Museum in Kampala, she mentioned that there are particular areas where people from particular backgrounds cluster (like the Ethiopian area in Kampala). Local food supply has been changed with respect to the food preferences of the inhabitants.

21 | The Kanyanya food challenge
4 Next steps and activities for 2020 Based on the outcomes of the participatory workshop we will establish a possible design for a policy intervention that will be implemented in 2020. For this, we will conduct a baseline survey among 500 households in Kanyanya early 2020. After the baseline, we will do an effect measurement among the same households to analyse the effects of the upcoming intervention. The policy mapping workshop 2 will be organized early 2020. Key questions are derived from the City Region Food Systems (CRFS) toolkit (FAO, RUAF Foundation, and Wilfrid Laurier University, Centre for Sustainable Food Systems 2018):
• What policies and plans influence the food systems? Think of policies directly related to food production, processing etc., but also of other sectoral policies (health, economic development, land use planning) that have a bearing on the food systems.
• Who governs the food system? What role and power do decision-makers and key stakeholders have in shaping a more sustainable/resilient food system that serves the city and the city region?
• Which interventions can be used to stimulate urban consumers to choose for a more healthy and sustainable diet? Interventions could be the provision of information on healthy food (training and leaflet), implementation of a system of vouchers for providing ingredients of healthy recipes and social media usage for healthy diets, reminders with texting to cook and eat healthy etc.
Some participants of workshop 1 will be invited and we will add new stakeholders based on the outcomes of the first workshop. The new stakeholders will be selected from the list of potential participants below. There will be 15-20 stakeholders at the workshop. Table 7: List of key activities
Activities WP Scheduled Results on dietary transitions 6 October 2019 PPT of results January 2020 Workshop on interventions 8 February 2020 Baseline survey 9 March-April 2020 Endline survey Second half 2020
In addition to the activities, we try to set up collaborations with the Food4Cities project in Kampala and the Feeding cities and migration project which both also have case studies in Kampala (Uganda), see Annex 2.
22 | The Kanyanya food challenge
References Action Aid Uganda. 2019. “Celebrating Gains and Triumph Towards Attainment of Social Justice.”
Kampala, Uganda. https://uganda.actionaid.org/sites/uganda/files/publications/annual%20report-2018-July-3rd-2.pdf.
Berkum, Siemen van, Just Dengerink, and Ruerd Ruben. 2018. “The Food Systems Approach: Sustainable Solutions for a Sufficient Supply of Healthy Food.” 2018–084. Economic Research Memorandum. The Hague: Wageningen Economic Research. https://doi.org/10.18174/451505.
Cleave, J.H. 1968. “Food Consumption in Uganda.” East African Journal of Rural Development 1: 70–87. FAO. 2010. “Nutrition Country Profile - The Republic of Uganda.” Rome, Italy: Food and Agriculture
Organization. http://www.fao.org/3/a-bc643e.pdf. FAO, RUAF Foundation, and Wilfrid Laurier University, Centre for Sustainable Food Systems. 2018. “City
Region Food System Toolkit Assessing and Planning Sustainable City Region Food Systems.” Food and Agriculture Organization of the United Nations and RUAF Foundation and Wilfrid Laurier University, Centre for Sustainable Food Systems. http://www.fao.org/3/i9255e/i9255e-Reporting-outline-CRFS-Scan.pdf.
FAO, and WHO. 2013. “An Analysis of the Food System Landscape and Agricultural Value Chains for Nutrition: A Case Study from Sierra Leone.” Rome, Italy: Food and Agriculture Organization of the United Nations and World Health Organisation. http://www.fao.org/3/a-as566e.pdf.
Global Panel. 2016. “Food Systems and Diets: Facing the Challenges of the 21st Century.” London, UK: Global Panel on Agriculture and Food Systems for Nutrition.
Hazell, Peter, and Stanley Wood. 2008. “Drivers of Change in Global Agriculture.” Philosophical Transactions of the Royal Society B: Biological Sciences 363 (1491): 495–515. https://doi.org/10.1098/rstb.2007.2166.
HLPE. 2014. “Food Losses and Waste in the Context of Sustainable Food Systems.” Rome: FAO. www.fao.org/cfs/cfs-hlpe.
———. 2017. “Nutrition and Food Systems.” Rome, Italy: High Level of Experts on Food Security and Nutrition of the Committee on World Food Security.
Ingram, John. 2011. “A Food Systems Approach to Researching Food Security and Its Interactions with Global Environmental Change.” Food Security 3 (4): 417–31. https://doi.org/10.1007/s12571-011-0149-9.
KCCA. 2015. “Laying the Foundation For Kampala City Transformation, Strategic Plan 2015/16-2018/19.” Strategic plan. Kampala, Uganda: Kampala Capital City Authority. https://www.kcca.go.ug/uploads/KCCA_STRATEGI_PLAN_2015-2016.pdf.
Kennedy, Gina, Guy Nantel, and Prakash Shetty. 2004. “Kennedy, Gina, Guy Nantel, and Prakash Shetty. ‘Globalization of Food Systems in Developing Countries: Impact on Food Security and Nutrition.’ In FAO Food and Nutrition Paper, 2004.” FAO Food and Nutrition Paper, 83. Rome, Italy: Food and Agriculture Organization. http://www.fao.org/3/a-y5736e.pdf.
Linderhof, Vincent, Youri Dijkxhoorn, Andrea Fongar, Joel Onyango, and Martha Nalweyiso. 2019. “Food System Mapping in Kanyanya (Kampala).” Wageningen, The Netherlands: Wageningen Economic Research.
MAAIF. 2010. “Agriculture Sector Development Strategy and Investment Plan: 2010/11 – 2014/15.” Kampala, Uganda: Ministry of Agriculture, animal industry and Fisheries. https://www.gafspfund.org/sites/default/files/inline-files/5.%20Uganda_strategy%20and%206.%20Uganda_investment%20plan.pdf.
Mwesigwa, Alon. 2017. “11 Million Ugandans Eat Unacceptable Food.” The Observer, October 13, 2017. https://observer.ug/news/headlines/55405-11-million-ugandans-eat-unacceptable-food.
Republic of Uganda. 2000. “Uganda’s Poverty Eradication Action Plan: Summary and Objectives.” Poverty Reduction and Strategy Plan. Kampala, Uganda. http://siteresources.worldbank.org/INTPRS1/Resources/Country-Papers-and-JSAs/Uganda_IPRSP.pdf.
———. 2003. “Uganda National Food and Nutrition Policy.” ———. 2011. “UGANDA NUTRITION ACTION PLAN 2011–2016 Scaling Up Multi -Sectoral Efforts to
Establish a Strong Nutrition Foundation for Uganda’s Development.” Kampala, Uganda. https://scalingupnutrition.org/wp-content/uploads/2013/02/Uganda_NutritionActionPlan_Nov2011.pdf.
———. 2015a. “SECOND NATIONAL DEVELOPMENT PLAN (NDPII) 2015/16 – 2019/20.” Kampala, Uganda. http://npa.go.ug/wp-content/uploads/NDPII-Final.pdf.
———. 2015b. “NATIONAL NUTRITION PLANNING GUIDELINES FOR UGANDA.” Kampala, Uganda: National Planning Authority. https://www.fantaproject.org/sites/default/files/resources/nutrition-planning-guidelines-uganda-Dec2015.pdf.
———. 2016. “Agriculture Sector Strategic Plan 2015/16-2019/20.” Kampala, Uganda: Ministry of Agriculture, Animal Industriy and Fisheries. http://npa.go.ug/wp-content/uploads/2016/08/ASSP-Final-Draft.pdf.

23 | The Kanyanya food challenge
Schinca, Nahyr. 2009. “El estado de la inseguridad alimentaria en el mundo.” Actividad Dietética 13 (2): 49–50. https://doi.org/10.1016/S1138-0322(09)71733-X.
Ssewanyana, Sarah, and Ibrahim Kasirye. 2010. “Ssewanyana, Sarah, and Ibrahim Kasirye. ‘Food Security in Uganda: A Dilemma to Achieving the Millennium Development Goal.’ Research Series, 2010.” Research Series 70. Kampala, Uganda: Economic Policy Research Centre (EPRC), Makerere University. https://ideas.repec.org/p/ags/eprcrs/113614.html.
The World Bank. 2015. “The Growth Challenge: Can Ugandan Cities Get to Work? Uganda Economic Update 5th Editions.” 94622. Uganda Economic Update. Washington DC (USA): International Bank for Reconstruction and Development / International Development Association. https://www.worldbank.org/content/dam/Worldbank/document/Africa/Uganda/Report/uganda-economic-update-march-2015.pdf.
Tusiime, Hamidu A., Robrecht Renard, and Lodewijk Smets. 2013. “Food Aid and Household Food Security in a Conflict Situation: Empirical Evidence from Northern Uganda.” Food Policy 43 (December): 14–22. https://doi.org/10.1016/j.foodpol.2013.07.005.
UBOS, and ICF. 2018. “Uganda Demographic and Health Survey 2016.” Kampala, Uganda and Rockville, Maryland, USA: Uganda Bureau of Statistics (UBOS) and ICF. https://dhsprogram.com/pubs/pdf/FR333/FR333.pdf.
Uganda Bureau of Statistics. 2017. “Uganda Bureau of Statistics 2017, The National Population and Housing Census 2014 – Area Specific Profile Series, Kampala, Uganda.” Kampala: Uganda Bureau of Statistics (UBOS).
UNEP. 2016. “Food Systems and Natural Resources.” A Report of the Working Group on Food Systems of the International Resource Panel. UNEP.

24 | The Kanyanya food challenge
Annex 1 Questions of semi-structured interviews Key questions to address during the workshop are (FAO, 2018):
• Who feeds the city region; where does the food come from; what and how much food is produced locally in the city region? Where are inputs and resources sourced from? How does city’ regions food supply system fit into the wider national and global food supply system?
• Food processing and manufacturing: which companies prepare/manufacture the food consumed in the city region?
• Food wholesale and distribution: who supplies the food to businesses/markets that sell food to the consumers?
• Food marketing, catering and retail: where do citizens buy their food? Please different for citizens of different wealth call-socio economic conditions.
• Food consumption: what do people in the city region eat? What is the composition of their actual diet and food basket? What are related food security/nutrition/food related health concerns? Can they access local food and where?
• Food and organic waste: where and how much food and organic waste is generated along the food chain and how is it managed?

25 | The Kanyanya food challenge
Annex 2 Related projects
Food4Cities (LEAP-AGRI)
Full title: Food4Cities - Exploring food system transformations in rapidly changing African cities Website: https://ec.europa.eu/knowledge4policy/projects-activities/food4cities-exploring-food-system-transformations-rapidly-changing-african_en Partners: VU Amsterdam, Leuven, Makerere University Contact persons: Jasper van Vliet or Jacqueline Davis (Institute for Environmental Studies, Vrije Universiteit, Amsterdam, the Netherlands). The research team in Kampala consists of Lisa-Marie Hemerijckx and Anton van Rompuy (KU Leuven, Belgium).
SmallFishFood (LEAP-AGRI)
Full title: SmallFishFood - Small Fish and Food Security: Towards innovative integration of fish in African food systems to improve nutrition Website: https://ec.europa.eu/knowledge4policy/projects-activities/smallfishfood-small-fish-food-security-towards-innovative-integration-fish_en Partners: University of Bergen, Norway; Institute of Marine Research; Wageningen University; German Federal Institute for Risk Assessment; University of Ghana; Council for Scientific and Industrial Research; Kenya Marine and Fisheries Research Institute; National Fisheries Resources Research Institute Contact person:
NUTRIFOODS (LEAP-AGRI)
Full title: NUTRIFOODS - Innovative approaches to value addition and commercialization of climate smart crops for enhanced food security and nutrition in Africa and beyond Website: https://leap.iamb.it/?page_id=329 Partners: Makerere University, Uganda; Wageningen University, The Netherlands; Kenya Industrial Research and development Institute, Kenya; VTT Technical Research Center of Finland Ltd, Finland; University of Pretoria, South Africa; University of Venda, South Africa; Nutreal Ltd, Uganda; Bake Five BV, The Netherlands Contact person: Martijn van Noort (WUR)
Feeding cities and migration
Full title: “Feeding cities and migration” as part of the Knowledge Based “Food Security and Valuing Water” program financed by the Dutch Ministry of Agriculture, Nature and Food Quality Website: https://www.wur.nl/en/Research-Results/kennisonline/Feeding-cities-migration-1.htm Partners: All institutes of Wageningen Research Contact person: Katrine Soma (WUR)