Partnership Lifecycles and the Evolution of Collaborative Relationships Robert T. Trotter, II...
18
Partnership Lifecycles and the Evolution of Collaborative Relationships Robert T. Trotter, II Northern Arizona University, Flagstaff, AZ Society for Applied Anthropology March 31-April 4, 2004
-
date post
21-Dec-2015 -
Category
Documents
-
view
213 -
download
0
Transcript of Partnership Lifecycles and the Evolution of Collaborative Relationships Robert T. Trotter, II...

Partnership Lifecycles and the Evolution of Collaborative
Relationships
Robert T. Trotter, II
Northern Arizona University, Flagstaff, AZ
Society for Applied Anthropology
March 31-April 4, 2004
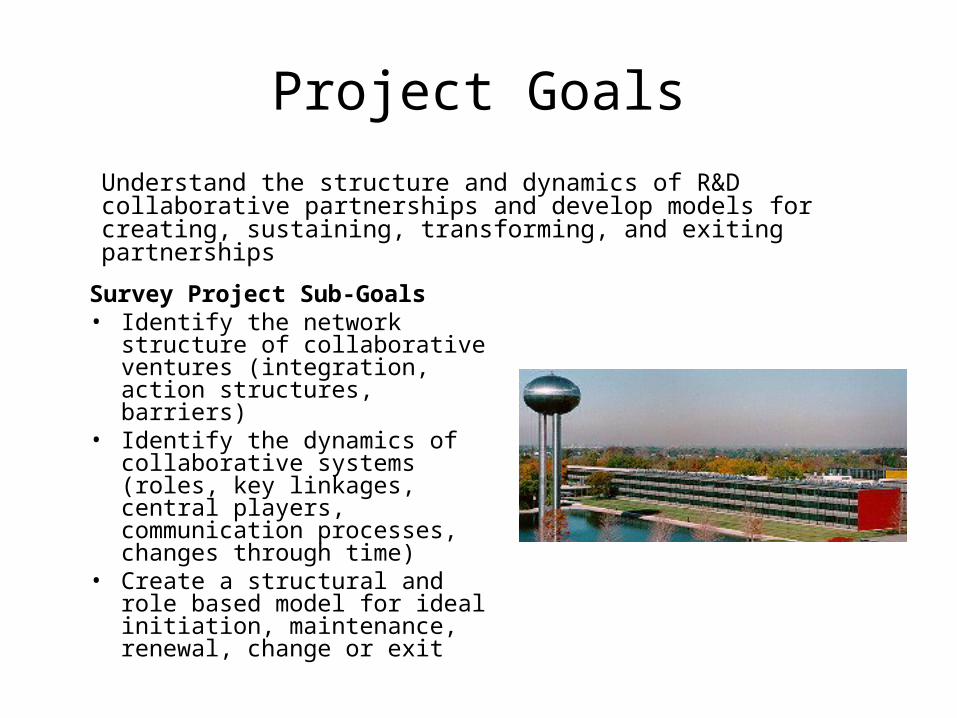
Project Goals
Understand the structure and dynamics of R&D collaborative partnerships and develop models for creating, sustaining, transforming, and exiting partnerships
Survey Project Sub-Goals• Identify the network structure
of collaborative ventures (integration, action structures, barriers)
• Identify the dynamics of collaborative systems (roles, key linkages, central players, communication processes, changes through time)
• Create a structural and role based model for ideal initiation, maintenance, renewal, change or exit
Preferred Customer
This slide is read as is.
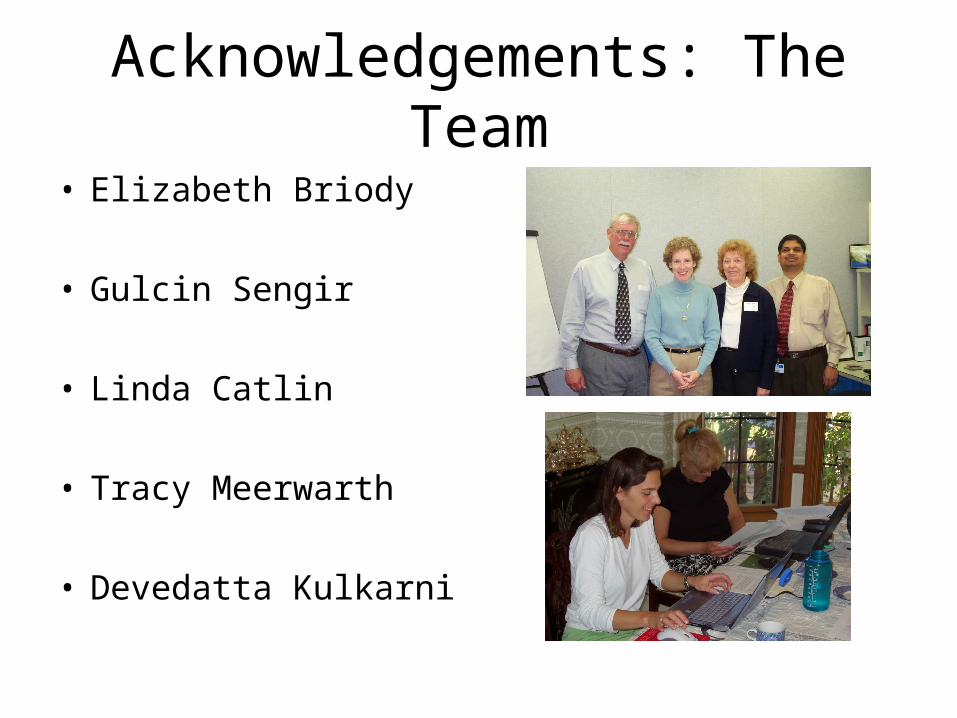
Acknowledgements: The Team
• Elizabeth Briody
• Gulcin Sengir
• Linda Catlin
• Tracy Meerwarth
• Devedatta Kulkarni

Basic Methods
• Data collection – Interviews (N=88)
– Focus groups (N=10)
– Direct observation
– Document analysis
– Social-network survey (N=173)
Analysis Overview
• Ethnographic Analysis– Partnership models, descriptions and trends– Partnership dynamics– Partnership profiles
• Sociometric Analysis– Statistical analysis of network characteristics– Sociometric analysis of structure, roles, positions– Network visualization and hypotheses generation

The Life Cycle of Collaboration: Results from the Ethnography
• Primary Stages: Partnership structures and the dynamic relationships that drive successful collaborations follow a clear lifecycle pattern. – Initiation Stage– Courtship Stage– Start-Up Stage– Mid-Term Stage– Mature Stage– Transition Stage

Qualitative Evidence for Evolution:Changes over Time
• Size and Composition
– Gradual addition of both roles and individual expertise on both sides
• Individual roles evolve• More roles are added
– Increase in complexity of roles• Specific roles accumulate duties and obligations

Qualitative Evidence (cont.)
• Initiation and Courtship– Ladder model– Agreeing on technical issues– Identifying and beginning mutual interests
• Mid-Term– Developing relationships
• Maturity– Getting work done
• Transition– Determining the Future
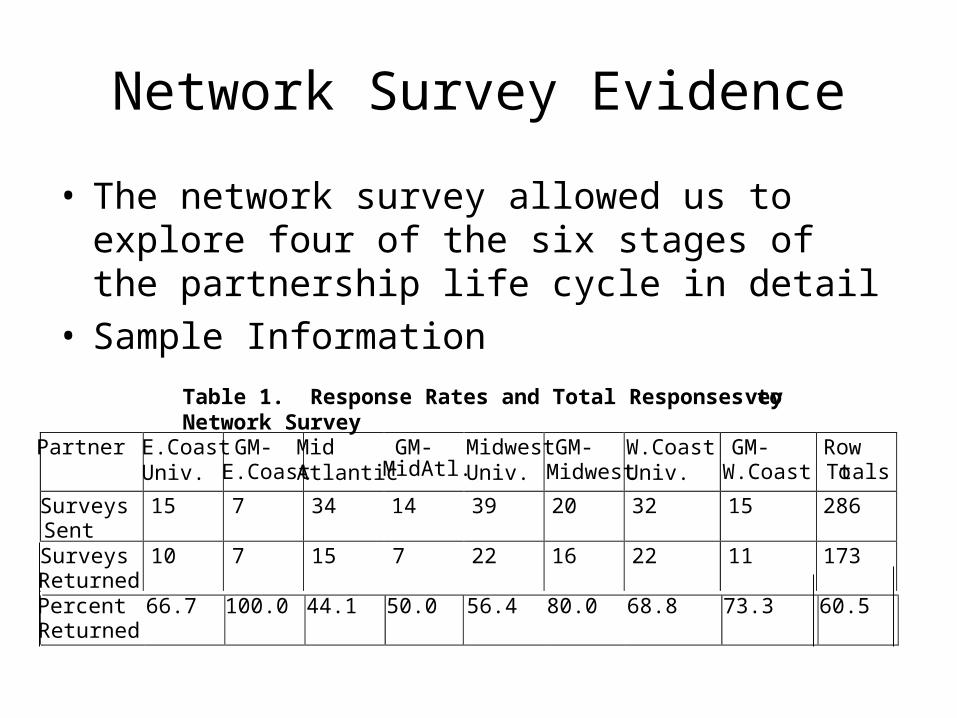
Network Survey Evidence
• The network survey allowed us to explore four of the six stages of the partnership life cycle in detail
• Sample InformationTable 1. Response Rates and Total Responses to Network Surveyvey
Partner E.Coast
Univ. GM-
E.Coast Mid Atlantic
GM- MidAtl.
MidwestUniv.
GM- Midwest
W.CoastUniv.
GM- W.Coast
Row Totals
Surveys Sent
15 7 34 14 39 20 32 15 286
Surveys Returned
10 7 15 7 22 16 22 11 173
Percent Returned
66.7 100.0 44.1 50.0 56.4 80.0 68.8 73.3 60.5
Network Survey Evidence
• Analysis Process
– Freelisting – Salient Positions and Roles(Anthropac)
– Edgelists were used to create sociometric matrices
– Sociometric Analysis was conducted

Evolution through Network Through Statistical Trends and Visualization
• Statistical Trends
• Network Visualization Processes
Statistical Trends
• The statistical trends that support our evolutionary hypothesis include:
– Changes in size of whole network, average personal network, and complexity of network were observed. (e.g., increasing in number of participants as partnership ages)
– Changes in sociometric measures (overall network density, transitivity, number of components, etc.) (e.g., newer partnerships have a lower average distance and higher density)
Network Visualization Hypotheses and Data from the Survey
• The data was assumed to match with specific stages in the partnership cycle
• Hypothetical and real networks were analyzed for similar structures

Figure 1: Theoretically- Figure 2: Start-Up Figure 3: Start-Up Constructed Start-Up Core Structure at 1 Year Core Structure at 1.5 Core Structure Years
Network Visualization Data:KineMage Images of Start Up
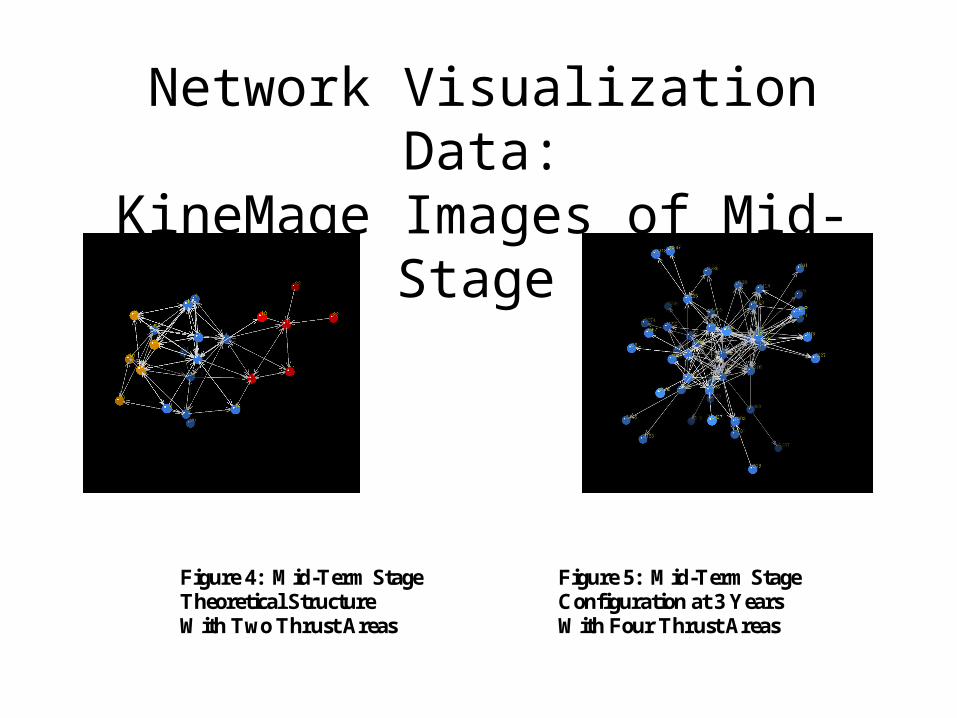
Figure 4: Mid-Term Stage Figure 5: Mid-Term Stage Theoretical Structure Configuration at 3 Years With Two Thrust Areas With Four Thrust Areas
Network Visualization Data:KineMage Images of Mid-Stage
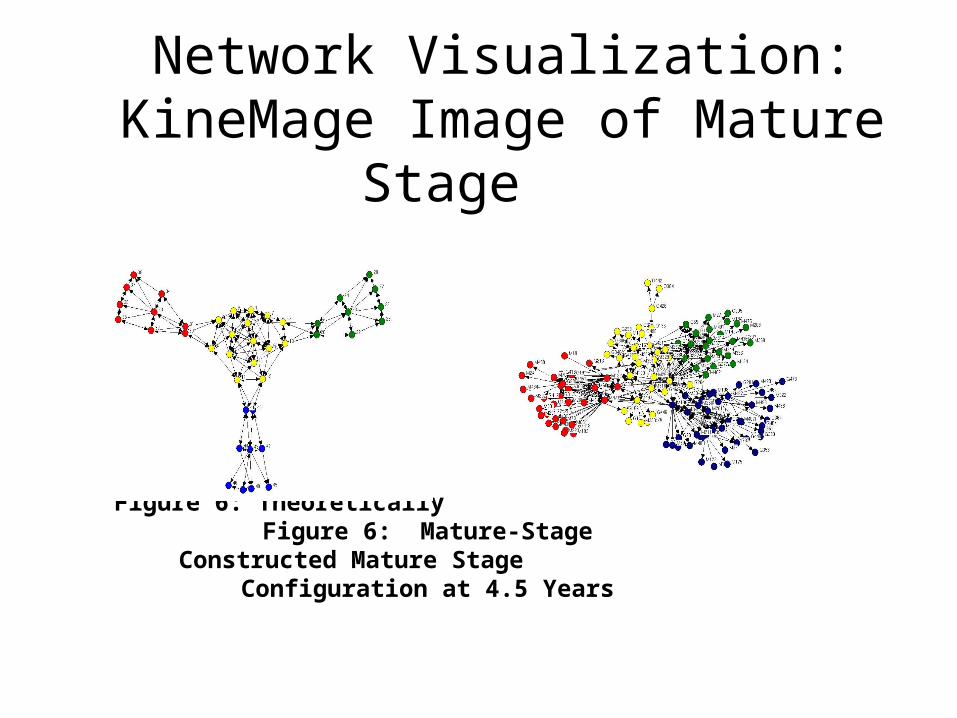
Figure 6: Theoretically Figure 6: Mature-Stage Constructed Mature Stage Configuration at 4.5 Years
Network Visualization:KineMage Image of Mature Stage

Conclusions
• The qualitative, statistical and visual trends in the data support an evolutionary model for partnership development and maintenance
• Six stages in the partnership cycle emerge, each associated with particular activities, issues, and decisions
• These findings have important applied implications associated with them
• An ideal model can be set up and used to guide new partnerships– Problems in existing partnerships can be diagnosed and addressed,
based on structure, change, or lack of change from stage to stage

Brief Examples of Application
• Recommendations for changes in the timing and structure of periodic progress reviews
• Recommendations for changes in the structure of roles on both sides of the partnership
• Recommendations on the types and amount of communication during the transition phase