Participating Employer Financial Information TO THE SCHEDULES ... Participating Employer Financial...
140
Participating Employer Financial Information For the Fiscal Year Ended June 30, 2015
-
Upload
duongxuyen -
Category
Documents
-
view
216 -
download
2
Transcript of Participating Employer Financial Information TO THE SCHEDULES ... Participating Employer Financial...

Participating Employer Financial Information
For the Fiscal Year Ended June 30, 2015

Participating Employer Financial Information
For the Fiscal Year Ended June 30, 2015
Preparer:
Washington State Department of Retirement Systems
PO Box 48380 Olympia, WA 98504-8380
www.drs.wa.gov

2 DRS s Participating Employer Financial Information
Table of Contents
3 Introduction
4 Independent Auditors’ Report
FISCAL YEAR 2015 ALLOCATION SCHEDULES
6 PERS 1 — Schedule of Employer and Nonemployer Allocations 53 PERS 2/3 — Schedule of Employer Allocations 78 SERS 2/3 — Schedule of Employer Allocations 86 PSERS 2 — Schedule of Employer Allocations 88 TRS 1 — Schedule of Employer and Nonemployer Allocations 104 TRS 2/3 — Schedule of Employer Allocations 113 LEOFF 1 — Schedule of Employer and Nonemployer Allocations 117 LEOFF 2 — Schedule of Employer and Nonemployer Allocations
127 State Actuary’s Certification Letter
129 Schedule of Collective Pension Amounts
NOTES TO THE SCHEDULES
131 Note 1: Plan Description 132 Note 2: Presentations and Allocations 134 Note 3: Reconciliation of DRS’ financial statements and employer records to Schedules of Employer and Nonemployer Allocations and Schedules of Collective Pension Amounts 136 Note 4: Actuarial Methods and Assumptions 137 Note 5: Additional Information

Participating Employer Financial Information s DRS 3
In June 2012, the Governmental Accounting Standards Board (GASB) issued two new standards for pension accounting and financial reporting. The standards — GASB Statement 67, Financial Reporting for Pension Plans, and GASB Statement 68, Accounting and Financial Reporting for Pensions — required changes in the way pension plans and state and local governments calculate and report the costs and obligations associated with providing pension benefits.
The schedules and accompanying information presented in this document are provided to assist employers participating in our multiple-employer, cost-sharing plans with preparing and presenting pension information in compliance with the requirements of GASB Statement 68. Information on the GASB standards and implementation tools GASB has provided can be found at www.drs.wa.gov/employer/gasb.
Additional information about the retirement plans is available in the Department of Retirement Systems’
2015 Comprehensive Annual Financial Report, which was prepared in compliance with GASB Statement 67.
As always, detailed accounting instructions should come from the State Auditor’s Office (for local governments), the state Office of Financial Management (for state agencies) or the Office of the Superintendent of Public Instruction (for school districts).
The new standards do not affect the amount employers pay to provide pension benefits. The standards only changed how pension costs are accounted for and reported in financial statements. GASB believes the required changes enhance accountability and transparency of governments that provide their employees with pension benefits.
October 2015
Introduction

4 DRS s Participating Employer Financial Information
INDEPENDENT AUDITORS' REPORT
Ms. Marcie Frost, Director Washington State Department of Retirement Systems Olympia, Washington Report on Schedules We have audited the accompanying schedules of employer and non‐employer allocations of the Washington State Department of Retirement Systems’ (DRS) Public Employees’ Retirement System (PERS) Plan 1 and Plan 2/3, School Employees’ Retirement System (SERS) Plan 2/3, Public Safety Employees’ Retirement System (PSERS) Plan 2, Teachers’ Retirement System (TRS) Plan 1 and Plan 2/3, Law Enforcement Officers’ and Fire Fighters’ Retirement System (LEOFF) Plan 1 and Plan 2 (the DRS Plans), as of and for the year ended June 30, 2015, and the related notes. We have also audited the total for all of the DRS Plans of the columns titled beginning net pension liability, ending net pension liability, total deferred outflows of resources excluding employer specific amounts, total deferred inflows of resources excluding employer specific amounts, and plan pension expense of the schedules of collective pension amounts as of and for the year ended June 30, 2015 (specified column totals), included in the accompanying schedules of collective pension amounts of the DRS Plans, and the related notes. Management’s Responsibility for the Schedules Management is responsible for the preparation and fair presentation of these schedules in accordance with accounting principles generally accepted in the United States of America; this includes the design, implementation, and maintenance of internal control relevant to the preparation and fair presentation of the schedules that are free from material misstatement, whether due to fraud or error. Auditors’ Responsibility Our responsibility is to express opinions on the schedules of employer and non‐employer allocations and the specified columns included in the schedules of collective pension amounts based on our audits. We conducted our audits in accordance with auditing standards generally accepted in the United States of America. Those standards require that we plan and perform the audit to obtain reasonable assurance about whether the schedules of employer and non‐employer allocations and the specified columns included in the schedules of collective pension amounts are free from material misstatement. An audit involves performing procedures to obtain audit evidence about the amounts and disclosures in the schedules of employer and non‐employer allocations and the specified columns included in the schedules of collective pension amounts. The procedures selected depend on the auditors’ judgment, including the assessment of the risks of material misstatement of the schedules of employer and non‐employer allocations and the specified columns included in the schedules of collective pension amounts, whether due to fraud or error. In making those risk assessments, the auditor considers internal control relevant to the entity’s preparation and fair presentation of the schedules of employer and non‐employer allocations and the specified columns included in the schedules of collective pension amounts in order to design audit procedures that are appropriate in the
CliftonLarsonAllen LLP CLAconnect.com
An independent member of Nexia International
Independent Auditors’ Report
Participating Employer Financial Information s DRS 5
Independent Auditors’ Report (cont.)
circumstances, but not for the purpose of expressing an opinion on the effectiveness of the entity’s internal control. Accordingly, we express no such opinion. An audit also includes evaluating the appropriateness of accounting policies used and the reasonableness of significant accounting estimates made by management, as well as evaluating the overall presentation of the schedules of employer and non‐employer allocations and the specified columns included in the schedules of collective pension amounts. We believe that the audit evidence we have obtained is sufficient and appropriate to provide a basis for our audit opinions. Opinions In our opinion, the schedules referred to above present fairly, in all material respects, the employer and non‐employer allocations and the beginning net pension liability, ending net pension liability, total deferred outflows of resources excluding employer specific amounts, total deferred inflows of resources excluding employer specific amounts, and plan pension expense for the DRS Plans as of June 30, 2015, in accordance with accounting principles generally accepted in the United States of America. Other Matters We have audited, in accordance with auditing standards generally accepted in the United States of America, the financial statements of DRS as of and for the year ended June 30, 2015, and our report thereon, dated October 15, 2015, expressed an unmodified opinion on those statements. Restriction of use Our report is intended solely for the information and use of the management of DRS, DRS employers and their auditors and is not intended to be and should not be used by anyone other than these specified parties.
a CliftonLarsonAllen LLP
Baltimore, Maryland October 22, 2015

6 DRS s Participating Employer Financial Information
State of Washington — Employer Allocations
Organization Identification Number Organization Name Employer Contributions
Allocation Percentage
1219 University of WA $ 2,017,391.60 0.438947%
0906 Social & Health Services Department of 1,417,885.10 0.308505%
0997 Transportation Department of 704,378.60 0.153260%
0510 Labor & Industries Department of 444,683.85 0.096755%
0298 Ferries WA State 429,060.64 0.093356%
0273 Employment Security Department of 367,979.36 0.080065%
0008 Administrative Office of the Court 319,592.00 0.069537%
0190 Corrections Southwest Region 233,472.47 0.050799%
1021 WA State University 223,530.15 0.048636%
0254 Ecology Department of 221,946.57 0.048291%
1616 Health Department of 206,600.73 0.044952%
0036 Attorney General Office of 187,578.25 0.040814%
0808 Revenue Department of 185,216.38 0.040300%
2550 Enterprise Services Department of 184,136.20 0.040065%
1601 Health Care Authority 183,246.31 0.039871%
0635 Natural Resources Department of 167,400.25 0.036423%
0538 Licensing Department of 167,151.06 0.036369%
1078 Western State Hospital 143,648.32 0.031255%
1745 Fish & Wildlife Department of 140,391.52 0.030547%
1079 Western WA University 120,565.09 0.026233%
0246 Eastern State Hospital 113,945.03 0.024792%
0713 State Patrol WA 105,564.04 0.022969%
0304 Financial Management Office of 92,252.65 0.020072%
0117 Central WA University 89,520.44 0.019478%
0772 Superintendent of Public Instruction 85,287.04 0.018557%
0520 Lakeland Village 81,025.58 0.017630%
0794 Rainier School 76,830.42 0.016717%
0839 Seattle Community College 74,072.24 0.016117%
0801 Corrections Northwest Region 73,472.16 0.015986%
2274 Corrections Health Services 72,193.22 0.015708%
0201 Court of Appeals WA State 68,374.43 0.014877%
0179 Spokane Community College 67,650.92 0.014720%
1678 Corrections Northeast Region 65,115.91 0.014168%
0974 Evergreen State College 64,208.29 0.013971%
0306 Fircrest School 60,841.35 0.013238%
0247 Eastern WA University 56,236.62 0.012236%
0704 Parks & Recreation Commission 51,343.82 0.011171%
2551 Consolidated Technology Services 49,644.48 0.010802%
0012 Agriculture Department of 49,387.06 0.010746%
0719 Corrections Southeast Region 49,331.21 0.010734%
0852 Senate WA State 47,978.85 0.010439%
1022 Utilities & Transportation Commission 47,345.03 0.010301%
PERS 1 — Schedule of Employer and Nonemployer Allocations
Public Employees’ Retirement System Plan 1For the fiscal year ended June 30, 2015 — Page 1 of 47
Participating Employer Financial Information s DRS 7
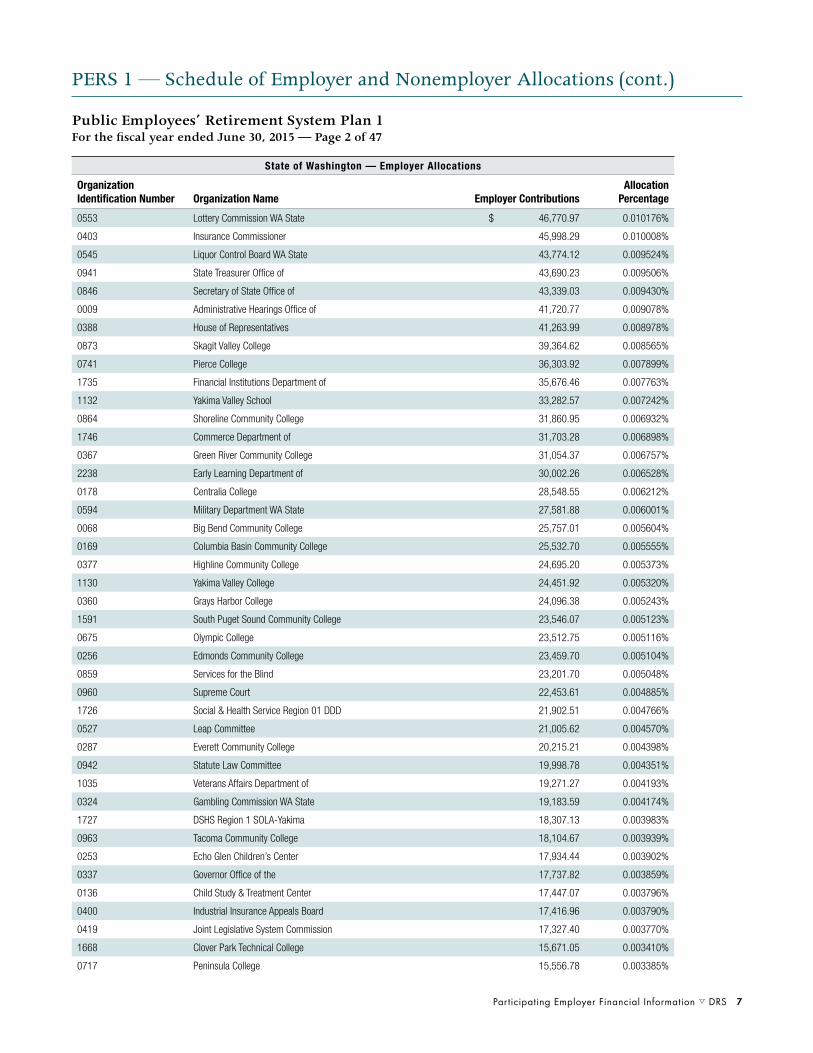
PERS 1 — Schedule of Employer and Nonemployer Allocations (cont.)
State of Washington — Employer Allocations
Organization Identification Number Organization Name Employer Contributions
Allocation Percentage
0553 Lottery Commission WA State $ 46,770.97 0.010176%
0403 Insurance Commissioner 45,998.29 0.010008%
0545 Liquor Control Board WA State 43,774.12 0.009524%
0941 State Treasurer Office of 43,690.23 0.009506%
0846 Secretary of State Office of 43,339.03 0.009430%
0009 Administrative Hearings Office of 41,720.77 0.009078%
0388 House of Representatives 41,263.99 0.008978%
0873 Skagit Valley College 39,364.62 0.008565%
0741 Pierce College 36,303.92 0.007899%
1735 Financial Institutions Department of 35,676.46 0.007763%
1132 Yakima Valley School 33,282.57 0.007242%
0864 Shoreline Community College 31,860.95 0.006932%
1746 Commerce Department of 31,703.28 0.006898%
0367 Green River Community College 31,054.37 0.006757%
2238 Early Learning Department of 30,002.26 0.006528%
0178 Centralia College 28,548.55 0.006212%
0594 Military Department WA State 27,581.88 0.006001%
0068 Big Bend Community College 25,757.01 0.005604%
0169 Columbia Basin Community College 25,532.70 0.005555%
0377 Highline Community College 24,695.20 0.005373%
1130 Yakima Valley College 24,451.92 0.005320%
0360 Grays Harbor College 24,096.38 0.005243%
1591 South Puget Sound Community College 23,546.07 0.005123%
0675 Olympic College 23,512.75 0.005116%
0256 Edmonds Community College 23,459.70 0.005104%
0859 Services for the Blind 23,201.70 0.005048%
0960 Supreme Court 22,453.61 0.004885%
1726 Social & Health Service Region 01 DDD 21,902.51 0.004766%
0527 Leap Committee 21,005.62 0.004570%
0287 Everett Community College 20,215.21 0.004398%
0942 Statute Law Committee 19,998.78 0.004351%
1035 Veterans Affairs Department of 19,271.27 0.004193%
0324 Gambling Commission WA State 19,183.59 0.004174%
1727 DSHS Region 1 SOLA-Yakima 18,307.13 0.003983%
0963 Tacoma Community College 18,104.67 0.003939%
0253 Echo Glen Children’s Center 17,934.44 0.003902%
0337 Governor Office of the 17,737.82 0.003859%
0136 Child Study & Treatment Center 17,447.07 0.003796%
0400 Industrial Insurance Appeals Board 17,416.96 0.003790%
0419 Joint Legislative System Commission 17,327.40 0.003770%
1668 Clover Park Technical College 15,671.05 0.003410%
0717 Peninsula College 15,556.78 0.003385%
Public Employees’ Retirement System Plan 1For the fiscal year ended June 30, 2015 — Page 2 of 47

8 DRS s Participating Employer Financial Information
PERS 1 — Schedule of Employer and Nonemployer Allocations (cont.)
State of Washington — Employer Allocations
Organization Identification Number Organization Name Employer Contributions
Allocation Percentage
1635 Special Commitment Center $ 14,658.82 0.003189%
0176 Community & Technical Colleges State Board for 14,304.82 0.003112%
1140 Consolidated Support Services 13,725.56 0.002986%
1729 DSHS Region 2 SOLA-King 13,497.81 0.002937%
0539 Lieutenant Governor Office of 13,180.25 0.002868%
0152 Clark Community College 12,965.04 0.002821%
1732 DSHS Region 3 DDD Field 12,815.64 0.002788%
1674 Bates Technical College 12,727.35 0.002769%
0365 Green Hill School 12,401.52 0.002698%
2261 Puget Sound Partnership 12,120.64 0.002637%
0213 Criminal Justice Training Commission 12,017.45 0.002615%
1088 Whatcom Community College 11,178.48 0.002432%
1728 Social & Health Service Region 02 DDD 10,574.64 0.002301%
0380 Historical Society WA State 10,376.29 0.002258%
0939 Center for Childhood Deafness WA State 9,426.92 0.002051%
0936 State Investment Board 9,046.58 0.001968%
1053 Walla Walla Community College 7,567.59 0.001647%
2563 Legislative Support Services Office of 7,294.84 0.001587%
1037 Workforce Training & Education Coordinating Board 7,095.17 0.001544%
0940 Soldiers Home of WA State 7,077.15 0.001540%
0386 Horse Racing Commission 6,615.60 0.001439%
0041 Auditor Office of the State 6,236.29 0.001357%
0633 Naselle Youth Camp 5,833.00 0.001269%
0027 Arts Commission WA State 5,057.28 0.001100%
1074 Wenatchee Valley College 5,056.81 0.001100%
2562 Student Achievement Council 4,855.38 0.001056%
1036 Veterans Home WA 4,658.04 0.001014%
0996 Traffic Safety Commission 4,601.92 0.001001%
0969 Tax Appeals Board of 4,138.08 0.000900%
0771 Public Employment Relations Commission 3,811.34 0.000829%
1442 Archaeology-Historic Preservation 3,748.32 0.000816%
1666 Renton Technical College 3,735.36 0.000813%
1731 DSHS Region 3 SOLA-Pierce 3,541.96 0.000771%
0938 School for the Blind 3,447.16 0.000750%
0554 Lower Columbia Community College 3,164.16 0.000688%
0599 Minority & Women’s Business Enterprises Office of 3,093.60 0.000673%
2008 Cascadia Community College 2,804.93 0.000610%
1725 Social & Health Service Region 01 SOLA 216.72 0.000047%
1004 Monroe Correctional Complex 16.84 0.000004%
Subtotal State of Washington — Employer Allocations $ 11,055,884.19 2.405555%
Public Employees’ Retirement System Plan 1For the fiscal year ended June 30, 2015 — Page 3 of 47

Participating Employer Financial Information s DRS 9
PERS 1 — Schedule of Employer and Nonemployer Allocations (cont.)
All Other Employers — Employer Allocations
Organization Identification Number Organization Name Employer Contributions
Allocation Percentage
0481 King County $ 1,996,477.71 0.434397%
0844 Seattle School District 001 390,828.85 0.085037%
0742 Pierce County 350,585.60 0.076281%
0896 Snohomish County 334,520.55 0.072785%
2559 King County Public Defender Organization 255,715.12 0.055639%
0922 Spokane County 212,392.85 0.046213%
0286 Everett City of 177,873.26 0.038702%
1089 Whatcom County 149,318.98 0.032489%
1126 Yakima County 148,195.16 0.032245%
0843 Seattle Port of 135,766.77 0.029540%
0048 Bellevue City of 133,986.18 0.029153%
0895 Snohomish County PUD 01 133,737.46 0.029099%
0966 Tacoma School District 010 131,922.95 0.028704%
0153 Clark County 129,623.40 0.028204%
0926 Spokane Public Schools 119,471.19 0.025995%
0490 Kitsap County 118,590.42 0.025803%
0984 Thurston County 114,897.08 0.024999%
0534 Lewis County 109,527.89 0.023831%
0460 King County Rural Library District 96,841.02 0.021071%
1031 Vancouver School District 037 89,820.73 0.019543%
0361 Grays Harbor County 87,624.40 0.019065%
0352 Grant County PUD 02 86,363.01 0.018791%
0051 Bellingham City of 76,415.51 0.016627%
0141 Clallam County 73,870.82 0.016073%
0050 Bellevue School District 405 73,799.27 0.016057%
0435 Kent School District 415 73,522.69 0.015997%
0872 Skagit County 72,055.43 0.015678%
0589 Metropolitan Park District of Tacoma 70,821.92 0.015410%
0124 Chelan County 65,384.61 0.014226%
0235 Douglas County PUD 01 64,890.90 0.014119%
1119 Yakima City of 61,147.95 0.013305%
0294 Federal Way School District 210 60,931.66 0.013258%
0865 Shoreline School District 412 59,780.65 0.013007%
0547 Longview City of 58,473.55 0.012723%
0237 Douglas County 57,140.33 0.012433%
0378 Highline School District 401 55,846.49 0.012151%
0061 Benton County 55,723.61 0.012124%
0745 Pierce County PTBA 55,400.91 0.012054%
0078 Bremerton City of 54,989.46 0.011965%
0611 Moses Lake School District 161 54,468.35 0.011851%
0482 King County Housing Authority 53,493.86 0.011639%
0054 Bellingham School District 501 52,713.79 0.011470%
Public Employees’ Retirement System Plan 1For the fiscal year ended June 30, 2015 — Page 4 of 47

10 DRS s Participating Employer Financial Information
PERS 1 — Schedule of Employer and Nonemployer Allocations (cont.)
All Other Employers — Employer Allocations
Organization Identification Number Organization Name Employer Contributions
Allocation Percentage
0804 Renton School District 403 $ 52,666.55 0.011459%
0128 Chelan County Public Utilities District 51,192.99 0.011139%
0518 Lake Washington School District 414 51,124.86 0.011124%
0205 Cowlitz County 50,357.85 0.010957%
1128 Yakima School District 007 50,109.47 0.010903%
0653 Northshore School District 417 48,609.09 0.010576%
0783 Puyallup City of 47,755.47 0.010391%
0810 Richland School District 400 47,705.24 0.010380%
0434 Kent City of 46,967.20 0.010219%
0623 Mukilteo School District 006 46,089.85 0.010028%
0861 Shelton City of 45,095.99 0.009812%
0290 Everett School District 002 43,865.26 0.009544%
0258 Edmonds School District 015 43,143.16 0.009387%
0484 Kirkland City of 43,105.78 0.009379%
0150 Clark County PUD 42,590.76 0.009267%
0671 Olympia City of 42,178.32 0.009177%
0651 North Thurston Public Schools 41,755.50 0.009085%
0668 Okanogan County 40,938.64 0.008907%
0673 Olympia School District 111 40,574.36 0.008828%
0499 Kittitas County 38,023.11 0.008273%
0718 Peninsula School District 401 37,492.14 0.008158%
0958 Sunnyside School District 201 37,039.46 0.008059%
0986 Timberland Regional Library 36,305.53 0.007899%
0114 Central Kitsap School District 401 36,144.01 0.007864%
0780 Pullman City of 35,954.00 0.007823%
0415 Issaquah School District 411 35,864.27 0.007803%
0161 Clover Park School District 400 35,744.19 0.007777%
0740 Pierce County Rural Library District 35,448.13 0.007713%
0625 North Central Regional Library 35,384.19 0.007699%
0809 Richland City of 35,188.86 0.007656%
1049 Walla Walla County 35,119.07 0.007641%
0709 Pasco School District 001 35,114.98 0.007640%
0802 Renton City of 34,953.03 0.007605%
0140 Clallam County PUD 01 34,761.67 0.007563%
0433 Kennewick School District 017 34,717.34 0.007554%
0570 Marysville School District 025 34,370.00 0.007478%
0255 Edmonds City of 33,342.09 0.007255%
0784 Puyallup School District 003 33,342.02 0.007255%
0115 Central Valley School District 356 32,995.46 0.007179%
0699 Pacific County 32,336.03 0.007036%
1115 Energy Northwest 31,944.67 0.006951%
0573 Mason County 31,867.83 0.006934%
Public Employees’ Retirement System Plan 1For the fiscal year ended June 30, 2015 — Page 5 of 47

Participating Employer Financial Information s DRS 11
PERS 1 — Schedule of Employer and Nonemployer Allocations (cont.)
All Other Employers — Employer Allocations
Organization Identification Number Organization Name Employer Contributions
Allocation Percentage
0992 Toppenish School District 202 $ 31,740.61 0.006906%
0260 Educational Service District 105 31,630.91 0.006882%
0316 Franklin County PUD 01 31,488.94 0.006851%
0935 WA Federation of State Employees 30,970.15 0.006739%
0039 Auburn School District 408 30,955.19 0.006735%
0882 Sno-Isle Regional Library 30,570.87 0.006652%
0751 Port Angeles City of 30,183.34 0.006567%
0829 South Columbia Basin Irrigation District 30,173.12 0.006565%
1020 University Place School District 083 29,963.52 0.006520%
2574 South Sound 911 29,831.40 0.006491%
0149 Clark County PTBA 29,823.17 0.006489%
0118 Centralia City of 29,705.58 0.006463%
0264 Puget Sound Educational Service District 29,529.91 0.006425%
0504 Klickitat County 29,459.78 0.006410%
0655 Oak Harbor City of 26,995.12 0.005874%
0358 Grays Harbor County PUD 01 26,836.20 0.005839%
0417 Jefferson County 26,646.58 0.005798%
0428 Kelso School District 458 26,492.74 0.005764%
0038 Auburn City of 26,405.58 0.005745%
0494 Kitsap Transit 26,387.23 0.005741%
0073 Blaine City of 26,263.27 0.005714%
0066 Bethel School District 403 25,996.87 0.005656%
0580 Mead School District 354 25,688.21 0.005589%
0954 Sumner City of 25,288.22 0.005502%
0413 Island County 24,981.83 0.005436%
0015 Alderwood Water District 24,724.14 0.005380%
1084 Whatcom County Public Library 24,684.01 0.005371%
0618 Mount Vernon School District 320 24,541.16 0.005340%
0263 Olympic Educational Service District 24,158.10 0.005256%
1652 Chelan-Douglas PTBA 23,717.19 0.005160%
1775 Shoreline City of 23,709.20 0.005159%
2436 Spokane Transit Authority 23,446.85 0.005102%
0856 Sequim City of 23,406.16 0.005093%
0033 Asotin County 23,069.15 0.005019%
0841 Seattle Housing Authority 22,910.18 0.004985%
0897 Snohomish Health District 22,637.75 0.004926%
0355 Grant County 22,465.47 0.004888%
1028 Vancouver City of 22,243.87 0.004840%
0910 South Kitsap School District 402 22,091.64 0.004807%
0706 Pasco City of 22,062.99 0.004800%
0429 Kennewick City of 21,599.22 0.004700%
0230 Midway Sewer District 21,577.90 0.004695%
Public Employees’ Retirement System Plan 1For the fiscal year ended June 30, 2015 — Page 6 of 47

12 DRS s Participating Employer Financial Information
PERS 1 — Schedule of Employer and Nonemployer Allocations (cont.)
All Other Employers — Employer Allocations
Organization Identification Number Organization Name Employer Contributions
Allocation Percentage
0871 Skagit County PUD 01 $ 21,022.54 0.004574%
0312 Fort Vancouver Regional Library 21,005.36 0.004570%
0319 Franklin Pierce School District 402 20,929.74 0.004554%
0649 North Kitsap School District 400 20,782.73 0.004522%
0249 Eastmont School District 206 20,551.32 0.004472%
1058 Wapato School District 207 20,456.72 0.004451%
0708 Pasco Port of 20,326.92 0.004423%
0800 Redmond City of 20,099.94 0.004373%
0291 Evergreen School District 114 19,829.62 0.004315%
0093 Burlington City of 19,133.90 0.004163%
0075 Bonney Lake City of 18,973.65 0.004128%
0269 Ellensburg City of 18,933.94 0.004120%
0295 Lakehaven Utility District 18,845.02 0.004100%
1685 Whatcom Transportation Authority 18,598.53 0.004047%
0899 Snohomish County PTBA 18,365.91 0.003996%
0001 Aberdeen City of 18,353.52 0.003993%
1891 Kenmore City of 18,104.03 0.003939%
0270 Ellensburg School District 401 17,949.81 0.003906%
0384 Hoquiam City of 17,550.43 0.003819%
0968 Tahoma School District 409 17,543.84 0.003817%
0754 Port Orchard City of 17,481.49 0.003804%
1003 Tumwater School District 033 17,431.09 0.003793%
0848 Sedro-Woolley School District 101 17,259.01 0.003755%
0779 Puget Sound Regional Council 17,142.06 0.003730%
0511 Lacey City of 16,980.74 0.003695%
0550 Longview School District 122 16,906.03 0.003678%
0781 Pullman School District 267 16,839.62 0.003664%
0303 Fife School District 417 16,827.64 0.003661%
0241 East Columbia Basin Irrigation District 16,762.04 0.003647%
0900 Snoqualmie City of 16,716.74 0.003637%
1096 Whitman County 16,709.77 0.003636%
1738 NW Regional Council 16,631.63 0.003619%
0569 Marysville City of 16,595.39 0.003611%
0903 South Whidbey School District 206 16,492.92 0.003589%
0602 Monroe City of 16,440.49 0.003577%
0473 Soos Creek Water & Sewer District 16,423.71 0.003573%
0045 Battle Ground School District 119 16,278.06 0.003542%
0972 Tenino School District 402 16,215.69 0.003528%
0204 Cowlitz County PUD 16,162.46 0.003517%
0406 Intercity Transit 16,157.37 0.003516%
0307 Fircrest City of 16,146.75 0.003513%
0245 East Wenatchee Water District 16,035.78 0.003489%
Public Employees’ Retirement System Plan 1For the fiscal year ended June 30, 2015 — Page 7 of 47

Participating Employer Financial Information s DRS 13
PERS 1 — Schedule of Employer and Nonemployer Allocations (cont.)
All Other Employers — Employer Allocations
Organization Identification Number Organization Name Employer Contributions
Allocation Percentage
0753 Port Angeles School District 121 $ 16,031.98 0.003488%
0007 Adams County 15,992.65 0.003480%
1624 Columbia River Council of Governments 15,982.51 0.003477%
0351 Grant County Public Works 15,815.87 0.003441%
2149 Cultural Development Authority of King County 15,769.56 0.003431%
0584 Mercer Island City of 15,735.49 0.003424%
0955 Sumner School District 320 15,700.63 0.003416%
0023 Aging & Long Term Care of Eastern WA 15,689.38 0.003414%
2241 South Central Workforce Council 15,668.76 0.003409%
0267 Northwest Regional Educational Service District 15,642.17 0.003403%
0056 Ben Franklin Transit 15,587.32 0.003392%
0217 Dairy Products Commission WA State* 15,515.12 0.003376%
0517 Lake Stevens School District 004 15,451.70 0.003362%
0002 Aberdeen School District 005 15,429.39 0.003357%
0302 Fife City of 15,395.59 0.003350%
0931 Stanwood-Camano School District 401 15,137.09 0.003294%
0832 San Juan County 15,058.03 0.003276%
0876 Skamania County 14,847.17 0.003230%
1134 Yelm School District 002 14,769.88 0.003214%
1034 Vera Water & Power 14,654.45 0.003189%
0340 Grandview City of 14,624.26 0.003182%
0920 Spokane Regional Health District 14,586.70 0.003174%
0385 Hoquiam School District 028 14,567.90 0.003170%
0231 Dieringer School District 343 14,359.09 0.003124%
0342 Granger School District 204 14,347.36 0.003122%
0272 Elma School District 068 14,320.21 0.003116%
0262 Educational Service District 113 14,319.39 0.003116%
0662 Ocean Shores City of 13,956.09 0.003037%
0080 Kitsap Public Health District 13,889.95 0.003022%
0898 Snohomish School District 201 13,826.67 0.003008%
0549 Longview Port of 13,685.33 0.002978%
0850 Selah School District 119 13,631.32 0.002966%
0614 Mount Adams School District 209 13,567.90 0.002952%
0070 Birch Bay Water & Sewer District 13,532.65 0.002944%
0622 Mukilteo City of 13,489.34 0.002935%
0609 Moses Lake City of 13,469.03 0.002931%
2005 Grays Harbor Transportation Authority 13,347.73 0.002904%
0695 Othello School District 147 13,235.20 0.002880%
0282 Ephrata City of 13,202.61 0.002873%
0583 Medina City of 13,127.14 0.002856%
Public Employees’ Retirement System Plan 1For the fiscal year ended June 30, 2015 — Page 8 of 47
* This employer is not included in the Office of Financial Management’s financial reporting for the state of Washington.

14 DRS s Participating Employer Financial Information
PERS 1 — Schedule of Employer and Nonemployer Allocations (cont.)
All Other Employers — Employer Allocations
Organization Identification Number Organization Name Employer Contributions
Allocation Percentage
0082 Bremerton School District 100 $ 13,063.14 0.002842%
0053 Bellingham Port of 13,005.51 0.002830%
1605 WA Counties Risk Pool 12,945.18 0.002817%
1842 Maple Valley City of 12,918.44 0.002811%
0076 Bothell City of 12,734.17 0.002771%
1076 West Valley School District 208 12,693.42 0.002762%
0464 King County Water District 111 12,662.16 0.002755%
0224 Dayton City of 12,415.25 0.002701%
0130 Chelan-Douglas Health District 12,409.02 0.002700%
0956 Sunnyside City of 12,393.53 0.002697%
0423 Kalama Port of 12,290.15 0.002674%
2538 Spokane County Water District 03 12,196.58 0.002654%
2267 West Sound Utility District 12,131.26 0.002640%
0341 Grandview School District 200 12,102.74 0.002633%
1071 Wenatchee City of 12,060.32 0.002624%
0095 Camas City of 11,972.25 0.002605%
0297 Ferndale School District 502 11,823.85 0.002573%
1127 Yakima County Health District 11,718.03 0.002550%
0094 Burlington-Edison School District 100 11,645.14 0.002534%
0656 Oak Harbor School District 201 11,597.09 0.002523%
0318 Franklin County 11,523.75 0.002507%
1027 Valley Transit 11,513.75 0.002505%
0362 Grays Harbor Port of 11,472.28 0.002496%
1593 Spokane County FPD 04 11,399.50 0.002480%
0229 Des Moines City of 11,089.37 0.002413%
0767 Prosser School District 116 11,053.37 0.002405%
0536 Liberty School District 362 10,927.71 0.002378%
1597 WA School Information Processing Cooperative 10,909.39 0.002374%
0414 Issaquah City of 10,883.92 0.002368%
0020 Anacortes School District 103 10,706.73 0.002330%
0946 Stevens County 10,621.56 0.002311%
0863 Shelton School District 309 10,603.83 0.002307%
2275 SW WA Council Government on Aging & Disabilities 10,588.91 0.002304%
0715 Pend Oreille County 10,569.76 0.002300%
0289 Everett Port of 10,543.87 0.002294%
1608 Thurston Regional Planning Council 10,493.64 0.002283%
1077 West Valley School District 363 10,414.10 0.002266%
1042 Wahkiakum County 10,386.59 0.002260%
0129 Chelan County Roads 10,371.04 0.002257%
0648 North Franklin School District 051 10,320.54 0.002246%
0757 Port Townsend School District 050 10,162.65 0.002211%
1623 Olympic Area Agency on Aging 10,160.66 0.002211%
Public Employees’ Retirement System Plan 1For the fiscal year ended June 30, 2015 — Page 9 of 47

Participating Employer Financial Information s DRS 15
PERS 1 — Schedule of Employer and Nonemployer Allocations (cont.)
All Other Employers — Employer Allocations
Organization Identification Number Organization Name Employer Contributions
Allocation Percentage
0043 Bar Association WA State* $ 10,137.24 0.002206%
1032 Vashon Island School District 402 10,029.99 0.002182%
1747 Greater Columbia Behavioral Health 9,949.28 0.002165%
1093 White Salmon School District 405 9,932.72 0.002161%
1131 Yakima Valley Regional Library 9,707.57 0.002112%
0645 North Beach School District 064 9,640.70 0.002098%
0322 Fruit Commission WA State* 9,578.34 0.002084%
0833 San Juan Island School District 149 9,577.78 0.002084%
1107 Bainbridge Island City of 9,523.02 0.002072%
0964 Tacoma Housing Authority 9,471.62 0.002061%
0060 Benton County PUD 1 9,398.87 0.002045%
2218 Spokane County Conservation 9,327.03 0.002029%
0016 Algona City of 9,314.33 0.002027%
0676 Olympic View Water District 9,185.32 0.001999%
1135 Yelm City of 9,180.28 0.001997%
1048 Walla Walla City of 9,118.34 0.001984%
0349 Grant County Housing Authority 9,081.51 0.001976%
0259 Northeast WA Educational Service District 101 8,952.27 0.001948%
0902 Snoqualmie Valley School District 410 8,838.37 0.001923%
2566 Health Benefit Exchange 8,833.22 0.001922%
0606 Montesano School District 066 8,797.61 0.001914%
0170 Columbia County 8,752.22 0.001904%
0638 Newport City of 8,718.72 0.001897%
0071 Black Diamond City of 8,704.98 0.001894%
1103 Willapa Valley Water District 8,659.69 0.001884%
0575 Mason County PUD 03 8,546.07 0.001859%
1002 Tumwater City of 8,535.21 0.001857%
0300 Ferry County 8,525.38 0.001855%
1059 Warden Joint Consolidated School District 146-161 8,503.40 0.001850%
0825 Royal School District 160 8,496.09 0.001849%
0965 Tacoma Port of 8,467.54 0.001842%
0284 Ephrata School District 165 8,452.12 0.001839%
0828 Ruston Town of 8,374.52 0.001822%
0678 Omak City of 8,258.64 0.001797%
0166 College Place City of 8,165.71 0.001777%
0881 Snohomish County Police Staff & Auxiliary 8,134.58 0.001770%
0991 Toppenish City of 8,074.04 0.001757%
0661 Ocean Beach School District 101 7,966.68 0.001733%
0679 Omak School District 019 7,891.70 0.001717%
0777 Puget Sound Clean Air Agency 7,821.70 0.001702%
Public Employees’ Retirement System Plan 1For the fiscal year ended June 30, 2015 — Page 10 of 47
* This employer is not included in the Office of Financial Management’s financial reporting for the state of Washington.
16 DRS s Participating Employer Financial Information
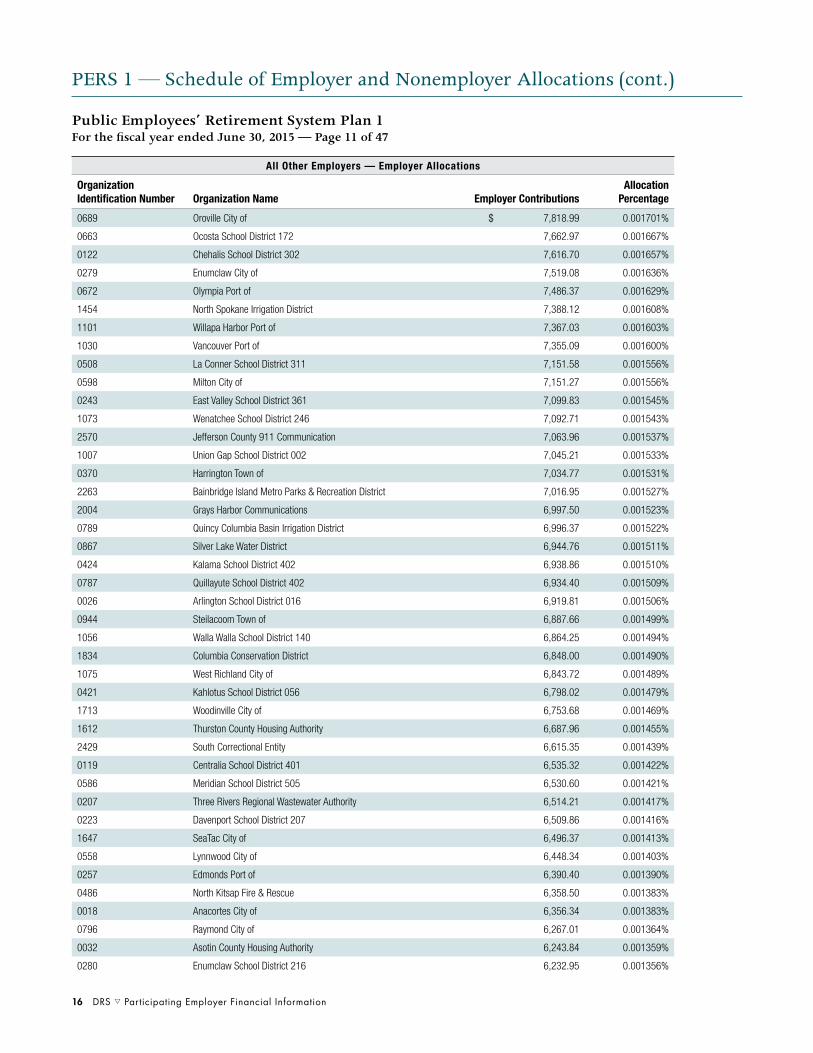
PERS 1 — Schedule of Employer and Nonemployer Allocations (cont.)
All Other Employers — Employer Allocations
Organization Identification Number Organization Name Employer Contributions
Allocation Percentage
0689 Oroville City of $ 7,818.99 0.001701%
0663 Ocosta School District 172 7,662.97 0.001667%
0122 Chehalis School District 302 7,616.70 0.001657%
0279 Enumclaw City of 7,519.08 0.001636%
0672 Olympia Port of 7,486.37 0.001629%
1454 North Spokane Irrigation District 7,388.12 0.001608%
1101 Willapa Harbor Port of 7,367.03 0.001603%
1030 Vancouver Port of 7,355.09 0.001600%
0508 La Conner School District 311 7,151.58 0.001556%
0598 Milton City of 7,151.27 0.001556%
0243 East Valley School District 361 7,099.83 0.001545%
1073 Wenatchee School District 246 7,092.71 0.001543%
2570 Jefferson County 911 Communication 7,063.96 0.001537%
1007 Union Gap School District 002 7,045.21 0.001533%
0370 Harrington Town of 7,034.77 0.001531%
2263 Bainbridge Island Metro Parks & Recreation District 7,016.95 0.001527%
2004 Grays Harbor Communications 6,997.50 0.001523%
0789 Quincy Columbia Basin Irrigation District 6,996.37 0.001522%
0867 Silver Lake Water District 6,944.76 0.001511%
0424 Kalama School District 402 6,938.86 0.001510%
0787 Quillayute School District 402 6,934.40 0.001509%
0026 Arlington School District 016 6,919.81 0.001506%
0944 Steilacoom Town of 6,887.66 0.001499%
1056 Walla Walla School District 140 6,864.25 0.001494%
1834 Columbia Conservation District 6,848.00 0.001490%
1075 West Richland City of 6,843.72 0.001489%
0421 Kahlotus School District 056 6,798.02 0.001479%
1713 Woodinville City of 6,753.68 0.001469%
1612 Thurston County Housing Authority 6,687.96 0.001455%
2429 South Correctional Entity 6,615.35 0.001439%
0119 Centralia School District 401 6,535.32 0.001422%
0586 Meridian School District 505 6,530.60 0.001421%
0207 Three Rivers Regional Wastewater Authority 6,514.21 0.001417%
0223 Davenport School District 207 6,509.86 0.001416%
1647 SeaTac City of 6,496.37 0.001413%
0558 Lynnwood City of 6,448.34 0.001403%
0257 Edmonds Port of 6,390.40 0.001390%
0486 North Kitsap Fire & Rescue 6,358.50 0.001383%
0018 Anacortes City of 6,356.34 0.001383%
0796 Raymond City of 6,267.01 0.001364%
0032 Asotin County Housing Authority 6,243.84 0.001359%
0280 Enumclaw School District 216 6,232.95 0.001356%
Public Employees’ Retirement System Plan 1For the fiscal year ended June 30, 2015 — Page 11 of 47

Participating Employer Financial Information s DRS 17
PERS 1 — Schedule of Employer and Nonemployer Allocations (cont.)
All Other Employers — Employer Allocations
Organization Identification Number Organization Name Employer Contributions
Allocation Percentage
0461 Covington Water District $ 6,218.20 0.001353%
1714 Burien City of 6,177.23 0.001344%
0478 Highline Water District 6,153.64 0.001339%
0132 Cheney City of 6,107.27 0.001329%
0582 Medical Lake School District 326 6,048.06 0.001316%
0688 Oroville-Tonasket Irrigation District 6,046.68 0.001316%
0535 Lewis PTBA 6,005.48 0.001307%
0605 Montesano City of 6,001.00 0.001306%
0617 Mount Vernon City of 5,983.49 0.001302%
0092 Buckley City of 5,952.68 0.001295%
0079 Bremerton Housing Authority 5,942.40 0.001293%
2595 SW WA Aging & Long Term Care 5,891.48 0.001282%
0072 Blaine School District 503 5,864.40 0.001276%
0515 Lake Forest Park City of 5,827.05 0.001268%
1025 Valley Communication Center 5,797.15 0.001261%
0135 Chewelah School District 036 5,790.23 0.001260%
0265 Educational Service District 123 5,789.98 0.001260%
0836 School Directors’ Association of WA State* 5,782.37 0.001258%
0187 Consolidated Irrigation District 19 5,778.10 0.001257%
0339 Grand Coulee Dam School District 301 5,767.48 0.001255%
1466 Anacortes Housing Authority 5,758.76 0.001253%
0096 Camas School District 117 5,747.56 0.001251%
0196 Coulee Dam Town of 5,718.97 0.001244%
0239 Dupont City of 5,618.96 0.001223%
0541 Lincoln County Highway Department 5,595.53 0.001217%
0133 Cheney School District 360 5,586.98 0.001216%
2169 Clallam Transit System 5,586.51 0.001216%
1919 Skagit 911 5,554.36 0.001209%
0601 Model Irrigation District 18 5,550.52 0.001208%
0189 Conway School District 317 5,543.20 0.001206%
0251 Eatonville School District 404 5,531.53 0.001204%
1111 Woodinville Water District 5,490.73 0.001195%
0636 Northshore Utility District 5,487.36 0.001194%
0604 Monroe School District 103 5,469.17 0.001190%
1029 Vancouver Housing Authority 5,454.61 0.001187%
0488 South Kitsap Fire & Rescue 5,420.07 0.001179%
0768 Public School Employees of WA 5,403.93 0.001176%
0426 Kelso City of 5,397.99 0.001175%
0042 Bainbridge Island School District 303 5,381.08 0.001171%
0035 County Officials WA Association of 5,358.36 0.001166%
Public Employees’ Retirement System Plan 1For the fiscal year ended June 30, 2015 — Page 12 of 47
* This employer is not included in the Office of Financial Management’s financial reporting for the state of Washington.
18 DRS s Participating Employer Financial Information
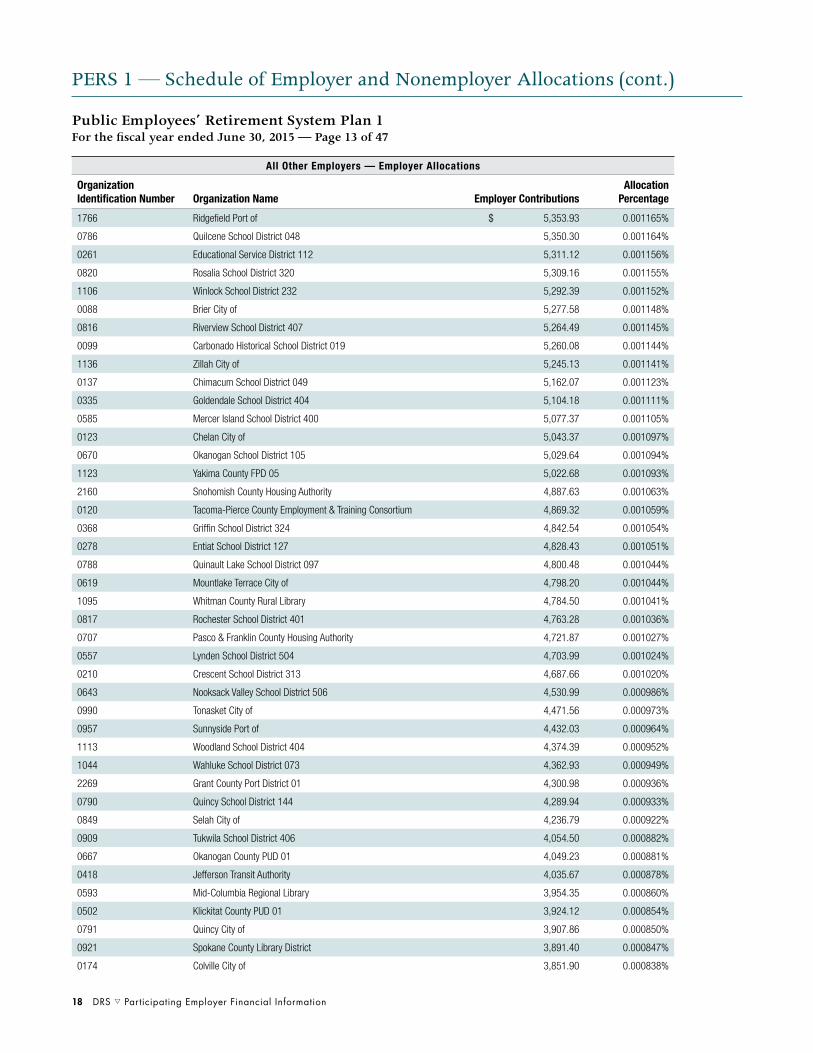
PERS 1 — Schedule of Employer and Nonemployer Allocations (cont.)
All Other Employers — Employer Allocations
Organization Identification Number Organization Name Employer Contributions
Allocation Percentage
1766 Ridgefield Port of $ 5,353.93 0.001165%
0786 Quilcene School District 048 5,350.30 0.001164%
0261 Educational Service District 112 5,311.12 0.001156%
0820 Rosalia School District 320 5,309.16 0.001155%
1106 Winlock School District 232 5,292.39 0.001152%
0088 Brier City of 5,277.58 0.001148%
0816 Riverview School District 407 5,264.49 0.001145%
0099 Carbonado Historical School District 019 5,260.08 0.001144%
1136 Zillah City of 5,245.13 0.001141%
0137 Chimacum School District 049 5,162.07 0.001123%
0335 Goldendale School District 404 5,104.18 0.001111%
0585 Mercer Island School District 400 5,077.37 0.001105%
0123 Chelan City of 5,043.37 0.001097%
0670 Okanogan School District 105 5,029.64 0.001094%
1123 Yakima County FPD 05 5,022.68 0.001093%
2160 Snohomish County Housing Authority 4,887.63 0.001063%
0120 Tacoma-Pierce County Employment & Training Consortium 4,869.32 0.001059%
0368 Griffin School District 324 4,842.54 0.001054%
0278 Entiat School District 127 4,828.43 0.001051%
0788 Quinault Lake School District 097 4,800.48 0.001044%
0619 Mountlake Terrace City of 4,798.20 0.001044%
1095 Whitman County Rural Library 4,784.50 0.001041%
0817 Rochester School District 401 4,763.28 0.001036%
0707 Pasco & Franklin County Housing Authority 4,721.87 0.001027%
0557 Lynden School District 504 4,703.99 0.001024%
0210 Crescent School District 313 4,687.66 0.001020%
0643 Nooksack Valley School District 506 4,530.99 0.000986%
0990 Tonasket City of 4,471.56 0.000973%
0957 Sunnyside Port of 4,432.03 0.000964%
1113 Woodland School District 404 4,374.39 0.000952%
1044 Wahluke School District 073 4,362.93 0.000949%
2269 Grant County Port District 01 4,300.98 0.000936%
0790 Quincy School District 144 4,289.94 0.000933%
0849 Selah City of 4,236.79 0.000922%
0909 Tukwila School District 406 4,054.50 0.000882%
0667 Okanogan County PUD 01 4,049.23 0.000881%
0418 Jefferson Transit Authority 4,035.67 0.000878%
0593 Mid-Columbia Regional Library 3,954.35 0.000860%
0502 Klickitat County PUD 01 3,924.12 0.000854%
0791 Quincy City of 3,907.86 0.000850%
0921 Spokane County Library District 3,891.40 0.000847%
0174 Colville City of 3,851.90 0.000838%
Public Employees’ Retirement System Plan 1For the fiscal year ended June 30, 2015 — Page 13 of 47

Participating Employer Financial Information s DRS 19
PERS 1 — Schedule of Employer and Nonemployer Allocations (cont.)
All Other Employers — Employer Allocations
Organization Identification Number Organization Name Employer Contributions
Allocation Percentage
0626 North Olympic Library System $ 3,803.69 0.000828%
0376 Highland School District 203 3,557.73 0.000774%
0637 Nespelem School District 014 3,557.49 0.000774%
0905 Soap Lake School District 156 3,524.58 0.000767%
0755 Port Townsend City of 3,402.77 0.000740%
2281 Grant Transit Authority 3,392.38 0.000738%
2213 Peninsula Metropolitan Park District 3,311.46 0.000721%
1092 White River School District 416 3,303.71 0.000719%
1005 Twisp Town of 3,254.93 0.000708%
0065 Benton-Franklin Health District 3,229.76 0.000703%
0156 Clarkston School District 250 3,227.12 0.000702%
0483 Kiona-Benton City School District 052 3,205.76 0.000698%
0621 East Valley School District 090 3,171.53 0.000690%
0901 Snoqualmie Pass Utility District 3,116.43 0.000678%
0227 Deer Park School District 414 3,082.79 0.000671%
1045 Waitsburg City of 3,063.74 0.000667%
1617 Kitsap County Consolidated Housing Authority 3,039.41 0.000661%
0305 Finley School District 053 3,022.06 0.000658%
0691 Orting School District 344 3,000.57 0.000653%
0687 Oroville School District 410 2,931.83 0.000638%
1063 Washougal School District 112-6 2,924.44 0.000636%
0815 Riverside School District 416 2,829.54 0.000616%
0577 McCleary School District 065 2,812.93 0.000612%
0396 Inchelium School District 070 2,762.54 0.000601%
0943 Steilacoom Historical School District 001 2,630.01 0.000572%
0615 Mount Baker School District 507 2,609.05 0.000568%
0759 Potato Commission WA State* 2,606.05 0.000567%
0098 Cape Flattery School District 401 2,566.28 0.000558%
0173 Columbia School District 400 2,520.54 0.000548%
0521 Lakewood School District 306 2,442.57 0.000531%
0010 Adna School District 226 2,396.14 0.000521%
0356 Grapeview School District 054 2,371.79 0.000516%
2294 Jefferson County Rural Library District 2,350.31 0.000511%
1614 Lopez Island Library District 2,306.73 0.000502%
0988 Toledo School District 237 2,245.74 0.000489%
0660 Oakville School District 400 2,180.06 0.000474%
0498 Kittitas County PUD 01 2,169.14 0.000472%
1069 Wellpinit School District 049 2,137.19 0.000465%
0686 Orondo School District 013 2,099.44 0.000457%
0548 Longview Housing Authority 2,077.64 0.000452%
Public Employees’ Retirement System Plan 1For the fiscal year ended June 30, 2015 — Page 14 of 47
* This employer is not included in the Office of Financial Management’s financial reporting for the state of Washington.

20 DRS s Participating Employer Financial Information
PERS 1 — Schedule of Employer and Nonemployer Allocations (cont.)
All Other Employers — Employer Allocations
Organization Identification Number Organization Name Employer Contributions
Allocation Percentage
0761 Prescott School District 402 $ 2,017.40 0.000439%
0747 Pioneer School District 402 1,986.57 0.000432%
0320 Freeman School District 358 1,948.00 0.000424%
0327 Garfield County 1,947.25 0.000424%
0564 Manson School District 019 1,946.43 0.000424%
0074 Boistfort School District 234 1,925.29 0.000419%
0834 Satsop School District 104 1,907.30 0.000415%
0664 Odessa School District 105 1,879.82 0.000409%
0560 Mabton School District 120 1,805.69 0.000393%
0225 Dayton School District 002 1,789.05 0.000389%
0793 Rainier School District 307 1,725.72 0.000375%
0908 South Bend School District 118 1,718.84 0.000374%
0215 Cusick School District 059 1,635.66 0.000356%
0108 Castle Rock School District 401 1,629.56 0.000355%
0167 College Place School District 250 1,624.89 0.000354%
1091 White Pass School District 303 1,611.50 0.000351%
0634 Naselle-Grays River Valley School District 1,564.43 0.000340%
0543 Lind School District 158 1,542.58 0.000336%
0467 King County Water District 019 1,528.52 0.000333%
0639 Newport School District 056-415 1,525.76 0.000332%
0869 Skagit County Housing Authority 1,484.89 0.000323%
0806 Republic City of 1,470.50 0.000320%
0317 Franklin County Public Works 1,432.53 0.000312%
1137 Zillah School District 205 1,415.14 0.000308%
1102 Willapa Valley School District 160 1,403.65 0.000305%
0514 Lake Chelan School District 129 1,398.85 0.000304%
0568 Mary Walker School District 207 1,356.88 0.000295%
0214 Curlew School District 050 1,324.62 0.000288%
0556 Lynden City of 1,312.82 0.000286%
0798 Reardan-Edwall School District 009 1,202.00 0.000262%
1006 Union Gap City of 1,168.47 0.000254%
0469 King County Water District 045 1,121.21 0.000244%
0492 Kitsap Regional Library 1,053.33 0.000229%
0334 Goldendale City of 998.86 0.000217%
0950 Sultan School District 311 966.08 0.000210%
0778 WA Cities Insurance Authority 873.66 0.000190%
0084 Brewster School District 111 847.67 0.000184%
0913 Spokane International Airport 666.67 0.000145%
0552 Lopez Island School District 144 620.58 0.000135%
0681 Onion Creek School District 030 618.42 0.000135%
0220 Darrington Town of 537.28 0.000117%
0165 Colfax School District 300 492.23 0.000107%
Public Employees’ Retirement System Plan 1For the fiscal year ended June 30, 2015 — Page 15 of 47

Participating Employer Financial Information s DRS 21
PERS 1 — Schedule of Employer and Nonemployer Allocations (cont.)
All Other Employers — Employer Allocations
Organization Identification Number Organization Name Employer Contributions
Allocation Percentage
0797 Raymond School District 116 $ 460.59 0.000100%
0640 Nine Mile Falls School District 325 452.48 0.000098%
0989 Tonasket School District 404 302.40 0.000066%
0812 Ridgefield School District 122 293.52 0.000064%
0682 Orcas Island School District 137 292.60 0.000064%
0509 La Conner Town of 214.97 0.000047%
0650 North Mason School District 403 144.35 0.000031%
0025 Arlington City of 141.58 0.000031%
0029 Asotin-Anatone School District 420 126.96 0.000028%
0542 Lincoln County 91.57 0.000020%
1108 Winthrop Town of 77.71 0.000017%
0765 Prosser City of 61.49 0.000013%
2082 LOTT Clean Water Alliance 13.17 0.000003%
1706 Mason County PTBA 7.76 0.000002%
Subtotal All Other Employers — Employer Allocations $ 12,615,128.10 2.744818%
Total State of Washington and All Other Employers — Employer Allocations $ 23,671,012.29 5.150373%
Public Employees’ Retirement System Plan 1For the fiscal year ended June 30, 2015 — Page 16 of 47
State of Washington — Plan 1 UAAL
Organization Identification Number Organization Name Employer Contributions
Allocation Percentage
1219 University of WA $ 36,277,380.61 7.893285%
0906 Social & Health Services Department of 21,887,984.16 4.762419%
0997 Transportation Department of 12,912,938.22 2.809616%
0510 Labor & Industries Department of 6,143,846.31 1.336787%
0190 Corrections Southwest Region 5,445,835.67 1.184913%
0801 Corrections Northwest Region 4,655,064.06 1.012856%
1021 WA State University 4,222,008.82 0.918631%
0298 Ferries WA State 4,033,134.39 0.877535%
1616 Health Department of 3,866,446.86 0.841267%
1078 Western State Hospital 3,863,888.41 0.840710%
0254 Ecology Department of 3,812,355.34 0.829498%
0719 Corrections Southeast Region 3,391,191.89 0.737860%
0036 Attorney General Office of 3,256,876.53 0.708636%
1745 Fish & Wildlife Department of 3,243,201.35 0.705660%
0635 Natural Resources Department of 3,197,342.96 0.695683%
0273 Employment Security Department of 2,891,997.78 0.629245%
0808 Revenue Department of 2,645,276.33 0.575563%
0538 Licensing Department of 2,460,347.73 0.535326%
1601 Health Care Authority 2,312,182.31 0.503088%
2550 Enterprise Services Department of 2,307,823.76 0.502140%
0713 State Patrol WA 2,297,355.33 0.499862%
2274 Corrections Health Services 2,040,219.02 0.443914%

22 DRS s Participating Employer Financial Information
PERS 1 — Schedule of Employer and Nonemployer Allocations (cont.)
State of Washington — Plan 1 UAAL
Organization Identification Number Organization Name Employer Contributions
Allocation Percentage
0008 Administrative Office of the Court $ 1,847,449.83 0.401971%
0246 Eastern State Hospital 1,465,343.67 0.318832%
0012 Agriculture Department of 1,444,148.25 0.314220%
1678 Corrections Northeast Region 1,345,999.21 0.292864%
1079 Western WA University 1,327,632.23 0.288868%
0794 Rainier School 1,289,021.00 0.280467%
0117 Central WA University 1,169,156.59 0.254387%
0704 Parks & Recreation Commission 1,126,579.68 0.245123%
0839 Seattle Community College 1,046,263.85 0.227648%
0247 Eastern WA University 1,012,494.99 0.220300%
0306 Fircrest School 965,746.70 0.210129%
0520 Lakeland Village 938,312.05 0.204159%
0041 Auditor Office of the State 933,890.69 0.203197%
0772 Superintendent of Public Instruction 914,578.25 0.198995%
0179 Spokane Community College 897,019.89 0.195175%
2551 Consolidated Technology Services 831,684.80 0.180959%
0304 Financial Management Office of 744,845.27 0.162065%
1746 Commerce Department of 708,945.13 0.154253%
1635 Special Commitment Center 700,369.52 0.152387%
0388 House of Representatives 698,452.98 0.151970%
0594 Military Department WA State 656,013.65 0.142736%
2238 Early Learning Department of 588,317.89 0.128007%
0545 Liquor Control Board WA State 587,186.63 0.127761%
0974 Evergreen State College 578,855.93 0.125948%
0049 Bellevue Community College 554,044.86 0.120550%
0403 Insurance Commissioner 545,664.38 0.118726%
0152 Clark Community College 534,884.17 0.116381%
1735 Financial Institutions Department of 530,751.84 0.115482%
0852 Senate WA State 523,627.83 0.113932%
1036 Veterans Home WA 510,976.41 0.111179%
0256 Edmonds Community College 486,366.08 0.105824%
0846 Secretary of State Office of 473,949.29 0.103123%
0741 Pierce College 446,922.00 0.097242%
0287 Everett Community College 419,954.83 0.091374%
0365 Green Hill School 414,653.65 0.090221%
0936 State Investment Board 401,457.65 0.087350%
0009 Administrative Hearings Office of 401,070.26 0.087265%
0400 Industrial Insurance Appeals Board 399,719.95 0.086972%
0201 Court of Appeals WA State 391,533.68 0.085190%
1132 Yakima Valley School 371,024.41 0.080728%
0367 Green River Community College 362,523.68 0.078878%
0253 Echo Glen Children’s Center 349,289.76 0.075999%
Public Employees’ Retirement System Plan 1For the fiscal year ended June 30, 2015 — Page 17 of 47

Participating Employer Financial Information s DRS 23
PERS 1 — Schedule of Employer and Nonemployer Allocations (cont.)
State of Washington — Plan 1 UAAL
Organization Identification Number Organization Name Employer Contributions
Allocation Percentage
1022 Utilities & Transportation Commission $ 346,692.35 0.075434%
1726 Social & Health Service Region 01 DDD 329,141.79 0.071615%
0963 Tacoma Community College 304,818.55 0.066323%
0873 Skagit Valley College 297,061.59 0.064635%
0324 Gambling Commission WA State 287,856.27 0.062632%
0864 Shoreline Community College 287,066.81 0.062460%
0940 Soldiers Home of WA State 280,793.00 0.061095%
0675 Olympic College 267,642.33 0.058234%
0554 Lower Columbia Community College 265,612.20 0.057792%
1728 Social & Health Service Region 02 DDD 265,136.52 0.057689%
0553 Lottery Commission WA State 261,374.72 0.056870%
0377 Highline Community College 260,305.45 0.056638%
1130 Yakima Valley College 235,226.12 0.051181%
1674 Bates Technical College 233,823.42 0.050876%
1035 Veterans Affairs Department of 232,511.82 0.050590%
1732 DSHS Region 3 DDD Field 232,176.77 0.050517%
1668 Clover Park Technical College 226,445.55 0.049270%
2562 Student Achievement Council 224,614.33 0.048872%
2114 Veterans Home — Spokane 221,068.86 0.048100%
0176 Community & Technical Colleges State Board for 214,104.00 0.046585%
1591 South Puget Sound Community College 213,372.03 0.046426%
0136 Child Study & Treatment Center 213,096.88 0.046366%
1053 Walla Walla Community College 212,616.27 0.046261%
0169 Columbia Basin Community College 190,788.78 0.041512%
0960 Supreme Court 185,195.35 0.040295%
0941 State Treasurer Office of 180,377.81 0.039247%
1666 Renton Technical College 172,579.51 0.037550%
0859 Services for the Blind 171,712.62 0.037361%
1140 Consolidated Support Services 170,510.13 0.037100%
1729 DSHS Region 2 SOLA-King 162,545.09 0.035367%
0178 Centralia College 161,295.08 0.035095%
1673 Lake Washington Institute of Technology 154,516.53 0.033620%
1088 Whatcom Community College 146,973.90 0.031979%
0633 Naselle Youth Camp 146,847.24 0.031951%
1667 Bellingham Technical College 144,209.76 0.031377%
1074 Wenatchee Valley College 140,994.00 0.030678%
0405 Recreation Conservation Office 135,243.37 0.029426%
2261 Puget Sound Partnership 135,080.49 0.029391%
0419 Joint Legislative System Commission 134,201.07 0.029200%
0360 Grays Harbor College 119,698.95 0.026044%
0337 Governor Office of the 119,019.71 0.025896%
0068 Big Bend Community College 114,156.82 0.024838%
Public Employees’ Retirement System Plan 1For the fiscal year ended June 30, 2015 — Page 18 of 47

24 DRS s Participating Employer Financial Information
PERS 1 — Schedule of Employer and Nonemployer Allocations (cont.)
State of Washington — Plan 1 UAAL
Organization Identification Number Organization Name Employer Contributions
Allocation Percentage
1731 DSHS Region 3 SOLA-Pierce $ 103,591.16 0.022540%
0717 Peninsula College 103,495.24 0.022519%
0942 Statute Law Committee 103,426.88 0.022504%
0939 Center for Childhood Deafness WA State 102,836.16 0.022375%
0938 School for the Blind 101,515.76 0.022088%
1725 Social & Health Service Region 01 SOLA 97,376.98 0.021187%
1727 DSHS Region 1 SOLA-Yakima 91,490.69 0.019907%
0213 Criminal Justice Training Commission 90,971.80 0.019794%
0771 Public Employment Relations Commission 82,411.57 0.017931%
2563 Legislative Support Services Office of 70,345.96 0.015306%
0380 Historical Society WA State 66,420.69 0.014452%
0529 Joint Legislative Audit & Review Committee 63,497.80 0.013816%
0391 Human Rights Commission 61,623.92 0.013408%
1228 County Road Administration Board 58,127.18 0.012647%
1037 Workforce Training & Education Coordinating Board 57,929.73 0.012604%
2008 Cascadia Community College 55,088.92 0.011986%
0996 Traffic Safety Commission 53,697.84 0.011684%
0185 Conservation Commission 48,721.42 0.010601%
0004 Actuary State 47,197.92 0.010269%
1809 Public Defense Office of 46,966.14 0.010219%
0281 Environmental & Land Use Hearings Office 44,628.98 0.009710%
0599 Minority & Women’s Business Enterprises Office of 44,301.35 0.009639%
1442 Archaeology-Historic Preservation 43,622.59 0.009491%
0379 Historical Society Eastern WA State 43,342.46 0.009431%
0769 Public Disclosure Commission 40,160.20 0.008738%
1646 Transportation Improvement Board 32,591.30 0.007091%
0527 Leap Committee 30,717.88 0.006684%
0969 Tax Appeals Board of 30,551.33 0.006647%
1837 Caseload Forecast Council 28,750.77 0.006256%
0027 Arts Commission WA State 25,713.38 0.005595%
0420 Judicial Conduct Commission 25,362.54 0.005518%
0003 Accountancy State Board of 24,629.42 0.005359%
2171 LEOFF Plan 2 Retirement Board 22,658.75 0.004930%
0386 Horse Racing Commission 22,541.65 0.004905%
1637 Forecast Council Office of 19,437.36 0.004229%
0163 Columbia River Gorge Commission 17,031.49 0.003706%
1622 Pollution Liability Insurance 16,378.90 0.003564%
0526 Law Library WA State 16,378.61 0.003564%
2212 Joint Transportation Committee 10,676.46 0.002323%
0539 Lieutenant Governor Office of 10,594.38 0.002305%
2206 Civil Legal Aide Office of 7,992.60 0.001739%
1039 Volunteer Firefighters Board 7,480.45 0.001628%
Public Employees’ Retirement System Plan 1For the fiscal year ended June 30, 2015 — Page 19 of 47

Participating Employer Financial Information s DRS 25
PERS 1 — Schedule of Employer and Nonemployer Allocations (cont.)
State of Washington — Plan 1 UAAL
Organization Identification Number Organization Name Employer Contributions
Allocation Percentage
2577 WA Charter School Commission $ 7,081.29 0.001541%
1443 Puget Sound Pilotage Commission 6,116.40 0.001331%
0398 Indian Advisory Council WA State 5,641.32 0.001227%
1627 African American Affairs Commission 5,062.71 0.001102%
0028 Commission on Asian Pacific American Affairs 5,031.93 0.001095%
0592 Hispanic Affairs Commission 5,017.71 0.001092%
1890 Citizens’ Commission on Salaries for Elected Officials 3,720.95 0.000810%
0159 Olympic Correction Center 97.89 0.000021%
0565 Maple Lane School 58.42 0.000013%
Subtotal State of Washington — Plan 1 UAAL $ 180,010,030.32 39.166843%
Public Employees’ Retirement System Plan 1For the fiscal year ended June 30, 2015 — Page 20 of 47
All Other Employers — Plan 1 UAAL
Organization Identification Number Organization Name Employer Contributions
Allocation Percentage
0481 King County $ 37,731,346.01 8.209641%
0742 Pierce County 7,735,214.28 1.683039%
0896 Snohomish County 6,342,552.45 1.380022%
1115 Energy Northwest 5,679,478.14 1.235749%
0844 Seattle School District 001 4,220,930.59 0.918396%
0895 Snohomish County PUD 01 3,961,745.20 0.862002%
0843 Seattle Port of 3,866,893.69 0.841364%
0922 Spokane County 3,801,818.72 0.827205%
0153 Clark County 3,673,779.39 0.799346%
0048 Bellevue City of 3,057,801.56 0.665321%
0490 Kitsap County 2,492,074.08 0.542229%
0352 Grant County PUD 02 2,416,829.43 0.525857%
0128 Chelan County Public Utilities District 2,391,360.89 0.520316%
0984 Thurston County 2,372,053.10 0.516115%
0745 Pierce County PTBA 2,146,370.48 0.467010%
0966 Tacoma School District 010 2,064,642.41 0.449228%
0286 Everett City of 2,025,455.70 0.440702%
1126 Yakima County 1,847,590.65 0.402001%
0435 Kent School District 415 1,768,072.14 0.384700%
0460 King County Rural Library District 1,760,391.78 0.383029%
1089 Whatcom County 1,752,288.08 0.381265%
0926 Spokane Public Schools 1,750,835.02 0.380949%
0899 Snohomish County PTBA 1,526,756.45 0.332194%
1031 Vancouver School District 037 1,507,366.12 0.327975%
0518 Lake Washington School District 414 1,482,632.58 0.322593%
1028 Vancouver City of 1,471,495.17 0.320170%
0434 Kent City of 1,435,351.12 0.312306%
0294 Federal Way School District 210 1,420,012.18 0.308968%
26 DRS s Participating Employer Financial Information
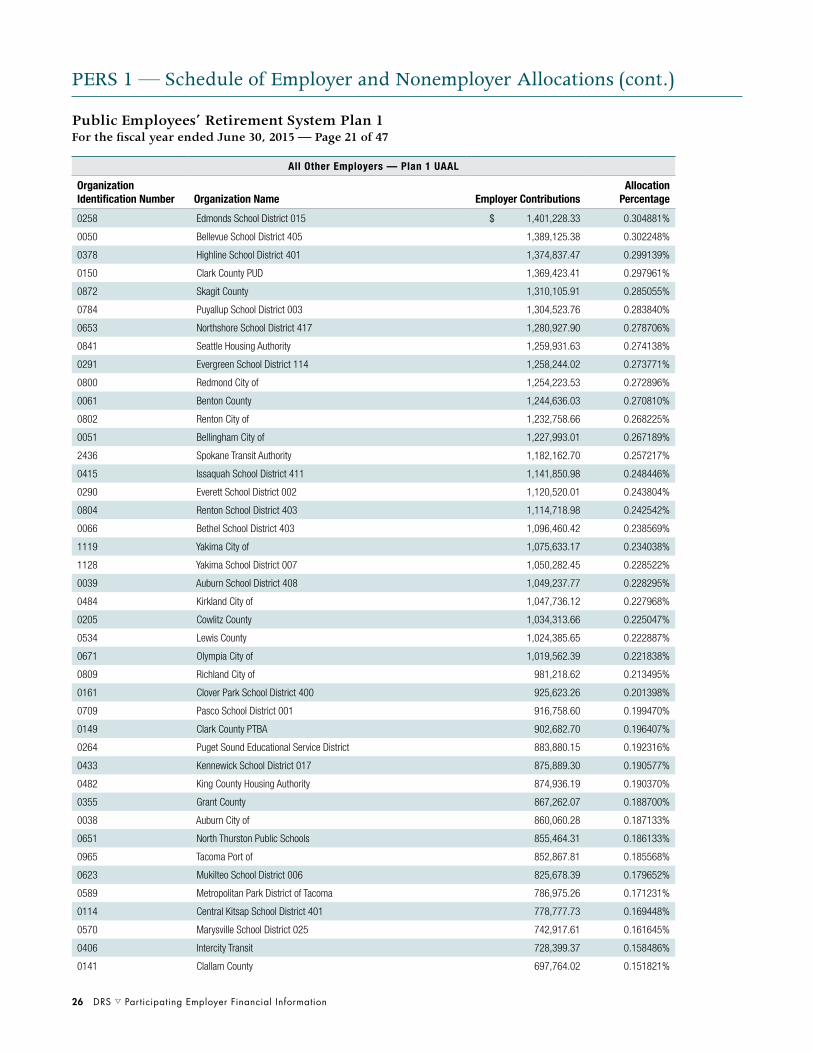
PERS 1 — Schedule of Employer and Nonemployer Allocations (cont.)
All Other Employers — Plan 1 UAAL
Organization Identification Number Organization Name Employer Contributions
Allocation Percentage
0258 Edmonds School District 015 $ 1,401,228.33 0.304881%
0050 Bellevue School District 405 1,389,125.38 0.302248%
0378 Highline School District 401 1,374,837.47 0.299139%
0150 Clark County PUD 1,369,423.41 0.297961%
0872 Skagit County 1,310,105.91 0.285055%
0784 Puyallup School District 003 1,304,523.76 0.283840%
0653 Northshore School District 417 1,280,927.90 0.278706%
0841 Seattle Housing Authority 1,259,931.63 0.274138%
0291 Evergreen School District 114 1,258,244.02 0.273771%
0800 Redmond City of 1,254,223.53 0.272896%
0061 Benton County 1,244,636.03 0.270810%
0802 Renton City of 1,232,758.66 0.268225%
0051 Bellingham City of 1,227,993.01 0.267189%
2436 Spokane Transit Authority 1,182,162.70 0.257217%
0415 Issaquah School District 411 1,141,850.98 0.248446%
0290 Everett School District 002 1,120,520.01 0.243804%
0804 Renton School District 403 1,114,718.98 0.242542%
0066 Bethel School District 403 1,096,460.42 0.238569%
1119 Yakima City of 1,075,633.17 0.234038%
1128 Yakima School District 007 1,050,282.45 0.228522%
0039 Auburn School District 408 1,049,237.77 0.228295%
0484 Kirkland City of 1,047,736.12 0.227968%
0205 Cowlitz County 1,034,313.66 0.225047%
0534 Lewis County 1,024,385.65 0.222887%
0671 Olympia City of 1,019,562.39 0.221838%
0809 Richland City of 981,218.62 0.213495%
0161 Clover Park School District 400 925,623.26 0.201398%
0709 Pasco School District 001 916,758.60 0.199470%
0149 Clark County PTBA 902,682.70 0.196407%
0264 Puget Sound Educational Service District 883,880.15 0.192316%
0433 Kennewick School District 017 875,889.30 0.190577%
0482 King County Housing Authority 874,936.19 0.190370%
0355 Grant County 867,262.07 0.188700%
0038 Auburn City of 860,060.28 0.187133%
0651 North Thurston Public Schools 855,464.31 0.186133%
0965 Tacoma Port of 852,867.81 0.185568%
0623 Mukilteo School District 006 825,678.39 0.179652%
0589 Metropolitan Park District of Tacoma 786,975.26 0.171231%
0114 Central Kitsap School District 401 778,777.73 0.169448%
0570 Marysville School District 025 742,917.61 0.161645%
0406 Intercity Transit 728,399.37 0.158486%
0141 Clallam County 697,764.02 0.151821%
Public Employees’ Retirement System Plan 1For the fiscal year ended June 30, 2015 — Page 21 of 47
Participating Employer Financial Information s DRS 27
PERS 1 — Schedule of Employer and Nonemployer Allocations (cont.)
All Other Employers — Plan 1 UAAL
Organization Identification Number Organization Name Employer Contributions
Allocation Percentage
0413 Island County $ 689,485.91 0.150019%
0235 Douglas County PUD 01 680,505.35 0.148065%
0865 Shoreline School District 412 674,022.35 0.146655%
0115 Central Valley School District 356 663,850.94 0.144442%
0882 Sno-Isle Regional Library 662,706.21 0.144193%
0414 Issaquah City of 661,469.78 0.143924%
0054 Bellingham School District 501 656,271.13 0.142792%
0361 Grays Harbor County 651,380.80 0.141728%
0573 Mason County 650,684.22 0.141577%
0810 Richland School District 400 641,537.40 0.139587%
0261 Educational Service District 112 628,157.34 0.136675%
1001 Tukwila City of 623,841.22 0.135736%
0124 Chelan County 622,298.19 0.135401%
0558 Lynnwood City of 621,466.20 0.135220%
0783 Puyallup City of 609,470.30 0.132609%
0045 Battle Ground School District 119 607,812.03 0.132249%
0955 Sumner School District 320 600,980.17 0.130762%
0494 Kitsap Transit 588,134.17 0.127967%
0569 Marysville City of 580,712.67 0.126352%
0511 Lacey City of 578,458.29 0.125862%
0673 Olympia School District 111 576,994.34 0.125543%
0204 Cowlitz County PUD 564,872.00 0.122906%
0056 Ben Franklin Transit 562,868.84 0.122470%
0898 Snohomish School District 201 552,631.03 0.120242%
0358 Grays Harbor County PUD 01 552,296.37 0.120169%
1049 Walla Walla County 548,727.77 0.119393%
0946 Stevens County 548,647.54 0.119376%
0076 Bothell City of 545,449.65 0.118680%
0429 Kennewick City of 535,108.06 0.116430%
0910 South Kitsap School District 402 534,328.28 0.116260%
0740 Pierce County Rural Library District 519,219.40 0.112973%
2574 South Sound 911 519,037.72 0.112933%
0060 Benton County PUD 1 518,408.58 0.112796%
0580 Mead School District 354 514,538.12 0.111954%
0078 Bremerton City of 513,374.01 0.111701%
1630 Federal Way City of 509,378.48 0.110831%
1685 Whatcom Transportation Authority 509,339.92 0.110823%
0668 Okanogan County 495,583.27 0.107830%
0319 Franklin Pierce School District 402 492,059.61 0.107063%
0517 Lake Stevens School District 004 491,597.94 0.106963%
0499 Kittitas County 471,507.69 0.102591%
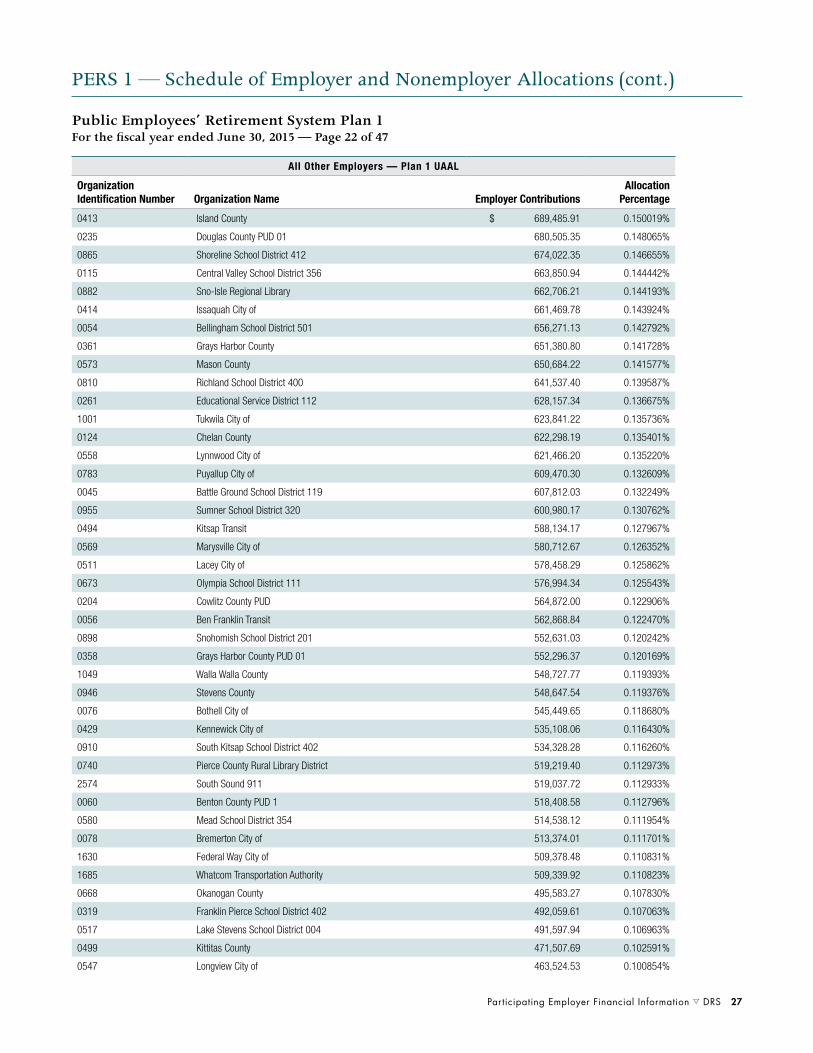
0547 Longview City of 463,524.53 0.100854%
Public Employees’ Retirement System Plan 1For the fiscal year ended June 30, 2015 — Page 22 of 47
28 DRS s Participating Employer Financial Information
PERS 1 — Schedule of Employer and Nonemployer Allocations (cont.)
All Other Employers — Plan 1 UAAL
Organization Identification Number Organization Name Employer Contributions
Allocation Percentage
0718 Peninsula School District 401 $ 462,814.04 0.100700%
1073 Wenatchee School District 246 462,667.70 0.100668%
0417 Jefferson County 460,582.48 0.100214%
0832 San Juan County 460,558.26 0.100209%
0751 Port Angeles City of 456,613.45 0.099351%
0611 Moses Lake School District 161 455,831.55 0.099180%
0618 Mount Vernon School District 320 450,628.87 0.098048%
0584 Mercer Island City of 450,391.35 0.097997%
0706 Pasco City of 448,202.66 0.097521%
0140 Clallam County PUD 01 436,700.85 0.095018%
0255 Edmonds City of 434,462.79 0.094531%
0958 Sunnyside School District 201 431,626.35 0.093914%
2566 Health Benefit Exchange 427,158.52 0.092942%
0262 Educational Service District 113 421,250.73 0.091656%
0318 Franklin County 420,347.46 0.091460%
0986 Timberland Regional Library 418,626.05 0.091085%
0550 Longview School District 122 417,825.84 0.090911%
1048 Walla Walla City of 414,248.66 0.090133%
0920 Spokane Regional Health District 413,361.20 0.089940%
0649 North Kitsap School District 400 412,195.31 0.089686%
1056 Walla Walla School District 140 407,985.12 0.088770%
0096 Camas School District 117 407,818.07 0.088734%
0504 Klickitat County 405,203.02 0.088165%
1775 Shoreline City of 401,632.98 0.087388%
0575 Mason County PUD 03 398,247.50 0.086651%
0043 Bar Association WA State* 397,295.43 0.086444%
0968 Tahoma School District 409 386,698.99 0.084139%
0897 Snohomish Health District 380,692.57 0.082832%
0716 Pend Oreille County PUD 01 379,609.32 0.082596%
2429 South Correctional Entity 378,924.72 0.082447%
0604 Monroe School District 103 377,322.83 0.082098%
0533 Lewis County PUD 01 375,342.35 0.081668%
1025 Valley Communication Center 371,955.42 0.080931%
1647 SeaTac City of 365,711.75 0.079572%
1003 Tumwater School District 033 364,757.98 0.079365%
0015 Alderwood Water District 358,683.42 0.078043%
0312 Fort Vancouver Regional Library 349,521.21 0.076049%
1134 Yelm School District 002 348,808.36 0.075894%
0656 Oak Harbor School District 201 346,592.39 0.075412%
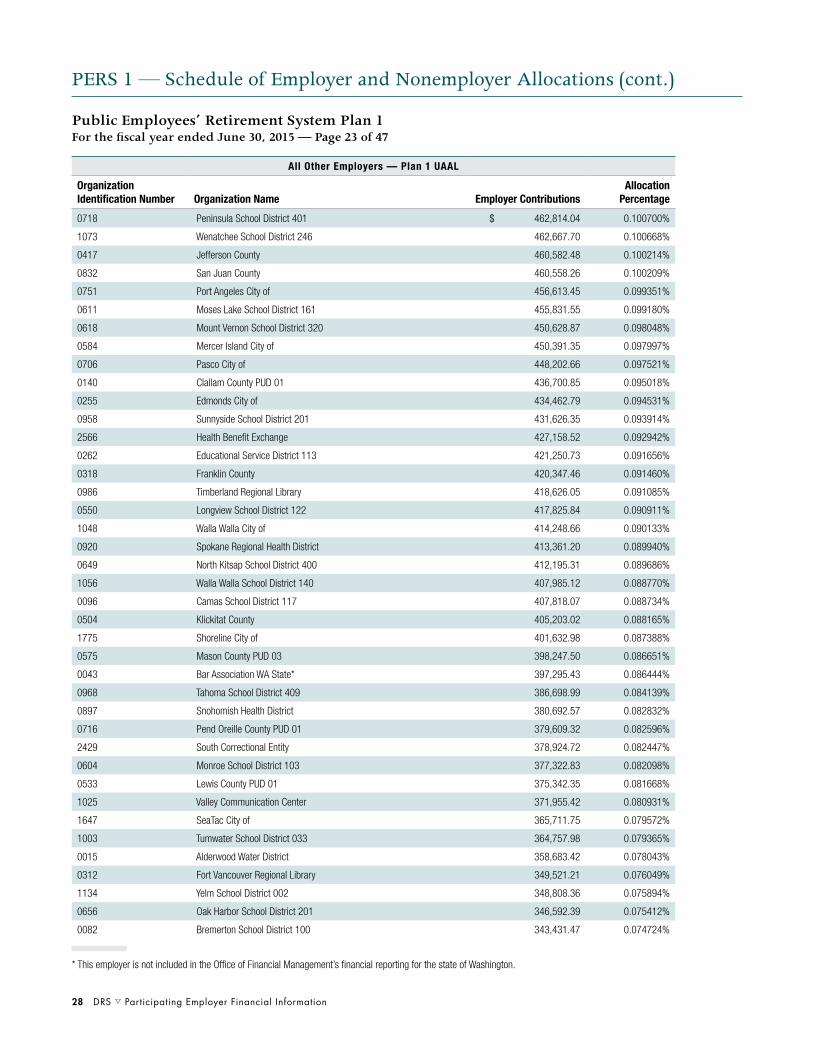
0082 Bremerton School District 100 343,431.47 0.074724%
Public Employees’ Retirement System Plan 1For the fiscal year ended June 30, 2015 — Page 23 of 47
* This employer is not included in the Office of Financial Management’s financial reporting for the state of Washington.

Participating Employer Financial Information s DRS 29
PERS 1 — Schedule of Employer and Nonemployer Allocations (cont.)
All Other Employers — Plan 1 UAAL
Organization Identification Number Organization Name Employer Contributions
Allocation Percentage
0018 Anacortes City of $ 343,330.43 0.074702%
0667 Okanogan County PUD 01 319,341.68 0.069483%
0881 Snohomish County Police Staff & Auxiliary 319,129.31 0.069437%
1002 Tumwater City of 318,756.81 0.069356%
1096 Whitman County 317,666.03 0.069118%
0316 Franklin County PUD 01 317,403.37 0.069061%
0249 Eastmont School District 206 317,264.99 0.069031%
0118 Centralia City of 317,061.15 0.068987%
0026 Arlington School District 016 315,619.91 0.068673%
0617 Mount Vernon City of 308,949.76 0.067222%
0848 Sedro-Woolley School District 101 305,772.60 0.066530%
0289 Everett Port of 304,997.20 0.066362%
0699 Pacific County 304,895.43 0.066340%
0237 Douglas County 304,616.43 0.066279%
0267 Northwest Regional Educational Service District 301,371.38 0.065573%
0295 Lakehaven Utility District 301,008.21 0.065494%
0269 Ellensburg City of 300,978.89 0.065487%
0902 Snoqualmie Valley School District 410 299,915.63 0.065256%
0780 Pullman City of 298,241.11 0.064892%
0297 Ferndale School District 502 297,103.98 0.064644%
1999 Sammamish City of 291,430.26 0.063410%
1071 Wenatchee City of 288,686.46 0.062813%
0931 Stanwood-Camano School District 401 288,014.20 0.062667%
0585 Mercer Island School District 400 284,313.02 0.061861%
0007 Adams County 284,297.66 0.061858%
0302 Fife City of 282,762.96 0.061524%
0280 Enumclaw School District 216 281,865.58 0.061329%
0095 Camas City of 281,488.89 0.061247%
0243 East Valley School District 361 281,299.52 0.061206%
0863 Shelton School District 309 280,067.63 0.060938%
0428 Kelso School District 458 279,801.69 0.060880%
2559 King County Public Defender Organization 279,005.15 0.060706%
0964 Tacoma Housing Authority 273,680.46 0.059548%
1597 WA School Information Processing Cooperative 271,533.33 0.059081%
0075 Bonney Lake City of 269,955.17 0.058737%
1107 Bainbridge Island City of 268,951.11 0.058519%
0229 Des Moines City of 264,885.15 0.057634%
1020 University Place School District 083 261,592.06 0.056918%
1076 West Valley School District 208 258,892.14 0.056330%
0715 Pend Oreille County 258,474.43 0.056239%
0502 Klickitat County PUD 01 258,461.24 0.056236%
0609 Moses Lake City of 257,324.29 0.055989%
Public Employees’ Retirement System Plan 1For the fiscal year ended June 30, 2015 — Page 24 of 47

30 DRS s Participating Employer Financial Information
PERS 1 — Schedule of Employer and Nonemployer Allocations (cont.)
All Other Employers — Plan 1 UAAL
Organization Identification Number Organization Name Employer Contributions
Allocation Percentage
0777 Puget Sound Clean Air Agency $ 251,882.13 0.054805%
1092 White River School District 416 250,478.96 0.054500%
0094 Burlington-Edison School District 100 248,184.86 0.054000%
0053 Bellingham Port of 247,087.11 0.053762%
0954 Sumner City of 246,681.15 0.053673%
1030 Vancouver Port of 245,918.18 0.053507%
0042 Bainbridge Island School District 303 244,300.96 0.053155%
2161 Spokane Valley City of 243,564.59 0.052995%
0909 Tukwila School District 406 240,143.03 0.052251%
0789 Quincy Columbia Basin Irrigation District 238,965.01 0.051994%
0002 Aberdeen School District 005 238,831.85 0.051965%
0080 Kitsap Public Health District 238,819.29 0.051963%
0133 Cheney School District 360 238,497.47 0.051893%
1077 West Valley School District 363 236,100.42 0.051371%
2082 LOTT Clean Water Alliance 235,362.35 0.051210%
2277 NORCOM 911 232,728.60 0.050637%
0259 Northeast WA Educational Service District 101 231,947.40 0.050467%
0876 Skamania County 231,806.77 0.050437%
0695 Othello School District 147 231,294.73 0.050325%
0829 South Columbia Basin Irrigation District 230,253.72 0.050099%
0753 Port Angeles School District 121 229,564.97 0.049949%
0351 Grant County Public Works 228,914.66 0.049808%
0779 Puget Sound Regional Council 226,770.55 0.049341%
0492 Kitsap Regional Library 226,421.19 0.049265%
0119 Centralia School District 401 224,630.29 0.048875%
0001 Aberdeen City of 223,064.59 0.048535%
0992 Toppenish School District 202 222,955.89 0.048511%
0655 Oak Harbor City of 221,504.78 0.048195%
0921 Spokane County Library District 220,318.70 0.047937%
0619 Mountlake Terrace City of 219,001.11 0.047651%
0331 Gig Harbor City of 217,266.39 0.047273%
0871 Skagit County PUD 01 212,094.40 0.046148%
1058 Wapato School District 207 212,070.12 0.046143%
0602 Monroe City of 210,549.68 0.045812%
0263 Olympic Educational Service District 209,342.62 0.045549%
1652 Chelan-Douglas PTBA 205,890.72 0.044798%
0033 Asotin County 201,757.07 0.043899%
0341 Grandview School District 200 201,076.70 0.043751%
0303 Fife School District 417 199,060.90 0.043312%
1714 Burien City of 195,199.29 0.042472%
0850 Selah School District 119 193,414.57 0.042083%
1719 Island Transit 191,951.23 0.041765%
Public Employees’ Retirement System Plan 1For the fiscal year ended June 30, 2015 — Page 25 of 47

Participating Employer Financial Information s DRS 31
PERS 1 — Schedule of Employer and Nonemployer Allocations (cont.)
All Other Employers — Plan 1 UAAL
Organization Identification Number Organization Name Employer Contributions
Allocation Percentage
0065 Benton-Franklin Health District $ 191,231.60 0.041608%
0390 Housing Finance Commission WA* 190,655.34 0.041483%
2275 SW WA Council Government on Aging & Disabilities 189,390.95 0.041208%
0241 East Columbia Basin Irrigation District 188,598.68 0.041036%
0790 Quincy School District 144 188,099.33 0.040927%
0900 Snoqualmie City of 187,567.64 0.040811%
0698 Pacific County PUD 02 184,849.12 0.040220%
1029 Vancouver Housing Authority 181,762.35 0.039548%
1063 Washougal School District 112-6 180,574.08 0.039290%
0913 Spokane International Airport 179,917.75 0.039147%
0279 Enumclaw City of 177,823.39 0.038691%
0025 Arlington City of 177,361.12 0.038590%
0156 Clarkston School District 250 177,192.78 0.038554%
0767 Prosser School District 116 175,836.39 0.038259%
0755 Port Townsend City of 174,744.47 0.038021%
0760 Poulsbo City of 171,826.89 0.037386%
0288 Everett Housing Authority 170,851.87 0.037174%
0079 Bremerton Housing Authority 170,426.26 0.037082%
0300 Ferry County 170,032.05 0.036996%
0362 Grays Harbor Port of 169,471.26 0.036874%
0122 Chehalis School District 302 167,866.27 0.036525%
0816 Riverview School District 407 166,780.39 0.036288%
0266 North Central WA Educational Service District 165,457.08 0.036000%
0020 Anacortes School District 103 165,096.34 0.035922%
1113 Woodland School District 404 164,120.68 0.035710%
0557 Lynden School District 504 162,982.13 0.035462%
0474 Sammamish Plateau Water & Sewer District 161,136.90 0.035060%
2450 Thurston 911 Communications 160,696.07 0.034964%
0857 Sequim School District 323 159,328.83 0.034667%
0129 Chelan County Roads 158,605.29 0.034510%
0093 Burlington City of 157,879.76 0.034352%
0959 Sunnyside Valley Irrigation District 156,757.67 0.034108%
1777 University Place City of 155,855.03 0.033911%
0621 East Valley School District 090 155,815.95 0.033903%
0132 Cheney City of 154,984.02 0.033722%
1062 Washougal City of 153,758.73 0.033455%
2160 Snohomish County Housing Authority 152,357.29 0.033150%
1738 NW Regional Council 152,075.62 0.033089%
0270 Ellensburg School District 401 151,404.03 0.032943%
0521 Lakewood School District 306 151,310.90 0.032922%
Public Employees’ Retirement System Plan 1For the fiscal year ended June 30, 2015 — Page 26 of 47
* This employer is not included in the Office of Financial Management’s financial reporting for the state of Washington.
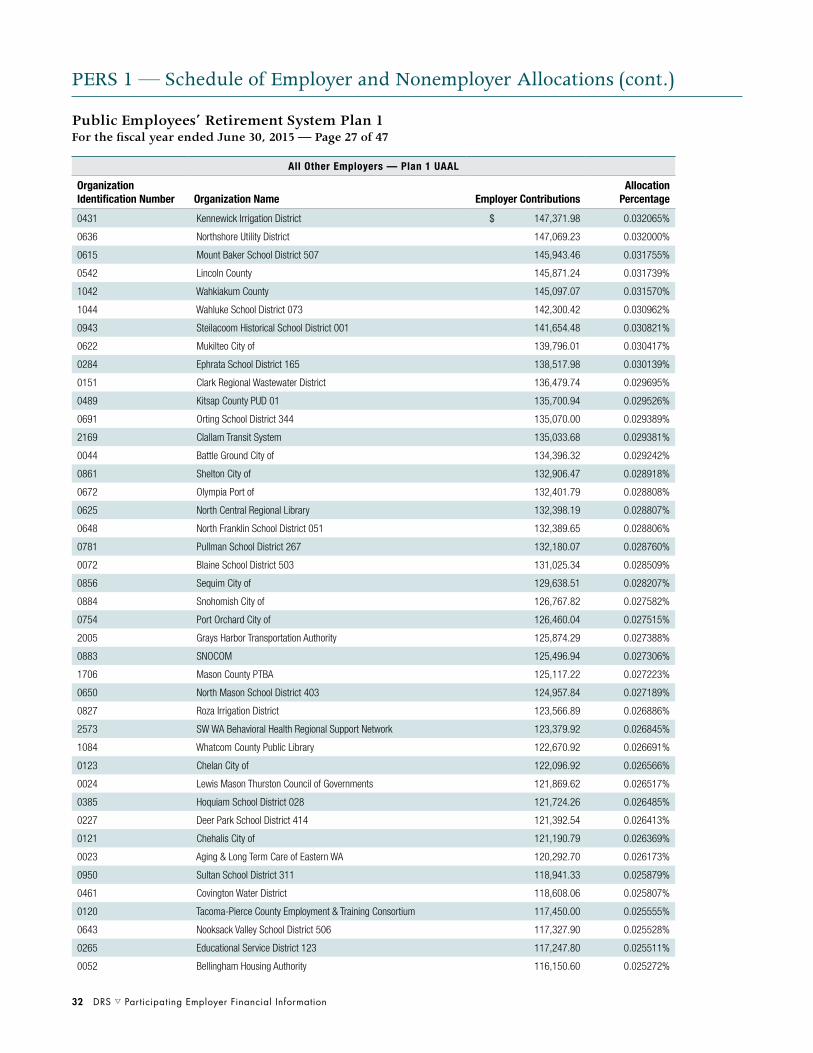
32 DRS s Participating Employer Financial Information
PERS 1 — Schedule of Employer and Nonemployer Allocations (cont.)
All Other Employers — Plan 1 UAAL
Organization Identification Number Organization Name Employer Contributions
Allocation Percentage
0431 Kennewick Irrigation District $ 147,371.98 0.032065%
0636 Northshore Utility District 147,069.23 0.032000%
0615 Mount Baker School District 507 145,943.46 0.031755%
0542 Lincoln County 145,871.24 0.031739%
1042 Wahkiakum County 145,097.07 0.031570%
1044 Wahluke School District 073 142,300.42 0.030962%
0943 Steilacoom Historical School District 001 141,654.48 0.030821%
0622 Mukilteo City of 139,796.01 0.030417%
0284 Ephrata School District 165 138,517.98 0.030139%
0151 Clark Regional Wastewater District 136,479.74 0.029695%
0489 Kitsap County PUD 01 135,700.94 0.029526%
0691 Orting School District 344 135,070.00 0.029389%
2169 Clallam Transit System 135,033.68 0.029381%
0044 Battle Ground City of 134,396.32 0.029242%
0861 Shelton City of 132,906.47 0.028918%
0672 Olympia Port of 132,401.79 0.028808%
0625 North Central Regional Library 132,398.19 0.028807%
0648 North Franklin School District 051 132,389.65 0.028806%
0781 Pullman School District 267 132,180.07 0.028760%
0072 Blaine School District 503 131,025.34 0.028509%
0856 Sequim City of 129,638.51 0.028207%
0884 Snohomish City of 126,767.82 0.027582%
0754 Port Orchard City of 126,460.04 0.027515%
2005 Grays Harbor Transportation Authority 125,874.29 0.027388%
0883 SNOCOM 125,496.94 0.027306%
1706 Mason County PTBA 125,117.22 0.027223%
0650 North Mason School District 403 124,957.84 0.027189%
0827 Roza Irrigation District 123,566.89 0.026886%
2573 SW WA Behavioral Health Regional Support Network 123,379.92 0.026845%
1084 Whatcom County Public Library 122,670.92 0.026691%
0123 Chelan City of 122,096.92 0.026566%
0024 Lewis Mason Thurston Council of Governments 121,869.62 0.026517%
0385 Hoquiam School District 028 121,724.26 0.026485%
0227 Deer Park School District 414 121,392.54 0.026413%
0121 Chehalis City of 121,190.79 0.026369%
0023 Aging & Long Term Care of Eastern WA 120,292.70 0.026173%
0950 Sultan School District 311 118,941.33 0.025879%
0461 Covington Water District 118,608.06 0.025807%
0120 Tacoma-Pierce County Employment & Training Consortium 117,450.00 0.025555%
0643 Nooksack Valley School District 506 117,327.90 0.025528%
0265 Educational Service District 123 117,247.80 0.025511%
0052 Bellingham Housing Authority 116,150.60 0.025272%
Public Employees’ Retirement System Plan 1For the fiscal year ended June 30, 2015 — Page 27 of 47
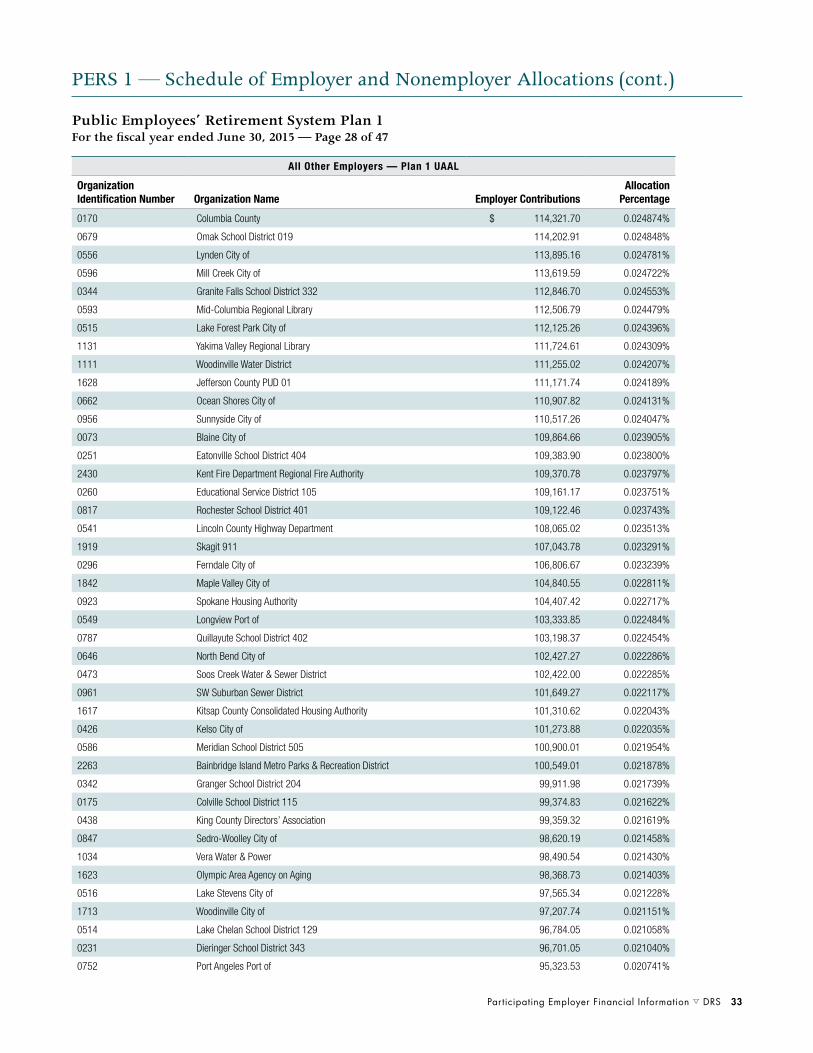
Participating Employer Financial Information s DRS 33
PERS 1 — Schedule of Employer and Nonemployer Allocations (cont.)
All Other Employers — Plan 1 UAAL
Organization Identification Number Organization Name Employer Contributions
Allocation Percentage
0170 Columbia County $ 114,321.70 0.024874%
0679 Omak School District 019 114,202.91 0.024848%
0556 Lynden City of 113,895.16 0.024781%
0596 Mill Creek City of 113,619.59 0.024722%
0344 Granite Falls School District 332 112,846.70 0.024553%
0593 Mid-Columbia Regional Library 112,506.79 0.024479%
0515 Lake Forest Park City of 112,125.26 0.024396%
1131 Yakima Valley Regional Library 111,724.61 0.024309%
1111 Woodinville Water District 111,255.02 0.024207%
1628 Jefferson County PUD 01 111,171.74 0.024189%
0662 Ocean Shores City of 110,907.82 0.024131%
0956 Sunnyside City of 110,517.26 0.024047%
0073 Blaine City of 109,864.66 0.023905%
0251 Eatonville School District 404 109,383.90 0.023800%
2430 Kent Fire Department Regional Fire Authority 109,370.78 0.023797%
0260 Educational Service District 105 109,161.17 0.023751%
0817 Rochester School District 401 109,122.46 0.023743%
0541 Lincoln County Highway Department 108,065.02 0.023513%
1919 Skagit 911 107,043.78 0.023291%
0296 Ferndale City of 106,806.67 0.023239%
1842 Maple Valley City of 104,840.55 0.022811%
0923 Spokane Housing Authority 104,407.42 0.022717%
0549 Longview Port of 103,333.85 0.022484%
0787 Quillayute School District 402 103,198.37 0.022454%
0646 North Bend City of 102,427.27 0.022286%
0473 Soos Creek Water & Sewer District 102,422.00 0.022285%
0961 SW Suburban Sewer District 101,649.27 0.022117%
1617 Kitsap County Consolidated Housing Authority 101,310.62 0.022043%
0426 Kelso City of 101,273.88 0.022035%
0586 Meridian School District 505 100,900.01 0.021954%
2263 Bainbridge Island Metro Parks & Recreation District 100,549.01 0.021878%
0342 Granger School District 204 99,911.98 0.021739%
0175 Colville School District 115 99,374.83 0.021622%
0438 King County Directors’ Association 99,359.32 0.021619%
0847 Sedro-Woolley City of 98,620.19 0.021458%
1034 Vera Water & Power 98,490.54 0.021430%
1623 Olympic Area Agency on Aging 98,368.73 0.021403%
0516 Lake Stevens City of 97,565.34 0.021228%
1713 Woodinville City of 97,207.74 0.021151%
0514 Lake Chelan School District 129 96,784.05 0.021058%
0231 Dieringer School District 343 96,701.05 0.021040%
0752 Port Angeles Port of 95,323.53 0.020741%
Public Employees’ Retirement System Plan 1For the fiscal year ended June 30, 2015 — Page 28 of 47

34 DRS s Participating Employer Financial Information
PERS 1 — Schedule of Employer and Nonemployer Allocations (cont.)
All Other Employers — Plan 1 UAAL
Organization Identification Number Organization Name Employer Contributions
Allocation Percentage
0381 Hockinson School District 098 $ 95,026.63 0.020676%
0903 South Whidbey School District 206 94,945.44 0.020658%
1032 Vashon Island School District 402 94,343.37 0.020527%
0875 Skamania County PUD 01 94,081.27 0.020470%
0582 Medical Lake School District 326 93,674.31 0.020382%
0384 Hoquiam City of 93,647.06 0.020376%
0803 Renton Housing Authority 92,669.06 0.020163%
0483 Kiona-Benton City School District 052 92,245.97 0.020071%
0732 Pierce County FPD 03 91,738.44 0.019961%
0825 Royal School District 160 91,729.20 0.019959%
0478 Highline Water District 90,020.83 0.019587%
0708 Pasco Port of 89,680.15 0.019513%
1075 West Richland City of 88,773.59 0.019315%
1891 Kenmore City of 87,556.67 0.019051%
0522 Lakewood Water District 87,250.27 0.018984%
1135 Yelm City of 84,833.57 0.018458%
0272 Elma School District 068 84,645.90 0.018417%
0654 NW Clean Air Agency 84,572.35 0.018401%
2191 RiverCom 84,282.51 0.018338%
0108 Castle Rock School District 401 84,076.51 0.018293%
1026 Valley School District 070 83,945.49 0.018265%
1027 Valley Transit 83,327.13 0.018130%
0735 Pierce County FPD 06 82,944.98 0.018047%
0418 Jefferson Transit Authority 82,075.14 0.017858%
1598 Grand Coulee Project Hydroelectric Authority 81,062.73 0.017638%
0778 WA Cities Insurance Authority 80,326.92 0.017478%
0321 Friday Harbor Town of 80,161.68 0.017442%
0240 Duvall City of 80,148.55 0.017439%
1702 Spokane Public Facility District 80,113.31 0.017431%
0815 Riverside School District 416 79,912.16 0.017387%
0103 Cascade School District 228 79,890.24 0.017383%
0106 Cashmere School District 222 79,677.66 0.017336%
1624 Columbia River Council of Governments 78,167.03 0.017008%
0327 Garfield County 78,164.47 0.017007%
2595 SW WA Aging & Long Term Care 76,179.16 0.016575%
0867 Silver Lake Water District 76,044.22 0.016546%
0137 Chimacum School District 049 75,731.46 0.016478%
0019 Anacortes Port of 75,558.91 0.016440%
0614 Mount Adams School District 209 75,400.35 0.016406%
0574 Mason County PUD 01 74,545.69 0.016220%
0944 Steilacoom Town of 74,502.77 0.016210%
0670 Okanogan School District 105 74,444.86 0.016198%
Public Employees’ Retirement System Plan 1For the fiscal year ended June 30, 2015 — Page 29 of 47

Participating Employer Financial Information s DRS 35
PERS 1 — Schedule of Employer and Nonemployer Allocations (cont.)
All Other Employers — Plan 1 UAAL
Organization Identification Number Organization Name Employer Contributions
Allocation Percentage
0640 Nine Mile Falls School District 325 $ 73,896.61 0.016079%
0738 Pierce County Housing Authority 73,670.75 0.016029%
0991 Toppenish City of 73,120.04 0.015910%
0757 Port Townsend School District 050 72,736.08 0.015826%
0317 Franklin County Public Works 72,241.14 0.015718%
2267 West Sound Utility District 71,383.42 0.015532%
2173 Lake Stevens Sewer District 71,363.18 0.015527%
2537 Pacific Mountain Workforce Development Council 71,313.64 0.015517%
0230 Midway Sewer District 70,448.74 0.015328%
0626 North Olympic Library System 69,892.99 0.015207%
0849 Selah City of 69,776.10 0.015182%
0598 Milton City of 69,517.15 0.015126%
0624 Mukilteo Water & Wastewater District 69,267.29 0.015071%
0282 Ephrata City of 68,957.20 0.015004%
1093 White Salmon School District 405 67,922.86 0.014779%
0339 Grand Coulee Dam School District 301 67,754.23 0.014742%
0870 Skagit County Port of 67,498.36 0.014686%
0376 Highland School District 203 66,702.25 0.014513%
0014 Airway Heights City of 66,278.88 0.014421%
0811 Ridgefield City of 66,049.46 0.014371%
0930 Stanwood City of 65,880.76 0.014334%
0340 Grandview City of 65,789.03 0.014314%
1644 North Sound Regional Support Network 65,659.96 0.014286%
0630 Naches Valley School District 003 65,588.26 0.014271%
0130 Chelan-Douglas Health District 65,497.57 0.014251%
0174 Colville City of 65,176.58 0.014181%
0756 Port Townsend Port of 65,146.93 0.014175%
1137 Zillah School District 205 64,134.13 0.013954%
0299 Ferry County PUD 01 64,071.72 0.013941%
0692 Othello City of 63,980.21 0.013921%
0661 Ocean Beach School District 101 63,564.52 0.013830%
0606 Montesano School District 066 63,322.19 0.013778%
0322 Fruit Commission WA State* 62,880.34 0.013682%
0349 Grant County Housing Authority 62,751.19 0.013653%
0765 Prosser City of 62,538.25 0.013607%
0548 Longview Housing Authority 62,397.95 0.013577%
0949 Stevenson-Carson School District 303 62,256.72 0.013546%
0092 Buckley City of 61,989.44 0.013488%
0639 Newport School District 056-415 61,873.90 0.013463%
0239 Dupont City of 61,873.83 0.013463%
Public Employees’ Retirement System Plan 1For the fiscal year ended June 30, 2015 — Page 30 of 47
* This employer is not included in the Office of Financial Management’s financial reporting for the state of Washington.
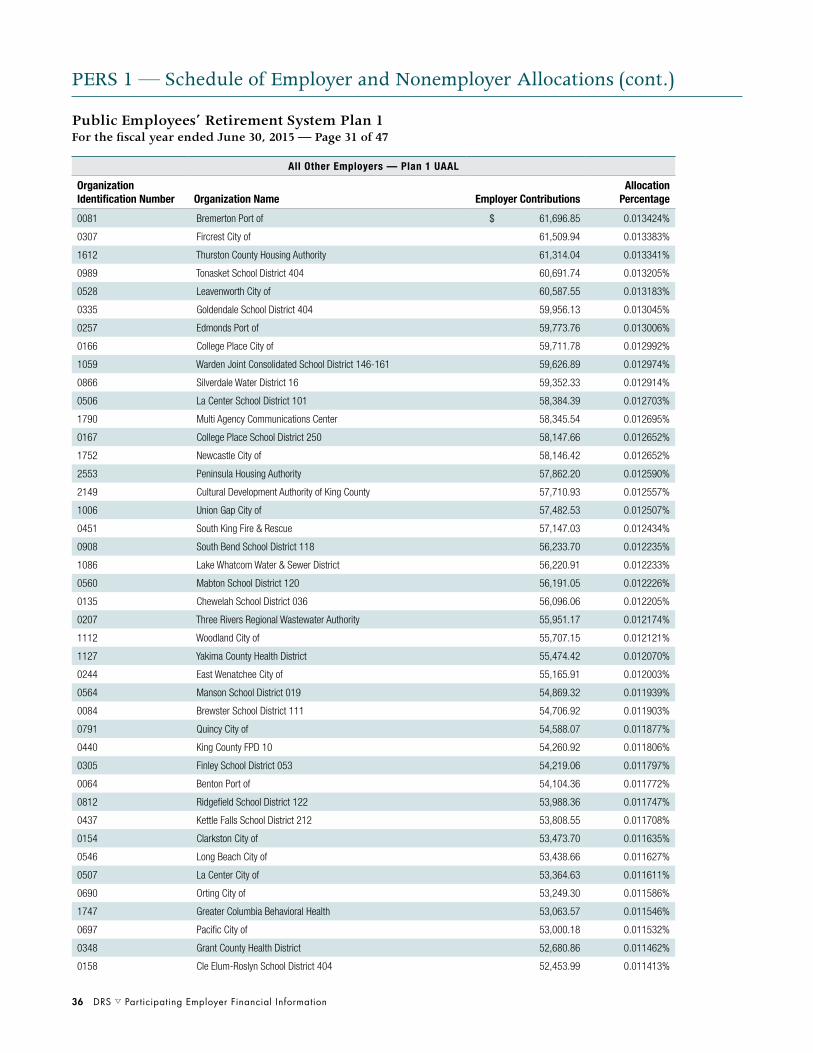
36 DRS s Participating Employer Financial Information
PERS 1 — Schedule of Employer and Nonemployer Allocations (cont.)
All Other Employers — Plan 1 UAAL
Organization Identification Number Organization Name Employer Contributions
Allocation Percentage
0081 Bremerton Port of $ 61,696.85 0.013424%
0307 Fircrest City of 61,509.94 0.013383%
1612 Thurston County Housing Authority 61,314.04 0.013341%
0989 Tonasket School District 404 60,691.74 0.013205%
0528 Leavenworth City of 60,587.55 0.013183%
0335 Goldendale School District 404 59,956.13 0.013045%
0257 Edmonds Port of 59,773.76 0.013006%
0166 College Place City of 59,711.78 0.012992%
1059 Warden Joint Consolidated School District 146-161 59,626.89 0.012974%
0866 Silverdale Water District 16 59,352.33 0.012914%
0506 La Center School District 101 58,384.39 0.012703%
1790 Multi Agency Communications Center 58,345.54 0.012695%
0167 College Place School District 250 58,147.66 0.012652%
1752 Newcastle City of 58,146.42 0.012652%
2553 Peninsula Housing Authority 57,862.20 0.012590%
2149 Cultural Development Authority of King County 57,710.93 0.012557%
1006 Union Gap City of 57,482.53 0.012507%
0451 South King Fire & Rescue 57,147.03 0.012434%
0908 South Bend School District 118 56,233.70 0.012235%
1086 Lake Whatcom Water & Sewer District 56,220.91 0.012233%
0560 Mabton School District 120 56,191.05 0.012226%
0135 Chewelah School District 036 56,096.06 0.012205%
0207 Three Rivers Regional Wastewater Authority 55,951.17 0.012174%
1112 Woodland City of 55,707.15 0.012121%
1127 Yakima County Health District 55,474.42 0.012070%
0244 East Wenatchee City of 55,165.91 0.012003%
0564 Manson School District 019 54,869.32 0.011939%
0084 Brewster School District 111 54,706.92 0.011903%
0791 Quincy City of 54,588.07 0.011877%
0440 King County FPD 10 54,260.92 0.011806%
0305 Finley School District 053 54,219.06 0.011797%
0064 Benton Port of 54,104.36 0.011772%
0812 Ridgefield School District 122 53,988.36 0.011747%
0437 Kettle Falls School District 212 53,808.55 0.011708%
0154 Clarkston City of 53,473.70 0.011635%
0546 Long Beach City of 53,438.66 0.011627%
0507 La Center City of 53,364.63 0.011611%
0690 Orting City of 53,249.30 0.011586%
1747 Greater Columbia Behavioral Health 53,063.57 0.011546%
0697 Pacific City of 53,000.18 0.011532%
0348 Grant County Health District 52,680.86 0.011462%
0158 Cle Elum-Roslyn School District 404 52,453.99 0.011413%
Public Employees’ Retirement System Plan 1For the fiscal year ended June 30, 2015 — Page 31 of 47

Participating Employer Financial Information s DRS 37
PERS 1 — Schedule of Employer and Nonemployer Allocations (cont.)
All Other Employers — Plan 1 UAAL
Organization Identification Number Organization Name Employer Contributions
Allocation Percentage
0463 Cedar River Water & Sewer District $ 52,383.03 0.011398%
0098 Cape Flattery School District 401 52,219.23 0.011362%
1057 Wapato City of 52,078.39 0.011331%
0485 Central Kitsap Fire & Rescue 51,731.00 0.011256%
0678 Omak City of 51,538.99 0.011214%
2116 Liberty Lake City of 51,380.10 0.011179%
1054 Walla Walla City Housing Authority 51,200.30 0.011140%
1966 Enduris WA 51,122.55 0.011123%
0833 San Juan Island School District 149 51,066.28 0.011111%
0320 Freeman School District 358 50,754.56 0.011043%
0199 Coupeville School District 204 50,569.34 0.011003%
0793 Rainier School District 307 50,349.83 0.010955%
0682 Orcas Island School District 137 50,268.04 0.010937%
1632 King Conservation District 49,877.53 0.010852%
0127 Chelan County Port of 49,459.12 0.010761%
0972 Tenino School District 402 49,107.88 0.010685%
1069 Wellpinit School District 049 49,093.20 0.010682%
0796 Raymond City of 48,720.61 0.010601%
1742 Island County Emergency Services Communication 48,719.77 0.010601%
0498 Kittitas County PUD 01 48,562.34 0.010566%
0797 Raymond School District 116 48,485.41 0.010550%
0462 Coal Creek Utility District 48,346.19 0.010519%
0071 Black Diamond City of 47,953.85 0.010434%
0368 Griffin School District 324 47,762.86 0.010392%
0508 La Conner School District 311 47,714.18 0.010382%
1608 Thurston Regional Planning Council 47,570.73 0.010351%
0747 Pioneer School District 402 47,551.39 0.010346%
0605 Montesano City of 47,029.10 0.010233%
0916 Spokane Valley Fire Department 46,916.10 0.010208%
1080 Westport City of 46,144.14 0.010040%
1694 Snohomish Conservation District 45,919.28 0.009991%
0674 Olympic Region Clean Air Agency 45,847.38 0.009976%
0915 Spokane Regional Clean Air Agency 45,603.22 0.009922%
1024 Valley View Sewer District 45,378.65 0.009874%
0245 East Wenatchee Water District 45,329.88 0.009863%
0663 Ocosta School District 172 45,238.07 0.009843%
0173 Columbia School District 400 45,139.74 0.009822%
0680 Onalaska School District 300 44,801.73 0.009748%
0588 Methow Valley School District 350 44,504.10 0.009683%
0951 Sultan City of 44,350.43 0.009650%
1695 KITTCOM 43,915.61 0.009555%
0645 North Beach School District 064 43,880.14 0.009548%
Public Employees’ Retirement System Plan 1For the fiscal year ended June 30, 2015 — Page 32 of 47

38 DRS s Participating Employer Financial Information
PERS 1 — Schedule of Employer and Nonemployer Allocations (cont.)
All Other Employers — Plan 1 UAAL
Organization Identification Number Organization Name Employer Contributions
Allocation Percentage
0583 Medina City of $ 43,876.92 0.009547%
0423 Kalama Port of 43,835.86 0.009538%
2004 Grays Harbor Communications 43,608.00 0.009488%
0479 North City Water District 43,493.12 0.009463%
0181 Concrete School District 011 42,550.28 0.009258%
1754 San Juan Island Emergency Medical Services 42,482.60 0.009243%
2281 Grant Transit Authority 42,319.03 0.009208%
2237 Valley Regional Fire Authority 42,172.68 0.009176%
0357 Grays Harbor County Housing Authority 41,825.14 0.009100%
0087 Bridgeport School District 075 41,530.85 0.009036%
1007 Union Gap School District 002 41,413.84 0.009011%
0610 Moses Lake Port of 41,348.88 0.008997%
0070 Birch Bay Water & Sewer District 40,976.69 0.008916%
1106 Winlock School District 232 40,919.76 0.008903%
1761 Asotin County PUD 01 40,688.86 0.008853%
0818 Ronald Wastewater District 40,596.14 0.008833%
0830 SW Clean Air Agency 40,490.95 0.008810%
1593 Spokane County FPD 04 40,315.80 0.008772%
0627 North Perry Avenue Water District 39,657.94 0.008629%
0568 Mary Walker School District 207 39,635.03 0.008624%
0994 Toutle Lake School District 130 39,542.09 0.008604%
2235 Friday Harbor Port of 39,459.61 0.008586%
0886 Snohomish County FPD 03 39,348.61 0.008562%
0798 Reardan-Edwall School District 009 38,896.25 0.008463%
0311 Forks City of 38,571.42 0.008392%
0578 McCleary City of 38,421.61 0.008360%
0535 Lewis PTBA 38,410.71 0.008357%
2556 Mason County Emergency Communications 38,239.50 0.008320%
0029 Asotin Anatone School District 420 38,190.95 0.008310%
1098 Whitworth Water District 02 38,145.59 0.008300%
0632 Napavine School District 014 37,659.60 0.008194%
0500 Kittitas Reclamation District 37,491.94 0.008158%
0223 Davenport School District 207 37,432.88 0.008145%
0452 Shoreline Fire Department 37,422.60 0.008142%
1129 Yakima-Tieton Irrigation District 37,397.10 0.008137%
0134 Chewelah City of 37,160.87 0.008086%
0644 Normandy Park City of 37,039.30 0.008059%
1091 White Pass School District 303 36,956.46 0.008041%
0219 Darrington School District 330 36,856.89 0.008019%
1958 Wine Commission* 36,831.16 0.008014%
Public Employees’ Retirement System Plan 1For the fiscal year ended June 30, 2015 — Page 33 of 47
* This employer is not included in the Office of Financial Management’s financial reporting for the state of Washington.
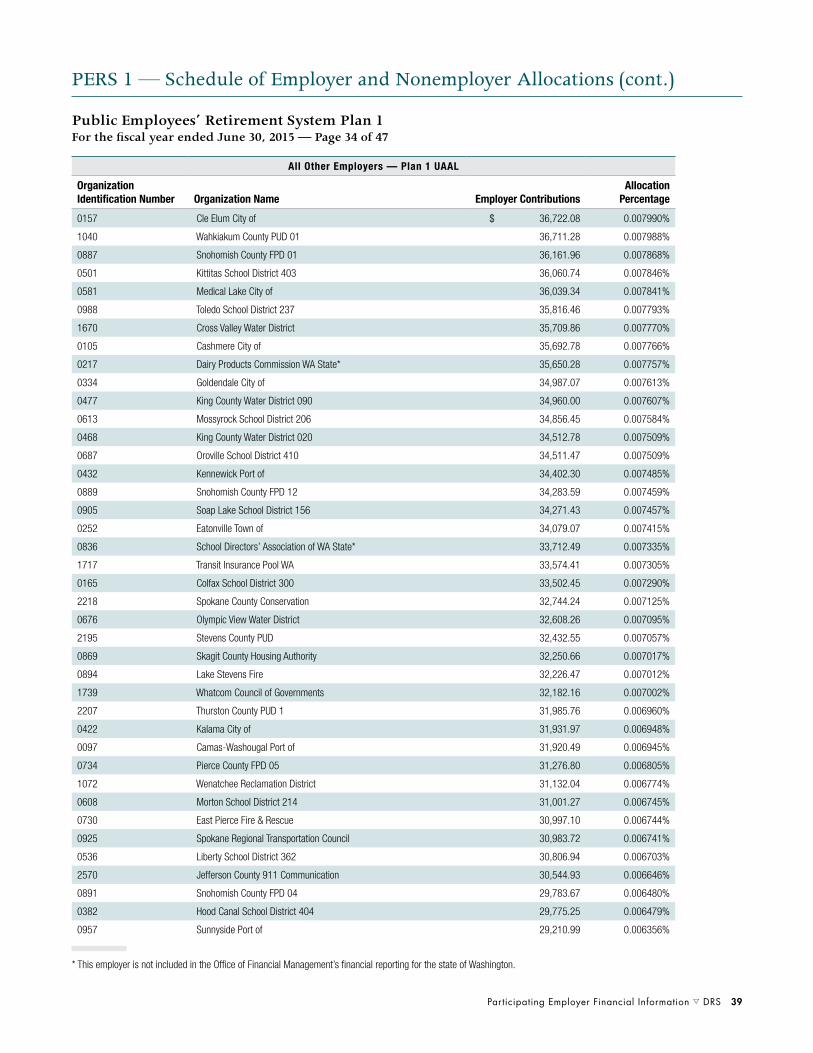
Participating Employer Financial Information s DRS 39
PERS 1 — Schedule of Employer and Nonemployer Allocations (cont.)
All Other Employers — Plan 1 UAAL
Organization Identification Number Organization Name Employer Contributions
Allocation Percentage
0157 Cle Elum City of $ 36,722.08 0.007990%
1040 Wahkiakum County PUD 01 36,711.28 0.007988%
0887 Snohomish County FPD 01 36,161.96 0.007868%
0501 Kittitas School District 403 36,060.74 0.007846%
0581 Medical Lake City of 36,039.34 0.007841%
0988 Toledo School District 237 35,816.46 0.007793%
1670 Cross Valley Water District 35,709.86 0.007770%
0105 Cashmere City of 35,692.78 0.007766%
0217 Dairy Products Commission WA State* 35,650.28 0.007757%
0334 Goldendale City of 34,987.07 0.007613%
0477 King County Water District 090 34,960.00 0.007607%
0613 Mossyrock School District 206 34,856.45 0.007584%
0468 King County Water District 020 34,512.78 0.007509%
0687 Oroville School District 410 34,511.47 0.007509%
0432 Kennewick Port of 34,402.30 0.007485%
0889 Snohomish County FPD 12 34,283.59 0.007459%
0905 Soap Lake School District 156 34,271.43 0.007457%
0252 Eatonville Town of 34,079.07 0.007415%
0836 School Directors’ Association of WA State* 33,712.49 0.007335%
1717 Transit Insurance Pool WA 33,574.41 0.007305%
0165 Colfax School District 300 33,502.45 0.007290%
2218 Spokane County Conservation 32,744.24 0.007125%
0676 Olympic View Water District 32,608.26 0.007095%
2195 Stevens County PUD 32,432.55 0.007057%
0869 Skagit County Housing Authority 32,250.66 0.007017%
0894 Lake Stevens Fire 32,226.47 0.007012%
1739 Whatcom Council of Governments 32,182.16 0.007002%
2207 Thurston County PUD 1 31,985.76 0.006960%
0422 Kalama City of 31,931.97 0.006948%
0097 Camas-Washougal Port of 31,920.49 0.006945%
0734 Pierce County FPD 05 31,276.80 0.006805%
1072 Wenatchee Reclamation District 31,132.04 0.006774%
0608 Morton School District 214 31,001.27 0.006745%
0730 East Pierce Fire & Rescue 30,997.10 0.006744%
0925 Spokane Regional Transportation Council 30,983.72 0.006741%
0536 Liberty School District 362 30,806.94 0.006703%
2570 Jefferson County 911 Communication 30,544.93 0.006646%
0891 Snohomish County FPD 04 29,783.67 0.006480%
0382 Hood Canal School District 404 29,775.25 0.006479%
0957 Sunnyside Port of 29,210.99 0.006356%
Public Employees’ Retirement System Plan 1For the fiscal year ended June 30, 2015 — Page 34 of 47
* This employer is not included in the Office of Financial Management’s financial reporting for the state of Washington.

40 DRS s Participating Employer Financial Information
PERS 1 — Schedule of Employer and Nonemployer Allocations (cont.)
All Other Employers — Plan 1 UAAL
Organization Identification Number Organization Name Employer Contributions
Allocation Percentage
0430 Kennewick Housing Authority $ 29,183.70 0.006350%
0707 Pasco & Franklin County Housing Authority 28,792.75 0.006265%
2294 Jefferson County Rural Library District 28,645.01 0.006233%
0046 Beacon Hill Water & Sewer District 28,516.61 0.006205%
1094 White Salmon City of 28,164.43 0.006128%
0967 Taholah School District 077 28,159.24 0.006127%
1715 Tree Fruit Research Commission* 28,080.56 0.006110%
0552 Lopez Island School District 144 27,856.40 0.006061%
0225 Dayton School District 002 27,814.78 0.006052%
1102 Willapa Valley School District 160 27,788.61 0.006046%
0814 Ritzville School District 160 27,742.79 0.006036%
1885 Stevens County Rural Library 27,528.80 0.005990%
0091 Skyway Water & Sewer District 27,337.62 0.005948%
2036 Snohomish County Emergency Radio System 27,332.97 0.005947%
2189 Si View Metropolitan Park District 27,293.27 0.005939%
0171 Columbia Irrigation District 27,266.45 0.005933%
1969 North County Regional Fire Authority 27,101.05 0.005897%
0786 Quilcene School District 048 27,050.35 0.005886%
0652 Northport School District 211 26,443.76 0.005754%
0182 Connell City of 26,389.65 0.005742%
0700 Pacific Transit System 26,359.66 0.005735%
0271 Elma City of 26,282.01 0.005718%
1452 NE Sammamish Sewer & Water District 26,265.20 0.005715%
0486 North Kitsap Fire & Rescue 25,961.01 0.005649%
0278 Entiat School District 127 25,889.72 0.005633%
0022 Apple Commission WA State* 25,825.88 0.005619%
2538 Spokane County Water District 03 25,749.47 0.005603%
0162 Clyde Hill City of 25,693.58 0.005590%
0513 Lake Chelan Reclamation District 25,438.07 0.005535%
0805 Republic School District 309 25,417.51 0.005530%
0424 Kalama School District 402 25,394.96 0.005525%
0666 Okanogan City of 25,167.17 0.005476%
0464 King County Water District 111 25,009.33 0.005442%
0980 Thurston County FPD 03 24,705.90 0.005376%
0948 Stevenson City of 24,699.34 0.005374%
0470 King County Water District 049 24,532.51 0.005338%
1136 Zillah City of 24,394.04 0.005308%
2602 Chelan County Wenatchee Housing Authority 24,361.42 0.005301%
0236 Douglas County Sewer District 01 24,339.05 0.005296%
0164 Colfax City of 24,283.91 0.005284%
Public Employees’ Retirement System Plan 1For the fiscal year ended June 30, 2015 — Page 35 of 47
* This employer is not included in the Office of Financial Management’s financial reporting for the state of Washington.

Participating Employer Financial Information s DRS 41
PERS 1 — Schedule of Employer and Nonemployer Allocations (cont.)
All Other Employers — Plan 1 UAAL
Organization Identification Number Organization Name Employer Contributions
Allocation Percentage
0851 Selkirk School District 070 $ 24,246.98 0.005276%
0107 Castle Rock City of 24,242.09 0.005275%
0088 Brier City of 23,922.95 0.005205%
0488 South Kitsap Fire & Rescue 23,838.83 0.005187%
2213 Peninsula Metropolitan Park District 23,751.19 0.005168%
0952 Sumas City of 23,692.97 0.005155%
0689 Oroville City of 23,587.52 0.005132%
0010 Adna School District 226 23,465.97 0.005106%
1060 Warden City of 23,424.01 0.005097%
2172 Yakima Regional Clean Air Agency 23,366.61 0.005084%
0788 Quinault Lake School District 097 23,336.83 0.005078%
2256 Columbia County Public Transportation 23,183.82 0.005044%
0465 King County Water District 125 23,182.59 0.005044%
1047 Walla Walla Regional Airport 23,060.81 0.005018%
2228 Edmonds Public Facilities District 22,987.59 0.005002%
1605 WA Counties Risk Pool 22,970.36 0.004998%
0750 Pomeroy School District 110 22,914.06 0.004986%
1043 Wahkiakum School District 200 22,895.43 0.004982%
0634 Naselle-Grays River Valley School District 22,849.79 0.004972%
0862 Shelton Port of 22,838.73 0.004969%
0660 Oakville School District 400 22,835.68 0.004969%
2260 WA Counties Insurance Fund 22,760.72 0.004952%
0543 Lind School District 158 22,496.23 0.004895%
0226 Deer Park City of 22,365.56 0.004866%
0345 Granite Falls City of 22,353.49 0.004864%
2468 Kittitas County Public Hospital District 2 21,989.30 0.004784%
0200 Coupeville Town of 21,889.46 0.004763%
0555 Lyle School District 406 21,881.05 0.004761%
0714 Pe Ell School District 301 21,874.34 0.004759%
0189 Conway School District 317 21,802.67 0.004744%
0686 Orondo School District 013 21,769.24 0.004737%
0138 Clallam County FPD 03 21,758.26 0.004734%
2241 South Central Workforce Council 21,755.59 0.004734%
2284 Cascadia Conservation District 21,634.58 0.004707%
1046 Waitsburg School District 401 21,403.74 0.004657%
0693 Othello Housing Authority 21,078.02 0.004586%
0395 Ilwaco City of 20,944.49 0.004557%
0143 Clark County Fire & Rescue 20,895.71 0.004547%
0524 Langley City of 20,858.19 0.004538%
0509 La Conner Town of 20,840.16 0.004534%
0186 Consolidated Diking Improvement District 01 20,776.65 0.004521%
0203 Cowlitz County FPD 02 20,736.69 0.004512%
Public Employees’ Retirement System Plan 1For the fiscal year ended June 30, 2015 — Page 36 of 47

42 DRS s Participating Employer Financial Information
PERS 1 — Schedule of Employer and Nonemployer Allocations (cont.)
All Other Employers — Plan 1 UAAL
Organization Identification Number Organization Name Employer Contributions
Allocation Percentage
0016 Algona City of $ 20,696.06 0.004503%
0085 Brewster City of 20,518.42 0.004464%
1676 San Juan Island County Library 20,447.61 0.004449%
0759 Potato Commission WA State* 20,437.39 0.004447%
0761 Prescott School District 402 20,384.74 0.004435%
0638 Newport City of 20,345.95 0.004427%
0215 Cusick School District 059 20,276.97 0.004412%
0919 Spokane County FPD 09 20,246.78 0.004405%
0209 Cowlitz-Wahkiakum Council of Governments 20,180.56 0.004391%
0224 Dayton City of 20,001.34 0.004352%
2547 Walla Walla Joint Community Development Agency 19,816.16 0.004312%
0058 Benton City City of 19,778.78 0.004303%
0410 North Whidbey Fire & Rescue 19,742.14 0.004296%
0907 South Bend City of 19,669.90 0.004280%
0729 Pierce County FPD 21 19,661.59 0.004278%
0458 King County Law Library 19,600.70 0.004265%
1104 Wilson Creek School District 167 19,447.73 0.004231%
0971 Tekoa School District 265 19,433.70 0.004228%
0918 Spokane County FPD 08 19,370.21 0.004215%
0343 Granger Town of 19,348.06 0.004210%
0450 Woodinville Fire & Rescue 19,124.60 0.004161%
0664 Odessa School District 105 19,100.16 0.004156%
0396 Inchelium School District 070 19,037.61 0.004142%
1052 Walla Walla County Rural Library District 19,021.63 0.004139%
1766 Ridgefield Port of 18,867.73 0.004105%
1090 Grain Commission WA* 18,858.66 0.004103%
0100 Carnation City of 18,848.39 0.004101%
1759 Valley Water District 18,659.99 0.004060%
0710 Pateros School District 122 18,634.20 0.004054%
1099 Wilbur School District 200 18,600.77 0.004047%
1800 Edgewood City of 18,573.57 0.004041%
0293 Everson City of 18,306.85 0.003983%
0637 Nespelem School District 014 18,243.51 0.003969%
0893 Snohomish County FPD 07 18,231.99 0.003967%
0210 Crescent School District 313 18,096.88 0.003938%
0577 McCleary School District 065 17,993.33 0.003915%
1467 North Country Emergency Medical Services 17,981.75 0.003912%
1718 Island County FPD 01 17,878.14 0.003890%
0567 Mary M. Knight School District 311 17,831.70 0.003880%
0193 Cosmopolis City of 17,797.12 0.003872%
Public Employees’ Retirement System Plan 1For the fiscal year ended June 30, 2015 — Page 37 of 47
* This employer is not included in the Office of Financial Management’s financial reporting for the state of Washington.

Participating Employer Financial Information s DRS 43
PERS 1 — Schedule of Employer and Nonemployer Allocations (cont.)
All Other Employers — Plan 1 UAAL
Organization Identification Number Organization Name Employer Contributions
Allocation Percentage
0820 Rosalia School District 320 $ 17,790.58 0.003871%
1067 Waterville School District 209 17,761.15 0.003864%
0628 Naches-Selah Irrigation District 17,680.49 0.003847%
1055 Walla Walla Port of 17,640.96 0.003838%
0197 Coulee Hartline School District 151 17,620.39 0.003834%
0412 Island County Housing Authority 17,323.96 0.003769%
0187 Consolidated Irrigation District 19 17,107.81 0.003722%
0505 Klickitat School District 402 17,040.16 0.003708%
0620 Moxee City of 16,968.52 0.003692%
2012 Kitsap County FPD 18 16,946.52 0.003687%
0328 Garfield School District 302 16,869.22 0.003670%
0222 Davenport City of 16,768.20 0.003648%
0982 Thurston County FPD 06 16,645.39 0.003622%
0147 Clark County FPD 05 16,480.21 0.003586%
2061 Thurston Conservation District 16,383.33 0.003565%
2579 Spokane Area Workforce Development Council 16,262.46 0.003538%
0250 Easton School District 028 16,145.31 0.003513%
0813 Ritzville City of 15,987.94 0.003479%
2564 Asotin County PTBA 15,873.77 0.003454%
0561 Manchester Water District 15,818.62 0.003442%
0454 King County FPD 43 15,612.98 0.003397%
1629 Kingston Port of 15,532.11 0.003379%
0993 Touchet School District 300 15,515.87 0.003376%
0929 Saint John School District 322 15,229.50 0.003314%
0631 Napavine City of 15,039.63 0.003272%
2155 Kittitas County Conservation District 15,037.47 0.003272%
0703 Palouse School District 301 14,994.43 0.003263%
1097 Whitman County Port of 14,947.77 0.003252%
0274 Endicott School District 308 14,757.09 0.003211%
0090 Brownsville Port of 14,685.36 0.003195%
0062 Benton County Mosquito Control District 14,469.63 0.003148%
0372 Health Care Facilities Authority* 14,393.91 0.003132%
0172 Columbia School District 206 14,337.04 0.003119%
2269 Grant County Port District 01 14,022.95 0.003051%
0364 Greater Wenatchee Irrigation District 13,998.21 0.003046%
2289 North Beach Water District 13,926.99 0.003030%
0032 Asotin County Housing Authority 13,883.60 0.003021%
1596 Orcas Island Library District 13,766.46 0.002995%
1101 Willapa Harbor Port of 13,752.22 0.002992%
0559 Mabton City of 13,724.79 0.002986%
Public Employees’ Retirement System Plan 1For the fiscal year ended June 30, 2015 — Page 38 of 47
* This employer is not included in the Office of Financial Management’s financial reporting for the state of Washington.

44 DRS s Participating Employer Financial Information
PERS 1 — Schedule of Employer and Nonemployer Allocations (cont.)
All Other Employers — Plan 1 UAAL
Organization Identification Number Organization Name Employer Contributions
Allocation Percentage
0338 Grand Coulee City of $ 13,702.91 0.002981%
1741 Sound Cities Association 13,671.40 0.002975%
0975 Thorp School District 400 13,417.51 0.002919%
0467 King County Water District 019 13,397.16 0.002915%
0394 Ilwaco Port of 13,372.01 0.002910%
0196 Coulee Dam Town of 13,325.73 0.002899%
1153 Mattawa City of 13,216.65 0.002876%
0658 Oakesdale School District 324 13,157.68 0.002863%
1082 Whatcom County FPD 21 13,086.36 0.002847%
1110 Wishram School District 094 13,048.98 0.002839%
0168 Colton School District 306 13,035.71 0.002836%
0597 Millwood Town of 12,949.62 0.002818%
0214 Curlew School District 050 12,932.43 0.002814%
0607 Morton City of 12,926.78 0.002813%
0874 Skamania County Port of 12,906.83 0.002808%
2282 Okanogan Conservation District 12,808.35 0.002787%
0973 Tenino City of 12,795.52 0.002784%
1792 Sunland Water District 12,768.54 0.002778%
0369 Harrington School District 204 12,738.99 0.002772%
0301 Fidalgo Pool & Fitness Center 12,644.39 0.002751%
0332 Glenwood School District 401 12,627.72 0.002748%
0427 Kelso Housing Authority 12,609.46 0.002744%
0497 Kittitas County Housing Authority 12,580.54 0.002737%
2572 Eastmont Metropolitan Park District 12,516.07 0.002723%
0688 Oroville-Tonasket Irrigation District 12,450.83 0.002709%
0443 King County FPD 16 12,440.18 0.002707%
0047 Beef Commission WA State* 12,409.44 0.002700%
0512 Lacrosse School District 126 12,215.81 0.002658%
1000 Trout Lake School District 400 11,940.23 0.002598%
0739 Pierce County Noxious Weed Board 11,926.13 0.002595%
1323 Skagit Council of Governments 11,879.65 0.002585%
0496 Kittitas County FPD 02 11,842.26 0.002577%
0211 Creston School District 073 11,814.94 0.002571%
0712 Paterson School District 050 11,725.40 0.002551%
1640 Thurston County FPD 12 11,600.20 0.002524%
0641 North River School District 200 11,595.45 0.002523%
2239 South Whidbey Parks & Recreation District 11,469.81 0.002496%
2295 Timberlands Regional Support Network 11,420.85 0.002485%
0393 Icicle Irrigation District 11,359.46 0.002472%
0017 Almira School District 017 11,294.84 0.002458%
Public Employees’ Retirement System Plan 1For the fiscal year ended June 30, 2015 — Page 39 of 47
* This employer is not included in the Office of Financial Management’s financial reporting for the state of Washington.

Participating Employer Financial Information s DRS 45
PERS 1 — Schedule of Employer and Nonemployer Allocations (cont.)
All Other Employers — Plan 1 UAAL
Organization Identification Number Organization Name Employer Contributions
Allocation Percentage
0086 Bridgeport City of $ 11,291.18 0.002457%
0562 Mansfield School District 207 11,290.56 0.002457%
1109 Wishkah Valley School District 117 11,254.70 0.002449%
1613 Asotin County Health District 11,212.98 0.002440%
0442 Vashon Island Fire & Rescue 11,124.24 0.002420%
1794 Woodway Town of 11,092.18 0.002413%
0824 Royal City City of 10,986.55 0.002390%
0647 North Bonneville City of 10,932.01 0.002379%
1781 Benton Clean Air Agency 10,921.82 0.002376%
1882 Public Stadium Authority WA State 10,912.96 0.002374%
0277 Entiat City of 10,854.09 0.002362%
0792 Rainier City of 10,776.86 0.002345%
0268 Electric City City of 10,767.63 0.002343%
1123 Yakima County FPD 05 10,760.87 0.002341%
0705 Pasadena Park Irrigation 17 10,704.30 0.002329%
0356 Grapeview School District 054 10,680.54 0.002324%
1108 Winthrop Town of 10,652.83 0.002318%
0148 Clark County FPD 06 10,632.77 0.002313%
2271 Key Peninsula Metro Park District 10,622.52 0.002311%
0928 Sprague School District 008 10,567.67 0.002299%
0878 Skykomish School District 404 10,544.40 0.002294%
2165 Wenatchee Valley Transport Council 10,406.10 0.002264%
1733 Centralia Port of 10,353.18 0.002253%
1577 Roslyn City of 10,340.32 0.002250%
0234 Douglas County Port of 10,303.62 0.002242%
0711 Pateros City of 10,288.93 0.002239%
0629 Naches Town of 10,247.96 0.002230%
0099 Carbonado Historical School District 019 10,238.58 0.002228%
0728 Pierce County FPD 16 10,221.21 0.002224%
1737 Emergency Services Coordinating Agency 10,219.73 0.002224%
0411 South Whidbey Fire/EMS 10,196.89 0.002219%
0109 Cathlamet Town of 10,166.35 0.002212%
0990 Tonasket City of 10,160.42 0.002211%
2226 Moses Lake Irrigation & Rehab District 10,159.70 0.002211%
1005 Twisp Town of 10,140.77 0.002206%
0904 Soap Lake City of 10,131.05 0.002204%
0069 Bingen City of 10,119.66 0.002202%
0350 Grant County Noxious Weed Board 10,090.02 0.002195%
0315 Franklin County Irrigation District 01 10,088.08 0.002195%
1064 Washtucna School District 109 10,048.57 0.002186%
0444 King County FPD 02 9,886.83 0.002151%
0911 Southside School District 042 9,798.91 0.002132%
Public Employees’ Retirement System Plan 1For the fiscal year ended June 30, 2015 — Page 40 of 47

46 DRS s Participating Employer Financial Information
PERS 1 — Schedule of Employer and Nonemployer Allocations (cont.)
All Other Employers — Plan 1 UAAL
Organization Identification Number Organization Name Employer Contributions
Allocation Percentage
1105 Winlock City of $ 9,677.57 0.002106%
1095 Whitman County Rural Library 9,662.16 0.002102%
2051 Eastsound Sewer & Water District 9,568.82 0.002082%
0455 King County FPD 44 9,467.86 0.002060%
1045 Waitsburg City of 9,345.58 0.002033%
0999 Trentwood Irrigation District 9,240.51 0.002011%
0067 Bickleton School District 203 9,139.87 0.001989%
1563 King County FPD 45 9,138.94 0.001988%
0155 Clarkston Port of 9,081.10 0.001976%
2220 Franklin County Mosquito Control District 9,080.11 0.001976%
1466 Anacortes Housing Authority 9,060.57 0.001971%
1087 Samish Water District 8,990.44 0.001956%
1602 Central Whidbey Island Fire & Rescue 8,928.00 0.001943%
1828 Franklin County Emergency Management 8,885.22 0.001933%
0665 Odessa Town of 8,780.14 0.001910%
1068 Waterville Town of 8,747.02 0.001903%
2136 Lynnwood Public Facilities District 8,697.04 0.001892%
0030 Asotin City of 8,672.39 0.001887%
1686 Tricounty Economic Development District 8,569.09 0.001864%
0551 Loon Lake School District 183 8,527.65 0.001855%
0445 King County FPD 20 8,450.33 0.001839%
1614 Lopez Island Library District 8,386.76 0.001825%
0685 Orient School District 065 8,274.04 0.001800%
0366 Green Mountain School District 103 8,265.56 0.001798%
0669 Okanogan Irrigation District 8,238.74 0.001793%
0409 Irvin Water District 06 8,238.37 0.001793%
0113 Centerville School District 215 8,232.53 0.001791%
0194 Cosmopolis School District 099 8,203.35 0.001785%
1721 East County Fire & Rescue 8,171.08 0.001778%
1757 Klickitat Port of 8,120.97 0.001767%
0806 Republic City of 8,057.71 0.001753%
1709 Pend Oreille Library 7,987.35 0.001738%
1567 Pacific County FPD 01 7,943.61 0.001728%
2038 San Juan Island Park & Recreation District 7,925.96 0.001725%
0683 Orchard Avenue Irrigation District 7,924.09 0.001724%
0074 Boistfort School District 234 7,916.83 0.001723%
1810 Snohomish County FPD 22 7,896.26 0.001718%
0987 Toledo City of 7,827.32 0.001703%
1592 Water & Sewer Insurance Pool 7,810.58 0.001699%
2003 Grays Harbor Council of Governments 7,767.73 0.001690%
0471 King County Water District 054 7,744.39 0.001685%
1688 Rock Island City of 7,691.67 0.001674%
Public Employees’ Retirement System Plan 1For the fiscal year ended June 30, 2015 — Page 41 of 47

Participating Employer Financial Information s DRS 47
PERS 1 — Schedule of Employer and Nonemployer Allocations (cont.)
All Other Employers — Plan 1 UAAL
Organization Identification Number Organization Name Employer Contributions
Allocation Percentage
1703 Fall City Water District $ 7,684.41 0.001672%
0785 Queets-Clearwater School District 020 7,678.96 0.001671%
0495 Kittitas City of 7,617.64 0.001657%
2597 Chehalis Port of 7,585.13 0.001650%
0425 Keller School District 003 7,562.48 0.001645%
0421 Kahlotus School District 056 7,524.13 0.001637%
0642 Nooksack City of 7,515.26 0.001635%
0901 Snoqualmie Pass Utility District 7,508.41 0.001634%
1743 East Spokane Water District 01 7,489.83 0.001630%
0953 Summit Valley School District 202 7,462.44 0.001624%
2599 Lower Columbia Fish Recovery Board 7,447.20 0.001620%
0877 Skamania School District 002 7,338.55 0.001597%
0995 Concrete Town of 7,231.60 0.001573%
0333 Gold Bar City of 7,219.78 0.001571%
0681 Onion Creek School District 030 7,199.79 0.001567%
1639 Clallam Conservation District 7,145.34 0.001555%
1841 Cowlitz Conservation District 6,991.30 0.001521%
0947 Stevens Pass Sewer District 6,951.25 0.001512%
0220 Darrington Town of 6,826.41 0.001485%
1133 Yarrow Point Town of 6,785.31 0.001476%
1822 Chelan County FPD 07 6,756.62 0.001470%
1767 Spokane County Noxious Weed Control Board 6,727.43 0.001464%
1693 King County Water District 119 6,678.29 0.001453%
0283 Grant County Port District 09 6,661.08 0.001449%
0383 Hop Commission WA State* 6,659.41 0.001449%
0102 Cascade Irrigation District 6,651.62 0.001447%
1932 Selah-Moxee Irrigation District 6,634.21 0.001443%
1459 Terrace Heights Sewer District 6,619.88 0.001440%
2119 Pacific Conservation District 6,447.08 0.001403%
0985 Tieton City of 6,430.09 0.001399%
0879 Skykomish Town of 6,401.32 0.001393%
0232 Dixie School District 101 6,310.06 0.001373%
1744 Pierce County Law Library 5,989.57 0.001303%
2266 Manson Parks & Recreation District 5,971.44 0.001299%
0089 Brinnon School District 046 5,898.90 0.001283%
1621 Pierce County FPD 17 5,859.45 0.001275%
1708 Columbia Mosquito Control District 5,829.16 0.001268%
1606 Carbonado Town of 5,780.56 0.001258%
0160 Clinton Water District 5,727.42 0.001246%
2594 Asotin County Public Facilities District 5,715.54 0.001244%
Public Employees’ Retirement System Plan 1For the fiscal year ended June 30, 2015 — Page 42 of 47
* This employer is not included in the Office of Financial Management’s financial reporting for the state of Washington.

48 DRS s Participating Employer Financial Information
PERS 1 — Schedule of Employer and Nonemployer Allocations (cont.)
All Other Employers — Plan 1 UAAL
Organization Identification Number Organization Name Employer Contributions
Allocation Percentage
2587 Okanogan County Housing Authority $ 5,682.38 0.001236%
2137 Belfair Water District 1 5,673.52 0.001234%
0233 Douglas County FPD 02 5,620.94 0.001223%
0799 Reardan Town of 5,541.55 0.001206%
0748 Point Roberts Water District 04 5,535.70 0.001204%
0523 Lamont School District 264 5,518.96 0.001201%
0601 Model Irrigation District 18 5,517.83 0.001201%
0970 Tekoa City of 5,506.18 0.001198%
0059 Benton County FPD 01 5,493.81 0.001195%
0917 Spokane County FPD 03 5,481.92 0.001193%
0983 Thurston County FPD 09 5,383.01 0.001171%
1615 Garfield County Health District 5,341.96 0.001162%
0828 Ruston Town of 5,310.60 0.001155%
1288 Columbia Port of 5,287.95 0.001151%
0285 Evaline School District 036 5,283.94 0.001150%
1454 North Spokane Irrigation District 5,225.25 0.001137%
1355 Moab Irrigation District 20 5,188.15 0.001129%
2063 Holmes Harbor Sewer District 5,180.94 0.001127%
1117 Yacolt Town of 5,146.82 0.001120%
1749 Stevens County FPD 01 5,115.19 0.001113%
2296 Walla Walla Watershed Management 5,068.18 0.001103%
1163 Garfield Town of 5,065.52 0.001102%
0063 Benton Irrigation District 5,025.19 0.001093%
1887 Jefferson County FPD 01 4,977.46 0.001083%
2585 North Mason Regional Fire Authority 4,971.43 0.001082%
2170 Lewis County FPD 02 4,931.50 0.001073%
0544 Lind Town of 4,930.30 0.001073%
0475 Lake Forest Park Water District 4,915.20 0.001069%
1804 Loon Lake Sewer District 04 4,908.00 0.001068%
2428 SE Thurston Fire Authority 4,901.75 0.001067%
1575 Stevens County Conservation District 4,780.63 0.001040%
2192 Columbia Valley Water District 4,737.31 0.001031%
0595 Mill A School District 031 4,718.30 0.001027%
1812 WA Economic Development Finance Authority* 4,637.62 0.001009%
1465 Glacier Water District 4,633.04 0.001008%
0572 Mason County FPD 05 4,612.70 0.001004%
0397 Index School District 063 4,609.35 0.001003%
0945 Steptoe School District 304 4,544.89 0.000989%
1436 Coulee City Town of 4,469.02 0.000972%
0701 Palisades School District 102 4,465.81 0.000972%
Public Employees’ Retirement System Plan 1For the fiscal year ended June 30, 2015 — Page 43 of 47
* This employer is not included in the Office of Financial Management’s financial reporting for the state of Washington.

Participating Employer Financial Information s DRS 49
PERS 1 — Schedule of Employer and Nonemployer Allocations (cont.)
All Other Employers — Plan 1 UAAL
Organization Identification Number Organization Name Employer Contributions
Allocation Percentage
0083 Brewster Flat Irrigation District $ 4,413.82 0.000960%
1914 South Cle Elum Town of 4,391.28 0.000955%
1083 Whatcom County FPD 07 4,349.29 0.000946%
2164 Upper Skagit Library District 4,342.23 0.000945%
0927 Sprague City of 4,336.53 0.000944%
2431 King County FPD 28 4,303.70 0.000936%
2248 Columbia County Rural Library District 4,284.05 0.000932%
0563 Mansfield Town of 4,254.92 0.000926%
1874 Peninsula Port of 4,228.04 0.000920%
0823 Roy City of 4,196.04 0.000913%
0612 Mossyrock City of 4,093.46 0.000891%
0126 Chelan County FPD 01 4,077.96 0.000887%
1599 Woodland Port of 4,062.13 0.000884%
0346 Grant County FPD 03 4,000.28 0.000870%
2025 Snohomish County FPD 26 3,998.68 0.000870%
1324 George City of 3,882.38 0.000845%
1826 Wahkiakum County Port District 01 3,787.20 0.000824%
0292 Evergreen School District 205 3,559.23 0.000774%
1638 Whitestone Reclamation District 3,551.84 0.000773%
1740 La Conner Regional Library 3,531.98 0.000768%
1832 Orcas Port of 3,478.69 0.000757%
1122 Yakima County FPD 12 3,475.21 0.000756%
0183 Consolidated Diking Improvement District 02 3,473.35 0.000756%
0616 Mount Pleasant School District 029-93 3,443.61 0.000749%
2268 Riverside Fire Authority 3,408.92 0.000742%
0819 Roosevelt School District 403 3,374.14 0.000734%
1437 San Juan County FPD 03 3,355.44 0.000730%
0694 Othello Port of 3,322.81 0.000723%
1755 Diamond Lake Water & Sewer District 3,303.75 0.000719%
0216 Cusick Town of 3,286.81 0.000715%
1494 South Whatcom Fire Authority 3,281.80 0.000714%
2047 Coalition for Clean Water 3,172.78 0.000690%
1834 Columbia Conservation District 3,172.06 0.000690%
0441 North Highline Fire District 3,084.90 0.000671%
1103 Willapa Valley Water District 3,068.61 0.000668%
0834 Satsop School District 104 3,063.48 0.000667%
1675 Springdale Town of 3,029.03 0.000659%
1458 Cowlitz County FPD 05 3,026.40 0.000658%
2330 Conconully Town of 3,006.13 0.000654%
2607 Okanogan County Transit Authority 2,992.73 0.000651%
0821 Rosalia Town of 2,992.36 0.000651%
0726 Pierce County FPD 10 2,990.79 0.000651%
Public Employees’ Retirement System Plan 1For the fiscal year ended June 30, 2015 — Page 44 of 47

50 DRS s Participating Employer Financial Information
PERS 1 — Schedule of Employer and Nonemployer Allocations (cont.)
All Other Employers — Plan 1 UAAL
Organization Identification Number Organization Name Employer Contributions
Allocation Percentage
1802 Chelan County FPD 09 $ 2,988.19 0.000650%
1972 Spangle Town of 2,983.85 0.000649%
0006 Adams County Mosquito District 2,978.94 0.000648%
1845 Spokane County Law Library 2,977.36 0.000648%
0659 Oakville City of 2,976.46 0.000648%
2593 Central Skagit Rural Library District 2,973.57 0.000647%
2002 South Beach Ambulance Service 2,883.83 0.000627%
0868 Skagit County Cemetery District 02 2,872.15 0.000625%
1793 Elmer City Town of 2,842.33 0.000618%
0657 Oakesdale Town of 2,823.22 0.000614%
2540 Dallesport Water District 2,816.10 0.000613%
0977 Thurston County FPD 08 2,768.32 0.000602%
1786 Colton Town of 2,697.00 0.000587%
2285 Skagit County FPD 06 2,669.67 0.000581%
2387 West Thurston Regional Fire Authority 2,657.49 0.000578%
0932 Star School District 054 2,650.09 0.000577%
1447 Spokane County FPD 10 2,635.11 0.000573%
0013 Ahtanum Irrigation District 2,620.14 0.000570%
0326 Gardena Farms Irrigation District 13 2,574.42 0.000560%
0212 Creston Town of 2,564.91 0.000558%
0359 Grays Harbor County Water District 01 2,539.83 0.000553%
2575 Lopez Solid Waste Disposal District 2,531.48 0.000551%
1712 Mattawa Port of 2,489.10 0.000542%
2411 Riverside Town of 2,484.25 0.000541%
1618 Mason County FPD 04 2,436.19 0.000530%
1124 Yakima County Mosquito Control District 2,418.48 0.000526%
2222 Ferry County Joint Housing Authority 2,403.23 0.000523%
2216 Clark County FPD 10 2,394.20 0.000521%
1705 Allyn Port of 2,392.83 0.000521%
0933 Starbuck School District 035 2,366.19 0.000515%
1438 King County FPD 27 2,360.57 0.000514%
0011 Agnew Irrigation District 2,355.56 0.000513%
1571 Benton County FPD 04 2,338.01 0.000509%
1165 Metaline Falls Town of 2,300.90 0.000501%
0684 Orchard Prairie School District 123 2,251.21 0.000490%
1903 Clallam County FPD 02 2,204.20 0.000480%
0145 Clark County FPD 03 2,169.09 0.000472%
0826 Royal Slope Port of 2,165.51 0.000471%
1762 Uniontown Town of 2,143.72 0.000466%
2243 Thurston County FPD 17 2,137.64 0.000465%
0469 King County Water District 045 2,090.17 0.000455%
2264 Klickitat County FPD 07 2,079.75 0.000453%
Public Employees’ Retirement System Plan 1For the fiscal year ended June 30, 2015 — Page 45 of 47
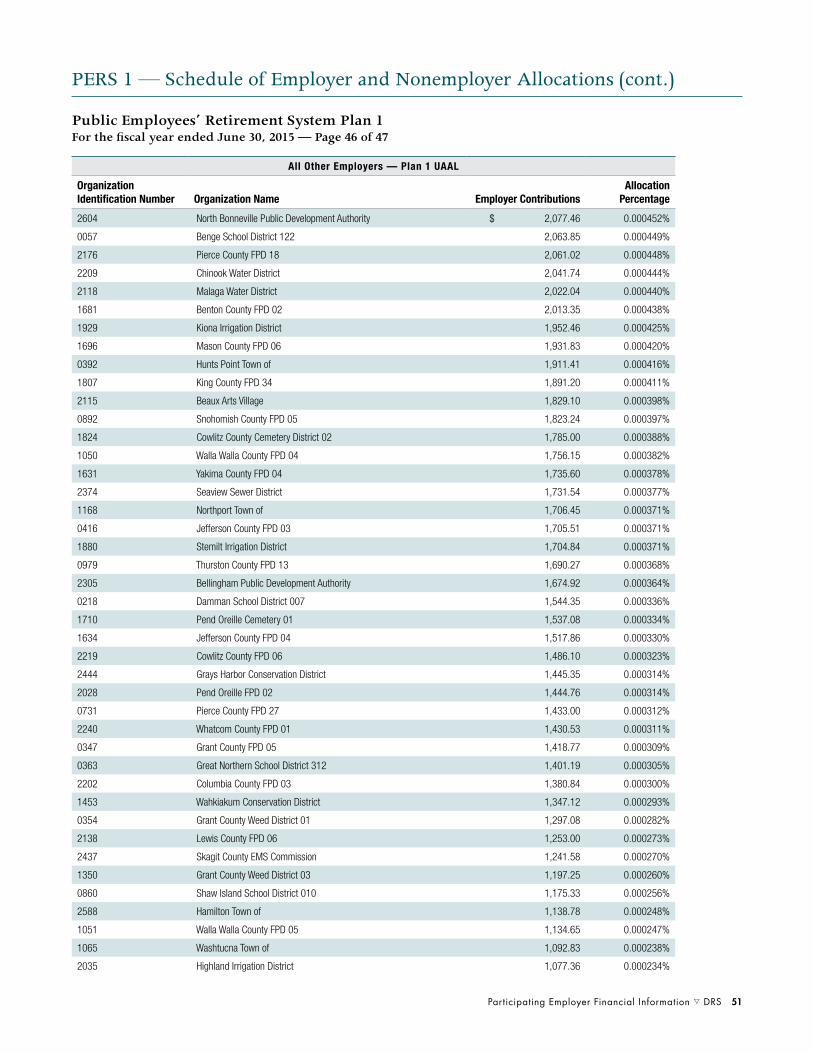
Participating Employer Financial Information s DRS 51
PERS 1 — Schedule of Employer and Nonemployer Allocations (cont.)
All Other Employers — Plan 1 UAAL
Organization Identification Number Organization Name Employer Contributions
Allocation Percentage
2604 North Bonneville Public Development Authority $ 2,077.46 0.000452%
0057 Benge School District 122 2,063.85 0.000449%
2176 Pierce County FPD 18 2,061.02 0.000448%
2209 Chinook Water District 2,041.74 0.000444%
2118 Malaga Water District 2,022.04 0.000440%
1681 Benton County FPD 02 2,013.35 0.000438%
1929 Kiona Irrigation District 1,952.46 0.000425%
1696 Mason County FPD 06 1,931.83 0.000420%
0392 Hunts Point Town of 1,911.41 0.000416%
1807 King County FPD 34 1,891.20 0.000411%
2115 Beaux Arts Village 1,829.10 0.000398%
0892 Snohomish County FPD 05 1,823.24 0.000397%
1824 Cowlitz County Cemetery District 02 1,785.00 0.000388%
1050 Walla Walla County FPD 04 1,756.15 0.000382%
1631 Yakima County FPD 04 1,735.60 0.000378%
2374 Seaview Sewer District 1,731.54 0.000377%
1168 Northport Town of 1,706.45 0.000371%
0416 Jefferson County FPD 03 1,705.51 0.000371%
1880 Stemilt Irrigation District 1,704.84 0.000371%
0979 Thurston County FPD 13 1,690.27 0.000368%
2305 Bellingham Public Development Authority 1,674.92 0.000364%
0218 Damman School District 007 1,544.35 0.000336%
1710 Pend Oreille Cemetery 01 1,537.08 0.000334%
1634 Jefferson County FPD 04 1,517.86 0.000330%
2219 Cowlitz County FPD 06 1,486.10 0.000323%
2444 Grays Harbor Conservation District 1,445.35 0.000314%
2028 Pend Oreille FPD 02 1,444.76 0.000314%
0731 Pierce County FPD 27 1,433.00 0.000312%
2240 Whatcom County FPD 01 1,430.53 0.000311%
0347 Grant County FPD 05 1,418.77 0.000309%
0363 Great Northern School District 312 1,401.19 0.000305%
2202 Columbia County FPD 03 1,380.84 0.000300%
1453 Wahkiakum Conservation District 1,347.12 0.000293%
0354 Grant County Weed District 01 1,297.08 0.000282%
2138 Lewis County FPD 06 1,253.00 0.000273%
2437 Skagit County EMS Commission 1,241.58 0.000270%
1350 Grant County Weed District 03 1,197.25 0.000260%
0860 Shaw Island School District 010 1,175.33 0.000256%
2588 Hamilton Town of 1,138.78 0.000248%
1051 Walla Walla County FPD 05 1,134.65 0.000247%
1065 Washtucna Town of 1,092.83 0.000238%
2035 Highland Irrigation District 1,077.36 0.000234%
Public Employees’ Retirement System Plan 1For the fiscal year ended June 30, 2015 — Page 46 of 47

52 DRS s Participating Employer Financial Information
PERS 1 — Schedule of Employer and Nonemployer Allocations (cont.)
All Other Employers — Plan 1 UAAL
Organization Identification Number Organization Name Employer Contributions
Allocation Percentage
2120 Douglas-Okanogan County FPD 15 $ 1,034.17 0.000225%
2616 Walla Walla Metropolitan Planning Organization 998.95 0.000217%
2183 Lewis County FPD 14 994.82 0.000216%
1933 Mason County FPD 13 959.88 0.000209%
2225 Cowlitz County FPD 03 956.52 0.000208%
2205 Klickitat County FPD 03 906.78 0.000197%
1701 Pacific Council of Governments 902.60 0.000196%
2224 Grant County FPD 10 898.96 0.000196%
2179 Lewis County FPD 03 840.00 0.000183%
2546 Cowlitz County Cemetery District 05 832.22 0.000181%
0453 King County FPD 40 757.91 0.000165%
1085 Whatcom County Water District 02 708.26 0.000154%
1939 Whatcom County Water District 07 693.79 0.000151%
1878 Chelan County FPD 05 623.46 0.000136%
1908 Cowlitz County Cemetery District 01 607.57 0.000132%
0370 Harrington Town of 406.32 0.000088%
0591 KC Metro 317.85 0.000069%
2558 Pend Oreille Conservation District 231.20 0.000050%
0314 Franklin County FPD 03 105.60 0.000023%
1562 Snohomish County FPD 17 105.60 0.000023%
2234 San Juan County FPD 05 83.13 0.000018%
0459 King County Public Health Department 72.78 0.000016%
1412 Stehekin School District 069 54.40 0.000012%
Subtotal All Other Employers — Plan 1 UAAL $ 255,916,959.85 55.682783%
Total State of Washington and All Other Employers — Plan 1 UAAL $ 435,926,990.17 94.849627%
Grand Total Plan 1 Employer Contributions and Plan 1 UAAL $ 459,598,002.46 100.000000%
Public Employees’ Retirement System Plan 1For the fiscal year ended June 30, 2015 — Page 47 of 47
Allocation is based on contribution transmittals DRS received and processed (July 1 -June 30) less mandatory nonrecurring billings.
Contributions are net of the DRS administrative fee, which was 0.18 percent for fiscal year 2015.
Plan 1 UAAL allocations include the PERS Plan 1 employer-contribution portions of PERS Plans 2 and 3, PSERS Plan 2, and SERS Plans 2 and 3, which are required to fund the unfunded actuarially accrued liability pursuant to RCW 41.45.060.

Participating Employer Financial Information s DRS 53
PERS 2/3 — Schedule of Employer Allocations
State of Washington — Employer Allocations
Organization Identification Number Organization Name Employer Contributions
Allocation Percentage
1219 University of WA $ 45,417,641.26 10.195840%
0906 Social & Health Services Department of 27,400,698.94 6.151203%
0997 Transportation Department of 16,165,757.34 3.629063%
0510 Labor & Industries Department of 7,692,984.93 1.727004%
0190 Corrections Southwest Region 5,339,624.60 1.198696%
1021 WA State University 5,285,672.29 1.186585%
0298 Ferries WA State 5,048,994.61 1.133453%
1616 Health Department of 4,841,237.48 1.086813%
1078 Western State Hospital 4,836,866.17 1.085832%
0254 Ecology Department of 4,772,919.70 1.071476%
0036 Attorney General Office of 4,077,703.79 0.915407%
1745 Fish & Wildlife Department of 4,059,769.72 0.911381%
0635 Natural Resources Department of 3,986,131.64 0.894850%
0273 Employment Security Department of 3,620,311.56 0.812726%
0801 Corrections Northwest Region 3,528,215.54 0.792052%
0808 Revenue Department of 3,311,678.85 0.743441%
0538 Licensing Department of 3,080,198.97 0.691476%
1601 Health Care Authority 2,894,582.44 0.649807%
2550 Enterprise Services Department of 2,889,347.13 0.648632%
0008 Administrative Office of the Court 2,642,629.87 0.593246%
0713 State Patrol WA 2,642,575.36 0.593234%
2274 Corrections Health Services 2,551,538.27 0.572797%
0719 Corrections Southeast Region 2,323,063.89 0.521506%
0246 Eastern State Hospital 1,834,606.64 0.411852%
0012 Agriculture Department of 1,807,806.08 0.405836%
1079 Western WA University 1,662,213.22 0.373151%
0794 Rainier School 1,613,772.79 0.362277%
0117 Central WA University 1,464,731.12 0.328819%
0839 Seattle Community College 1,310,274.00 0.294144%
0247 Eastern WA University 1,268,466.11 0.284759%
1678 Corrections Northeast Region 1,242,322.96 0.278890%
0306 Fircrest School 1,208,498.74 0.271297%
0520 Lakeland Village 1,175,014.17 0.263780%
0041 Auditor Office of the State 1,169,260.68 0.262488%
0772 Superintendent of Public Instruction 1,144,702.74 0.256975%
0179 Spokane Community College 1,123,304.70 0.252172%
0704 Parks & Recreation Commission 1,059,550.91 0.237859%
2551 Consolidated Technology Services 1,041,199.37 0.233740%
0304 Financial Management Office of 932,560.27 0.209351%
1746 Commerce Department of 887,559.52 0.199249%
1635 Special Commitment Center 877,645.68 0.197023%
0388 House of Representatives 874,556.67 0.196330%
Public Employees’ Retirement System Plans 2 and 3For the fiscal year ended June 30, 2015 — Page 1 of 25

54 DRS s Participating Employer Financial Information
PERS 2/3 — Schedule of Employer Allocations (cont.)
State of Washington — Employer Allocations
Organization Identification Number Organization Name Employer Contributions
Allocation Percentage
0594 Military Department WA State $ 821,547.51 0.184430%
2238 Early Learning Department of 736,567.96 0.165353%
0974 Evergreen State College 724,502.98 0.162644%
0049 Bellevue Community College 693,529.92 0.155691%
0403 Insurance Commissioner 683,176.39 0.153367%
0152 Clark Community College 669,659.56 0.150332%
1735 Financial Institutions Department of 664,476.23 0.149169%
0852 Senate WA State 655,619.84 0.147181%
1036 Veterans Home WA 639,629.75 0.143591%
0256 Edmonds Community College 609,052.42 0.136727%
0846 Secretary of State Office of 593,355.04 0.133203%
0545 Liquor Control Board WA State 563,432.70 0.126485%
0741 Pierce College 559,120.98 0.125517%
0201 Court of Appeals WA State 530,965.33 0.119197%
0287 Everett Community College 525,719.31 0.118019%
0365 Green Hill School 519,513.83 0.116626%
0936 State Investment Board 502,655.57 0.112842%
0009 Administrative Hearings Office of 502,072.58 0.112711%
0400 Industrial Insurance Appeals Board 500,441.95 0.112345%
1132 Yakima Valley School 464,665.18 0.104313%
0367 Green River Community College 453,908.25 0.101898%
0253 Echo Glen Children’s Center 437,266.92 0.098162%
1022 Utilities & Transportation Commission 434,059.03 0.097442%
1726 Social & Health Service Region 01 DDD 412,085.80 0.092509%
0963 Tacoma Community College 381,604.86 0.085667%
0873 Skagit Valley College 371,927.22 0.083494%
0864 Shoreline Community College 359,342.79 0.080669%
0940 Soldiers Home of WA State 351,541.37 0.078918%
0675 Olympic College 335,091.89 0.075225%
0554 Lower Columbia Community College 332,598.32 0.074665%
1728 Social & Health Service Region 02 DDD 331,959.89 0.074522%
0553 Lottery Commission WA State 327,227.43 0.073460%
0377 Highline Community College 322,343.20 0.072363%
1130 Yakima Valley College 294,521.36 0.066117%
1674 Bates Technical College 292,748.53 0.065719%
1035 Veterans Affairs Department of 291,118.22 0.065353%
1732 DSHS Region 3 DDD Field 290,661.98 0.065251%
1668 Clover Park Technical College 283,617.77 0.063670%
2562 Student Achievement Council 281,094.73 0.063103%
2114 Veterans Home — Spokane 276,758.33 0.062130%
0176 Community & Technical Colleges State Board for 267,764.69 0.060111%
1591 South Puget Sound Community College 267,140.15 0.059970%
Public Employees’ Retirement System Plans 2 and 3For the fiscal year ended June 30, 2015 — Page 2 of 25

Participating Employer Financial Information s DRS 55
PERS 2/3 — Schedule of Employer Allocations
State of Washington — Employer Allocations
Organization Identification Number Organization Name Employer Contributions
Allocation Percentage
0136 Child Study & Treatment Center $ 266,776.10 0.059889%
1053 Walla Walla Community College 266,231.72 0.059767%
0324 Gambling Commission WA State 254,217.24 0.057069%
0960 Supreme Court 249,056.45 0.055911%
0169 Columbia Basin Community College 238,858.74 0.053622%
0941 State Treasurer Office of 225,816.12 0.050694%
1666 Renton Technical College 215,940.95 0.048477%
0859 Services for the Blind 214,968.50 0.048258%
1140 Consolidated Support Services 213,578.52 0.047946%
1729 DSHS Region 2 SOLA-King 203,553.12 0.045696%
0178 Centralia College 201,812.89 0.045305%
1673 Lake Washington Institute of Technology 193,455.36 0.043429%
1088 Whatcom Community College 184,017.57 0.041310%
0633 Naselle Youth Camp 183,820.06 0.041266%
1667 Bellingham Technical College 180,566.25 0.040535%
1074 Wenatchee Valley College 175,921.70 0.039493%
0405 Recreation Conservation Office 169,331.05 0.038013%
2261 Puget Sound Partnership 169,092.06 0.037960%
0419 Joint Legislative System Commission 168,022.25 0.037719%
0360 Grays Harbor College 149,856.81 0.033641%
0337 Governor Office of the 149,007.56 0.033451%
0068 Big Bend Community College 142,762.92 0.032049%
1731 DSHS Region 3 SOLA-Pierce 129,685.65 0.029113%
0717 Peninsula College 129,605.40 0.029095%
0942 Statute Law Committee 129,563.04 0.029086%
0939 Center for Childhood Deafness WA State 128,810.66 0.028917%
0938 School for the Blind 127,120.60 0.028537%
1725 Social & Health Service Region 01 SOLA 121,908.17 0.027367%
1727 DSHS Region 1 SOLA-Yakima 114,552.46 0.025716%
0213 Criminal Justice Training Commission 113,894.21 0.025568%
0771 Public Employment Relations Commission 103,166.18 0.023160%
2563 Legislative Support Services Office of 88,067.39 0.019770%
0380 Historical Society WA State 83,409.37 0.018725%
0529 Joint Legislative Audit & Review Committee 79,480.66 0.017843%
0391 Human Rights Commission 77,135.10 0.017316%
1228 County Road Administration Board 72,777.52 0.016338%
1037 Workforce Training & Education Coordinating Board 72,525.55 0.016281%
2008 Cascadia Community College 68,972.17 0.015484%
0996 Traffic Safety Commission 67,226.98 0.015092%
0185 Conservation Commission 61,003.94 0.013695%
0004 Actuary State 59,081.33 0.013263%
1809 Public Defense Office of 58,807.69 0.013202%
Public Employees’ Retirement System Plans 2 and 3For the fiscal year ended June 30, 2015 — Page 3 of 25

56 DRS s Participating Employer Financial Information
PERS 2/3 — Schedule of Employer Allocations (cont.)
State of Washington — Employer Allocations
Organization Identification Number Organization Name Employer Contributions
Allocation Percentage
0281 Environmental & Land Use Hearings office $ 55,877.15 0.012544%
0599 Minority & Women’s Business Enterprises Office of 55,448.83 0.012448%
1442 Archaeology-Historic Preservation 54,615.00 0.012261%
0379 Historical Society Eastern WA State 54,269.48 0.012183%
0769 Public Disclosure Commission 50,284.08 0.011288%
1646 Transportation Improvement Board 40,789.49 0.009157%
0527 Leap Committee 38,457.18 0.008633%
0969 Tax Appeals Board of 38,247.67 0.008586%
1837 Caseload Forecast Council 35,995.63 0.008081%
0027 Arts Commission WA State 32,185.19 0.007225%
0420 Judicial Conduct Commission 31,751.69 0.007128%
0003 Accountancy State Board of 30,842.18 0.006924%
2171 LEOFF Plan 2 Retirement Board 28,368.07 0.006368%
0386 Horse Racing Commission 28,216.75 0.006334%
1637 Forecast Council Office of 24,333.84 0.005463%
0163 Columbia River Gorge Commission 21,317.68 0.004786%
1622 Pollution Liability Insurance 20,505.40 0.004603%
0526 Law Library WA State 20,503.83 0.004603%
2212 Joint Transportation Committee 13,368.23 0.003001%
0539 Lieutenant Governor Office of 13,264.47 0.002978%
2206 Civil Legal Aide Office of 10,005.96 0.002246%
1039 Volunteer Firefighters Board 9,365.74 0.002103%
2577 WA Charter School Commission 8,871.98 0.001992%
1443 Puget Sound Pilotage Commission 7,657.20 0.001719%
0398 Indian Advisory Council WA State 7,062.36 0.001585%
1627 African American Affairs Commission 6,337.62 0.001423%
0028 Commission on Asian Pacific American Affairs 6,298.41 0.001414%
0592 Hispanic Affairs Commission 6,281.59 0.001410%
1890 Citizens’ Commission on Salaries for Elected Officials 4,657.58 0.001046%
0159 Olympic Correction Center 122.01 0.000027%
0565 Maple Lane School 72.81 0.000016%
Subtotal State of Washington — Employer Allocations $ 218,723,111.59 49.101315%
Public Employees’ Retirement System Plans 2 and 3For the fiscal year ended June 30, 2015 — Page 4 of 25

Participating Employer Financial Information s DRS 57
PERS 2/3 — Schedule of Employer Allocations
All Other Employers — Employer Allocations
Organization Identification Number Organization Name Employer Contributions
Allocation Percentage
0481 King County $ 45,791,761.20 10.279827%
0742 Pierce County 8,860,838.53 1.989176%
0896 Snohomish County 7,212,009.93 1.619029%
1115 Energy Northwest 7,108,348.91 1.595759%
0895 Snohomish County PUD 01 4,958,829.32 1.113211%
0843 Seattle Port of 4,840,492.96 1.086646%
0153 Clark County 4,311,617.32 0.967918%
0922 Spokane County 4,309,176.78 0.967370%
0048 Bellevue City of 3,793,114.24 0.851519%
0352 Grant County PUD 02 3,025,798.65 0.679264%
0128 Chelan County Public Utilities District 2,993,765.21 0.672073%
0490 Kitsap County 2,885,356.48 0.647736%
0745 Pierce County PTBA 2,686,164.04 0.603019%
0984 Thurston County 2,534,748.29 0.569028%
0286 Everett City of 2,504,347.32 0.562203%
0460 King County Rural Library District 2,202,351.26 0.494407%
1126 Yakima County 2,057,374.04 0.461861%
1089 Whatcom County 1,989,942.53 0.446724%
0899 Snohomish County PTBA 1,912,051.45 0.429238%
1028 Vancouver City of 1,841,001.93 0.413288%
0150 Clark County PUD 1,714,000.83 0.384777%
0434 Kent City of 1,701,231.86 0.381911%
0841 Seattle Housing Authority 1,577,229.28 0.354073%
0800 Redmond City of 1,556,660.51 0.349456%
0051 Bellingham City of 1,537,343.90 0.345119%
0802 Renton City of 1,537,130.94 0.345072%
0872 Skagit County 1,526,676.03 0.342725%
2436 Spokane Transit Authority 1,479,958.80 0.332237%
1119 Yakima City of 1,310,588.83 0.294215%
0061 Benton County 1,281,932.11 0.287782%
0484 Kirkland City of 1,256,545.16 0.282083%
0671 Olympia City of 1,233,899.08 0.276999%
0809 Richland City of 1,228,814.08 0.275857%
0534 Lewis County 1,163,118.19 0.261109%
0149 Clark County PTBA 1,130,101.21 0.253697%
0205 Cowlitz County 1,103,256.96 0.247671%
0482 King County Housing Authority 1,097,162.13 0.246303%
0038 Auburn City of 1,076,834.75 0.241739%
0965 Tacoma Port of 1,067,791.94 0.239709%
0355 Grant County 1,016,820.01 0.228267%
0589 Metropolitan Park District of Tacoma 985,279.63 0.221186%
0406 Intercity Transit 911,972.63 0.204729%
Public Employees’ Retirement System Plans 2 and 3For the fiscal year ended June 30, 2015 — Page 5 of 25
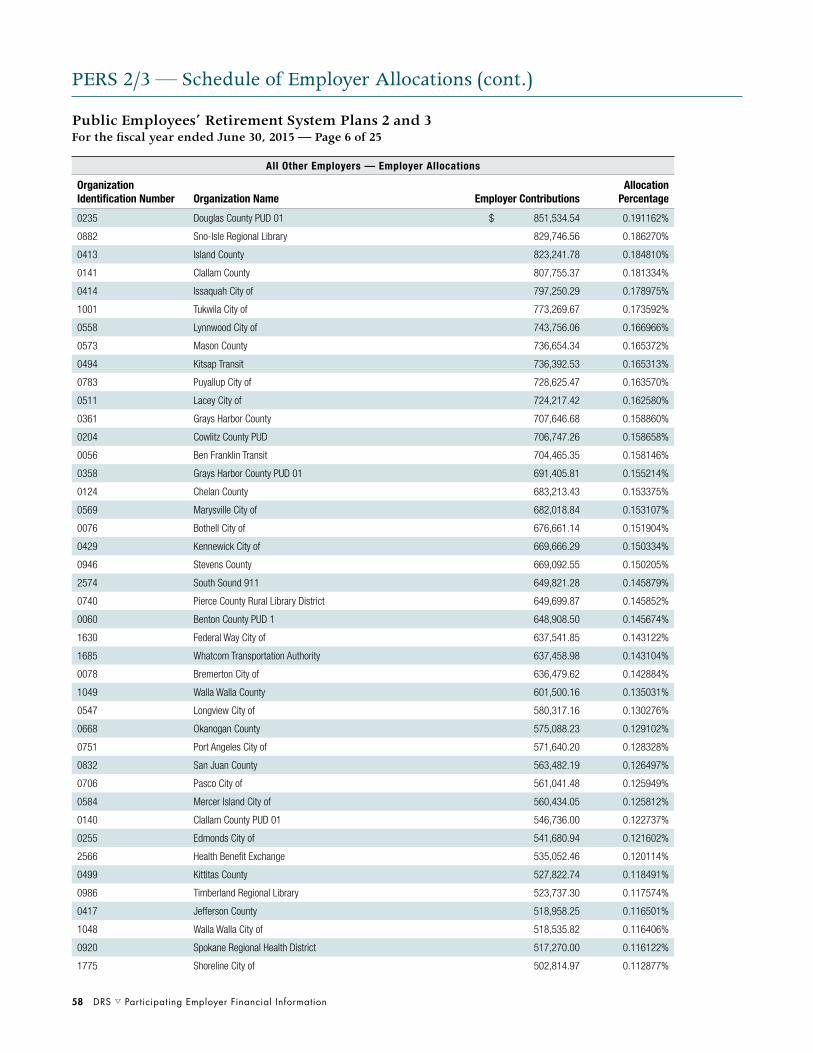
58 DRS s Participating Employer Financial Information
PERS 2/3 — Schedule of Employer Allocations (cont.)
All Other Employers — Employer Allocations
Organization Identification Number Organization Name Employer Contributions
Allocation Percentage
0235 Douglas County PUD 01 $ 851,534.54 0.191162%
0882 Sno-Isle Regional Library 829,746.56 0.186270%
0413 Island County 823,241.78 0.184810%
0141 Clallam County 807,755.37 0.181334%
0414 Issaquah City of 797,250.29 0.178975%
1001 Tukwila City of 773,269.67 0.173592%
0558 Lynnwood City of 743,756.06 0.166966%
0573 Mason County 736,654.34 0.165372%
0494 Kitsap Transit 736,392.53 0.165313%
0783 Puyallup City of 728,625.47 0.163570%
0511 Lacey City of 724,217.42 0.162580%
0361 Grays Harbor County 707,646.68 0.158860%
0204 Cowlitz County PUD 706,747.26 0.158658%
0056 Ben Franklin Transit 704,465.35 0.158146%
0358 Grays Harbor County PUD 01 691,405.81 0.155214%
0124 Chelan County 683,213.43 0.153375%
0569 Marysville City of 682,018.84 0.153107%
0076 Bothell City of 676,661.14 0.151904%
0429 Kennewick City of 669,666.29 0.150334%
0946 Stevens County 669,092.55 0.150205%
2574 South Sound 911 649,821.28 0.145879%
0740 Pierce County Rural Library District 649,699.87 0.145852%
0060 Benton County PUD 1 648,908.50 0.145674%
1630 Federal Way City of 637,541.85 0.143122%
1685 Whatcom Transportation Authority 637,458.98 0.143104%
0078 Bremerton City of 636,479.62 0.142884%
1049 Walla Walla County 601,500.16 0.135031%
0547 Longview City of 580,317.16 0.130276%
0668 Okanogan County 575,088.23 0.129102%
0751 Port Angeles City of 571,640.20 0.128328%
0832 San Juan County 563,482.19 0.126497%
0706 Pasco City of 561,041.48 0.125949%
0584 Mercer Island City of 560,434.05 0.125812%
0140 Clallam County PUD 01 546,736.00 0.122737%
0255 Edmonds City of 541,680.94 0.121602%
2566 Health Benefit Exchange 535,052.46 0.120114%
0499 Kittitas County 527,822.74 0.118491%
0986 Timberland Regional Library 523,737.30 0.117574%
0417 Jefferson County 518,958.25 0.116501%
1048 Walla Walla City of 518,535.82 0.116406%
0920 Spokane Regional Health District 517,270.00 0.116122%
1775 Shoreline City of 502,814.97 0.112877%
Public Employees’ Retirement System Plans 2 and 3For the fiscal year ended June 30, 2015 — Page 6 of 25

Participating Employer Financial Information s DRS 59
PERS 2/3 — Schedule of Employer Allocations
All Other Employers — Employer Allocations
Organization Identification Number Organization Name Employer Contributions
Allocation Percentage
0575 Mason County PUD 03 $ 498,558.22 0.111922%
0043 Bar Association WA State* 497,039.82 0.111581%
0897 Snohomish Health District 476,590.36 0.106990%
0504 Klickitat County 475,739.80 0.106799%
0716 Pend Oreille County PUD 01 475,147.13 0.106666%
0533 Lewis County PUD 01 469,818.86 0.105470%
1025 Valley Communication Center 465,682.72 0.104541%
0318 Franklin County 462,334.15 0.103790%
1647 SeaTac City of 457,833.17 0.102779%
0015 Alderwood Water District 450,336.83 0.101096%
0312 Fort Vancouver Regional Library 437,610.50 0.098240%
0018 Anacortes City of 429,874.93 0.096503%
0667 Okanogan County PUD 01 399,595.14 0.089705%
0881 Snohomish County Police Staff & Auxiliary 399,564.15 0.089698%
1002 Tumwater City of 398,931.56 0.089556%
0316 Franklin County PUD 01 397,377.39 0.089208%
0118 Centralia City of 396,966.59 0.089115%
0617 Mount Vernon City of 386,770.96 0.086827%
0289 Everett Port of 381,717.86 0.085692%
0295 Lakehaven Utility District 376,852.48 0.084600%
0269 Ellensburg City of 376,834.80 0.084596%
1096 Whitman County 376,748.23 0.084576%
0780 Pullman City of 373,566.87 0.083862%
0237 Douglas County 372,315.63 0.083581%
1999 Sammamish City of 364,931.18 0.081924%
1071 Wenatchee City of 361,547.27 0.081164%
0699 Pacific County 359,216.46 0.080641%
0095 Camas City of 352,456.22 0.079123%
2559 King County Public Defender Organization 347,742.41 0.078065%
0964 Tacoma Housing Authority 342,652.07 0.076922%
0007 Adams County 340,418.38 0.076421%
1597 WA School Information Processing Cooperative 339,942.39 0.076314%
0075 Bonney Lake City of 337,754.53 0.075823%
1107 Bainbridge Island City of 336,728.13 0.075592%
0229 Des Moines City of 331,742.81 0.074473%
0502 Klickitat County PUD 01 323,562.54 0.072637%
0609 Moses Lake City of 322,409.20 0.072378%
0777 Puget Sound Clean Air Agency 315,449.67 0.070816%
0954 Sumner City of 310,120.88 0.069619%
0053 Bellingham Port of 309,335.61 0.069443%
Public Employees’ Retirement System Plans 2 and 3For the fiscal year ended June 30, 2015 — Page 7 of 25
* This employer is not included in the Office of Financial Management’s financial reporting for the state of Washington.
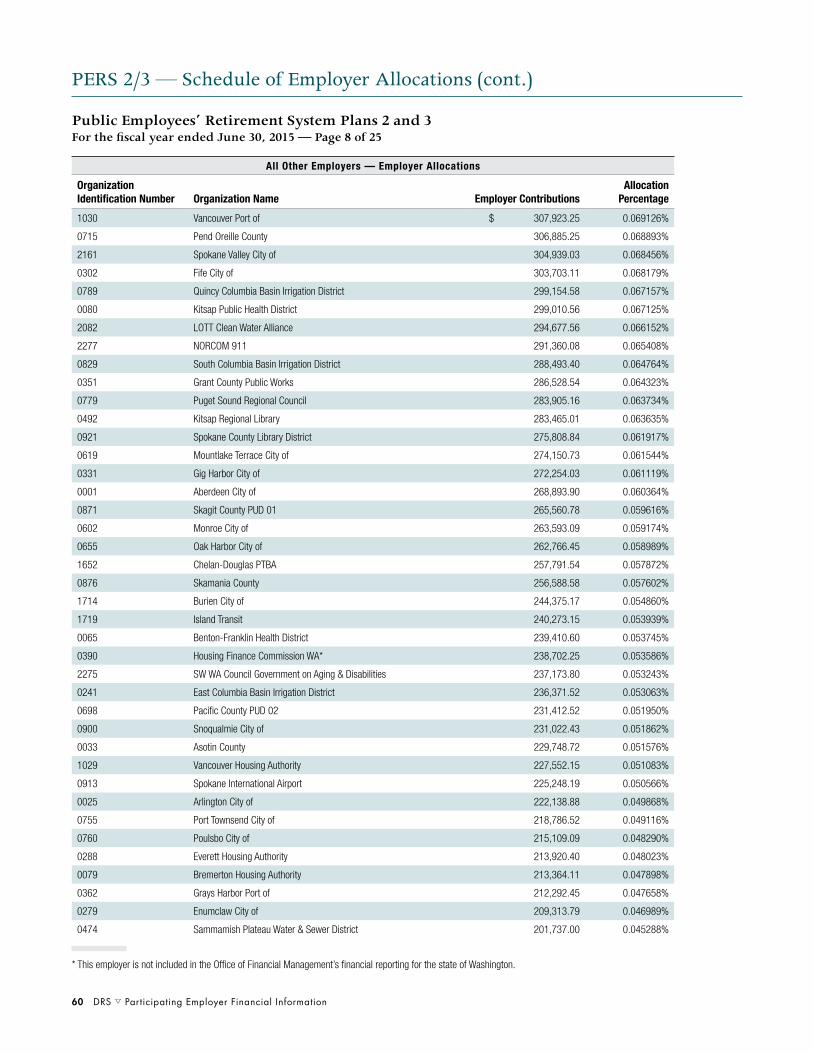
60 DRS s Participating Employer Financial Information
PERS 2/3 — Schedule of Employer Allocations (cont.)
All Other Employers — Employer Allocations
Organization Identification Number Organization Name Employer Contributions
Allocation Percentage
1030 Vancouver Port of $ 307,923.25 0.069126%
0715 Pend Oreille County 306,885.25 0.068893%
2161 Spokane Valley City of 304,939.03 0.068456%
0302 Fife City of 303,703.11 0.068179%
0789 Quincy Columbia Basin Irrigation District 299,154.58 0.067157%
0080 Kitsap Public Health District 299,010.56 0.067125%
2082 LOTT Clean Water Alliance 294,677.56 0.066152%
2277 NORCOM 911 291,360.08 0.065408%
0829 South Columbia Basin Irrigation District 288,493.40 0.064764%
0351 Grant County Public Works 286,528.54 0.064323%
0779 Puget Sound Regional Council 283,905.16 0.063734%
0492 Kitsap Regional Library 283,465.01 0.063635%
0921 Spokane County Library District 275,808.84 0.061917%
0619 Mountlake Terrace City of 274,150.73 0.061544%
0331 Gig Harbor City of 272,254.03 0.061119%
0001 Aberdeen City of 268,893.90 0.060364%
0871 Skagit County PUD 01 265,560.78 0.059616%
0602 Monroe City of 263,593.09 0.059174%
0655 Oak Harbor City of 262,766.45 0.058989%
1652 Chelan-Douglas PTBA 257,791.54 0.057872%
0876 Skamania County 256,588.58 0.057602%
1714 Burien City of 244,375.17 0.054860%
1719 Island Transit 240,273.15 0.053939%
0065 Benton-Franklin Health District 239,410.60 0.053745%
0390 Housing Finance Commission WA* 238,702.25 0.053586%
2275 SW WA Council Government on Aging & Disabilities 237,173.80 0.053243%
0241 East Columbia Basin Irrigation District 236,371.52 0.053063%
0698 Pacific County PUD 02 231,412.52 0.051950%
0900 Snoqualmie City of 231,022.43 0.051862%
0033 Asotin County 229,748.72 0.051576%
1029 Vancouver Housing Authority 227,552.15 0.051083%
0913 Spokane International Airport 225,248.19 0.050566%
0025 Arlington City of 222,138.88 0.049868%
0755 Port Townsend City of 218,786.52 0.049116%
0760 Poulsbo City of 215,109.09 0.048290%
0288 Everett Housing Authority 213,920.40 0.048023%
0079 Bremerton Housing Authority 213,364.11 0.047898%
0362 Grays Harbor Port of 212,292.45 0.047658%
0279 Enumclaw City of 209,313.79 0.046989%
0474 Sammamish Plateau Water & Sewer District 201,737.00 0.045288%
Public Employees’ Retirement System Plans 2 and 3For the fiscal year ended June 30, 2015 — Page 8 of 25
* This employer is not included in the Office of Financial Management’s financial reporting for the state of Washington.
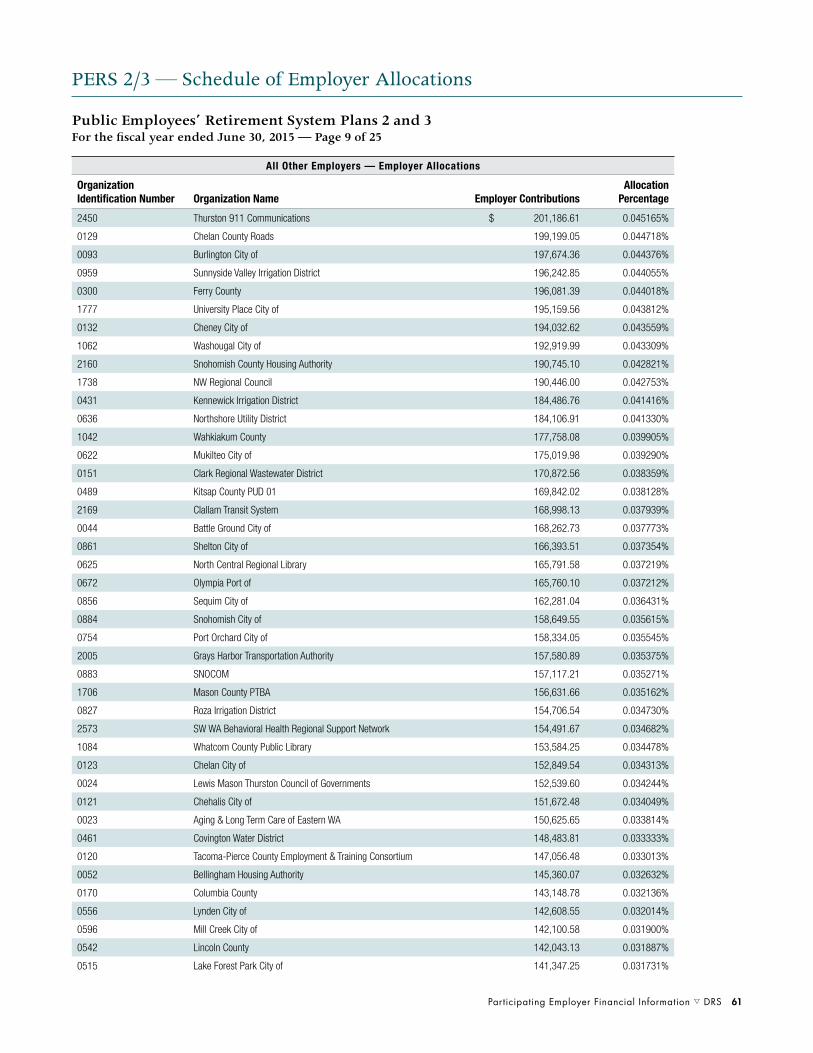
Participating Employer Financial Information s DRS 61
PERS 2/3 — Schedule of Employer Allocations
All Other Employers — Employer Allocations
Organization Identification Number Organization Name Employer Contributions
Allocation Percentage
2450 Thurston 911 Communications $ 201,186.61 0.045165%
0129 Chelan County Roads 199,199.05 0.044718%
0093 Burlington City of 197,674.36 0.044376%
0959 Sunnyside Valley Irrigation District 196,242.85 0.044055%
0300 Ferry County 196,081.39 0.044018%
1777 University Place City of 195,159.56 0.043812%
0132 Cheney City of 194,032.62 0.043559%
1062 Washougal City of 192,919.99 0.043309%
2160 Snohomish County Housing Authority 190,745.10 0.042821%
1738 NW Regional Council 190,446.00 0.042753%
0431 Kennewick Irrigation District 184,486.76 0.041416%
0636 Northshore Utility District 184,106.91 0.041330%
1042 Wahkiakum County 177,758.08 0.039905%
0622 Mukilteo City of 175,019.98 0.039290%
0151 Clark Regional Wastewater District 170,872.56 0.038359%
0489 Kitsap County PUD 01 169,842.02 0.038128%
2169 Clallam Transit System 168,998.13 0.037939%
0044 Battle Ground City of 168,262.73 0.037773%
0861 Shelton City of 166,393.51 0.037354%
0625 North Central Regional Library 165,791.58 0.037219%
0672 Olympia Port of 165,760.10 0.037212%
0856 Sequim City of 162,281.04 0.036431%
0884 Snohomish City of 158,649.55 0.035615%
0754 Port Orchard City of 158,334.05 0.035545%
2005 Grays Harbor Transportation Authority 157,580.89 0.035375%
0883 SNOCOM 157,117.21 0.035271%
1706 Mason County PTBA 156,631.66 0.035162%
0827 Roza Irrigation District 154,706.54 0.034730%
2573 SW WA Behavioral Health Regional Support Network 154,491.67 0.034682%
1084 Whatcom County Public Library 153,584.25 0.034478%
0123 Chelan City of 152,849.54 0.034313%
0024 Lewis Mason Thurston Council of Governments 152,539.60 0.034244%
0121 Chehalis City of 151,672.48 0.034049%
0023 Aging & Long Term Care of Eastern WA 150,625.65 0.033814%
0461 Covington Water District 148,483.81 0.033333%
0120 Tacoma-Pierce County Employment & Training Consortium 147,056.48 0.033013%
0052 Bellingham Housing Authority 145,360.07 0.032632%
0170 Columbia County 143,148.78 0.032136%
0556 Lynden City of 142,608.55 0.032014%
0596 Mill Creek City of 142,100.58 0.031900%
0542 Lincoln County 142,043.13 0.031887%
0515 Lake Forest Park City of 141,347.25 0.031731%
Public Employees’ Retirement System Plans 2 and 3For the fiscal year ended June 30, 2015 — Page 9 of 25

62 DRS s Participating Employer Financial Information
PERS 2/3 — Schedule of Employer Allocations (cont.)
All Other Employers — Employer Allocations
Organization Identification Number Organization Name Employer Contributions
Allocation Percentage
0593 Mid-Columbia Regional Library $ 140,856.72 0.031621%
1131 Yakima Valley Regional Library 139,863.58 0.031398%
1111 Woodinville Water District 139,300.32 0.031272%
1628 Jefferson County PUD 01 139,178.42 0.031244%
0662 Ocean Shores City of 138,891.72 0.031180%
0073 Blaine City of 137,546.14 0.030878%
2430 Kent Fire Department Regional Fire Authority 136,959.71 0.030746%
0541 Lincoln County Highway Department 135,349.82 0.030385%
0956 Sunnyside City of 134,635.79 0.030224%
1919 Skagit 911 134,009.09 0.030084%
1842 Maple Valley City of 131,219.18 0.029457%
0923 Spokane Housing Authority 130,722.01 0.029346%
0296 Ferndale City of 130,512.03 0.029299%
0549 Longview Port of 129,430.94 0.029056%
0473 Soos Creek Water & Sewer District 128,232.94 0.028787%
0646 North Bend City of 128,223.64 0.028785%
0961 SW Suburban Sewer District 127,264.88 0.028570%
1617 Kitsap County Consolidated Housing Authority 126,832.77 0.028473%
0426 Kelso City of 126,796.79 0.028465%
2263 Bainbridge Island Metro Parks & Recreation District 125,891.06 0.028261%
0438 King County Directors’ Association 124,412.87 0.027930%
0847 Sedro-Woolley City of 123,471.78 0.027718%
1034 Vera Water & Power 123,295.67 0.027679%
1623 Olympic Area Agency On Aging 123,155.33 0.027647%
0516 Lake Stevens City of 122,166.18 0.027425%
1713 Woodinville City of 121,703.71 0.027321%
0752 Port Angeles Port of 119,335.14 0.026790%
0875 Skamania County PUD 01 117,770.80 0.026438%
0384 Hoquiam City of 117,227.87 0.026317%
0803 Renton Housing Authority 116,017.34 0.026045%
0732 Pierce County FPD 03 114,845.39 0.025782%
0478 Highline Water District 112,702.57 0.025301%
0708 Pasco Port of 112,265.50 0.025203%
1075 West Richland City of 111,148.57 0.024952%
1891 Kenmore City of 109,635.59 0.024612%
0522 Lakewood Water District 109,251.10 0.024526%
1135 Yelm City of 106,197.51 0.023840%
0654 NW Clean Air Agency 105,863.16 0.023765%
2191 RiverCom 105,511.23 0.023686%
1027 Valley Transit 104,324.19 0.023420%
0735 Pierce County FPD 06 103,851.86 0.023314%
0418 Jefferson Transit Authority 102,713.78 0.023058%
Public Employees’ Retirement System Plans 2 and 3For the fiscal year ended June 30, 2015 — Page 10 of 25
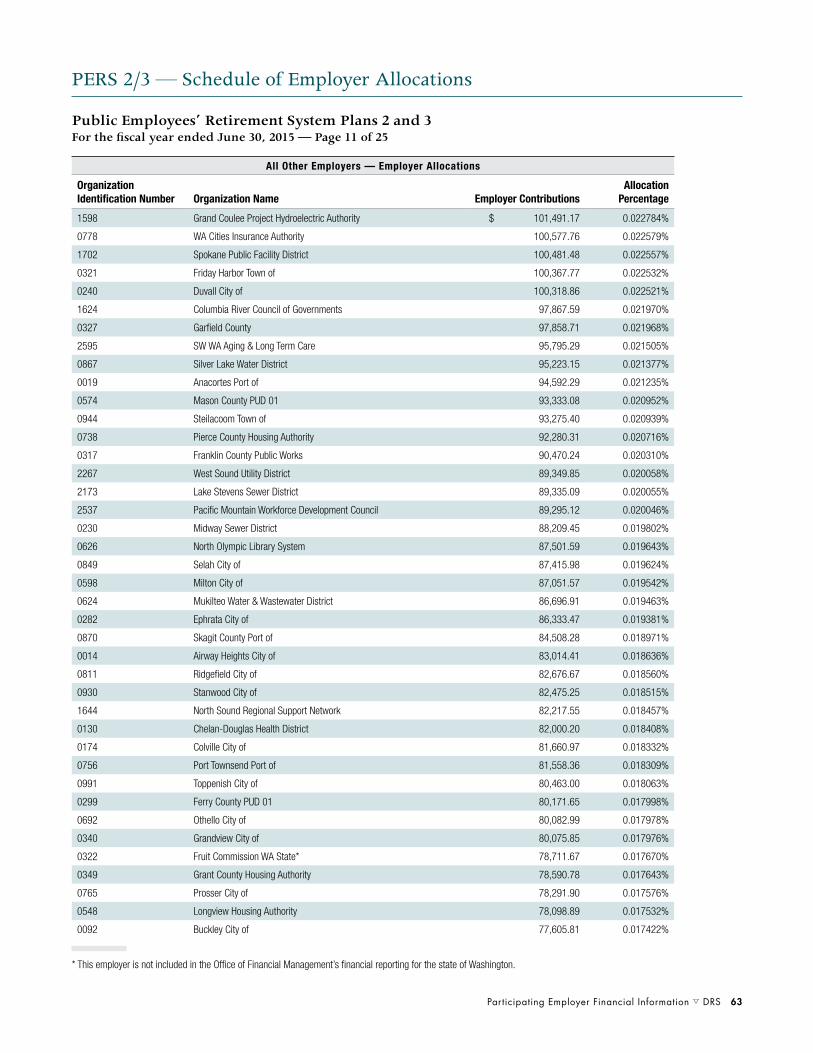
Participating Employer Financial Information s DRS 63
PERS 2/3 — Schedule of Employer Allocations
All Other Employers — Employer Allocations
Organization Identification Number Organization Name Employer Contributions
Allocation Percentage
1598 Grand Coulee Project Hydroelectric Authority $ 101,491.17 0.022784%
0778 WA Cities Insurance Authority 100,577.76 0.022579%
1702 Spokane Public Facility District 100,481.48 0.022557%
0321 Friday Harbor Town of 100,367.77 0.022532%
0240 Duvall City of 100,318.86 0.022521%
1624 Columbia River Council of Governments 97,867.59 0.021970%
0327 Garfield County 97,858.71 0.021968%
2595 SW WA Aging & Long Term Care 95,795.29 0.021505%
0867 Silver Lake Water District 95,223.15 0.021377%
0019 Anacortes Port of 94,592.29 0.021235%
0574 Mason County PUD 01 93,333.08 0.020952%
0944 Steilacoom Town of 93,275.40 0.020939%
0738 Pierce County Housing Authority 92,280.31 0.020716%
0317 Franklin County Public Works 90,470.24 0.020310%
2267 West Sound Utility District 89,349.85 0.020058%
2173 Lake Stevens Sewer District 89,335.09 0.020055%
2537 Pacific Mountain Workforce Development Council 89,295.12 0.020046%
0230 Midway Sewer District 88,209.45 0.019802%
0626 North Olympic Library System 87,501.59 0.019643%
0849 Selah City of 87,415.98 0.019624%
0598 Milton City of 87,051.57 0.019542%
0624 Mukilteo Water & Wastewater District 86,696.91 0.019463%
0282 Ephrata City of 86,333.47 0.019381%
0870 Skagit County Port of 84,508.28 0.018971%
0014 Airway Heights City of 83,014.41 0.018636%
0811 Ridgefield City of 82,676.67 0.018560%
0930 Stanwood City of 82,475.25 0.018515%
1644 North Sound Regional Support Network 82,217.55 0.018457%
0130 Chelan-Douglas Health District 82,000.20 0.018408%
0174 Colville City of 81,660.97 0.018332%
0756 Port Townsend Port of 81,558.36 0.018309%
0991 Toppenish City of 80,463.00 0.018063%
0299 Ferry County PUD 01 80,171.65 0.017998%
0692 Othello City of 80,082.99 0.017978%
0340 Grandview City of 80,075.85 0.017976%
0322 Fruit Commission WA State* 78,711.67 0.017670%
0349 Grant County Housing Authority 78,590.78 0.017643%
0765 Prosser City of 78,291.90 0.017576%
0548 Longview Housing Authority 78,098.89 0.017532%
0092 Buckley City of 77,605.81 0.017422%
Public Employees’ Retirement System Plans 2 and 3For the fiscal year ended June 30, 2015 — Page 11 of 25
* This employer is not included in the Office of Financial Management’s financial reporting for the state of Washington.
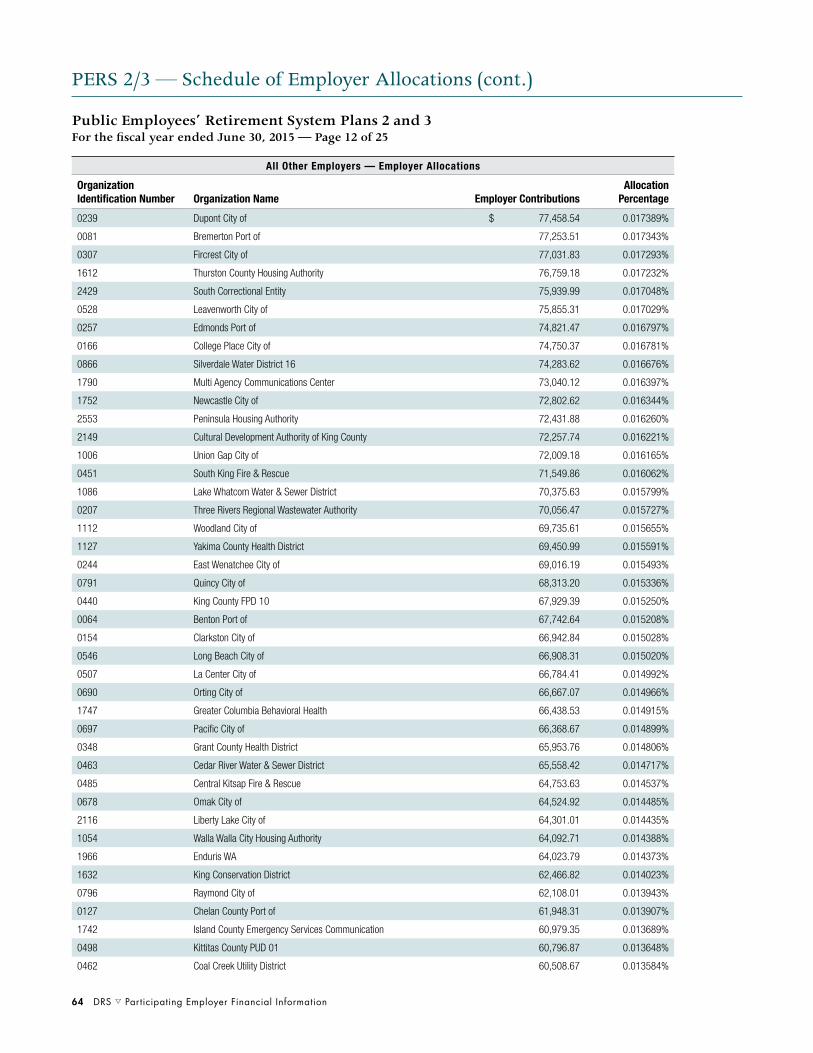
64 DRS s Participating Employer Financial Information
PERS 2/3 — Schedule of Employer Allocations (cont.)
All Other Employers — Employer Allocations
Organization Identification Number Organization Name Employer Contributions
Allocation Percentage
0239 Dupont City of $ 77,458.54 0.017389%
0081 Bremerton Port of 77,253.51 0.017343%
0307 Fircrest City of 77,031.83 0.017293%
1612 Thurston County Housing Authority 76,759.18 0.017232%
2429 South Correctional Entity 75,939.99 0.017048%
0528 Leavenworth City of 75,855.31 0.017029%
0257 Edmonds Port of 74,821.47 0.016797%
0166 College Place City of 74,750.37 0.016781%
0866 Silverdale Water District 16 74,283.62 0.016676%
1790 Multi Agency Communications Center 73,040.12 0.016397%
1752 Newcastle City of 72,802.62 0.016344%
2553 Peninsula Housing Authority 72,431.88 0.016260%
2149 Cultural Development Authority of King County 72,257.74 0.016221%
1006 Union Gap City of 72,009.18 0.016165%
0451 South King Fire & Rescue 71,549.86 0.016062%
1086 Lake Whatcom Water & Sewer District 70,375.63 0.015799%
0207 Three Rivers Regional Wastewater Authority 70,056.47 0.015727%
1112 Woodland City of 69,735.61 0.015655%
1127 Yakima County Health District 69,450.99 0.015591%
0244 East Wenatchee City of 69,016.19 0.015493%
0791 Quincy City of 68,313.20 0.015336%
0440 King County FPD 10 67,929.39 0.015250%
0064 Benton Port of 67,742.64 0.015208%
0154 Clarkston City of 66,942.84 0.015028%
0546 Long Beach City of 66,908.31 0.015020%
0507 La Center City of 66,784.41 0.014992%
0690 Orting City of 66,667.07 0.014966%
1747 Greater Columbia Behavioral Health 66,438.53 0.014915%
0697 Pacific City of 66,368.67 0.014899%
0348 Grant County Health District 65,953.76 0.014806%
0463 Cedar River Water & Sewer District 65,558.42 0.014717%
0485 Central Kitsap Fire & Rescue 64,753.63 0.014537%
0678 Omak City of 64,524.92 0.014485%
2116 Liberty Lake City of 64,301.01 0.014435%
1054 Walla Walla City Housing Authority 64,092.71 0.014388%
1966 Enduris WA 64,023.79 0.014373%
1632 King Conservation District 62,466.82 0.014023%
0796 Raymond City of 62,108.01 0.013943%
0127 Chelan County Port of 61,948.31 0.013907%
1742 Island County Emergency Services Communication 60,979.35 0.013689%
0498 Kittitas County PUD 01 60,796.87 0.013648%
0462 Coal Creek Utility District 60,508.67 0.013584%
Public Employees’ Retirement System Plans 2 and 3For the fiscal year ended June 30, 2015 — Page 12 of 25

Participating Employer Financial Information s DRS 65
PERS 2/3 — Schedule of Employer Allocations
All Other Employers — Employer Allocations
Organization Identification Number Organization Name Employer Contributions
Allocation Percentage
0071 Black Diamond City of $ 60,013.27 0.013472%
1608 Thurston Regional Planning Council 59,569.74 0.013373%
0605 Montesano City of 58,815.76 0.013204%
0916 Spokane Valley Fire Department 58,744.70 0.013188%
1080 Westport City of 57,754.32 0.012965%
1694 Snohomish Conservation District 57,495.15 0.012907%
0674 Olympic Region Clean Air Agency 57,397.98 0.012885%
0915 Spokane Regional Clean Air Agency 57,094.06 0.012817%
1024 Valley View Sewer District 56,817.83 0.012755%
0245 East Wenatchee Water District 56,754.54 0.012741%
0951 Sultan City of 55,531.63 0.012466%
1695 KITTCOM 54,992.91 0.012345%
0583 Medina City of 54,938.13 0.012333%
0423 Kalama Port of 54,901.64 0.012325%
2004 Grays Harbor Communications 54,600.02 0.012257%
0479 North City Water District 54,458.50 0.012225%
1754 San Juan Island Emergency Medical Services 53,184.09 0.011939%
2281 Grant Transit Authority 52,982.74 0.011894%
2237 Valley Regional Fire Authority 52,780.85 0.011849%
0357 Grays Harbor County Housing Authority 52,347.72 0.011752%
0610 Moses Lake Port of 51,764.56 0.011621%
1057 Wapato City of 51,377.29 0.011534%
0070 Birch Bay Water & Sewer District 51,341.08 0.011526%
1761 Asotin County PUD 01 50,908.20 0.011428%
0818 Ronald Wastewater District 50,806.94 0.011406%
0830 SW Clean Air Agency 50,696.32 0.011381%
1593 Spokane County FPD 04 50,476.24 0.011331%
0627 North Perry Avenue Water District 49,650.54 0.011146%
2235 Friday Harbor Port of 49,398.48 0.011090%
0886 Snohomish County FPD 03 49,260.53 0.011059%
0535 Lewis PTBA 48,092.89 0.010796%
0578 McCleary City of 48,065.76 0.010790%
2556 Mason County Emergency Communications 47,871.18 0.010747%
1098 Whitworth Water District 02 47,791.65 0.010729%
0500 Kittitas Reclamation District 46,943.03 0.010538%
0452 Shoreline Fire Department 46,857.34 0.010519%
1129 Yakima-Tieton Irrigation District 46,792.54 0.010504%
0134 Chewelah City of 46,531.29 0.010446%
1958 Wine Commission* 46,118.12 0.010353%
0157 Cle Elum City of 45,975.77 0.010321%
Public Employees’ Retirement System Plans 2 and 3For the fiscal year ended June 30, 2015 — Page 13 of 25
* This employer is not included in the Office of Financial Management’s financial reporting for the state of Washington.
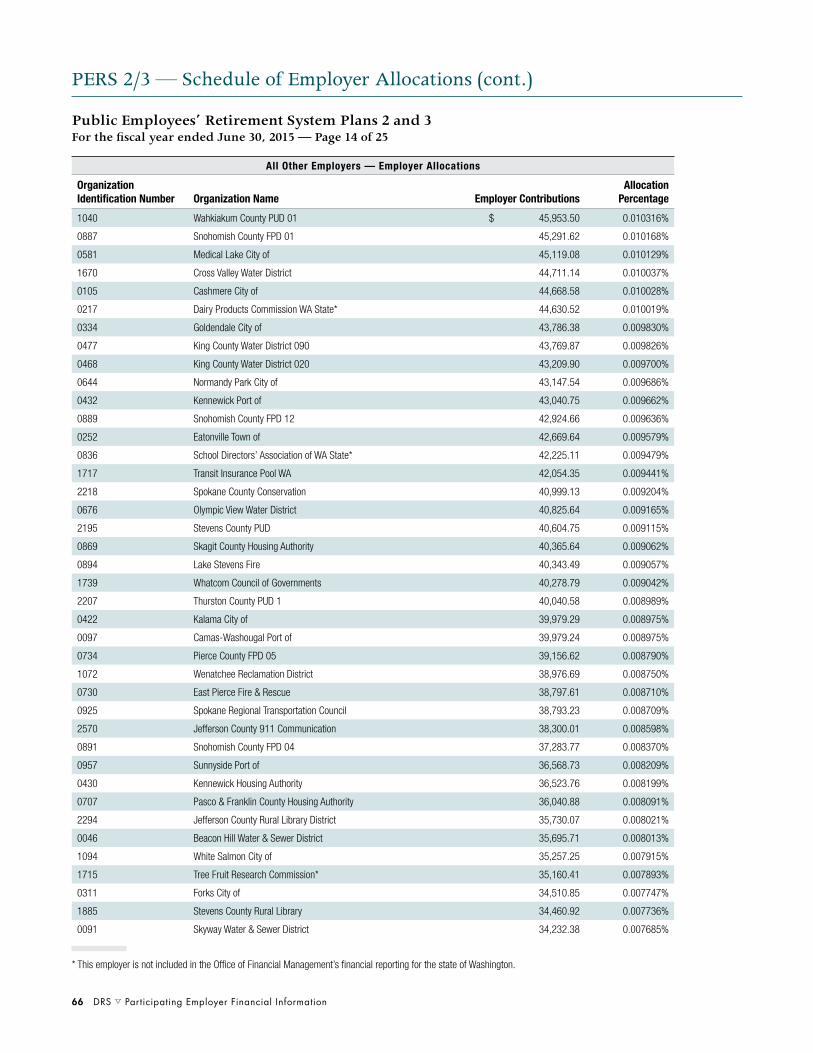
66 DRS s Participating Employer Financial Information
PERS 2/3 — Schedule of Employer Allocations (cont.)
All Other Employers — Employer Allocations
Organization Identification Number Organization Name Employer Contributions
Allocation Percentage
1040 Wahkiakum County PUD 01 $ 45,953.50 0.010316%
0887 Snohomish County FPD 01 45,291.62 0.010168%
0581 Medical Lake City of 45,119.08 0.010129%
1670 Cross Valley Water District 44,711.14 0.010037%
0105 Cashmere City of 44,668.58 0.010028%
0217 Dairy Products Commission WA State* 44,630.52 0.010019%
0334 Goldendale City of 43,786.38 0.009830%
0477 King County Water District 090 43,769.87 0.009826%
0468 King County Water District 020 43,209.90 0.009700%
0644 Normandy Park City of 43,147.54 0.009686%
0432 Kennewick Port of 43,040.75 0.009662%
0889 Snohomish County FPD 12 42,924.66 0.009636%
0252 Eatonville Town of 42,669.64 0.009579%
0836 School Directors’ Association of WA State* 42,225.11 0.009479%
1717 Transit Insurance Pool WA 42,054.35 0.009441%
2218 Spokane County Conservation 40,999.13 0.009204%
0676 Olympic View Water District 40,825.64 0.009165%
2195 Stevens County PUD 40,604.75 0.009115%
0869 Skagit County Housing Authority 40,365.64 0.009062%
0894 Lake Stevens Fire 40,343.49 0.009057%
1739 Whatcom Council of Governments 40,278.79 0.009042%
2207 Thurston County PUD 1 40,040.58 0.008989%
0422 Kalama City of 39,979.29 0.008975%
0097 Camas-Washougal Port of 39,979.24 0.008975%
0734 Pierce County FPD 05 39,156.62 0.008790%
1072 Wenatchee Reclamation District 38,976.69 0.008750%
0730 East Pierce Fire & Rescue 38,797.61 0.008710%
0925 Spokane Regional Transportation Council 38,793.23 0.008709%
2570 Jefferson County 911 Communication 38,300.01 0.008598%
0891 Snohomish County FPD 04 37,283.77 0.008370%
0957 Sunnyside Port of 36,568.73 0.008209%
0430 Kennewick Housing Authority 36,523.76 0.008199%
0707 Pasco & Franklin County Housing Authority 36,040.88 0.008091%
2294 Jefferson County Rural Library District 35,730.07 0.008021%
0046 Beacon Hill Water & Sewer District 35,695.71 0.008013%
1094 White Salmon City of 35,257.25 0.007915%
1715 Tree Fruit Research Commission* 35,160.41 0.007893%
0311 Forks City of 34,510.85 0.007747%
1885 Stevens County Rural Library 34,460.92 0.007736%
0091 Skyway Water & Sewer District 34,232.38 0.007685%
Public Employees’ Retirement System Plans 2 and 3For the fiscal year ended June 30, 2015 — Page 14 of 25
* This employer is not included in the Office of Financial Management’s financial reporting for the state of Washington.

Participating Employer Financial Information s DRS 67
PERS 2/3 — Schedule of Employer Allocations
All Other Employers — Employer Allocations
Organization Identification Number Organization Name Employer Contributions
Allocation Percentage
2036 Snohomish County Emergency Radio System $ 34,222.91 0.007683%
2189 Si View Metropolitan Park District 34,175.31 0.007672%
0171 Columbia Irrigation District 34,137.09 0.007663%
1969 North County Regional Fire Authority 33,930.17 0.007617%
0182 Connell City of 33,041.13 0.007417%
0700 Pacific Transit System 32,992.54 0.007407%
0271 Elma City of 32,904.32 0.007387%
1452 NE Sammamish Sewer & Water District 32,880.98 0.007381%
0486 North Kitsap Fire & Rescue 32,504.81 0.007297%
0022 Apple Commission WA State* 32,326.18 0.007257%
2538 Spokane County Water District 03 32,227.59 0.007235%
0162 Clyde Hill City of 32,166.43 0.007221%
0513 Lake Chelan Reclamation District 31,841.15 0.007148%
0666 Okanogan City of 31,508.23 0.007073%
0464 King County Water District 111 31,314.17 0.007030%
0980 Thurston County FPD 03 30,928.61 0.006943%
0948 Stevenson City of 30,924.36 0.006942%
0470 King County Water District 049 30,716.20 0.006896%
2602 Chelan County Wenatchee Housing Authority 30,634.91 0.006877%
1136 Zillah City of 30,543.24 0.006857%
0236 Douglas County Sewer District 01 30,481.70 0.006843%
0107 Castle Rock City of 30,378.10 0.006820%
0164 Colfax City of 30,376.23 0.006819%
0088 Brier City of 29,957.32 0.006725%
0488 South Kitsap Fire & Rescue 29,859.66 0.006703%
2213 Peninsula Metropolitan Park District 29,739.81 0.006676%
0952 Sumas City of 29,664.89 0.006659%
0689 Oroville City of 29,529.80 0.006629%
1060 Warden City of 29,326.25 0.006583%
2172 Yakima Regional Clean Air Agency 29,253.74 0.006567%
2256 Columbia County Public Transportation 29,029.22 0.006517%
0465 King County Water District 125 29,024.75 0.006516%
1047 Walla Walla Regional Airport 28,872.50 0.006482%
2228 Edmonds Public Facilities District 28,788.16 0.006463%
1605 WA Counties Risk Pool 28,757.93 0.006456%
0862 Shelton Port of 28,586.51 0.006417%
2260 WA Counties Insurance Fund 28,498.72 0.006398%
0226 Deer Park City of 27,986.99 0.006283%
0345 Granite Falls City of 27,985.82 0.006283%
2468 Kittitas County Public Hospital District 2 27,520.62 0.006178%
Public Employees’ Retirement System Plans 2 and 3For the fiscal year ended June 30, 2015 — Page 15 of 25
* This employer is not included in the Office of Financial Management’s financial reporting for the state of Washington.

68 DRS s Participating Employer Financial Information
PERS 2/3 — Schedule of Employer Allocations (cont.)
All Other Employers — Employer Allocations
Organization Identification Number Organization Name Employer Contributions
Allocation Percentage
0200 Coupeville Town of $ 27,414.45 0.006154%
0138 Clallam County FPD 03 27,238.54 0.006115%
2241 South Central Workforce Council 27,233.45 0.006114%
2284 Cascadia Conservation District 27,078.82 0.006079%
0693 Othello Housing Authority 26,404.75 0.005928%
0395 Ilwaco City of 26,231.51 0.005889%
0143 Clark County Fire & Rescue 26,182.36 0.005878%
0524 Langley City of 26,116.49 0.005863%
0509 La Conner Town of 26,093.27 0.005858%
0186 Consolidated Diking Improvement District 01 26,009.61 0.005839%
0203 Cowlitz County FPD 02 25,970.38 0.005830%
0016 Algona City of 25,910.28 0.005817%
0085 Brewster City of 25,692.60 0.005768%
1676 San Juan Island County Library 25,600.78 0.005747%
0759 Potato Commission WA State* 25,594.14 0.005746%
0638 Newport City of 25,466.05 0.005717%
0919 Spokane County FPD 09 25,366.99 0.005695%
0209 Cowlitz-Wahkiakum Council of Governments 25,270.22 0.005673%
0224 Dayton City of 25,043.93 0.005622%
0058 Benton City City of 24,762.08 0.005559%
0410 North Whidbey Fire & Rescue 24,717.31 0.005549%
2547 Walla Walla Joint Community Development Agency 24,698.18 0.005545%
0729 Pierce County FPD 21 24,627.60 0.005529%
0907 South Bend City of 24,626.91 0.005529%
0458 King County Law Library 24,535.41 0.005508%
0918 Spokane County FPD 08 24,253.21 0.005445%
0343 Granger Town of 24,234.49 0.005440%
0450 Woodinville Fire & Rescue 23,943.59 0.005375%
1052 Walla Walla County Rural Library District 23,812.60 0.005346%
1766 Ridgefield Port of 23,630.72 0.005305%
1090 Grain Commission WA* 23,609.70 0.005300%
0100 Carnation City of 23,599.13 0.005298%
1759 Valley Water District 23,364.08 0.005245%
1800 Edgewood City of 23,247.21 0.005219%
0293 Everson City of 22,913.11 0.005144%
0893 Snohomish County FPD 07 22,843.79 0.005128%
1467 North Country Emergency Medical Services 22,509.04 0.005053%
1718 Island County FPD 01 22,383.83 0.005025%
0193 Cosmopolis City of 22,285.21 0.005003%
0628 Naches-Selah Irrigation District 22,127.82 0.004967%
Public Employees’ Retirement System Plans 2 and 3For the fiscal year ended June 30, 2015 — Page 16 of 25
* This employer is not included in the Office of Financial Management’s financial reporting for the state of Washington.
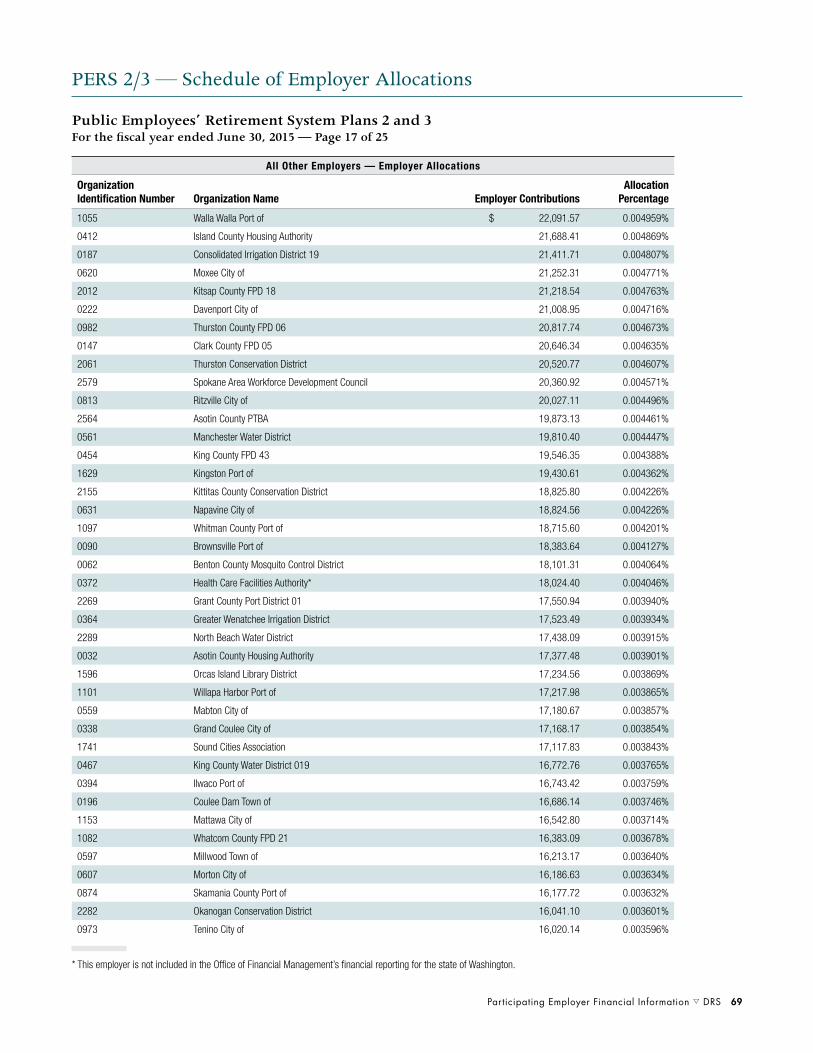
Participating Employer Financial Information s DRS 69
PERS 2/3 — Schedule of Employer Allocations
All Other Employers — Employer Allocations
Organization Identification Number Organization Name Employer Contributions
Allocation Percentage
1055 Walla Walla Port of $ 22,091.57 0.004959%
0412 Island County Housing Authority 21,688.41 0.004869%
0187 Consolidated Irrigation District 19 21,411.71 0.004807%
0620 Moxee City of 21,252.31 0.004771%
2012 Kitsap County FPD 18 21,218.54 0.004763%
0222 Davenport City of 21,008.95 0.004716%
0982 Thurston County FPD 06 20,817.74 0.004673%
0147 Clark County FPD 05 20,646.34 0.004635%
2061 Thurston Conservation District 20,520.77 0.004607%
2579 Spokane Area Workforce Development Council 20,360.92 0.004571%
0813 Ritzville City of 20,027.11 0.004496%
2564 Asotin County PTBA 19,873.13 0.004461%
0561 Manchester Water District 19,810.40 0.004447%
0454 King County FPD 43 19,546.35 0.004388%
1629 Kingston Port of 19,430.61 0.004362%
2155 Kittitas County Conservation District 18,825.80 0.004226%
0631 Napavine City of 18,824.56 0.004226%
1097 Whitman County Port of 18,715.60 0.004201%
0090 Brownsville Port of 18,383.64 0.004127%
0062 Benton County Mosquito Control District 18,101.31 0.004064%
0372 Health Care Facilities Authority* 18,024.40 0.004046%
2269 Grant County Port District 01 17,550.94 0.003940%
0364 Greater Wenatchee Irrigation District 17,523.49 0.003934%
2289 North Beach Water District 17,438.09 0.003915%
0032 Asotin County Housing Authority 17,377.48 0.003901%
1596 Orcas Island Library District 17,234.56 0.003869%
1101 Willapa Harbor Port of 17,217.98 0.003865%
0559 Mabton City of 17,180.67 0.003857%
0338 Grand Coulee City of 17,168.17 0.003854%
1741 Sound Cities Association 17,117.83 0.003843%
0467 King County Water District 019 16,772.76 0.003765%
0394 Ilwaco Port of 16,743.42 0.003759%
0196 Coulee Dam Town of 16,686.14 0.003746%
1153 Mattawa City of 16,542.80 0.003714%
1082 Whatcom County FPD 21 16,383.09 0.003678%
0597 Millwood Town of 16,213.17 0.003640%
0607 Morton City of 16,186.63 0.003634%
0874 Skamania County Port of 16,177.72 0.003632%
2282 Okanogan Conservation District 16,041.10 0.003601%
0973 Tenino City of 16,020.14 0.003596%
Public Employees’ Retirement System Plans 2 and 3For the fiscal year ended June 30, 2015 — Page 17 of 25
* This employer is not included in the Office of Financial Management’s financial reporting for the state of Washington.
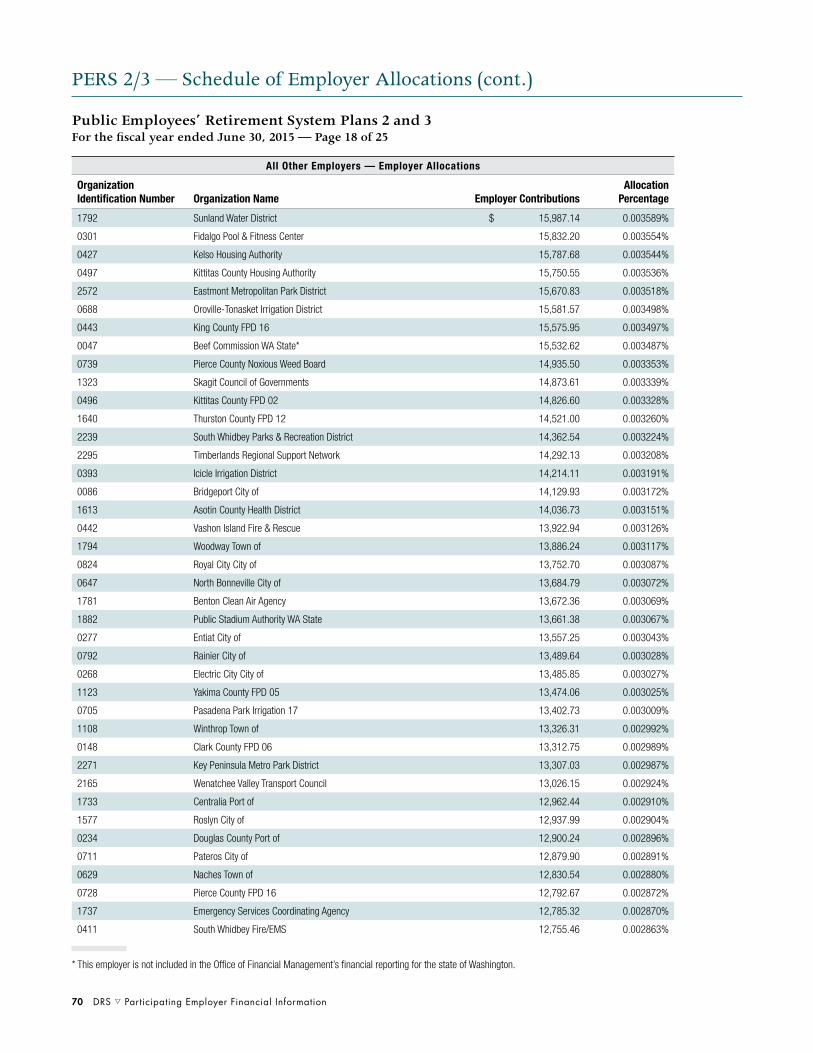
70 DRS s Participating Employer Financial Information
PERS 2/3 — Schedule of Employer Allocations (cont.)
All Other Employers — Employer Allocations
Organization Identification Number Organization Name Employer Contributions
Allocation Percentage
1792 Sunland Water District $ 15,987.14 0.003589%
0301 Fidalgo Pool & Fitness Center 15,832.20 0.003554%
0427 Kelso Housing Authority 15,787.68 0.003544%
0497 Kittitas County Housing Authority 15,750.55 0.003536%
2572 Eastmont Metropolitan Park District 15,670.83 0.003518%
0688 Oroville-Tonasket Irrigation District 15,581.57 0.003498%
0443 King County FPD 16 15,575.95 0.003497%
0047 Beef Commission WA State* 15,532.62 0.003487%
0739 Pierce County Noxious Weed Board 14,935.50 0.003353%
1323 Skagit Council of Governments 14,873.61 0.003339%
0496 Kittitas County FPD 02 14,826.60 0.003328%
1640 Thurston County FPD 12 14,521.00 0.003260%
2239 South Whidbey Parks & Recreation District 14,362.54 0.003224%
2295 Timberlands Regional Support Network 14,292.13 0.003208%
0393 Icicle Irrigation District 14,214.11 0.003191%
0086 Bridgeport City of 14,129.93 0.003172%
1613 Asotin County Health District 14,036.73 0.003151%
0442 Vashon Island Fire & Rescue 13,922.94 0.003126%
1794 Woodway Town of 13,886.24 0.003117%
0824 Royal City City of 13,752.70 0.003087%
0647 North Bonneville City of 13,684.79 0.003072%
1781 Benton Clean Air Agency 13,672.36 0.003069%
1882 Public Stadium Authority WA State 13,661.38 0.003067%
0277 Entiat City of 13,557.25 0.003043%
0792 Rainier City of 13,489.64 0.003028%
0268 Electric City City of 13,485.85 0.003027%
1123 Yakima County FPD 05 13,474.06 0.003025%
0705 Pasadena Park Irrigation 17 13,402.73 0.003009%
1108 Winthrop Town of 13,326.31 0.002992%
0148 Clark County FPD 06 13,312.75 0.002989%
2271 Key Peninsula Metro Park District 13,307.03 0.002987%
2165 Wenatchee Valley Transport Council 13,026.15 0.002924%
1733 Centralia Port of 12,962.44 0.002910%
1577 Roslyn City of 12,937.99 0.002904%
0234 Douglas County Port of 12,900.24 0.002896%
0711 Pateros City of 12,879.90 0.002891%
0629 Naches Town of 12,830.54 0.002880%
0728 Pierce County FPD 16 12,792.67 0.002872%
1737 Emergency Services Coordinating Agency 12,785.32 0.002870%
0411 South Whidbey Fire/EMS 12,755.46 0.002863%
Public Employees’ Retirement System Plans 2 and 3For the fiscal year ended June 30, 2015 — Page 18 of 25
* This employer is not included in the Office of Financial Management’s financial reporting for the state of Washington.

Participating Employer Financial Information s DRS 71
PERS 2/3 — Schedule of Employer Allocations
All Other Employers — Employer Allocations
Organization Identification Number Organization Name Employer Contributions
Allocation Percentage
0109 Cathlamet Town of $ 12,735.58 0.002859%
0990 Tonasket City of 12,721.20 0.002856%
2226 Moses Lake Irrigation & Rehab District 12,716.23 0.002855%
1005 Twisp Town of 12,698.23 0.002851%
0904 Soap Lake City of 12,682.24 0.002847%
0069 Bingen City of 12,668.39 0.002844%
0350 Grant County Noxious Weed Board 12,634.38 0.002836%
0315 Franklin County Irrigation District 01 12,629.87 0.002835%
0444 King County FPD 02 12,377.91 0.002779%
1105 Winlock City of 12,115.64 0.002720%
1095 Whitman County Rural Library 12,104.26 0.002717%
2051 Eastsound Sewer & Water District 11,973.39 0.002688%
0455 King County FPD 44 11,855.18 0.002661%
1045 Waitsburg City of 11,701.11 0.002627%
0999 Trentwood Irrigation District 11,572.18 0.002598%
1563 King County FPD 45 11,442.52 0.002569%
2220 Franklin County Mosquito Control District 11,385.88 0.002556%
0155 Clarkston Port of 11,369.31 0.002552%
1466 Anacortes Housing Authority 11,342.49 0.002546%
1087 Samish Water District 11,256.38 0.002527%
1602 Central Whidbey Island Fire & Rescue 11,174.20 0.002509%
1828 Franklin County Emergency Management 11,124.92 0.002497%
0665 Odessa Town of 10,991.83 0.002468%
1068 Waterville Town of 10,950.07 0.002458%
2136 Lynnwood Public Facilities District 10,890.33 0.002445%
0030 Asotin City of 10,858.42 0.002438%
1686 Tricounty Economic Development District 10,733.44 0.002410%
0445 King County FPD 20 10,579.52 0.002375%
1614 Lopez Island Library District 10,502.31 0.002358%
0669 Okanogan Irrigation District 10,320.63 0.002317%
0409 Irvin Water District 06 10,316.55 0.002316%
1721 East County Fire & Rescue 10,230.71 0.002297%
1757 Klickitat Port of 10,166.89 0.002282%
0806 Republic City of 10,087.88 0.002265%
1709 Pend Oreille Library 10,001.57 0.002245%
1567 Pacific County FPD 01 9,951.07 0.002234%
0683 Orchard Avenue Irrigation District 9,922.29 0.002227%
2038 San Juan Island Park & Recreation District 9,920.84 0.002227%
1810 Snohomish County FPD 22 9,881.66 0.002218%
0987 Toledo City of 9,792.19 0.002198%
1592 Water & Sewer Insurance Pool 9,779.97 0.002196%
2003 Grays Harbor Council of Governments 9,724.19 0.002183%
Public Employees’ Retirement System Plans 2 and 3For the fiscal year ended June 30, 2015 — Page 19 of 25

72 DRS s Participating Employer Financial Information
PERS 2/3 — Schedule of Employer Allocations (cont.)
All Other Employers — Employer Allocations
Organization Identification Number Organization Name Employer Contributions
Allocation Percentage
0471 King County Water District 054 $ 9,701.63 0.002178%
1688 Rock Island City of 9,622.96 0.002160%
1703 Fall City Water District 9,616.64 0.002159%
0495 Kittitas City of 9,532.14 0.002140%
2597 Chehalis Port of 9,498.95 0.002132%
0642 Nooksack City of 9,408.52 0.002112%
0901 Snoqualmie Pass Utility District 9,400.56 0.002110%
1743 East Spokane Water District 01 9,372.75 0.002104%
2599 Lower Columbia Fish Recovery Board 9,365.10 0.002102%
0995 Concrete Town of 9,056.26 0.002033%
0333 Gold Bar City of 9,041.12 0.002030%
1639 Clallam Conservation District 8,945.13 0.002008%
1841 Cowlitz Conservation District 8,752.75 0.001965%
0947 Stevens Pass Sewer District 8,702.80 0.001954%
0220 Darrington Town of 8,546.08 0.001919%
1133 Yarrow Point Town of 8,495.04 0.001907%
1822 Chelan County FPD 07 8,457.73 0.001899%
1767 Spokane County Noxious Weed Control Board 8,428.17 0.001892%
1693 King County Water District 119 8,361.17 0.001877%
0283 Grant County Port District 09 8,339.52 0.001872%
0383 Hop Commission WA State* 8,334.67 0.001871%
0102 Cascade Irrigation District 8,330.22 0.001870%
1932 Selah-Moxee Irrigation District 8,308.97 0.001865%
1459 Terrace Heights Sewer District 8,289.06 0.001861%
2119 Pacific Conservation District 8,073.16 0.001812%
0985 Tieton City of 8,053.75 0.001808%
0879 Skykomish Town of 8,014.02 0.001799%
1744 Pierce County Law Library 7,499.91 0.001684%
2266 Manson Parks & Recreation District 7,471.14 0.001677%
1621 Pierce County FPD 17 7,335.22 0.001647%
1708 Columbia Mosquito Control District 7,293.23 0.001637%
1606 Carbonado Town of 7,237.85 0.001625%
0160 Clinton Water District 7,170.48 0.001610%
2594 Asotin County Public Facilities District 7,164.66 0.001608%
2587 Okanogan County Housing Authority 7,115.59 0.001597%
2137 Belfair Water District 1 7,095.63 0.001593%
0233 Douglas County FPD 02 7,037.25 0.001580%
0799 Reardan Town of 6,937.27 0.001557%
0748 Point Roberts Water District 04 6,929.77 0.001556%
0601 Model Irrigation District 18 6,904.08 0.001550%
Public Employees’ Retirement System Plans 2 and 3For the fiscal year ended June 30, 2015 — Page 20 of 25
* This employer is not included in the Office of Financial Management’s financial reporting for the state of Washington.

Participating Employer Financial Information s DRS 73
PERS 2/3 — Schedule of Employer Allocations
All Other Employers — Employer Allocations
Organization Identification Number Organization Name Employer Contributions
Allocation Percentage
0970 Tekoa City of $ 6,887.76 0.001546%
0059 Benton County FPD 01 6,878.60 0.001544%
0917 Spokane County FPD 03 6,866.42 0.001541%
0983 Thurston County FPD 09 6,739.37 0.001513%
1615 Garfield County Health District 6,687.86 0.001501%
0828 Ruston Town of 6,648.46 0.001493%
1288 Columbia Port of 6,621.49 0.001486%
1454 North Spokane Irrigation District 6,547.17 0.001470%
1355 Moab Irrigation District 20 6,495.92 0.001458%
2063 Holmes Harbor Sewer District 6,489.38 0.001457%
1117 Yacolt Town of 6,446.11 0.001447%
1749 Stevens County FPD 01 6,404.45 0.001438%
1163 Garfield Town of 6,342.67 0.001424%
2296 Walla Walla Watershed Management 6,340.33 0.001423%
0063 Benton Irrigation District 6,286.41 0.001411%
1887 Jefferson County FPD 01 6,228.36 0.001398%
2585 North Mason Regional Fire Authority 6,224.22 0.001397%
2170 Lewis County FPD 02 6,173.97 0.001386%
0544 Lind Town of 6,169.88 0.001385%
0475 Lake Forest Park Water District 6,153.32 0.001381%
1804 Loon Lake Sewer District 04 6,143.06 0.001379%
2428 SE Thurston Fire Authority 6,136.99 0.001378%
1575 Stevens County Conservation District 5,987.00 0.001344%
2192 Columbia Valley Water District 5,928.41 0.001331%
1812 WA Economic Development Finance Authority* 5,806.82 0.001304%
1465 Glacier Water District 5,798.84 0.001302%
0572 Mason County FPD 05 5,779.22 0.001297%
0083 Brewster Flat Irrigation District 5,526.79 0.001241%
1914 South Cle Elum Town of 5,497.68 0.001234%
1083 Whatcom County FPD 07 5,445.24 0.001222%
2164 Upper Skagit Library District 5,437.53 0.001221%
0927 Sprague City of 5,437.01 0.001221%
2431 King County FPD 28 5,388.42 0.001210%
2248 Columbia County Rural Library District 5,364.79 0.001204%
0563 Mansfield Town of 5,327.26 0.001196%
1874 Peninsula Port of 5,293.36 0.001188%
0823 Roy City of 5,252.27 0.001179%
0612 Mossyrock City of 5,125.74 0.001151%
0126 Chelan County FPD 01 5,105.47 0.001146%
1599 Woodland Port of 5,085.78 0.001142%
Public Employees’ Retirement System Plans 2 and 3For the fiscal year ended June 30, 2015 — Page 21 of 25
* This employer is not included in the Office of Financial Management’s financial reporting for the state of Washington.

74 DRS s Participating Employer Financial Information
PERS 2/3 — Schedule of Employer Allocations (cont.)
All Other Employers — Employer Allocations
Organization Identification Number Organization Name Employer Contributions
Allocation Percentage
0346 Grant County FPD 03 $ 5,006.65 0.001124%
2025 Snohomish County FPD 26 5,005.26 0.001124%
1436 Coulee City Town of 4,886.54 0.001097%
1324 George City of 4,859.54 0.001091%
1826 Wahkiakum County Port District 01 4,741.96 0.001065%
1638 Whitestone Reclamation District 4,447.08 0.000998%
1740 La Conner Regional Library 4,418.14 0.000992%
1832 Orcas Port of 4,354.90 0.000978%
1122 Yakima County FPD 12 4,351.00 0.000977%
0183 Consolidated Diking Improvement District 02 4,348.81 0.000976%
1494 South Whatcom Fire Authority 4,336.30 0.000973%
2268 Riverside Fire Authority 4,264.36 0.000957%
1437 San Juan County FPD 03 4,197.71 0.000942%
0694 Othello Port of 4,168.21 0.000936%
1755 Diamond Lake Water & Sewer District 4,134.97 0.000928%
0216 Cusick Town of 4,116.21 0.000924%
2047 Coalition for Clean Water 3,972.19 0.000892%
1834 Columbia Conservation District 3,971.11 0.000891%
0821 Rosalia Town of 3,910.65 0.000878%
0441 North Highline Fire District 3,862.14 0.000867%
1103 Willapa Valley Water District 3,841.39 0.000862%
1675 Springdale Town of 3,791.65 0.000851%
1458 Cowlitz County FPD 05 3,789.46 0.000851%
2330 Conconully Town of 3,764.71 0.000845%
2607 Okanogan County Transit Authority 3,763.32 0.000845%
0726 Pierce County FPD 10 3,745.72 0.000841%
1802 Chelan County FPD 09 3,743.45 0.000840%
1972 Spangle Town of 3,735.40 0.000839%
0006 Adams County Mosquito District 3,729.60 0.000837%
1845 Spokane County Law Library 3,727.01 0.000837%
0659 Oakville City of 3,725.46 0.000836%
2593 Central Skagit Rural Library District 3,719.76 0.000835%
2002 South Beach Ambulance Service 3,610.74 0.000811%
0868 Skagit County Cemetery District 02 3,595.43 0.000807%
1793 Elmer City Town of 3,557.40 0.000799%
0657 Oakesdale Town of 3,537.26 0.000794%
2540 Dallesport Water District 3,524.30 0.000791%
0977 Thurston County FPD 08 3,465.84 0.000778%
1786 Colton Town of 3,376.62 0.000758%
2285 Skagit County FPD 06 3,343.03 0.000750%
2387 West Thurston Regional Fire Authority 3,325.42 0.000747%
Public Employees’ Retirement System Plans 2 and 3For the fiscal year ended June 30, 2015 — Page 22 of 25
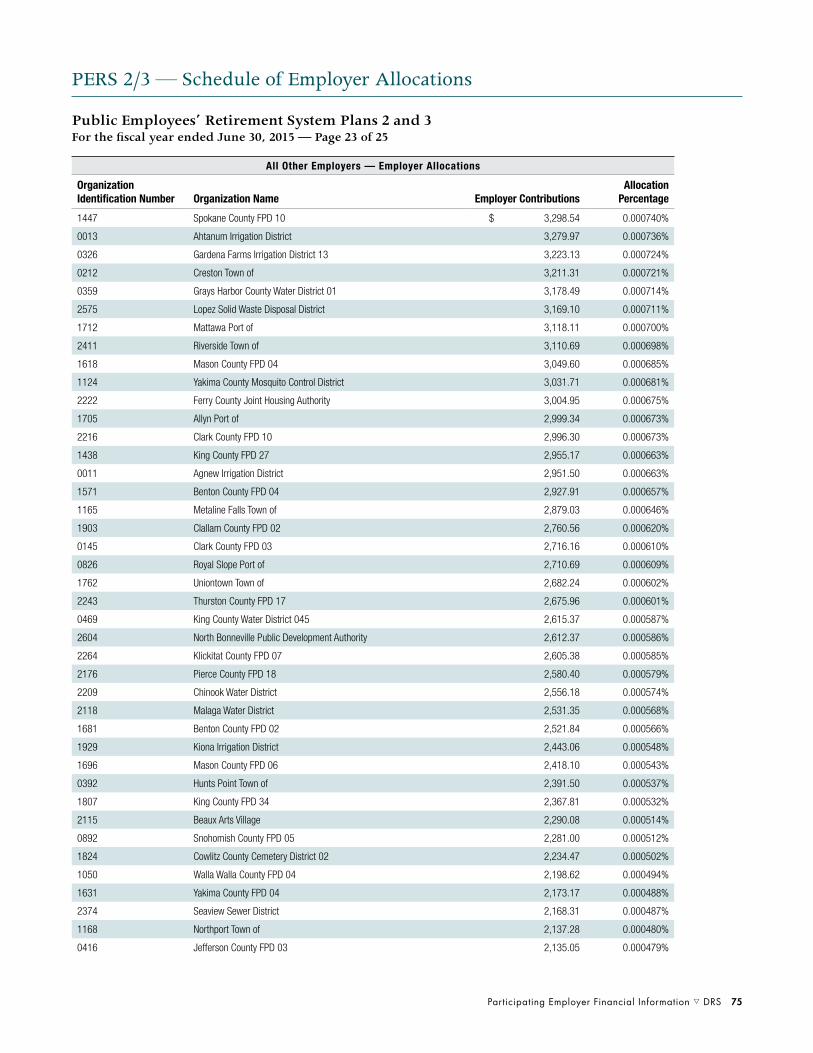
Participating Employer Financial Information s DRS 75
PERS 2/3 — Schedule of Employer Allocations
All Other Employers — Employer Allocations
Organization Identification Number Organization Name Employer Contributions
Allocation Percentage
1447 Spokane County FPD 10 $ 3,298.54 0.000740%
0013 Ahtanum Irrigation District 3,279.97 0.000736%
0326 Gardena Farms Irrigation District 13 3,223.13 0.000724%
0212 Creston Town of 3,211.31 0.000721%
0359 Grays Harbor County Water District 01 3,178.49 0.000714%
2575 Lopez Solid Waste Disposal District 3,169.10 0.000711%
1712 Mattawa Port of 3,118.11 0.000700%
2411 Riverside Town of 3,110.69 0.000698%
1618 Mason County FPD 04 3,049.60 0.000685%
1124 Yakima County Mosquito Control District 3,031.71 0.000681%
2222 Ferry County Joint Housing Authority 3,004.95 0.000675%
1705 Allyn Port of 2,999.34 0.000673%
2216 Clark County FPD 10 2,996.30 0.000673%
1438 King County FPD 27 2,955.17 0.000663%
0011 Agnew Irrigation District 2,951.50 0.000663%
1571 Benton County FPD 04 2,927.91 0.000657%
1165 Metaline Falls Town of 2,879.03 0.000646%
1903 Clallam County FPD 02 2,760.56 0.000620%
0145 Clark County FPD 03 2,716.16 0.000610%
0826 Royal Slope Port of 2,710.69 0.000609%
1762 Uniontown Town of 2,682.24 0.000602%
2243 Thurston County FPD 17 2,675.96 0.000601%
0469 King County Water District 045 2,615.37 0.000587%
2604 North Bonneville Public Development Authority 2,612.37 0.000586%
2264 Klickitat County FPD 07 2,605.38 0.000585%
2176 Pierce County FPD 18 2,580.40 0.000579%
2209 Chinook Water District 2,556.18 0.000574%
2118 Malaga Water District 2,531.35 0.000568%
1681 Benton County FPD 02 2,521.84 0.000566%
1929 Kiona Irrigation District 2,443.06 0.000548%
1696 Mason County FPD 06 2,418.10 0.000543%
0392 Hunts Point Town of 2,391.50 0.000537%
1807 King County FPD 34 2,367.81 0.000532%
2115 Beaux Arts Village 2,290.08 0.000514%
0892 Snohomish County FPD 05 2,281.00 0.000512%
1824 Cowlitz County Cemetery District 02 2,234.47 0.000502%
1050 Walla Walla County FPD 04 2,198.62 0.000494%
1631 Yakima County FPD 04 2,173.17 0.000488%
2374 Seaview Sewer District 2,168.31 0.000487%
1168 Northport Town of 2,137.28 0.000480%
0416 Jefferson County FPD 03 2,135.05 0.000479%
Public Employees’ Retirement System Plans 2 and 3For the fiscal year ended June 30, 2015 — Page 23 of 25
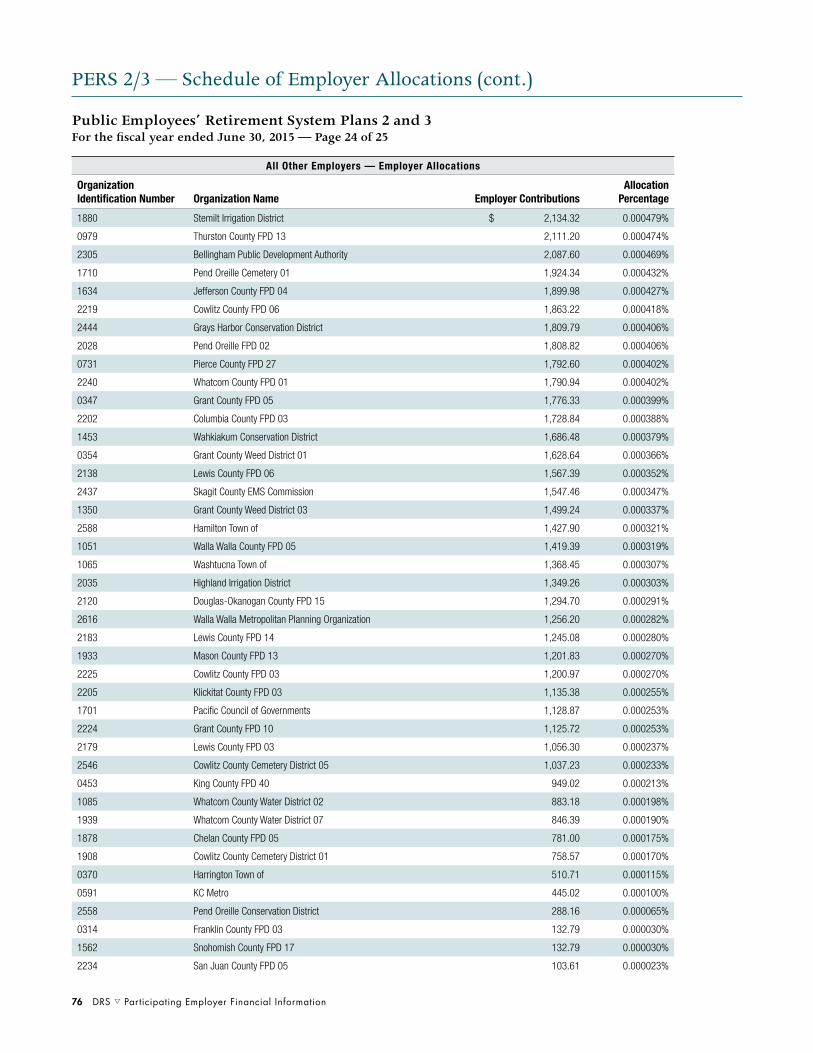
76 DRS s Participating Employer Financial Information
PERS 2/3 — Schedule of Employer Allocations (cont.)
All Other Employers — Employer Allocations
Organization Identification Number Organization Name Employer Contributions
Allocation Percentage
1880 Stemilt Irrigation District $ 2,134.32 0.000479%
0979 Thurston County FPD 13 2,111.20 0.000474%
2305 Bellingham Public Development Authority 2,087.60 0.000469%
1710 Pend Oreille Cemetery 01 1,924.34 0.000432%
1634 Jefferson County FPD 04 1,899.98 0.000427%
2219 Cowlitz County FPD 06 1,863.22 0.000418%
2444 Grays Harbor Conservation District 1,809.79 0.000406%
2028 Pend Oreille FPD 02 1,808.82 0.000406%
0731 Pierce County FPD 27 1,792.60 0.000402%
2240 Whatcom County FPD 01 1,790.94 0.000402%
0347 Grant County FPD 05 1,776.33 0.000399%
2202 Columbia County FPD 03 1,728.84 0.000388%
1453 Wahkiakum Conservation District 1,686.48 0.000379%
0354 Grant County Weed District 01 1,628.64 0.000366%
2138 Lewis County FPD 06 1,567.39 0.000352%
2437 Skagit County EMS Commission 1,547.46 0.000347%
1350 Grant County Weed District 03 1,499.24 0.000337%
2588 Hamilton Town of 1,427.90 0.000321%
1051 Walla Walla County FPD 05 1,419.39 0.000319%
1065 Washtucna Town of 1,368.45 0.000307%
2035 Highland Irrigation District 1,349.26 0.000303%
2120 Douglas-Okanogan County FPD 15 1,294.70 0.000291%
2616 Walla Walla Metropolitan Planning Organization 1,256.20 0.000282%
2183 Lewis County FPD 14 1,245.08 0.000280%
1933 Mason County FPD 13 1,201.83 0.000270%
2225 Cowlitz County FPD 03 1,200.97 0.000270%
2205 Klickitat County FPD 03 1,135.38 0.000255%
1701 Pacific Council of Governments 1,128.87 0.000253%
2224 Grant County FPD 10 1,125.72 0.000253%
2179 Lewis County FPD 03 1,056.30 0.000237%
2546 Cowlitz County Cemetery District 05 1,037.23 0.000233%
0453 King County FPD 40 949.02 0.000213%
1085 Whatcom County Water District 02 883.18 0.000198%
1939 Whatcom County Water District 07 846.39 0.000190%
1878 Chelan County FPD 05 781.00 0.000175%
1908 Cowlitz County Cemetery District 01 758.57 0.000170%
0370 Harrington Town of 510.71 0.000115%
0591 KC Metro 445.02 0.000100%
2558 Pend Oreille Conservation District 288.16 0.000065%
0314 Franklin County FPD 03 132.79 0.000030%
1562 Snohomish County FPD 17 132.79 0.000030%
2234 San Juan County FPD 05 103.61 0.000023%
Public Employees’ Retirement System Plans 2 and 3For the fiscal year ended June 30, 2015 — Page 24 of 25
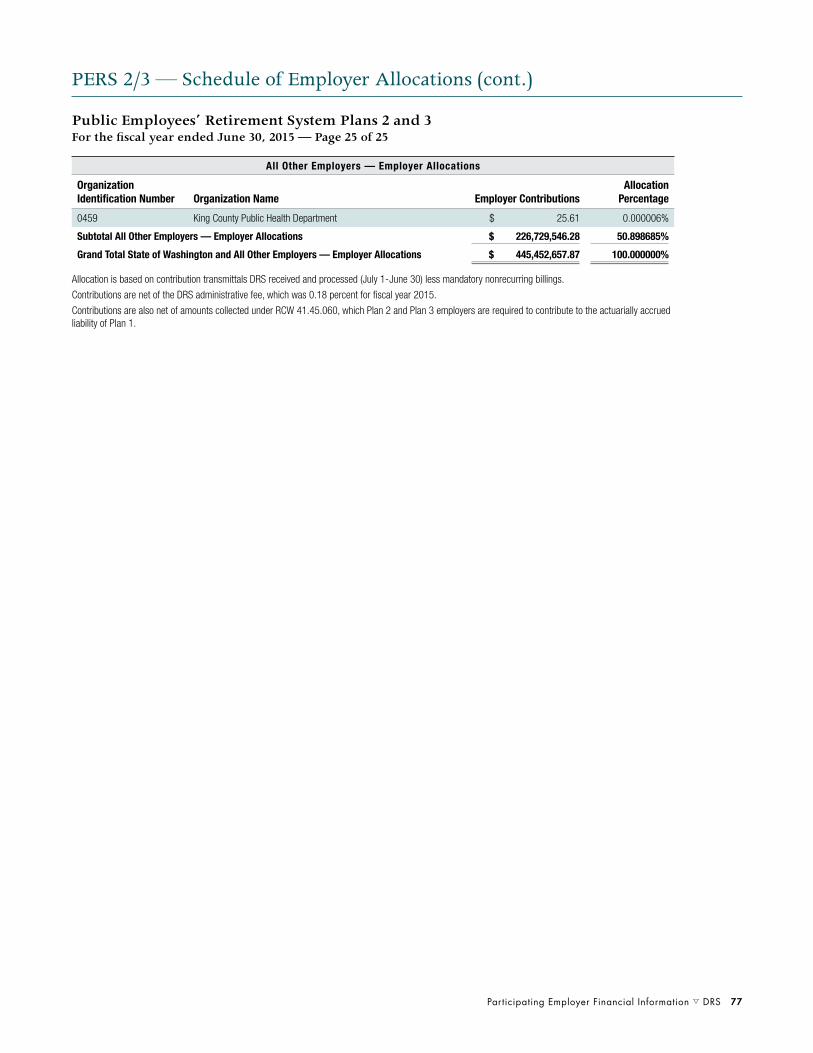
Participating Employer Financial Information s DRS 77
Allocation is based on contribution transmittals DRS received and processed (July 1-June 30) less mandatory nonrecurring billings.
Contributions are net of the DRS administrative fee, which was 0.18 percent for fiscal year 2015.
Contributions are also net of amounts collected under RCW 41.45.060, which Plan 2 and Plan 3 employers are required to contribute to the actuarially accrued liability of Plan 1.
All Other Employers — Employer Allocations
Organization Identification Number Organization Name Employer Contributions
Allocation Percentage
0459 King County Public Health Department $ 25.61 0.000006%
Subtotal All Other Employers — Employer Allocations $ 226,729,546.28 50.898685%
Grand Total State of Washington and All Other Employers — Employer Allocations $ 445,452,657.87 100.000000%
PERS 2/3 — Schedule of Employer Allocations (cont.)
Public Employees’ Retirement System Plans 2 and 3For the fiscal year ended June 30, 2015 — Page 25 of 25

78 DRS s Participating Employer Financial Information
SERS 2/3 — Schedule of Employer Allocations
All Employers — Employer Allocations
Organization Identification Number Organization Name Employer Contributions
Allocation Percentage
0844 Seattle School District 001 $ 5,972,726.41 6.143410%
0966 Tacoma School District 010 2,920,800.57 3.004269%
0435 Kent School District 415 2,501,833.95 2.573329%
0926 Spokane Public Schools 2,477,879.53 2.548690%
1031 Vancouver School District 037 2,132,896.66 2.193849%
0518 Lake Washington School District 414 2,096,529.79 2.156443%
0294 Federal Way School District 210 2,008,930.19 2.066340%
0258 Edmonds School District 015 1,980,655.08 2.037256%
0050 Bellevue School District 405 1,964,441.82 2.020580%
0378 Highline School District 401 1,945,506.66 2.001104%
0784 Puyallup School District 003 1,845,956.37 1.898708%
0653 Northshore School District 417 1,812,454.55 1.864249%
0291 Evergreen School District 114 1,779,942.20 1.830808%
0415 Issaquah School District 411 1,615,748.42 1.661922%
0290 Everett School District 002 1,585,863.32 1.631183%
0804 Renton School District 403 1,577,421.70 1.622500%
0066 Bethel School District 403 1,552,509.45 1.596876%
1128 Yakima School District 007 1,486,577.41 1.529059%
0039 Auburn School District 408 1,484,686.08 1.527114%
0161 Clover Park School District 400 1,307,476.94 1.344841%
0709 Pasco School District 001 1,297,322.33 1.334396%
0264 Puget Sound Educational Service District 1,250,704.24 1.286446%
0433 Kennewick School District 017 1,239,396.99 1.274815%
0651 North Thurston Public Schools 1,210,285.50 1.244872%
0623 Mukilteo School District 006 1,168,396.61 1.201786%
0114 Central Kitsap School District 401 1,101,974.15 1.133465%
0570 Marysville School District 025 1,050,578.97 1.080601%
0865 Shoreline School District 412 953,710.93 0.980965%
0115 Central Valley School District 356 939,198.67 0.966038%
0054 Bellingham School District 501 928,631.10 0.955169%
0810 Richland School District 400 903,472.27 0.929291%
0261 Educational Service District 112 888,702.56 0.914099%
0045 Battle Ground School District 119 860,028.88 0.884606%
0955 Sumner School District 320 850,299.00 0.874598%
0673 Olympia School District 111 816,002.97 0.839322%
0898 Snohomish School District 201 781,966.90 0.804313%
0910 South Kitsap School District 402 756,091.85 0.777699%
0580 Mead School District 354 727,629.75 0.748423%
0319 Franklin Pierce School District 402 696,269.44 0.716167%
0517 Lake Stevens School District 004 695,856.60 0.715742%
0718 Peninsula School District 401 657,147.10 0.675926%
1073 Wenatchee School District 246 654,719.84 0.673430%
School Employees’ Retirement System Plans 2 and 3For the fiscal year ended June 30, 2015 — Page 1 of 8

Participating Employer Financial Information s DRS 79
SERS 2/3 — Schedule of Employer Allocations (cont.)
All Employers — Employer Allocations
Organization Identification Number Organization Name Employer Contributions
Allocation Percentage
0611 Moses Lake School District 161 $ 645,042.37 0.663476%
0618 Mount Vernon School District 320 637,184.64 0.655394%
0958 Sunnyside School District 201 610,812.84 0.628268%
0262 Educational Service District 113 596,090.67 0.613125%
0550 Longview School District 122 590,941.32 0.607829%
0649 North Kitsap School District 400 582,932.35 0.599591%
1056 Walla Walla School District 140 577,335.28 0.593834%
0096 Camas School District 117 576,785.16 0.593268%
0968 Tahoma School District 409 547,430.53 0.563075%
0604 Monroe School District 103 533,852.06 0.549108%
1003 Tumwater School District 033 516,152.67 0.530903%
1134 Yelm School District 002 493,736.82 0.507846%
0656 Oak Harbor School District 201 490,444.84 0.504460%
0082 Bremerton School District 100 485,995.70 0.499884%
0249 Eastmont School District 206 448,964.53 0.461795%
0026 Arlington School District 016 446,223.03 0.458975%
0848 Sedro-Woolley School District 101 432,692.25 0.445057%
0267 Northwest Regional Educational Service District 426,479.14 0.438667%
0902 Snoqualmie Valley School District 410 424,371.26 0.436499%
0297 Ferndale School District 502 420,426.81 0.432441%
0931 Stanwood-Camano School District 401 407,336.00 0.418976%
0585 Mercer Island School District 400 402,082.15 0.413572%
0280 Enumclaw School District 216 398,906.69 0.410306%
0243 East Valley School District 361 397,573.29 0.408935%
0863 Shelton School District 309 396,306.07 0.407631%
0428 Kelso School District 458 395,926.88 0.407241%
1020 University Place School District 083 369,567.96 0.380129%
1076 West Valley School District 208 366,358.33 0.376828%
1092 White River School District 416 354,545.65 0.364678%
0094 Burlington-Edison School District 100 351,062.56 0.361095%
0042 Bainbridge Island School District 303 344,192.61 0.354029%
0909 Tukwila School District 406 339,820.15 0.349531%
0133 Cheney School District 360 338,818.45 0.348501%
0002 Aberdeen School District 005 338,178.77 0.347843%
1077 West Valley School District 363 334,343.34 0.343898%
0259 Northeast WA Educational Service District 101 328,164.19 0.337542%
0695 Othello School District 147 327,207.69 0.336558%
0753 Port Angeles School District 121 324,817.84 0.334100%
0119 Centralia School District 401 317,849.83 0.326933%
0992 Toppenish School District 202 315,265.47 0.324275%
1058 Wapato School District 207 300,092.31 0.308668%
0263 Olympic Educational Service District 296,482.79 0.304955%
School Employees’ Retirement System Plans 2 and 3For the fiscal year ended June 30, 2015 — Page 2 of 8
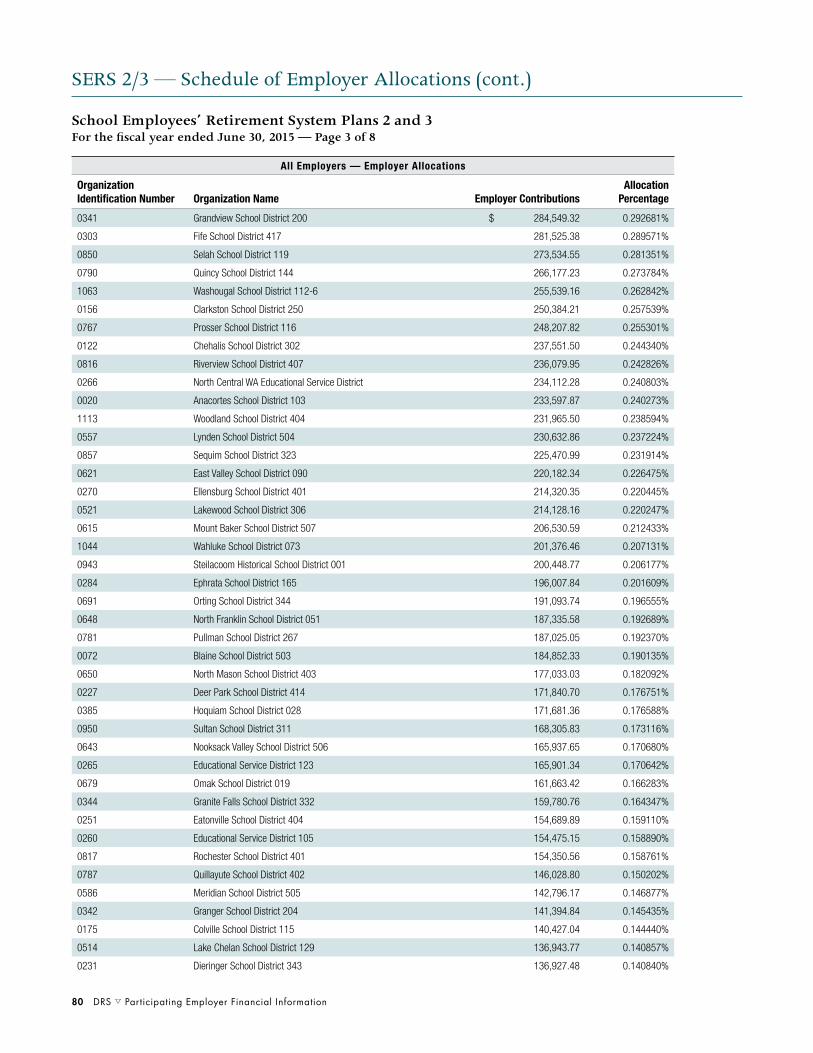
80 DRS s Participating Employer Financial Information
SERS 2/3 — Schedule of Employer Allocations (cont.)
All Employers — Employer Allocations
Organization Identification Number Organization Name Employer Contributions
Allocation Percentage
0341 Grandview School District 200 $ 284,549.32 0.292681%
0303 Fife School District 417 281,525.38 0.289571%
0850 Selah School District 119 273,534.55 0.281351%
0790 Quincy School District 144 266,177.23 0.273784%
1063 Washougal School District 112-6 255,539.16 0.262842%
0156 Clarkston School District 250 250,384.21 0.257539%
0767 Prosser School District 116 248,207.82 0.255301%
0122 Chehalis School District 302 237,551.50 0.244340%
0816 Riverview School District 407 236,079.95 0.242826%
0266 North Central WA Educational Service District 234,112.28 0.240803%
0020 Anacortes School District 103 233,597.87 0.240273%
1113 Woodland School District 404 231,965.50 0.238594%
0557 Lynden School District 504 230,632.86 0.237224%
0857 Sequim School District 323 225,470.99 0.231914%
0621 East Valley School District 090 220,182.34 0.226475%
0270 Ellensburg School District 401 214,320.35 0.220445%
0521 Lakewood School District 306 214,128.16 0.220247%
0615 Mount Baker School District 507 206,530.59 0.212433%
1044 Wahluke School District 073 201,376.46 0.207131%
0943 Steilacoom Historical School District 001 200,448.77 0.206177%
0284 Ephrata School District 165 196,007.84 0.201609%
0691 Orting School District 344 191,093.74 0.196555%
0648 North Franklin School District 051 187,335.58 0.192689%
0781 Pullman School District 267 187,025.05 0.192370%
0072 Blaine School District 503 184,852.33 0.190135%
0650 North Mason School District 403 177,033.03 0.182092%
0227 Deer Park School District 414 171,840.70 0.176751%
0385 Hoquiam School District 028 171,681.36 0.176588%
0950 Sultan School District 311 168,305.83 0.173116%
0643 Nooksack Valley School District 506 165,937.65 0.170680%
0265 Educational Service District 123 165,901.34 0.170642%
0679 Omak School District 019 161,663.42 0.166283%
0344 Granite Falls School District 332 159,780.76 0.164347%
0251 Eatonville School District 404 154,689.89 0.159110%
0260 Educational Service District 105 154,475.15 0.158890%
0817 Rochester School District 401 154,350.56 0.158761%
0787 Quillayute School District 402 146,028.80 0.150202%
0586 Meridian School District 505 142,796.17 0.146877%
0342 Granger School District 204 141,394.84 0.145435%
0175 Colville School District 115 140,427.04 0.144440%
0514 Lake Chelan School District 129 136,943.77 0.140857%
0231 Dieringer School District 343 136,927.48 0.140840%
School Employees’ Retirement System Plans 2 and 3For the fiscal year ended June 30, 2015 — Page 3 of 8

Participating Employer Financial Information s DRS 81
SERS 2/3 — Schedule of Employer Allocations (cont.)
All Employers — Employer Allocations
Organization Identification Number Organization Name Employer Contributions
Allocation Percentage
0381 Hockinson School District 098 $ 134,473.55 0.138316%
0903 South Whidbey School District 206 134,378.10 0.138218%
1032 Vashon Island School District 402 133,349.27 0.137160%
0582 Medical Lake School District 326 132,286.14 0.136066%
0483 Kiona-Benton City School District 052 130,139.23 0.133858%
0825 Royal School District 160 129,839.02 0.133549%
0272 Elma School District 068 119,782.91 0.123206%
0108 Castle Rock School District 401 118,965.88 0.122366%
1026 Valley School District 070 118,825.36 0.122221%
0815 Riverside School District 416 113,068.81 0.116300%
0106 Cashmere School District 222 112,748.53 0.115971%
0103 Cascade School District 228 112,254.74 0.115463%
0137 Chimacum School District 049 107,171.65 0.110234%
0614 Mount Adams School District 209 106,697.73 0.109747%
0670 Okanogan School District 105 105,348.66 0.108359%
0640 Nine Mile Falls School District 325 104,543.33 0.107531%
0757 Port Townsend School District 050 102,913.24 0.105854%
1093 White Salmon School District 405 96,175.12 0.098924%
0339 Grand Coulee Dam School District 301 95,872.18 0.098612%
0376 Highland School District 203 94,392.89 0.097090%
0630 Naches Valley School District 003 92,814.40 0.095467%
1137 Zillah School District 205 90,753.41 0.093347%
0661 Ocean Beach School District 101 89,911.78 0.092481%
0606 Montesano School District 066 89,500.71 0.092058%
0949 Stevenson-Carson School District 303 88,107.18 0.090625%
0639 Newport School District 056-415 87,542.35 0.090044%
0989 Tonasket School District 404 85,880.92 0.088335%
0335 Goldendale School District 404 84,845.02 0.087270%
1059 Warden Joint Consolidated School District 146-161 84,432.86 0.086846%
0506 La Center School District 101 82,632.74 0.084994%
0167 College Place School District 250 82,281.79 0.084633%
0908 South Bend School District 118 79,619.34 0.081895%
0560 Mabton School District 120 79,468.94 0.081740%
0135 Chewelah School District 036 79,381.98 0.081650%
0564 Manson School District 019 77,628.73 0.079847%
0084 Brewster School District 111 77,255.56 0.079463%
0305 Finley School District 053 76,548.10 0.078736%
0812 Ridgefield School District 122 76,415.65 0.078599%
0437 Kettle Falls School District 212 76,147.67 0.078324%
0158 Cle Elum-Roslyn School District 404 74,224.54 0.076346%
0098 Cape Flattery School District 401 73,778.33 0.075887%
0833 San Juan Island School District 149 72,263.62 0.074329%
School Employees’ Retirement System Plans 2 and 3For the fiscal year ended June 30, 2015 — Page 4 of 8

82 DRS s Participating Employer Financial Information
SERS 2/3 — Schedule of Employer Allocations (cont.)
All Employers — Employer Allocations
Organization Identification Number Organization Name Employer Contributions
Allocation Percentage
0320 Freeman School District 358 $ 71,826.44 0.073879%
0199 Coupeville School District 204 71,554.46 0.073599%
0793 Rainier School District 307 71,487.26 0.073530%
0682 Orcas Island School District 137 71,135.59 0.073168%
0972 Tenino School District 402 69,509.42 0.071496%
1069 Wellpinit School District 049 69,469.02 0.071454%
0797 Raymond School District 116 68,609.69 0.070570%
0368 Griffin School District 324 67,593.03 0.069525%
0508 La Conner School District 311 67,545.79 0.069476%
0747 Pioneer School District 402 67,323.56 0.069247%
0663 Ocosta School District 172 64,011.86 0.065841%
0173 Columbia School District 400 63,896.60 0.065723%
0680 Onalaska School District 300 63,404.53 0.065216%
0588 Methow Valley School District 350 62,961.95 0.064761%
0645 North Beach School District 064 62,091.52 0.063866%
0181 Concrete School District 011 60,211.04 0.061932%
0087 Bridgeport School District 075 58,792.13 0.060472%
1007 Union Gap School District 002 58,603.69 0.060278%
1106 Winlock School District 232 57,905.12 0.059560%
0568 Mary Walker School District 207 56,092.33 0.057695%
0994 Toutle Lake School District 130 55,940.92 0.057540%
0798 Reardan-Edwall School District 009 55,142.59 0.056718%
0029 Asotin Anatone School District 420 54,090.38 0.055636%
0632 Napavine School District 014 53,290.75 0.054814%
0223 Davenport School District 207 52,738.97 0.054246%
1091 White Pass School District 303 52,305.11 0.053800%
0219 Darrington School District 330 52,152.42 0.053643%
0501 Kittitas School District 403 51,030.55 0.052489%
0988 Toledo School District 237 50,683.55 0.052132%
0613 Mossyrock School District 206 49,322.53 0.050732%
0687 Oroville School District 410 48,839.01 0.050235%
0905 Soap Lake School District 156 48,499.59 0.049886%
0165 Colfax School District 300 47,403.19 0.048758%
0608 Morton School District 214 43,883.33 0.045137%
0536 Liberty School District 362 43,604.77 0.044851%
0382 Hood Canal School District 404 42,137.90 0.043342%
0967 Taholah School District 077 39,851.25 0.040990%
0552 Lopez Island School District 144 39,384.59 0.040510%
0225 Dayton School District 002 39,339.72 0.040464%
1102 Willapa Valley School District 160 39,329.48 0.040453%
0814 Ritzville School District 160 39,250.80 0.040372%
0786 Quilcene School District 048 38,276.10 0.039370%
School Employees’ Retirement System Plans 2 and 3For the fiscal year ended June 30, 2015 — Page 5 of 8

Participating Employer Financial Information s DRS 83
SERS 2/3 — Schedule of Employer Allocations (cont.)
All Employers — Employer Allocations
Organization Identification Number Organization Name Employer Contributions
Allocation Percentage
0652 Northport School District 211 $ 37,305.98 0.038372%
0278 Entiat School District 127 36,640.44 0.037688%
0805 Republic School District 309 35,962.89 0.036991%
0424 Kalama School District 402 35,939.18 0.036966%
0851 Selkirk School District 070 34,341.75 0.035323%
0010 Adna School District 226 33,198.51 0.034147%
1043 Wahkiakum School District 200 33,085.30 0.034031%
0788 Quinault Lake School District 097 33,000.19 0.033943%
0634 Naselle-Grays River Valley School District 32,320.00 0.033244%
0660 Oakville School District 400 32,318.54 0.033242%
0543 Lind School District 158 31,834.77 0.032745%
0750 Pomeroy School District 110 31,768.70 0.032677%
0555 Lyle School District 406 30,960.27 0.031845%
0714 Pe Ell School District 301 30,955.84 0.031840%
0189 Conway School District 317 30,866.83 0.031749%
0686 Orondo School District 013 30,802.59 0.031683%
1046 Waitsburg School District 401 30,285.56 0.031151%
0761 Prescott School District 402 28,855.36 0.029680%
0215 Cusick School District 059 28,691.86 0.029512%
1104 Wilson Creek School District 167 27,517.93 0.028304%
0971 Tekoa School District 265 27,500.79 0.028287%
0664 Odessa School District 105 27,028.60 0.027801%
0396 Inchelium School District 070 26,939.47 0.027709%
0710 Pateros School District 122 26,359.63 0.027113%
1099 Wilbur School District 200 26,325.33 0.027078%
0637 Nespelem School District 014 25,816.64 0.026554%
0210 Crescent School District 313 25,613.05 0.026345%
0577 McCleary School District 065 25,461.06 0.026189%
0567 Mary M Knight School District 311 25,232.40 0.025953%
1067 Waterville School District 209 25,148.36 0.025867%
0820 Rosalia School District 320 25,088.08 0.025805%
0197 Coulee Hartline School District 151 24,934.42 0.025647%
0505 Klickitat School District 402 24,117.63 0.024807%
0328 Garfield School District 302 23,887.91 0.024571%
0250 Easton School District 028 22,769.59 0.023420%
0993 Touchet School District 300 21,955.57 0.022583%
0929 Saint John School District 322 21,555.06 0.022171%
0703 Palouse School District 301 21,233.27 0.021840%
0274 Endicott School District 308 20,882.51 0.021479%
0172 Columbia School District 206 20,289.89 0.020870%
0975 Thorp School District 400 18,972.06 0.019514%
0658 Oakesdale School District 324 18,616.47 0.019148%
School Employees’ Retirement System Plans 2 and 3For the fiscal year ended June 30, 2015 — Page 6 of 8

84 DRS s Participating Employer Financial Information
SERS 2/3 — Schedule of Employer Allocations (cont.)
All Employers — Employer Allocations
Organization Identification Number Organization Name Employer Contributions
Allocation Percentage
1110 Wishram School District 094 $ 18,477.67 0.019006%
0168 Colton School District 306 18,444.64 0.018972%
0214 Curlew School District 050 18,302.89 0.018826%
0369 Harrington School District 204 18,027.47 0.018543%
0332 Glenwood School District 401 17,868.99 0.018380%
0512 Lacrosse School District 126 17,285.58 0.017780%
1000 Trout Lake School District 400 16,889.66 0.017372%
0211 Creston School District 073 16,719.92 0.017198%
0712 Paterson School District 050 16,605.41 0.017080%
0641 North River School District 200 16,412.30 0.016881%
0017 Almira School District 017 15,982.53 0.016439%
0562 Mansfield School District 207 15,976.83 0.016433%
1109 Wishkah Valley School District 117 15,943.33 0.016399%
0356 Grapeview School District 054 15,043.40 0.015473%
0928 Sprague School District 008 14,955.03 0.015382%
0878 Skykomish School District 404 14,921.01 0.015347%
0099 Carbonado Historical School District 019 14,496.61 0.014911%
1064 Washtucna School District 109 14,219.97 0.014626%
0911 Southside School District 042 13,867.15 0.014263%
0067 Bickleton School District 203 12,928.16 0.013298%
0551 Loon Lake School District 183 12,066.43 0.012411%
0685 Orient School District 065 11,712.18 0.012047%
0366 Green Mountain School District 103 11,697.99 0.012032%
0113 Centerville School District 215 11,649.36 0.011982%
0194 Cosmopolis School District 099 11,604.74 0.011936%
0074 Boistfort School District 234 11,201.11 0.011521%
0785 Queets-Clearwater School District 020 10,865.63 0.011176%
0425 Keller School District 003 10,702.02 0.011008%
0421 Kahlotus School District 056 10,653.29 0.010958%
0953 Summit Valley School District 202 10,557.95 0.010860%
0877 Skamania School District 002 10,383.79 0.010681%
0681 Onion Creek School District 030 10,190.03 0.010481%
0232 Dixie School District 101 8,929.52 0.009185%
0089 Brinnon School District 046 8,346.56 0.008585%
0523 Lamont School District 264 7,810.58 0.008034%
0285 Evaline School District 036 7,477.58 0.007691%
0595 Mill A School District 031 6,674.81 0.006866%
0397 Index School District 063 6,523.66 0.006710%
0945 Steptoe School District 304 6,431.53 0.006615%
0701 Palisades School District 102 6,323.93 0.006505%
0292 Evergreen School District 205 5,036.08 0.005180%
0616 Mount Pleasant School District 029-93 4,871.44 0.005011%
School Employees’ Retirement System Plans 2 and 3For the fiscal year ended June 30, 2015 — Page 7 of 8

Participating Employer Financial Information s DRS 85
SERS 2/3 — Schedule of Employer Allocations (cont.)
All Employers — Employer Allocations
Organization Identification Number Organization Name Employer Contributions
Allocation Percentage
0819 Roosevelt School District 403 $ 4,774.87 0.004911%
0834 Satsop School District 104 4,332.19 0.004456%
0932 Star School District 054 3,748.46 0.003856%
0933 Starbuck School District 035 3,350.45 0.003446%
0684 Orchard Prairie School District 123 3,185.71 0.003277%
0057 Benge School District 122 2,919.07 0.003002%
0218 Damman School District 007 2,182.61 0.002245%
0363 Great Northern School District 312 1,982.95 0.002040%
0860 Shaw Island School District 010 1,663.46 0.001711%
1412 Stehekin School District 069 77.03 0.000079%
Grand Total All Employers — Employer Allocations $ 97,221,684.99 100.000000%
School Employees’ Retirement System Plans 2 and 3For the fiscal year ended June 30, 2015 — Page 8 of 8
Allocation is based on contribution transmittals DRS received and processed (July 1-June 30) less mandatory nonrecurring billings.
Contributions are net of the DRS administrative fee, which was 0.18 percent for fiscal year 2015.
Contributions are also net of the amounts collected under RCW 41.45.060, which Plan 2 and Plan 3 employers are required to contribute to the actuarially accrued liability of Plan 1.
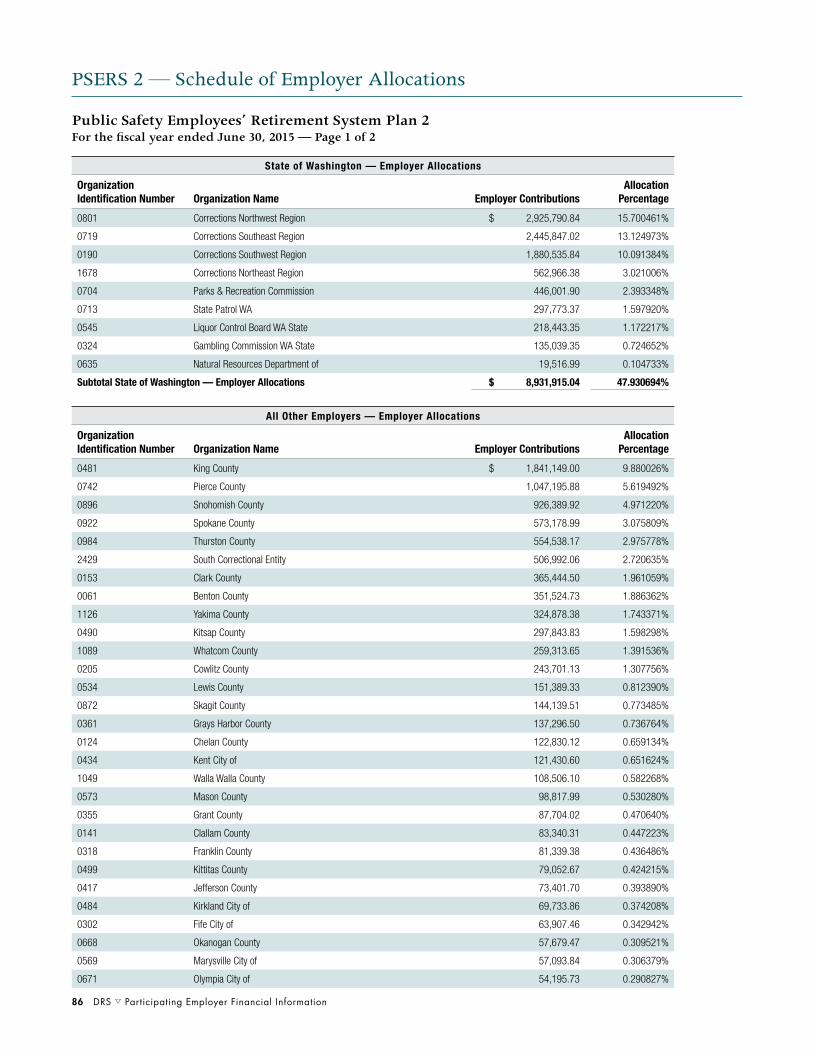
86 DRS s Participating Employer Financial Information
PSERS 2 — Schedule of Employer Allocations
State of Washington — Employer Allocations
Organization Identification Number Organization Name Employer Contributions
Allocation Percentage
0801 Corrections Northwest Region $ 2,925,790.84 15.700461%
0719 Corrections Southeast Region 2,445,847.02 13.124973%
0190 Corrections Southwest Region 1,880,535.84 10.091384%
1678 Corrections Northeast Region 562,966.38 3.021006%
0704 Parks & Recreation Commission 446,001.90 2.393348%
0713 State Patrol WA 297,773.37 1.597920%
0545 Liquor Control Board WA State 218,443.35 1.172217%
0324 Gambling Commission WA State 135,039.35 0.724652%
0635 Natural Resources Department of 19,516.99 0.104733%
Subtotal State of Washington — Employer Allocations $ 8,931,915.04 47.930694%
Public Safety Employees’ Retirement System Plan 2For the fiscal year ended June 30, 2015 — Page 1 of 2
All Other Employers — Employer Allocations
Organization Identification Number Organization Name Employer Contributions
Allocation Percentage
0481 King County $ 1,841,149.00 9.880026%
0742 Pierce County 1,047,195.88 5.619492%
0896 Snohomish County 926,389.92 4.971220%
0922 Spokane County 573,178.99 3.075809%
0984 Thurston County 554,538.17 2.975778%
2429 South Correctional Entity 506,992.06 2.720635%
0153 Clark County 365,444.50 1.961059%
0061 Benton County 351,524.73 1.886362%
1126 Yakima County 324,878.38 1.743371%
0490 Kitsap County 297,843.83 1.598298%
1089 Whatcom County 259,313.65 1.391536%
0205 Cowlitz County 243,701.13 1.307756%
0534 Lewis County 151,389.33 0.812390%
0872 Skagit County 144,139.51 0.773485%
0361 Grays Harbor County 137,296.50 0.736764%
0124 Chelan County 122,830.12 0.659134%
0434 Kent City of 121,430.60 0.651624%
1049 Walla Walla County 108,506.10 0.582268%
0573 Mason County 98,817.99 0.530280%
0355 Grant County 87,704.02 0.470640%
0141 Clallam County 83,340.31 0.447223%
0318 Franklin County 81,339.38 0.436486%
0499 Kittitas County 79,052.67 0.424215%
0417 Jefferson County 73,401.70 0.393890%
0484 Kirkland City of 69,733.86 0.374208%
0302 Fife City of 63,907.46 0.342942%
0668 Okanogan County 57,679.47 0.309521%
0569 Marysville City of 57,093.84 0.306379%
0671 Olympia City of 54,195.73 0.290827%

Participating Employer Financial Information s DRS 87
All Other Employers — Employer Allocations
Organization Identification Number Organization Name Employer Contributions
Allocation Percentage
0542 Lincoln County $ 51,646.45 0.277147%
0413 Island County 50,191.03 0.269337%
0048 Bellevue City of 46,098.80 0.247377%
1119 Yakima City of 45,871.64 0.246158%
0783 Puyallup City of 43,767.63 0.234867%
0558 Lynnwood City of 43,142.63 0.231513%
0876 Skamania County 42,660.40 0.228925%
0414 Issaquah City of 41,754.32 0.224063%
0504 Klickitat County 39,921.44 0.214228%
0286 Everett City of 39,391.52 0.211384%
0033 Asotin County 28,865.93 0.154901%
0699 Pacific County 28,730.28 0.154173%
1096 Whitman County 26,591.57 0.142696%
0946 Stevens County 22,310.34 0.119722%
0300 Ferry County 21,452.37 0.115118%
0715 Pend Oreille County 21,274.30 0.114163%
0007 Adams County 19,740.24 0.105931%
0655 Oak Harbor City of 18,572.02 0.099662%
1057 Wapato City of 17,590.57 0.094395%
0311 Forks City of 17,514.39 0.093986%
0800 Redmond City of 17,313.61 0.092909%
0279 Enumclaw City of 16,935.67 0.090881%
0832 San Juan County 16,651.84 0.089358%
0991 Toppenish City of 14,092.64 0.075624%
0001 Aberdeen City of 13,204.98 0.070861%
0237 Douglas County 11,534.53 0.061897%
1001 Tukwila City of 9,829.62 0.052748%
0802 Renton City of 8,011.44 0.042991%
0078 Bremerton City of 7,957.69 0.042703%
0076 Bothell City of 7,923.12 0.042517%
1042 Wahkiakum County 4,963.65 0.026636%
0900 Snoqualmie City of 4,822.33 0.025878%
0584 Mercer Island City of 4,267.62 0.022901%
0644 Normandy Park City of 4,101.13 0.022008%
0296 Ferndale City of 4,096.18 0.021981%
0956 Sunnyside City of 3,484.87 0.018701%
0340 Grandview City of 2,860.51 0.015350%
Subtotal All Other Employers — Employer Allocations $ 9,703,148.13 52.069306%
Grand Total State of Washington and All Other Employers — Employer Allocations $ 18,635,063.17 100.000000%
PSERS 2 — Schedule of Employer Allocations (cont.)
Public Safety Employees’ Retirement System Plan 2For the fiscal year ended June 30, 2015 — Page 2 of 2
Allocation is based on contribution transmittals DRS received and processed (July 1-June 30) less mandatory nonrecurring billings.
Contributions are net of the DRS administrative fee, which was 0.18 percent for fiscal year 2015.
Contributions are also net of amounts collected under RCW 41.45.060, which Plan 2 and Plan 3 employers are required to contribute to the actuarially accrued liability of Plan 1.

88 DRS s Participating Employer Financial Information
TRS 1 — Schedule of Employer and Nonemployer Allocations
State of Washington — Employer Allocations
Organization Identification Number Organization Name Employer Contributions
Allocation Percentage
1219 University of WA $ 43,230.42 0.019319%
0772 Superintendent of Public Instruction 29,066.84 0.012989%
0873 Skagit Valley College 23,909.88 0.010685%
0179 Spokane Community College 18,081.77 0.008080%
0839 Seattle Community College 17,606.05 0.007868%
0008 Administrative Office of the Court 15,867.71 0.007091%
0169 Columbia Basin Community College 15,085.47 0.006741%
1079 Western WA University 15,010.04 0.006708%
0049 Bellevue Community College 14,775.14 0.006603%
1667 Bellingham Technical College 14,474.20 0.006468%
0906 Social & Health Services Department of 13,138.13 0.005871%
0256 Edmonds Community College 12,581.90 0.005623%
0287 Everett Community College 12,238.19 0.005469%
0360 Grays Harbor College 10,720.32 0.004791%
0273 Employment Security Department of 10,526.88 0.004704%
0176 Community & Technical Colleges State Board for 10,517.04 0.004700%
0675 Olympic College 8,216.03 0.003672%
1088 Whatcom Community College 8,132.32 0.003634%
1735 Financial Institutions Department of 8,102.15 0.003621%
0254 Ecology Department of 8,015.05 0.003582%
0068 Big Bend Community College 7,998.96 0.003575%
0864 Shoreline Community College 7,992.36 0.003572%
0997 Transportation Department of 7,832.43 0.003500%
1053 Walla Walla Community College 7,482.15 0.003344%
0178 Centralia College 7,333.20 0.003277%
1074 Wenatchee Valley College 7,172.05 0.003205%
1021 WA State University 6,428.75 0.002873%
0377 Highline Community College 6,210.50 0.002775%
1591 South Puget Sound Community College 5,274.54 0.002357%
0117 Central WA University 3,907.71 0.001746%
0152 Clark Community College 3,563.41 0.001592%
0365 Green Hill School 2,888.41 0.001291%
1673 Lake Washington Institute of Technology 2,563.45 0.001146%
1130 Yakima Valley College 1,294.61 0.000579%
0741 Pierce College 940.39 0.000420%
0247 Eastern WA University 40.84 0.000018%
Subtotal State of Washington — Employer Allocations $ 388,219.29 0.173485%
Teachers’ Retirement System Plan 1For the fiscal year ended June 30, 2015 — Page 1 of 16

Participating Employer Financial Information s DRS 89
TRS 1 — Schedule of Employer and Nonemployer Allocations (cont.)
All Other Employers — Employer Allocations
Organization Identification Number Organization Name Employer Contributions
Allocation Percentage
0844 Seattle School District 001 $ 694,302.83 0.310266%
0966 Tacoma School District 010 547,754.85 0.244777%
0653 Northshore School District 417 390,283.46 0.174407%
0518 Lake Washington School District 414 339,951.20 0.151915%
0926 Spokane Public Schools 267,426.77 0.119506%
0290 Everett School District 002 251,782.25 0.112515%
0784 Puyallup School District 003 244,595.12 0.109303%
0291 Evergreen School District 114 223,888.51 0.100050%
1128 Yakima School District 007 220,955.26 0.098739%
0258 Edmonds School District 015 210,920.83 0.094255%
0623 Mukilteo School District 006 205,831.45 0.091981%
0435 Kent School District 415 204,506.61 0.091389%
0050 Bellevue School District 405 181,703.17 0.081198%
0039 Auburn School District 408 175,830.03 0.078574%
0378 Highline School District 401 175,825.98 0.078572%
0651 North Thurston Public Schools 173,755.14 0.077647%
0804 Renton School District 403 172,649.98 0.077153%
0611 Moses Lake School District 161 172,116.37 0.076914%
0045 Battle Ground School District 119 158,286.04 0.070734%
1031 Vancouver School District 037 158,226.89 0.070707%
0066 Bethel School District 403 157,436.30 0.070354%
0898 Snohomish School District 201 154,394.52 0.068995%
0115 Central Valley School District 356 154,337.62 0.068969%
0294 Federal Way School District 210 152,251.11 0.068037%
0865 Shoreline School District 412 143,878.12 0.064295%
0673 Olympia School District 111 141,917.30 0.063419%
0433 Kennewick School District 017 141,713.09 0.063328%
0297 Ferndale School District 502 117,756.93 0.052622%
0810 Richland School District 400 113,883.36 0.050891%
1073 Wenatchee School District 246 111,494.42 0.049824%
0054 Bellingham School District 501 100,570.20 0.044942%
0709 Pasco School District 001 99,609.57 0.044513%
0718 Peninsula School District 401 99,396.64 0.044418%
0570 Marysville School District 025 93,039.53 0.041577%
0114 Central Kitsap School District 401 91,982.89 0.041105%
0649 North Kitsap School District 400 89,509.50 0.039999%
0910 South Kitsap School District 402 86,456.16 0.038635%
0415 Issaquah School District 411 85,107.85 0.038032%
0550 Longview School District 122 81,986.86 0.036638%
1076 West Valley School District 208 81,382.52 0.036368%
1020 University Place School District 083 76,181.73 0.034044%
1003 Tumwater School District 033 72,259.77 0.032291%
Teachers’ Retirement System Plan 1For the fiscal year ended June 30, 2015 — Page 2 of 16

90 DRS s Participating Employer Financial Information
TRS 1 — Schedule of Employer and Nonemployer Allocations (cont.)
All Other Employers — Employer Allocations
Organization Identification Number Organization Name Employer Contributions
Allocation Percentage
0517 Lake Stevens School District 004 $ 71,096.82 0.031771%
0161 Clover Park School District 400 70,063.01 0.031309%
0955 Sumner School District 320 67,666.04 0.030238%
0585 Mercer Island School District 400 66,351.22 0.029651%
0521 Lakewood School District 306 63,806.17 0.028513%
0902 Snoqualmie Valley School District 410 63,503.43 0.028378%
0319 Franklin Pierce School District 402 62,144.40 0.027771%
0931 Stanwood-Camano School District 401 61,437.33 0.027455%
0243 East Valley School District 361 57,585.73 0.025734%
1056 Walla Walla School District 140 56,888.15 0.025422%
0249 Eastmont School District 206 56,690.64 0.025334%
1077 West Valley School District 363 56,496.78 0.025247%
0604 Monroe School District 103 56,363.40 0.025187%
0863 Shelton School District 309 55,100.79 0.024623%
0753 Port Angeles School District 121 53,692.09 0.023994%
0428 Kelso School District 458 51,708.08 0.023107%
0580 Mead School District 354 51,253.59 0.022904%
0848 Sedro-Woolley School District 101 50,606.18 0.022615%
1063 Washougal School District 112-6 49,566.24 0.022150%
0385 Hoquiam School District 028 46,737.21 0.020886%
0119 Centralia School District 401 45,740.04 0.020440%
0968 Tahoma School District 409 44,011.79 0.019668%
0026 Arlington School District 016 43,783.82 0.019566%
0096 Camas School District 117 40,746.16 0.018208%
0082 Bremerton School District 100 40,599.05 0.018143%
1058 Wapato School District 207 39,844.17 0.017805%
0767 Prosser School District 116 38,966.35 0.017413%
0958 Sunnyside School District 201 38,817.96 0.017347%
0621 East Valley School District 090 38,462.09 0.017188%
0909 Tukwila School District 406 37,820.30 0.016901%
0133 Cheney School District 360 36,927.90 0.016502%
0122 Chehalis School District 302 35,900.77 0.016043%
0992 Toppenish School District 202 34,732.07 0.015521%
0156 Clarkston School District 250 34,475.62 0.015406%
0267 Northwest Regional Educational Service District 34,070.61 0.015225%
0943 Steilacoom Historical School District 001 34,007.72 0.015197%
0231 Dieringer School District 343 33,563.37 0.014999%
1134 Yelm School District 002 33,491.16 0.014966%
0648 North Franklin School District 051 33,404.61 0.014928%
0042 Bainbridge Island School District 303 33,395.35 0.014924%
0618 Mount Vernon School District 320 32,088.54 0.014340%
1032 Vashon Island School District 402 30,378.74 0.013575%
Teachers’ Retirement System Plan 1For the fiscal year ended June 30, 2015 — Page 3 of 16

Participating Employer Financial Information s DRS 91
TRS 1 — Schedule of Employer and Nonemployer Allocations (cont.)
All Other Employers — Employer Allocations
Organization Identification Number Organization Name Employer Contributions
Allocation Percentage
0284 Ephrata School District 165 $ 29,455.42 0.013163%
1113 Woodland School District 404 29,301.84 0.013094%
0557 Lynden School District 504 29,164.43 0.013033%
0679 Omak School District 019 29,022.63 0.012969%
0560 Mabton School District 120 28,213.94 0.012608%
0950 Sultan School District 311 28,189.64 0.012597%
0812 Ridgefield School District 122 27,836.68 0.012439%
0816 Riverview School District 407 27,349.18 0.012222%
1137 Zillah School District 205 27,269.15 0.012186%
0630 Naches Valley School District 003 26,764.42 0.011960%
0270 Ellensburg School District 401 26,693.25 0.011929%
0010 Adna School District 226 26,571.52 0.011874%
0656 Oak Harbor School District 201 25,307.04 0.011309%
0790 Quincy School District 144 24,033.79 0.010740%
0305 Finley School District 053 23,807.09 0.010639%
0857 Sequim School District 323 23,071.16 0.010310%
0506 La Center School District 101 22,711.48 0.010149%
0303 Fife School District 417 22,432.29 0.010024%
0137 Chimacum School District 049 22,016.40 0.009839%
0798 Reardan-Edwall School District 009 21,880.94 0.009778%
0670 Okanogan School District 105 21,795.03 0.009740%
0280 Enumclaw School District 216 21,510.99 0.009613%
0382 Hood Canal School District 404 21,510.55 0.009612%
0219 Darrington School District 330 20,943.26 0.009359%
0687 Oroville School District 410 20,753.23 0.009274%
0251 Eatonville School District 404 20,344.46 0.009091%
0582 Medical Lake School District 326 20,295.32 0.009069%
0663 Ocosta School District 172 20,218.30 0.009035%
0606 Montesano School District 066 20,138.77 0.008999%
0793 Rainier School District 307 19,773.28 0.008836%
0586 Meridian School District 505 19,391.33 0.008665%
0613 Mossyrock School District 206 18,906.01 0.008449%
0215 Cusick School District 059 18,836.51 0.008418%
0994 Toutle Lake School District 130 18,779.63 0.008392%
0508 La Conner School District 311 18,709.16 0.008361%
0223 Davenport School District 207 18,265.59 0.008162%
0020 Anacortes School District 103 18,136.72 0.008105%
0376 Highland School District 203 17,956.14 0.008024%
0341 Grandview School District 200 17,181.70 0.007678%
0512 Lacrosse School District 126 16,712.38 0.007468%
0339 Grand Coulee Dam School District 301 16,638.38 0.007435%
0514 Lake Chelan School District 129 16,524.75 0.007384%
Teachers’ Retirement System Plan 1For the fiscal year ended June 30, 2015 — Page 4 of 16

92 DRS s Participating Employer Financial Information
TRS 1 — Schedule of Employer and Nonemployer Allocations (cont.)
All Other Employers — Employer Allocations
Organization Identification Number Organization Name Employer Contributions
Allocation Percentage
0615 Mount Baker School District 507 $ 16,472.24 0.007361%
0002 Aberdeen School District 005 16,203.45 0.007241%
0094 Burlington-Edison School District 100 15,839.24 0.007078%
0342 Granger School District 204 15,638.83 0.006989%
0825 Royal School District 160 15,421.02 0.006891%
0850 Selah School District 119 15,266.12 0.006822%
0643 Nooksack Valley School District 506 15,206.01 0.006795%
0167 College Place School District 250 15,198.60 0.006792%
0903 South Whidbey School District 206 15,191.91 0.006789%
0437 Kettle Falls School District 212 15,149.26 0.006770%
0175 Colville School District 115 14,867.95 0.006644%
0682 Orcas Island School District 137 14,860.15 0.006641%
0272 Elma School District 068 14,468.53 0.006466%
0989 Tonasket School District 404 14,398.94 0.006435%
0967 Taholah School District 077 14,386.47 0.006429%
0356 Grapeview School District 054 14,161.23 0.006328%
0641 North River School District 200 14,012.09 0.006262%
0072 Blaine School District 503 13,901.78 0.006212%
0335 Goldendale School District 404 13,866.60 0.006197%
0210 Crescent School District 313 13,781.33 0.006159%
0851 Selkirk School District 070 13,559.97 0.006060%
0332 Glenwood School District 401 13,524.80 0.006044%
0972 Tenino School District 402 13,359.31 0.005970%
0797 Raymond School District 116 13,356.83 0.005969%
0929 Saint John School District 322 13,336.98 0.005960%
0710 Pateros School District 122 12,885.39 0.005758%
0632 Napavine School District 014 12,717.82 0.005683%
0577 McCleary School District 065 12,494.46 0.005583%
0645 North Beach School District 064 12,314.67 0.005503%
0650 North Mason School District 403 12,253.58 0.005476%
0158 Cle Elum-Roslyn School District 404 12,252.02 0.005475%
0172 Columbia School District 206 11,862.18 0.005301%
1059 Warden Joint Consolidated School District 146-161 11,335.45 0.005066%
0173 Columbia School District 400 10,911.34 0.004876%
1109 Wishkah Valley School District 117 10,875.83 0.004860%
0691 Orting School District 344 10,760.60 0.004809%
1092 White River School District 416 9,988.44 0.004464%
0761 Prescott School District 402 9,429.57 0.004214%
0165 Colfax School District 300 9,004.74 0.004024%
0189 Conway School District 317 8,774.26 0.003921%
0103 Cascade School District 228 8,609.52 0.003847%
0817 Rochester School District 401 8,487.82 0.003793%
Teachers’ Retirement System Plan 1For the fiscal year ended June 30, 2015 — Page 5 of 16

Participating Employer Financial Information s DRS 93
TRS 1 — Schedule of Employer and Nonemployer Allocations (cont.)
All Other Employers — Employer Allocations
Organization Identification Number Organization Name Employer Contributions
Allocation Percentage
1106 Winlock School District 232 $ 8,324.58 0.003720%
0396 Inchelium School District 070 8,216.50 0.003672%
0421 Kahlotus School District 056 8,104.70 0.003622%
0555 Lyle School District 406 7,849.75 0.003508%
0834 Satsop School District 104 7,835.59 0.003502%
0815 Riverside School District 416 7,665.96 0.003426%
1102 Willapa Valley School District 160 7,616.13 0.003403%
0680 Onalaska School District 300 7,533.51 0.003367%
1412 Stehekin School District 069 7,523.48 0.003362%
0381 Hockinson School District 098 7,498.85 0.003351%
1093 White Salmon School District 405 7,359.18 0.003289%
0260 Educational Service District 105 7,282.32 0.003254%
1099 Wilbur School District 200 7,201.07 0.003218%
0501 Kittitas School District 403 7,186.77 0.003212%
0988 Toledo School District 237 7,173.82 0.003206%
0199 Coupeville School District 204 7,154.08 0.003197%
0787 Quillayute School District 402 6,981.88 0.003120%
0640 Nine Mile Falls School District 325 6,901.31 0.003084%
0135 Chewelah School District 036 6,887.12 0.003078%
0225 Dayton School District 002 6,691.77 0.002990%
0017 Almira School District 017 6,663.06 0.002978%
0197 Coulee Hartline School District 151 6,661.37 0.002977%
0786 Quilcene School District 048 6,632.77 0.002964%
0684 Orchard Prairie School District 123 6,605.81 0.002952%
0877 Skamania School District 002 6,604.95 0.002952%
0747 Pioneer School District 402 6,460.40 0.002887%
1046 Waitsburg School District 401 6,435.14 0.002876%
0975 Thorp School District 400 6,330.85 0.002829%
0087 Bridgeport School District 075 6,062.05 0.002709%
0750 Pomeroy School District 110 6,019.18 0.002690%
0661 Ocean Beach School District 101 5,852.70 0.002615%
0543 Lind School District 158 5,066.69 0.002264%
0227 Deer Park School District 414 4,208.43 0.001881%
0820 Rosalia School District 320 3,707.38 0.001657%
0552 Lopez Island School District 144 3,475.46 0.001553%
0265 Educational Service District 123 3,077.30 0.001375%
1043 Wahkiakum School District 200 2,727.27 0.001219%
1044 Wahluke School District 073 2,236.87 0.001000%
0814 Ritzville School District 160 1,844.43 0.000824%
0639 Newport School District 056-415 1,807.23 0.000808%
1067 Waterville School District 209 1,747.23 0.000781%
0099 Carbonado Historical School District 019 1,665.05 0.000744%
Teachers’ Retirement System Plan 1For the fiscal year ended June 30, 2015 — Page 6 of 16

94 DRS s Participating Employer Financial Information
TRS 1 — Schedule of Employer and Nonemployer Allocations (cont.)
All Other Employers — Employer Allocations
Organization Identification Number Organization Name Employer Contributions
Allocation Percentage
0781 Pullman School District 267 $ 1,660.56 0.000742%
0945 Steptoe School District 304 1,638.04 0.000732%
0320 Freeman School District 358 1,593.73 0.000712%
0757 Port Townsend School District 050 1,576.84 0.000705%
0905 Soap Lake School District 156 1,573.58 0.000703%
0029 Asotin-Anatone School District 420 1,570.80 0.000702%
0695 Othello School District 147 1,472.61 0.000658%
0266 North Central WA Educational Service District 1,319.35 0.000590%
0108 Castle Rock School District 401 1,189.70 0.000532%
1007 Union Gap School District 002 1,176.59 0.000526%
0614 Mount Adams School District 209 1,030.11 0.000460%
0218 Damman School District 007 1,030.10 0.000460%
0551 Loon Lake School District 183 1,012.03 0.000452%
0993 Touchet School District 300 981.72 0.000439%
0949 Stevenson-Carson School District 303 763.30 0.000341%
0536 Liberty School District 362 485.35 0.000217%
Subtotal All Other Employers — Employer Allocations $ 11,366,879.73 5.079560%
Total State of Washington and All Other Employers — Employer Allocations $ 11,755,099.02 5.253045%
Teachers’ Retirement System Plan 1For the fiscal year ended June 30, 2015 — Page 7 of 16
State of Washington — Plan 1 UAAL
Organization Identification Number Organization Name Employer Contributions
Allocation Percentage
1021 WA State University $ 286,384.46 0.127978%
1219 University of WA 242,738.21 0.108473%
0938 School for the Blind 105,405.36 0.047103%
0939 Center for Childhood Deafness WA State 89,878.83 0.040164%
0179 Spokane Community College 58,356.30 0.026078%
0152 Clark Community College 55,655.10 0.024871%
0117 Central WA University 55,493.08 0.024798%
0963 Tacoma Community College 55,363.84 0.024741%
0839 Seattle Community College 48,643.75 0.021738%
1591 South Puget Sound Community College 45,459.76 0.020315%
0049 Bellevue Community College 36,998.01 0.016533%
1079 Western WA University 33,687.62 0.015054%
0247 Eastern WA University 33,601.23 0.015016%
0360 Grays Harbor College 25,847.41 0.011551%
1668 Clover Park Technical College 23,614.91 0.010553%
0864 Shoreline Community College 22,856.27 0.010214%
0367 Green River Community College 21,840.80 0.009760%
0178 Centralia College 21,463.01 0.009591%
0377 Highline Community College 21,071.13 0.009416%
0256 Edmonds Community College 20,731.67 0.009264%

Participating Employer Financial Information s DRS 95
TRS 1 — Schedule of Employer and Nonemployer Allocations (cont.)
State of Washington — Plan 1 UAAL
Organization Identification Number Organization Name Employer Contributions
Allocation Percentage
0741 Pierce College $ 19,879.50 0.008884%
0974 Evergreen State College 19,316.94 0.008632%
1667 Bellingham Technical College 16,832.33 0.007522%
0554 Lower Columbia Community College 16,001.15 0.007150%
0287 Everett Community College 15,801.14 0.007061%
1674 Bates Technical College 15,665.16 0.007000%
1130 Yakima Valley College 15,398.05 0.006881%
0675 Olympic College 15,339.58 0.006855%
1053 Walla Walla Community College 14,242.26 0.006364%
0068 Big Bend Community College 13,849.27 0.006189%
1673 Lake Washington Institute of Technology 12,865.04 0.005749%
1088 Whatcom Community College 12,046.14 0.005383%
1666 Renton Technical College 11,924.31 0.005329%
0169 Columbia Basin Community College 8,051.34 0.003598%
0873 Skagit Valley College 5,278.95 0.002359%
0176 Community & Technical Colleges State Board for 4,666.68 0.002085%
1074 Wenatchee Valley College 2,935.83 0.001312%
0717 Peninsula College 1,907.31 0.000852%
2008 Cascadia Community College 1,700.79 0.000760%
1078 Western State Hospital 1,430.17 0.000639%
0254 Ecology Department of 987.99 0.000442%
0997 Transportation Department of 390.64 0.000175%
0906 Social & Health Services Department of 299.07 0.000134%
0298 Ferries WA State 118.95 0.000053%
Subtotal State of Washington — Plan 1 UAAL $ 1,532,019.34 0.684619%
Teachers’ Retirement System Plan 1For the fiscal year ended June 30, 2015 — Page 8 of 16

96 DRS s Participating Employer Financial Information
TRS 1 — Schedule of Employer and Nonemployer Allocations (cont.)
All Other Employers — Plan 1 UAAL
Organization Identification Number Organization Name Employer Contributions
Allocation Percentage
0844 Seattle School District 001 $ 12,003,890.16 5.364223%
0966 Tacoma School District 010 6,798,731.04 3.038174%
0926 Spokane Public Schools 6,623,280.01 2.959770%
0518 Lake Washington School District 414 5,606,748.97 2.505509%
0435 Kent School District 415 5,605,762.76 2.505068%
0291 Evergreen School District 114 5,374,313.05 2.401639%
0294 Federal Way School District 210 4,595,962.10 2.053815%
0258 Edmonds School District 015 4,465,257.60 1.995406%
0290 Everett School District 002 4,398,019.43 1.965359%
0050 Bellevue School District 405 4,375,984.91 1.955513%
1031 Vancouver School District 037 4,373,566.97 1.954432%
0653 Northshore School District 417 4,251,525.74 1.899895%
0378 Highline School District 401 4,002,893.88 1.788788%
0784 Puyallup School District 003 3,975,244.79 1.776432%
0415 Issaquah School District 411 3,565,757.31 1.593443%
0623 Mukilteo School District 006 3,438,529.08 1.536588%
0066 Bethel School District 403 3,402,192.00 1.520350%
1128 Yakima School District 007 3,382,856.47 1.511710%
0039 Auburn School District 408 3,322,382.92 1.484686%
0804 Renton School District 403 3,157,773.77 1.411126%
0433 Kennewick School District 017 3,151,855.59 1.408481%
0709 Pasco School District 001 3,092,223.02 1.381833%
0651 North Thurston Public Schools 2,781,448.18 1.242956%
0161 Clover Park School District 400 2,752,256.73 1.229911%
0115 Central Valley School District 356 2,530,076.18 1.130625%
0570 Marysville School District 025 2,454,706.37 1.096944%
0045 Battle Ground School District 119 2,398,666.49 1.071901%
0054 Bellingham School District 501 2,371,403.47 1.059718%
0114 Central Kitsap School District 401 2,194,865.08 0.980828%
0810 Richland School District 400 1,986,899.20 0.887893%
0898 Snohomish School District 201 1,948,533.99 0.870749%
0580 Mead School District 354 1,810,705.24 0.809157%
0673 Olympia School District 111 1,807,197.53 0.807589%
0865 Shoreline School District 412 1,764,610.17 0.788558%
0955 Sumner School District 320 1,719,818.73 0.768542%
0910 South Kitsap School District 402 1,699,460.18 0.759444%
0718 Peninsula School District 401 1,648,199.12 0.736537%
0319 Franklin Pierce School District 402 1,581,211.36 0.706602%
0517 Lake Stevens School District 004 1,532,400.39 0.684789%
0611 Moses Lake School District 161 1,512,402.76 0.675853%
1073 Wenatchee School District 246 1,499,678.98 0.670167%
0618 Mount Vernon School District 320 1,338,567.03 0.598170%
Teachers’ Retirement System Plan 1For the fiscal year ended June 30, 2015 — Page 9 of 16

Participating Employer Financial Information s DRS 97
TRS 1 — Schedule of Employer and Nonemployer Allocations (cont.)
All Other Employers — Plan 1 UAAL
Organization Identification Number Organization Name Employer Contributions
Allocation Percentage
0968 Tahoma School District 409 $ 1,322,954.57 0.591194%
0604 Monroe School District 103 1,298,572.08 0.580298%
0550 Longview School District 122 1,260,825.48 0.563430%
1003 Tumwater School District 033 1,222,071.68 0.546112%
0096 Camas School District 117 1,208,511.10 0.540052%
0958 Sunnyside School District 201 1,166,637.13 0.521339%
0902 Snoqualmie Valley School District 410 1,155,931.94 0.516556%
1056 Walla Walla School District 140 1,152,083.20 0.514836%
1020 University Place School District 083 1,131,868.41 0.505802%
0026 Arlington School District 016 1,114,334.36 0.497967%
0649 North Kitsap School District 400 1,098,054.98 0.490692%
0249 Eastmont School District 206 1,094,458.30 0.489085%
0656 Oak Harbor School District 201 1,036,310.37 0.463100%
1134 Yelm School District 002 1,034,802.28 0.462426%
0082 Bremerton School District 100 991,328.98 0.442999%
0297 Ferndale School District 502 941,206.15 0.420600%
0428 Kelso School District 458 910,136.14 0.406716%
0931 Stanwood-Camano School District 401 890,240.39 0.397825%
0243 East Valley School District 361 886,127.66 0.395987%
0585 Mercer Island School District 400 851,473.18 0.380501%
0133 Cheney School District 360 847,226.78 0.378603%
1076 West Valley School District 208 826,563.93 0.369370%
0848 Sedro-Woolley School District 101 816,301.17 0.364784%
0863 Shelton School District 309 804,335.98 0.359437%
0042 Bainbridge Island School District 303 802,348.59 0.358548%
0280 Enumclaw School District 216 798,319.59 0.356748%
1092 White River School District 416 744,169.70 0.332550%
0753 Port Angeles School District 121 736,689.20 0.329207%
0094 Burlington-Edison School District 100 712,397.76 0.318352%
0303 Fife School District 417 691,524.79 0.309024%
0695 Othello School District 147 675,954.17 0.302066%
0002 Aberdeen School District 005 673,366.29 0.300910%
0992 Toppenish School District 202 671,583.30 0.300113%
1077 West Valley School District 363 669,726.16 0.299283%
0909 Tukwila School District 406 644,249.85 0.287898%
1058 Wapato School District 207 642,359.17 0.287053%
0850 Selah School District 119 635,182.29 0.283846%
0119 Centralia School District 401 609,737.65 0.272476%
0341 Grandview School District 200 596,486.29 0.266554%
0122 Chehalis School District 302 567,108.76 0.253426%
0816 Riverview School District 407 556,423.26 0.248651%
0943 Steilacoom Historical School District 001 553,502.59 0.247346%
Teachers’ Retirement System Plan 1For the fiscal year ended June 30, 2015 — Page 10 of 16
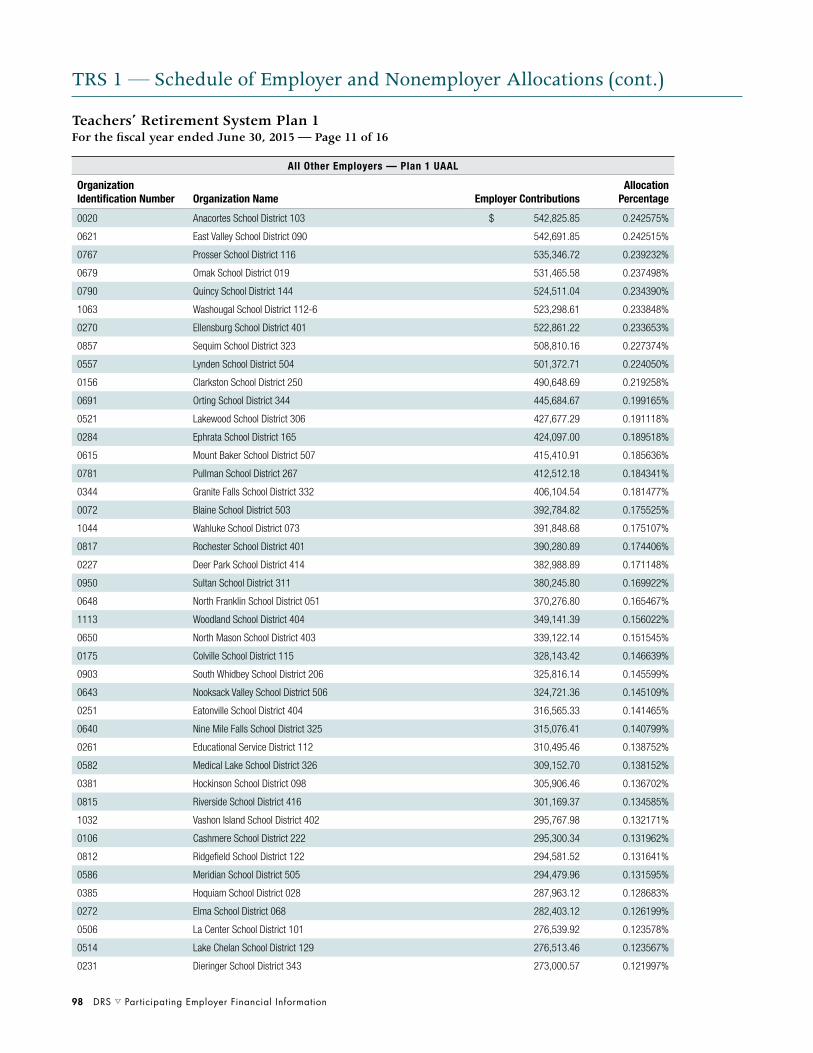
98 DRS s Participating Employer Financial Information
TRS 1 — Schedule of Employer and Nonemployer Allocations (cont.)
All Other Employers — Plan 1 UAAL
Organization Identification Number Organization Name Employer Contributions
Allocation Percentage
0020 Anacortes School District 103 $ 542,825.85 0.242575%
0621 East Valley School District 090 542,691.85 0.242515%
0767 Prosser School District 116 535,346.72 0.239232%
0679 Omak School District 019 531,465.58 0.237498%
0790 Quincy School District 144 524,511.04 0.234390%
1063 Washougal School District 112-6 523,298.61 0.233848%
0270 Ellensburg School District 401 522,861.22 0.233653%
0857 Sequim School District 323 508,810.16 0.227374%
0557 Lynden School District 504 501,372.71 0.224050%
0156 Clarkston School District 250 490,648.69 0.219258%
0691 Orting School District 344 445,684.67 0.199165%
0521 Lakewood School District 306 427,677.29 0.191118%
0284 Ephrata School District 165 424,097.00 0.189518%
0615 Mount Baker School District 507 415,410.91 0.185636%
0781 Pullman School District 267 412,512.18 0.184341%
0344 Granite Falls School District 332 406,104.54 0.181477%
0072 Blaine School District 503 392,784.82 0.175525%
1044 Wahluke School District 073 391,848.68 0.175107%
0817 Rochester School District 401 390,280.89 0.174406%
0227 Deer Park School District 414 382,988.89 0.171148%
0950 Sultan School District 311 380,245.80 0.169922%
0648 North Franklin School District 051 370,276.80 0.165467%
1113 Woodland School District 404 349,141.39 0.156022%
0650 North Mason School District 403 339,122.14 0.151545%
0175 Colville School District 115 328,143.42 0.146639%
0903 South Whidbey School District 206 325,816.14 0.145599%
0643 Nooksack Valley School District 506 324,721.36 0.145109%
0251 Eatonville School District 404 316,565.33 0.141465%
0640 Nine Mile Falls School District 325 315,076.41 0.140799%
0261 Educational Service District 112 310,495.46 0.138752%
0582 Medical Lake School District 326 309,152.70 0.138152%
0381 Hockinson School District 098 305,906.46 0.136702%
0815 Riverside School District 416 301,169.37 0.134585%
1032 Vashon Island School District 402 295,767.98 0.132171%
0106 Cashmere School District 222 295,300.34 0.131962%
0812 Ridgefield School District 122 294,581.52 0.131641%
0586 Meridian School District 505 294,479.96 0.131595%
0385 Hoquiam School District 028 287,963.12 0.128683%
0272 Elma School District 068 282,403.12 0.126199%
0506 La Center School District 101 276,539.92 0.123578%
0514 Lake Chelan School District 129 276,513.46 0.123567%
0231 Dieringer School District 343 273,000.57 0.121997%
Teachers’ Retirement System Plan 1For the fiscal year ended June 30, 2015 — Page 11 of 16
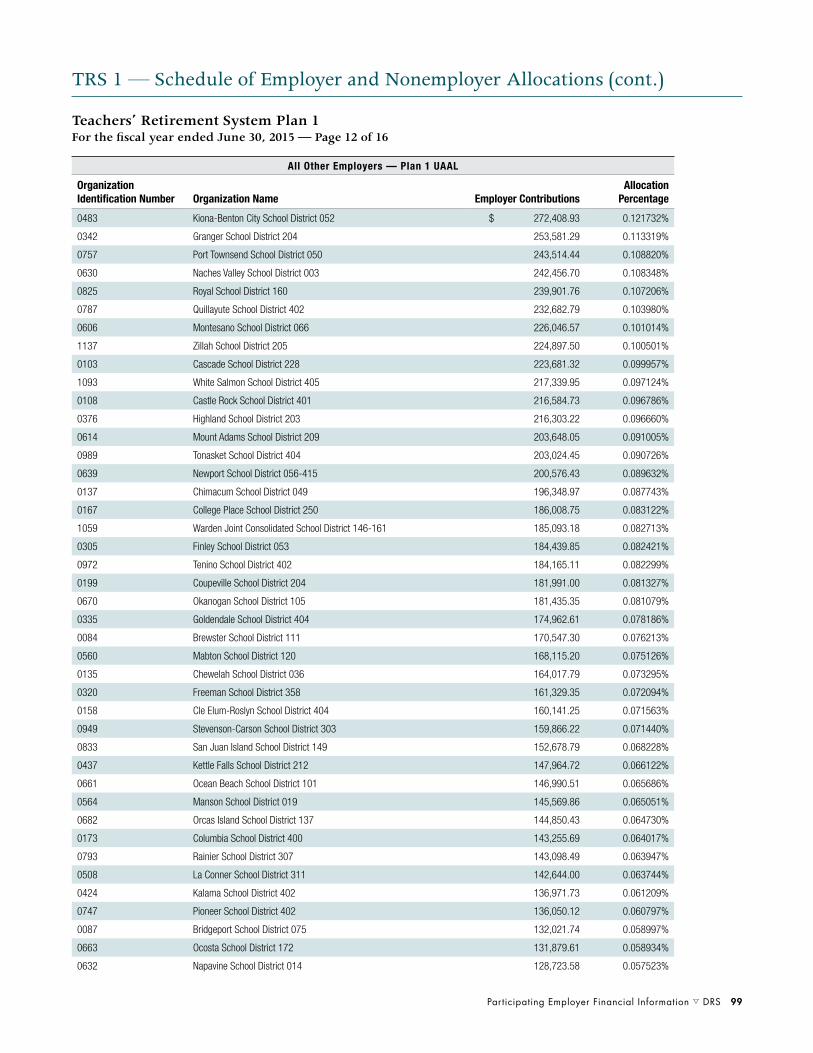
Participating Employer Financial Information s DRS 99
TRS 1 — Schedule of Employer and Nonemployer Allocations (cont.)
All Other Employers — Plan 1 UAAL
Organization Identification Number Organization Name Employer Contributions
Allocation Percentage
0483 Kiona-Benton City School District 052 $ 272,408.93 0.121732%
0342 Granger School District 204 253,581.29 0.113319%
0757 Port Townsend School District 050 243,514.44 0.108820%
0630 Naches Valley School District 003 242,456.70 0.108348%
0825 Royal School District 160 239,901.76 0.107206%
0787 Quillayute School District 402 232,682.79 0.103980%
0606 Montesano School District 066 226,046.57 0.101014%
1137 Zillah School District 205 224,897.50 0.100501%
0103 Cascade School District 228 223,681.32 0.099957%
1093 White Salmon School District 405 217,339.95 0.097124%
0108 Castle Rock School District 401 216,584.73 0.096786%
0376 Highland School District 203 216,303.22 0.096660%
0614 Mount Adams School District 209 203,648.05 0.091005%
0989 Tonasket School District 404 203,024.45 0.090726%
0639 Newport School District 056-415 200,576.43 0.089632%
0137 Chimacum School District 049 196,348.97 0.087743%
0167 College Place School District 250 186,008.75 0.083122%
1059 Warden Joint Consolidated School District 146-161 185,093.18 0.082713%
0305 Finley School District 053 184,439.85 0.082421%
0972 Tenino School District 402 184,165.11 0.082299%
0199 Coupeville School District 204 181,991.00 0.081327%
0670 Okanogan School District 105 181,435.35 0.081079%
0335 Goldendale School District 404 174,962.61 0.078186%
0084 Brewster School District 111 170,547.30 0.076213%
0560 Mabton School District 120 168,115.20 0.075126%
0135 Chewelah School District 036 164,017.79 0.073295%
0320 Freeman School District 358 161,329.35 0.072094%
0158 Cle Elum-Roslyn School District 404 160,141.25 0.071563%
0949 Stevenson-Carson School District 303 159,866.22 0.071440%
0833 San Juan Island School District 149 152,678.79 0.068228%
0437 Kettle Falls School District 212 147,964.72 0.066122%
0661 Ocean Beach School District 101 146,990.51 0.065686%
0564 Manson School District 019 145,569.86 0.065051%
0682 Orcas Island School District 137 144,850.43 0.064730%
0173 Columbia School District 400 143,255.69 0.064017%
0793 Rainier School District 307 143,098.49 0.063947%
0508 La Conner School District 311 142,644.00 0.063744%
0424 Kalama School District 402 136,971.73 0.061209%
0747 Pioneer School District 402 136,050.12 0.060797%
0087 Bridgeport School District 075 132,021.74 0.058997%
0663 Ocosta School District 172 131,879.61 0.058934%
0632 Napavine School District 014 128,723.58 0.057523%
Teachers’ Retirement System Plan 1For the fiscal year ended June 30, 2015 — Page 12 of 16

100 DRS s Participating Employer Financial Information
TRS 1 — Schedule of Employer and Nonemployer Allocations (cont.)
All Other Employers — Plan 1 UAAL
Organization Identification Number Organization Name Employer Contributions
Allocation Percentage
0988 Toledo School District 237 $ 128,573.41 0.057456%
0339 Grand Coulee Dam School District 301 126,798.53 0.056663%
0680 Onalaska School District 300 125,145.13 0.055924%
0098 Cape Flattery School District 401 121,576.15 0.054329%
0029 Asotin-Anatone School District 420 119,926.66 0.053592%
0501 Kittitas School District 403 115,385.34 0.051563%
0908 South Bend School District 118 114,743.03 0.051276%
0181 Concrete School District 011 113,583.08 0.050757%
1106 Winlock School District 232 112,242.90 0.050158%
1069 Wellpinit School District 049 111,371.68 0.049769%
0588 Methow Valley School District 350 110,181.87 0.049237%
0368 Griffin School District 324 110,021.55 0.049166%
0645 North Beach School District 064 109,072.45 0.048742%
0687 Oroville School District 410 107,831.93 0.048187%
0165 Colfax School District 300 106,647.77 0.047658%
0797 Raymond School District 116 106,154.23 0.047438%
0798 Reardan-Edwall School District 009 103,976.57 0.046464%
0262 Educational Service District 113 103,410.27 0.046211%
1026 Valley School District 070 102,515.93 0.045812%
0994 Toutle Lake School District 130 102,293.69 0.045712%
1007 Union Gap School District 002 101,859.17 0.045518%
0223 Davenport School District 207 101,008.29 0.045138%
0267 Northwest Regional Educational Service District 100,124.84 0.044743%
0568 Mary Walker School District 207 99,729.91 0.044567%
0260 Educational Service District 105 96,754.32 0.043237%
0905 Soap Lake School District 156 95,087.01 0.042492%
0536 Liberty School District 362 93,070.03 0.041591%
0613 Mossyrock School District 206 90,982.48 0.040658%
0634 Naselle-Grays River Valley School District 90,612.99 0.040493%
0219 Darrington School District 330 90,281.54 0.040344%
0010 Adna School District 226 88,424.29 0.039514%
0225 Dayton School District 002 87,579.27 0.039137%
0266 North Central WA Educational Service District 86,525.79 0.038666%
0189 Conway School District 317 84,913.26 0.037946%
0805 Republic School District 309 82,494.45 0.036865%
1091 White Pass School District 303 79,747.13 0.035637%
0263 Olympic Educational Service District 77,622.69 0.034688%
1102 Willapa Valley School District 160 77,528.51 0.034645%
1043 Wahkiakum School District 200 72,033.97 0.032190%
0814 Ritzville School District 160 70,899.98 0.031683%
0278 Entiat School District 127 69,000.25 0.030834%
0259 Northeast WA Educational Service District 101 68,157.41 0.030458%
Teachers’ Retirement System Plan 1For the fiscal year ended June 30, 2015 — Page 13 of 16
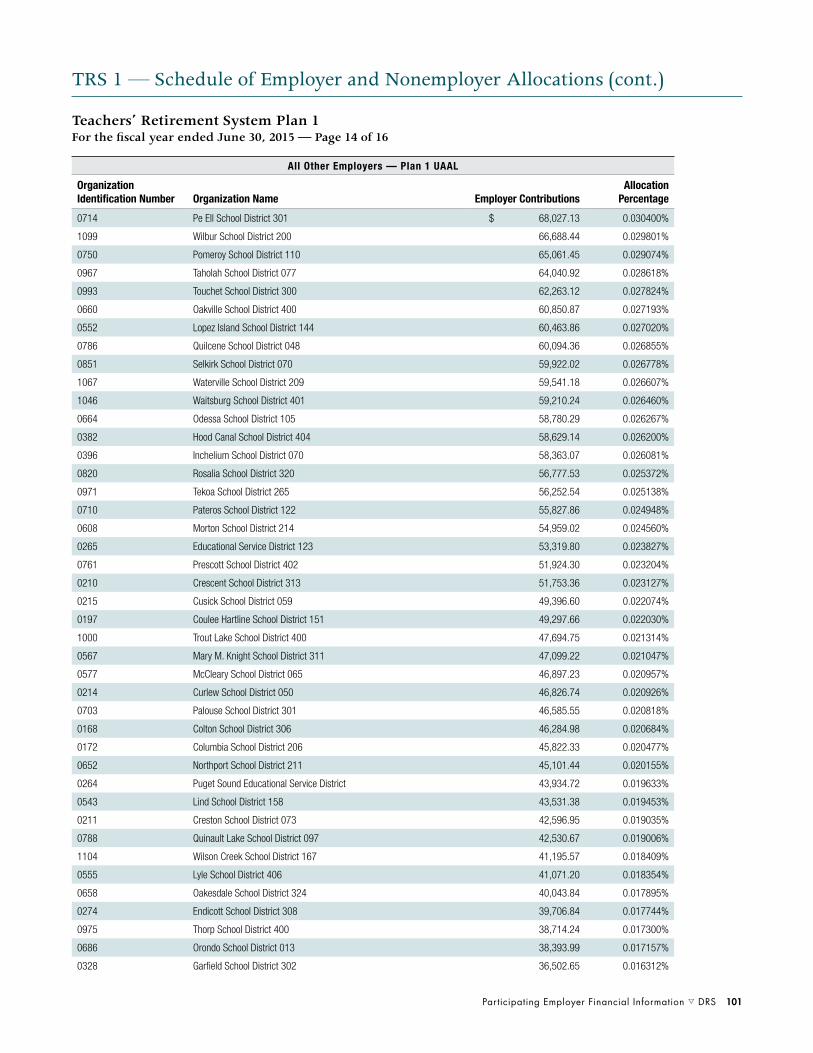
Participating Employer Financial Information s DRS 101
TRS 1 — Schedule of Employer and Nonemployer Allocations (cont.)
All Other Employers — Plan 1 UAAL
Organization Identification Number Organization Name Employer Contributions
Allocation Percentage
0714 Pe Ell School District 301 $ 68,027.13 0.030400%
1099 Wilbur School District 200 66,688.44 0.029801%
0750 Pomeroy School District 110 65,061.45 0.029074%
0967 Taholah School District 077 64,040.92 0.028618%
0993 Touchet School District 300 62,263.12 0.027824%
0660 Oakville School District 400 60,850.87 0.027193%
0552 Lopez Island School District 144 60,463.86 0.027020%
0786 Quilcene School District 048 60,094.36 0.026855%
0851 Selkirk School District 070 59,922.02 0.026778%
1067 Waterville School District 209 59,541.18 0.026607%
1046 Waitsburg School District 401 59,210.24 0.026460%
0664 Odessa School District 105 58,780.29 0.026267%
0382 Hood Canal School District 404 58,629.14 0.026200%
0396 Inchelium School District 070 58,363.07 0.026081%
0820 Rosalia School District 320 56,777.53 0.025372%
0971 Tekoa School District 265 56,252.54 0.025138%
0710 Pateros School District 122 55,827.86 0.024948%
0608 Morton School District 214 54,959.02 0.024560%
0265 Educational Service District 123 53,319.80 0.023827%
0761 Prescott School District 402 51,924.30 0.023204%
0210 Crescent School District 313 51,753.36 0.023127%
0215 Cusick School District 059 49,396.60 0.022074%
0197 Coulee Hartline School District 151 49,297.66 0.022030%
1000 Trout Lake School District 400 47,694.75 0.021314%
0567 Mary M. Knight School District 311 47,099.22 0.021047%
0577 McCleary School District 065 46,897.23 0.020957%
0214 Curlew School District 050 46,826.74 0.020926%
0703 Palouse School District 301 46,585.55 0.020818%
0168 Colton School District 306 46,284.98 0.020684%
0172 Columbia School District 206 45,822.33 0.020477%
0652 Northport School District 211 45,101.44 0.020155%
0264 Puget Sound Educational Service District 43,934.72 0.019633%
0543 Lind School District 158 43,531.38 0.019453%
0211 Creston School District 073 42,596.95 0.019035%
0788 Quinault Lake School District 097 42,530.67 0.019006%
1104 Wilson Creek School District 167 41,195.57 0.018409%
0555 Lyle School District 406 41,071.20 0.018354%
0658 Oakesdale School District 324 40,043.84 0.017895%
0274 Endicott School District 308 39,706.84 0.017744%
0975 Thorp School District 400 38,714.24 0.017300%
0686 Orondo School District 013 38,393.99 0.017157%
0328 Garfield School District 302 36,502.65 0.016312%
Teachers’ Retirement System Plan 1For the fiscal year ended June 30, 2015 — Page 14 of 16

102 DRS s Participating Employer Financial Information
TRS 1 — Schedule of Employer and Nonemployer Allocations (cont.)
All Other Employers — Plan 1 UAAL
Organization Identification Number Organization Name Employer Contributions
Allocation Percentage
0369 Harrington School District 204 $ 36,245.63 0.016197%
0929 Saint John School District 322 35,898.70 0.016042%
0512 Lacrosse School District 126 35,818.94 0.016007%
1064 Washtucna School District 109 35,246.95 0.015751%
0562 Mansfield School District 207 34,568.83 0.015448%
1109 Wishkah Valley School District 117 34,087.11 0.015233%
0067 Bickleton School District 203 33,537.87 0.014987%
0194 Cosmopolis School District 099 33,119.55 0.014800%
0878 Skykomish School District 404 32,524.57 0.014534%
0099 Carbonado Historical School District 019 31,925.85 0.014267%
0928 Sprague School District 008 30,404.33 0.013587%
0911 Southside School District 042 30,122.49 0.013461%
1110 Wishram School District 094 29,642.45 0.013246%
0017 Almira School District 017 29,570.38 0.013214%
0250 Easton School District 028 29,568.09 0.013213%
0505 Klickitat School District 402 28,865.27 0.012899%
0356 Grapeview School District 054 28,156.62 0.012582%
0421 Kahlotus School District 056 27,652.54 0.012357%
0712 Paterson School District 050 27,116.58 0.012118%
0637 Nespelem School District 014 26,338.89 0.011770%
0366 Green Mountain School District 103 23,956.75 0.010706%
0332 Glenwood School District 401 23,202.19 0.010368%
0641 North River School District 200 22,344.15 0.009985%
0551 Loon Lake School District 183 21,232.13 0.009488%
0953 Summit Valley School District 202 17,294.29 0.007728%
0074 Boistfort School District 234 16,415.86 0.007336%
0685 Orient School District 065 14,815.85 0.006621%
0785 Queets-Clearwater School District 020 13,329.48 0.005957%
0113 Centerville School District 215 12,979.91 0.005800%
0684 Orchard Prairie School District 123 12,444.02 0.005561%
0089 Brinnon School District 046 12,138.79 0.005425%
0523 Lamont School District 264 10,879.11 0.004862%
0425 Keller School District 003 9,499.88 0.004245%
0397 Index School District 063 9,205.57 0.004114%
0945 Steptoe School District 304 9,177.59 0.004101%
0681 Onion Creek School District 030 9,170.27 0.004098%
0877 Skamania School District 002 8,979.03 0.004012%
0616 Mount Pleasant School District 029-93 8,875.39 0.003966%
0363 Great Northern School District 312 8,468.80 0.003784%
0933 Starbuck School District 035 6,916.63 0.003091%
0819 Roosevelt School District 403 6,171.54 0.002758%
0292 Evergreen School District 205 5,850.35 0.002614%
Teachers’ Retirement System Plan 1For the fiscal year ended June 30, 2015 — Page 15 of 16
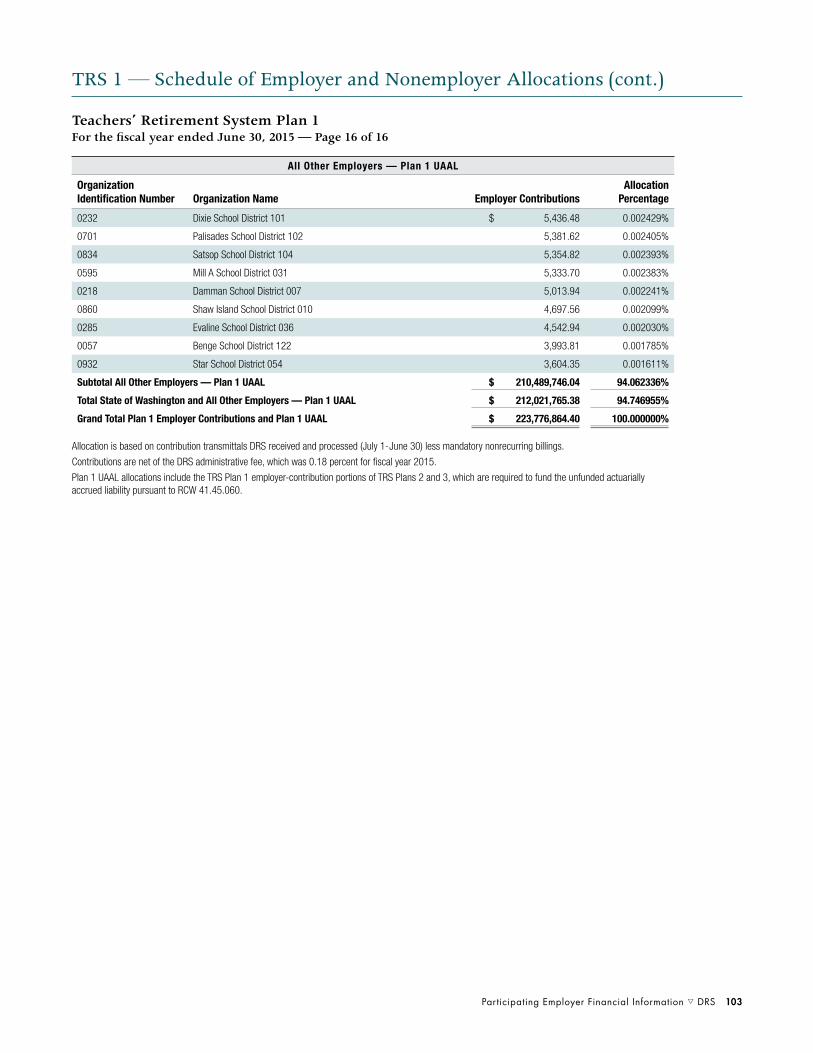
Participating Employer Financial Information s DRS 103
TRS 1 — Schedule of Employer and Nonemployer Allocations (cont.)
All Other Employers — Plan 1 UAAL
Organization Identification Number Organization Name Employer Contributions
Allocation Percentage
0232 Dixie School District 101 $ 5,436.48 0.002429%
0701 Palisades School District 102 5,381.62 0.002405%
0834 Satsop School District 104 5,354.82 0.002393%
0595 Mill A School District 031 5,333.70 0.002383%
0218 Damman School District 007 5,013.94 0.002241%
0860 Shaw Island School District 010 4,697.56 0.002099%
0285 Evaline School District 036 4,542.94 0.002030%
0057 Benge School District 122 3,993.81 0.001785%
0932 Star School District 054 3,604.35 0.001611%
Subtotal All Other Employers — Plan 1 UAAL $ 210,489,746.04 94.062336%
Total State of Washington and All Other Employers — Plan 1 UAAL $ 212,021,765.38 94.746955%
Grand Total Plan 1 Employer Contributions and Plan 1 UAAL $ 223,776,864.40 100.000000%
Teachers’ Retirement System Plan 1For the fiscal year ended June 30, 2015 — Page 16 of 16
Allocation is based on contribution transmittals DRS received and processed (July 1-June 30) less mandatory nonrecurring billings.
Contributions are net of the DRS administrative fee, which was 0.18 percent for fiscal year 2015.
Plan 1 UAAL allocations include the TRS Plan 1 employer-contribution portions of TRS Plans 2 and 3, which are required to fund the unfunded actuarially accrued liability pursuant to RCW 41.45.060.

104 DRS s Participating Employer Financial Information
TRS 2/3 — Schedule of Employer Allocations
State of Washington — Employer Allocations
Organization Identification Number Organization Name Employer Contributions
Allocation Percentage
1021 WA State University $ 359,624.59 0.135326%
1219 University of WA 305,200.26 0.114846%
0938 School for the Blind 132,137.86 0.049723%
0939 Center for Childhood Deafness WA State 112,559.93 0.042356%
0179 Spokane Community College 73,369.16 0.027609%
0152 Clark Community College 70,112.53 0.026383%
0963 Tacoma Community College 69,729.84 0.026239%
0117 Central WA University 69,629.13 0.026201%
0839 Seattle Community College 61,251.05 0.023049%
1591 South Puget Sound Community College 57,183.53 0.021518%
0049 Bellevue Community College 46,584.91 0.017530%
0247 Eastern WA University 42,309.11 0.015921%
1079 Western WA University 42,121.17 0.015850%
0360 Grays Harbor College 32,459.93 0.012215%
1668 Clover Park Technical College 29,669.90 0.011165%
0864 Shoreline Community College 28,766.43 0.010825%
0367 Green River Community College 27,532.01 0.010360%
0178 Centralia College 27,032.82 0.010172%
0256 Edmonds Community College 26,163.83 0.009845%
0377 Highline Community College 25,815.39 0.009714%
0741 Pierce College 24,392.05 0.009179%
0974 Evergreen State College 24,301.67 0.009145%
1667 Bellingham Technical College 21,159.69 0.007962%
0554 Lower Columbia Community College 20,106.63 0.007566%
1674 Bates Technical College 19,655.32 0.007396%
0287 Everett Community College 19,568.01 0.007363%
1130 Yakima Valley College 19,448.96 0.007319%
0675 Olympic College 19,264.08 0.007249%
1053 Walla Walla Community College 17,962.18 0.006759%
0068 Big Bend Community College 17,387.21 0.006543%
1673 Lake Washington Institute of Technology 16,134.58 0.006071%
1088 Whatcom Community College 15,199.77 0.005720%
1666 Renton Technical College 14,709.79 0.005535%
0169 Columbia Basin Community College 10,116.49 0.003807%
0873 Skagit Valley College 6,617.85 0.002490%
0176 Community & Technical Colleges State Board for 5,850.36 0.002201%
1074 Wenatchee Valley College 3,754.90 0.001413%
0717 Peninsula College 2,410.80 0.000907%
2008 Cascadia Community College 2,158.00 0.000812%
1078 Western State Hospital 1,792.56 0.000675%
0254 Ecology Department of 1,216.17 0.000458%
0997 Transportation Department of 480.04 0.000181%
Teachers’ Retirement System Plans 2 and 3For the fiscal year ended June 30, 2015 — Page 1 of 9

Participating Employer Financial Information s DRS 105
TRS 2/3 — Schedule of Employer Allocations (cont.)
State of Washington — Employer Allocations
Organization Identification Number Organization Name Employer Contributions
Allocation Percentage
0906 Social & Health Services Department of $ 382.48 0.000144%
0298 Ferries WA State 152.15 0.000057%
Subtotal State of Washington — Employer Allocations $ 1,923,475.12 0.723798%
Teachers’ Retirement System Plans 2 and 3For the fiscal year ended June 30, 2015 — Page 2 of 9
All Other Employers — Employer Allocations
Organization Identification Number Organization Name Employer Contributions
Allocation Percentage
0844 Seattle School District 001 $ 15,048,761.44 5.662808%
0966 Tacoma School District 010 8,522,516.37 3.207000%
0926 Spokane Public Schools 8,309,907.18 3.126996%
0518 Lake Washington School District 414 7,033,264.49 2.646598%
0435 Kent School District 415 7,021,184.03 2.642053%
0291 Evergreen School District 114 6,735,260.82 2.534460%
0294 Federal Way School District 210 5,754,300.81 2.165328%
0258 Edmonds School District 015 5,614,524.12 2.112730%
0290 Everett School District 002 5,512,496.45 2.074337%
1031 Vancouver School District 037 5,483,520.38 2.063434%
0050 Bellevue School District 405 5,482,730.42 2.063137%
0653 Northshore School District 417 5,330,002.44 2.005665%
0378 Highline School District 401 5,017,410.61 1.888038%
0784 Puyallup School District 003 4,982,139.12 1.874765%
0415 Issaquah School District 411 4,462,307.79 1.679154%
0623 Mukilteo School District 006 4,307,756.89 1.620997%
0066 Bethel School District 403 4,251,906.89 1.599981%
1128 Yakima School District 007 4,232,834.62 1.592804%
0039 Auburn School District 408 4,165,580.31 1.567497%
0804 Renton School District 403 3,957,319.32 1.489129%
0433 Kennewick School District 017 3,951,165.04 1.486813%
0709 Pasco School District 001 3,877,706.48 1.459170%
0651 North Thurston Public Schools 3,484,269.89 1.311121%
0161 Clover Park School District 400 3,441,775.87 1.295131%
0115 Central Valley School District 356 3,172,293.78 1.193726%
0570 Marysville School District 025 3,087,278.86 1.161735%
0045 Battle Ground School District 119 3,006,300.67 1.131263%
0054 Bellingham School District 501 2,972,742.21 1.118635%
0114 Central Kitsap School District 401 2,751,028.55 1.035205%
0810 Richland School District 400 2,491,491.02 0.937541%
0898 Snohomish School District 201 2,443,128.85 0.919343%
0673 Olympia School District 111 2,270,764.28 0.854482%
0580 Mead School District 354 2,269,088.84 0.853852%
0865 Shoreline School District 412 2,212,126.99 0.832417%
0955 Sumner School District 320 2,156,247.52 0.811390%

106 DRS s Participating Employer Financial Information
TRS 2/3 — Schedule of Employer Allocations (cont.)
All Other Employers — Employer Allocations
Organization Identification Number Organization Name Employer Contributions
Allocation Percentage
0910 South Kitsap School District 402 $ 2,130,030.04 0.801525%
0718 Peninsula School District 401 2,065,246.46 0.777147%
0319 Franklin Pierce School District 402 1,982,260.81 0.745919%
0517 Lake Stevens School District 004 1,921,305.68 0.722982%
0611 Moses Lake School District 161 1,895,240.67 0.713174%
1073 Wenatchee School District 246 1,878,336.36 0.706813%
0618 Mount Vernon School District 320 1,676,109.09 0.630715%
0968 Tahoma School District 409 1,656,421.67 0.623307%
0604 Monroe School District 103 1,627,778.06 0.612528%
0550 Longview School District 122 1,585,526.66 0.596629%
1003 Tumwater School District 033 1,531,378.76 0.576254%
0096 Camas School District 117 1,520,530.70 0.572172%
0958 Sunnyside School District 201 1,461,471.91 0.549948%
0902 Snoqualmie Valley School District 410 1,449,745.75 0.545535%
1056 Walla Walla School District 140 1,444,000.82 0.543374%
1020 University Place School District 083 1,418,829.52 0.533902%
0026 Arlington School District 016 1,397,381.26 0.525831%
0649 North Kitsap School District 400 1,376,606.00 0.518013%
0249 Eastmont School District 206 1,371,611.52 0.516134%
0656 Oak Harbor School District 201 1,299,122.81 0.488856%
1134 Yelm School District 002 1,294,934.80 0.487280%
0082 Bremerton School District 100 1,242,531.90 0.467561%
0297 Ferndale School District 502 1,179,889.67 0.443989%
0428 Kelso School District 458 1,140,776.81 0.429271%
0931 Stanwood-Camano School District 401 1,116,074.45 0.419976%
0243 East Valley School District 361 1,111,791.31 0.418364%
0585 Mercer Island School District 400 1,067,501.30 0.401698%
0133 Cheney School District 360 1,061,773.15 0.399542%
1076 West Valley School District 208 1,036,623.85 0.390079%
0848 Sedro-Woolley School District 101 1,023,355.78 0.385086%
0863 Shelton School District 309 1,007,993.43 0.379305%
0042 Bainbridge Island School District 303 1,001,503.77 0.376863%
0280 Enumclaw School District 216 1,000,816.84 0.376605%
1092 White River School District 416 931,503.72 0.350522%
0753 Port Angeles School District 121 923,675.62 0.347577%
0094 Burlington-Edison School District 100 894,586.61 0.336631%
0303 Fife School District 417 864,831.23 0.325434%
0695 Othello School District 147 847,237.11 0.318813%
0002 Aberdeen School District 005 843,611.20 0.317449%
0992 Toppenish School District 202 840,551.69 0.316297%
1077 West Valley School District 363 836,688.18 0.314843%
0909 Tukwila School District 406 807,848.04 0.303991%
Teachers’ Retirement System Plans 2 and 3For the fiscal year ended June 30, 2015 — Page 3 of 9

Participating Employer Financial Information s DRS 107
TRS 2/3 — Schedule of Employer Allocations (cont.)
All Other Employers — Employer Allocations
Organization Identification Number Organization Name Employer Contributions
Allocation Percentage
1058 Wapato School District 207 $ 806,275.98 0.303399%
0850 Selah School District 119 798,512.92 0.300478%
0119 Centralia School District 401 764,156.57 0.287550%
0341 Grandview School District 200 747,611.24 0.281324%
0122 Chehalis School District 302 710,543.37 0.267376%
0816 Riverview School District 407 696,261.38 0.262001%
0943 Steilacoom Historical School District 001 693,672.00 0.261027%
0020 Anacortes School District 103 680,420.16 0.256040%
0621 East Valley School District 090 679,604.16 0.255733%
0767 Prosser School District 116 672,535.14 0.253073%
0679 Omak School District 019 665,010.34 0.250242%
0790 Quincy School District 144 657,344.56 0.247357%
1063 Washougal School District 112-6 655,919.77 0.246821%
0270 Ellensburg School District 401 655,300.63 0.246588%
0857 Sequim School District 323 635,577.06 0.239166%
0557 Lynden School District 504 628,533.23 0.236515%
0156 Clarkston School District 250 612,432.37 0.230457%
0691 Orting School District 344 558,079.35 0.210004%
0521 Lakewood School District 306 536,291.85 0.201805%
0284 Ephrata School District 165 531,756.76 0.200099%
0615 Mount Baker School District 507 520,609.66 0.195904%
0781 Pullman School District 267 516,839.56 0.194485%
0344 Granite Falls School District 332 507,488.54 0.190967%
0072 Blaine School District 503 492,254.39 0.185234%
1044 Wahluke School District 073 491,104.27 0.184801%
0817 Rochester School District 401 489,301.81 0.184123%
0227 Deer Park School District 414 479,117.43 0.180291%
0950 Sultan School District 311 476,592.00 0.179340%
0648 North Franklin School District 051 464,181.14 0.174670%
1113 Woodland School District 404 438,017.02 0.164825%
0650 North Mason School District 403 424,393.12 0.159698%
0175 Colville School District 115 411,078.56 0.154688%
0643 Nooksack Valley School District 506 408,351.39 0.153662%
0903 South Whidbey School District 206 407,813.60 0.153459%
0251 Eatonville School District 404 398,054.75 0.149787%
0640 Nine Mile Falls School District 325 395,359.85 0.148773%
0261 Educational Service District 112 389,282.61 0.146486%
0582 Medical Lake School District 326 387,733.07 0.145903%
0381 Hockinson School District 098 383,444.44 0.144289%
0815 Riverside School District 416 377,195.36 0.141938%
1032 Vashon Island School District 402 370,846.73 0.139549%
0106 Cashmere School District 222 370,226.32 0.139315%
Teachers’ Retirement System Plans 2 and 3For the fiscal year ended June 30, 2015 — Page 4 of 9
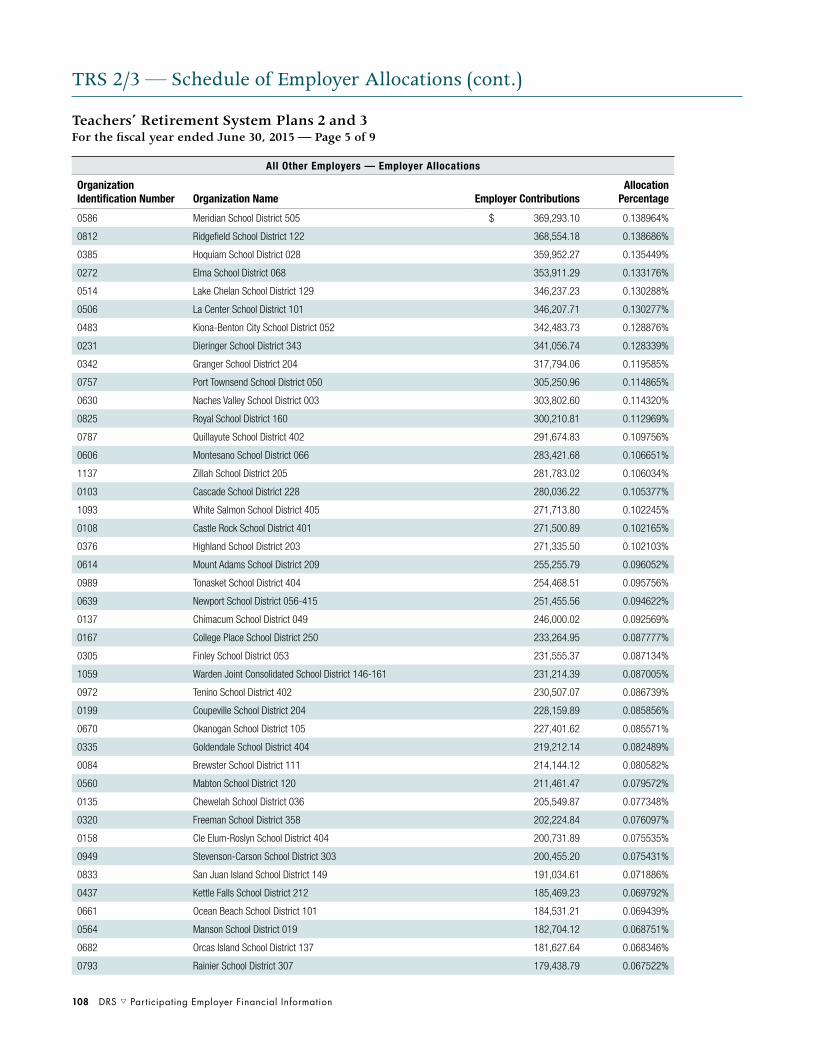
108 DRS s Participating Employer Financial Information
TRS 2/3 — Schedule of Employer Allocations (cont.)
All Other Employers — Employer Allocations
Organization Identification Number Organization Name Employer Contributions
Allocation Percentage
0586 Meridian School District 505 $ 369,293.10 0.138964%
0812 Ridgefield School District 122 368,554.18 0.138686%
0385 Hoquiam School District 028 359,952.27 0.135449%
0272 Elma School District 068 353,911.29 0.133176%
0514 Lake Chelan School District 129 346,237.23 0.130288%
0506 La Center School District 101 346,207.71 0.130277%
0483 Kiona-Benton City School District 052 342,483.73 0.128876%
0231 Dieringer School District 343 341,056.74 0.128339%
0342 Granger School District 204 317,794.06 0.119585%
0757 Port Townsend School District 050 305,250.96 0.114865%
0630 Naches Valley School District 003 303,802.60 0.114320%
0825 Royal School District 160 300,210.81 0.112969%
0787 Quillayute School District 402 291,674.83 0.109756%
0606 Montesano School District 066 283,421.68 0.106651%
1137 Zillah School District 205 281,783.02 0.106034%
0103 Cascade School District 228 280,036.22 0.105377%
1093 White Salmon School District 405 271,713.80 0.102245%
0108 Castle Rock School District 401 271,500.89 0.102165%
0376 Highland School District 203 271,335.50 0.102103%
0614 Mount Adams School District 209 255,255.79 0.096052%
0989 Tonasket School District 404 254,468.51 0.095756%
0639 Newport School District 056-415 251,455.56 0.094622%
0137 Chimacum School District 049 246,000.02 0.092569%
0167 College Place School District 250 233,264.95 0.087777%
0305 Finley School District 053 231,555.37 0.087134%
1059 Warden Joint Consolidated School District 146-161 231,214.39 0.087005%
0972 Tenino School District 402 230,507.07 0.086739%
0199 Coupeville School District 204 228,159.89 0.085856%
0670 Okanogan School District 105 227,401.62 0.085571%
0335 Goldendale School District 404 219,212.14 0.082489%
0084 Brewster School District 111 214,144.12 0.080582%
0560 Mabton School District 120 211,461.47 0.079572%
0135 Chewelah School District 036 205,549.87 0.077348%
0320 Freeman School District 358 202,224.84 0.076097%
0158 Cle Elum-Roslyn School District 404 200,731.89 0.075535%
0949 Stevenson-Carson School District 303 200,455.20 0.075431%
0833 San Juan Island School District 149 191,034.61 0.071886%
0437 Kettle Falls School District 212 185,469.23 0.069792%
0661 Ocean Beach School District 101 184,531.21 0.069439%
0564 Manson School District 019 182,704.12 0.068751%
0682 Orcas Island School District 137 181,627.64 0.068346%
0793 Rainier School District 307 179,438.79 0.067522%
Teachers’ Retirement System Plans 2 and 3For the fiscal year ended June 30, 2015 — Page 5 of 9

Participating Employer Financial Information s DRS 109
TRS 2/3 — Schedule of Employer Allocations (cont.)
All Other Employers — Employer Allocations
Organization Identification Number Organization Name Employer Contributions
Allocation Percentage
0173 Columbia School District 400 $ 179,216.04 0.067439%
0508 La Conner School District 311 178,510.71 0.067173%
0424 Kalama School District 402 171,664.18 0.064597%
0747 Pioneer School District 402 169,958.75 0.063955%
0087 Bridgeport School District 075 165,274.31 0.062192%
0663 Ocosta School District 172 165,161.35 0.062150%
0632 Napavine School District 014 161,346.14 0.060714%
0988 Toledo School District 237 161,169.59 0.060648%
0339 Grand Coulee Dam School District 301 159,032.55 0.059844%
0680 Onalaska School District 300 156,832.45 0.059016%
0098 Cape Flattery School District 401 152,073.64 0.057225%
0029 Asotin Anatone School District 420 149,858.91 0.056392%
0501 Kittitas School District 403 144,586.53 0.054408%
0908 South Bend School District 118 143,407.45 0.053964%
0181 Concrete School District 011 142,374.53 0.053575%
1106 Winlock School District 232 140,691.35 0.052942%
1069 Wellpinit School District 049 139,615.64 0.052537%
0588 Methow Valley School District 350 138,102.80 0.051968%
0368 Griffin School District 324 137,868.62 0.051880%
0645 North Beach School District 064 136,784.16 0.051472%
0687 Oroville School District 410 135,147.67 0.050856%
0165 Colfax School District 300 133,649.04 0.050292%
0797 Raymond School District 116 133,056.04 0.050069%
0798 Reardan-Edwall School District 009 130,325.57 0.049041%
0262 Educational Service District 113 129,587.09 0.048763%
1026 Valley School District 070 128,553.99 0.048375%
0994 Toutle Lake School District 130 128,418.38 0.048323%
1007 Union Gap School District 002 127,655.61 0.048036%
0223 Davenport School District 207 126,628.90 0.047650%
0267 Northwest Regional Educational Service District 125,429.87 0.047199%
0568 Mary Walker School District 207 124,435.83 0.046825%
0260 Educational Service District 105 121,305.16 0.045647%
0905 Soap Lake School District 156 119,127.51 0.044827%
0536 Liberty School District 362 116,652.73 0.043896%
0613 Mossyrock School District 206 114,062.58 0.042921%
0634 Naselle-Grays River Valley School District 113,898.87 0.042860%
0219 Darrington School District 330 113,169.66 0.042585%
0010 Adna School District 226 110,832.78 0.041706%
0225 Dayton School District 002 110,119.81 0.041438%
0266 North Central WA Educational Service District 108,499.84 0.040828%
0189 Conway School District 317 106,561.66 0.040099%
0805 Republic School District 309 103,573.90 0.038975%
Teachers’ Retirement System Plans 2 and 3For the fiscal year ended June 30, 2015 — Page 6 of 9

110 DRS s Participating Employer Financial Information
TRS 2/3 — Schedule of Employer Allocations (cont.)
All Other Employers — Employer Allocations
Organization Identification Number Organization Name Employer Contributions
Allocation Percentage
1091 White Pass School District 303 $ 99,929.68 0.037603%
0263 Olympic Educational Service District 97,359.85 0.036636%
1102 Willapa Valley School District 160 97,099.66 0.036538%
1043 Wahkiakum School District 200 90,315.88 0.033986%
0814 Ritzville School District 160 88,592.03 0.033337%
0278 Entiat School District 127 86,511.66 0.032554%
0259 Northeast WA Educational Service District 101 85,429.00 0.032147%
0714 Pe Ell School District 301 85,283.36 0.032092%
1099 Wilbur School District 200 83,535.29 0.031434%
0750 Pomeroy School District 110 81,545.92 0.030686%
0967 Taholah School District 077 80,166.77 0.030167%
0993 Touchet School District 300 78,077.82 0.029380%
0660 Oakville School District 400 76,303.94 0.028713%
0552 Lopez Island School District 144 75,575.33 0.028439%
0786 Quilcene School District 048 75,324.97 0.028345%
0851 Selkirk School District 070 75,084.77 0.028254%
1067 Waterville School District 209 74,414.87 0.028002%
1046 Waitsburg School District 401 74,273.67 0.027949%
0664 Odessa School District 105 73,644.52 0.027712%
0382 Hood Canal School District 404 73,484.68 0.027652%
0396 Inchelium School District 070 73,079.67 0.027500%
0820 Rosalia School District 320 71,159.73 0.026777%
0971 Tekoa School District 265 70,528.85 0.026540%
0710 Pateros School District 122 69,730.49 0.026239%
0608 Morton School District 214 68,887.10 0.025922%
0265 Educational Service District 123 66,941.78 0.025190%
0761 Prescott School District 402 65,032.41 0.024472%
0210 Crescent School District 313 64,846.93 0.024402%
0215 Cusick School District 059 61,895.48 0.023291%
0197 Coulee Hartline School District 151 61,795.96 0.023254%
1000 Trout Lake School District 400 59,784.92 0.022497%
0567 Mary M. Knight School District 311 59,017.40 0.022208%
0577 McCleary School District 065 58,840.02 0.022141%
0214 Curlew School District 050 58,734.41 0.022102%
0703 Palouse School District 301 58,203.95 0.021902%
0168 Colton School District 306 58,023.22 0.021834%
0172 Columbia School District 206 57,414.58 0.021605%
0652 Northport School District 211 56,223.74 0.021157%
0264 Puget Sound Educational Service District 55,064.34 0.020721%
0543 Lind School District 158 54,536.33 0.020522%
0211 Creston School District 073 53,406.98 0.020097%
0788 Quinault Lake School District 097 53,041.88 0.019960%
Teachers’ Retirement System Plans 2 and 3For the fiscal year ended June 30, 2015 — Page 7 of 9

Participating Employer Financial Information s DRS 111
TRS 2/3 — Schedule of Employer Allocations (cont.)
All Other Employers — Employer Allocations
Organization Identification Number Organization Name Employer Contributions
Allocation Percentage
0555 Lyle School District 406 $ 51,483.26 0.019373%
1104 Wilson Creek School District 167 51,187.71 0.019262%
0658 Oakesdale School District 324 50,193.77 0.018888%
0274 Endicott School District 308 49,751.57 0.018721%
0975 Thorp School District 400 48,691.74 0.018323%
0686 Orondo School District 013 48,104.91 0.018102%
0328 Garfield School District 302 45,602.98 0.017160%
0369 Harrington School District 204 45,423.21 0.017093%
0929 Saint John School District 322 45,034.50 0.016946%
0512 Lacrosse School District 126 44,984.31 0.016927%
1064 Washtucna School District 109 44,200.45 0.016633%
0562 Mansfield School District 207 43,358.78 0.016316%
1109 Wishkah Valley School District 117 42,583.73 0.016024%
0067 Bickleton School District 203 42,035.07 0.015818%
0194 Cosmopolis School District 099 41,564.13 0.015640%
0878 Skykomish School District 404 40,778.74 0.015345%
0099 Carbonado Historical School District 019 39,909.05 0.015018%
0928 Sprague School District 008 38,037.79 0.014314%
0911 Southside School District 042 37,707.98 0.014189%
0250 Easton School District 028 37,096.41 0.013959%
0017 Almira School District 017 37,055.38 0.013944%
1110 Wishram School District 094 37,001.85 0.013924%
0505 Klickitat School District 402 36,115.61 0.013590%
0356 Grapeview School District 054 35,301.49 0.013284%
0421 Kahlotus School District 056 34,537.93 0.012997%
0712 Paterson School District 050 33,938.18 0.012771%
0637 Nespelem School District 014 32,990.31 0.012414%
0366 Green Mountain School District 103 29,986.99 0.011284%
0332 Glenwood School District 401 29,080.51 0.010943%
0641 North River School District 200 27,960.02 0.010521%
0551 Loon Lake School District 183 26,616.30 0.010016%
0953 Summit Valley School District 202 21,684.56 0.008160%
0074 Boistfort School District 234 20,625.55 0.007761%
0685 Orient School District 065 18,525.14 0.006971%
0785 Queets-Clearwater School District 020 16,712.77 0.006289%
0113 Centerville School District 215 16,268.99 0.006122%
0684 Orchard Prairie School District 123 15,602.42 0.005871%
0089 Brinnon School District 046 15,210.43 0.005724%
0523 Lamont School District 264 13,637.75 0.005132%
0425 Keller School District 003 11,911.34 0.004482%
0397 Index School District 063 11,550.88 0.004347%
0945 Steptoe School District 304 11,516.98 0.004334%
Teachers’ Retirement System Plans 2 and 3For the fiscal year ended June 30, 2015 — Page 8 of 9

112 DRS s Participating Employer Financial Information
TRS 2/3 — Schedule of Employer Allocations (cont.)
All Other Employers — Employer Allocations
Organization Identification Number Organization Name Employer Contributions
Allocation Percentage
0681 Onion Creek School District 030 $ 11,478.82 0.004319%
0877 Skamania School District 002 11,255.49 0.004235%
0616 Mount Pleasant School District 029-93 11,122.55 0.004185%
0363 Great Northern School District 312 10,623.82 0.003998%
0933 Starbuck School District 035 8,633.82 0.003249%
0819 Roosevelt School District 403 7,735.78 0.002911%
0292 Evergreen School District 205 7,333.55 0.002760%
0232 Dixie School District 101 6,792.91 0.002556%
0834 Satsop School District 104 6,735.71 0.002535%
0701 Palisades School District 102 6,727.35 0.002531%
0595 Mill A School District 031 6,676.02 0.002512%
0218 Damman School District 007 6,321.18 0.002379%
0860 Shaw Island School District 010 5,897.97 0.002219%
0285 Evaline School District 036 5,694.12 0.002143%
0057 Benge School District 122 5,008.61 0.001885%
0932 Star School District 054 4,505.86 0.001696%
Subtotal All Other Employers — Employer Allocations $ 263,823,852.80 99.276202%
Grand Total State of Washington and All Other Employers — Employer Allocations $ 265,747,327.92 100.000000%
Teachers’ Retirement System Plans 2 and 3For the fiscal year ended June 30, 2015 — Page 9 of 9
Allocation is based on contribution transmittals DRS received and processed (July 1-June 30) less mandatory nonrecurring billings.
Contributions are net of the DRS administrative fee, which was 0.18 percent for fiscal year 2015.
Contributions are also net of the amounts collected under RCW 41.45.060, which Plan 2 and Plan 3 employers are required to contribute to the actuarially accrued liability of Plan 1.

Participating Employer Financial Information s DRS 113
LEOFF 1 — Schedule of Employer and Nonemployer Allocations
All Other Employers — Employer Allocations
Organization Identification Number Organization Name
Allocation Percentage
1904 Seattle City of (Fire) 1.785914%
0838 Seattle City of (Police Pension) 1.762864%
0962 Tacoma City of 1.093480%
1434 Spokane City of 0.961340%
0481 King County 0.603631%
0286 Everett City of 0.431425%
0048 Bellevue City of 0.288065%
1119 Yakima City of 0.268611%
0051 Bellingham City of 0.259501%
1028 Vancouver City of 0.246609%
0802 Renton City of 0.229885%
0742 Pierce County 0.221236%
0922 Spokane County 0.185702%
0078 Bremerton City of 0.175712%
0916 Spokane Valley Fire Department 0.156913%
0671 Olympia City of 0.135558%
0434 Kent City of 0.132902%
0896 Snohomish County 0.132754%
0001 Aberdeen City of 0.126017%
0809 Richland City of 0.125802%
0547 Longview City of 0.119600%
1048 Walla Walla City of 0.105656%
0038 Auburn City of 0.103718%
0153 Clark County 0.097091%
0558 Lynnwood City of 0.095558%
0783 Puyallup City of 0.081604%
1001 Tukwila City of 0.077944%
1071 Wenatchee City of 0.077203%
0429 Kennewick City of 0.075726%
0484 Kirkland City of 0.075351%
0843 Seattle Port of 0.073259%
1126 Yakima County 0.073200%
0743 Pierce County FPD 02 0.073105%
0490 Kitsap County 0.072079%
0584 Mercer Island City of 0.071143%
0706 Pasco City of 0.067488%
0800 Redmond City of 0.061310%
0255 Edmonds City of 0.054022%
0384 Hoquiam City of 0.053800%
0984 Thurston County 0.048745%
0451 South King Fire & Rescue 0.046662%
0118 Centralia City of 0.046024%
Law Enforcement Officers’ and Fire Fighters’ Retirement System Plan 1For the fiscal year ended June 30, 2015 — Page 1 of 4
All Other Employers — Employer Allocations
Organization Identification Number Organization Name
Allocation Percentage
0619 Mountlake Terrace City of 0.045130%
0426 Kelso City of 0.042208%
0617 Mount Vernon City of 0.041694%
0751 Port Angeles City of 0.041318%
0205 Cowlitz County 0.040473%
0269 Ellensburg City of 0.039784%
0732 Pierce County FPD 03 0.038033%
0076 Bothell City of 0.037398%
0887 Snohomish County FPD 01 0.036837%
0452 Shoreline Fire Department 0.035850%
1089 Whatcom County 0.035035%
0534 Lewis County 0.033869%
0124 Chelan County 0.031844%
0609 Moses Lake City of 0.031497%
0361 Grays Harbor County 0.031317%
0121 Chehalis City of 0.028815%
0355 Grant County 0.028598%
0018 Anacortes City of 0.028425%
0095 Camas City of 0.026403%
0780 Pullman City of 0.025707%
0061 Benton County 0.024967%
0872 Skagit County 0.024877%
0735 Pierce County FPD 06 0.024698%
0956 Sunnyside City of 0.024069%
0511 Lacey City of 0.023373%
1002 Tumwater City of 0.023112%
0441 North Highline Fire District 0.022530%
0440 King County FPD 10 0.021387%
0924 Spokane International Airport 0.020548%
0861 Shelton City of 0.019705%
0573 Mason County 0.018902%
0148 Clark County FPD 06 0.017115%
0141 Clallam County 0.016854%
0980 Thurston County FPD 03 0.016272%
0443 King County FPD 16 0.016270%
0488 South Kitsap Fire & Rescue 0.016043%
0569 Marysville City of 0.015457%
0954 Sumner City of 0.015402%
0413 Island County 0.015336%
0444 King County FPD 02 0.015148%
0913 Spokane International Airport 0.014646%
1049 Walla Walla County 0.014572%

114 DRS s Participating Employer Financial Information
LEOFF 1 — Schedule of Employer and Nonemployer Allocations (cont.)
Law Enforcement Officers’ and Fire Fighters’ Retirement System Plan 1For the fiscal year ended June 30, 2015 — Page 2 of 4
All Other Employers — Employer Allocations
Organization Identification Number Organization Name
Allocation Percentage
0414 Issaquah City of 0.014498%
0279 Enumclaw City of 0.014399%
0132 Cheney City of 0.014061%
0340 Grandview City of 0.013781%
0417 Jefferson County 0.013277%
0692 Othello City of 0.013048%
0991 Toppenish City of 0.012865%
0154 Clarkston City of 0.012831%
0229 Des Moines City of 0.012137%
0233 Douglas County FPD 02 0.011903%
0318 Franklin County 0.011665%
0755 Port Townsend City of 0.011599%
0025 Arlington City of 0.011355%
2237 Valley Regional Fire Authority 0.011304%
0944 Steilacoom Town of 0.011058%
0734 Pierce County FPD 05 0.010898%
0485 Central Kitsap Fire & Rescue 0.010322%
0847 Sedro-Woolley City of 0.010209%
0655 Oak Harbor City of 0.010003%
0662 Ocean Shores City of 0.009833%
0237 Douglas County 0.009785%
0885 Snohomish County Airport 0.009671%
0499 Kittitas County 0.009538%
0126 Chelan County FPD 01 0.009484%
1123 Yakima County FPD 05 0.009384%
0338 Grand Coulee City of 0.009284%
0919 Spokane County FPD 09 0.009257%
0888 Snohomish County FPD 11 0.009134%
0075 Bonney Lake City of 0.009091%
0946 Stevens County 0.008721%
0876 Skamania County 0.008109%
0504 Klickitat County 0.008022%
0302 Fife City of 0.007934%
0093 Burlington City of 0.007769%
0668 Okanogan County 0.007673%
0147 Clark County FPD 05 0.007595%
0832 San Juan County 0.007091%
0602 Monroe City of 0.007051%
0007 Adams County 0.006819%
0765 Prosser City of 0.006722%
0334 Goldendale City of 0.006697%
1057 Wapato City of 0.006659%
All Other Employers — Employer Allocations
Organization Identification Number Organization Name
Allocation Percentage
1647 SeaTac City of 0.006607%
0889 Snohomish County FPD 12 0.006567%
1062 Washougal City of 0.006385%
0754 Port Orchard City of 0.006300%
0331 Gig Harbor City of 0.006300%
0282 Ephrata City of 0.006115%
0699 Pacific County 0.006082%
1047 Walla Walla Regional Airport 0.006027%
0572 Mason County FPD 05 0.005976%
0542 Lincoln County 0.005896%
0737 Pierce County FPD 09 0.005841%
0532 Lewis County FPD 12 0.005823%
0678 Omak City of 0.005707%
1096 Whitman County 0.005566%
0123 Chelan City of 0.005517%
1075 West Richland City of 0.005409%
0900 Snoqualmie City of 0.005404%
0073 Blaine City of 0.005341%
0453 King County FPD 40 0.005326%
0487 Bainbridge Island Fire Department 0.005292%
0884 Snohomish City of 0.005228%
0796 Raymond City of 0.005117%
1107 Bainbridge Island City of 0.005108%
0760 Poulsbo City of 0.005085%
0044 Battle Ground City of 0.005052%
0092 Buckley City of 0.005050%
0162 Clyde Hill City of 0.005014%
0598 Milton City of 0.004973%
0983 Thurston County FPD 09 0.004927%
1006 Union Gap City of 0.004868%
0622 Mukilteo City of 0.004645%
0447 King County FPD 25 0.004589%
0454 King County FPD 43 0.004528%
0583 Medina City of 0.004444%
0244 East Wenatchee City of 0.004417%
0296 Ferndale City of 0.004405%
0174 Colville City of 0.004374%
0145 Clark County FPD 03 0.004010%
0346 Grant County FPD 03 0.004005%
0791 Quincy City of 0.003977%
0556 Lynden City of 0.003841%
0849 Selah City of 0.003791%
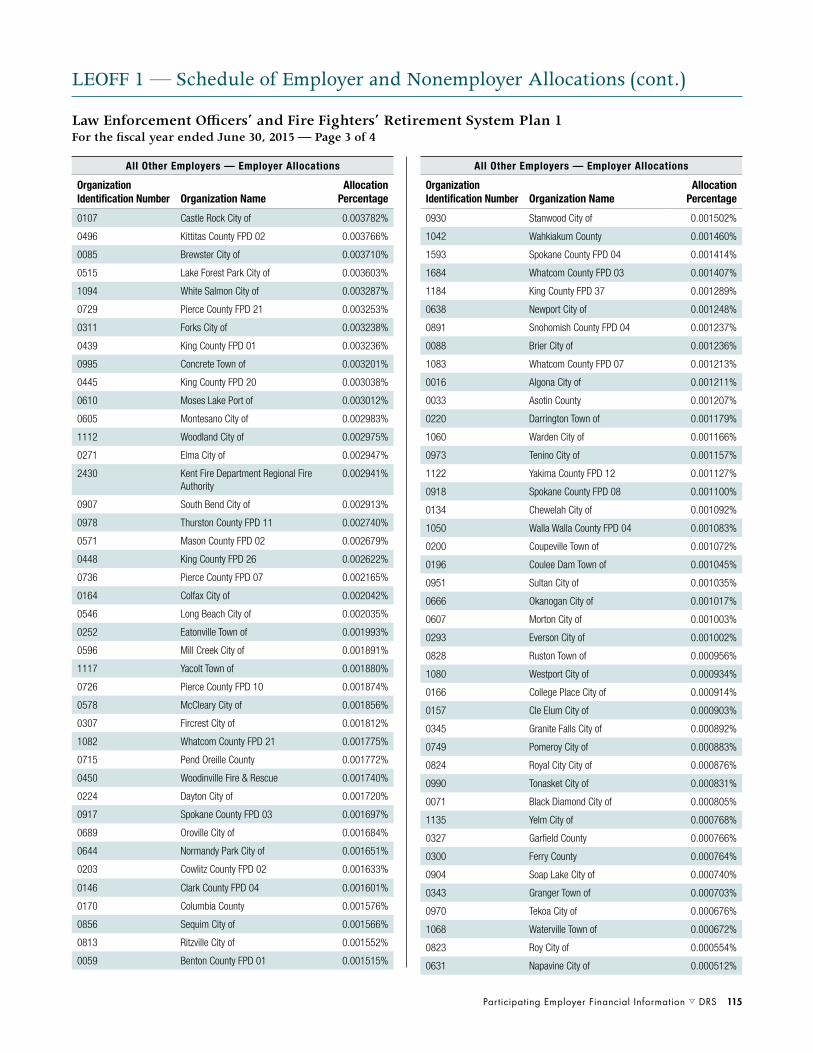
Participating Employer Financial Information s DRS 115
LEOFF 1 — Schedule of Employer and Nonemployer Allocations (cont.)
Law Enforcement Officers’ and Fire Fighters’ Retirement System Plan 1For the fiscal year ended June 30, 2015 — Page 3 of 4
All Other Employers — Employer Allocations
Organization Identification Number Organization Name
Allocation Percentage
0107 Castle Rock City of 0.003782%
0496 Kittitas County FPD 02 0.003766%
0085 Brewster City of 0.003710%
0515 Lake Forest Park City of 0.003603%
1094 White Salmon City of 0.003287%
0729 Pierce County FPD 21 0.003253%
0311 Forks City of 0.003238%
0439 King County FPD 01 0.003236%
0995 Concrete Town of 0.003201%
0445 King County FPD 20 0.003038%
0610 Moses Lake Port of 0.003012%
0605 Montesano City of 0.002983%
1112 Woodland City of 0.002975%
0271 Elma City of 0.002947%
2430 Kent Fire Department Regional Fire Authority
0.002941%
0907 South Bend City of 0.002913%
0978 Thurston County FPD 11 0.002740%
0571 Mason County FPD 02 0.002679%
0448 King County FPD 26 0.002622%
0736 Pierce County FPD 07 0.002165%
0164 Colfax City of 0.002042%
0546 Long Beach City of 0.002035%
0252 Eatonville Town of 0.001993%
0596 Mill Creek City of 0.001891%
1117 Yacolt Town of 0.001880%
0726 Pierce County FPD 10 0.001874%
0578 McCleary City of 0.001856%
0307 Fircrest City of 0.001812%
1082 Whatcom County FPD 21 0.001775%
0715 Pend Oreille County 0.001772%
0450 Woodinville Fire & Rescue 0.001740%
0224 Dayton City of 0.001720%
0917 Spokane County FPD 03 0.001697%
0689 Oroville City of 0.001684%
0644 Normandy Park City of 0.001651%
0203 Cowlitz County FPD 02 0.001633%
0146 Clark County FPD 04 0.001601%
0170 Columbia County 0.001576%
0856 Sequim City of 0.001566%
0813 Ritzville City of 0.001552%
0059 Benton County FPD 01 0.001515%
All Other Employers — Employer Allocations
Organization Identification Number Organization Name
Allocation Percentage
0930 Stanwood City of 0.001502%
1042 Wahkiakum County 0.001460%
1593 Spokane County FPD 04 0.001414%
1684 Whatcom County FPD 03 0.001407%
1184 King County FPD 37 0.001289%
0638 Newport City of 0.001248%
0891 Snohomish County FPD 04 0.001237%
0088 Brier City of 0.001236%
1083 Whatcom County FPD 07 0.001213%
0016 Algona City of 0.001211%
0033 Asotin County 0.001207%
0220 Darrington Town of 0.001179%
1060 Warden City of 0.001166%
0973 Tenino City of 0.001157%
1122 Yakima County FPD 12 0.001127%
0918 Spokane County FPD 08 0.001100%
0134 Chewelah City of 0.001092%
1050 Walla Walla County FPD 04 0.001083%
0200 Coupeville Town of 0.001072%
0196 Coulee Dam Town of 0.001045%
0951 Sultan City of 0.001035%
0666 Okanogan City of 0.001017%
0607 Morton City of 0.001003%
0293 Everson City of 0.001002%
0828 Ruston Town of 0.000956%
1080 Westport City of 0.000934%
0166 College Place City of 0.000914%
0157 Cle Elum City of 0.000903%
0345 Granite Falls City of 0.000892%
0749 Pomeroy City of 0.000883%
0824 Royal City City of 0.000876%
0990 Tonasket City of 0.000831%
0071 Black Diamond City of 0.000805%
1135 Yelm City of 0.000768%
0327 Garfield County 0.000766%
0300 Ferry County 0.000764%
0904 Soap Lake City of 0.000740%
0343 Granger Town of 0.000703%
0970 Tekoa City of 0.000676%
1068 Waterville Town of 0.000672%
0823 Roy City of 0.000554%
0631 Napavine City of 0.000512%

116 DRS s Participating Employer Financial Information
LEOFF 1 — Schedule of Employer and Nonemployer Allocations (cont.)
Law Enforcement Officers’ and Fire Fighters’ Retirement System Plan 1For the fiscal year ended June 30, 2015 — Page 4 of 4
All Other Employers — Employer Allocations
Organization Identification Number Organization Name
Allocation Percentage
0620 Moxee City of 0.000418%
0143 Clark County Fire & Rescue 0.000415%
0702 Palouse City of 0.000350%
1183 King County FPD 32 0.000025%
Total All Other Employers — Employer Allocations 12.880000%
State of Washington — Special Funding
Organization Identification Number Organization Name
Allocation Percentage
N/A State of Washington 87.120000%
Total State of Washington — Special Funding 87.120000%
Grand Total All Other Employer and Nonemployer Allocations
100.000000%
LEOFF Plan 1 allocation percentages reported in the Schedules of Employer and Nonemployer Allocations are based on the total historical employer contributions to LEOFF Plan 1 (1971-2000) and retirement benefit payments in fiscal year 2015. Historical data was obtained from a 2011 study the Office of the State Actuary (OSA) conducted.
Washington state contributed 87.12 percent of LEOFF Plan 1 employer contributions; all other employers contributed the remaining 12.88 percent of employer contributions.
The cumulative retirement benefit payments through fiscal year 2015 were used to determine the employer allocation amounts and percentages listed under All Other Employers.
LEOFF Plan 1 is fully funded, and no further employer contributions have been required since June 2000; see RCW 41.26.080. If the plan becomes underfunded, funding of the remaining liability will require new legislation. The allocation method the plan chose reflects the projected long-term contribution effort based on historical data.

Participating Employer Financial Information s DRS 117
LEOFF 2 — Schedule of Employer and Nonemployer Allocations
State of Washington — Employer Allocations
Organization Identification Number Organization Name Employer Contributions
Allocation Percentage
1745 Fish & Wildlife Department of $ 520,163.86 0.354889%
1219 University of WA 297,112.71 0.202709%
1021 WA State University 136,418.88 0.093074%
1079 Western WA University 81,930.67 0.055898%
0117 Central WA University 73,246.44 0.049973%
0247 Eastern WA University 70,540.50 0.048127%
0974 Evergreen State College 39,836.13 0.027179%
0388 House of Representatives 4,252.80 0.002902%
Subtotal State of Washington — Employer Allocations $ 1,223,501.99 0.834750%
Law Enforcement Officers’ and Fire Fighters’ Retirement System Plan 2For the fiscal year ended June 30, 2015 — Page 1 of 10
All Other Employers — Employer Allocations
Organization Identification Number Organization Name Employer Contributions
Allocation Percentage
0838 Seattle City of (Police Pension) $ 7,978,717.87 5.443586%
1904 Seattle City of (Fire) 5,659,730.64 3.861426%
0481 King County 4,252,355.09 2.901226%
0962 Tacoma City of 3,615,466.17 2.466700%
1434 Spokane City of 2,934,279.45 2.001951%
0048 Bellevue City of 2,030,678.85 1.385458%
1028 Vancouver City of 1,901,980.64 1.297652%
0286 Everett City of 1,716,560.52 1.171146%
0843 Seattle Port of 1,571,254.21 1.072009%
0742 Pierce County 1,431,349.51 0.976557%
0802 Renton City of 1,399,334.88 0.954715%
2430 Kent Fire Department Regional Fire Authority 1,377,525.27 0.939835%
0735 Pierce County FPD 06 1,337,674.38 0.912646%
0800 Redmond City of 1,327,125.52 0.905449%
0896 Snohomish County 1,269,257.07 0.865967%
0887 Snohomish County FPD 01 1,264,679.51 0.862844%
0051 Bellingham City of 1,197,282.05 0.816862%
1119 Yakima City of 1,088,457.81 0.742615%
0484 Kirkland City of 1,088,208.47 0.742445%
0922 Spokane County 987,840.95 0.673968%
0732 Pierce County FPD 03 960,335.19 0.655201%
0429 Kennewick City of 904,536.54 0.617132%
0916 Spokane Valley Fire Department 883,503.77 0.602782%
0671 Olympia City of 825,261.67 0.563046%
0434 Kent City of 764,214.83 0.521396%
1001 Tukwila City of 760,936.55 0.519159%
0451 South King Fire & Rescue 748,215.33 0.510480%
0440 King County FPD 10 680,425.58 0.464229%
0730 East Pierce Fire & Rescue 676,354.03 0.461452%
0558 Lynnwood City of 669,650.32 0.456878%

118 DRS s Participating Employer Financial Information
LEOFF 2 — Schedule of Employer and Nonemployer Allocations (cont.)
All Other Employers — Employer Allocations
Organization Identification Number Organization Name Employer Contributions
Allocation Percentage
0076 Bothell City of $ 653,937.37 0.446157%
0452 Shoreline Fire Department 627,401.94 0.428053%
1630 Federal Way City of 627,099.05 0.427847%
0153 Clark County 609,985.30 0.416171%
0809 Richland City of 602,830.35 0.411289%
0706 Pasco City of 594,849.66 0.405844%
0078 Bremerton City of 582,588.86 0.397479%
0893 Snohomish County FPD 07 545,258.85 0.372010%
2237 Valley Regional Fire Authority 533,936.87 0.364286%
0038 Auburn City of 519,609.68 0.354511%
2175 Lakewood City of 499,195.78 0.340583%
0980 Thurston County FPD 03 495,263.05 0.337900%
0547 Longview City of 473,258.22 0.322887%
0490 Kitsap County 460,143.31 0.313939%
0889 Snohomish County FPD 12 459,222.06 0.313310%
0734 Pierce County FPD 05 458,317.09 0.312693%
0488 South Kitsap Fire & Rescue 412,371.78 0.281346%
0485 Central Kitsap Fire & Rescue 406,977.84 0.277666%
1048 Walla Walla City of 406,852.54 0.277581%
0584 Mercer Island City of 383,598.48 0.261715%
0984 Thurston County 377,624.03 0.257639%
0095 Camas City of 362,618.70 0.247401%
1089 Whatcom County 351,868.64 0.240067%
0617 Mount Vernon City of 346,936.74 0.236702%
0450 Woodinville Fire & Rescue 327,746.61 0.223609%
0569 Marysville City of 326,643.52 0.222857%
0729 Pierce County FPD 21 325,904.37 0.222353%
1002 Tumwater City of 322,129.81 0.219777%
0148 Clark County FPD 06 318,720.31 0.217451%
0001 Aberdeen City of 308,624.56 0.210563%
0919 Spokane County FPD 09 304,105.25 0.207480%
1071 Wenatchee City of 291,871.32 0.199133%
0783 Puyallup City of 291,622.70 0.198963%
0511 Lacey City of 274,412.44 0.187222%
0143 Clark County Fire & Rescue 271,872.39 0.185489%
0255 Edmonds City of 268,717.09 0.183336%
0444 King County FPD 02 263,582.57 0.179833%
0124 Chelan County 260,308.53 0.177599%
0622 Mukilteo City of 259,297.25 0.176909%
0780 Pullman City of 258,400.05 0.176297%
0609 Moses Lake City of 256,858.55 0.175245%
0454 King County FPD 43 255,637.70 0.174412%
Law Enforcement Officers’ and Fire Fighters’ Retirement System Plan 2For the fiscal year ended June 30, 2015 — Page 2 of 10
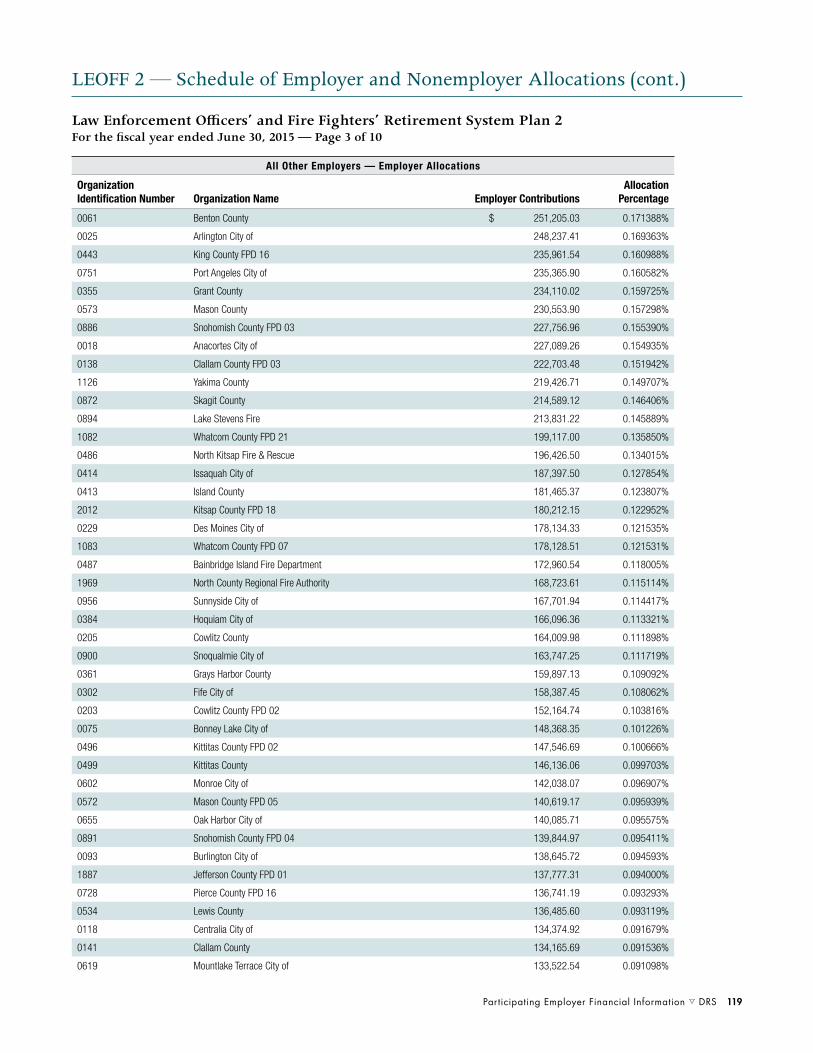
Participating Employer Financial Information s DRS 119
LEOFF 2 — Schedule of Employer and Nonemployer Allocations (cont.)
All Other Employers — Employer Allocations
Organization Identification Number Organization Name Employer Contributions
Allocation Percentage
0061 Benton County $ 251,205.03 0.171388%
0025 Arlington City of 248,237.41 0.169363%
0443 King County FPD 16 235,961.54 0.160988%
0751 Port Angeles City of 235,365.90 0.160582%
0355 Grant County 234,110.02 0.159725%
0573 Mason County 230,553.90 0.157298%
0886 Snohomish County FPD 03 227,756.96 0.155390%
0018 Anacortes City of 227,089.26 0.154935%
0138 Clallam County FPD 03 222,703.48 0.151942%
1126 Yakima County 219,426.71 0.149707%
0872 Skagit County 214,589.12 0.146406%
0894 Lake Stevens Fire 213,831.22 0.145889%
1082 Whatcom County FPD 21 199,117.00 0.135850%
0486 North Kitsap Fire & Rescue 196,426.50 0.134015%
0414 Issaquah City of 187,397.50 0.127854%
0413 Island County 181,465.37 0.123807%
2012 Kitsap County FPD 18 180,212.15 0.122952%
0229 Des Moines City of 178,134.33 0.121535%
1083 Whatcom County FPD 07 178,128.51 0.121531%
0487 Bainbridge Island Fire Department 172,960.54 0.118005%
1969 North County Regional Fire Authority 168,723.61 0.115114%
0956 Sunnyside City of 167,701.94 0.114417%
0384 Hoquiam City of 166,096.36 0.113321%
0205 Cowlitz County 164,009.98 0.111898%
0900 Snoqualmie City of 163,747.25 0.111719%
0361 Grays Harbor County 159,897.13 0.109092%
0302 Fife City of 158,387.45 0.108062%
0203 Cowlitz County FPD 02 152,164.74 0.103816%
0075 Bonney Lake City of 148,368.35 0.101226%
0496 Kittitas County FPD 02 147,546.69 0.100666%
0499 Kittitas County 146,136.06 0.099703%
0602 Monroe City of 142,038.07 0.096907%
0572 Mason County FPD 05 140,619.17 0.095939%
0655 Oak Harbor City of 140,085.71 0.095575%
0891 Snohomish County FPD 04 139,844.97 0.095411%
0093 Burlington City of 138,645.72 0.094593%
1887 Jefferson County FPD 01 137,777.31 0.094000%
0728 Pierce County FPD 16 136,741.19 0.093293%
0534 Lewis County 136,485.60 0.093119%
0118 Centralia City of 134,374.92 0.091679%
0141 Clallam County 134,165.69 0.091536%
0619 Mountlake Terrace City of 133,522.54 0.091098%
Law Enforcement Officers’ and Fire Fighters’ Retirement System Plan 2For the fiscal year ended June 30, 2015 — Page 3 of 10
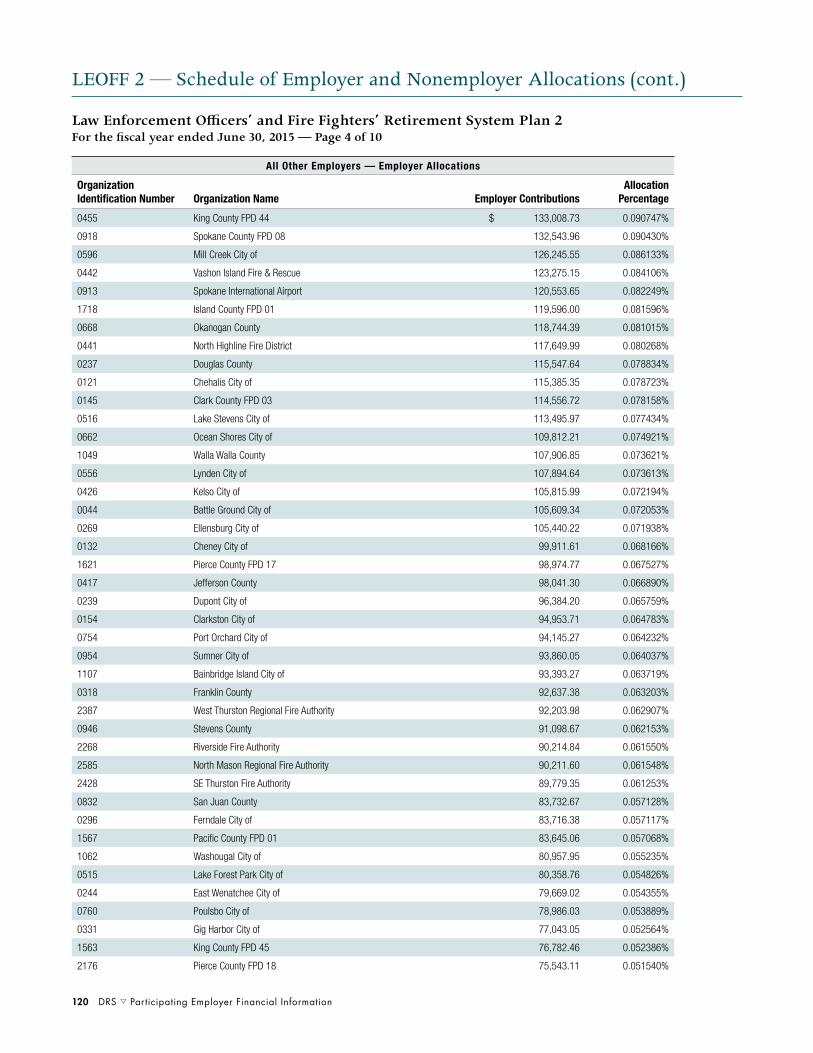
120 DRS s Participating Employer Financial Information
LEOFF 2 — Schedule of Employer and Nonemployer Allocations (cont.)
All Other Employers — Employer Allocations
Organization Identification Number Organization Name Employer Contributions
Allocation Percentage
0455 King County FPD 44 $ 133,008.73 0.090747%
0918 Spokane County FPD 08 132,543.96 0.090430%
0596 Mill Creek City of 126,245.55 0.086133%
0442 Vashon Island Fire & Rescue 123,275.15 0.084106%
0913 Spokane International Airport 120,553.65 0.082249%
1718 Island County FPD 01 119,596.00 0.081596%
0668 Okanogan County 118,744.39 0.081015%
0441 North Highline Fire District 117,649.99 0.080268%
0237 Douglas County 115,547.64 0.078834%
0121 Chehalis City of 115,385.35 0.078723%
0145 Clark County FPD 03 114,556.72 0.078158%
0516 Lake Stevens City of 113,495.97 0.077434%
0662 Ocean Shores City of 109,812.21 0.074921%
1049 Walla Walla County 107,906.85 0.073621%
0556 Lynden City of 107,894.64 0.073613%
0426 Kelso City of 105,815.99 0.072194%
0044 Battle Ground City of 105,609.34 0.072053%
0269 Ellensburg City of 105,440.22 0.071938%
0132 Cheney City of 99,911.61 0.068166%
1621 Pierce County FPD 17 98,974.77 0.067527%
0417 Jefferson County 98,041.30 0.066890%
0239 Dupont City of 96,384.20 0.065759%
0154 Clarkston City of 94,953.71 0.064783%
0754 Port Orchard City of 94,145.27 0.064232%
0954 Sumner City of 93,860.05 0.064037%
1107 Bainbridge Island City of 93,393.27 0.063719%
0318 Franklin County 92,637.38 0.063203%
2387 West Thurston Regional Fire Authority 92,203.98 0.062907%
0946 Stevens County 91,098.67 0.062153%
2268 Riverside Fire Authority 90,214.84 0.061550%
2585 North Mason Regional Fire Authority 90,211.60 0.061548%
2428 SE Thurston Fire Authority 89,779.35 0.061253%
0832 San Juan County 83,732.67 0.057128%
0296 Ferndale City of 83,716.38 0.057117%
1567 Pacific County FPD 01 83,645.06 0.057068%
1062 Washougal City of 80,957.95 0.055235%
0515 Lake Forest Park City of 80,358.76 0.054826%
0244 East Wenatchee City of 79,669.02 0.054355%
0760 Poulsbo City of 78,986.03 0.053889%
0331 Gig Harbor City of 77,043.05 0.052564%
1563 King County FPD 45 76,782.46 0.052386%
2176 Pierce County FPD 18 75,543.11 0.051540%
Law Enforcement Officers’ and Fire Fighters’ Retirement System Plan 2For the fiscal year ended June 30, 2015 — Page 4 of 10
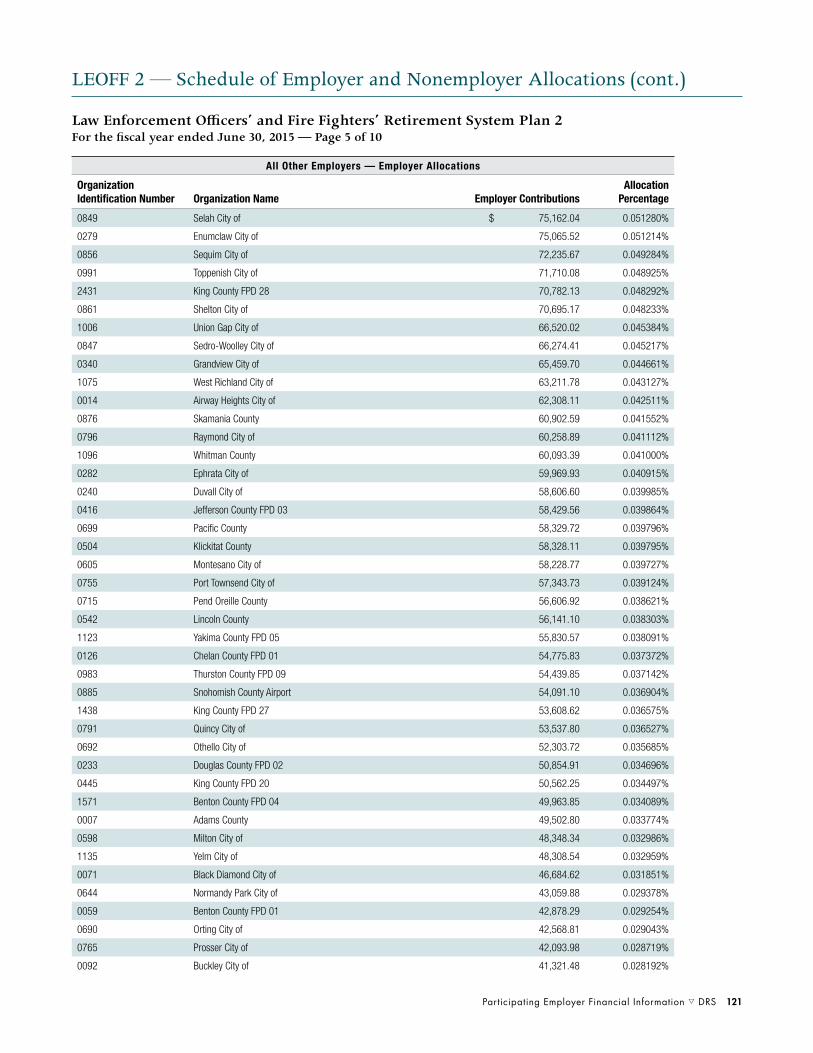
Participating Employer Financial Information s DRS 121
LEOFF 2 — Schedule of Employer and Nonemployer Allocations (cont.)
All Other Employers — Employer Allocations
Organization Identification Number Organization Name Employer Contributions
Allocation Percentage
0849 Selah City of $ 75,162.04 0.051280%
0279 Enumclaw City of 75,065.52 0.051214%
0856 Sequim City of 72,235.67 0.049284%
0991 Toppenish City of 71,710.08 0.048925%
2431 King County FPD 28 70,782.13 0.048292%
0861 Shelton City of 70,695.17 0.048233%
1006 Union Gap City of 66,520.02 0.045384%
0847 Sedro-Woolley City of 66,274.41 0.045217%
0340 Grandview City of 65,459.70 0.044661%
1075 West Richland City of 63,211.78 0.043127%
0014 Airway Heights City of 62,308.11 0.042511%
0876 Skamania County 60,902.59 0.041552%
0796 Raymond City of 60,258.89 0.041112%
1096 Whitman County 60,093.39 0.041000%
0282 Ephrata City of 59,969.93 0.040915%
0240 Duvall City of 58,606.60 0.039985%
0416 Jefferson County FPD 03 58,429.56 0.039864%
0699 Pacific County 58,329.72 0.039796%
0504 Klickitat County 58,328.11 0.039795%
0605 Montesano City of 58,228.77 0.039727%
0755 Port Townsend City of 57,343.73 0.039124%
0715 Pend Oreille County 56,606.92 0.038621%
0542 Lincoln County 56,141.10 0.038303%
1123 Yakima County FPD 05 55,830.57 0.038091%
0126 Chelan County FPD 01 54,775.83 0.037372%
0983 Thurston County FPD 09 54,439.85 0.037142%
0885 Snohomish County Airport 54,091.10 0.036904%
1438 King County FPD 27 53,608.62 0.036575%
0791 Quincy City of 53,537.80 0.036527%
0692 Othello City of 52,303.72 0.035685%
0233 Douglas County FPD 02 50,854.91 0.034696%
0445 King County FPD 20 50,562.25 0.034497%
1571 Benton County FPD 04 49,963.85 0.034089%
0007 Adams County 49,502.80 0.033774%
0598 Milton City of 48,348.34 0.032986%
1135 Yelm City of 48,308.54 0.032959%
0071 Black Diamond City of 46,684.62 0.031851%
0644 Normandy Park City of 43,059.88 0.029378%
0059 Benton County FPD 01 42,878.29 0.029254%
0690 Orting City of 42,568.81 0.029043%
0765 Prosser City of 42,093.98 0.028719%
0092 Buckley City of 41,321.48 0.028192%
Law Enforcement Officers’ and Fire Fighters’ Retirement System Plan 2For the fiscal year ended June 30, 2015 — Page 5 of 10
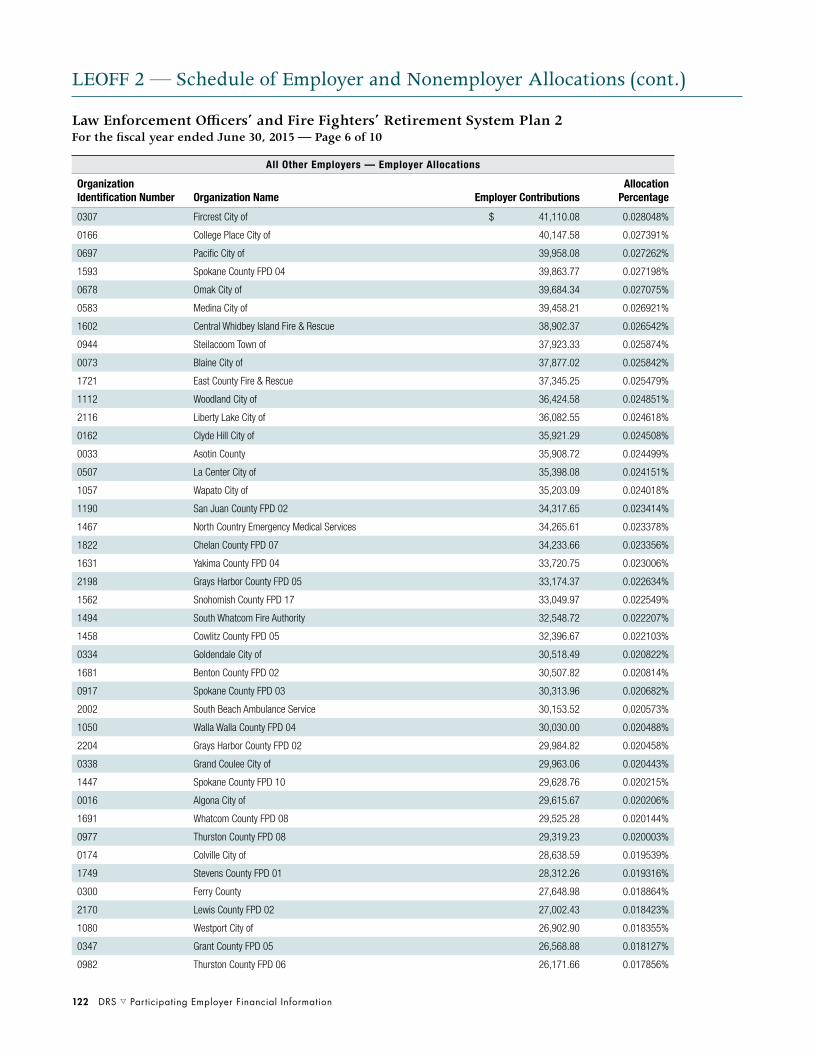
122 DRS s Participating Employer Financial Information
LEOFF 2 — Schedule of Employer and Nonemployer Allocations (cont.)
All Other Employers — Employer Allocations
Organization Identification Number Organization Name Employer Contributions
Allocation Percentage
0307 Fircrest City of $ 41,110.08 0.028048%
0166 College Place City of 40,147.58 0.027391%
0697 Pacific City of 39,958.08 0.027262%
1593 Spokane County FPD 04 39,863.77 0.027198%
0678 Omak City of 39,684.34 0.027075%
0583 Medina City of 39,458.21 0.026921%
1602 Central Whidbey Island Fire & Rescue 38,902.37 0.026542%
0944 Steilacoom Town of 37,923.33 0.025874%
0073 Blaine City of 37,877.02 0.025842%
1721 East County Fire & Rescue 37,345.25 0.025479%
1112 Woodland City of 36,424.58 0.024851%
2116 Liberty Lake City of 36,082.55 0.024618%
0162 Clyde Hill City of 35,921.29 0.024508%
0033 Asotin County 35,908.72 0.024499%
0507 La Center City of 35,398.08 0.024151%
1057 Wapato City of 35,203.09 0.024018%
1190 San Juan County FPD 02 34,317.65 0.023414%
1467 North Country Emergency Medical Services 34,265.61 0.023378%
1822 Chelan County FPD 07 34,233.66 0.023356%
1631 Yakima County FPD 04 33,720.75 0.023006%
2198 Grays Harbor County FPD 05 33,174.37 0.022634%
1562 Snohomish County FPD 17 33,049.97 0.022549%
1494 South Whatcom Fire Authority 32,548.72 0.022207%
1458 Cowlitz County FPD 05 32,396.67 0.022103%
0334 Goldendale City of 30,518.49 0.020822%
1681 Benton County FPD 02 30,507.82 0.020814%
0917 Spokane County FPD 03 30,313.96 0.020682%
2002 South Beach Ambulance Service 30,153.52 0.020573%
1050 Walla Walla County FPD 04 30,030.00 0.020488%
2204 Grays Harbor County FPD 02 29,984.82 0.020458%
0338 Grand Coulee City of 29,963.06 0.020443%
1447 Spokane County FPD 10 29,628.76 0.020215%
0016 Algona City of 29,615.67 0.020206%
1691 Whatcom County FPD 08 29,525.28 0.020144%
0977 Thurston County FPD 08 29,319.23 0.020003%
0174 Colville City of 28,638.59 0.019539%
1749 Stevens County FPD 01 28,312.26 0.019316%
0300 Ferry County 27,648.98 0.018864%
2170 Lewis County FPD 02 27,002.43 0.018423%
1080 Westport City of 26,902.90 0.018355%
0347 Grant County FPD 05 26,568.88 0.018127%
0982 Thurston County FPD 06 26,171.66 0.017856%
Law Enforcement Officers’ and Fire Fighters’ Retirement System Plan 2For the fiscal year ended June 30, 2015 — Page 6 of 10

Participating Employer Financial Information s DRS 123
LEOFF 2 — Schedule of Employer and Nonemployer Allocations (cont.)
All Other Employers — Employer Allocations
Organization Identification Number Organization Name Employer Contributions
Allocation Percentage
0182 Connell City of $ 25,686.94 0.017525%
0157 Cle Elum City of 25,215.80 0.017204%
0952 Sumas City of 25,143.05 0.017154%
0164 Colfax City of 24,398.39 0.016646%
0346 Grant County FPD 03 24,215.64 0.016521%
0811 Ridgefield City of 23,606.52 0.016106%
0293 Everson City of 23,529.49 0.016053%
1136 Zillah City of 23,452.42 0.016001%
0271 Elma City of 23,214.55 0.015838%
0088 Brier City of 22,755.09 0.015525%
1042 Wahkiakum County 22,532.07 0.015373%
1122 Yakima County FPD 12 21,858.74 0.014913%
2138 Lewis County FPD 06 21,726.57 0.014823%
1437 San Juan County FPD 03 21,596.00 0.014734%
0892 Snohomish County FPD 05 21,240.16 0.014491%
0343 Granger Town of 20,866.07 0.014236%
0107 Castle Rock City of 19,828.47 0.013528%
0546 Long Beach City of 19,796.53 0.013506%
0170 Columbia County 18,697.96 0.012757%
0411 South Whidbey Fire/EMS 18,667.32 0.012736%
0422 Kalama City of 18,475.49 0.012605%
0085 Brewster City of 18,251.76 0.012453%
1094 White Salmon City of 17,606.87 0.012013%
0327 Garfield County 17,151.30 0.011702%
0311 Forks City of 16,887.49 0.011522%
0134 Chewelah City of 16,584.30 0.011315%
0193 Cosmopolis City of 15,495.79 0.010572%
0979 Thurston County FPD 13 15,037.87 0.010260%
0620 Moxee City of 14,593.40 0.009957%
0252 Eatonville Town of 14,578.87 0.009947%
0981 Thurston County FPD 05 14,384.34 0.009814%
0314 Franklin County FPD 03 14,371.88 0.009805%
2139 Okanogan County FPD 06 13,772.22 0.009396%
2125 San Juan County FPD 04 12,842.85 0.008762%
1604 Chelan County FPD 03 12,840.39 0.008761%
1903 Clallam County FPD 02 12,629.11 0.008616%
2120 Douglas-Okanogan County FPD 15 12,598.61 0.008596%
1153 Mattawa City of 12,392.42 0.008455%
1618 Mason County FPD 04 12,214.38 0.008333%
0907 South Bend City of 12,016.63 0.008199%
0524 Langley City of 11,984.50 0.008177%
0578 McCleary City of 11,574.66 0.007897%
1051 Walla Walla County FPD 05 11,377.50 0.007762%
Law Enforcement Officers’ and Fire Fighters’ Retirement System Plan 2For the fiscal year ended June 30, 2015 — Page 7 of 10

124 DRS s Participating Employer Financial Information
LEOFF 2 — Schedule of Employer and Nonemployer Allocations (cont.)
All Other Employers — Employer Allocations
Organization Identification Number Organization Name Employer Contributions
Allocation Percentage
0708 Pasco Port of $ 11,280.59 0.007696%
0689 Oroville City of 11,224.94 0.007658%
0813 Ritzville City of 10,828.69 0.007388%
2153 Clark County FPD 13 10,095.07 0.006887%
0005 Adams County FPD 05 9,543.02 0.006511%
2293 Lewis County FPD 05 9,488.92 0.006474%
0031 Asotin County FPD 01 9,478.86 0.006467%
1060 Warden City of 9,196.73 0.006275%
0990 Tonasket City of 9,116.27 0.006220%
0824 Royal City City of 9,030.38 0.006161%
0828 Ruston Town of 8,909.59 0.006079%
2219 Cowlitz County FPD 06 8,905.68 0.006076%
0436 Kettle Falls City of 8,744.56 0.005966%
0731 Pierce County FPD 27 8,384.51 0.005720%
1643 Grant County FPD 08 8,333.93 0.005686%
1810 Snohomish County FPD 22 8,012.04 0.005466%
0196 Coulee Dam Town of 7,989.88 0.005451%
1696 Mason County FPD 06 7,646.59 0.005217%
2240 Whatcom County FPD 01 7,535.39 0.005141%
1998 Snohomish County FPD 15 7,084.49 0.004833%
2224 Grant County FPD 10 6,843.71 0.004669%
1005 Twisp Town of 6,734.04 0.004594%
2052 Prosser FPD 03 6,662.81 0.004546%
0559 Mabton City of 6,493.03 0.004430%
0030 Asotin City of 6,489.92 0.004428%
2202 Columbia County FPD 03 6,456.41 0.004405%
2128 Pierce County FPD 13 6,394.30 0.004363%
0410 North Whidbey Fire & Rescue 6,376.00 0.004350%
0806 Republic City of 6,283.28 0.004287%
0973 Tenino City of 6,274.73 0.004281%
2278 Lewis County FPD 15 6,184.02 0.004219%
1634 Jefferson County FPD 04 6,169.53 0.004209%
1699 Benton County FPD 06 5,948.44 0.004058%
2184 Thurston County FPD 07 5,849.11 0.003991%
1108 Winthrop Town of 5,616.00 0.003832%
2614 West Benton Regional Fire Authority 5,586.28 0.003811%
0631 Napavine City of 5,500.27 0.003753%
0607 Morton City of 5,439.24 0.003711%
0495 Kittitas City of 5,415.05 0.003694%
2557 Snoqualmie Pass Fire & Rescue 5,383.43 0.003673%
0702 Palouse City of 5,199.64 0.003548%
2064 Whatcom County FPD 14 5,065.89 0.003456%
2231 Spokane County FPD 13 5,045.51 0.003442%
Law Enforcement Officers’ and Fire Fighters’ Retirement System Plan 2For the fiscal year ended June 30, 2015 — Page 8 of 10

Participating Employer Financial Information s DRS 125
LEOFF 2 — Schedule of Employer and Nonemployer Allocations (cont.)
All Other Employers — Employer Allocations
Organization Identification Number Organization Name Employer Contributions
Allocation Percentage
0985 Tieton City of $ 5,030.34 0.003432%
0457 King County FPD 50 4,993.03 0.003407%
0665 Odessa Town of 4,985.26 0.003401%
1105 Winlock City of 4,902.67 0.003345%
2086 Mason County FPD 03 4,868.55 0.003322%
2185 Snohomish County FPD 19 4,742.62 0.003236%
1869 Pierce County FPD 14 4,628.00 0.003158%
0987 Toledo City of 4,477.48 0.003055%
2216 Clark County FPD 10 4,341.74 0.002962%
0823 Roy City of 4,262.80 0.002908%
2421 Chelan County FPD 06 4,195.00 0.002862%
1840 Pierce County FPD 23 4,162.20 0.002840%
1878 Chelan County FPD 05 3,788.36 0.002585%
2223 Whatcom County FPD 17 3,724.40 0.002541%
2264 Klickitat County FPD 07 3,533.02 0.002410%
1100 Wilbur Town of 3,515.49 0.002398%
2016 Jefferson County FPD 02 3,477.90 0.002373%
2292 Snohomish County FPD 21 3,442.39 0.002349%
0904 Soap Lake City of 3,411.70 0.002328%
1642 Skagit County FPD 08 3,408.72 0.002326%
2243 Thurston County FPD 17 3,351.07 0.002286%
2188 South Pend Oreille Fire & Rescue 3,318.92 0.002264%
1892 Cowlitz County FPD 01 3,235.86 0.002208%
2183 Lewis County FPD 14 3,205.67 0.002187%
2581 Mason County FPD 11 3,181.54 0.002171%
2270 Clallam County FPD 05 3,170.00 0.002163%
2117 Lewis County FPD 10 3,131.58 0.002137%
2612 Whatcom County FPD 11 2,924.21 0.001995%
2518 Garfield County FPD 01 2,868.46 0.001957%
2179 Lewis County FPD 03 2,858.30 0.001950%
2177 Cowlitz-Skamania County FPD 07 2,858.20 0.001950%
2028 Pend Oreille FPD 02 2,801.97 0.001912%
1877 Pend Oreille FPD 04 2,688.30 0.001834%
2126 Snohomish County FPD 28 2,618.53 0.001787%
2373 Kittitas County FPD 01 2,398.75 0.001637%
0799 Reardan Town of 2,397.30 0.001636%
1611 Pe Ell Town of 2,106.45 0.001437%
1933 Mason County FPD 13 2,099.88 0.001433%
1675 Springdale Town of 1,815.50 0.001239%
Subtotal All Other Employers — Employer Allocations $ 87,008,448.19 59.362670%
Total State of Washington and All Other Employers — Employer Allocations $ 88,231,950.18 60.197420%
Law Enforcement Officers’ and Fire Fighters’ Retirement System Plan 2For the fiscal year ended June 30, 2015 — Page 9 of 10

126 DRS s Participating Employer Financial Information
LEOFF 2 — Schedule of Employer and Nonemployer Allocations (cont.)
Law Enforcement Officers’ and Fire Fighters’ Retirement System Plan 2For the fiscal year ended June 30, 2015 — Page 10 of 10
State of Washington — Special Funding
Organization Identification Number Organization Name Employer Contributions
Allocation Percentage
N/A State of Washington $ 58,339,032.00 39.802580%
Total State of Washington — Special Funding $ 58,339,032.00 39.802580%
Grand Total Employer and Nonemployer Allocations $ 146,570,982.18 100.000000%
Allocation is based on contribution transmittals DRS received and processed (July 1-June 30) less mandatory nonrecurring billings.
Contributions are net of the DRS administrative fee, which was 0.18 percent for fiscal year 2015.
RCW 41.26.725 created the special funding situation.

Participating Employer Financial Information s DRS 127
State Actuary’s Certification Letter
“Securing tomorrow’s pensions today.”
PO Box 40914 | Olympia, Washington 98504-0914 | [email protected] | osa.leg.wa.govPhone: 360.786.6140 | Fax: 360.586.8135 | TDD: 711
October 2, 2015
Ms. Marcie FrostDirectorDepartment of Retirement SystemsPO Box 48380Olympia, Washington 98504-8380
SUBJECT: ACTUARIAL CERTIFICATION LETTER
Dear Marcie:
At your request, we prepared the following information for inclusion in the 2015 Fiscal Year Participating Employer Financial Information (PEFI):
Schedules of Collective Pension Amounts, Fiscal Year 2015.
Amortization Schedules and Pension Expense under Note 2.
The primary purpose of this information is to satisfy the actuarial reporting requirements of GASB 68 and the Government Finance Officers Association (GFOA). Readers should not use this information for other purposes. Please replace this information with more recent information from next year’s PEFI when available.
The Actuarial Certification Letter in the DRS 2015 Comprehensive Annual Financial Report(CAFR) covers the required disclosures under GASB 67. We relied on the same participant data, assumptions, and methods for the GASB 68 disclosures as we did for the GASB 67 disclosures. Please refer to that certification letter for additional detail on data, assumptions, and methods, as well as any results that are disclosed under both GASB 67 and GASB 68. This certification letter is intended to cover any disclosures that are unique to GASB 68.
We prepared the required accounting disclosures in accordance with GASB Statement 68. We believe the actuarial assumptions and methods we selected for this analysis are reasonable and appropriate for this purpose. We prepared all items in accordance with generally accepted actuarial principles and actuarial standards of practice as of the date of this letter.
We certify, to the best of our knowledge, that the actuarial submissions in the 2015 PEFImeet the GFOA standards for actuarial reporting.

128 DRS s Participating Employer Financial Information
State Actuary’s Certification Letter (cont.)
Ms. Marcie FrostPage 2 of 2
Office of the State Actuary October 2, 2015
The undersigned, with actuarial credentials, meet the Qualification Standards of the American Academy of Actuaries to render the actuarial opinions contained herein. We are available to provide extra advice and explanations as needed.
Sincerely,
Matthew M. Smith, FCA, EA, MAAA Luke Masselink, ASA, EA, MAAAState Actuary Actuary
N:\MS\2015\2015_PEFI_Certification_Letter.docx
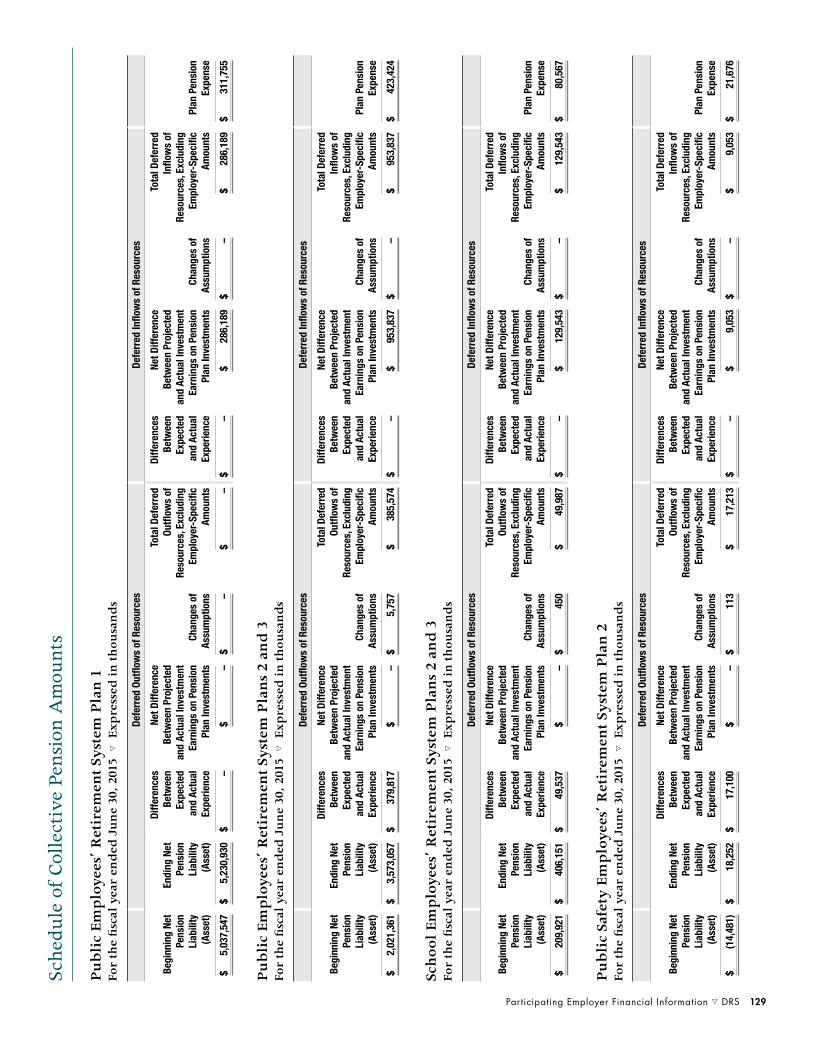
Participating Employer Financial Information s DRS 129
Pu
bli
c Em
plo
yees
’ Ret
irem
ent S
yste
m P
lan
1Fo
r th
e fi
scal
yea
r en
ded
Ju
ne
30, 2
015
s E
xpre
ssed
in th
ousa
nd
s
Sche
dule
of C
olle
ctiv
e Pe
nsio
n A
mou
nts
Defe
rred
Out
flow
s of
Res
ourc
esDe
ferr
ed In
flow
s of
Res
ourc
es
Begi
nnin
g Ne
t Pe
nsio
n Li
abili
ty
(Ass
et)
Endi
ng N
et
Pens
ion
Liab
ility
(A
sset
)
Diffe
renc
es
Betw
een
Expe
cted
an
d Ac
tual
Ex
perie
nce
Net D
iffer
ence
Be
twee
n Pr
ojec
ted
and
Actu
al In
vest
men
t Ea
rnin
gs o
n Pe
nsio
n Pl
an In
vest
men
tsCh
ange
s of
As
sum
ptio
ns
Tota
l Def
erre
d Ou
tflow
s of
Re
sour
ces,
Exc
ludi
ng
Empl
oyer
-Spe
cific
Am
ount
s
Diffe
renc
es
Betw
een
Expe
cted
an
d Ac
tual
Ex
perie
nce
Net D
iffer
ence
Be
twee
n Pr
ojec
ted
and
Actu
al In
vest
men
t Ea
rnin
gs o
n Pe
nsio
n Pl
an In
vest
men
tsCh
ange
s of
As
sum
ptio
ns
Tota
l Def
erre
d In
flow
s of
Re
sour
ces,
Exc
ludi
ng
Empl
oyer
-Spe
cific
Am
ount
sPl
an P
ensi
on
Expe
nse
$ 5,
037,
547
$ 5,
230,
930
$ –
$ –
$ –
$ –
$ –
$ 28
6,18
9 $
–$
286,
189
$ 31
1,75
5
Defe
rred
Out
flow
s of
Res
ourc
esDe
ferr
ed In
flow
s of
Res
ourc
es
Begi
nnin
g Ne
t Pe
nsio
n Li
abili
ty
(Ass
et)
Endi
ng N
et
Pens
ion
Liab
ility
(A
sset
)
Diffe
renc
es
Betw
een
Expe
cted
an
d Ac
tual
Ex
perie
nce
Net D
iffer
ence
Be
twee
n Pr
ojec
ted
and
Actu
al In
vest
men
t Ea
rnin
gs o
n Pe
nsio
n Pl
an In
vest
men
tsCh
ange
s of
As
sum
ptio
ns
Tota
l Def
erre
d Ou
tflow
s of
Re
sour
ces,
Exc
ludi
ng
Empl
oyer
-Spe
cific
Am
ount
s
Diffe
renc
es
Betw
een
Expe
cted
an
d Ac
tual
Ex
perie
nce
Net D
iffer
ence
Be
twee
n Pr
ojec
ted
and
Actu
al In
vest
men
t Ea
rnin
gs o
n Pe
nsio
n Pl
an In
vest
men
tsCh
ange
s of
As
sum
ptio
ns
Tota
l Def
erre
d In
flow
s of
Re
sour
ces,
Exc
ludi
ng
Empl
oyer
-Spe
cific
Am
ount
sPl
an P
ensi
on
Expe
nse
$ 2,
021,
361
$ 3,
573,
057
$ 37
9,81
7 $
–$
5,75
7 $
385,
574
$ –
$ 95
3,83
7 $
–$
953,
837
$ 42
3,42
4
Pu
bli
c Em
plo
yees
’ Ret
irem
ent S
yste
m P
lan
s 2
and
3Fo
r th
e fi
scal
yea
r en
ded
Ju
ne
30, 2
015
s E
xpre
ssed
in th
ousa
nd
s
Sch
ool E
mp
loye
es’ R
etir
emen
t Sys
tem
Pla
ns
2 an
d 3
For
the
fisc
al y
ear
end
ed J
un
e 30
, 201
5 s
Exp
ress
ed in
thou
san
ds
Defe
rred
Out
flow
s of
Res
ourc
esDe
ferr
ed In
flow
s of
Res
ourc
es
Begi
nnin
g Ne
t Pe
nsio
n Li
abili
ty
(Ass
et)
Endi
ng N
et
Pens
ion
Liab
ility
(A
sset
)
Diffe
renc
es
Betw
een
Expe
cted
an
d Ac
tual
Ex
perie
nce
Net D
iffer
ence
Be
twee
n Pr
ojec
ted
and
Actu
al In
vest
men
t Ea
rnin
gs o
n Pe
nsio
n Pl
an In
vest
men
tsCh
ange
s of
As
sum
ptio
ns
Tota
l Def
erre
d Ou
tflow
s of
Re
sour
ces,
Exc
ludi
ng
Empl
oyer
-Spe
cific
Am
ount
s
Diffe
renc
es
Betw
een
Expe
cted
an
d Ac
tual
Ex
perie
nce
Net D
iffer
ence
Be
twee
n Pr
ojec
ted
and
Actu
al In
vest
men
t Ea
rnin
gs o
n Pe
nsio
n Pl
an In
vest
men
tsCh
ange
s of
As
sum
ptio
ns
Tota
l Def
erre
d In
flow
s of
Re
sour
ces,
Exc
ludi
ng
Empl
oyer
-Spe
cific
Am
ount
sPl
an P
ensi
on
Expe
nse
$ 20
9,92
1 $
406,
151
$ 49
,537
$
–$
450
$ 49
,987
$
–$
129,
543
$ –
$ 12
9,54
3 $
80,5
67
Pu
bli
c Sa
fety
Em
plo
yees
’ Ret
irem
ent S
yste
m P
lan
2Fo
r th
e fi
scal
yea
r en
ded
Ju
ne
30, 2
015
s E
xpre
ssed
in th
ousa
nd
s
Defe
rred
Out
flow
s of
Res
ourc
esDe
ferr
ed In
flow
s of
Res
ourc
es
Begi
nnin
g Ne
t Pe
nsio
n Li
abili
ty
(Ass
et)
Endi
ng N
et
Pens
ion
Liab
ility
(A
sset
)
Diffe
renc
es
Betw
een
Expe
cted
an
d Ac
tual
Ex
perie
nce
Net D
iffer
ence
Be
twee
n Pr
ojec
ted
and
Actu
al In
vest
men
t Ea
rnin
gs o
n Pe
nsio
n Pl
an In
vest
men
tsCh
ange
s of
As
sum
ptio
ns
Tota
l Def
erre
d Ou
tflow
s of
Re
sour
ces,
Exc
ludi
ng
Empl
oyer
-Spe
cific
Am
ount
s
Diffe
renc
es
Betw
een
Expe
cted
an
d Ac
tual
Ex
perie
nce
Net D
iffer
ence
Be
twee
n Pr
ojec
ted
and
Actu
al In
vest
men
t Ea
rnin
gs o
n Pe
nsio
n Pl
an In
vest
men
tsCh
ange
s of
As
sum
ptio
ns
Tota
l Def
erre
d In
flow
s of
Re
sour
ces,
Exc
ludi
ng
Empl
oyer
-Spe
cific
Am
ount
sPl
an P
ensi
on
Expe
nse
$ (1
4,48
1)$
18,2
52
$ 17
,100
$
–$
113
$ 17
,213
$
–$
9,05
3 $
–$
9,05
3 $
21,6
76

130 DRS s Participating Employer Financial Information
Teac
her
s’ R
etir
emen
t Sys
tem
Pla
n 1
For
the
fisc
al y
ear
end
ed J
un
e 30
, 201
5 s
Exp
ress
ed in
thou
san
ds
Sche
dule
of C
olle
ctiv
e Pe
nsio
n A
mou
nts
(con
t.)
Defe
rred
Out
flow
s of
Res
ourc
esDe
ferr
ed In
flow
s of
Res
ourc
es
Begi
nnin
g Ne
t Pe
nsio
n Li
abili
ty
(Ass
et)
Endi
ng N
et
Pens
ion
Liab
ility
(A
sset
)
Diffe
renc
es
Betw
een
Expe
cted
an
d Ac
tual
Ex
perie
nce
Net D
iffer
ence
Be
twee
n Pr
ojec
ted
and
Actu
al In
vest
men
t Ea
rnin
gs o
n Pe
nsio
n Pl
an In
vest
men
tsCh
ange
s of
As
sum
ptio
ns
Tota
l Def
erre
d Ou
tflow
s of
Re
sour
ces,
Exc
ludi
ng
Empl
oyer
-Spe
cific
Am
ount
s
Diffe
renc
es
Betw
een
Expe
cted
an
d Ac
tual
Ex
perie
nce
Net D
iffer
ence
Be
twee
n Pr
ojec
ted
and
Actu
al In
vest
men
t Ea
rnin
gs o
n Pe
nsio
n Pl
an In
vest
men
tsCh
ange
s of
As
sum
ptio
ns
Tota
l Def
erre
d In
flow
s of
Re
sour
ces,
Exc
ludi
ng
Empl
oyer
-Spe
cific
Am
ount
sPl
an P
ensi
on
Expe
nse
$ 2,
949,
454
$ 3,
168,
142
$ –
$ –
$ –
$ –
$ –
$ 23
4,49
4 $
–$
234,
494
$ 15
9,86
8
Defe
rred
Out
flow
s of
Res
ourc
esDe
ferr
ed In
flow
s of
Res
ourc
es
Begi
nnin
g Ne
t Pe
nsio
n Li
abili
ty
(Ass
et)
Endi
ng N
et
Pens
ion
Liab
ility
(A
sset
)
Diffe
renc
es
Betw
een
Expe
cted
an
d Ac
tual
Ex
perie
nce
Net D
iffer
ence
Be
twee
n Pr
ojec
ted
and
Actu
al In
vest
men
t Ea
rnin
gs o
n Pe
nsio
n Pl
an In
vest
men
tsCh
ange
s of
As
sum
ptio
ns
Tota
l Def
erre
d Ou
tflow
s of
Re
sour
ces,
Exc
ludi
ng
Empl
oyer
-Spe
cific
Am
ount
s
Diffe
renc
es
Betw
een
Expe
cted
an
d Ac
tual
Ex
perie
nce
Net D
iffer
ence
Be
twee
n Pr
ojec
ted
and
Actu
al In
vest
men
t Ea
rnin
gs o
n Pe
nsio
n Pl
an In
vest
men
tsCh
ange
s of
As
sum
ptio
ns
Tota
l Def
erre
d In
flow
s of
Re
sour
ces,
Exc
ludi
ng
Empl
oyer
-Spe
cific
Am
ount
sPl
an P
ensi
on
Expe
nse
$ 32
2,98
9 $
843,
802
$ 13
3,56
9 $
–$
733
$ 13
4,30
2 $
–$
327,
370
$ –
$ 32
7,37
0 $
239,
721
Teac
her
s’ R
etir
emen
t Sys
tem
Pla
ns
2 an
d 3
For
the
fisc
al y
ear
end
ed J
un
e 30
, 201
5 s
Exp
ress
ed in
thou
san
ds
Law
En
forc
emen
t Offi
cers
’ an
d F
ire
Figh
ters
’ Ret
irem
ent S
yste
m P
lan
1Fo
r th
e fi
scal
yea
r en
ded
Ju
ne
30, 2
015
s E
xpre
ssed
in th
ousa
nd
s
Defe
rred
Out
flow
s of
Res
ourc
esDe
ferr
ed In
flow
s of
Res
ourc
es
Begi
nnin
g Ne
t Pe
nsio
n Li
abili
ty
(Ass
et)
Endi
ng N
et
Pens
ion
Liab
ility
(A
sset
)
Diffe
renc
es
Betw
een
Expe
cted
an
d Ac
tual
Ex
perie
nce
Net D
iffer
ence
Be
twee
n Pr
ojec
ted
and
Actu
al In
vest
men
t Ea
rnin
gs o
n Pe
nsio
n Pl
an In
vest
men
tsCh
ange
s of
As
sum
ptio
ns
Tota
l Def
erre
d Ou
tflow
s of
Re
sour
ces,
Exc
ludi
ng
Empl
oyer
-Spe
cific
Am
ount
s
Diffe
renc
es
Betw
een
Expe
cted
an
d Ac
tual
Ex
perie
nce
Net D
iffer
ence
Be
twee
n Pr
ojec
ted
and
Actu
al In
vest
men
t Ea
rnin
gs o
n Pe
nsio
n Pl
an In
vest
men
tsCh
ange
s of
As
sum
ptio
ns
Tota
l Def
erre
d In
flow
s of
Re
sour
ces,
Exc
ludi
ng
Empl
oyer
-Spe
cific
Am
ount
sPl
an P
ensi
on
Expe
nse
$ (1
,212
,791
)$
(1,2
05,2
21)
$ –
$ –
$ –
$ –
$ –
$ 20
3,46
5 $
–$
203,
465
$ (2
38,2
77)
Law
En
forc
emen
t Offi
cers
’ an
d F
ire
Figh
ters
’ Ret
irem
ent S
yste
m P
lan
2Fo
r th
e fi
scal
yea
r en
ded
Ju
ne
30, 2
015
s E
xpre
ssed
in th
ousa
nd
s
Defe
rred
Out
flow
s of
Res
ourc
esDe
ferr
ed In
flow
s of
Res
ourc
es
Begi
nnin
g Ne
t Pe
nsio
n Li
abili
ty
(Ass
et)
Endi
ng N
et
Pens
ion
Liab
ility
(A
sset
)
Diffe
renc
es
Betw
een
Expe
cted
an
d Ac
tual
Ex
perie
nce
Net D
iffer
ence
Be
twee
n Pr
ojec
ted
and
Actu
al In
vest
men
t Ea
rnin
gs o
n Pe
nsio
n Pl
an In
vest
men
tsCh
ange
s of
As
sum
ptio
ns
Tota
l Def
erre
d Ou
tflow
s of
Re
sour
ces,
Exc
ludi
ng
Empl
oyer
-Spe
cific
Am
ount
s
Diffe
renc
es
Betw
een
Expe
cted
an
d Ac
tual
Ex
perie
nce
Net D
iffer
ence
Be
twee
n Pr
ojec
ted
and
Actu
al In
vest
men
t Ea
rnin
gs o
n Pe
nsio
n Pl
an In
vest
men
tsCh
ange
s of
As
sum
ptio
ns
Tota
l Def
erre
d In
flow
s of
Re
sour
ces,
Exc
ludi
ng
Empl
oyer
-Spe
cific
Am
ount
sPl
an P
ensi
on
Expe
nse
$ (1
,327
,043
)$
(1,0
27,8
00)
$ 90
,001
$
–$
2,71
1 $
92,7
12
$ –
$ 31
1,41
8 $
–$
311,
418
$ (3
6,73
1)

Participating Employer Financial Information s DRS 131
Notes to the Schedules
Note 1: Plan DescriptionThe Department of Retirement Systems (DRS) administers cost-sharing, multiple-employer retirement plans and single-employer retirement plans that cover eligible employees of the state and its local governments.
This publication includes these cost-sharing, multiple-employer retirement plans:
Public Employees’ Retirement System (PERS) Plan 1: Defined benefitPlan 2: Defined benefitPlan 3: Defined benefit/defined contribution
School Employees’ Retirement System (SERS)Plan 2: Defined benefitPlan 3: Defined benefit/defined contribution
Public Safety Employees’ Retirement System (PSERS)
Plan 2: Defined benefit
Teachers’ Retirement System (TRS)Plan 1: Defined benefitPlan 2: Defined benefitPlan 3: Defined benefit/defined contribution
Law Enforcement Officers’ and Fire Fighters’ Retirement System (LEOFF)
Plan 1: Defined benefitPlan 2: Defined benefit
This publication excludes these single-employer plans:
Washington State Patrol Retirement System (WSPRS) Plan 1: Defined benefitPlan 2: Defined benefit
Judicial Retirement System (JRS)Defined benefit
Judges’ Retirement Fund (JRF)Defined benefit
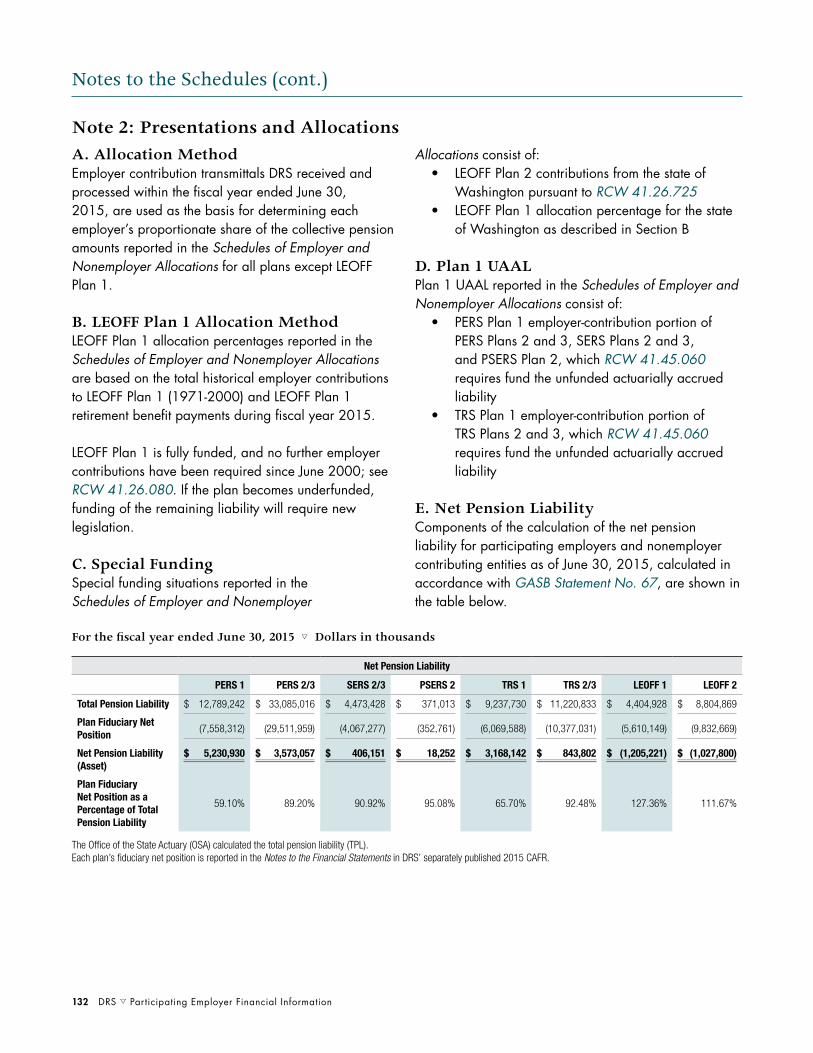
132 DRS s Participating Employer Financial Information
Notes to the Schedules (cont.)
Net Pension Liability
PERS 1 PERS 2/3 SERS 2/3 PSERS 2 TRS 1 TRS 2/3 LEOFF 1 LEOFF 2
Total Pension Liability $ 12,789,242 $ 33,085,016 $ 4,473,428 $ 371,013 $ 9,237,730 $ 11,220,833 $ 4,404,928 $ 8,804,869
Plan Fiduciary Net Position
(7,558,312) (29,511,959) (4,067,277) (352,761) (6,069,588) (10,377,031) (5,610,149) (9,832,669)
Net Pension Liability (Asset)
$ 5,230,930 $ 3,573,057 $ 406,151 $ 18,252 $ 3,168,142 $ 843,802 $ (1,205,221) $ (1,027,800)
Plan Fiduciary Net Position as a Percentage of Total Pension Liability
59.10% 89.20% 90.92% 95.08% 65.70% 92.48% 127.36% 111.67%
For the fiscal year ended June 30, 2015 s Dollars in thousands
Note 2: Presentations and AllocationsA. Allocation MethodEmployer contribution transmittals DRS received and processed within the fiscal year ended June 30, 2015, are used as the basis for determining each employer’s proportionate share of the collective pension amounts reported in the Schedules of Employer and Nonemployer Allocations for all plans except LEOFF Plan 1.
B. LEOFF Plan 1 Allocation MethodLEOFF Plan 1 allocation percentages reported in the Schedules of Employer and Nonemployer Allocations are based on the total historical employer contributions to LEOFF Plan 1 (1971-2000) and LEOFF Plan 1 retirement benefit payments during fiscal year 2015.
LEOFF Plan 1 is fully funded, and no further employer contributions have been required since June 2000; see RCW 41.26.080. If the plan becomes underfunded, funding of the remaining liability will require new legislation.
C. Special FundingSpecial funding situations reported in the Schedules of Employer and Nonemployer
Allocations consist of:• LEOFF Plan 2 contributions from the state of
Washington pursuant to RCW 41.26.725• LEOFF Plan 1 allocation percentage for the state
of Washington as described in Section B
D. Plan 1 UAALPlan 1 UAAL reported in the Schedules of Employer and Nonemployer Allocations consist of:
• PERS Plan 1 employer-contribution portion of PERS Plans 2 and 3, SERS Plans 2 and 3, and PSERS Plan 2, which RCW 41.45.060 requires fund the unfunded actuarially accrued liability
• TRS Plan 1 employer-contribution portion of TRS Plans 2 and 3, which RCW 41.45.060 requires fund the unfunded actuarially accrued liability
E. Net Pension LiabilityComponents of the calculation of the net pension liability for participating employers and nonemployer contributing entities as of June 30, 2015, calculated in accordance with GASB Statement No. 67, are shown in the table below.
The Office of the State Actuary (OSA) calculated the total pension liability (TPL).Each plan’s fiduciary net position is reported in the Notes to the Financial Statements in DRS’ separately published 2015 CAFR.
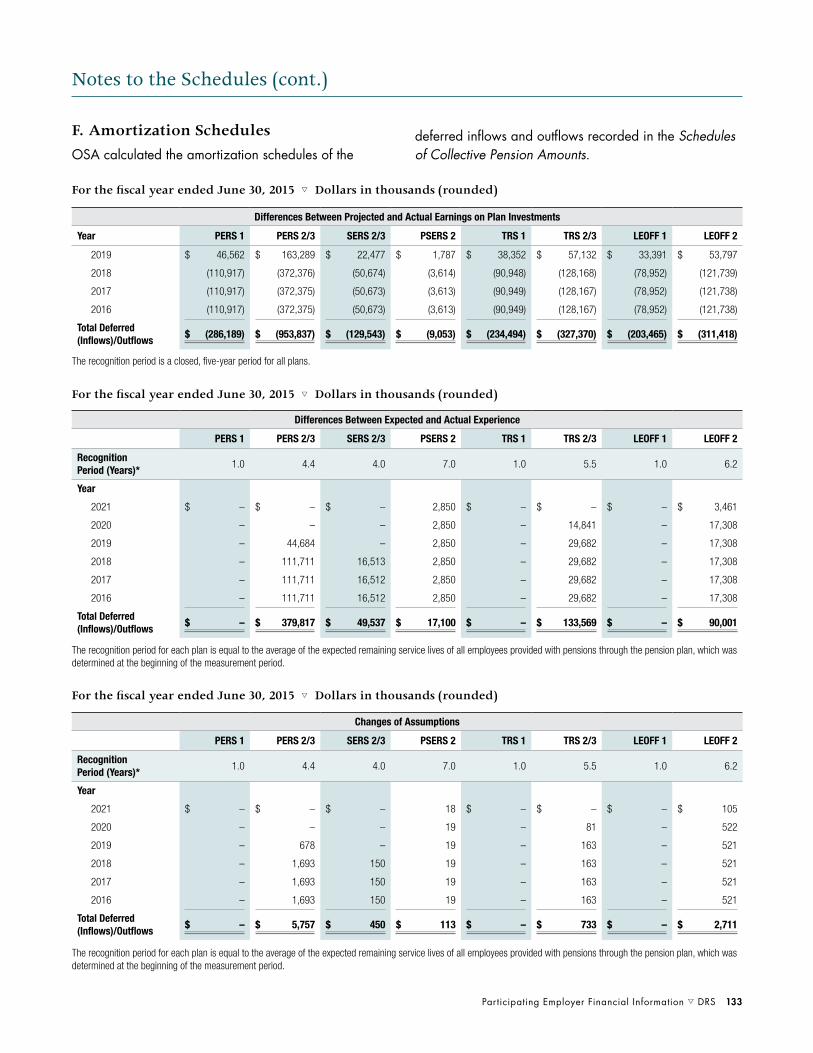
Participating Employer Financial Information s DRS 133
Notes to the Schedules (cont.)
F. Amortization SchedulesOSA calculated the amortization schedules of the
deferred inflows and outflows recorded in the Schedules of Collective Pension Amounts.
Differences Between Projected and Actual Earnings on Plan Investments
Year PERS 1 PERS 2/3 SERS 2/3 PSERS 2 TRS 1 TRS 2/3 LEOFF 1 LEOFF 2
2019 $ 46,562 $ 163,289 $ 22,477 $ 1,787 $ 38,352 $ 57,132 $ 33,391 $ 53,797
2018 (110,917) (372,376) (50,674) (3,614) (90,948) (128,168) (78,952) (121,739)
2017 (110,917) (372,375) (50,673) (3,613) (90,949) (128,167) (78,952) (121,738)
2016 (110,917) (372,375) (50,673) (3,613) (90,949) (128,167) (78,952) (121,738)
Total Deferred (Inflows)/Outflows
$ (286,189) $ (953,837) $ (129,543) $ (9,053) $ (234,494) $ (327,370) $ (203,465) $ (311,418)
The recognition period is a closed, five-year period for all plans.
For the fiscal year ended June 30, 2015 s Dollars in thousands (rounded)
Differences Between Expected and Actual Experience
PERS 1 PERS 2/3 SERS 2/3 PSERS 2 TRS 1 TRS 2/3 LEOFF 1 LEOFF 2
Recognition Period (Years)*
1.0 4.4 4.0 7.0 1.0 5.5 1.0 6.2
Year
2021 $ – $ – $ – 2,850 $ – $ – $ – $ 3,461
2020 – – – 2,850 – 14,841 – 17,308
2019 – 44,684 – 2,850 – 29,682 – 17,308
2018 – 111,711 16,513 2,850 – 29,682 – 17,308
2017 – 111,711 16,512 2,850 – 29,682 – 17,308
2016 – 111,711 16,512 2,850 – 29,682 – 17,308
Total Deferred (Inflows)/Outflows
$ – $ 379,817 $ 49,537 $ 17,100 $ – $ 133,569 $ – $ 90,001
The recognition period for each plan is equal to the average of the expected remaining service lives of all employees provided with pensions through the pension plan, which was determined at the beginning of the measurement period.
Changes of Assumptions
PERS 1 PERS 2/3 SERS 2/3 PSERS 2 TRS 1 TRS 2/3 LEOFF 1 LEOFF 2
Recognition Period (Years)*
1.0 4.4 4.0 7.0 1.0 5.5 1.0 6.2
Year
2021 $ – $ – $ – 18 $ – $ – $ – $ 105
2020 – – – 19 – 81 – 522
2019 – 678 – 19 – 163 – 521
2018 – 1,693 150 19 – 163 – 521
2017 – 1,693 150 19 – 163 – 521
2016 – 1,693 150 19 – 163 – 521
Total Deferred (Inflows)/Outflows
$ – $ 5,757 $ 450 $ 113 $ – $ 733 $ – $ 2,711
The recognition period for each plan is equal to the average of the expected remaining service lives of all employees provided with pensions through the pension plan, which was determined at the beginning of the measurement period.
For the fiscal year ended June 30, 2015 s Dollars in thousands (rounded)
For the fiscal year ended June 30, 2015 s Dollars in thousands (rounded)

134 DRS s Participating Employer Financial Information
A. Basis of AccountingDRS’ financial statements conform to generally accepted accounting principles (GAAP).
The retirement plans are accounted for in pension trust funds using the flow of economic-resources-measurement focus and the accrual basis of accounting. Employer contributions to each plan are recognized when due and the employer has made a formal commitment to provide the contributions.
DRS financial statements include: • Additions and deductions incurred from the
administration of the pension fund• Asset balance of the general capital assets
fund to account for the capital assets used in administering the pension plans
• The asset balance of the general long-term obligation fund DRS maintains to account for accumulated compensated absences incurred in administering the pension plans
Note 3: Reconciliation of DRS’ financial statements and employer records to Schedules of Employer and Nonemployer Allocations and Schedules of Collective Pension Amounts
Notes to the Schedules (cont.)
G. Pension ExpenseComponents of the pension expense reported in the
Schedules of Collective Pension Amounts for the fiscal year ended June 30, 2015, are presented below.
For the fiscal year ended June 30, 2015 s Dollars in thousands
* Amortization supporting schedules are located in this publication; see Amortization Schedules (F) on page 133. All other supporting information is available in the Financial Section of the 2015 DRS CAFR; see Schedule of Changes in Net Pension Liability reported in Required Supplementary Information located by plan on pages 77-82.
Pension Expense
Pension Trust
Description* PERS 1 PERS 2/3 SERS 2/3 PSERS 2 TRS 1 TRS 2/3 LEOFF 1 LEOFF 2
Service Cost $ 28,685 $ 864,319 $ 128,806 $ 40,546 $ 15,630 $ 352,315 $ 3,270 $ 286,031
Interest Cost 933,978 2,302,454 311,044 24,553 676,915 776,944 319,945 609,818
Amortization of Differences Between Expected and Actual Experience
27,130 111,711 16,512 2,850 23,516 29,682 (65,557) 17,308
Amortization of Changes of Assumptions
23,339 1,693 150 19 6,552 163 – 521
Changes of Benefit Terms
– – – – – – – 34,746
Employee Contributions
(21,617) (374,825) (35,445) (18,664) (10,324) (52,713) (1,016) (165,772)
Expected Earnings on Plan Investments
(569,121) (2,111,750) (290,427) (24,016) (461,499) (739,185) (415,748) (699,387)
Amortization of Differences Between Projected and Actual Earnings on Plan Investments
(110,917) (372,376) (50,673) (3,613) (90,949) (128,167) (78,952) (121,738)
Administrative Expenses
269 581 20 2 28 64 18 1,504
Other Changes in Fiduciary Net Position
9 1,617 580 (1) (1) 618 (237) 238
Total Pension Expense $ 311,755 $ 423,424 $ 80,567 $ 21,676 $ 159,868 $ 239,721 $ (238,277) $ (36,731)

Participating Employer Financial Information s DRS 135
Notes to the Schedules (cont.)
Actuarial valuations do not include these amounts. Employers should refer to the audited Notes to the Financial Statements located in the DRS CAFR when implementing GASB 68.
B. Employer Contribution ExclusionsThe employer contributions reported in DRS’ Statement of Changes in Fiduciary Net Position included in the separately issued CAFR will not agree with the employer allocation totals in the Schedules of Employer and Nonemployer Allocations due to the following exclusions:
• Accruals prepared at the plan level
• Nonrecurring bills of individual employers• Contributions for DRS employees
C. Contribution ReconciliationThe tables below present a reconciliation summary of the employer and nonemployer contribution allocations to the contributions reported in DRS’ Statement of Changes in Fiduciary Net Position.
The employer and nonemployer contributions were used in determining each employer’s proportionate share of the collective pension amounts for the fiscal year ended June 30, 2015.
Reconciliation of Allocations to DRS’ Statement of Changes in Net Position (SCNP)
Employer and Nonemployer Allocations s Expressed in Dollars
PERS 1 PERS 2/3 SERS 2/3 PSERS 2 TRS 1 TRS 2/3 LEOFF 2
Total Employer Contribution Allocations
$ 23,671,012.29 $ 445,452,657.87 $ 97,221,684.99 $ 18,635,063.17 $ 11,755,099.02 $ 265,747,327.92 $ 88,231,950.18
Total Plan 1 UAAL 435,926,990.17 – – – 212,021,765.38 – –
Total Special Funding – – – – – – 58,339,032.00
Total Employer and Nonemployer Entity Allocations*
459,598,002.46 445,452,657.87 97,221,684.99 18,635,063.17 223,776,864.40 265,747,327.92 146,570,982.18
Total Contributions Excluded from Allocations
2,501,588.18 674,259.30 164,227.15 69,331.73 109,012.36 1,290,701.74 890,131.22
Total Employer and Nonemployer Contributions with Allocation Exclusions $ 462,099,590.64 $ 446,126,917.17 $ 97,385,912.14 $ 18,704,394.90 $ 223,885,876.76 $ 267,038,029.66 $ 147,461,113.40
For the fiscal year ended June 30, 2015
* DRS has provided an online service for employers to access the employer transmittal detail reported in its Schedules of Employer and Nonemployer Allocations.
** LEOFF 1 is based on the percentage of historical contributions paid to the plan. The employer-allocation percentage breakdown is based on the final employer for the LEOFF 1 member and retirement benefits paid during the 2015 fiscal year.
Employer and Nonemployer Allocations
LEOFF Plan 1**
Historical % of Employer Contributions 12.88%
Historical % of State Contributions 87.12%
Total Allocation Percentage 100.00%
DRS 2015 CAFR Employer and Nonemployer Contributions s Expressed in Thousands
PERS 1 PERS 2/3 SERS 2/3 PSERS 2 TRS 1 TRS 2/3 LEOFF 2
Employer $ 462,100 $ 446,127 $ 97,386 $ 18,704 $ 223,886 $ 267,038 $ 89,122
Nonemployer (State) – – – – – – 58,339
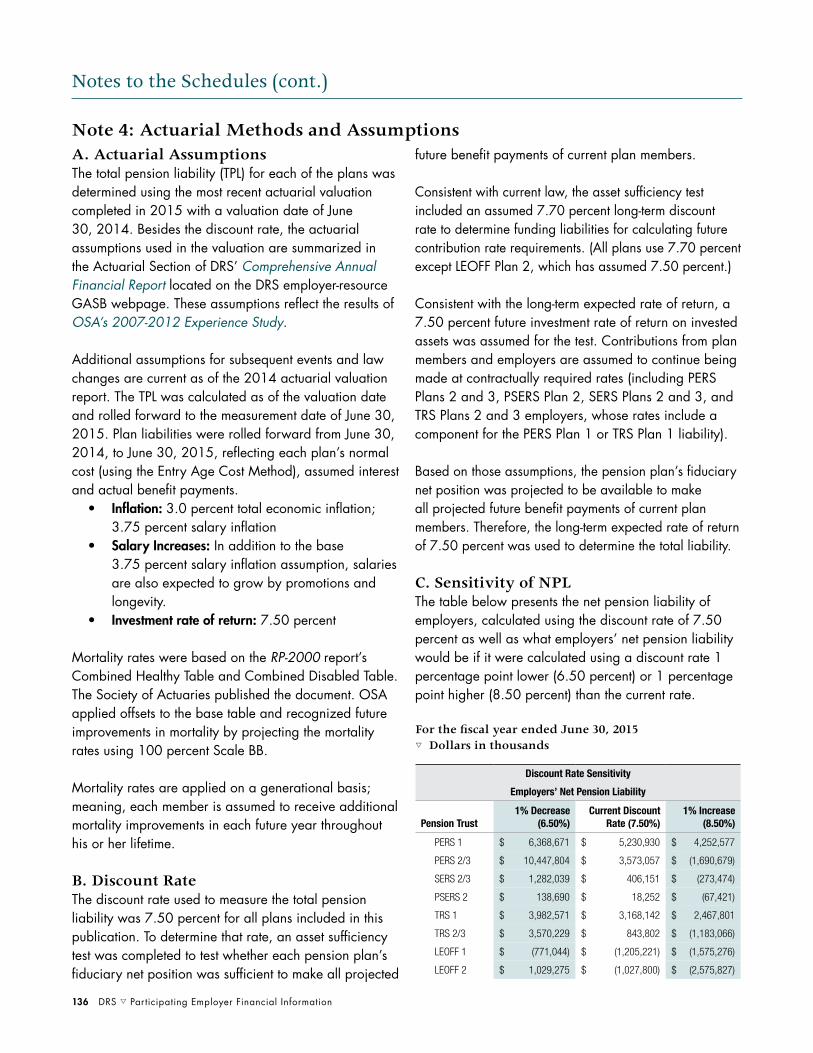
136 DRS s Participating Employer Financial Information
A. Actuarial AssumptionsThe total pension liability (TPL) for each of the plans was determined using the most recent actuarial valuation completed in 2015 with a valuation date of June 30, 2014. Besides the discount rate, the actuarial assumptions used in the valuation are summarized in the Actuarial Section of DRS’ Comprehensive Annual Financial Report located on the DRS employer-resource GASB webpage. These assumptions reflect the results of OSA’s 2007-2012 Experience Study.
Additional assumptions for subsequent events and law changes are current as of the 2014 actuarial valuation report. The TPL was calculated as of the valuation date and rolled forward to the measurement date of June 30, 2015. Plan liabilities were rolled forward from June 30, 2014, to June 30, 2015, reflecting each plan’s normal cost (using the Entry Age Cost Method), assumed interest and actual benefit payments.
• Inflation: 3.0 percent total economic inflation; 3.75 percent salary inflation
• Salary Increases: In addition to the base 3.75 percent salary inflation assumption, salaries are also expected to grow by promotions and longevity.
• Investment rate of return: 7.50 percent
Mortality rates were based on the RP-2000 report’s Combined Healthy Table and Combined Disabled Table. The Society of Actuaries published the document. OSA applied offsets to the base table and recognized future improvements in mortality by projecting the mortality rates using 100 percent Scale BB.
Mortality rates are applied on a generational basis; meaning, each member is assumed to receive additional mortality improvements in each future year throughout his or her lifetime.
B. Discount RateThe discount rate used to measure the total pension liability was 7.50 percent for all plans included in this publication. To determine that rate, an asset sufficiency test was completed to test whether each pension plan’s fiduciary net position was sufficient to make all projected
future benefit payments of current plan members.
Consistent with current law, the asset sufficiency test included an assumed 7.70 percent long-term discount rate to determine funding liabilities for calculating future contribution rate requirements. (All plans use 7.70 percent except LEOFF Plan 2, which has assumed 7.50 percent.)
Consistent with the long-term expected rate of return, a 7.50 percent future investment rate of return on invested assets was assumed for the test. Contributions from plan members and employers are assumed to continue being made at contractually required rates (including PERS Plans 2 and 3, PSERS Plan 2, SERS Plans 2 and 3, and TRS Plans 2 and 3 employers, whose rates include a component for the PERS Plan 1 or TRS Plan 1 liability).
Based on those assumptions, the pension plan’s fiduciary net position was projected to be available to make all projected future benefit payments of current plan members. Therefore, the long-term expected rate of return of 7.50 percent was used to determine the total liability.
C. Sensitivity of NPLThe table below presents the net pension liability of employers, calculated using the discount rate of 7.50 percent as well as what employers’ net pension liability would be if it were calculated using a discount rate 1 percentage point lower (6.50 percent) or 1 percentage point higher (8.50 percent) than the current rate.
Discount Rate Sensitivity
Employers’ Net Pension Liability
Pension Trust1% Decrease
(6.50%)Current Discount
Rate (7.50%)1% Increase
(8.50%)
PERS 1 $ 6,368,671 $ 5,230,930 $ 4,252,577
PERS 2/3 $ 10,447,804 $ 3,573,057 $ (1,690,679)
SERS 2/3 $ 1,282,039 $ 406,151 $ (273,474)
PSERS 2 $ 138,690 $ 18,252 $ (67,421)
TRS 1 $ 3,982,571 $ 3,168,142 $ 2,467,801
TRS 2/3 $ 3,570,229 $ 843,802 $ (1,183,066)
LEOFF 1 $ (771,044) $ (1,205,221) $ (1,575,276)
LEOFF 2 $ 1,029,275 $ (1,027,800) $ (2,575,827)
For the fiscal year ended June 30, 2015s Dollars in thousands
Note 4: Actuarial Methods and Assumptions
Notes to the Schedules (cont.)

Participating Employer Financial Information s DRS 137
D. Long-Term Expected Rate of ReturnThe long-term expected rate of return on pension plan investments was determined using a building-block method. The Washington State Investment Board (WSIB) used a best estimate of expected future rates of return (expected returns, net of pension plan investment expense, including inflation) to develop each major asset class. Those expected returns make up one component of WSIB’s Capital Market Assumptions (CMAs).
The CMAs contain three pieces of information for each class of assets WSIB currently invests in:
• Expected annual return• Standard deviation of the annual return• Correlations between the annual returns of each
asset class with every other asset class
WSIB uses the CMAs and their target asset allocation to simulate future investment returns at various future times.
The long-term expected rate of return of 7.50 percent approximately equals the median of the simulated investment returns over a 50-year time horizon, adjusted
to remove or dampen any short-term changes to WSIB’s CMAs that aren’t expected over the entire 50-year measurement period.
E. Estimated Rates of Return by Asset ClassBest estimates of arithmetic real rates of return for each major asset class included in the pension plan’s target asset allocation as of June 30, 2015, are summarized in this table.
The inflation component used to create the table is 2.20 percent and represents WSIB’s most recent long-term estimate of broad economic inflation.
Financial and pension plan information supporting the preparation of the Schedules of Collective Pension Amounts and Schedules of Employer and Nonemployer Allocations for the fiscal year ended June 30, 2015, is located in DRS’ Comprehensive Annual Financial Report located on the DRS employer-resource GASB webpage.
Supporting actuarial information for the implementation
of GASB 67 and GASB 68 is included in Note 4 of this document.
Additional actuarial and pension plan information is included in the DRS 2015 CAFR, including descriptions of actuarial data, assumptions, methods, and plan provisions relied on for the preparation of GASB 67 and GASB 68. Additional details regarding this information is included in OSA’s 2014 Actuarial Valuation Report.
Note 5: Additional Information
Asset Class Target Allocation
% Long-Term Expected Real Rate
of Return Arithmetic
Fixed Income 20.00% 1.70%
Tangible Assets 5.00% 4.40%
Real Estate 15.00% 5.80%
Global Equity 37.00% 6.60%
Private Equity 23.00% 9.60%
100.00%
Notes to the Schedules (cont.)
Department of Retirement Systems PO Box 48380 Olympia, WA 98504-8380
360.664.7000
800.547.6657
www.drs.wa.gov