Partially Nonergodic Empirical Ground‐Motion Models … · Partially Nonergodic Empirical...
15
Ⓔ Partially Nonergodic Empirical Ground-Motion Models for Predicting Horizontal and Vertical PGV, PGA, and 5% Damped Linear Acceleration Response Spectra Using Data from the Iranian Plateau by Farhad Sedaghati and Shahram Pezeshk Abstract We present new ground-motion prediction equations (GMPEs) to esti- mate horizontal and vertical strong ground motion intensity measures (GMIMs) generated by shallow active crustal earthquakes occurring within the Iranian plateau. To this end, a dataset containing 688 records from 152 earthquakes with moment magnitudes ranging from 4.7 to 7.4 and Joyner–Boore distances up to 250 km has been used. The effects of the local site condition are taken into account using the time- averaged shear-wave velocities in the upper 30 m (V S30 ). We decided not to include the style-of-faulting term in the final functional form because the total standard deviation is reduced 10% by removing this term from the functional form. We used a nonlinear mixed-effects regression to determine the coefficients of the functional form and to separate out the between-event and between-station standard deviations from the total standard deviation. Significant standard deviation of site-to-site vari- ability demonstrates that the ergodic assumption is not able to account for the spatial variability of ground motions. We introduced random-effects coefficients to capture regional variations between different tectonic regions of the Iranian plateau, such as Alborz and Zagros, in the regression analysis to investigate the effects of regionali- zation on GMPEs. The results showed that, although the effects of regional variations for considered regions are negligible at close distances, they are significant at longer distances. The complexity and performance of the final functional form is justified by comparing Akaike and Bayesian information criteria values over many trial functional forms. Moreover, the distribution of between-event, site-to-site, and event-station cor- rected residuals demonstrates that no trends are evident, implying satisfactory perfor- mance of the proposed GMPEs. Therefore, the derived GMPEs can be employed to predict GMIMs and to do seismic-hazard assessments within the Iranian plateau. Electronic Supplement: Lists of the events and stations considered in the final dataset and derived coefficients of the functional form. Introduction The Iranian plateau, situated in the middle of the Alpine-Himalayan orogenic belt and characterized by active strike-slip and reverse faults and frequent moderate-to-large earthquakes, is one of the foremost tectonically active areas in the world (Berberian and Yeats, 1999; Tavakoli and Ghafory-Ashtiany, 1999; Ansari and Amini Hosseini, 2014). The Alpine-Himalayan orogenic belt located between the Arabian and Eurasian plates undergoes compressional stresses. This area is considered as a convergent plate tec- tonic setting. The convergence is still active in a nearly north–south direction at a rate of ∼25–30 mm=year at the eastern edge of the Arabian plate (Sella et al., 2002). Even though there is no historical evidence that an earthquake with a magnitude larger than 8 has struck Iran, there is a potential to have a devastating earthquake because no large earthquake has been reported for several long strike-slip faults such as Doruneh and Nayband (Berberian and Yeats, 1999). There- fore, it is vital to be prepared for such a destructive event. Ghasemi et al. (2008), Mousavi et al. (2012), and Zafarani and Mousavi (2014), using the ranking schemes proposed by Scherbaum et al. (2004, 2009), showed that ground-motion prediction equations (GMPEs) developed 934 Bulletin of the Seismological Society of America, Vol. 107, No. 2, pp. 934–948, April 2017, doi: 10.1785/0120160205
Transcript of Partially Nonergodic Empirical Ground‐Motion Models … · Partially Nonergodic Empirical...

Ⓔ
Partially Nonergodic Empirical Ground-Motion Models for Predicting
Horizontal and Vertical PGV, PGA, and 5% Damped Linear Acceleration
Response Spectra Using Data from the Iranian Plateau
by Farhad Sedaghati and Shahram Pezeshk
Abstract We present new ground-motion prediction equations (GMPEs) to esti-mate horizontal and vertical strong ground motion intensity measures (GMIMs)generated by shallow active crustal earthquakes occurring within the Iranian plateau.To this end, a dataset containing 688 records from 152 earthquakes with momentmagnitudes ranging from 4.7 to 7.4 and Joyner–Boore distances up to 250 km hasbeen used. The effects of the local site condition are taken into account using the time-averaged shear-wave velocities in the upper 30 m (VS30). We decided not to includethe style-of-faulting term in the final functional form because the total standarddeviation is reduced 10% by removing this term from the functional form. We useda nonlinear mixed-effects regression to determine the coefficients of the functionalform and to separate out the between-event and between-station standard deviationsfrom the total standard deviation. Significant standard deviation of site-to-site vari-ability demonstrates that the ergodic assumption is not able to account for the spatialvariability of ground motions. We introduced random-effects coefficients to captureregional variations between different tectonic regions of the Iranian plateau, such asAlborz and Zagros, in the regression analysis to investigate the effects of regionali-zation on GMPEs. The results showed that, although the effects of regional variationsfor considered regions are negligible at close distances, they are significant at longerdistances. The complexity and performance of the final functional form is justified bycomparing Akaike and Bayesian information criteria values over many trial functionalforms. Moreover, the distribution of between-event, site-to-site, and event-station cor-rected residuals demonstrates that no trends are evident, implying satisfactory perfor-mance of the proposed GMPEs. Therefore, the derived GMPEs can be employed topredict GMIMs and to do seismic-hazard assessments within the Iranian plateau.
Electronic Supplement: Lists of the events and stations considered in the finaldataset and derived coefficients of the functional form.
Introduction
The Iranian plateau, situated in the middle of theAlpine-Himalayan orogenic belt and characterized by activestrike-slip and reverse faults and frequent moderate-to-largeearthquakes, is one of the foremost tectonically active areasin the world (Berberian and Yeats, 1999; Tavakoli andGhafory-Ashtiany, 1999; Ansari and Amini Hosseini, 2014).The Alpine-Himalayan orogenic belt located between theArabian and Eurasian plates undergoes compressionalstresses. This area is considered as a convergent plate tec-tonic setting. The convergence is still active in a nearlynorth–south direction at a rate of ∼25–30 mm=year at the
eastern edge of the Arabian plate (Sella et al., 2002). Eventhough there is no historical evidence that an earthquake witha magnitude larger than 8 has struck Iran, there is a potentialto have a devastating earthquake because no large earthquakehas been reported for several long strike-slip faults such asDoruneh and Nayband (Berberian and Yeats, 1999). There-fore, it is vital to be prepared for such a destructive event.
Ghasemi et al. (2008), Mousavi et al. (2012), andZafarani and Mousavi (2014), using the ranking schemesproposed by Scherbaum et al. (2004, 2009), showed thatground-motion prediction equations (GMPEs) developed
934
Bulletin of the Seismological Society of America, Vol. 107, No. 2, pp. 934–948, April 2017, doi: 10.1785/0120160205

based on local databases of different parts of Iran are mostlyassigned better ranks compared to Next Generation Attenua-tion-West (NGA-West) GMPEs. Furthermore, regardless ofhaving a suitable strong-motion network in the country, thereis a limited and small number of appropriate and reliableGMPEs based on a local database in which all influential es-timator parameters, such as magnitude, distance, site classifi-cation, and style-of-faulting, are taken into account.Within thelast decade, several empirical GMPEs have been developed topredict ground motion intensity measures (GMIMs) for Iran ora particular region inside the Iranian plateau (e.g., Nowroozi,2005; Zare and Sabzali, 2006; Ghodrati Amiri et al., 2007,2010; Ghasemi et al., 2009; Sadeghi et al., 2010; Hamzehlooand Mahood, 2012; Saffari et al., 2012; Kale et al., 2015;Soghrat and Ziyaeifar, 2016). We selected models that havebeen calibrated based on the data from the whole Iranian pla-teau and refer to these GMPEs as N05 (Nowroozi, 2005),GZFK09 (Ghasemi et al., 2009), SKTM12 (Saffari et al.,2012), and KAAH15 (Kale et al., 2015). These GMPEs usedvastly different approaches and parameters. Table 1 comparestheir magnitude–distance range of applicability and technicaldifferences, such as terms used in their functional forms.
Epistemic uncertainties are typically captured with a com-bination of GMPEs using the logic-tree approach, whereasthe aleatory uncertainty σ is directly used in the probabilisticseismic-hazard assessment (PSHA) integrations to estimatehazard in a given site, and a small decrease in σ can result ina significant influence on the hazard assessments (Rodriguez-Marek et al., 2014). Therefore, separating out the epistemicuncertainty from the aleatory uncertainty to reduce σ is vitalfor the new generation of GMPEs. One way to reduce the total
standard deviation is to utilize the partially nonergodic ap-proach (Anderson and Brune, 1999; Rodriguez-Marek et al.,2014; Kotha et al., 2016) in which the site-to-site variability isremoved from the total variability. The corrected standarddeviation σss is known as the single-station sigma (Atkinson,2006). Another way to reduce the total aleatory standarddeviation is to consider the effects of regional differences as-sociated with source, path, and site functions (Stafford, 2014),because databases used to develop GMPEs can be composedof records from different tectonic regions.
Moving toward conducting partially nonergodic region-specific PSHA (Kotha et al., 2017), there is an essential need toupdate GMPEs derived based on the database of Iranianground-motion records. In this study, we present new GMPEsto predict the horizontal and the vertical peak ground velocity(PGV), peak ground acceleration (PGA), and 5% damped lin-ear elastic pseudoabsolute response spectral acceleration (PSA)ordinates. Although the functional form seems relatively sim-ple, it captures the main characteristics of ground motions. Weused a nonlinear mixed-effects regression analysis discussedby Stafford (2014) instead of the traditional mixed-effects al-gorithm developed by Abrahamson and Youngs (1992) to par-tition the total residual into three components (between-event,between-station, and event-site corrected residuals; Chen andTsai, 2002) and to incorporate random-effects coefficients toaccount for regional differences among various tectonic re-gions of the Iranian plateau.
Database and Data Processing
The Iranian plateau is composed of many minor seismiczones; however, it is generally divided into two major seis-
Table 1Summary of the Database Ranges and Functional Forms of Ground-Motion Prediction Equations Developed for Iran
N05 GZFK09 SKTM12 KAAH15 This Study
Region Iran Iran and West Eurasia Iran Iran IranNumber of events 45 200 78 138 152Number of recordings 279 893 351 528 688Magnitude scale Different scales M M M MMagnitude range 3.0–7.4 5.0–7.4 5.0–7.3 4.2–7.4 4.7–7.4Distance scale REPI REPI RRUP and RHYP RJB RJB
Maximum distance (km) 245 340 135 200 250Hinge magnitude Not used Not used Not used Included IncludedGeometrical spreading term Included Included Included Included IncludedAnelastic attenuation term Not used Not used Not used Included IncludedSoil response term Linear Linear Linear Nonlinear LinearFault mechanism term Not used Not used SS, RV SS, RV Not usedRegional variability Not used Not used Not used Not used IncludedStandard deviation σ σ τ, ϕ, σ τ, ϕ, σ τ, ϕ0, ϕS2S, σDirection Horizontal and vertical Horizontal Horizontal Horizontal Horizontal and verticalComponent of horizontal SRSM GMRotI50 Geometric mean Geometric mean Geometric meanGMIM PGA PSA PGV, PGA, and PSA PGV, PGA, and PSA PGV, PGA, and PSA
N05, Nowroozi (2005); GZFK09, Ghasemi et al., (2009); SKTM12, Saffari et al., (2012); KAAH15, Kale et al. (2015); REPI, epicentral distance; RRUP,rupture distance; RHYP, hypocentral distance; RJB, Joyner–Boore distance; σ, total standard deviation; τ, between-event standard deviation; ϕ, within-eventstandard deviation; ϕ0, event-site corrected standard deviation; ϕS2S, site-to-site standard deviation; SRSM, square root of sum of squares of the twocomponents; GMRotI50, 50th percentile of the set of geometric means for a given oscillator period (Boore et al., 2006); PGV, peak ground velocity;PGA, peak ground acceleration; PSA, pseudoabsolute response spectral acceleration; SS, strike-slip; RV, reverse; GMIM, ground motion intensity measures.
Partially Nonergodic Empirical Ground-Motion Models 935

mic zones with different tectonic characteristics known as theAlborz and Zagros regions. Records from the Zagros activefolded belt generally have distinct frequency content, dura-tion, and attenuation rate compared to records from theAlborz region. Further, the surface structure of these two re-gions is different (Berberian and Mohajer Ashjai, 1977). As aconsequence, the combination of records from these regionswith various seismic characteristics and discrepant tectonicsettings may result in increased standard deviations of theGMPEs (Douglas, 2004a,b). On the other hand, compilationof a large database aims to improve the range of applicabilityof the database in terms of magnitude, distance, and site con-ditions, in addition to deriving reliable and robust GMPEsthrough the variability of ground motions (Kotha et al.,2016). Ghasemi et al. (2009) and Sedaghati and Pezeshk(2016a), utilizing the analysis of variance technique (Doug-las, 2004a,b), investigated the regional differences betweenmajor seismic zones of Iran and demonstrated that recordsfrom the Alborz region can be merged with records from theZagros region to derive GMPEs, although these regions havedifferent seismic characteristics. In this article, we use a data-set containing records from different tectonic regions ofIran (Alborz, Zagros, and others) to have a wider magnitude–distance range of applicability of the derived GPMEs to beused within PSHA. Thus, random-effects coefficients in thefunctional form are introduced to explore the effects of regionalvariations on GMPEs.
We collected uncorrected triaxial accelerograms for thisstudy from the Iranian Strong Motion Network (ISMN) datarecorded by the Building and Housing Research Center ofIran. The ISMN recording sensors include both analog instru-ments, the kinematics SMA-1 that is an optical-mechanicaldevice and digital instruments SSA-2. Waveforms used inthis study occurred during the period of 1979–2013. Theserecords have been visually inspected, and poor quality datahave been removed. To avoid confronting any biases, we per-formed a baseline adjustment, including subtracting themean from the raw waveform and removing the linear trend.Then, the response of the instruments has been deconvolvedwith the recorded signals to correct for the instrument re-sponse. The next step is to deal with noise, which can haveobvious and significant impacts on the velocity and displace-ment time histories obtained by the integration of an accel-eration time history. It should be mentioned that, even thoughthe separation of the noise from the signal is impossible, dataprocessing and filtering can aid an analyst to identify whichpart of the signal has satisfactory signal-to-noise ratio (SNR)to be used for further investigations and to remove the part ofthe signal which is heavily contaminated by noise (Booreand Bommer, 2005; Douglas and Boore, 2011). Therefore,a phaseless eight-pole band-pass filter has been applied onevery single zero-padded accelerogram to remove portionsof accelerograms for which SNRs are unacceptable. To pre-vent distortion of the size and location of the peaks in wave-forms, a phaseless (acausal) filter is used to filter signals,because causal filters may change the phase portion of
signals. Filter cutoff frequencies for each accelerogramare very important and can easily change values of PGV,PGA, and PSAs (Akkar and Bommer, 2006, 2007). Todetermine these cutoff frequencies, the Fourier amplitude ofthe signal to the Fourier amplitude of the noise plot has beenused, in which the signal is defined as a window after theorigin time and the noise is defined as a window before theorigin time. The length of this window is variable and flex-ible based on the pre-event length of the record. The lowerand upper cutoff frequencies are frequencies at which theFourier amplitude of the signal to the Fourier amplitudeof the noise becomes less than three (Akkar and Bommer,2006; Ghasemi et al., 2009). After processing the initialdatabase, we applied the following criteria to create thefinal dataset to perform regression:
• Records lacking the three components are discardedfrom the final dataset.
• Because the proposed GMPEs are developed for shal-low active crustal earthquakes, we consider events withfocal depths less than 35 km to be included in the finaldataset.
• Only records with Joyner–Boore distances less than250 km are included in the final dataset.
• Records with unknown VS30 are excluded from thefinal dataset. It should be mentioned that 30% of thedata in the initial database had no VS30, and they areeliminated from the final dataset.
• Regarding the recent attention about accounting forthe effects of small magnitude events within PSHA(Bindi et al., 2014), we did not set any limitations forthe moment magnitude. However, our initial databaseconsists of records with a minimum moment magni-tude of 4.7.
The final dataset is composed of 688 records out of 152earthquakes recorded at 321 different stations, with momentmagnitudes varying from 4.7 to 7.4 and Joyner–Boore dis-tances within 250 km. This dataset has 46 singly recordedearthquakes. We kept singly recorded earthquakes andaftershocks in the final dataset if they passed the above-mentioned criteria. Figure 1 demonstrates the locations ofthe considered stations as well as the locations of the se-lected earthquakes. Figure 2 illustrates the distribution ofdata in the magnitude–distance space. It should be notedthat the number of records with distances less than 10 kmis not adequately robust; hence, the predicted medianground motions may not be well constrained at very shortdistances. Out of 688 records, 262 records are from theZagros region, 132 records are from the Alborz region, and294 records are from other regions, such as central andeastern Iran. Histograms of the selected records with re-spect to magnitude, distance, and VS30 for each region aredisplayed in Figure 3. Ⓔ Table S1 (available in the elec-tronic supplement to this article) lists all the earthquakes,dates, times, epicentral longitudes and latitudes, momentmagnitudes, depths, and the number of records for each
936 F. Sedaghati and S. Pezeshk

earthquake considered in the final dataset. Ⓔ Table S2 liststhe name of stations, their longitudes and latitudes, VS30,and the number of records for each station.
The vertical component and the geometric mean of thehorizontal components for PGV, PGA, and PSA ordinatesare considered as the vertical and the horizontal GMIMsof interest, respectively. Niazi and Bozorgnia (1991), Elna-shai and Papazoglou (1997), Ambraseys and Douglas(2003), and Bozorgnia and Campbell (2004) discussed theeffect of vertical ground motions on structures that shouldbe taken into account, particularly for near-source distances;therefore, we estimated the coefficients of the functionalform for the vertical component as well as the horizontalcomponent. We considered 13 spectral periods: 0.050, 0.075,0.10, 0.15, 0.20, 0.30, 0.50, 0.75, 1.0, 1.5, 2.0, 3.0, and 4.0 s.We restricted the spectral periods to these values because thenumber of records out of this range is very small, and theregression analysis does not yield a robust result. The peakground displacement is intensively sensitive to the cutofffrequencies of the applied band-pass filter; therefore, thisGMIM is not considered in the developed GMPEs (Booreet al., 2014).
Functional Form and Regression Method
Kaklamanos and Baise (2011) compared various NGA-West GMPEs and demonstrated that sophisticated functionalforms essentially do not guarantee more accuracy and reduc-tion of their standard deviations compared to simple func-tional forms. Hence, we included terms corresponding to thepredictor variables that are available in the database. Kothaet al. (2016) used the same functional form proposed byBindi et al. (2014) for Europe and the Middle East andshowed that incorporating regional variations as random ef-fects in the functional form results in a significant decrease inthe total aleatory standard deviation. In this study, we usea parametric regression approach in which coefficients arecalibrated using the nonlinear mixed-effects algorithm andconsider the presence of regional variations in ground mo-tions. In this regard, we use the nonlinear mixed-effects regres-sion algorithm developed by Lindstrom and Bates (1990) andexerted in MATLAB with the functions of nlmefit and fitlme-matrix (MathWorks Inc., 2015).
Generally, observed ground motions are a function ofsource, path, and site effects. To develop a framework for
44°
44°
45°
45°
46°
46°
47°
47°
48°
48°
49°
49°
50°
50°
51°
51°
52°
52°
53°
53°
54°
54°
55°
55°
56°
56°
57°
57°
58°
58°
59°
59°
60°
60°
61°
61°
62°
62°
63°
63°
25° 25°
26° 26°
27° 27°
28° 28°
29° 29°
30° 30°
31° 31°
32° 32°
33° 33°
34° 34°
35° 35°
36° 36°
37° 37°
38° 38°
39° 39°
40° 40°
0 500
km
S
E
N
W
Caspian Sea
Persian Gulf
StationEarthquake
Figure 1. Locations of the considered stations and selected earthquakes. The color version of this figure is available only in the electronicedition.
Partially Nonergodic Empirical Ground-Motion Models 937

the functional form, the first step is inspecting nonparametricplots of data, such as PSA values versus distance, to explorethe magnitude and distance dependence of PGA and PSAordinates. Sedaghati and Pezeshk (2016b) showed that se-lecting an appropriate functional form is the main step to cal-ibrating GMPEs, whereas the effect of choosing a specificregression procedure to derive the model coefficients is insig-nificant. Accordingly, we chose many trial functional formswith distinctive terms included, and compared Akaike andBayesian information criteria (AIC and BIC, respectively)values and the logarithms of their likelihoods to find an ap-propriate functional form that can best fit the data. Based onthe considerations discussed, we propose the following func-tional form
EQ-TARGET;temp:intralink-;df1;55;291 ln�Y� � fsource � fpath � δBe � δW; �1�
in which
EQ-TARGET;temp:intralink-;df2;55;244δW � fsite � δS2S � ε; �2�
and ln�Y� is the natural logarithm of the GMIM of interest(PGA and PSAs in g and PGV in cm=s), δW is the within-event term, and δBe and δS2S are the random effects in themodels to describe the between-event and site-to-site resid-uals. δBe has a normal distribution with zero mean and stan-dard deviation of τ. δS2S has a normal distribution with zeromean and standard deviation of ϕS2S (Al Atik et al., 2010). ϵis the event-site corrected residual having normal distributionwith zero mean and standard deviation of ϕ0. fsource, fpath,and fsite are the source, the path, and the site functions,respectively.
The source function is given by
EQ-TARGET;temp:intralink-;df3;313;403fsource ��a1 � a2�M −Mh� � a3�M −Mh�2 M ≤ Mh
a1 � a4�M −Mh� M > Mh;
�3�
in which M is the moment magnitude, Mh is the hinge mag-nitude fixed at 7.0, and a1 to a4 are fixed-effects coefficients.The coefficient a4, which represents the saturation effectwith magnitude, is not constrained to be nonnegative to allowcapturing the oversaturation effect with magnitude if it existsin the dataset.
The path function describing the effects of the geo-metrical spreading, the magnitude-dependent geometricalspreading, and the anelastic attenuation (Sedaghati andPezeshk, 2016c) is defined as
EQ-TARGET;temp:intralink-;df4;313;221fpath � �b1 � b2M� ln��������������������R2JB � h2
q�
� �b3 � Δb3;region���������������������R2JB � h2
q�; �4�
in which RJB is the Joyner–Boore distance, b1, b2, b3, and h(fictitious depth) are fixed-effects coefficients, and Δb3 is arandom-effect coefficient to capture the effects of regionalvariations in the anelastic attenuation (Q−1). Since there isa trade-off between the geometric spreading and the anelasticattenuation terms because of the scatter of data, we restrictedthe coefficient b3 to be negative or zero.
Figure 2. Distribution of the considered data in the magnitude–distance space. Records with RJB (Joyner–Boore distance) less than1 km are demonstrated at 1 km in the plots. The color version of thisfigure is available only in the electronic edition.
5 6 70
50
100
150
Num
ber
of r
ecor
ds
0 100 2000
20
40
60
80
500 1000 15000
10
20
30Zagros
5 6 70
50
100
Num
ber
of r
ecor
ds
0 100 2000
10
20
30
500 1000 15000
5
10
15
20Alborz
5 6 7 M
0
20
40
60
80
Num
ber
of r
ecor
ds
0 100 200R
JB(km)
0
20
40
60
500 1000 1500V
S30 (m/s)
0
10
20
30
40
Others
Figure 3. Histograms demonstrating the distribution of the dataused with respect to magnitude, distance, and VS30 for each group.The color version of this figure is available only in the electronicedition.
938 F. Sedaghati and S. Pezeshk

The site function describing the effects of the near-surface site diminution κ0 (Anderson and Hough, 1984) andthe site amplification is defined as
EQ-TARGET;temp:intralink-;df5;55;466fsite � c1 � c2 ln�VS30�; �5�
in which c1 and c2 are fixed-effects coefficients. We did notaccount for the nonlinear site amplification effects becauseour dataset is deficient in records with high moment magni-tude and very short Joyner–Boore distance captured at sta-tions with low VS30.
It is worth mentioning that we first introduced randomeffects on all fixed-effects coefficients, particularly on c1 andc2, to capture the effects of regional differences in κ0 and siteamplification in trial functional forms. However, based on theperformance of those functional forms and comparing thep-value of each random-effects coefficient, explaining the sig-nificance of that coefficient in the functional form and AICand BIC values, we decided to represent the anelastic attenu-ation term by both fixed-effects and random-effects coefficientsand to disregard the remaining random-effects coefficients.
Furthermore, in our trial functional forms, we first incor-porated coefficients corresponding to the style-of-faultingterm; yet, p-values of those coefficients reveal that they arestatistically insignificant. Removing the style-of-faulting termfrom the functional form reduced the total standard deviationof residual by 10%. At most periods, the between-station stan-dard deviation is nearly constant with or without the style-of-faulting term; yet, the between-event and event-site correctedstandard deviations are reduced after disregarding the style-of-faulting term. Thus, following Kotha et al. (2016), we decidedto eliminate the style-of-faulting term from the final func-tional form.
Because of rising interest in implementing site-specificPSHA (Kotha et al., 2017), we performed the regression analy-sis in two steps (equations 1 and 2) to separate out the site-to-
site component δS2S from the total residual. As a consequence,the site-corrected standard deviation can be obtained from
EQ-TARGET;temp:intralink-;df6;313;478σ0 �����������������τ2 � ϕ2
0
q: �6�
Then, δS2S � SE (standard error) is modeled as the site-adjust-ment factor and its epistemic uncertainty (Rodriguez-Mareket al., 2014). On the other hand, in traditional PSHA (i.e.,ergodic assumption), all residual components are consideredto obtain the total aleatory uncertainty
EQ-TARGET;temp:intralink-;df7;313;376σ ���������������������������������τ2 � ϕ2
0 � ϕ2S2S
q: �7�
Results and Discussion
We first performed the mixed-effects regression analysison equation (1) to obtain the source and path effects coeffi-cients. Then, we performed another mixed-effects regressionanalysis on equation (2) using the within-event residualsobtained from the first stage to acquire the coefficients of thesite-effects term. The source, path, and site-effects coeffi-cients are listed in Tables 2 and 3 for the horizontal and ver-tical directions, respectively. Associated standard deviationsand regional variations coefficients in anelastic attenuationterms are tabulated in Tables 4 and 5 for the horizontal andvertical directions, respectively. We also provided thesetables as Ⓔ Tables S3–S6. Moreover, site-to-site residualsfor all stations to be used in site-specific PSHA studies areprovided as Ⓔ Tables S7 and S8 for horizontal and verticaldirections, respectively.
Figure 4 compares the horizontal and vertical anelasticattenuation coefficients. The effect of the apparent anelasticattenuation is negligible at very low and very high frequencyranges; yet, it is significant in the intermediate frequencyrange of 1–20 Hz (Atkinson, 2004). An interesting point
Table 2Derived Source, Path, and Site-Effects Coefficients of the Functional Form for the Horizontal Component
Period a1 a2 a3 a4 b1 b2 b3 h c1 c2
PGV 4.33325 1.41553 0.05836 0.86556 −0.01452 −0.09448 0.00000 3.43732 1.04360 −0.16201PGA 0.44780 0.24582 −0.14444 0.49645 −1.17792 0.04959 0.00000 4.52478 0.68185 −0.107270.050 1.28296 0.39084 −0.06956 0.41181 −1.26192 0.03221 0.00000 5.57414 −0.14576 0.022510.075 1.79752 0.40895 −0.07594 0.48121 −1.21353 0.01317 0.00000 6.69748 −0.41950 0.065670.10 1.75732 0.44831 −0.10471 0.51506 −0.91959 −0.01771 −0.00132 5.89668 −0.23816 0.037350.15 1.92211 0.68712 −0.09073 0.42364 −0.66230 −0.05142 −0.00107 5.05776 0.53382 −0.084020.20 1.84094 0.81142 −0.06014 0.41682 −0.61504 −0.05301 −0.00052 5.21685 0.96326 −0.152050.30 0.93871 0.42956 −0.12175 −0.13730 −1.08613 0.04596 −0.00141 4.05788 1.94902 −0.305710.50 0.16310 0.12164 −0.25975 0.15371 −1.26131 0.08491 −0.00131 4.79965 2.41536 −0.378350.75 −0.35304 0.07930 −0.27238 0.49447 −1.45150 0.11993 −0.00114 6.58682 2.32740 −0.364781.0 −0.32946 0.09923 −0.31769 0.33462 −1.53799 0.11986 0.00000 9.71673 2.31834 −0.363191.5 −1.07387 0.17559 −0.31747 0.32466 −1.69699 0.15532 0.00000 8.85002 2.65348 −0.415642.0 −1.34555 0.21828 −0.33131 0.39197 −1.86417 0.17975 0.00000 10.79563 2.61514 −0.409333.0 −1.71058 0.18318 −0.40189 0.60346 −2.02030 0.20208 0.00000 14.60791 2.32699 −0.363714.0 −1.64664 0.42652 −0.33922 0.66777 −2.06789 0.20052 0.00000 20.18967 2.01555 −0.31493
PGA and PSAs are in units of g, and PGV has units of cm/s.
Partially Nonergodic Empirical Ground-Motion Models 939

is that the horizontal anelastic attenuation is weaker than thevertical, due to the higher frequency content of the verticalcomponent compared with the horizontal component (Stew-art et al., 2016). Bindi et al. (2011) and Stewart et al. (2016)also had similar observations comparing the vertical andhorizontal anelastic attenuation coefficients.
Figure 5 shows the comparison of the horizontal and ver-tical VS30-scaling coefficients. The site response for the ver-tical component is significantly lower than for the horizontalcomponent. This confirms the assumption of the H/V tech-nique in which the vertical site amplification is negligiblecompared to the horizontal site amplification to measure thesite response (Lermo and Chavez-Garcia, 1993; Zandieh andPezeshk, 2011). For periods less than about 0.1 s, the VS30-scaling coefficients are positive. It is very well established thatsofter sites (lower VS30) amplify long-period motions, whereas
stiffer sites (higher VS30) amplify short-period motions.Therefore, having positive site-response values at short periodis justified. The reader is referred to Kramer (1996) for a dis-cussion of the comparison of the site amplification effectswithin different sites. A similar observation was made by Gha-semi et al. (2009) and Soghrat and Ziyaeifar (2016).
Figure 6 displays the period dependence comparison ofthe standard deviations. The between-event and site-to-sitestandard deviations of vertical and horizontal motions arecomparable; however, the event-site corrected standarddeviation of the vertical component is higher than the hori-zontal component, resulting in a higher overall standarddeviation for the vertical component. Stewart et al. (2016)also observed the same trend comparing total standard devi-ations of vertical and horizontal components. This indicatesthat there is more scatter of data in the vertical direction than
Table 3Derived Source, Path, and Site-Effects Coefficients of the Functional Form for the Vertical Component
Period a1 a2 a3 a4 b1 b2 b3 h c1 c2
PGV 3.84553 1.12721 −0.11120 1.12538 0.06376 −0.11459 0.00000 7.33430 0.45063 −0.06904PGA −0.32176 0.00795 −0.14011 0.32612 −1.60377 0.12555 −0.00223 4.90710 −0.01229 0.001320.050 1.66400 0.24546 −0.10090 0.85470 −1.64838 0.06451 −0.00155 7.46483 −0.93195 0.145390.075 1.36236 0.23167 −0.15349 1.00740 −1.29590 0.03809 −0.00405 7.19732 −0.35834 0.055440.10 0.82558 0.41494 −0.03751 0.43918 −1.19230 0.05304 −0.00546 4.66372 0.07088 −0.012540.15 0.94686 0.56822 −0.07128 0.50286 −0.94059 0.01084 −0.00395 5.06452 0.22220 −0.035490.20 1.35291 0.89665 −0.01630 0.15262 −0.78544 −0.03050 −0.00154 6.87616 0.24147 −0.038810.30 0.76382 0.56948 −0.06353 0.03079 −1.19802 0.03999 −0.00090 8.98875 0.36840 −0.058700.50 −0.38842 −0.28561 −0.31437 0.16822 −1.77938 0.14813 −0.00093 10.32620 0.16614 −0.027110.75 −1.08457 −0.89586 −0.40550 −0.00072 −2.56429 0.27182 0.00000 13.27726 0.58054 −0.091771.0 −1.15711 −0.71209 −0.38767 −0.23647 −2.56498 0.27067 0.00000 15.46950 0.63574 −0.099691.5 −1.67083 −0.94815 −0.45175 −0.25892 −3.09290 0.35369 0.00000 17.64422 0.90997 −0.142132.0 −1.70981 −0.46810 −0.38954 −0.28465 −2.83722 0.31440 0.00000 17.49300 1.15554 −0.180503.0 −1.31340 0.18260 −0.38439 −0.13375 −2.26790 0.21694 0.00000 23.02558 0.66731 −0.103584.0 −0.78427 0.66893 −0.32855 −0.03085 −1.94019 0.14942 0.00000 31.60893 0.81452 −0.12683
PGA and PSAs are in units of g, and PGV has units of cm/s.
Table 4Associated Standard Deviations of the Proposed Functional Form and Random-Effects Coefficients for the Horizontal Component
Period τ ϕS2S ϕ0 σ Δb3;Alborz Δb3;Zagros Δb3;Others SE (Δb3;Alborz) SE (Δb3;Zagros) SE (Δb3;Others)
PGV 0.21991 0.27471 0.56986 0.66975 0.00000 0.00000 0.00000 0.00000 0.00000 0.00000PGA 0.20592 0.20338 0.45542 0.53961 0.00000 0.00000 0.00000 0.00000 0.00000 0.000000.050 0.26759 0.24464 0.52383 0.63706 0.00000 0.00000 0.00000 0.00000 0.00000 0.000000.075 0.29109 0.26182 0.51187 0.64443 0.00000 0.00000 0.00000 0.00000 0.00000 0.000000.10 0.26870 0.29404 0.53584 0.66767 0.00000 0.00000 0.00000 0.00000 0.00000 0.000000.15 0.24067 0.28827 0.53874 0.65671 0.00000 0.00000 0.00000 0.00000 0.00000 0.000000.20 0.22902 0.28460 0.53337 0.64648 0.00000 0.00000 0.00000 0.00000 0.00000 0.000000.30 0.26071 0.23028 0.56110 0.66018 0.00001 −0.00009 0.00008 0.00007 0.00003 0.000040.50 0.23706 0.24270 0.62001 0.70676 0.00007 −0.00018 0.00011 0.00019 0.00044 0.000100.75 0.25190 0.30756 0.64693 0.75932 0.00015 −0.00069 0.00054 0.00065 0.00062 0.000651.0 0.25511 0.34064 0.65563 0.78164 0.00000 0.00000 0.00000 0.00000 0.00000 0.000001.5 0.26505 0.36046 0.68288 0.81640 0.00000 0.00000 0.00000 0.00000 0.00000 0.000002.0 0.23501 0.36160 0.68411 0.80870 0.00000 0.00000 0.00000 0.00000 0.00000 0.000003.0 0.33210 0.33375 0.63807 0.79298 0.00000 0.00000 0.00000 0.00000 0.00000 0.000004.0 0.48985 0.27984 0.60826 0.82960 0.00000 0.00000 0.00000 0.00000 0.00000 0.00000
All standard deviations are in natural logarithm units. SE, standard error.
940 F. Sedaghati and S. Pezeshk

in the horizontal direction. Because we did not discard singlyrecorded earthquakes or singly recorded stations, thebetween-event and site-to-site standard deviations may beslightly underestimated.
Figures 7 and 8 show the decay rate (attenuation) of theestimated spectral accelerations with distance for the hori-zontal and vertical components, respectively. The mediandistance scaling of the proposed GMPEs are computed fora reference site with VS30 of 760 m=s. We chose PSA at aperiod of 1.0 s because it is widely used in the seismic-hazardanalysis (Tavakoli and Pezeshk, 2005; Rezaeian et al., 2015).The distance attenuation trends show that spectral accelera-tions are fairly constant (flat) for distances up to 5 km,whereas the decay rates of spectral accelerations are rela-tively steep for distances more than 10 km. Moreover, theMscaling, indicating the relative positions of the curves for aspecific distance, is weak for high frequency and becomesstronger for low frequencies. In addition, the curvature on
the curves of the vertical component implies the stronger ver-tical anelastic attenuation compared to the horizontal.
Figures 9 and 10 present the variation of the estimatedmedian response spectra versus spectral period for sites withVS30 of 360 and 760 m=s located at Joyner–Boore distancesof 10 and 100 km for horizontal and vertical components,respectively. The comparison of the predicted median re-sponse spectra at different distances and magnitudes confirmsthat the spectral acceleration decreases as distance increases,and increases with increasing magnitude. Furthermore, it canbe seen that the predominant period, defined as the period inwhich the response spectrum is maximum (Boore et al.,2014), systematically increases with increasing moment mag-nitude for the horizontal component. However, the locationsof the predominant period do not noticeably changewith mag-nitude for the vertical component. Bozorgnia and Campbell(2016a) and Stewart et al. (2016) had a similar observationfor horizontal and vertical predominant periods.
Table 5Associated Standard Deviations of the Proposed Functional Form and Random-Effects Coefficients for the Vertical Component
Period τ ϕS2S ϕ0 σ Δb3;Alborz Δb3;Zagros Δb3;Others SE (Δb3;Alborz) SE (Δb3;Zagros) SE (Δb3;Others)
PGV 0.27917 0.28996 0.57154 0.69905 0.00000 0.00000 0.00000 0.00000 0.00000 0.00000PGA 0.21104 0.16597 0.50317 0.57032 0.00000 0.00000 0.00000 0.00000 0.00000 0.000000.050 0.32567 0.26859 0.60610 0.73862 0.00000 0.00000 0.00000 0.00000 0.00000 0.000000.075 0.31193 0.25567 0.60890 0.73036 0.00000 0.00000 0.00000 0.00000 0.00000 0.000000.10 0.28880 0.31005 0.60135 0.73563 0.00000 0.00000 0.00000 0.00000 0.00000 0.000000.15 0.25778 0.29522 0.56773 0.68987 0.00000 0.00000 0.00000 0.00000 0.00000 0.000000.20 0.25529 0.25430 0.58073 0.68344 0.00007 −0.00025 0.00018 0.00038 0.00037 0.000420.30 0.23982 0.24810 0.59422 0.68714 0.00004 −0.00018 0.00015 0.00033 0.00032 0.000330.50 0.24370 0.27256 0.66659 0.76028 −0.00049 −0.00042 0.00090 0.00072 0.00069 0.000730.75 0.24878 0.29194 0.69164 0.79088 0.00000 0.00000 0.00000 0.00000 0.00000 0.000001.0 0.27942 0.28654 0.70367 0.80953 0.00000 0.00000 0.00000 0.00000 0.00000 0.000001.5 0.29497 0.33724 0.73200 0.85823 0.00000 0.00000 0.00000 0.00000 0.00000 0.000002.0 0.30107 0.34996 0.73815 0.87062 0.00000 0.00000 0.00000 0.00000 0.00000 0.000003.0 0.46021 0.28037 0.67186 0.86128 0.00000 0.00000 0.00000 0.00000 0.00000 0.000004.0 0.63650 0.24940 0.62358 0.92530 0.00000 0.00000 0.00000 0.00000 0.00000 0.00000
All standard deviations are in natural logarithm units.
0.05 0.1 1 4
Spectral period (s)
-6
-5
-4
-3
-2
-1
0
Ane
last
ic a
ttenu
atio
n co
effi
cien
t, b 3 × 10⁻³
HorizontalVertical
Figure 4. Comparison of the horizontal and vertical apparentanelastic attenuation coefficients. The color version of this figureis available only in the electronic edition.
0.05 0.1 1 4
Spectral period (s)
-0.5
-0.4
-0.3
-0.2
-0.1
0
0.1
VS3
0-s
calin
g co
effi
cien
t, c
2 HorizontalVertical
Figure 5. Comparison of the horizontal and vertical VS30-scaling coefficients. The color version of this figure is available onlyin the electronic edition.
Partially Nonergodic Empirical Ground-Motion Models 941

The introduced random-effects term on the anelasticattenuation for each region Δb3 indicates that the effects ofregionalization on the anelastic attenuation only show up inthe middle frequency range, indicating the fact that the ane-lastic attenuation effect is negligible at very low and veryhigh frequencies (Aki, 1980). This little variation betweenthe anelastic attenuation in different regions of the Iranianplateau in the middle frequency range is caused either by thedifference in the lithosphere structure of these regions or bythe difference in scattered heterogeneities within the crust orby the difference of the viscosity of the lithosphere (Seda-ghati and Pezeshk, 2016c). The effects of regionalization onthe median predication are demonstrated in Figure 11. Thedifference between predicted median motions grows withincreasing distance because the anelastic attenuationinfluences the curvature of the distance decay of spectral ac-celerations. However, there is a negligible difference be-tween predicted median motions for distances less than100 km, indicating that the impact of the geometric spreadingoverweigh the anelastic attenuation at close distances,whereas the impact of the anelastic attenuation overweighsthe geometric spreading at long distances (Atkinson andBoore, 2014). Figure 12 illustrates the effects of regionaliza-tion on the median response spectra for sites at Joyner–Boore
distances of 10 and 200 km and VS30 of 760 m=s. For the siteat distance of 10 km, regional differences in anelastic attenu-ation are clearly insignificant, whereas for the site at distanceof 200 km, the influence of regional variations on the responsespectra is obvious in the intermediate frequency range.
The distribution of between-event, site-to-site, andevent-site corrected residuals, respectively, describes therobustness of the source (M-scaling), site (VS30-scaling), andpath (distance-scaling) terms of the functional form. Fig-ures 13 and 14 display between-event, site-to-site, and event-site corrected residuals against predictor variables to explorethe validity of our median GMPEs for PGA and PSA at aperiod of 1.0 s for the horizontal and vertical directions, re-spectively. We used 0.25 M, 100 m=s, and 25 km intervalbins to compute the average values of residuals. Error barsrepresent the mean of binned residuals along with their 95%confidence intervals. It should be noted that we combinedtwo last magnitude bins because the number of records werefew. We considered bins in which there are at least three ob-servations to estimate the mean of binned residuals. The
0.05 0.1 1 4
Spectral period (s)
0
0.2
0.4
0.6
0.8
1
Stan
dard
dev
iatio
nsHorizontal Component
0.05 0.1 1 4
Spectral period (s)
0
0.2
0.4
0.6
0.8
1
Stan
dard
dev
iatio
ns
Vertical Component
Figure 6. Comparison of between-event, site-to-site, event-sitecorrected, and total aleatory standard deviations with respect tospectral period for horizontal and vertical components. The colorversion of this figure is available only in the electronic edition.
1 5 10 50 100 250R
JB (km)
10-4
10-3
10-2
10-1
100
SA (
g)
PGA
M 4M 5M 6M 7M 8
1 5 10 50 100 250R
JB (km)
10-4
10-3
10-2
10-1
100
SA (
g)
PSA at T=1.0 s
Figure 7. Comparison of distance scaling characteristics of ourproposed ground-motion prediction equations (GMPEs) for thehorizontal component of spectral accelerations (SAs) for a referencesite with VS30 � 760 m=s. PGA, peak ground acceleration; PSA,pseudoabsolute response spectral acceleration. The color versionof this figure is available only in the electronic edition.
942 F. Sedaghati and S. Pezeshk

evaluation of these figures shows random distributions ofresiduals, indicating that there are no obvious biases, andno significant trends and models fit the observations well.
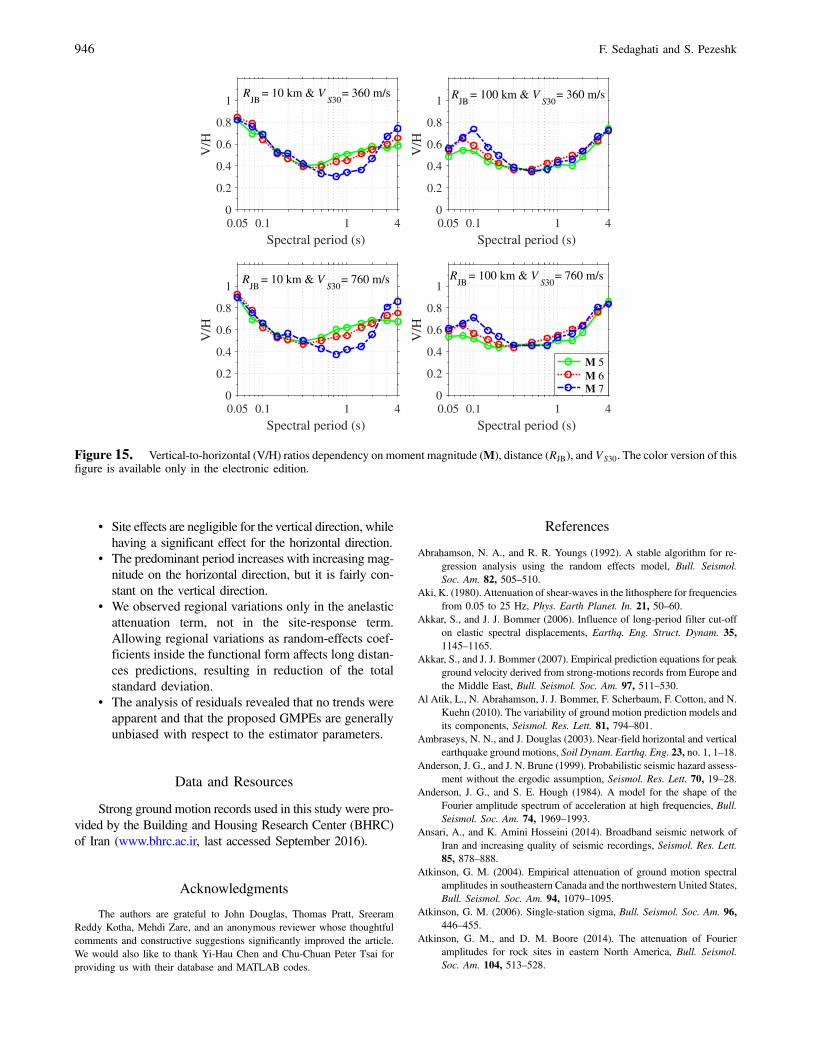
There are two approaches to develop vertical design spec-tra for a particular site: using vertical GMPEs or using the ver-tical-to-horizontal (V/H) ratio approach (Bommer et al., 2011;Gülerce and Abrahamson, 2011). In this article, we developedGMPEs for the vertical component as well as for the horizon-tal component using a dataset of Iran. Bozorgnia and Camp-bell (2016b) explained how the horizontal and verticalGMPEs can be combined to generate a model for V/H ratios,if the user wishes to work with the V/H ratio in practice. Thereader is referred to Bozorgnia and Campbell (2016b, theirequations 5–12) for more discussion. In essence, the V/H ratiois a function of spectral period, source to site distance, andearthquake magnitude (Niazi and Bozorgnia, 1992; Bozorgniaet al., 1995). V/H ratios estimated from the proposed GMPEsfor sites with VS30 of 360 and 760 m=s located at Joyner–Boore distances of 10 and 100 km are shown in Figure 15. Thetwo-thirds value underestimates the V/H ratio in short periods,particularly in near-source regions, whereas the V/H ratio is
1 5 10 50 100 250R
JB (km)
10-4
10-3
10-2
10-1
100
SA (
g)PGA
M 4M 5M 6M 7M 8
1 5 10 50 100 250R
JB (km)
10-4
10-3
10-2
10-1
100
SA (
g)
PSA at T=1.0 s
Figure 8. Comparison of distance scaling characteristics of ourproposed GMPEs for the vertical component of spectral accelera-tions for a reference site with VS30 � 760 m=s. The color version ofthis figure is available only in the electronic edition.
0.05 0.1 1 4
Spectral period (s)
10-4
10-3
10-2
10-1
100
SA (
g)
RJB
= 10 km & VS30
= 360 m/s
0.05 0.1 1 4
Spectral period (s)
10-4
10-3
10-2
10-1
100
SA (
g)
RJB
= 100 km & VS30
= 360 m/s
0.05 0.1 1 4
Spectral period (s)
10-4
10-3
10-2
10-1
100
SA (
g)
RJB
= 10 km & VS30
= 760 m/s
0.05 0.1 1 4
Spectral period (s)
10-4
10-3
10-2
10-1
100
SA (
g)
RJB
= 100 km & VS30
= 760 m/s
M 5 M 6 M 7
Figure 9. Variation of median estimates of response spectra ver-sus spectral period for the horizontal component of spectral accel-erations for sites with VS30 of 360 and 760 m=s at distances of 10and 100 km. The color version of this figure is available only in theelectronic edition.
0.05 0.1 1 4
Spectral period (s)
10-4
10-3
10-2
10-1
100
SA (
g)
RJB
= 10 km & VS30
= 360 m/s
0.05 0.1 1 4
Spectral period (s)
10-4
10-3
10-2
10-1
100
SA (
g)
RJB
= 100 km & VS30
= 360 m/s
0.05 0.1 1 4
Spectral period (s)
10-4
10-3
10-2
10-1
100
SA (
g)
RJB
= 10 km & VS30
= 760 m/s
0.05 0.1 1 4
Spectral period (s)
10-4
10-3
10-2
10-1
100
SA (
g)
RJB
= 100 km & VS30
= 760 m/s
M 5 M 6 M 7
Figure 10. Variation of median estimates of response spectraversus spectral period for the vertical component of spectral accel-erations for sites with VS30 of 360 and 760 m=s at distances of 10and 100 km. The color version of this figure is available only in theelectronic edition.
Partially Nonergodic Empirical Ground-Motion Models 943
less than two-thirds at longer periods. It can be observed thatas the Joyner–Boore distance gets shorter, the V/H spectralratio increases. V/H ratios are high (near 1) at short periodsand have peaks at 0.1 s for distances of 100 km, indicatingthe effects of the soil sites in which the horizontal motion isreduced at short periods (Bozorgnia and Campbell, 2016b),whereas the effects of soil sites on the vertical component isnegligible. In the middle spectral period range, the V/H ratiois dropped, showing the stronger effect of the anelastic at-tenuation on the vertical motion.
Summary and Conclusions
Increasing interest in performing region-specific andsite-specific PSHA motivated us to develop new horizontal
GMPEs using a dataset from the Iranian strong ground mo-tion database. Moreover, there are some limitations of V/Hmodels discussed by Stewart et al. (2016). The last GMPEsfor the vertical motions of Iranian records were developedover a decade ago in 2005. Therefore, in addition to derivinghorizontal GMPEs, we directly developed vertical GMPEs,having a similar functional form to the horizontal direction,based on the vertical recorded strong ground motions. In thisregard, we used a compiled dataset, which consists of 688three-component accelerograms from 152 earthquakes. OurGMPEs are applicable to estimate horizontal and verticalground-motion components of PGV (cm=s), PGA (g), andPSA (g) at spectral periods of 0.050–4.0 s. GMPEs weredeveloped for active shallow crustal earthquakes within theIranian plateau with moment magnitudes ranging from 4.7 to7.4 and Joyner–Boore distances up to 250 km. For magni-tudes outside this magnitude range and for regions outside ofthe Iranian plateau, usage should be handled with cautionand checked for compatibility. The developed GMPEs canbe utilized for sites with VS30 in the 300–1000 m=s range.Although the range of VS30 of stations used in the datasetvaries from 155 to 1564 m=s, most of the stations haveVS30 ranging from 300 to 1000 m=s.
The results obtained from this study are as follows:
• Eliminating the fault type term from the functionalform reduced the total aleatory standard deviationby 10%.
• Site-to-site variability (see Ⓔ Tables S7 and S8) is animportant part of the total aleatory standard deviation.Removing this component from the total standarddeviation and modeling it into the site-specific adjust-ment can significantly reduce the aleatory uncertainty.
• The apparent anelastic attenuation rate is faster for thevertical direction compared to the horizontal direction.
1 5 10 50 100 250R
JB (km)
10-4
10-3
10-2
10-1
100SA
(g)
Vertical - T = 0.5 s
M 5 - AlborzM 7 - AlborzM 5 - ZagrosM 7 - ZagrosM 5 - OthersM 7 - OthersM 5 - Fixed-effectsM 7 - Fixed-effects
Figure 11. Effects of considering regional differences on themedian prediction for the vertical component at T � 0:5 s. Thecolor version of this figure is available only in the electronic edition.
0.05 0.1 1 4
Spectral period (s)
10-4
10-3
10-2
10-1
100
SA (
g)
RJB
= 10 km & VS30
= 760 m/s
M 5 - Alborz M 7 - Alborz M 5 - Zagros M 7 - Zagros M 5 - Others M 7 - Others M 5 - Fixed-effects M 7 - Fixed-effects
0.05 0.1 1 4
Spectral period (s)
10-4
10-3
10-2
10-1
100
SA (
g)
RJB
= 200 km & VS30
= 760 m/s
Figure 12. Effects of considering regional differences on response spectra for the horizontal component. The color version of this figureis available only in the electronic edition.
944 F. Sedaghati and S. Pezeshk

4.5 5 5.5 6 6.5 7 7.5-1
0
1
MB
etw
een-
even
t res
idua
l
PGA
Residuals
µ ± 95% conf. int.
500 1000 1500-1
0
1
VS30
Site
-to-
site
res
idua
l
PGA
0 50 100 150 200 250-2
0
2
RJB
(km)Eve
nt-s
ite c
orre
cted
res
idua
l
PGA
M 4 M 5 M 6 M 7
4.5 5 5.5 6 6.5 7 7.5-1
0
1
M
Bet
wee
n-ev
ent r
esid
ual
T = 1 s
500 1000 1500-1
0
1
VS30
Site
-to-
site
res
idua
l
T = 1 s
0 50 100 150 200 250-2
0
2
RJB
(km)Eve
nt-s
ite c
orre
cted
res
idua
l
T = 1 s
Figure 13. Distribution of between-event, site-to-site, and event-site corrected residuals (in natural logarithm units) for horizontalground-motion components of PGA and PSA at spectral period 1.0 s. Error bars represent the mean and �95% confidence interval ofthe mean binned residuals. The color version of this figure is available only in the electronic edition.
4.5 5 5.5 6 6.5 7 7.5-1
0
1
M
Bet
wee
n-ev
ent r
esid
ual
PGA
Residuals
µ ± 95% conf. int.
500 1000 1500-1
0
1
VS30
Site
-to-
site
res
idua
l
PGA
0 50 100 150 200 250-2
0
2
RJB
(km)Eve
nt-s
ite c
orre
cted
res
idua
l
PGA
M 4 M 5 M 6 M 7
4.5 5 5.5 6 6.5 7 7.5-1
0
1
M
Bet
wee
n-ev
ent r
esid
ual
T = 1 s
500 1000 1500-1
0
1
VS30
Site
-to-
site
res
idua
l
T = 1 s
0 50 100 150 200 250-2
0
2
RJB
(km)Eve
nt-s
ite c
orre
cted
res
idua
l
T = 1 s
Figure 14. Distribution of between-event, site-to-site, and event-site corrected residuals (in natural logarithm units) for vertical ground-motion components of PGA and PSA at spectral period 1.0 s. Error bars represent the mean and �95% confidence interval of the meanbinned residuals. The color version of this figure is available only in the electronic edition.
Partially Nonergodic Empirical Ground-Motion Models 945
• Site effects are negligible for the vertical direction, whilehaving a significant effect for the horizontal direction.
• The predominant period increases with increasing mag-nitude on the horizontal direction, but it is fairly con-stant on the vertical direction.
• We observed regional variations only in the anelasticattenuation term, not in the site-response term.Allowing regional variations as random-effects coef-ficients inside the functional form affects long distan-ces predictions, resulting in reduction of the totalstandard deviation.
• The analysis of residuals revealed that no trends wereapparent and that the proposed GMPEs are generallyunbiased with respect to the estimator parameters.
Data and Resources
Strong ground motion records used in this study were pro-vided by the Building and Housing Research Center (BHRC)of Iran (www.bhrc.ac.ir, last accessed September 2016).
Acknowledgments
The authors are grateful to John Douglas, Thomas Pratt, SreeramReddy Kotha, Mehdi Zare, and an anonymous reviewer whose thoughtfulcomments and constructive suggestions significantly improved the article.We would also like to thank Yi-Hau Chen and Chu-Chuan Peter Tsai forproviding us with their database and MATLAB codes.
References
Abrahamson, N. A., and R. R. Youngs (1992). A stable algorithm for re-gression analysis using the random effects model, Bull. Seismol.Soc. Am. 82, 505–510.
Aki, K. (1980). Attenuation of shear-waves in the lithosphere for frequenciesfrom 0.05 to 25 Hz, Phys. Earth Planet. In. 21, 50–60.
Akkar, S., and J. J. Bommer (2006). Influence of long-period filter cut-offon elastic spectral displacements, Earthq. Eng. Struct. Dynam. 35,1145–1165.
Akkar, S., and J. J. Bommer (2007). Empirical prediction equations for peakground velocity derived from strong-motions records from Europe andthe Middle East, Bull. Seismol. Soc. Am. 97, 511–530.
Al Atik, L., N. Abrahamson, J. J. Bommer, F. Scherbaum, F. Cotton, and N.Kuehn (2010). The variability of ground motion prediction models andits components, Seismol. Res. Lett. 81, 794–801.
Ambraseys, N. N., and J. Douglas (2003). Near-field horizontal and verticalearthquake ground motions, Soil Dynam. Earthq. Eng. 23, no. 1, 1–18.
Anderson, J. G., and J. N. Brune (1999). Probabilistic seismic hazard assess-ment without the ergodic assumption, Seismol. Res. Lett. 70, 19–28.
Anderson, J. G., and S. E. Hough (1984). A model for the shape of theFourier amplitude spectrum of acceleration at high frequencies, Bull.Seismol. Soc. Am. 74, 1969–1993.
Ansari, A., and K. Amini Hosseini (2014). Broadband seismic network ofIran and increasing quality of seismic recordings, Seismol. Res. Lett.85, 878–888.
Atkinson, G. M. (2004). Empirical attenuation of ground motion spectralamplitudes in southeastern Canada and the northwestern United States,Bull. Seismol. Soc. Am. 94, 1079–1095.
Atkinson, G. M. (2006). Single-station sigma, Bull. Seismol. Soc. Am. 96,446–455.
Atkinson, G. M., and D. M. Boore (2014). The attenuation of Fourieramplitudes for rock sites in eastern North America, Bull. Seismol.Soc. Am. 104, 513–528.
0.05 0.1 1 4
Spectral period (s)
0
0.2
0.4
0.6
0.8
1
V/H
RJB
= 10 km & VS30
= 360 m/s
0.05 0.1 1 4
Spectral period (s)
0
0.2
0.4
0.6
0.8
1
V/H
RJB
= 100 km & VS30
= 360 m/s
0.05 0.1 1 4
Spectral period (s)
0
0.2
0.4
0.6
0.8
1
V/H
RJB
= 10 km & VS30
= 760 m/s
0.05 0.1 1 4
Spectral period (s)
0
0.2
0.4
0.6
0.8
1
V/H
RJB
= 100 km & VS30
= 760 m/s
M 5 M 6 M 7
Figure 15. Vertical-to-horizontal (V/H) ratios dependency on moment magnitude (M), distance (RJB), and VS30. The color version of thisfigure is available only in the electronic edition.
946 F. Sedaghati and S. Pezeshk

Berberian, M., and A. Mohajer Ashjai (1977). Seismic risk map of Iran, aproposal, Geol. Surv. Iran 41, 121–148.
Berberian, M., and R. S. Yeats (1999). Patterns of historical earthquakerupture in the Iranian plateau, Bull. Seismol. Soc. Am. 89, 120–139.
Bindi, D., M. Massa, L. Luzi, G. Ameri, F. Pacor, R. Puglia, and P. Augliera(2014). Pan-European ground-motion prediction equations for theaverage horizontal component of PGA, PGV, and 5%-damped PSA atspectral periods up to 3.0 s using the RESORCE dataset, Bull. Earthq.Eng. 12, 391–430.
Bindi, D., F. Pacor, L. Luzi, R. Puglia, M. Massa, G. Ameri, and R. Paolucci(2011). Ground motion prediction equations derived from the Italianstrong motion database, Bull. Earthq. Eng. 9, 1899–1920.
Bommer, J. J., S. Akkar, and O. Kale (2011). A model for vertical-to-horizontal response spectral ratios for Europe and the Middle East,Bull. Seismol. Soc. Am. 101, 1783–1806.
Boore, D. M., and J. J. Bommer (2005). Processing of strong-motion accel-erograms: Needs, options and consequences, Soil Dynam. Earthq.Eng. 25, 93–115.
Boore, D. M., J. P. Stewart, E. Seyhan, and G. M. Atkinson (2014).NGA-West2 equations for predicting PGA, PGV, and 5% dampedPSA for shallow crustal earthquakes, Earthq. Spectra 30, 1057–1085.
Boore, D. M., J. Watson-Lamprey, and N. A. Abrahamson (2006). Orienta-tion-independent measures of ground motion, Bull. Seismol. Soc. Am.96, 1502–1511.
Bozorgnia, Y., and K. W. Campbell (2004). Engineering characterization ofground motion, in Earthquake Engineering: From Engineering Seis-mology to Performance-Based Engineering, Y. Bozorgnia and V. V.Bertero (Editors), CRC Press, Boca Raton, Florida, 215–315.
Bozorgnia, Y., and K. W. Campbell (2016a). Vertical ground motion modelusing NGA-West2 database, Earthq. Spectra 32, 979–1004.
Bozorgnia, Y., and K. W. Campbell (2016b). Vertical-to-horizontal (V/H)ground motion model, Earthq. Spectra 32, 951–978.
Bozorgnia, Y., M. Niazi, and K. W. Campbell (1995). Characteristics of free-field vertical ground motion during the Northridge earthquake, Earthq.Spectra 11, 515–525.
Chen, Y.-H., and C.-C. P. Tsai (2002). A new method for estimation of theattenuation relationship with variance components, Bull. Seismol. Soc.Am. 92, 1984–1991.
Douglas, J. (2004a). Use of analysis of variance for the investigation ofregional dependence of strong ground motions, 13th World Conf.on Earthquake Engineering, Vancouver, Canada, Paper No. 29.
Douglas, J. (2004b). An investigation of analysis of variance as a tool forexploring regional differences in strong ground motions, J. Seismol. 8,485–496.
Douglas, J., and D. M. Boore (2011). High-frequency filtering of strong-motion records, Bull. Earthq. Eng. 9, 395–409.
Elnashai, A., and A. Papazoglou (1997). Procedure and spectra for analysisof RC structures subjected to strong vertical earthquake loads, J.Earthq. Eng. 1, 121–155.
Ghasemi, H., M. Zare, and Y. Fukushima (2008). Ranking of several ground-motion models for seismic hazard analysis in Iran, J. Geophys. Eng. 5,301–310.
Ghasemi, H., M. Zare, Y. Fukushima, and K. Koketsu (2009). An empiricalspectral ground motion model for Iran, J. Seismol. 13, 499–515.
Ghodrati Amiri, G., M. Khorasani, M. Mirza Hessabi, and S. A. RazavianAmrei (2010). Ground motion prediction equations of spectral ordi-nates and Arias intensity for Iran, J. Earthq. Eng. 14, 1–29.
Ghodrati Amiri, G., A. Mahdavian, and F. M. Dana (2007). Attenuationrelationships for Iran, J. Earthq. Eng. 11, 469–492.
Gülerce, Z., and N. A. Abrahamson (2011). Site-specific spectra for verticalground motion, Earthq. Spectra 27, 1023–1047.
Hamzehloo, H., and M. Mahood (2012). Ground motion attenuationrelationship for east central Iran, Bull. Seismol. Soc. Am. 102,2677–2684.
Kaklamanos, J., and L. G. Baise (2011). Model validations and comparisonsof the Next Generation Attenuation of Ground Motions (NGA-West)Project, Bull. Seismol. Soc. Am. 101, 160–175.
Kale, O., S. Akkar, A. Ansari, and H. Hamzehloo (2015). A ground-motionpredictive model for Iran and Turkey for horizontal PGA, PGV, and5% damped response spectrum: Investigation of possible regionaleffects, Bull. Seismol. Soc. Am. 105, 963–980.
Kotha, S. R., D. Bindi, and F. Cotton (2016). Partially non-ergodic regionspecific GMPE for Europe and Middle-East, Bull. Earthq. Eng. 14,1245–1263.
Kotha, S. R., D. Bindi, and F. Cotton (2017). Towards a non-ergodic prob-abilistic seismic hazard assessment in Europe and Middle East, 16thWorld Conf. on Earthquake Engineering (16WCEE), Santiago, Chile,9–13 January 2017.
Kramer, S. L. (1996). Geotechnical Earthquake Engineering, Prentice-Hall,Inc., Upper Saddle River, New Jersey.
Lermo, J., and F. Chavez-Garcia (1993). Site effect evaluation usingspectral ratios with only one station, Bull. Seismol. Soc. Am. 83,1574–1594.
Lindstrom, M. J., and D. M. Bates (1990). Nonlinear mixed effects modelsfor repeated measures data, Biometrics 46, 673–687.
MathWorks Inc. (2015). MATLAB and Statistics and Machine LearningToolbox, The MathWorks Inc., Natick, Massachusetts.
Mousavi, M., A. Ansari, H. Zafarani, and A. Azarbakht (2012). Selection ofground motion prediction models for seismic hazard analyses inZagros region, Iran, J. Earthq. Eng. 16, 1184–1207.
Niazi, M., and Y. Bozorgnia (1991). Behavior of near-source peak horizontaland vertical ground motions over SMART-1 array, Taiwan, Bull.Seismol. Soc. Am. 81, 715–732.
Niazi, M., and Y. Bozorgnia (1992). Behaviour of near-source vertical andhorizontal response spectra at smart-1 array, Taiwan, Earthq. Eng.Struct. Dynam. 21, 37–50.
Nowroozi, A. A. (2005). Attenuation relations for peak horizontal and ver-tical accelerations of earthquake ground motion in Iran: A preliminaryanalysis, J. Seismol. Earthq. Eng. 7, 109–128.
Rezaeian, S., M. D. Petersen, and M. P. Moschetti (2015). Ground motionmodels used in the 2014 U.S. national seismic hazard maps, Earthq.Spectra 31, S59–S84.
Rodriguez-Marek, A., E. M. Rathje, J. J. Bommer, F. Scherbaum, and P. J.Stafford (2014). Application of single-station sigma and site-responsecharacterization in a probabilistic seismic-hazard analysis for a newnuclear site, Bull. Seismol. Soc. Am. 104, 1601–1619.
Sadeghi, H., A. Shooshtari, and M. Jaladat (2010). Prediction of horizontalresponse spectra of strong ground motions in Iran and its regions, Proc.of the 9th U.S. National and 10th Canadian Conf. on EarthquakeEngineering: Reaching Beyond Borders, Toronto, Canada, 25–29 July,Paper Number 861.
Saffari, H., Y. Kuwata, S. Takada, and A. Mahdavian (2012). Updated PGA,PGV, and spectral acceleration attenuation relations for Iran, Earthq.Spectra 28, 257–276.
Scherbaum, F., F. Cotton, and P. Smit (2004). On the use of response spectralreference data for the selection and ranking of ground-motion modelsfor seismic hazard analysis in regions of moderate seismicity: The caseof rock motion, Bull. Seismol. Soc. Am. 94, 1–22.
Scherbaum, F., E. Delavaud, and C. Riggelsen (2009). Model selection inseismic hazard analysis: An information theoretic perspective, Bull.Seismol. Soc. Am. 99, 3234–3247.
Sedaghati, F., and S. Pezeshk (2016a). Investigation of regional differencesin strong ground motions for the Iranian plateau, World Acad. Sci.Eng. Tech., Int. J. Environ. Chem. Ecol. Geol. Geophys. Eng. 10,no. 6, 591–594.
Sedaghati, F., and S. Pezeshk (2016b). Comparative study on parameterestimation methods for attenuation relationships, J. Geophys. Eng.13, no. 6, 912–927.
Sedaghati, F., and S. Pezeshk (2016c). Estimation of the coda-wave attenu-ation and geometrical spreading in the NewMadrid seismic zone, Bull.Seismol. Soc. Am. 106, no. 4, 1482–1498.
Sella, G. F., H. T. Dixon, and A. Mao (2002). REVEL: A model forrecent plate velocities from space geodesy, J. Geophys. Res. 107,11–30.
Partially Nonergodic Empirical Ground-Motion Models 947

Soghrat, M. R., and M. Ziyaeifar (2016). Ground motion prediction equa-tions for horizontal and vertical components of acceleration in northernIran, J. Seismol. 1, 1–27, doi: 10.1007/s10950-016-9586-4.
Stafford, P. J. (2014). Crossed and nested mixed-effects approaches forenhanced model development and removal of the ergodic assumption inempirical ground-motion models, Bull. Seismol. Soc. Am. 104, 702–719.
Stewart, J. P., D. M. Boore, E. Seyhan, and G. M. Atkinson (2016). NGA-West2 equations for predicting vertical-component PGA, PGV, and5%-damped PSA from shallow crustal earthquakes, Earthq. Spectra32, 1005–1031.
Tavakoli, B., and M. Ghafory-Ashtiany (1999). Seismic hazard assessmentof Iran, Ann. Geophys. 42, 1013–1021.
Tavakoli, B., and S. Pezeshk (2005). Empirical-stochastic ground-motionprediction for eastern North America, Bull. Seismol. Soc. Am. 95,2283–2296.
Zafarani, H., and M. Mousavi (2014). Applicability of different ground-mo-tion prediction models for northern Iran, Nat. Hazards 73, 1199–1228.
Zandieh, A., and S. Pezeshk (2011). A study of horizontal-to-vertical com-ponent spectral ratio in the New Madrid seismic zone, Bull. Seismol.Soc. Am. 101, 287–296.
Zare, M., and S. Sabzali (2006). Spectral attenuation of strong motions in Iran,Proc. of Third International Symposium on the Effects of Surface Geol-ogy on Seismic Motion, Grenoble, France, 30 August–1 September.
Department of Civil EngineeringThe University of Memphis3815 Central AvenueMemphis, Tennessee [email protected]@memphis.edu
Manuscript received 27 June 2016;Published Online 7 February 2017
948 F. Sedaghati and S. Pezeshk