PART IId18rn0p25nwr6d.cloudfront.net/CIK-0001024478/67b...Rockwell Automation, Inc. (“Rockwell...
101
Table of Contents UNITED STATES SECURITIES AND EXCHANGE COMMISSION Washington, D.C. 20549 ____________ Form 10-K ANNUAL REPORT PURSUANT TO SECTION 13 OR 15(d) OF THE SECURITIES EXCHANGE ACT OF 1934 For the fiscal year ended September 30, 2018 Commission file number 1-12383 Rockwell Automation, Inc. (Exact name of registrant as specified in its charter) Delaware 25-1797617 (State or other jurisdiction of (I.R.S. Employer incorporation or organization) Identification No.) 1201 South 2 nd Street Milwaukee, Wisconsin 53204 (Address of principal executive offices) (Zip Code) Registrant’s telephone number, including area code: +1 (414) 382-2000 Securities registered pursuant to Section 12(b) of the Act : Title of each class Name of each exchange on which registered Common Stock, $1 Par Value New York Stock Exchange Securities registered pursuant to Section 12(g) of the Act: None Indicate by check mark if the registrant is a well-known seasoned issuer, as defined in Rule 405 of the Securities Act. Yes ☑ No ☐ Indicate by check mark if the registrant is not required to file reports pursuant to Section 13 or Section 15(d) of the Act. Yes ☐ No ☑ Indicate by check mark whether the registrant (1) has filed all reports required to be filed by Section 13 or 15(d) of the Securities Exchange Act of 1934 during the preceding 12 months (or for such shorter period that the registrant was required to file such reports), and (2) has been subject to such filing requirements for the past 90 days. Yes ☑ No ☐ Indicate by check mark whether the registrant has submitted electronically every Interactive Data File required to be submitted pursuant to Rule 405 of Regulation S-T during the preceding 12 months (or for such shorter period that the registrant was required to submit such files). Yes ☑ No ☐ Indicate by check mark if disclosure of delinquent filers pursuant to Item 405 of Regulation S-K is not contained herein, and will not be contained, to the best of registrant’s knowledge, in definitive proxy or information statements incorporated by reference in Part III of this Form 10-K or any amendment to this Form 10-K. ☐ Indicate by check mark whether the registrant is a large accelerated filer, an accelerated filer, a non-accelerated filer, smaller reporting company, or an emerging growth company. See definitions of “large accelerated filer,” “accelerated filer,” “smaller reporting company,” and “emerging growth company” in Rule 12b-2 of the Exchange Act. (Check one): Large Accelerated Filer ☑ Accelerated Filer ☐ Non-accelerated Filer ☐ Smaller Reporting Company ☐ Emerging Growth Company ☐ If an emerging growth company, indicate by check mark if the registrant has elected not to use the extended transition period for complying with any new or revised financial accounting standards provided pursuant to Section 13(a) of the Exchange Act. ☐ Indicate by check mark whether the registrant is a shell company (as defined in Rule 12b-2 of the Act). Yes ☐ No ☑ The aggregate market value of registrant’s voting stock held by non-affiliates of registrant on March 29, 2018 was approximately $21.7 billion . 120,684,079 shares of registrant’s Common Stock, par value $1 per share, were outstanding on October 31, 2018 . DOCUMENTS INCORPORATED BY REFERENCE Certain information contained in the Proxy Statement for the Annual Meeting of Shareowners of registrant to be held on February 5, 2019 is incorporated by reference into Part III hereof.
Transcript of PART IId18rn0p25nwr6d.cloudfront.net/CIK-0001024478/67b...Rockwell Automation, Inc. (“Rockwell...
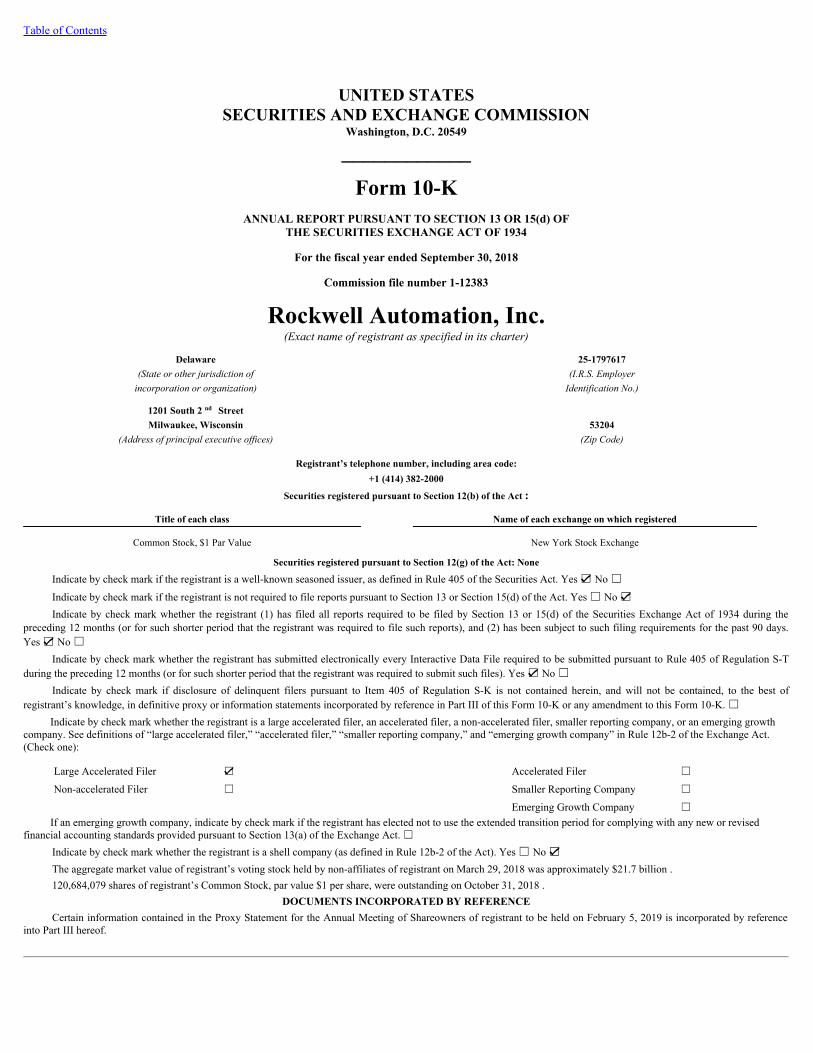
Table of Contents
UNITED STATESSECURITIES AND EXCHANGE COMMISSION
Washington, D.C. 20549
____________
Form 10-KANNUAL REPORT PURSUANT TO SECTION 13 OR 15(d) OF
THE SECURITIES EXCHANGE ACT OF 1934
For the fiscal year ended September 30, 2018
Commission file number 1-12383
Rockwell Automation, Inc.(Exactnameofregistrantasspecifiedinitscharter)
Delaware 25-1797617(Stateorotherjurisdictionof (I.R.S.Employerincorporationororganization) IdentificationNo.)
1201 South 2 nd Street Milwaukee, Wisconsin 53204
(Addressofprincipalexecutiveoffices) (ZipCode)
Registrant’s telephone number, including area code:+1 (414) 382-2000
Securities registered pursuant to Section 12(b) of the Act :
Title of each class Name of each exchange on which registered
Common Stock, $1 Par Value New York Stock Exchange
Securities registered pursuant to Section 12(g) of the Act: None
Indicate by check mark if the registrant is a well-known seasoned issuer, as defined in Rule 405 of the Securities Act. Yes ☑ No ☐
Indicate by check mark if the registrant is not required to file reports pursuant to Section 13 or Section 15(d) of the Act. Yes ☐ No ☑Indicate by check mark whether the registrant (1) has filed all reports required to be filed by Section 13 or 15(d) of the Securities Exchange Act of 1934 during the
preceding 12 months (or for such shorter period that the registrant was required to file such reports), and (2) has been subject to such filing requirements for the past 90 days.Yes ☑ No ☐
Indicate by check mark whether the registrant has submitted electronically every Interactive Data File required to be submitted pursuant to Rule 405 of Regulation S-Tduring the preceding 12 months (or for such shorter period that the registrant was required to submit such files). Yes ☑ No ☐
Indicate by check mark if disclosure of delinquent filers pursuant to Item 405 of Regulation S-K is not contained herein, and will not be contained, to the best ofregistrant’s knowledge, in definitive proxy or information statements incorporated by reference in Part III of this Form 10-K or any amendment to this Form 10-K. ☐
Indicate by check mark whether the registrant is a large accelerated filer, an accelerated filer, a non-accelerated filer, smaller reporting company, or an emerging growthcompany. See definitions of “large accelerated filer,” “accelerated filer,” “smaller reporting company,” and “emerging growth company” in Rule 12b-2 of the Exchange Act.(Check one):
Large Accelerated Filer ☑ Accelerated Filer ☐ Non-accelerated Filer ☐ Smaller Reporting Company ☐ Emerging Growth Company ☐
If an emerging growth company, indicate by check mark if the registrant has elected not to use the extended transition period for complying with any new or revisedfinancial accounting standards provided pursuant to Section 13(a) of the Exchange Act. ☐
Indicate by check mark whether the registrant is a shell company (as defined in Rule 12b-2 of the Act). Yes ☐ No ☑The aggregate market value of registrant’s voting stock held by non-affiliates of registrant on March 29, 2018 was approximately $21.7 billion .120,684,079 shares of registrant’s Common Stock, par value $1 per share, were outstanding on October 31, 2018 .
DOCUMENTS INCORPORATED BY REFERENCECertain information contained in the Proxy Statement for the Annual Meeting of Shareowners of registrant to be held on February 5, 2019 is incorporated by reference
into Part III hereof.
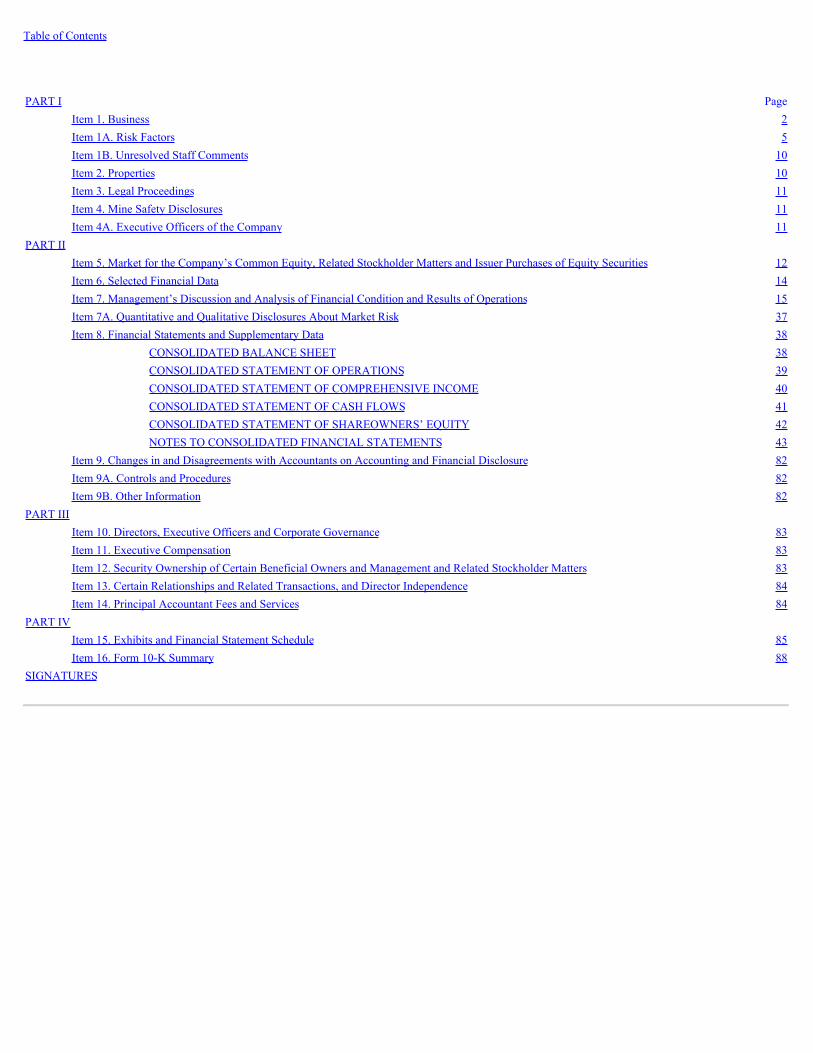
Table of Contents
PART I Page Item 1. Business 2 Item 1A. Risk Factors 5 Item 1B. Unresolved Staff Comments 10 Item 2. Properties 10 Item 3. Legal Proceedings 11 Item 4. Mine Safety Disclosures 11 Item 4A. Executive Officers of the Company 11PART II Item 5. Market for the Company’s Common Equity, Related Stockholder Matters and Issuer Purchases of Equity Securities 12 Item 6. Selected Financial Data 14 Item 7. Management’s Discussion and Analysis of Financial Condition and Results of Operations 15 Item 7A. Quantitative and Qualitative Disclosures About Market Risk 37 Item 8. Financial Statements and Supplementary Data 38 CONSOLIDATED BALANCE SHEET 38 CONSOLIDATED STATEMENT OF OPERATIONS 39 CONSOLIDATED STATEMENT OF COMPREHENSIVE INCOME 40 CONSOLIDATED STATEMENT OF CASH FLOWS 41 CONSOLIDATED STATEMENT OF SHAREOWNERS’ EQUITY 42 NOTES TO CONSOLIDATED FINANCIAL STATEMENTS 43 Item 9. Changes in and Disagreements with Accountants on Accounting and Financial Disclosure 82 Item 9A. Controls and Procedures 82 Item 9B. Other Information 82PART III Item 10. Directors, Executive Officers and Corporate Governance 83 Item 11. Executive Compensation 83 Item 12. Security Ownership of Certain Beneficial Owners and Management and Related Stockholder Matters 83 Item 13. Certain Relationships and Related Transactions, and Director Independence 84 Item 14. Principal Accountant Fees and Services 84PART IV Item 15. Exhibits and Financial Statement Schedule 85 Item 16. Form 10-K Summary 88SIGNATURES
Table of Contents
PART I
FORWARD-LOOKING STATEMENTS
This Annual Report contains statements (including certain projections and business trends) that are “forward-looking statements” as defined in the PrivateSecurities Litigation Reform Act of 1995. Words such as “believe”, “estimate”, “project”, “plan”, “expect”, “anticipate”, “will”, “intend” and other similarexpressions may identify forward-looking statements. Actual results may differ materially from those projected as a result of certain risks and uncertainties, manyof which are beyond our control, including but not limited to:
• macroeconomicfactors,includingglobalandregionalbusinessconditions,theavailabilityandcostofcapital,commodityprices,thecyclicalnatureofourcustomers’capitalspending,sovereigndebtconcernsandcurrencyexchangerates;
• laws,regulationsandgovernmentalpoliciesaffectingouractivitiesinthecountrieswherewedobusiness,includingthoserelatedtotariffs,taxation,andtradecontrols;
• thesuccessfuldevelopmentofadvancedtechnologiesanddemandforandmarketacceptanceofnewandexistinghardwareandsoftwareproducts;• theavailabilityandpriceofcomponentsandmaterials;• thesuccessfulexecutionofourcostproductivityinitiatives;• theavailability,effectivenessandsecurityofourinformationtechnologysystems;• competitivehardwareandsoftwareproducts,solutionsandservicesandpricingpressures,andourabilitytoprovidehighqualityproducts,solutionsand
services;• disruptionstoourdistributionchannelsorthefailureofdistributorstodevelopandmaintaincapabilitiestosellourproducts;• adisruptionofourbusinessduetonaturaldisasters,pandemics,actsofwar,strikes,terrorism,socialunrestorothercauses;• ourabilitytomanageandmitigatetheriskrelatedtosecurityvulnerabilitiesandbreachesofourproducts,solutionsandservices;• intellectualpropertyinfringementclaimsbyothersandtheabilitytoprotectourintellectualproperty;• theuncertaintyofclaimsbytaxingauthoritiesinthevariousjurisdictionswherewedobusiness;• ourabilitytoattract,develop,andretainqualifiedpersonnel;• theuncertaintiesoflitigation,includingliabilitiesrelatedtothesafetyandsecurityofthehardwareandsoftwareproducts,solutionsandserviceswesell;• ourabilitytomanageandmitigatetherisksassociatedwithoursolutionsandservicesbusinesses;• thesuccessfulintegrationandmanagementofacquiredbusinessesandtechnologies;• risksassociatedwithourinvestmentincommonstockofPTCInc.,includingthepotentialforvolatilityinourreportedquarterlyearningsassociatedwith
changesinthemarketvalueofsuchstock;• ourabilitytomanagecostsrelatedtoemployeeretirementandhealthcarebenefits;and• otherrisksanduncertainties,includingbutnotlimitedtothosedetailedfromtimetotimeinourSecuritiesandExchangeCommission(SEC)filings.
These forward-looking statements reflect our beliefs as of the date of filing this report. We undertake no obligation to update or revise any forward-lookingstatement, whether as a result of new information, future events or otherwise. See Item 1A. Risk Factors for more information.
Item 1. Business
General
Rockwell Automation, Inc. (“Rockwell Automation” or the “Company”), a leader in industrial automation and information, makes its customers more productiveand the world more sustainable . Our hardware and software products, solutions and services are designed to meet our customers’ needs to reduce total cost ofownership, maximize asset utilization, improve time to market and reduce enterprise business risk.
The Company continues the business founded as the Allen-Bradley Company in 1903. The privately-owned Allen-Bradley Company was a leading NorthAmerican manufacturer of industrial automation equipment when the former Rockwell International Corporation (RIC) purchased it in 1985.
The Company was incorporated in Delaware in connection with a tax-free reorganization completed on December 6, 1996, pursuant to which we divested ourformer aerospace and defense businesses (the A&D Business) to The Boeing Company (Boeing). In the
2
Table of Contents
reorganization, RIC contributed all of its businesses, other than the A&D Business, to the Company and distributed all capital stock of the Company to RIC’sshareowners. Boeing then acquired RIC.
As used herein, the terms “we”, “us”, “our”, “Rockwell Automation” or the “Company” include subsidiaries and predecessors unless the context indicatesotherwise. Information included in this Annual Report on Form 10-K refers to our continuing businesses unless otherwise indicated.
Whenever an Item of this Annual Report on Form 10-K refers to information in our Proxy Statement for our Annual Meeting of Shareowners to be held onFebruary 5, 2019 (the Proxy Statement), or to information under specific captions in Item 7. Management’s Discussion and Analysis of Financial Condition andResults of Operations (MD&A), or in Item 8. Financial Statements and Supplementary Data (the Financial Statements), the information is incorporated in thatItem by reference. All date references to years and quarters refer to our fiscal year and quarters unless otherwise stated.
Operating Segments
We have two operating segments: Architecture & Software and Control Products & Solutions. Both operating segments share a common sales organization andsupply chain and conduct business globally. Major markets served by both segments consist of consumer industries, including food and beverage, home andpersonal care and life sciences; transportation, including automotive and tire; and heavy industries, including oil and gas, mining, metals, and chemicals.
Geographic Information
We do business in more than 80 countries around the world. The largest sales outside the United States on a country-of-destination basis are in China, Canada,Mexico, Italy, the United Kingdom, Germany, and Brazil. See Item 1A. Risk Factors for a discussion of risks associated with our global operations.
Competition
Our competitors range from large diversified corporations that may also have business interests outside of industrial automation to smaller companies that offer alimited portfolio of industrial automation products, solutions and services. Factors that influence our competitive position include the breadth of our productportfolio and scope of solutions, technology differentiation, domain expertise, installed base, distribution network, quality of hardware and software products,solutions and services, global presence and price. Major competitors include Siemens AG, ABB Ltd, Schneider Electric SA, Emerson Electric Co., MitsubishiElectric Corp. and Honeywell International Inc.
Distribution
In most countries, we sell primarily through independent distributors in conjunction with our direct sales force. In other countries, we sell through a combination ofour direct sales force and to a lesser extent, through independent distributors. Approximately 75 percent of our global sales are through independent distributors.Sales to our largest distributor in 2018 , 2017 and 2016 were approximately 10 percent of our total sales.
Employees
At September 30, 2018 , we had approximately 23,000 employees. Approximately 8,600 were employed in the United States.
Raw Materials
We purchase a wide range of equipment, components, finished products and materials used in our business. The raw materials essential to the manufacture of ourproducts generally are available at competitive prices. We have a broad base of suppliers and subcontractors. We depend upon the ability of our suppliers andsubcontractors to meet performance and quality specifications and delivery schedules. See Item 1A. Risk Factors for a discussion of risks associated with ourreliance on third party suppliers.
3
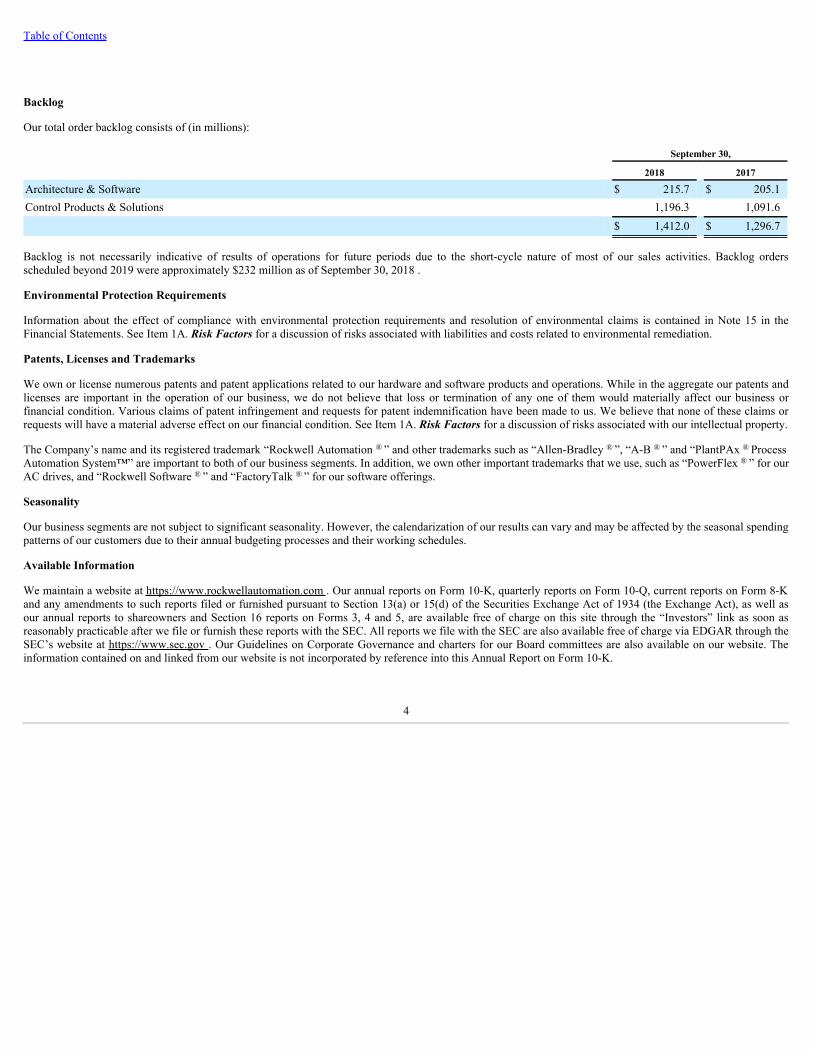
Table of Contents
Backlog
Our total order backlog consists of (in millions):
September 30,
2018 2017
Architecture & Software $ 215.7 $ 205.1Control Products & Solutions 1,196.3 1,091.6
$ 1,412.0 $ 1,296.7
Backlog is not necessarily indicative of results of operations for future periods due to the short-cycle nature of most of our sales activities. Backlog ordersscheduled beyond 2019 were approximately $232 million as of September 30, 2018 .
Environmental Protection Requirements
Information about the effect of compliance with environmental protection requirements and resolution of environmental claims is contained in Note 15 in theFinancial Statements. See Item 1A. Risk Factors for a discussion of risks associated with liabilities and costs related to environmental remediation.
Patents, Licenses and Trademarks
We own or license numerous patents and patent applications related to our hardware and software products and operations. While in the aggregate our patents andlicenses are important in the operation of our business, we do not believe that loss or termination of any one of them would materially affect our business orfinancial condition. Various claims of patent infringement and requests for patent indemnification have been made to us. We believe that none of these claims orrequests will have a material adverse effect on our financial condition. See Item 1A. Risk Factors for a discussion of risks associated with our intellectual property.
The Company’s name and its registered trademark “Rockwell Automation ® ” and other trademarks such as “Allen-Bradley ® ”, “A-B ® ” and “PlantPAx ® ProcessAutomation System™” are important to both of our business segments. In addition, we own other important trademarks that we use, such as “PowerFlex ® ” for ourAC drives, and “Rockwell Software ® ” and “FactoryTalk ® ” for our software offerings.
Seasonality
Our business segments are not subject to significant seasonality. However, the calendarization of our results can vary and may be affected by the seasonal spendingpatterns of our customers due to their annual budgeting processes and their working schedules.
Available Information
We maintain a website at https://www.rockwellautomation.com . Our annual reports on Form 10-K, quarterly reports on Form 10-Q, current reports on Form 8-Kand any amendments to such reports filed or furnished pursuant to Section 13(a) or 15(d) of the Securities Exchange Act of 1934 (the Exchange Act), as well asour annual reports to shareowners and Section 16 reports on Forms 3, 4 and 5, are available free of charge on this site through the “Investors” link as soon asreasonably practicable after we file or furnish these reports with the SEC. All reports we file with the SEC are also available free of charge via EDGAR through theSEC’s website at https://www.sec.gov . Our Guidelines on Corporate Governance and charters for our Board committees are also available on our website. Theinformation contained on and linked from our website is not incorporated by reference into this Annual Report on Form 10-K.
4

Table of Contents
Item 1A. Risk Factors
In the ordinary course of our business, we face various strategic, operating, compliance and financial risks. These risks could have an impact on our business,financial condition, operating results and cash flows. Our most significant risks are set forth below and elsewhere in this Annual Report on Form 10-K.
Our Enterprise Risk Management (ERM) process seeks to identify and address significant risks. Our ERM process assesses, manages, and monitors risks consistentwith the integrated risk framework in InternalControl—IntegratedFramework(2013) issued by the Committee of Sponsoring Organizations of the TreadwayCommission (COSO). We believe that risk-taking is an inherent aspect of the pursuit of our strategy. Our goal is to manage risks prudently rather than avoid risks.We can mitigate risks and their impact on the Company only to a limited extent.
A team of senior executives prioritizes identified risks and assigns an executive to address each major identified risk area and lead action plans to manage risks.Our Board of Directors provides oversight of the ERM process and reviews significant identified risks. The Audit Committee of the Board of Directors alsoreviews significant financial risk exposures and the steps management has taken to monitor and manage them. Our other Board committees also play a role in riskmanagement, as set forth in their respective charters.
Our goal is to proactively manage risks in a structured approach in conjunction with strategic planning, with the intent to preserve and enhance shareowner value.However, the risks set forth below and elsewhere in this Annual Report on Form 10-K and other risks and uncertainties could adversely affect us and cause ourresults to vary materially from recent results or from our anticipated future results.
Adverse changes in business or industry conditions and volatility and disruption of the capital and credit markets may result in decreases in our sales andprofitability.
We are subject to macroeconomic cycles and when recessions occur, we may experience reduced, canceled or delayed orders, payment delays or defaults, supplychain disruptions or other factors as a result of the economic challenges faced by our customers, prospective customers and suppliers.
Demand for our hardware and software products is sensitive to changes in levels of industrial production and the financial performance of major industries that weserve. As economic activity slows, credit markets tighten, or sovereign debt concerns arise, companies tend to reduce their levels of capital spending, which couldresult in decreased demand for our products.
Our ability to access the credit markets and the costs of borrowing are affected by the strength of our credit rating and current market conditions. If our access tocredit, including the commercial paper market, is adversely affected by a change in market conditions or otherwise, our cost of borrowings may increase or ourability to fund operations may be reduced.
We sell to customers around the world and are subject to the risks of doing business in many countries.
We do business in more than 80 countries around the world. Approximately 45 percent of our sales in 2018 were to customers outside the U.S. In addition, many ofour manufacturing operations, suppliers and employees are located in many places around the world. The future success of our business depends in large part ongrowth in our sales in non-U.S. markets. Our global operations are subject to numerous financial, legal and operating risks, such as political and economicinstability; prevalence of corruption in certain countries; enforcement of contract and intellectual property rights; and compliance with existing and future laws,regulations and policies, including those related to exports, imports, tariffs, embargoes and other trade restrictions, investments, taxation, product content andperformance, employment and repatriation of earnings. In addition, we are affected by changes in foreign currency exchange rates, inflation rates and interest rates.The occurrence or consequences of these risks may make it more difficult to operate our business and increase our costs, which could decrease our profitability andhave an adverse effect on our financial condition.
An inability to respond to changes in customer preferences could result in decreased demand for our products.
Our success depends in part on our ability to anticipate and offer hardware and software products that appeal to the changing needs and preferences of ourcustomers in the various markets we serve. Developing new hardware and software products requires high levels of innovation, and the development process isoften lengthy and costly. If we are not able to anticipate, identify, develop and market products that respond to changes in customer preferences and emergingtechnological and broader industry trends, demand for our products could decline.
5
Table of Contents
We rely on suppliers to provide equipment, components and services.
Our business requires that we buy equipment, components and services including finished products, electronic components and commodities. Our reliance onsuppliers involves certain risks, including:
• poor quality or an insecure supply chain, which could adversely affect the reliability and reputation of our hardware and software products;• changes in the cost of these purchases due to inflation, exchange rate fluctuations, taxes, tariffs, embargoes and other trade restrictions, commodity market
volatility or other factors that affect our suppliers;• intellectual property risks such as challenges to ownership of rights or alleged infringement by suppliers; and• shortages of components, commodities or other materials, which could adversely affect our manufacturing efficiencies and ability to make timely delivery of
our products, solutions and services.
Any of these uncertainties could adversely affect our profitability and ability to compete. We also maintain several single-source supplier relationships, becauseeither alternative sources are not available or the relationship is advantageous due to performance, quality, support, delivery, capacity, or price considerations.Unavailability of, or delivery delays for single-source components or products could adversely affect our ability to ship the related products in a timely manner.The effect of unavailability or delivery delays would be more severe if associated with our higher volume and more profitable products. Even where substitutesources of supply are available, qualifying alternative suppliers and establishing reliable supplies could cost more or result in delays and a loss of sales.
Failures or security breaches of our products, connected services, manufacturing environment, supply chain, or information technology systems could havean adverse effect on our business.
We rely heavily on information technology (IT) in our hardware and software products, solutions and services for customers, manufacturing environment, and inour enterprise IT infrastructure. Despite the implementation of security measures, our IT systems are vulnerable to unauthorized access by nation states, hackers,cyber-criminals, malicious insiders, and other actors who may engage in fraud, theft of confidential or proprietary information, or sabotage. These systems couldbe compromised by malware (including ransomware), cyber attacks, and other events, ranging from widespread, non-targeted, global cyber threats to targetedadvanced persistent threats. Given that our hardware and software products and services are used in critical infrastructure, these threats could indicate increasedrisk for our products, services, manufacturing, and IT infrastructure. Recent global cyber attacks have been perpetuated by compromising software updates inwidely-used software products, increasing the risk that vulnerabilities or malicious content could be inserted into our products. In some cases, malware attackswere spread throughout the supply chain, moving from one company to the next via authorized network connections.
Our hardware and software products, solutions, and services are used by our direct and indirect customers in applications that may be subject to information theft,tampering, or sabotage. Careless or malicious actors could cause a customer’s process to be disrupted or could cause equipment to operate in an improper mannerthat could result in harm to people or property. While we continue to improve the security attributes of our hardware and software products, solutions and services,we can reduce risk, not eliminate it. To a significant extent, the security of our customers’ systems depends on how those systems are designed, installed, protected,configured, updated and monitored, much of which are typically outside our control.
Our business uses IT resources on a dispersed, global basis for a wide variety of functions including development, engineering, manufacturing, sales, accounting,and human resources. Our vendors, partners, employees and customers have access to, and share, information across multiple locations via various digitaltechnologies. In addition, we rely on partners and vendors for a wide range of outsourced activities, including cloud providers, are part of our internal ITinfrastructure and our commercial offerings. Secure connectivity is important to these ongoing operations. Also, our partners and vendors frequently have access toour confidential information as well as confidential information about our customers, employees, and others. We design our security architecture to reduce the riskthat a compromise of our partners’ infrastructure, for example a cloud platform, could lead to a compromise of our internal systems or customer networks, but thisrisk cannot be eliminated and vulnerabilities at third parties could result in unknown risk exposure to our business.
The current cyber threat environment indicates increased risk for all companies, including those in industrial automation and information. Like other globalcompanies, we have experienced cyber threats and incidents, although none have been material or had a material adverse effect on our business or financialcondition. Our information security efforts, under the leadership of our Chief Information Security Officer and Chief Product Security Officer, with the support ofthe entire management team, include major programs designed to address security governance, product security, identification and protection of critical assets,insider risk, third-party risk, and cyber defense operations. We believe these measures reduce, but cannot eliminate, the risk of an information
6
Table of Contents
security incident. Any significant security incidents could have an adverse impact on sales, harm our reputation and cause us to incur legal liability and increasedcosts to address such events and related security concerns.
There are inherent risks in our solutions and services businesses.
Risks inherent in the sale of solutions and services include assuming greater responsibility for successfully delivering projects that meet a particular customerspecification, including defining and controlling contract scope, efficiently executing projects, and managing the performance and quality of our subcontractors andsuppliers. If we are unable to manage and mitigate these risks, we could incur cost overruns, liabilities and other losses that would adversely affect our results ofoperations.
New legislative and regulatory actions could adversely affect our business.
Legislative and regulatory action may be taken in the various countries and other jurisdictions where we operate that may affect our business activities in thesecountries or may otherwise increase our costs to do business. For example, we are increasingly required to comply with various environmental and other material,product, certification and labeling laws and regulations. Our customers may also be required to comply with such legislative and regulatory requirements. Theserequirements could increase our costs and could potentially have an adverse effect on our ability to do business in certain jurisdictions. Changes in theserequirements could impact demand for our hardware and software products, solutions and services. Compliance with increasing privacy regulation, such as theEuropean Union's General Data Protection Regulation (GDPR), could increase our operating costs as part of our efforts to protect and safeguard our sensitive dataand personal information. Failure to maintain information privacy could result in legal liability or reputational harm.
Our industry is highly competitive.
We face strong competition in all of our market segments in several significant respects. We compete based on breadth and scope of our hardware and softwareproduct portfolio and solution and service offerings, technology differentiation, the domain expertise of our employees and partners, product performance, qualityof our hardware and software products, solutions and services, knowledge of integrated systems and applications that address our customers’ business challenges,pricing, delivery and customer service. The relative importance of these factors differs across the geographic markets and product areas that we serve and acrossour market segments. We seek to maintain acceptable pricing levels across and within geographic markets by continually developing advanced technologies fornew hardware and software products and product enhancements and offering complete solutions for our customers’ business problems. In addition, we continue todrive productivity to reduce our cost structure. If we fail to achieve our objectives, to keep pace with technological changes, or to provide high quality hardwareand software products, solutions and services, we may lose business or experience price erosion and correspondingly lower sales and margins. We expect the levelof competition to remain high in the future, which could limit our ability to maintain or increase our market share or profitability.
We rely on our distribution channel for a substantial portion of our sales.
In the United States and Canada, a large percentage of our sales are through distributors. In certain other countries, the majority of our sales are also through alimited number of distributors. We depend on the capabilities and competencies of our distributors to sell our hardware and software products and services anddeliver value to our customers. Disruptions to our existing distribution channel or the failure of distributors to maintain and develop the appropriate capabilities tosell our hardware and software products and services could adversely affect our sales. A disruption could result from the sale of a distributor to a competitor,financial instability of a distributor or other events.
We face the potential harms of natural disasters, pandemics, acts of war, terrorism, international conflicts or other disruptions to our operations.
Our business depends on the movement of people and goods around the world. Natural disasters, pandemics, acts or threats of war or terrorism, internationalconflicts, power outages, fires, explosions, equipment failures, sabotage, political instability and the actions taken by governments could cause damage to ordisrupt our business operations, our suppliers or our customers, and could create economic instability. Disruptions to our IT infrastructure from system failures,shutdowns, power outages, telecommunication or utility failures, and other events, including disruptions at third party IT and other service providers, could alsointerfere with or disrupt our operations. Although it is not possible to predict such events or their consequences, these events could decrease demand for ourhardware and software products, solutions or services, increase our costs, or make it difficult or impossible for us to deliver products, solutions or services.
7
Table of Contents
Intellectual property infringement claims of others and the inability to protect our intellectual property rights could harm our business and our customers.
Others may assert intellectual property infringement claims against us or our customers. We frequently provide a limited intellectual property indemnity inconnection with our terms and conditions of sale to our customers and in other types of contracts with third parties. Indemnification payments and legal expenses todefend claims could be costly.
In addition, we own the rights to many patents, trademarks, brand names and trade names that are important to our business. The inability to enforce ourintellectual property rights may have an adverse effect on our results of operations. Expenses related to enforcing our intellectual property rights could besignificant.
Claims from taxing authorities could have an adverse effect on our income tax expense and financial condition.
We conduct business in many countries, which requires us to interpret and comply with the income tax laws and rulings in each of those taxing jurisdictions. Dueto the ambiguity of tax laws among those jurisdictions as well as the uncertainty of how underlying facts may be construed, our estimates of income tax liabilitiesmay differ from actual payments or assessments. We must successfully defend any claims from taxing authorities to avoid an adverse effect on our operatingresults and financial condition.
Our business success depends on attracting, developing, and retaining highly qualified personnel.
Our success depends in part on the efforts and abilities of our management team and key employees. Their skills, experience and industry knowledge significantlybenefit our operations and performance. Difficulty attracting, developing, and retaining members of our management team and key employees, includingemployees with the necessary technological expertise, could have a negative effect on our business, operating results and financial condition.
Potential liabilities and costs from litigation (including asbestos claims and environmental remediation) could reduce our profitability.
Various lawsuits, claims and proceedings have been or may be asserted against us relating to the conduct of our business, including those pertaining to the safetyand security of the hardware and software products, solutions and services we sell, employment, contract matters, and environmental remediation.
We have been named as a defendant in lawsuits alleging personal injury as a result of exposure to asbestos that was used in certain of our products many years ago.Our products may also be used in hazardous industrial activities, which could result in product liability claims. The uncertainties of litigation (including asbestosclaims) and the uncertainties related to the collection of insurance proceeds make it difficult to predict the ultimate resolution.
Our operations are subject to various environmental regulations that are concerned with human health, the limitation and control of emissions and discharges intothe air, ground, and water, the quality of air and bodies of water, and the handling, use and disposal of specified substances. Our financial responsibility to clean upcontaminated property or for natural resource damages may extend to previously owned or used properties, waterways and properties owned by unrelatedcompanies or individuals, as well as properties that we currently own and use, regardless of whether the contamination is attributable to prior owners. We havebeen named as a potentially responsible party at cleanup sites and may be so named in the future, and the costs associated with these current and future sites maybe significant.
We have, from time to time, divested certain of our businesses. In connection with these divestitures, certain lawsuits, claims and proceedings may be instituted orasserted against us related to the period that we owned the businesses, either because we agreed to retain certain liabilities related to these periods or because suchliabilities fall upon us by operation of law. In some instances, the divested business has assumed the liabilities; however, it is possible that we might be responsiblefor satisfying those liabilities if the divested business is unable to do so.
8
Table of Contents
Failure to identify, manage, complete, and integrate acquisitions and technology investments may adversely affect our business.
As part of our strategy, we may pursue acquisitions of or investment opportunities in businesses as well as the purchase of technology from third parties. In orderto be successful with these transactions, we must identify attractive acquisition or investment opportunities, successfully complete the transaction, and managepost-closing matters, such as integration of the acquired business or technology. We may not be able to identify or complete beneficial acquisition or transactionopportunities given the intense competition for them. Even if we successfully identify and complete such transactions, we may not be able to successfully addressrisks and uncertainties inherent in such transactions, including:
• difficulties in integrating the purchased operations, technologies, products or services, retaining the acquired business’ customers and achieving the expectedbenefits of the acquisition, such as sales increases, access to technologies, cost savings and increases in geographic or product presence, in the desired timeframes;
• loss of key employees of the acquired business;• legal and compliance issues;• difficulties implementing and maintaining consistent standards, controls, procedures, policies and information systems; and• diversion of management’s attention from other business concerns.
Future acquisitions and technology investments could result in debt, dilution, liabilities, increased interest expense, restructuring charges, and impairment andamortization expenses related to intangible assets.
We own common stock in PTC Inc. and are exposed to the volatility, liquidity and other risks inherent in holding that stock.
We own common stock of PTC Inc. (PTC), a Nasdaq-listed company, that we acquired for an aggregate purchase price of approximately $1.0 billion. We presentthis investment on our Consolidated Balance Sheet at its fair value at the end of each reporting period, less a valuation adjustment pending registration of ourshares of PTC common stock (Shares) under the Securities Act of 1933, as amended, which, per a registration rights agreement entered into with PTC, must occurno later than July 19, 2019. The fair value of the Shares is subject to fluctuation in the future due to the volatility of the stock market, changes in general economicconditions, and the performance of PTC. We will recognize all changes in the fair value of the Shares (whether realized or unrealized) as gains or losses in ourConsolidated Statement of Operations. Accordingly, changes in the fair value of the Shares can materially impact the earnings we report, which introducesvolatility in our earnings that is not associated with the results of our business operations. In particular, significant declines in the fair value of the Shares wouldproduce significant declines in our reported earnings.
While there is an established trading market for shares of PTC common stock, there are limitations on our ability to dispose of some or all of the Shares should wewish to reduce our investment. Until approximately July 19, 2021, we are subject to contractual restrictions on our ability to transfer the Shares, subject to certainexceptions. In addition, we are subject to certain restrictions on our ability to transfer the Shares under the securities laws. Further, the reported value of our Sharesdoes not necessarily reflect their lowest current market price. If we were forced to sell some or all the Shares in the market, there can be no assurance that we willbe able to sell them at prices equivalent to the value of the Shares that we have reported on our Consolidated Balance Sheet, and we may be forced to sell them atsignificantly lower prices.
Finally, our equity position in PTC is a minority position which exposes us to further risk as we are not able to exert control over PTC.
Increasing employee benefit costs could have a negative effect on our operating results and financial condition.
One important aspect of attracting and retaining qualified personnel is continuing to offer competitive employee retirement and health care benefits. The expenseswe record for our pension and other postretirement benefit plans depend on factors such as changes in market interest rates, the value of plan assets, mortalityassumptions and healthcare trend rates. Significant unfavorable changes in these factors would increase our expenses. Expenses related to employer-fundedhealthcare benefits depend on laws and regulations, which could change, as well as healthcare cost inflation. An inability to control costs related to employee andretiree benefits could negatively impact our operating results and financial condition.
9
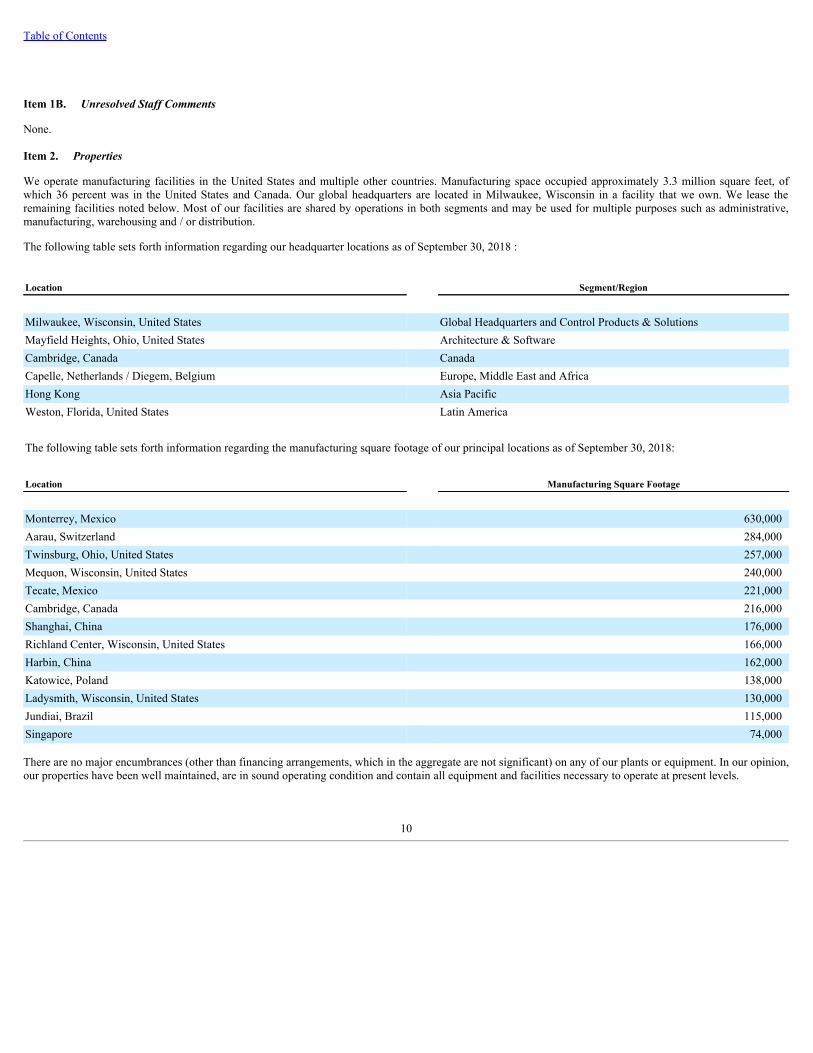
Table of Contents
Item 1B. Unresolved Staff Comments
None.
Item 2. Properties
We operate manufacturing facilities in the United States and multiple other countries. Manufacturing space occupied approximately 3.3 million square feet, ofwhich 36 percent was in the United States and Canada. Our global headquarters are located in Milwaukee, Wisconsin in a facility that we own. We lease theremaining facilities noted below. Most of our facilities are shared by operations in both segments and may be used for multiple purposes such as administrative,manufacturing, warehousing and / or distribution.
The following table sets forth information regarding our headquarter locations as of September 30, 2018 :
Location Segment/Region
Milwaukee, Wisconsin, United States Global Headquarters and Control Products & SolutionsMayfield Heights, Ohio, United States Architecture & SoftwareCambridge, Canada CanadaCapelle, Netherlands / Diegem, Belgium Europe, Middle East and AfricaHong Kong Asia PacificWeston, Florida, United States Latin America The following table sets forth information regarding the manufacturing square footage of our principal locations as of September 30, 2018: Location Manufacturing Square Footage
Monterrey, Mexico 630,000Aarau, Switzerland 284,000Twinsburg, Ohio, United States 257,000Mequon, Wisconsin, United States 240,000Tecate, Mexico 221,000Cambridge, Canada 216,000Shanghai, China 176,000Richland Center, Wisconsin, United States 166,000Harbin, China 162,000Katowice, Poland 138,000Ladysmith, Wisconsin, United States 130,000Jundiai, Brazil 115,000Singapore 74,000
There are no major encumbrances (other than financing arrangements, which in the aggregate are not significant) on any of our plants or equipment. In our opinion,our properties have been well maintained, are in sound operating condition and contain all equipment and facilities necessary to operate at present levels.
10
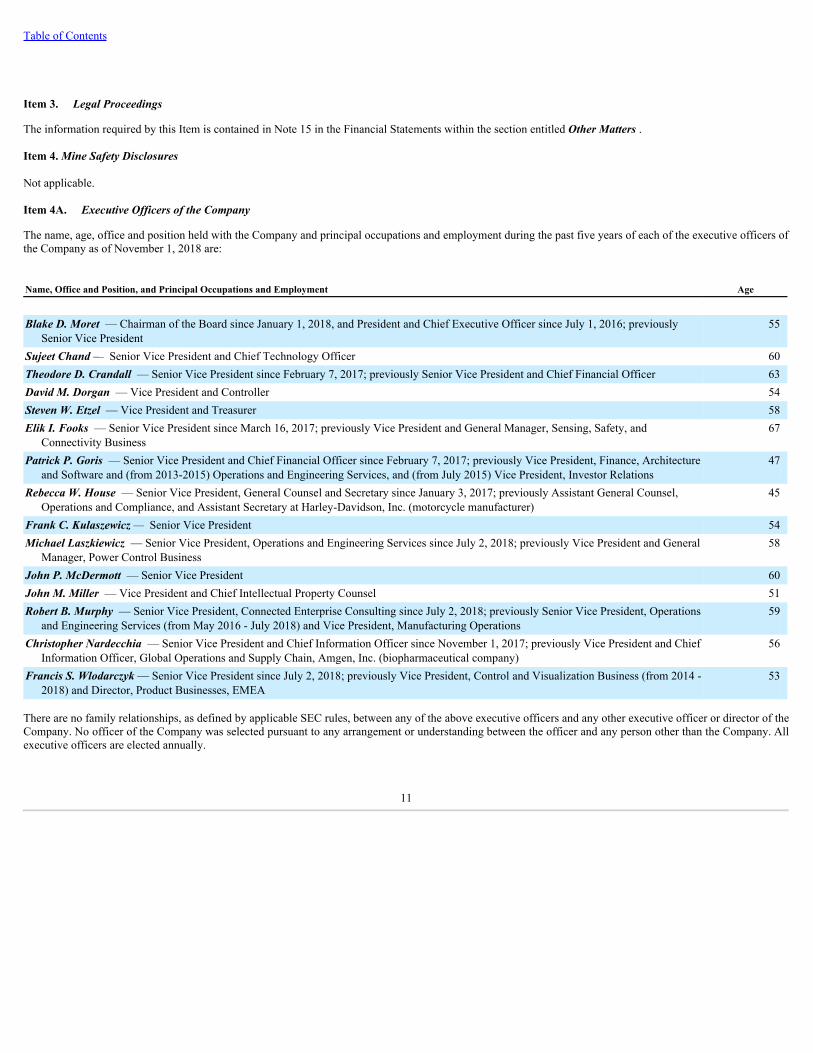
Table of Contents
Item 3. Legal Proceedings
The information required by this Item is contained in Note 15 in the Financial Statements within the section entitled Other Matters .
Item 4. Mine Safety Disclosures
Not applicable.
Item 4A. Executive Officers of the Company
The name, age, office and position held with the Company and principal occupations and employment during the past five years of each of the executive officers ofthe Company as of November 1, 2018 are:
Name, Office and Position, and Principal Occupations and Employment Age
Blake D. Moret — Chairman of the Board since January 1, 2018, and President and Chief Executive Officer since July 1, 2016; previously
Senior Vice President55
Sujeet Chand — Senior Vice President and Chief Technology Officer 60Theodore D. Crandall — Senior Vice President since February 7, 2017; previously Senior Vice President and Chief Financial Officer 63David M. Dorgan — Vice President and Controller 54Steven W. Etzel — Vice President and Treasurer 58Elik I. Fooks — Senior Vice President since March 16, 2017; previously Vice President and General Manager, Sensing, Safety, and
Connectivity Business67
Patrick P. Goris — Senior Vice President and Chief Financial Officer since February 7, 2017; previously Vice President, Finance, Architectureand Software and (from 2013-2015) Operations and Engineering Services, and (from July 2015) Vice President, Investor Relations
47
Rebecca W. House — Senior Vice President, General Counsel and Secretary since January 3, 2017; previously Assistant General Counsel,Operations and Compliance, and Assistant Secretary at Harley-Davidson, Inc. (motorcycle manufacturer)
45
Frank C. Kulaszewicz — Senior Vice President 54Michael Laszkiewicz — Senior Vice President, Operations and Engineering Services since July 2, 2018; previously Vice President and General
Manager, Power Control Business58
John P. McDermott — Senior Vice President 60John M. Miller — Vice President and Chief Intellectual Property Counsel 51Robert B. Murphy — Senior Vice President, Connected Enterprise Consulting since July 2, 2018; previously Senior Vice President, Operations
and Engineering Services (from May 2016 - July 2018) and Vice President, Manufacturing Operations59
Christopher Nardecchia — Senior Vice President and Chief Information Officer since November 1, 2017; previously Vice President and ChiefInformation Officer, Global Operations and Supply Chain, Amgen, Inc. (biopharmaceutical company)
56
Francis S. Wlodarczyk — Senior Vice President since July 2, 2018; previously Vice President, Control and Visualization Business (from 2014 -2018) and Director, Product Businesses, EMEA
53
There are no family relationships, as defined by applicable SEC rules, between any of the above executive officers and any other executive officer or director of theCompany. No officer of the Company was selected pursuant to any arrangement or understanding between the officer and any person other than the Company. Allexecutive officers are elected annually.
11
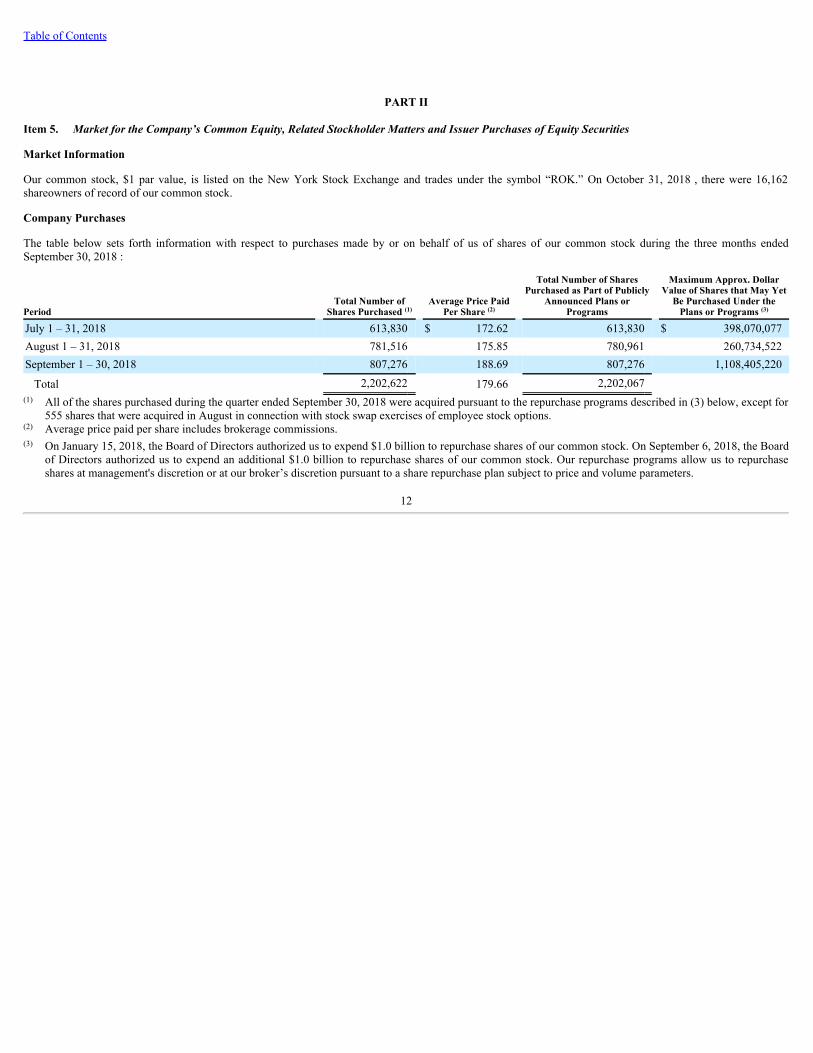
Table of Contents
PART II
Item 5. Market for the Company’s Common Equity, Related Stockholder Matters and Issuer Purchases of Equity Securities
Market Information
Our common stock, $1 par value, is listed on the New York Stock Exchange and trades under the symbol “ROK.” On October 31, 2018 , there were 16,162shareowners of record of our common stock.
Company Purchases
The table below sets forth information with respect to purchases made by or on behalf of us of shares of our common stock during the three months endedSeptember 30, 2018 :
Period Total Number of
Shares Purchased (1) Average Price Paid
Per Share (2)
Total Number of SharesPurchased as Part of Publicly
Announced Plans orPrograms
Maximum Approx. DollarValue of Shares that May Yet
Be Purchased Under thePlans or Programs (3)
July 1 – 31, 2018 613,830 $ 172.62 613,830 $ 398,070,077August 1 – 31, 2018 781,516 175.85 780,961 260,734,522September 1 – 30, 2018 807,276 188.69 807,276 1,108,405,220
Total 2,202,622 179.66 2,202,067 (1) All of the shares purchased during the quarter ended September 30, 2018 were acquired pursuant to the repurchase programs described in (3) below, except for
555 shares that were acquired in August in connection with stock swap exercises of employee stock options.(2) Average price paid per share includes brokerage commissions.(3) On January 15, 2018, the Board of Directors authorized us to expend $1.0 billion to repurchase shares of our common stock. On September 6, 2018, the Board
of Directors authorized us to expend an additional $1.0 billion to repurchase shares of our common stock. Our repurchase programs allow us to repurchaseshares at management's discretion or at our broker’s discretion pursuant to a share repurchase plan subject to price and volume parameters.
12
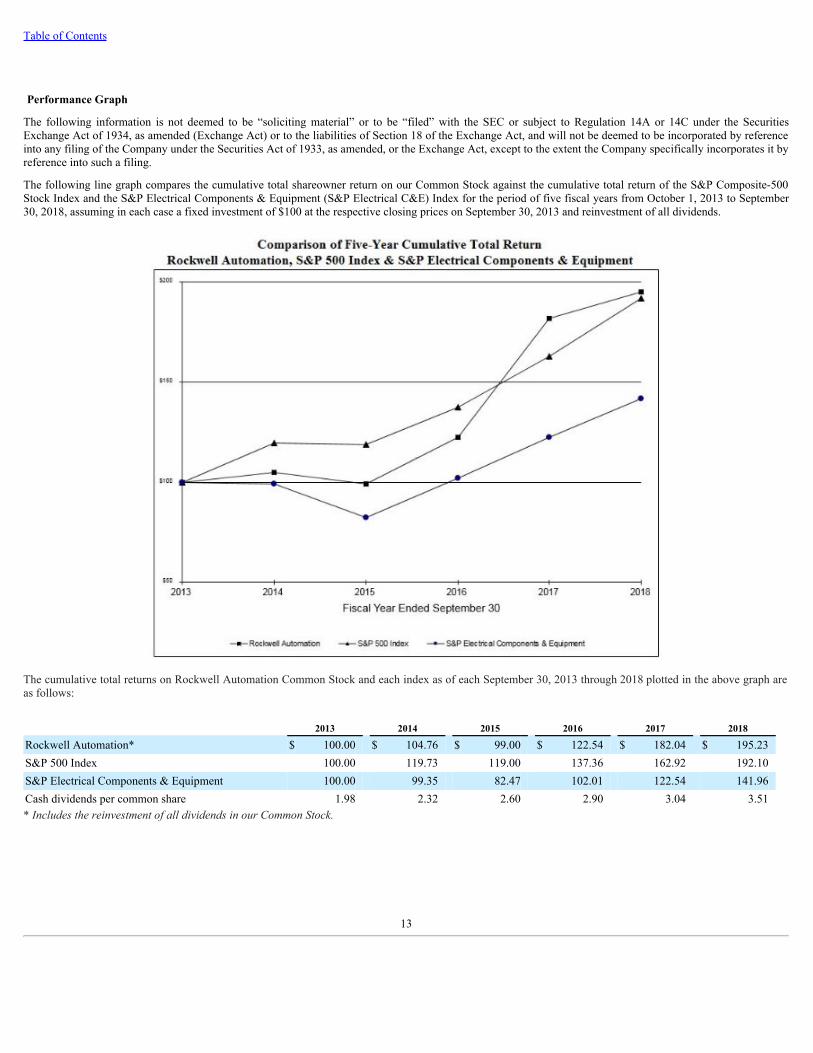
Table of Contents
Performance Graph
The following information is not deemed to be “soliciting material” or to be “filed” with the SEC or subject to Regulation 14A or 14C under the SecuritiesExchange Act of 1934, as amended (Exchange Act) or to the liabilities of Section 18 of the Exchange Act, and will not be deemed to be incorporated by referenceinto any filing of the Company under the Securities Act of 1933, as amended, or the Exchange Act, except to the extent the Company specifically incorporates it byreference into such a filing.
The following line graph compares the cumulative total shareowner return on our Common Stock against the cumulative total return of the S&P Composite-500Stock Index and the S&P Electrical Components & Equipment (S&P Electrical C&E) Index for the period of five fiscal years from October 1, 2013 to September30, 2018, assuming in each case a fixed investment of $100 at the respective closing prices on September 30, 2013 and reinvestment of all dividends.
The cumulative total returns on Rockwell Automation Common Stock and each index as of each September 30, 2013 through 2018 plotted in the above graph areas follows:
2013 2014 2015 2016 2017 2018
Rockwell Automation* $ 100.00 $ 104.76 $ 99.00 $ 122.54 $ 182.04 $ 195.23S&P 500 Index 100.00 119.73 119.00 137.36 162.92 192.10S&P Electrical Components & Equipment 100.00 99.35 82.47 102.01 122.54 141.96Cash dividends per common share 1.98 2.32 2.60 2.90 3.04 3.51*IncludesthereinvestmentofalldividendsinourCommonStock.
13
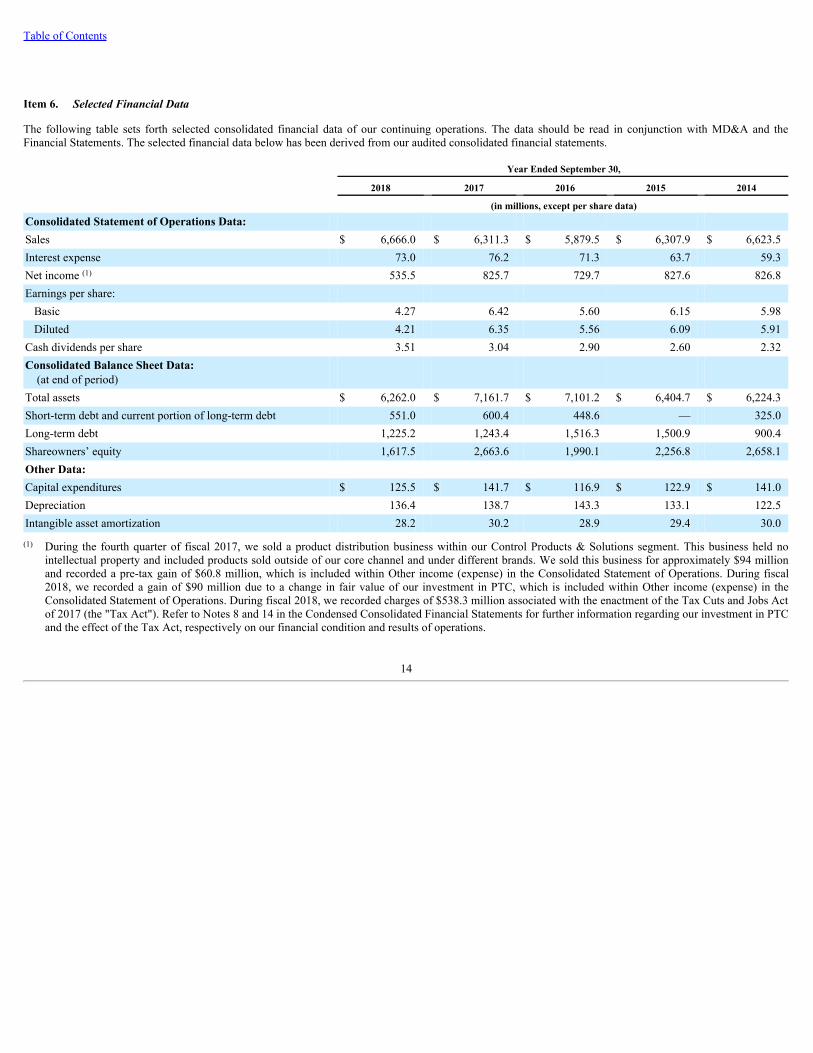
Table of Contents
Item 6. Selected Financial Data
The following table sets forth selected consolidated financial data of our continuing operations. The data should be read in conjunction with MD&A and theFinancial Statements. The selected financial data below has been derived from our audited consolidated financial statements.
Year Ended September 30,
2018 2017 2016 2015 2014 (in millions, except per share data)Consolidated Statement of Operations Data: Sales $ 6,666.0 $ 6,311.3 $ 5,879.5 $ 6,307.9 $ 6,623.5Interest expense 73.0 76.2 71.3 63.7 59.3Net income (1) 535.5 825.7 729.7 827.6 826.8Earnings per share:
Basic 4.27 6.42 5.60 6.15 5.98Diluted 4.21 6.35 5.56 6.09 5.91
Cash dividends per share 3.51 3.04 2.90 2.60 2.32Consolidated Balance Sheet Data: (at end of period) Total assets $ 6,262.0 $ 7,161.7 $ 7,101.2 $ 6,404.7 $ 6,224.3Short-term debt and current portion of long-term debt 551.0 600.4 448.6 — 325.0Long-term debt 1,225.2 1,243.4 1,516.3 1,500.9 900.4Shareowners’ equity 1,617.5 2,663.6 1,990.1 2,256.8 2,658.1Other Data: Capital expenditures $ 125.5 $ 141.7 $ 116.9 $ 122.9 $ 141.0Depreciation 136.4 138.7 143.3 133.1 122.5Intangible asset amortization 28.2 30.2 28.9 29.4 30.0
(1) During the fourth quarter of fiscal 2017, we sold a product distribution business within our Control Products & Solutions segment. This business held nointellectual property and included products sold outside of our core channel and under different brands. We sold this business for approximately $94 millionand recorded a pre-tax gain of $60.8 million, which is included within Other income (expense) in the Consolidated Statement of Operations. During fiscal2018, we recorded a gain of $90 million due to a change in fair value of our investment in PTC, which is included within Other income (expense) in theConsolidated Statement of Operations. During fiscal 2018, we recorded charges of $538.3 million associated with the enactment of the Tax Cuts and Jobs Actof 2017 (the "Tax Act"). Refer to Notes 8 and 14 in the Condensed Consolidated Financial Statements for further information regarding our investment in PTCand the effect of the Tax Act, respectively on our financial condition and results of operations.
14
Table of Contents
Item 7. Management’s Discussion and Analysis of Financial Condition and Results of Operations
Results of Operations
Non-GAAP Measures
The following discussion includes organic sales, total segment operating earnings and margin, Adjusted Income, Adjusted EPS, Adjusted Effective Tax Rate andfree cash flow, which are non-GAAP measures. See Supplemental Sales Information for a reconciliation of reported sales to organic sales and a discussion ofwhy we believe this non-GAAP measure is useful to investors. See Results of Operations for a reconciliation of income before income taxes to total segmentoperating earnings and margin and a discussion of why we believe these non-GAAP measures are useful to investors. See Results of Operations for areconciliation of income from continuing operations, diluted EPS from continuing operations and effective tax rate to Adjusted Income, Adjusted EPS andAdjusted Effective Tax Rate, respectively, and a discussion of why we believe these non-GAAP measures are useful to investors. See Financial Condition for areconciliation of cash flows from operating activities to free cash flow and a discussion of why we believe this non-GAAP measure is useful to investors.
Overview
Rockwell Automation, Inc., a leader in industrial automation and information, makes its customers more productive and the world more sustainable . Overalldemand for our hardware and software products, solutions and services is driven by:
• investments in manufacturing, including upgrades, modifications and expansions of existing facilities or production lines and new facilities or productionlines;
• investments in basic materials production capacity, which may be related to commodity pricing levels;• our customers’ needs for faster time to market, lower total cost of ownership, improved asset utilization and optimization, and enterprise risk management;• our customers’ needs to continuously improve quality, safety and sustainability;• industry factors that include our customers’ new product introductions, demand for our customers’ products or services and the regulatory and competitive
environments in which our customers operate;• levels of global industrial production and capacity utilization;• regional factors that include local political, social, regulatory and economic circumstances; and• the spending patterns of our customers due to their annual budgeting processes and their working schedules.
Long-term Strategy
Our strategy is to bring The Connected Enterprise to life. We integrate control and information across the enterprise to help industrial companies and their peoplebe more productive. Our vision of being the most valued global provider of innovative industrial automation and information hardware and software products,solutions and services is supported by our growth and performance strategy, which seeks to:
• achieve organic sales growth in excess of the automation market by expanding our served market and strengthening our competitive differentiation;• diversify our sales streams by broadening our portfolio of hardware and software products, solutions and services, expanding our global presence and serving a
wider range of industries and applications;• grow market share by gaining new customers and by capturing a larger share of existing customers’ spending;• enhance our market access by building our channel capability and partner network;• acquire companies that serve as catalysts to organic growth by adding complementary technology, expanding our served market, or enhancing our domain
expertise or market access;• deploy human and financial resources to strengthen our technology leadership and our intellectual capital business model;• continuously improve quality and customer experience; and• drive annual cost productivity.
By implementing the above strategy, we seek to achieve our long-term financial goals, including above-market organic sales growth, EPS growth above salesgrowth, return on invested capital in excess of 20 percent and free cash flow equal to about 100 percent of Adjusted Income. We expect acquisitions to add apercentage point or more per year to long-term sales growth.
15
Table of Contents
Our customers face the challenge of remaining globally cost competitive and automation can help them achieve their productivity and sustainability objectives. Ourvalue proposition is to help our customers reduce time to market, lower total cost of ownership, improve asset utilization and manage enterprise risks.
DifferentiationthroughTechnologyInnovationandDomainExpertise
We seek a technology leadership position in industrial automation. We believe that our three platforms - integrated architecture, intelligent motor control andsolutions and services - provide the foundation for a long-term sustainable competitive advantage.
Our integrated control and information architecture, with Logix at its core, is an important differentiator. We are the only automation provider that can supportdiscrete, process, batch, safety, motion and power control on the same hardware platform with the same software programming environment. Our integratedarchitecture is scalable with standard open communications protocols making it easier for customers to implement it more cost effectively. Our software portfolio,combined with the software made available as a result of our strategic alliance with PTC, is the most comprehensive and flexible information platform in theindustry. Through the combination of this technology and our domain expertise we help customers to achieve additional productivity benefits, such as reducedunplanned downtime, improved energy efficiency, higher quality and increased throughput yield.
Intelligent motor control is one of our core competencies and an important aspect of an automation system. These products and solutions enhance the availability,efficiency and safe operation of our customers' critical and most energy-intensive plant assets. Our intelligent motor control offering can be integrated seamlesslywith the Logix architecture.
Domain expertise refers to the industry and application knowledge required to deliver solutions and services that support customers through the entire life cycle oftheir automation investment. The combination of industry-specific domain expertise of our people with our innovative technologies enables us to help ourcustomers solve their manufacturing and business challenges.
GlobalExpansion
As the manufacturing world continues to expand, we must be able to meet our customers’ needs around the world. Approximately 60 percent of our employees and45 percent of our sales are outside the U.S. We continue to expand our footprint in emerging markets.
As we expand in markets with considerable growth potential and shift our global footprint, we expect to continue to broaden the portfolio of hardware and softwareproducts, solutions and services that we provide to our customers in these regions. We have made significant investments to globalize our manufacturing, productdevelopment and customer-facing resources in order to be closer to our customers throughout the world. The emerging markets of Asia Pacific, including Chinaand India, Latin America, Central and Eastern Europe and Africa are projected to be the fastest growing over the long term, due to higher levels of infrastructureinvestment and the growing middle-class population. We believe that increased demand for consumer products in these markets will lead to manufacturinginvestment and provide us with additional growth opportunities in the future.
EnhancedMarketAccess
Over the past decade, our investments in technology and globalization have enabled us to expand our addressed market to over $90 billion. Our process initiativehas been the most important contributor to this expansion and remains our largest growth opportunity. Logix is the technology foundation that enabled us tobecome an industry leader for process applications. We complement that with a growing global network of engineers and partners to provide solutions to processcustomers.
Original Equipment Manufacturers (OEMs) represent another area of addressed market expansion and an important growth opportunity. To remain competitive,OEMs need to find the optimal balance of machine cost and performance while reducing their time to market. Our scalable integrated architecture and intelligentmotor control offerings, along with design productivity tools and our motion and safety products, can assist OEMs in addressing these business needs.
We have developed a powerful network of channel partners, technology partners and commercial partners that act as amplifiers to our internal capabilities andenable us to serve our customers’ needs around the world.
16

Table of Contents
BroadRangeofIndustriesServed
We apply our knowledge of manufacturing applications to help customers solve their business challenges. We serve customers in a wide range of industries,including consumer products, heavy industries and transportation.
Our consumer products customers are engaged in the food and beverage, home and personal care, and life sciences industries. These customers’ needs include newcapacity, incremental capacity from existing facilities, flexible manufacturing and regulatory compliance. These customers operate in an environment whereproduct innovation and time to market are critical factors.
We serve customers in heavy industries, including oil and gas, mining, aggregates, cement, metals, energy, semiconductor, chemicals, pulp and paper andwater/wastewater. Companies in resource-based industries typically invest in capacity expansion when commodity prices are relatively high and global demand forbasic materials is increasing. In addition, there is ongoing investment in upgrades of aging automation systems and productivity.
In the transportation industry, factors such as geographic expansion, investment in new model introductions, including electric vehicles, and more flexiblemanufacturing technologies influence customers’ automation investment decisions. Our sales in transportation are primarily to automotive and tire manufacturers.
All of these industries also generate maintenance repair order (MRO) and ongoing services revenue related to the installed base.
OutsourcingandSustainabilityTrends
Demand for our hardware and software products, solutions and services across all industries benefits from the outsourcing and sustainability needs of ourcustomers. Customers increasingly desire to outsource engineering services to achieve a more flexible cost base. Our manufacturing application knowledge enablesus to serve these customers globally.
We help our customers meet their sustainability needs pertaining to energy efficiency, environmental and safety goals. Customers across all industries are investingin more energy-efficient manufacturing processes and technologies, such as intelligent motor control, and energy-efficient solutions and services. In addition,environmental and safety objectives often spur customers to invest to ensure compliance and implement sustainable business practices.
AcquisitionsandInvestments
Our acquisition and investment strategy focuses on hardware and software products, solutions and services that will be catalytic to the organic growth of our coreofferings.
In 2018, we made several investments, including in PTC. PTC is the leader in the Industrial Internet of Things and augmented reality. Our investment in andalliance with PTC will accelerate growth for both companies and enable us to be the partner of choice for customers around the world who want to transform theirphysical operations with digital technology. The result will be an unmatched integrated information solution that will enable customers to achieve increasedproductivity, heightened plant efficiency, reduced operational risk and better system interoperability.
In November 2017, we acquired Odos Imaging Limited, a Scottish technology company that provides three-dimensional, time-of-flight sensing systems forindustrial imaging applications. This acquisition enables us to expand our existing capabilities by bringing 3-D time-of-flight sensor technology to industrialapplications.
In September 2016, we acquired Maverick Technologies, a leading systems integrator. This acquisition significantly enhances our expertise in key process andbatch applications that help our customers realize greater productivity and improved global competitiveness through process control and information managementsolutions.
In September 2016, we acquired Automation Control Products, a premier provider in centralized thin client, remote desktop and server management software. Thisacquisition strengthens our ability to provide our customers with visual display and software solutions to manage information and streamline workflows for a moreconnected manufacturing environment.
In March 2016, we acquired MagneMotion Inc., a leading manufacturer of intelligent conveying systems. This acquisition continues our strategy to build aportfolio of smart manufacturing technologies by expanding our existing capabilities in independent cart technology.
We believe these acquisitions and investments will help us expand our served market and deliver value to our customers.
17

Table of Contents
ContinuousImprovement
Productivity and continuous improvement are important components of our culture. We have programs in place that drive ongoing process improvement,functional streamlining, material cost savings and manufacturing productivity. Our implementation of common global processes and an enterprise-wide businesssystem is nearly complete. These are intended to improve profitability that can be used to fund investments in growth and to offset inflation. Our ongoingproductivity initiatives target both cost reduction and improved asset utilization. Charges for workforce reductions and facility rationalization may be required inorder to effectively execute our productivity programs.
18
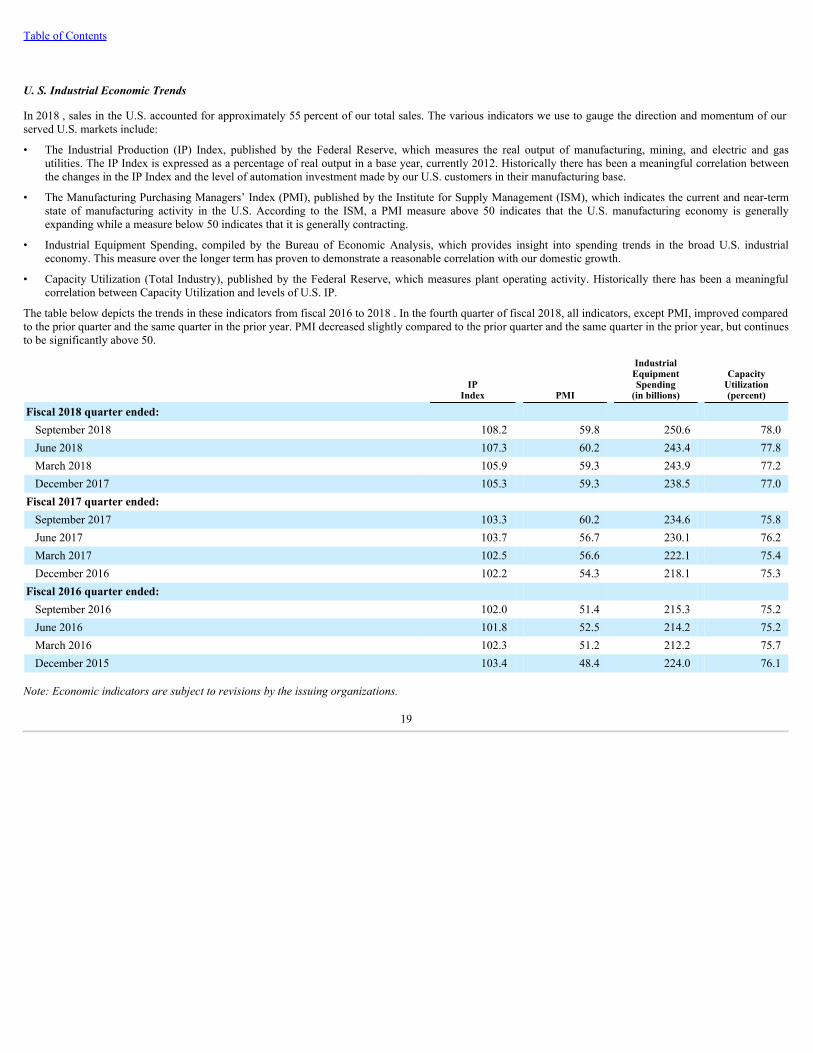
Table of Contents
U. S. Industrial Economic Trends
In 2018 , sales in the U.S. accounted for approximately 55 percent of our total sales. The various indicators we use to gauge the direction and momentum of ourserved U.S. markets include:
• The Industrial Production (IP) Index, published by the Federal Reserve, which measures the real output of manufacturing, mining, and electric and gasutilities. The IP Index is expressed as a percentage of real output in a base year, currently 2012. Historically there has been a meaningful correlation betweenthe changes in the IP Index and the level of automation investment made by our U.S. customers in their manufacturing base.
• The Manufacturing Purchasing Managers’ Index (PMI), published by the Institute for Supply Management (ISM), which indicates the current and near-termstate of manufacturing activity in the U.S. According to the ISM, a PMI measure above 50 indicates that the U.S. manufacturing economy is generallyexpanding while a measure below 50 indicates that it is generally contracting.
• Industrial Equipment Spending, compiled by the Bureau of Economic Analysis, which provides insight into spending trends in the broad U.S. industrialeconomy. This measure over the longer term has proven to demonstrate a reasonable correlation with our domestic growth.
• Capacity Utilization (Total Industry), published by the Federal Reserve, which measures plant operating activity. Historically there has been a meaningfulcorrelation between Capacity Utilization and levels of U.S. IP.
The table below depicts the trends in these indicators from fiscal 2016 to 2018 . In the fourth quarter of fiscal 2018, all indicators, except PMI, improved comparedto the prior quarter and the same quarter in the prior year. PMI decreased slightly compared to the prior quarter and the same quarter in the prior year, but continuesto be significantly above 50.
IP
Index PMI
IndustrialEquipmentSpending
(in billions)
CapacityUtilization(percent)
Fiscal 2018 quarter ended: September 2018 108.2 59.8 250.6 78.0June 2018 107.3 60.2 243.4 77.8March 2018 105.9 59.3 243.9 77.2December 2017 105.3 59.3 238.5 77.0
Fiscal 2017 quarter ended: September 2017 103.3 60.2 234.6 75.8June 2017 103.7 56.7 230.1 76.2March 2017 102.5 56.6 222.1 75.4December 2016 102.2 54.3 218.1 75.3
Fiscal 2016 quarter ended: September 2016 102.0 51.4 215.3 75.2June 2016 101.8 52.5 214.2 75.2March 2016 102.3 51.2 212.2 75.7December 2015 103.4 48.4 224.0 76.1
Note:Economicindicatorsaresubjecttorevisionsbytheissuingorganizations.
19

Table of Contents
Non-U.S. Economic Trends
In 2018 , sales outside the U.S. accounted for approximately 45 percent of our total sales. These customers include both indigenous companies and multinationalcompanies with expanding global presence. In addition to the global factors previously mentioned in the “Overview” section, international demand, particularly inemerging markets, has historically been driven by the strength of the industrial economy in each region, investments in infrastructure and expanding consumermarkets. We use changes in the respective countries' gross domestic product and IP as indicators of the growth opportunities in each region where we do business.
Macroeconomic indicators remain favorable in most geographies, although IP and gross domestic product growth rates are projected to slow in 2019. In China, theimpact of trade tensions is expected to be partially offset by government stimulus, and solid domestic and foreign demand in India is expected to help supportcontinued manufacturing growth. In Europe, the economy is affected by slowing export growth driven by a strong Euro against emerging market currencies andincreasing oil prices. Latin America is expected to continue to benefit from a strong U.S. economy. Growth rates in Canada are expected to be lower in 2019.
20
Table of Contents
Summary of Results of Operations
In 2018 , sales were $6,666.0 million , an increase of 5.6 percent year over year. Organic sales increased 5.5 percent . Currency translation increased sales by 1.4percentage points , and the prior year divestiture reduced sales growth by 1.3 percentage points . Growth was broad-based across industries, led by food andbeverage, mining, life sciences, and semiconductor.
The following is a summary of our results related to key growth initiatives:
• Logix reported sales increased 8 percent year over year in 2018 compared to 2017 . Organic sales increased 7 percent year over year, and currency translationincreased sales by 1 percentage point.
• Process initiative reported sales and organic sales increased 10 percent year over year in 2018 compared to 2017 .
• Sales in emerging countries increased 8 percent in 2018 compared to 2017 . Organic sales in emerging countries increased 9 percent year over year. The prioryear divestiture reduced sales in emerging countries by 1 percent.
21
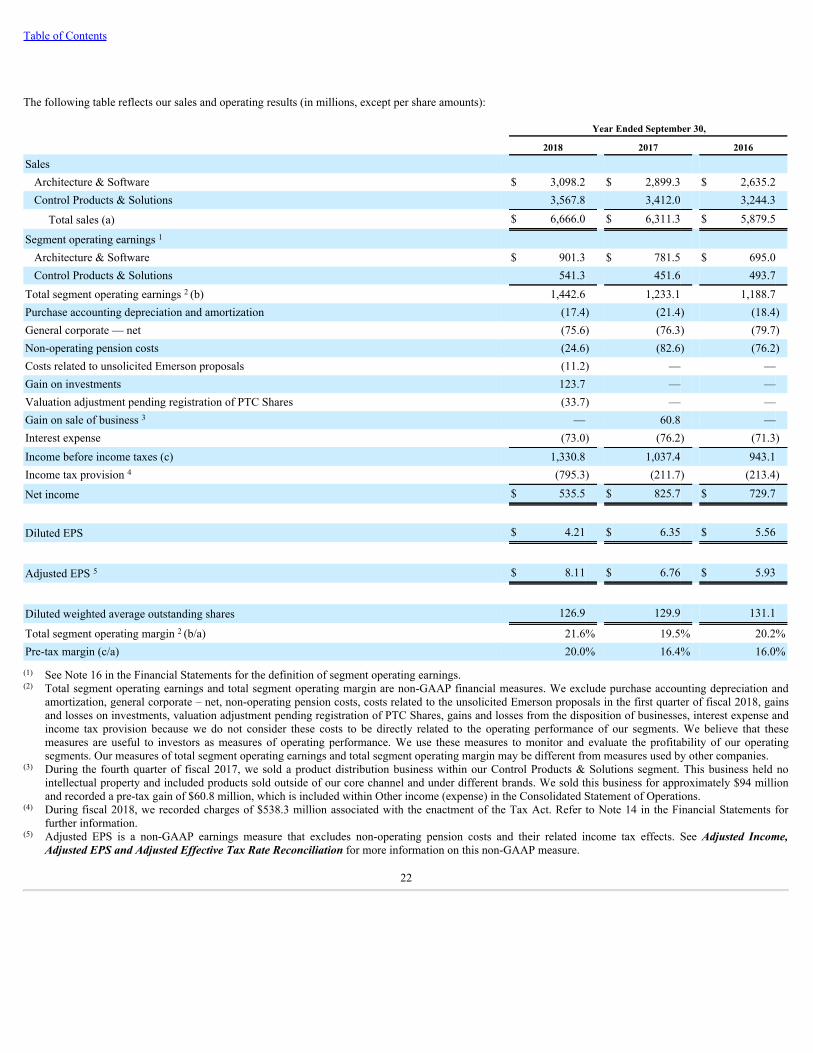
Table of Contents
The following table reflects our sales and operating results (in millions, except per share amounts):
Year Ended September 30,
2018 2017 2016
Sales Architecture & Software $ 3,098.2 $ 2,899.3 $ 2,635.2Control Products & Solutions 3,567.8 3,412.0 3,244.3
Total sales (a) $ 6,666.0 $ 6,311.3 $ 5,879.5
Segment operating earnings 1 Architecture & Software $ 901.3 $ 781.5 $ 695.0Control Products & Solutions 541.3 451.6 493.7
Total segment operating earnings 2 (b) 1,442.6 1,233.1 1,188.7Purchase accounting depreciation and amortization (17.4) (21.4) (18.4)General corporate — net (75.6) (76.3) (79.7)Non-operating pension costs (24.6) (82.6) (76.2)Costs related to unsolicited Emerson proposals (11.2) — —Gain on investments 123.7 — —Valuation adjustment pending registration of PTC Shares (33.7) — —Gain on sale of business 3 — 60.8 —Interest expense (73.0) (76.2) (71.3)Income before income taxes (c) 1,330.8 1,037.4 943.1Income tax provision 4 (795.3) (211.7) (213.4)
Net income $ 535.5 $ 825.7 $ 729.7
Diluted EPS $ 4.21 $ 6.35 $ 5.56
Adjusted EPS 5 $ 8.11 $ 6.76 $ 5.93
Diluted weighted average outstanding shares 126.9 129.9 131.1
Total segment operating margin 2 (b/a) 21.6% 19.5% 20.2%Pre-tax margin (c/a) 20.0% 16.4% 16.0%
(1) See Note 16 in the Financial Statements for the definition of segment operating earnings.(2) Total segment operating earnings and total segment operating margin are non-GAAP financial measures. We exclude purchase accounting depreciation and
amortization, general corporate – net, non-operating pension costs, costs related to the unsolicited Emerson proposals in the first quarter of fiscal 2018, gainsand losses on investments, valuation adjustment pending registration of PTC Shares, gains and losses from the disposition of businesses, interest expense andincome tax provision because we do not consider these costs to be directly related to the operating performance of our segments. We believe that thesemeasures are useful to investors as measures of operating performance. We use these measures to monitor and evaluate the profitability of our operatingsegments. Our measures of total segment operating earnings and total segment operating margin may be different from measures used by other companies.
(3) During the fourth quarter of fiscal 2017, we sold a product distribution business within our Control Products & Solutions segment. This business held nointellectual property and included products sold outside of our core channel and under different brands. We sold this business for approximately $94 millionand recorded a pre-tax gain of $60.8 million, which is included within Other income (expense) in the Consolidated Statement of Operations.
(4) During fiscal 2018, we recorded charges of $538.3 million associated with the enactment of the Tax Act. Refer to Note 14 in the Financial Statements forfurther information.
(5) Adjusted EPS is a non-GAAP earnings measure that excludes non-operating pension costs and their related income tax effects. See Adjusted Income,Adjusted EPS and Adjusted Effective Tax Rate Reconciliation for more information on this non-GAAP measure.
22
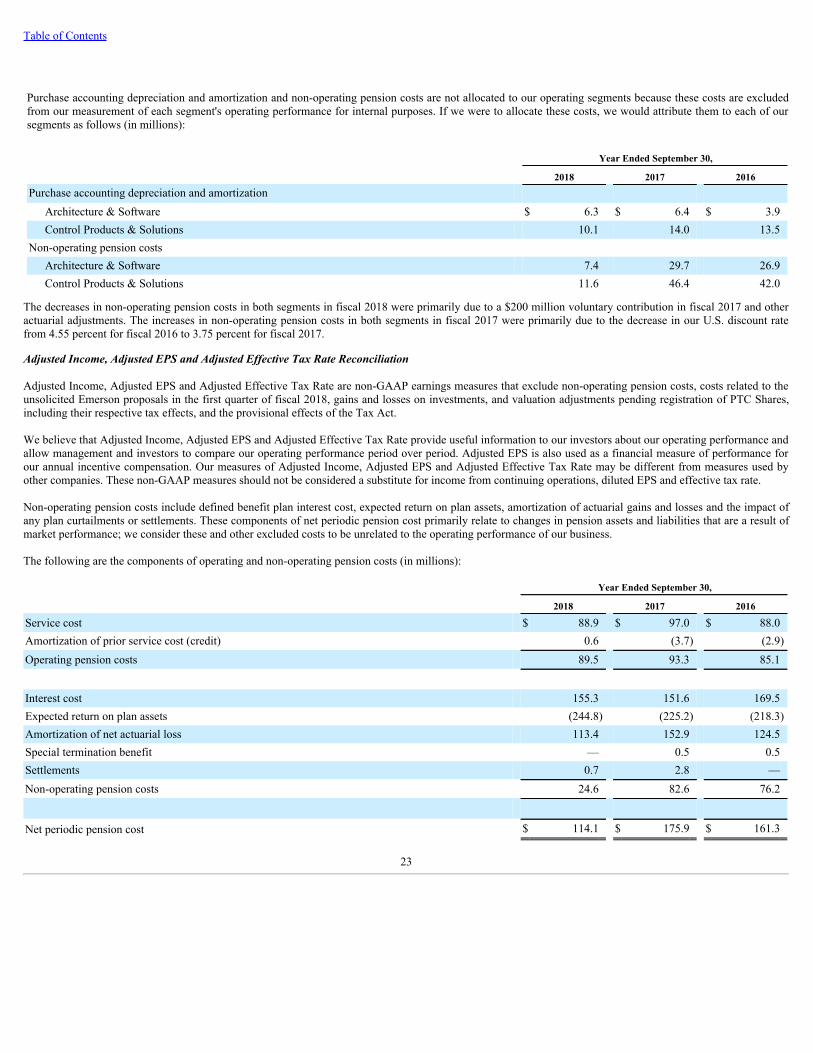
Table of Contents
Purchase accounting depreciation and amortization and non-operating pension costs are not allocated to our operating segments because these costs are excludedfrom our measurement of each segment's operating performance for internal purposes. If we were to allocate these costs, we would attribute them to each of oursegments as follows (in millions):
Year Ended September 30,
2018 2017 2016Purchase accounting depreciation and amortization
Architecture & Software $ 6.3 $ 6.4 $ 3.9Control Products & Solutions 10.1 14.0 13.5
Non-operating pension costs Architecture & Software 7.4 29.7 26.9Control Products & Solutions 11.6 46.4 42.0
The decreases in non-operating pension costs in both segments in fiscal 2018 were primarily due to a $200 million voluntary contribution in fiscal 2017 and otheractuarial adjustments. The increases in non-operating pension costs in both segments in fiscal 2017 were primarily due to the decrease in our U.S. discount ratefrom 4.55 percent for fiscal 2016 to 3.75 percent for fiscal 2017.
Adjusted Income, Adjusted EPS and Adjusted Effective Tax Rate Reconciliation
Adjusted Income, Adjusted EPS and Adjusted Effective Tax Rate are non-GAAP earnings measures that exclude non-operating pension costs, costs related to theunsolicited Emerson proposals in the first quarter of fiscal 2018, gains and losses on investments, and valuation adjustments pending registration of PTC Shares,including their respective tax effects, and the provisional effects of the Tax Act.
We believe that Adjusted Income, Adjusted EPS and Adjusted Effective Tax Rate provide useful information to our investors about our operating performance andallow management and investors to compare our operating performance period over period. Adjusted EPS is also used as a financial measure of performance forour annual incentive compensation. Our measures of Adjusted Income, Adjusted EPS and Adjusted Effective Tax Rate may be different from measures used byother companies. These non-GAAP measures should not be considered a substitute for income from continuing operations, diluted EPS and effective tax rate.
Non-operating pension costs include defined benefit plan interest cost, expected return on plan assets, amortization of actuarial gains and losses and the impact ofany plan curtailments or settlements. These components of net periodic pension cost primarily relate to changes in pension assets and liabilities that are a result ofmarket performance; we consider these and other excluded costs to be unrelated to the operating performance of our business.
The following are the components of operating and non-operating pension costs (in millions):
Year Ended September 30,
2018 2017 2016
Service cost $ 88.9 $ 97.0 $ 88.0Amortization of prior service cost (credit) 0.6 (3.7) (2.9)Operating pension costs 89.5 93.3 85.1
Interest cost 155.3 151.6 169.5Expected return on plan assets (244.8) (225.2) (218.3)Amortization of net actuarial loss 113.4 152.9 124.5Special termination benefit — 0.5 0.5Settlements 0.7 2.8 —Non-operating pension costs 24.6 82.6 76.2
Net periodic pension cost $ 114.1 $ 175.9 $ 161.3
23
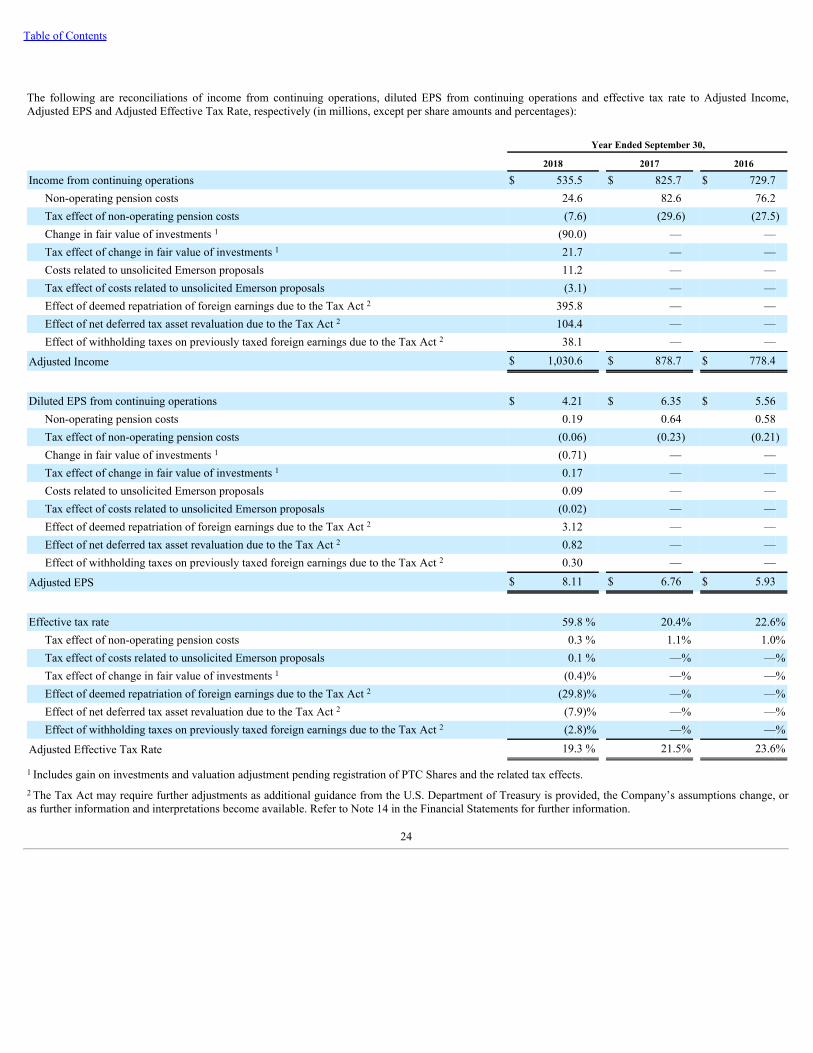
Table of Contents
The following are reconciliations of income from continuing operations, diluted EPS from continuing operations and effective tax rate to Adjusted Income,Adjusted EPS and Adjusted Effective Tax Rate, respectively (in millions, except per share amounts and percentages):
Year Ended September 30,
2018 2017 2016
Income from continuing operations $ 535.5 $ 825.7 $ 729.7Non-operating pension costs 24.6 82.6 76.2Tax effect of non-operating pension costs (7.6) (29.6) (27.5)Change in fair value of investments 1 (90.0) — —Tax effect of change in fair value of investments 1 21.7 — —Costs related to unsolicited Emerson proposals 11.2 — —Tax effect of costs related to unsolicited Emerson proposals (3.1) — —Effect of deemed repatriation of foreign earnings due to the Tax Act 2 395.8 — —Effect of net deferred tax asset revaluation due to the Tax Act 2 104.4 — —Effect of withholding taxes on previously taxed foreign earnings due to the Tax Act 2 38.1 — —
Adjusted Income $ 1,030.6 $ 878.7 $ 778.4
Diluted EPS from continuing operations $ 4.21 $ 6.35 $ 5.56Non-operating pension costs 0.19 0.64 0.58Tax effect of non-operating pension costs (0.06) (0.23) (0.21)Change in fair value of investments 1 (0.71) — —Tax effect of change in fair value of investments 1 0.17 — —Costs related to unsolicited Emerson proposals 0.09 — —Tax effect of costs related to unsolicited Emerson proposals (0.02) — —Effect of deemed repatriation of foreign earnings due to the Tax Act 2 3.12 — —Effect of net deferred tax asset revaluation due to the Tax Act 2 0.82 — —Effect of withholding taxes on previously taxed foreign earnings due to the Tax Act 2 0.30 — —
Adjusted EPS $ 8.11 $ 6.76 $ 5.93
Effective tax rate 59.8 % 20.4% 22.6%Tax effect of non-operating pension costs 0.3 % 1.1% 1.0%Tax effect of costs related to unsolicited Emerson proposals 0.1 % —% —%Tax effect of change in fair value of investments 1 (0.4)% —% —%Effect of deemed repatriation of foreign earnings due to the Tax Act 2 (29.8)% —% —%Effect of net deferred tax asset revaluation due to the Tax Act 2 (7.9)% —% —%Effect of withholding taxes on previously taxed foreign earnings due to the Tax Act 2 (2.8)% —% —%
Adjusted Effective Tax Rate 19.3 % 21.5% 23.6%
1 Includes gain on investments and valuation adjustment pending registration of PTC Shares and the related tax effects.2 The Tax Act may require further adjustments as additional guidance from the U.S. Department of Treasury is provided, the Company’s assumptions change, oras further information and interpretations become available. Refer to Note 14 in the Financial Statements for further information.
24
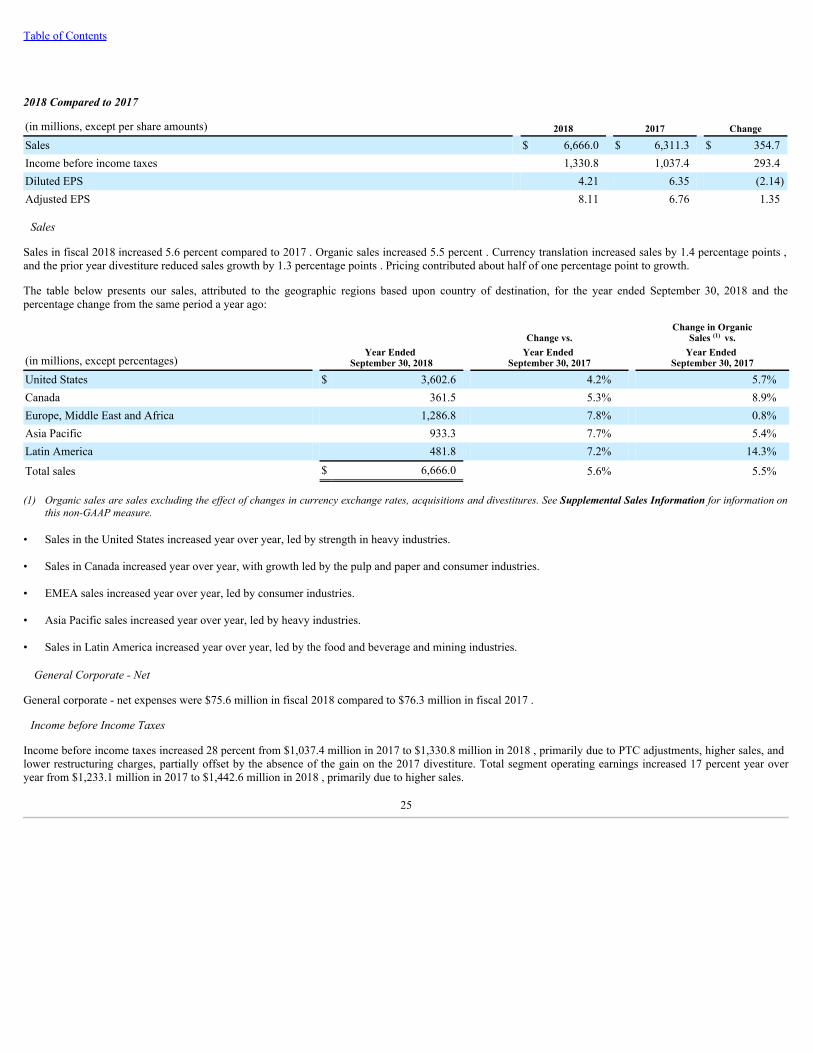
Table of Contents
2018 Compared to 2017
(in millions, except per share amounts) 2018 2017 Change
Sales $ 6,666.0 $ 6,311.3 $ 354.7Income before income taxes 1,330.8 1,037.4 293.4Diluted EPS 4.21 6.35 (2.14)Adjusted EPS 8.11 6.76 1.35
Sales
Sales in fiscal 2018 increased 5.6 percent compared to 2017 . Organic sales increased 5.5 percent . Currency translation increased sales by 1.4 percentage points ,and the prior year divestiture reduced sales growth by 1.3 percentage points . Pricing contributed about half of one percentage point to growth.
The table below presents our sales, attributed to the geographic regions based upon country of destination, for the year ended September 30, 2018 and thepercentage change from the same period a year ago:
Change vs. Change in Organic
Sales (1) vs.
(in millions, except percentages) Year Ended
September 30, 2018 Year Ended
September 30, 2017 Year Ended
September 30, 2017
United States $ 3,602.6 4.2% 5.7%Canada 361.5 5.3% 8.9%Europe, Middle East and Africa 1,286.8 7.8% 0.8%Asia Pacific 933.3 7.7% 5.4%Latin America 481.8 7.2% 14.3%
Total sales $ 6,666.0 5.6% 5.5%
(1) Organicsalesaresalesexcludingtheeffectofchangesincurrencyexchangerates,acquisitionsanddivestitures.SeeSupplemental Sales Information forinformationonthisnon-GAAPmeasure.
• Sales in the United States increased year over year, led by strength in heavy industries.
• Sales in Canada increased year over year, with growth led by the pulp and paper and consumer industries.
• EMEA sales increased year over year, led by consumer industries.
• Asia Pacific sales increased year over year, led by heavy industries.
• Sales in Latin America increased year over year, led by the food and beverage and mining industries.
GeneralCorporate-Net
General corporate - net expenses were $75.6 million in fiscal 2018 compared to $76.3 million in fiscal 2017 .
IncomebeforeIncomeTaxes
Income before income taxes increased 28 percent from $1,037.4 million in 2017 to $1,330.8 million in 2018 , primarily due to PTC adjustments, higher sales, andlower restructuring charges, partially offset by the absence of the gain on the 2017 divestiture. Total segment operating earnings increased 17 percent year overyear from $1,233.1 million in 2017 to $1,442.6 million in 2018 , primarily due to higher sales.
25
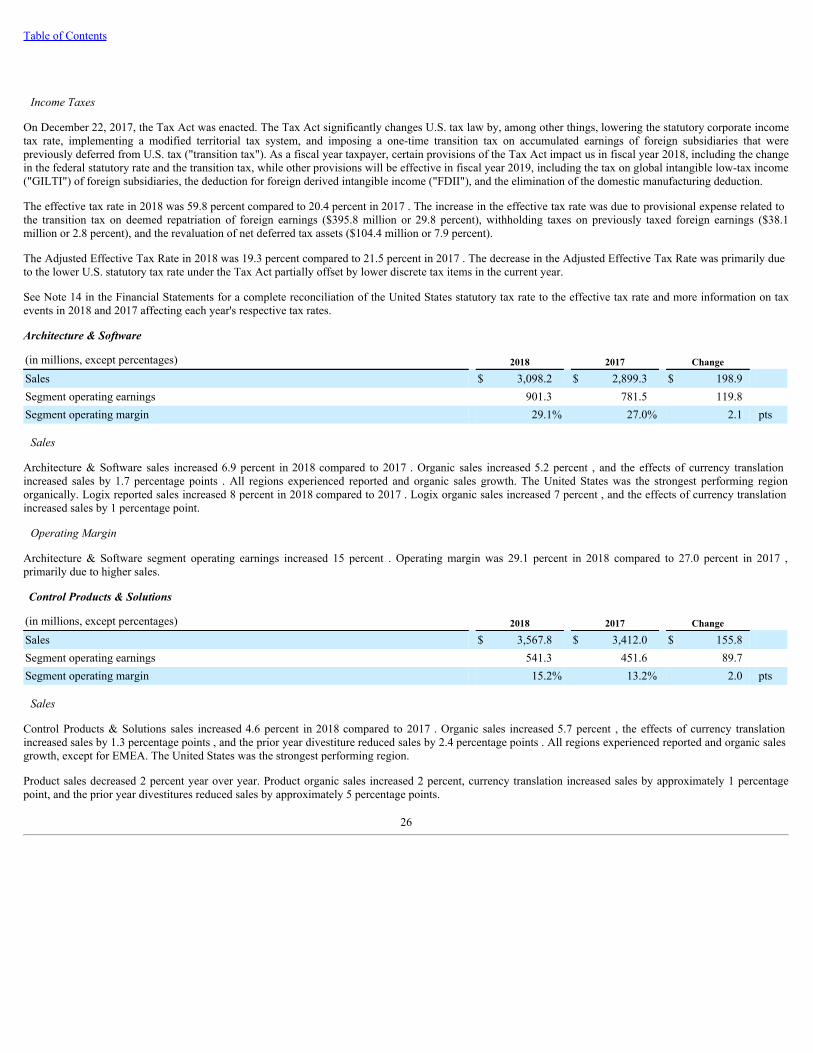
Table of Contents
IncomeTaxes
On December 22, 2017, the Tax Act was enacted. The Tax Act significantly changes U.S. tax law by, among other things, lowering the statutory corporate incometax rate, implementing a modified territorial tax system, and imposing a one-time transition tax on accumulated earnings of foreign subsidiaries that werepreviously deferred from U.S. tax ("transition tax"). As a fiscal year taxpayer, certain provisions of the Tax Act impact us in fiscal year 2018, including the changein the federal statutory rate and the transition tax, while other provisions will be effective in fiscal year 2019, including the tax on global intangible low-tax income("GILTI") of foreign subsidiaries, the deduction for foreign derived intangible income ("FDII"), and the elimination of the domestic manufacturing deduction.
The effective tax rate in 2018 was 59.8 percent compared to 20.4 percent in 2017 . The increase in the effective tax rate was due to provisional expense related tothe transition tax on deemed repatriation of foreign earnings ($395.8 million or 29.8 percent), withholding taxes on previously taxed foreign earnings ($38.1million or 2.8 percent), and the revaluation of net deferred tax assets ($104.4 million or 7.9 percent).
The Adjusted Effective Tax Rate in 2018 was 19.3 percent compared to 21.5 percent in 2017 . The decrease in the Adjusted Effective Tax Rate was primarily dueto the lower U.S. statutory tax rate under the Tax Act partially offset by lower discrete tax items in the current year.
See Note 14 in the Financial Statements for a complete reconciliation of the United States statutory tax rate to the effective tax rate and more information on taxevents in 2018 and 2017 affecting each year's respective tax rates.
Architecture & Software
(in millions, except percentages) 2018 2017 Change Sales $ 3,098.2 $ 2,899.3 $ 198.9 Segment operating earnings 901.3 781.5 119.8 Segment operating margin 29.1% 27.0% 2.1 pts
Sales
Architecture & Software sales increased 6.9 percent in 2018 compared to 2017 . Organic sales increased 5.2 percent , and the effects of currency translationincreased sales by 1.7 percentage points . All regions experienced reported and organic sales growth. The United States was the strongest performing regionorganically. Logix reported sales increased 8 percent in 2018 compared to 2017 . Logix organic sales increased 7 percent , and the effects of currency translationincreased sales by 1 percentage point.
OperatingMargin
Architecture & Software segment operating earnings increased 15 percent . Operating margin was 29.1 percent in 2018 compared to 27.0 percent in 2017 ,primarily due to higher sales.
Control Products & Solutions
(in millions, except percentages) 2018 2017 Change Sales $ 3,567.8 $ 3,412.0 $ 155.8 Segment operating earnings 541.3 451.6 89.7 Segment operating margin 15.2% 13.2% 2.0 pts
Sales
Control Products & Solutions sales increased 4.6 percent in 2018 compared to 2017 . Organic sales increased 5.7 percent , the effects of currency translationincreased sales by 1.3 percentage points , and the prior year divestiture reduced sales by 2.4 percentage points . All regions experienced reported and organic salesgrowth, except for EMEA. The United States was the strongest performing region.
Product sales decreased 2 percent year over year. Product organic sales increased 2 percent, currency translation increased sales by approximately 1 percentagepoint, and the prior year divestitures reduced sales by approximately 5 percentage points.
26
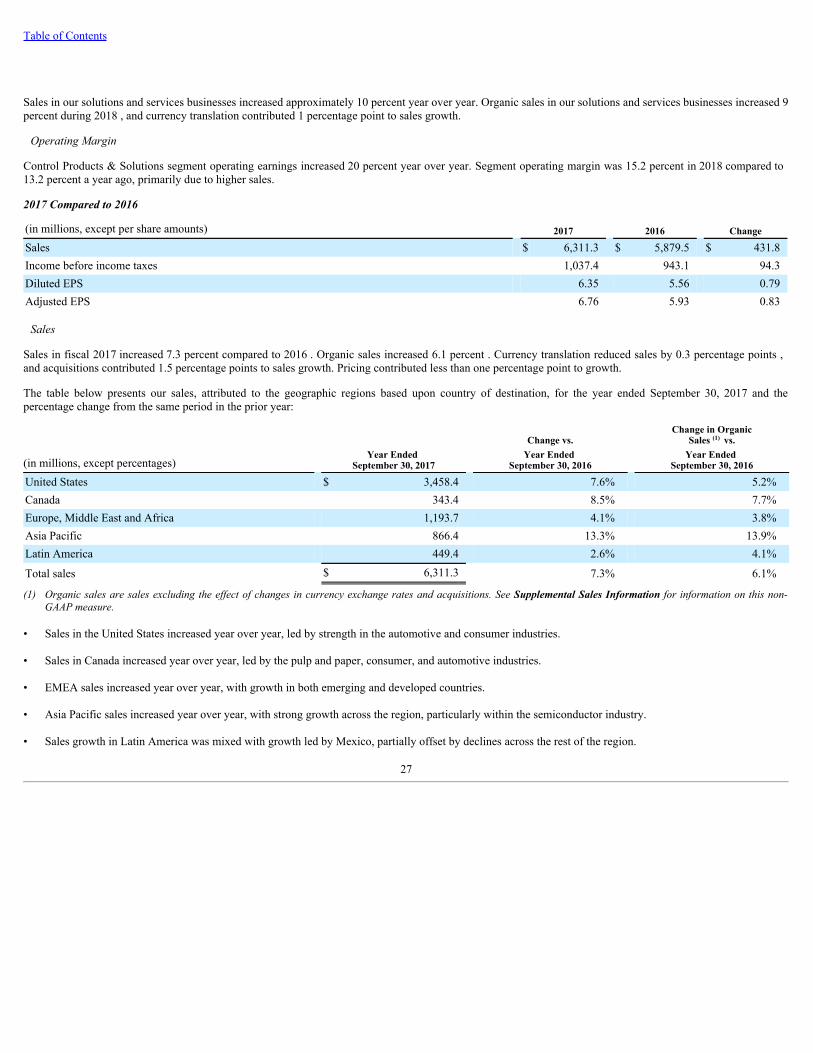
Table of Contents
Sales in our solutions and services businesses increased approximately 10 percent year over year. Organic sales in our solutions and services businesses increased 9percent during 2018 , and currency translation contributed 1 percentage point to sales growth.
OperatingMargin
Control Products & Solutions segment operating earnings increased 20 percent year over year. Segment operating margin was 15.2 percent in 2018 compared to13.2 percent a year ago, primarily due to higher sales.
2017 Compared to 2016
(in millions, except per share amounts) 2017 2016 Change
Sales $ 6,311.3 $ 5,879.5 $ 431.8Income before income taxes 1,037.4 943.1 94.3Diluted EPS 6.35 5.56 0.79Adjusted EPS 6.76 5.93 0.83
Sales
Sales in fiscal 2017 increased 7.3 percent compared to 2016 . Organic sales increased 6.1 percent . Currency translation reduced sales by 0.3 percentage points ,and acquisitions contributed 1.5 percentage points to sales growth. Pricing contributed less than one percentage point to growth.
The table below presents our sales, attributed to the geographic regions based upon country of destination, for the year ended September 30, 2017 and thepercentage change from the same period in the prior year:
Change vs. Change in Organic
Sales (1) vs.
(in millions, except percentages) Year Ended
September 30, 2017 Year Ended
September 30, 2016 Year Ended
September 30, 2016
United States $ 3,458.4 7.6% 5.2%Canada 343.4 8.5% 7.7%Europe, Middle East and Africa 1,193.7 4.1% 3.8%Asia Pacific 866.4 13.3% 13.9%Latin America 449.4 2.6% 4.1%
Total sales $ 6,311.3 7.3% 6.1%
(1) Organicsalesaresalesexcludingtheeffect of changesincurrencyexchangeratesandacquisitions. SeeSupplemental Sales Information forinformationonthisnon-GAAPmeasure.
• Sales in the United States increased year over year, led by strength in the automotive and consumer industries.
• Sales in Canada increased year over year, led by the pulp and paper, consumer, and automotive industries.
• EMEA sales increased year over year, with growth in both emerging and developed countries.
• Asia Pacific sales increased year over year, with strong growth across the region, particularly within the semiconductor industry.
• Sales growth in Latin America was mixed with growth led by Mexico, partially offset by declines across the rest of the region.
27
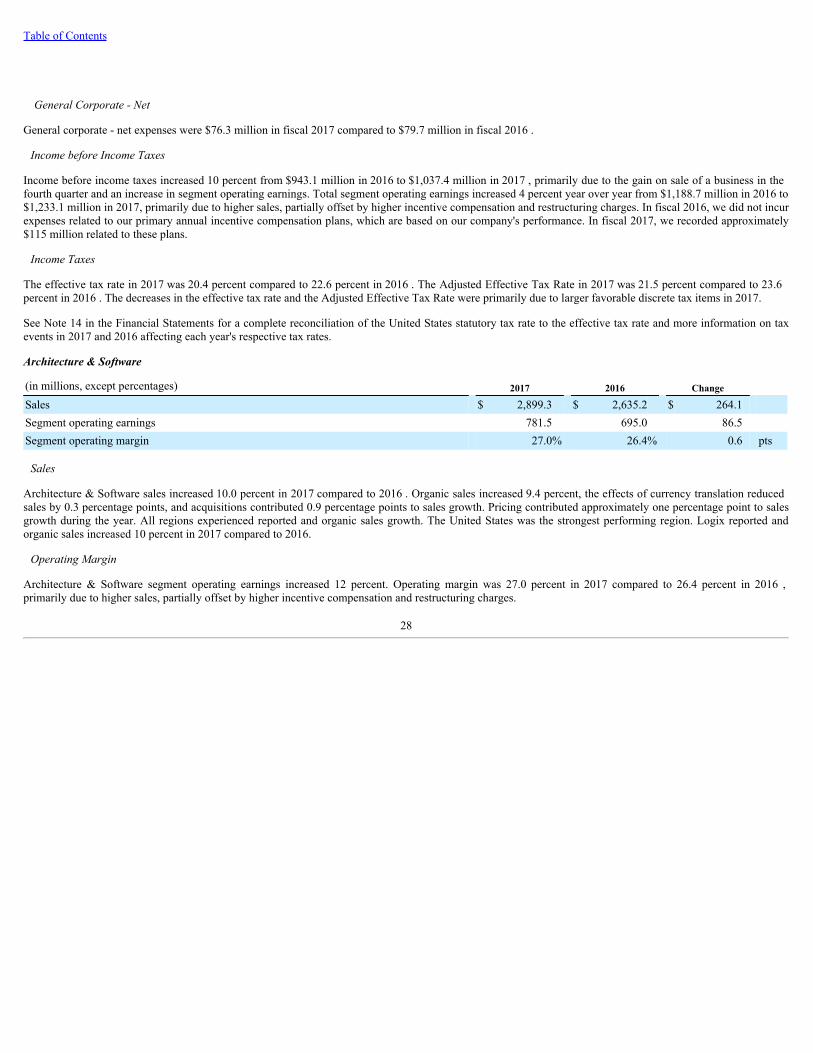
Table of Contents
GeneralCorporate-Net
General corporate - net expenses were $76.3 million in fiscal 2017 compared to $79.7 million in fiscal 2016 .
IncomebeforeIncomeTaxes
Income before income taxes increased 10 percent from $943.1 million in 2016 to $1,037.4 million in 2017 , primarily due to the gain on sale of a business in thefourth quarter and an increase in segment operating earnings. Total segment operating earnings increased 4 percent year over year from $1,188.7 million in 2016 to$1,233.1 million in 2017, primarily due to higher sales, partially offset by higher incentive compensation and restructuring charges. In fiscal 2016, we did not incurexpenses related to our primary annual incentive compensation plans, which are based on our company's performance. In fiscal 2017, we recorded approximately$115 million related to these plans.
IncomeTaxes
The effective tax rate in 2017 was 20.4 percent compared to 22.6 percent in 2016 . The Adjusted Effective Tax Rate in 2017 was 21.5 percent compared to 23.6percent in 2016 . The decreases in the effective tax rate and the Adjusted Effective Tax Rate were primarily due to larger favorable discrete tax items in 2017.
See Note 14 in the Financial Statements for a complete reconciliation of the United States statutory tax rate to the effective tax rate and more information on taxevents in 2017 and 2016 affecting each year's respective tax rates.
Architecture & Software
(in millions, except percentages) 2017 2016 Change Sales $ 2,899.3 $ 2,635.2 $ 264.1 Segment operating earnings 781.5 695.0 86.5 Segment operating margin 27.0% 26.4% 0.6 pts
Sales
Architecture & Software sales increased 10.0 percent in 2017 compared to 2016 . Organic sales increased 9.4 percent, the effects of currency translation reducedsales by 0.3 percentage points, and acquisitions contributed 0.9 percentage points to sales growth. Pricing contributed approximately one percentage point to salesgrowth during the year. All regions experienced reported and organic sales growth. The United States was the strongest performing region. Logix reported andorganic sales increased 10 percent in 2017 compared to 2016.
OperatingMargin
Architecture & Software segment operating earnings increased 12 percent. Operating margin was 27.0 percent in 2017 compared to 26.4 percent in 2016 ,primarily due to higher sales, partially offset by higher incentive compensation and restructuring charges.
28
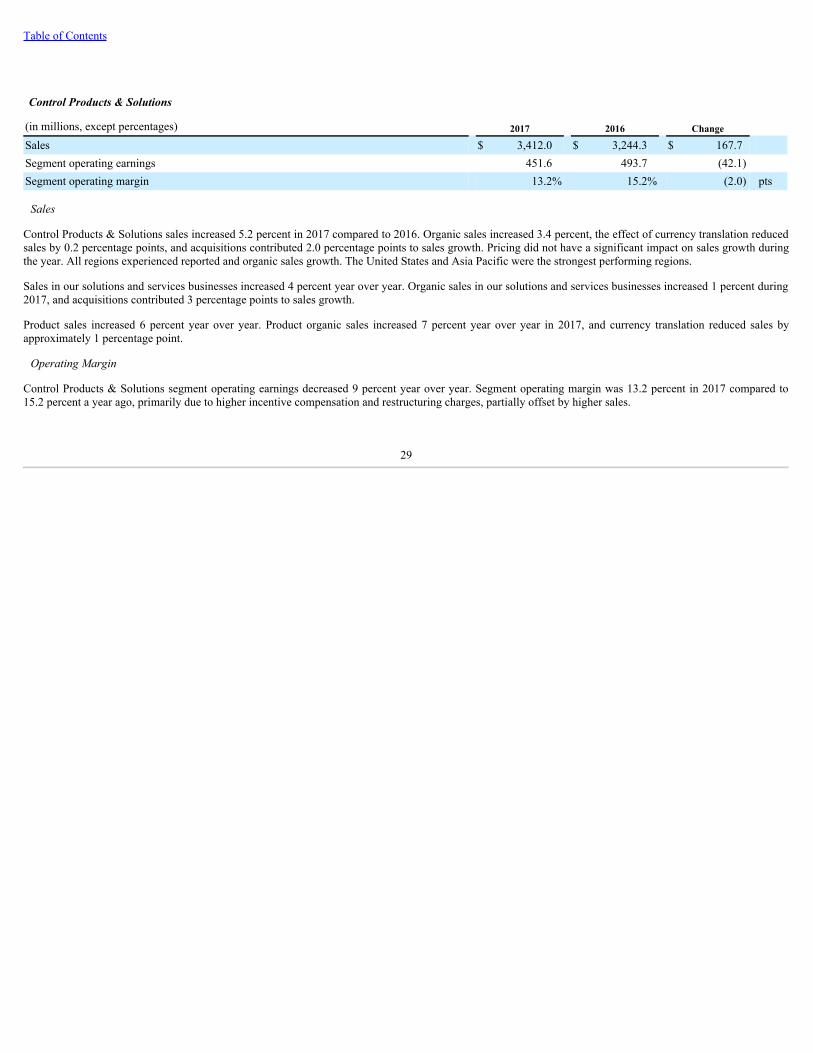
Table of Contents
Control Products & Solutions
(in millions, except percentages) 2017 2016 Change Sales $ 3,412.0 $ 3,244.3 $ 167.7 Segment operating earnings 451.6 493.7 (42.1) Segment operating margin 13.2% 15.2% (2.0) pts
Sales
Control Products & Solutions sales increased 5.2 percent in 2017 compared to 2016. Organic sales increased 3.4 percent, the effect of currency translation reducedsales by 0.2 percentage points, and acquisitions contributed 2.0 percentage points to sales growth. Pricing did not have a significant impact on sales growth duringthe year. All regions experienced reported and organic sales growth. The United States and Asia Pacific were the strongest performing regions.
Sales in our solutions and services businesses increased 4 percent year over year. Organic sales in our solutions and services businesses increased 1 percent during2017, and acquisitions contributed 3 percentage points to sales growth.
Product sales increased 6 percent year over year. Product organic sales increased 7 percent year over year in 2017, and currency translation reduced sales byapproximately 1 percentage point.
OperatingMargin
Control Products & Solutions segment operating earnings decreased 9 percent year over year. Segment operating margin was 13.2 percent in 2017 compared to15.2 percent a year ago, primarily due to higher incentive compensation and restructuring charges, partially offset by higher sales.
29
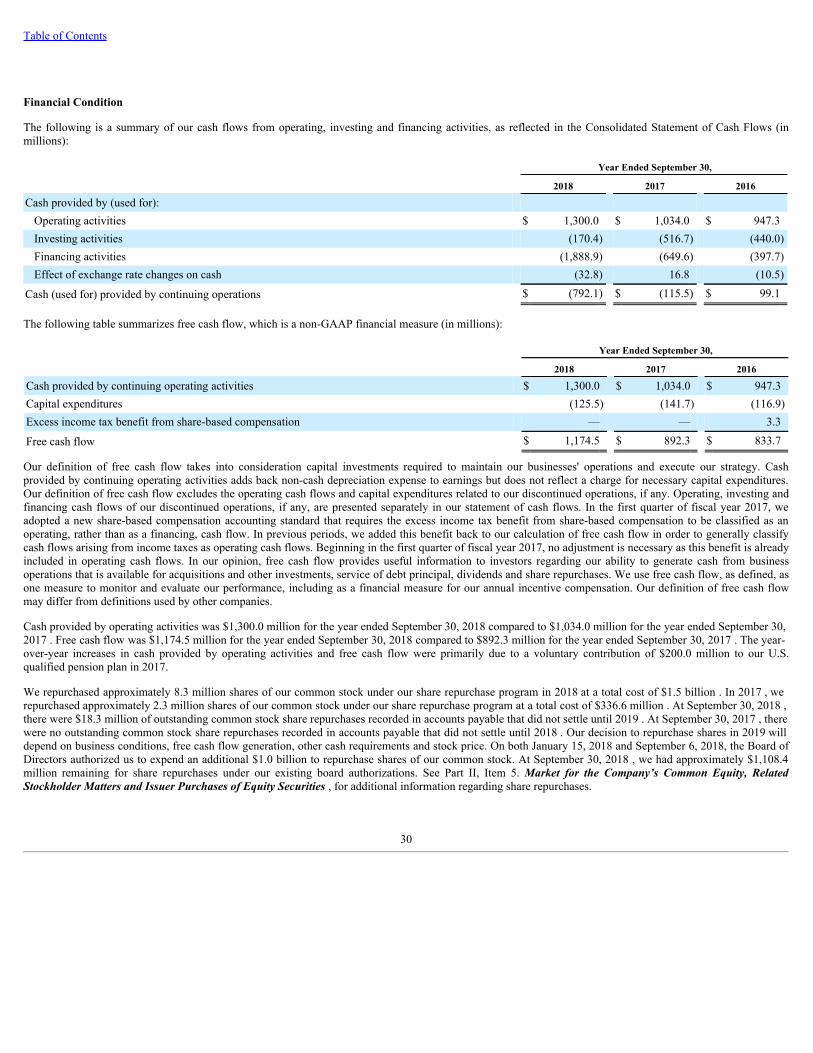
Table of Contents
Financial Condition
The following is a summary of our cash flows from operating, investing and financing activities, as reflected in the Consolidated Statement of Cash Flows (inmillions):
Year Ended September 30,
2018 2017 2016
Cash provided by (used for): Operating activities $ 1,300.0 $ 1,034.0 $ 947.3Investing activities (170.4) (516.7) (440.0)Financing activities (1,888.9) (649.6) (397.7)Effect of exchange rate changes on cash (32.8) 16.8 (10.5)
Cash (used for) provided by continuing operations $ (792.1) $ (115.5) $ 99.1
The following table summarizes free cash flow, which is a non-GAAP financial measure (in millions):
Year Ended September 30,
2018 2017 2016
Cash provided by continuing operating activities $ 1,300.0 $ 1,034.0 $ 947.3Capital expenditures (125.5) (141.7) (116.9)Excess income tax benefit from share-based compensation — — 3.3
Free cash flow $ 1,174.5 $ 892.3 $ 833.7
Our definition of free cash flow takes into consideration capital investments required to maintain our businesses' operations and execute our strategy. Cashprovided by continuing operating activities adds back non-cash depreciation expense to earnings but does not reflect a charge for necessary capital expenditures.Our definition of free cash flow excludes the operating cash flows and capital expenditures related to our discontinued operations, if any. Operating, investing andfinancing cash flows of our discontinued operations, if any, are presented separately in our statement of cash flows. In the first quarter of fiscal year 2017, weadopted a new share-based compensation accounting standard that requires the excess income tax benefit from share-based compensation to be classified as anoperating, rather than as a financing, cash flow. In previous periods, we added this benefit back to our calculation of free cash flow in order to generally classifycash flows arising from income taxes as operating cash flows. Beginning in the first quarter of fiscal year 2017, no adjustment is necessary as this benefit is alreadyincluded in operating cash flows. In our opinion, free cash flow provides useful information to investors regarding our ability to generate cash from businessoperations that is available for acquisitions and other investments, service of debt principal, dividends and share repurchases. We use free cash flow, as defined, asone measure to monitor and evaluate our performance, including as a financial measure for our annual incentive compensation. Our definition of free cash flowmay differ from definitions used by other companies.
Cash provided by operating activities was $1,300.0 million for the year ended September 30, 2018 compared to $1,034.0 million for the year ended September 30,2017 . Free cash flow was $1,174.5 million for the year ended September 30, 2018 compared to $892.3 million for the year ended September 30, 2017 . The year-over-year increases in cash provided by operating activities and free cash flow were primarily due to a voluntary contribution of $200.0 million to our U.S.qualified pension plan in 2017.
We repurchased approximately 8.3 million shares of our common stock under our share repurchase program in 2018 at a total cost of $1.5 billion . In 2017 , werepurchased approximately 2.3 million shares of our common stock under our share repurchase program at a total cost of $336.6 million . At September 30, 2018 ,there were $18.3 million of outstanding common stock share repurchases recorded in accounts payable that did not settle until 2019 . At September 30, 2017 , therewere no outstanding common stock share repurchases recorded in accounts payable that did not settle until 2018 . Our decision to repurchase shares in 2019 willdepend on business conditions, free cash flow generation, other cash requirements and stock price. On both January 15, 2018 and September 6, 2018, the Board ofDirectors authorized us to expend an additional $1.0 billion to repurchase shares of our common stock. At September 30, 2018 , we had approximately $1,108.4million remaining for share repurchases under our existing board authorizations. See Part II, Item 5. Market for the Company’s Common Equity, RelatedStockholder Matters and Issuer Purchases of Equity Securities , for additional information regarding share repurchases.
30
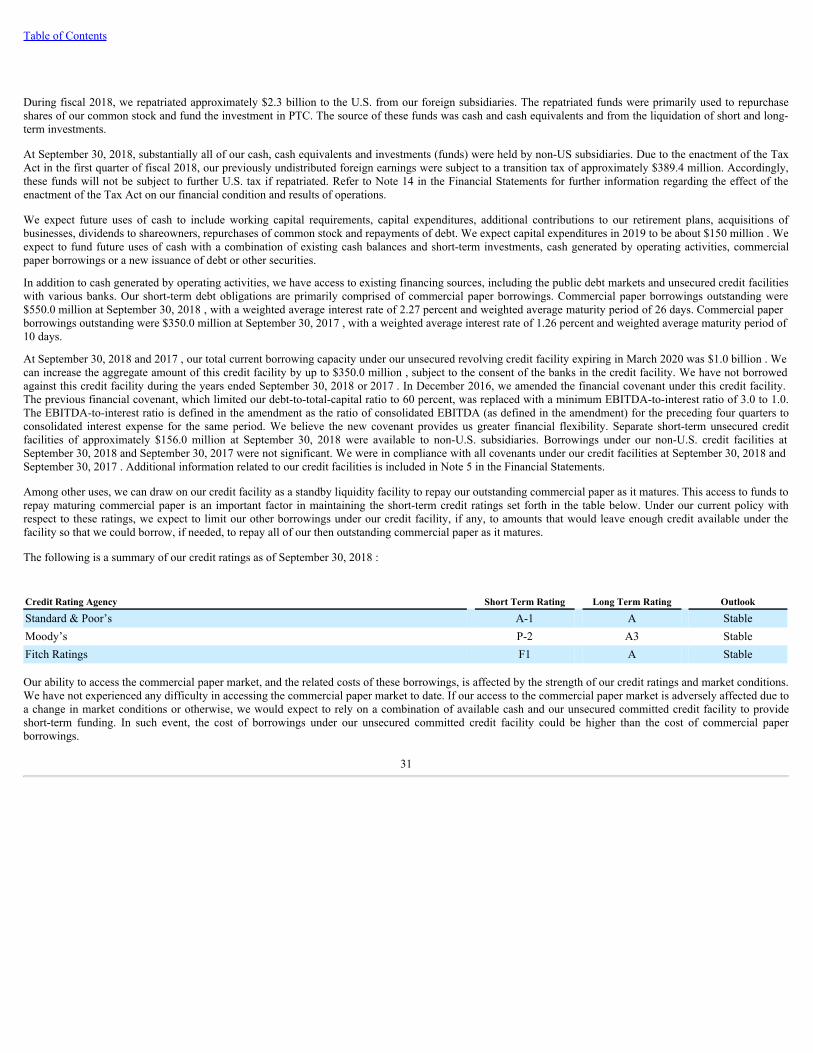
Table of Contents
During fiscal 2018, we repatriated approximately $2.3 billion to the U.S. from our foreign subsidiaries. The repatriated funds were primarily used to repurchaseshares of our common stock and fund the investment in PTC. The source of these funds was cash and cash equivalents and from the liquidation of short and long-term investments.
At September 30, 2018, substantially all of our cash, cash equivalents and investments (funds) were held by non-US subsidiaries. Due to the enactment of the TaxAct in the first quarter of fiscal 2018, our previously undistributed foreign earnings were subject to a transition tax of approximately $389.4 million. Accordingly,these funds will not be subject to further U.S. tax if repatriated. Refer to Note 14 in the Financial Statements for further information regarding the effect of theenactment of the Tax Act on our financial condition and results of operations.
We expect future uses of cash to include working capital requirements, capital expenditures, additional contributions to our retirement plans, acquisitions ofbusinesses, dividends to shareowners, repurchases of common stock and repayments of debt. We expect capital expenditures in 2019 to be about $150 million . Weexpect to fund future uses of cash with a combination of existing cash balances and short-term investments, cash generated by operating activities, commercialpaper borrowings or a new issuance of debt or other securities.
In addition to cash generated by operating activities, we have access to existing financing sources, including the public debt markets and unsecured credit facilitieswith various banks. Our short-term debt obligations are primarily comprised of commercial paper borrowings. Commercial paper borrowings outstanding were$550.0 million at September 30, 2018 , with a weighted average interest rate of 2.27 percent and weighted average maturity period of 26 days. Commercial paperborrowings outstanding were $350.0 million at September 30, 2017 , with a weighted average interest rate of 1.26 percent and weighted average maturity period of10 days.
At September 30, 2018 and 2017 , our total current borrowing capacity under our unsecured revolving credit facility expiring in March 2020 was $1.0 billion . Wecan increase the aggregate amount of this credit facility by up to $350.0 million , subject to the consent of the banks in the credit facility. We have not borrowedagainst this credit facility during the years ended September 30, 2018 or 2017 . In December 2016, we amended the financial covenant under this credit facility.The previous financial covenant, which limited our debt-to-total-capital ratio to 60 percent, was replaced with a minimum EBITDA-to-interest ratio of 3.0 to 1.0.The EBITDA-to-interest ratio is defined in the amendment as the ratio of consolidated EBITDA (as defined in the amendment) for the preceding four quarters toconsolidated interest expense for the same period. We believe the new covenant provides us greater financial flexibility. Separate short-term unsecured creditfacilities of approximately $156.0 million at September 30, 2018 were available to non-U.S. subsidiaries. Borrowings under our non-U.S. credit facilities atSeptember 30, 2018 and September 30, 2017 were not significant. We were in compliance with all covenants under our credit facilities at September 30, 2018 andSeptember 30, 2017 . Additional information related to our credit facilities is included in Note 5 in the Financial Statements.
Among other uses, we can draw on our credit facility as a standby liquidity facility to repay our outstanding commercial paper as it matures. This access to funds torepay maturing commercial paper is an important factor in maintaining the short-term credit ratings set forth in the table below. Under our current policy withrespect to these ratings, we expect to limit our other borrowings under our credit facility, if any, to amounts that would leave enough credit available under thefacility so that we could borrow, if needed, to repay all of our then outstanding commercial paper as it matures.
The following is a summary of our credit ratings as of September 30, 2018 :
Credit Rating Agency Short Term Rating Long Term Rating Outlook
Standard & Poor’s A-1 A StableMoody’s P-2 A3 StableFitch Ratings F1 A Stable
Our ability to access the commercial paper market, and the related costs of these borrowings, is affected by the strength of our credit ratings and market conditions.We have not experienced any difficulty in accessing the commercial paper market to date. If our access to the commercial paper market is adversely affected due toa change in market conditions or otherwise, we would expect to rely on a combination of available cash and our unsecured committed credit facility to provideshort-term funding. In such event, the cost of borrowings under our unsecured committed credit facility could be higher than the cost of commercial paperborrowings.
31
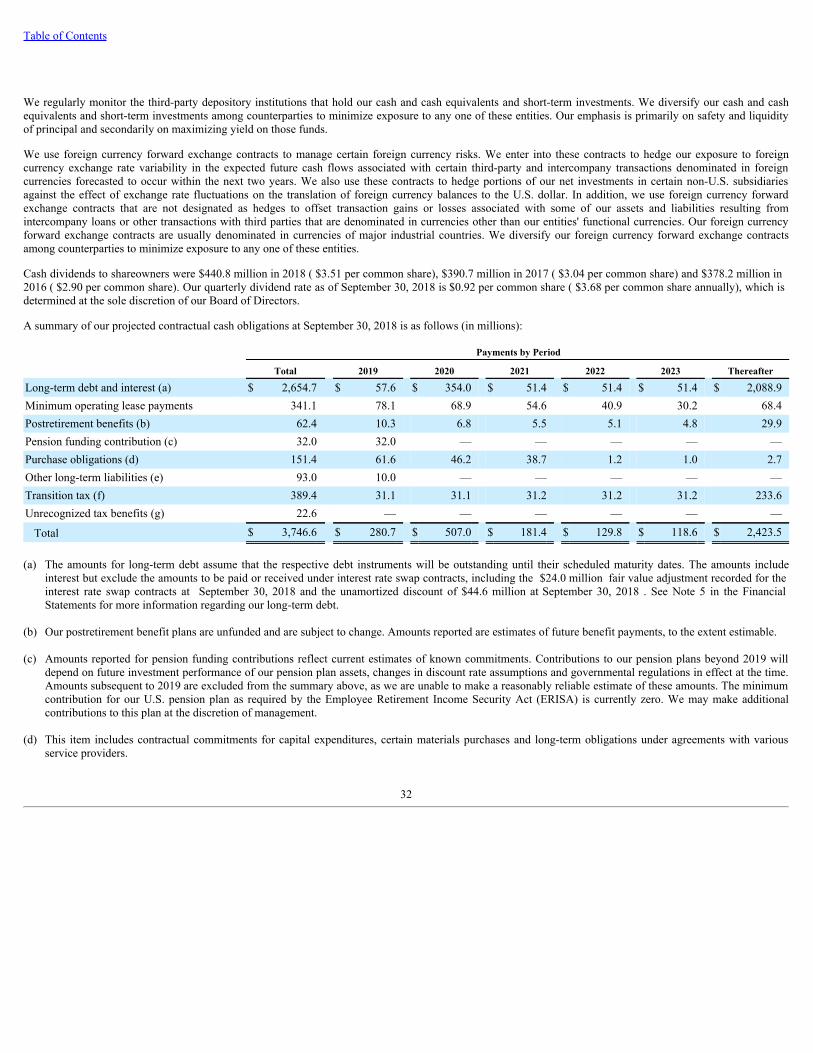
Table of Contents
We regularly monitor the third-party depository institutions that hold our cash and cash equivalents and short-term investments. We diversify our cash and cashequivalents and short-term investments among counterparties to minimize exposure to any one of these entities. Our emphasis is primarily on safety and liquidityof principal and secondarily on maximizing yield on those funds.
We use foreign currency forward exchange contracts to manage certain foreign currency risks. We enter into these contracts to hedge our exposure to foreigncurrency exchange rate variability in the expected future cash flows associated with certain third-party and intercompany transactions denominated in foreigncurrencies forecasted to occur within the next two years. We also use these contracts to hedge portions of our net investments in certain non-U.S. subsidiariesagainst the effect of exchange rate fluctuations on the translation of foreign currency balances to the U.S. dollar. In addition, we use foreign currency forwardexchange contracts that are not designated as hedges to offset transaction gains or losses associated with some of our assets and liabilities resulting fromintercompany loans or other transactions with third parties that are denominated in currencies other than our entities' functional currencies. Our foreign currencyforward exchange contracts are usually denominated in currencies of major industrial countries. We diversify our foreign currency forward exchange contractsamong counterparties to minimize exposure to any one of these entities.
Cash dividends to shareowners were $440.8 million in 2018 ( $3.51 per common share), $390.7 million in 2017 ( $3.04 per common share) and $378.2 million in2016 ( $2.90 per common share). Our quarterly dividend rate as of September 30, 2018 is $0.92 per common share ( $3.68 per common share annually), which isdetermined at the sole discretion of our Board of Directors.
A summary of our projected contractual cash obligations at September 30, 2018 is as follows (in millions):
Payments by Period
Total 2019 2020 2021 2022 2023 Thereafter
Long-term debt and interest (a) $ 2,654.7 $ 57.6 $ 354.0 $ 51.4 $ 51.4 $ 51.4 $ 2,088.9Minimum operating lease payments 341.1 78.1 68.9 54.6 40.9 30.2 68.4Postretirement benefits (b) 62.4 10.3 6.8 5.5 5.1 4.8 29.9Pension funding contribution (c) 32.0 32.0 — — — — —Purchase obligations (d) 151.4 61.6 46.2 38.7 1.2 1.0 2.7Other long-term liabilities (e) 93.0 10.0 — — — — —Transition tax (f) 389.4 31.1 31.1 31.2 31.2 31.2 233.6Unrecognized tax benefits (g) 22.6 — — — — — —
Total $ 3,746.6 $ 280.7 $ 507.0 $ 181.4 $ 129.8 $ 118.6 $ 2,423.5
(a) The amounts for long-term debt assume that the respective debt instruments will be outstanding until their scheduled maturity dates. The amounts includeinterest but exclude the amounts to be paid or received under interest rate swap contracts, including the $24.0 million fair value adjustment recorded for theinterest rate swap contracts at September 30, 2018 and the unamortized discount of $44.6 million at September 30, 2018 . See Note 5 in the FinancialStatements for more information regarding our long-term debt.
(b) Our postretirement benefit plans are unfunded and are subject to change. Amounts reported are estimates of future benefit payments, to the extent estimable.
(c) Amounts reported for pension funding contributions reflect current estimates of known commitments. Contributions to our pension plans beyond 2019 willdepend on future investment performance of our pension plan assets, changes in discount rate assumptions and governmental regulations in effect at the time.Amounts subsequent to 2019 are excluded from the summary above, as we are unable to make a reasonably reliable estimate of these amounts. The minimumcontribution for our U.S. pension plan as required by the Employee Retirement Income Security Act (ERISA) is currently zero. We may make additionalcontributions to this plan at the discretion of management.
(d) This item includes contractual commitments for capital expenditures, certain materials purchases and long-term obligations under agreements with variousservice providers.
32
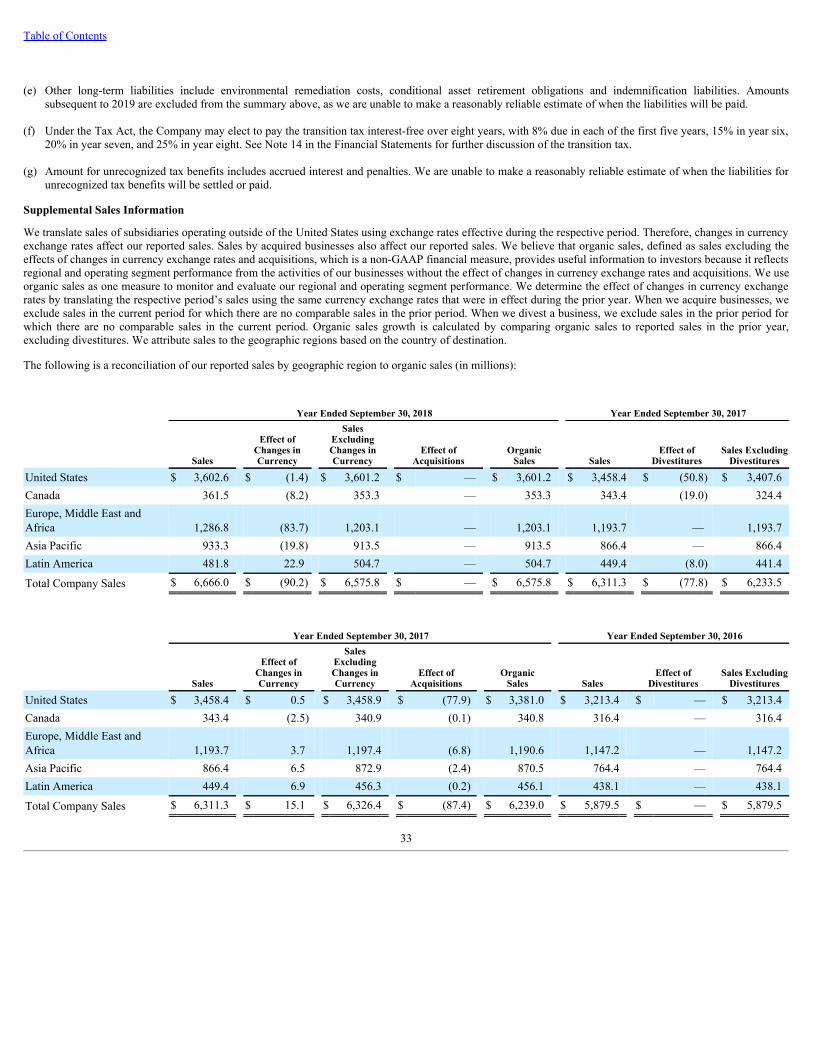
Table of Contents
(e) Other long-term liabilities include environmental remediation costs, conditional asset retirement obligations and indemnification liabilities. Amountssubsequent to 2019 are excluded from the summary above, as we are unable to make a reasonably reliable estimate of when the liabilities will be paid.
(f) Under the Tax Act, the Company may elect to pay the transition tax interest-free over eight years, with 8% due in each of the first five years, 15% in year six,20% in year seven, and 25% in year eight. See Note 14 in the Financial Statements for further discussion of the transition tax.
(g) Amount for unrecognized tax benefits includes accrued interest and penalties. We are unable to make a reasonably reliable estimate of when the liabilities forunrecognized tax benefits will be settled or paid.
Supplemental Sales Information
We translate sales of subsidiaries operating outside of the United States using exchange rates effective during the respective period. Therefore, changes in currencyexchange rates affect our reported sales. Sales by acquired businesses also affect our reported sales. We believe that organic sales, defined as sales excluding theeffects of changes in currency exchange rates and acquisitions, which is a non-GAAP financial measure, provides useful information to investors because it reflectsregional and operating segment performance from the activities of our businesses without the effect of changes in currency exchange rates and acquisitions. We useorganic sales as one measure to monitor and evaluate our regional and operating segment performance. We determine the effect of changes in currency exchangerates by translating the respective period’s sales using the same currency exchange rates that were in effect during the prior year. When we acquire businesses, weexclude sales in the current period for which there are no comparable sales in the prior period. When we divest a business, we exclude sales in the prior period forwhich there are no comparable sales in the current period. Organic sales growth is calculated by comparing organic sales to reported sales in the prior year,excluding divestitures. We attribute sales to the geographic regions based on the country of destination.
The following is a reconciliation of our reported sales by geographic region to organic sales (in millions):
Year Ended September 30, 2018 Year Ended September 30, 2017
Sales
Effect ofChanges inCurrency
SalesExcludingChanges inCurrency
Effect ofAcquisitions
OrganicSales Sales
Effect ofDivestitures
Sales ExcludingDivestitures
United States $ 3,602.6 $ (1.4) $ 3,601.2 $ — $ 3,601.2 $ 3,458.4 $ (50.8) $ 3,407.6Canada 361.5 (8.2) 353.3 — 353.3 343.4 (19.0) 324.4Europe, Middle East andAfrica 1,286.8 (83.7) 1,203.1 — 1,203.1 1,193.7 — 1,193.7Asia Pacific 933.3 (19.8) 913.5 — 913.5 866.4 — 866.4Latin America 481.8 22.9 504.7 — 504.7 449.4 (8.0) 441.4
Total Company Sales $ 6,666.0 $ (90.2) $ 6,575.8 $ — $ 6,575.8 $ 6,311.3 $ (77.8) $ 6,233.5
Year Ended September 30, 2017 Year Ended September 30, 2016
Sales
Effect ofChanges inCurrency
SalesExcludingChanges inCurrency
Effect ofAcquisitions
OrganicSales Sales
Effect ofDivestitures
Sales ExcludingDivestitures
United States $ 3,458.4 $ 0.5 $ 3,458.9 $ (77.9) $ 3,381.0 $ 3,213.4 $ — $ 3,213.4Canada 343.4 (2.5) 340.9 (0.1) 340.8 316.4 — 316.4Europe, Middle East andAfrica 1,193.7 3.7 1,197.4 (6.8) 1,190.6 1,147.2 — 1,147.2Asia Pacific 866.4 6.5 872.9 (2.4) 870.5 764.4 — 764.4Latin America 449.4 6.9 456.3 (0.2) 456.1 438.1 — 438.1
Total Company Sales $ 6,311.3 $ 15.1 $ 6,326.4 $ (87.4) $ 6,239.0 $ 5,879.5 $ — $ 5,879.5
33
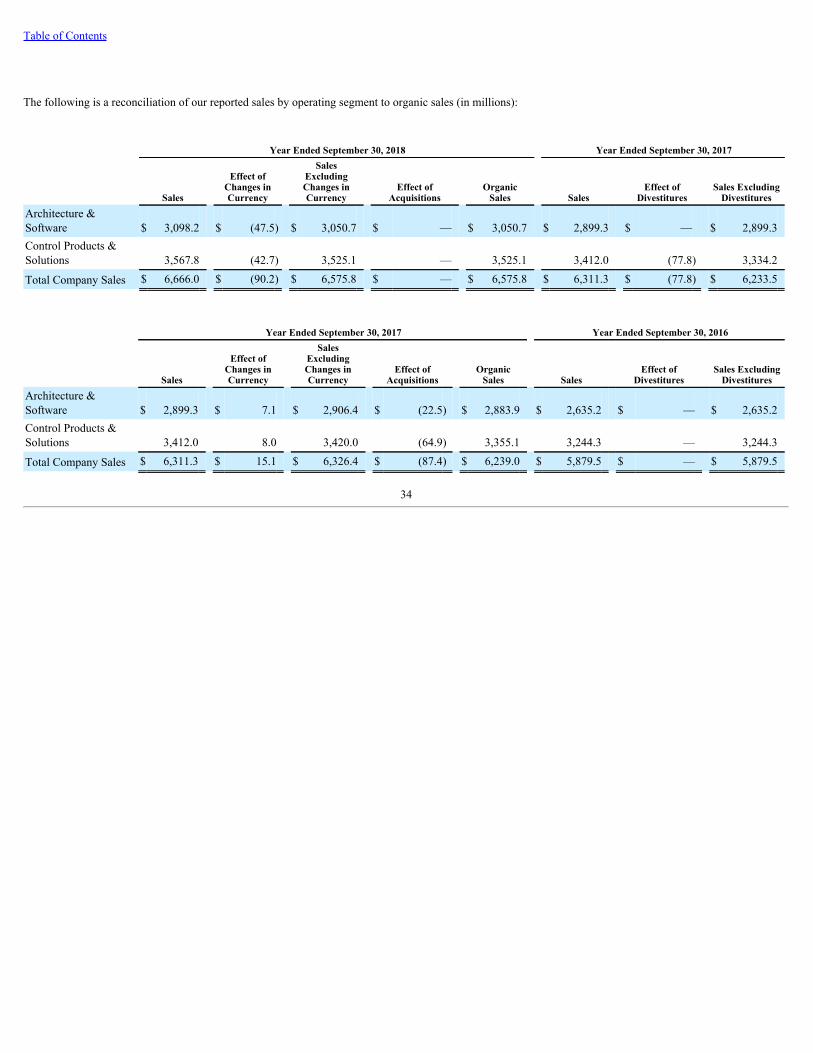
Table of Contents
The following is a reconciliation of our reported sales by operating segment to organic sales (in millions):
Year Ended September 30, 2018 Year Ended September 30, 2017
Sales
Effect ofChanges inCurrency
SalesExcludingChanges inCurrency
Effect ofAcquisitions
OrganicSales Sales
Effect ofDivestitures
Sales ExcludingDivestitures
Architecture &Software $ 3,098.2 $ (47.5) $ 3,050.7 $ — $ 3,050.7 $ 2,899.3 $ — $ 2,899.3Control Products &Solutions 3,567.8 (42.7) 3,525.1 — 3,525.1 3,412.0 (77.8) 3,334.2
Total Company Sales $ 6,666.0 $ (90.2) $ 6,575.8 $ — $ 6,575.8 $ 6,311.3 $ (77.8) $ 6,233.5
Year Ended September 30, 2017 Year Ended September 30, 2016
Sales
Effect ofChanges inCurrency
SalesExcludingChanges inCurrency
Effect ofAcquisitions
OrganicSales Sales
Effect ofDivestitures
Sales ExcludingDivestitures
Architecture &Software $ 2,899.3 $ 7.1 $ 2,906.4 $ (22.5) $ 2,883.9 $ 2,635.2 $ — $ 2,635.2Control Products &Solutions 3,412.0 8.0 3,420.0 (64.9) 3,355.1 3,244.3 — 3,244.3
Total Company Sales $ 6,311.3 $ 15.1 $ 6,326.4 $ (87.4) $ 6,239.0 $ 5,879.5 $ — $ 5,879.5
34
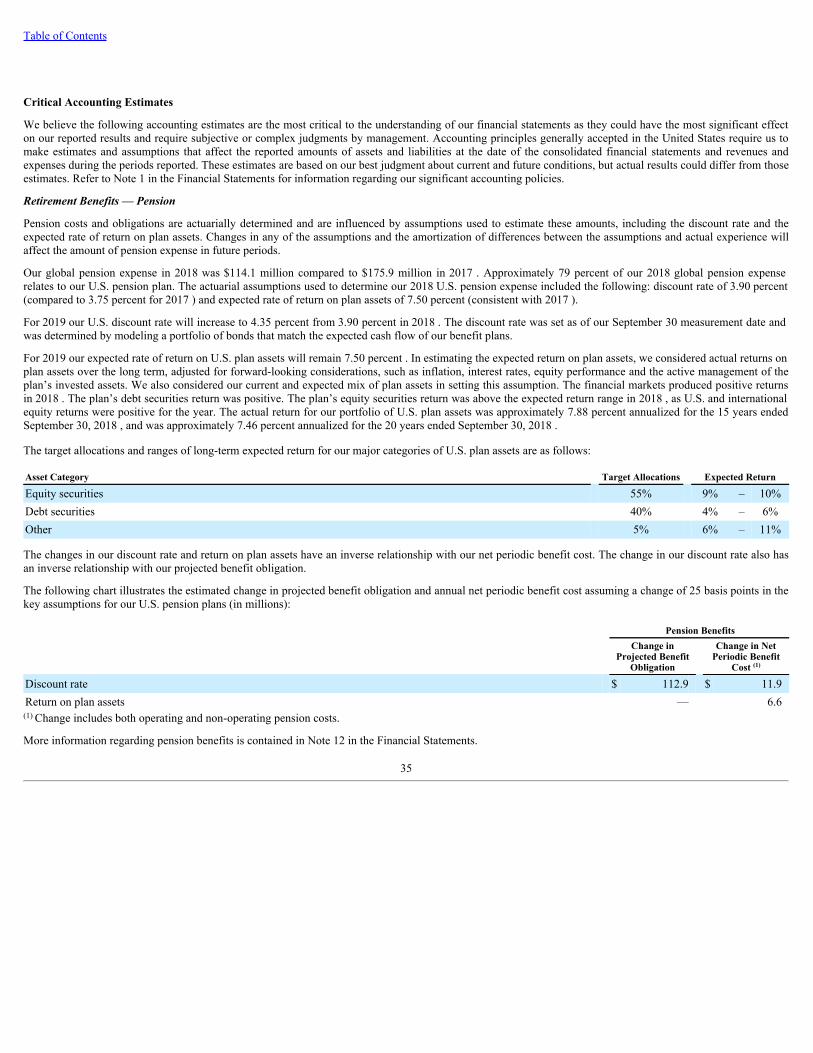
Table of Contents
Critical Accounting Estimates
We believe the following accounting estimates are the most critical to the understanding of our financial statements as they could have the most significant effecton our reported results and require subjective or complex judgments by management. Accounting principles generally accepted in the United States require us tomake estimates and assumptions that affect the reported amounts of assets and liabilities at the date of the consolidated financial statements and revenues andexpenses during the periods reported. These estimates are based on our best judgment about current and future conditions, but actual results could differ from thoseestimates. Refer to Note 1 in the Financial Statements for information regarding our significant accounting policies.
Retirement Benefits — Pension
Pension costs and obligations are actuarially determined and are influenced by assumptions used to estimate these amounts, including the discount rate and theexpected rate of return on plan assets. Changes in any of the assumptions and the amortization of differences between the assumptions and actual experience willaffect the amount of pension expense in future periods.
Our global pension expense in 2018 was $114.1 million compared to $175.9 million in 2017 . Approximately 79 percent of our 2018 global pension expenserelates to our U.S. pension plan. The actuarial assumptions used to determine our 2018 U.S. pension expense included the following: discount rate of 3.90 percent(compared to 3.75 percent for 2017 ) and expected rate of return on plan assets of 7.50 percent (consistent with 2017 ).
For 2019 our U.S. discount rate will increase to 4.35 percent from 3.90 percent in 2018 . The discount rate was set as of our September 30 measurement date andwas determined by modeling a portfolio of bonds that match the expected cash flow of our benefit plans.
For 2019 our expected rate of return on U.S. plan assets will remain 7.50 percent . In estimating the expected return on plan assets, we considered actual returns onplan assets over the long term, adjusted for forward-looking considerations, such as inflation, interest rates, equity performance and the active management of theplan’s invested assets. We also considered our current and expected mix of plan assets in setting this assumption. The financial markets produced positive returnsin 2018 . The plan’s debt securities return was positive. The plan’s equity securities return was above the expected return range in 2018 , as U.S. and internationalequity returns were positive for the year. The actual return for our portfolio of U.S. plan assets was approximately 7.88 percent annualized for the 15 years endedSeptember 30, 2018 , and was approximately 7.46 percent annualized for the 20 years ended September 30, 2018 .
The target allocations and ranges of long-term expected return for our major categories of U.S. plan assets are as follows:
Asset Category Target Allocations Expected Return
Equity securities 55% 9% – 10%Debt securities 40% 4% – 6%Other 5% 6% – 11%
The changes in our discount rate and return on plan assets have an inverse relationship with our net periodic benefit cost. The change in our discount rate also hasan inverse relationship with our projected benefit obligation.
The following chart illustrates the estimated change in projected benefit obligation and annual net periodic benefit cost assuming a change of 25 basis points in thekey assumptions for our U.S. pension plans (in millions):
Pension Benefits
Change inProjected Benefit
Obligation
Change in NetPeriodic Benefit
Cost (1)
Discount rate $ 112.9 $ 11.9Return on plan assets — 6.6(1) Change includes both operating and non-operating pension costs.
More information regarding pension benefits is contained in Note 12 in the Financial Statements.
35
Table of Contents
Revenue Recognition — Customer Incentives
We offer various incentive programs that provide distributors and direct sale customers with cash rebates, account credits or additional hardware and softwareproducts, solutions and services based on meeting specified program criteria. Customer incentives are recognized as a reduction of sales if distributed in cash orcustomer account credits. Customer incentives are recognized in cost of sales for additional hardware and software products, solutions and services to be provided.We record accruals at the time of revenue recognition as a current liability within Customer returns, rebates and incentives in our Consolidated Balance Sheet or,where a right of setoff exists, as a reduction of Receivables.
Our primary incentive program provides distributors with cash rebates or account credits based on agreed amounts that vary depending on the customer to whomour distributor ultimately sells the product. A critical assumption used in estimating the accrual for this program is the time period from when revenue isrecognized to when the rebate is processed. Our estimate is based primarily on historical experience. If the time period were to change by 10 percent, the effectwould be an adjustment to the accrual of approximately $12.0 million .
More information regarding our revenue recognition and returns, rebates and incentives policies are contained in Note 1 in the Financial Statements.
Recent Accounting Pronouncements
See Note 1 in the Financial Statements regarding recent accounting pronouncements.
36
Table of Contents
Item 7A. Quantitative and Qualitative Disclosures About Market Risk
We are exposed to market risk during the normal course of business from changes in foreign currency exchange rates and interest rates. We manage exposure tothese risks through a combination of normal operating and financing activities as well as derivative financial instruments in the form of foreign currency forwardexchange contracts. We sometimes use interest rate swap contracts to manage the balance of fixed and floating rate debt.
Foreign Currency Risk
We are exposed to foreign currency risks that arise from normal business operations. These risks include the translation of local currency balances of foreignsubsidiaries, transaction gains and losses associated with intercompany loans with foreign subsidiaries and transactions denominated in currencies other than alocation’s functional currency. Our objective is to minimize our exposure to these risks through a combination of normal operating activities and the use of foreigncurrency forward exchange contracts. Contracts are usually denominated in currencies of major industrial countries. The fair value of our foreign currency forwardexchange contracts is an asset of $22.0 million and a liability of $7.2 million at September 30, 2018 . We enter into these contracts with major financial institutionsthat we believe to be creditworthy.
We do not enter into derivative financial instruments for speculative purposes. In 2018 , the relative weakening of the U.S. dollar against foreign currencies had afavorable impact on our sales and results of operations. In 2017 , the relative strengthening of the U.S. dollar against foreign currencies had an unfavorable impacton our sales and results of operations. While future changes in foreign currency exchange rates are difficult to predict, our sales and profitability may be adverselyaffected if the U.S. dollar strengthens relative to 2018 levels.
Certain of our locations have assets and liabilities denominated in currencies other than their functional currencies. We enter into foreign currency forwardexchange contracts to offset the transaction gains or losses associated with some of these assets and liabilities. For such assets and liabilities without offsettingforeign currency forward exchange contracts, a 10 percent adverse change in the underlying foreign currency exchange rates would reduce our pre-tax income byapproximately $21.0 million .
We record all derivatives on the balance sheet at fair value regardless of the purpose for holding them. The use of foreign currency forward exchange contractsallows us to manage transactional exposure to exchange rate fluctuations as the gains or losses incurred on these contracts will offset, in whole or in part, losses orgains on the underlying foreign currency exposure. Derivatives that are not designated as hedges for accounting purposes are adjusted to fair value throughearnings. For derivatives that are hedges, depending on the nature of the hedge, changes in fair value are either offset by changes in the fair value of the hedgedassets, liabilities or firm commitments through earnings or recognized in other comprehensive loss until the hedged item is recognized in earnings. We recognizethe ineffective portion of a derivative’s change in fair value in earnings immediately. There was no impact on earnings due to ineffective hedges in 2018 or 2017 .A hypothetical 10 percent adverse change in underlying foreign currency exchange rates associated with the hedged exposures and related contracts would not besignificant to our financial condition or results of operations.
Interest Rate Risk
In addition to existing cash balances and cash provided by normal operating activities, we use a combination of short-term and long-term debt to financeoperations. We are exposed to interest rate risk on certain of these debt obligations.
Our short-term debt obligations are primarily comprised of commercial paper borrowings. Commercial paper borrowings outstanding were $550.0 million atSeptember 30, 2018 , with a weighted average interest rate of 2.27 percent and weighted average maturity period of 26 days. Commercial paper borrowingsoutstanding were $350.0 million at September 30, 2017 , with a weighted average interest rate of 1.26 percent and weighted average maturity period of 10 days.We have issued, and anticipate continuing to issue, additional short-term commercial paper obligations as needed. Changes in market interest rates on commercialpaper borrowings affect our results of operations. A hypothetical 50 basis point increase in average market interest rates related to our short-term debt would not besignificant to our results of operations or financial condition.
We had outstanding fixed rate long-term debt obligations with a carrying value of $1,225.2 million at September 30, 2018 and $1,243.4 million at September 30,2017 . The fair value of this debt was $1,391.3 million at September 30, 2018 and $1,452.6 million at September 30, 2017 . The potential reduction in fair value onsuch fixed-rate debt obligations from a hypothetical 50 basis point increase in market interest rates would not be significant to our results of operations or financialcondition. We currently have no plans to repurchase our outstanding fixed-rate instruments before their maturity and, therefore, fluctuations in market interest rateswould not have an effect on our results of operations or shareowners’ equity.
In February 2015, we entered into interest rate swap contracts, which we designated as fair value hedges. These interest rate swaps effectively converted the $600.0million aggregate principal amount of our 2.050 percent notes payable in March 2020 (2020 Notes) and 2.875 percent notes payable in March 2025 (2025 Notes)to floating rate debt, each at a rate based on three-month LIBOR plus a fixed spread. The effective floating interest rates were 2.759 percent for the 2020 Notes and3.169 percent for the 2025 Notes at September 30, 2018 . The fair value of our interest rate swap contracts at September 30, 2018 was a net unrealized loss of$24.0 million . A hypothetical 50 basis point increase in average market interest rates related to our interest rate swaps would not be significant to our results ofoperations or financial condition.
37
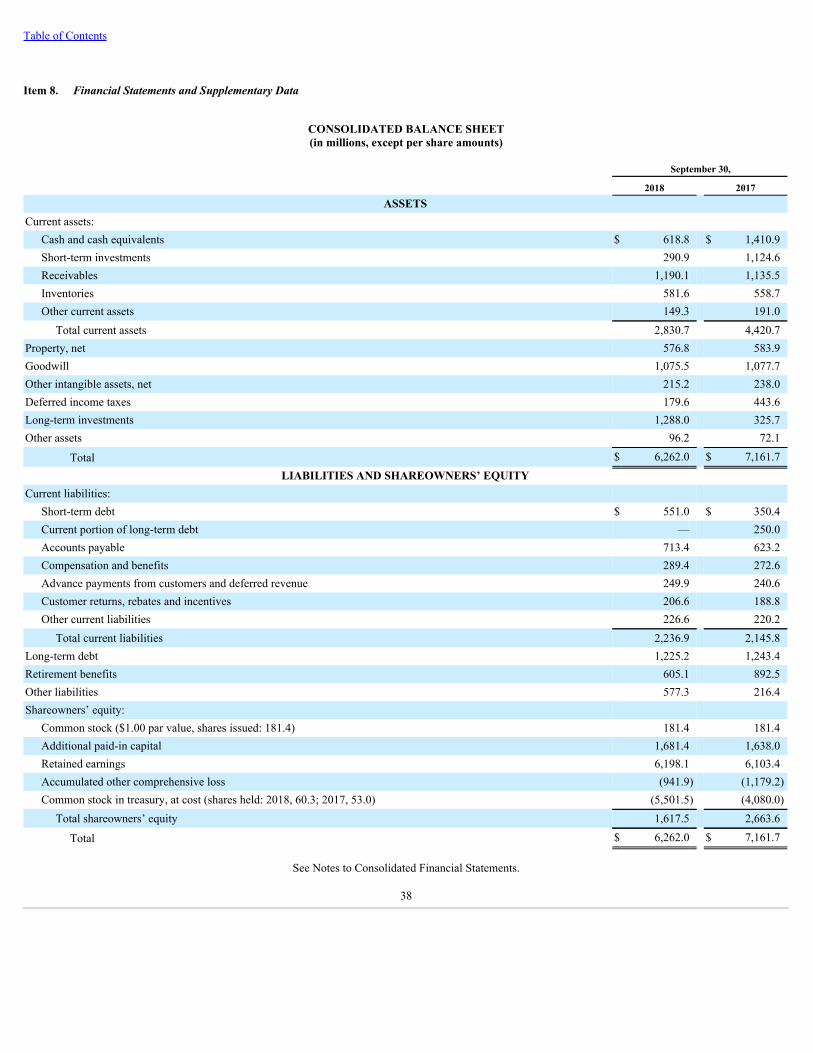
Table of Contents
Item 8. Financial Statements and Supplementary Data
CONSOLIDATED BALANCE SHEET(in millions, except per share amounts)
September 30,
2018 2017ASSETS
Current assets: Cash and cash equivalents $ 618.8 $ 1,410.9Short-term investments 290.9 1,124.6Receivables 1,190.1 1,135.5Inventories 581.6 558.7Other current assets 149.3 191.0
Total current assets 2,830.7 4,420.7Property, net 576.8 583.9Goodwill 1,075.5 1,077.7Other intangible assets, net 215.2 238.0Deferred income taxes 179.6 443.6Long-term investments 1,288.0 325.7Other assets 96.2 72.1
Total $ 6,262.0 $ 7,161.7LIABILITIES AND SHAREOWNERS’ EQUITY
Current liabilities: Short-term debt $ 551.0 $ 350.4Current portion of long-term debt — 250.0Accounts payable 713.4 623.2Compensation and benefits 289.4 272.6Advance payments from customers and deferred revenue 249.9 240.6Customer returns, rebates and incentives 206.6 188.8Other current liabilities 226.6 220.2
Total current liabilities 2,236.9 2,145.8Long-term debt 1,225.2 1,243.4Retirement benefits 605.1 892.5Other liabilities 577.3 216.4Shareowners’ equity:
Common stock ($1.00 par value, shares issued: 181.4) 181.4 181.4Additional paid-in capital 1,681.4 1,638.0Retained earnings 6,198.1 6,103.4Accumulated other comprehensive loss (941.9) (1,179.2)Common stock in treasury, at cost (shares held: 2018, 60.3; 2017, 53.0) (5,501.5) (4,080.0)
Total shareowners’ equity 1,617.5 2,663.6
Total $ 6,262.0 $ 7,161.7
See Notes to Consolidated Financial Statements.
38
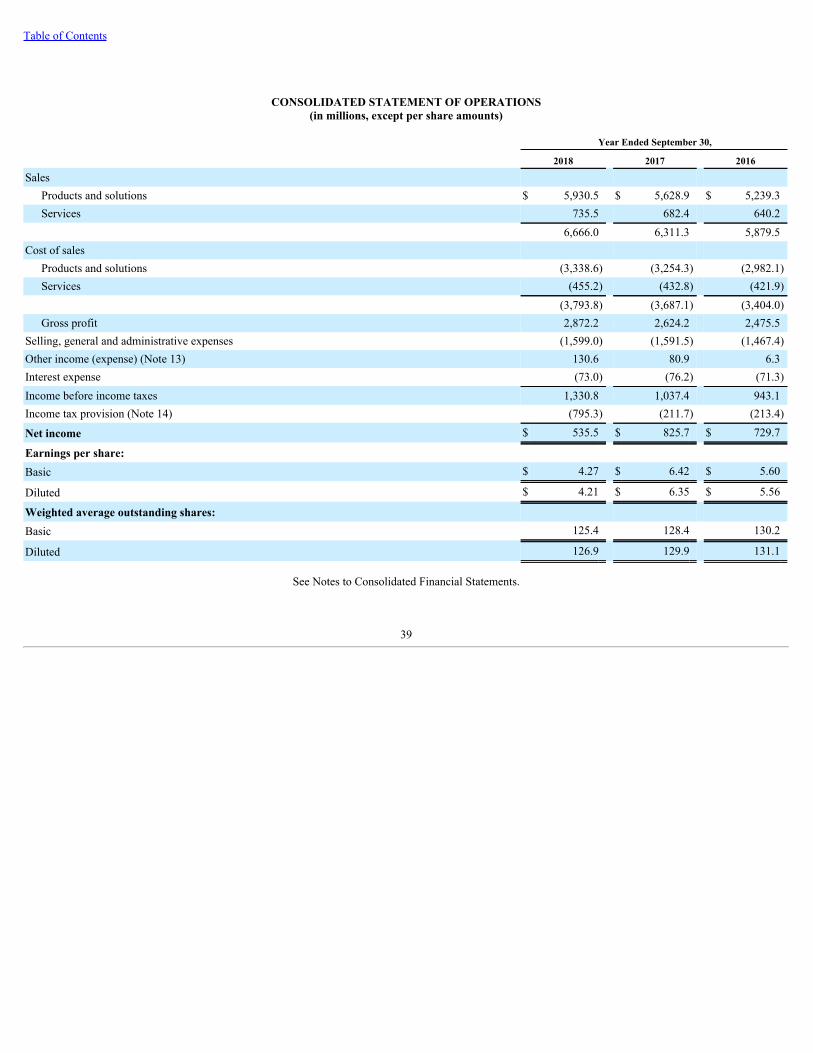
Table of Contents
CONSOLIDATED STATEMENT OF OPERATIONS(in millions, except per share amounts)
Year Ended September 30,
2018 2017 2016
Sales Products and solutions $ 5,930.5 $ 5,628.9 $ 5,239.3Services 735.5 682.4 640.2
6,666.0 6,311.3 5,879.5Cost of sales
Products and solutions (3,338.6) (3,254.3) (2,982.1)Services (455.2) (432.8) (421.9)
(3,793.8) (3,687.1) (3,404.0)Gross profit 2,872.2 2,624.2 2,475.5
Selling, general and administrative expenses (1,599.0) (1,591.5) (1,467.4)Other income (expense) (Note 13) 130.6 80.9 6.3Interest expense (73.0) (76.2) (71.3)Income before income taxes 1,330.8 1,037.4 943.1Income tax provision (Note 14) (795.3) (211.7) (213.4)
Net income $ 535.5 $ 825.7 $ 729.7
Earnings per share: Basic $ 4.27 $ 6.42 $ 5.60
Diluted $ 4.21 $ 6.35 $ 5.56
Weighted average outstanding shares: Basic 125.4 128.4 130.2
Diluted 126.9 129.9 131.1
See Notes to Consolidated Financial Statements.
39
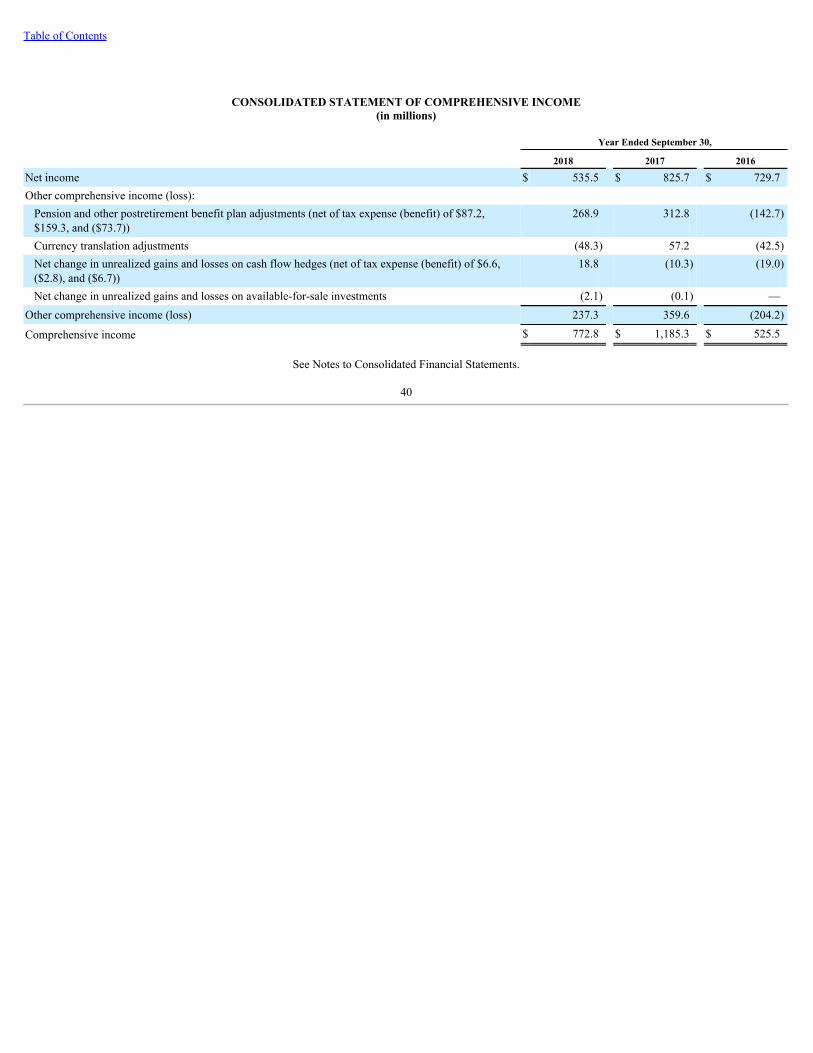
Table of Contents
CONSOLIDATED STATEMENT OF COMPREHENSIVE INCOME(in millions)
Year Ended September 30,
2018 2017 2016
Net income $ 535.5 $ 825.7 $ 729.7Other comprehensive income (loss):
Pension and other postretirement benefit plan adjustments (net of tax expense (benefit) of $87.2,$159.3, and ($73.7))
268.9
312.8
(142.7)
Currency translation adjustments (48.3) 57.2 (42.5)Net change in unrealized gains and losses on cash flow hedges (net of tax expense (benefit) of $6.6,($2.8), and ($6.7))
18.8
(10.3)
(19.0)
Net change in unrealized gains and losses on available-for-sale investments (2.1) (0.1) —Other comprehensive income (loss) 237.3 359.6 (204.2)
Comprehensive income $ 772.8 $ 1,185.3 $ 525.5
See Notes to Consolidated Financial Statements.
40
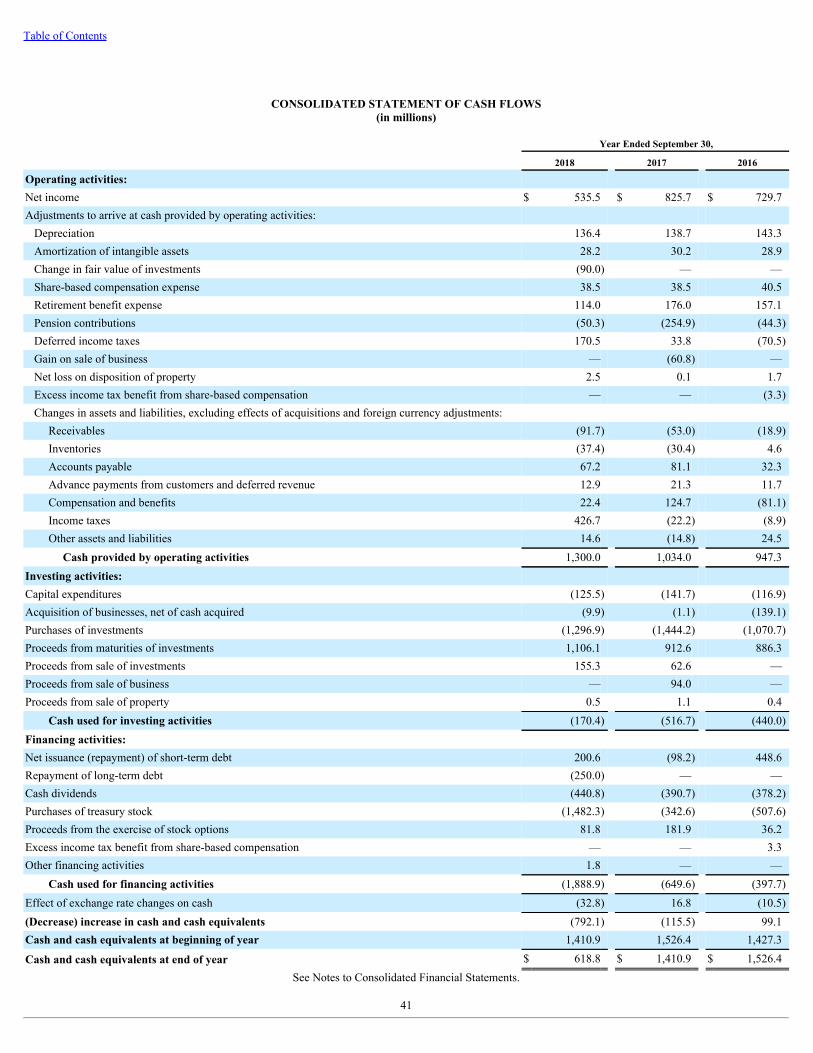
Table of Contents
CONSOLIDATED STATEMENT OF CASH FLOWS(in millions)
Year Ended September 30,
2018 2017 2016
Operating activities: Net income $ 535.5 $ 825.7 $ 729.7Adjustments to arrive at cash provided by operating activities:
Depreciation 136.4 138.7 143.3Amortization of intangible assets 28.2 30.2 28.9Change in fair value of investments (90.0) — —Share-based compensation expense 38.5 38.5 40.5Retirement benefit expense 114.0 176.0 157.1Pension contributions (50.3) (254.9) (44.3)Deferred income taxes 170.5 33.8 (70.5)Gain on sale of business — (60.8) —Net loss on disposition of property 2.5 0.1 1.7Excess income tax benefit from share-based compensation — — (3.3)Changes in assets and liabilities, excluding effects of acquisitions and foreign currency adjustments:
Receivables (91.7) (53.0) (18.9)Inventories (37.4) (30.4) 4.6Accounts payable 67.2 81.1 32.3Advance payments from customers and deferred revenue 12.9 21.3 11.7Compensation and benefits 22.4 124.7 (81.1)Income taxes 426.7 (22.2) (8.9)Other assets and liabilities 14.6 (14.8) 24.5
Cash provided by operating activities 1,300.0 1,034.0 947.3Investing activities: Capital expenditures (125.5) (141.7) (116.9)Acquisition of businesses, net of cash acquired (9.9) (1.1) (139.1)Purchases of investments (1,296.9) (1,444.2) (1,070.7)Proceeds from maturities of investments 1,106.1 912.6 886.3Proceeds from sale of investments 155.3 62.6 —Proceeds from sale of business — 94.0 —Proceeds from sale of property 0.5 1.1 0.4
Cash used for investing activities (170.4) (516.7) (440.0)Financing activities: Net issuance (repayment) of short-term debt 200.6 (98.2) 448.6Repayment of long-term debt (250.0) — —Cash dividends (440.8) (390.7) (378.2)Purchases of treasury stock (1,482.3) (342.6) (507.6)Proceeds from the exercise of stock options 81.8 181.9 36.2Excess income tax benefit from share-based compensation — — 3.3Other financing activities 1.8 — —
Cash used for financing activities (1,888.9) (649.6) (397.7)Effect of exchange rate changes on cash (32.8) 16.8 (10.5)(Decrease) increase in cash and cash equivalents (792.1) (115.5) 99.1Cash and cash equivalents at beginning of year 1,410.9 1,526.4 1,427.3
Cash and cash equivalents at end of year $ 618.8 $ 1,410.9 $ 1,526.4See Notes to Consolidated Financial Statements.
41
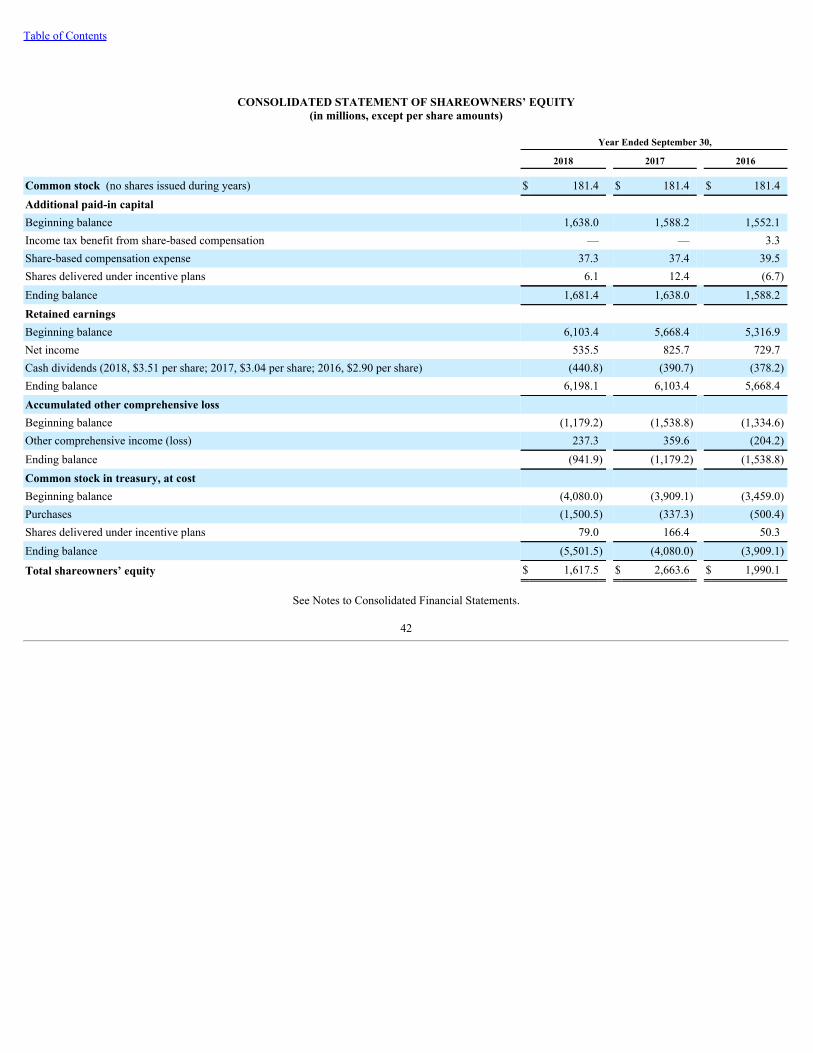
Table of Contents
CONSOLIDATED STATEMENT OF SHAREOWNERS’ EQUITY(in millions, except per share amounts)
Year Ended September 30,
2018 2017 2016
Common stock (no shares issued during years) $ 181.4 $ 181.4 $ 181.4Additional paid-in capital Beginning balance 1,638.0 1,588.2 1,552.1Income tax benefit from share-based compensation — — 3.3Share-based compensation expense 37.3 37.4 39.5Shares delivered under incentive plans 6.1 12.4 (6.7)Ending balance 1,681.4 1,638.0 1,588.2Retained earnings Beginning balance 6,103.4 5,668.4 5,316.9Net income 535.5 825.7 729.7Cash dividends (2018, $3.51 per share; 2017, $3.04 per share; 2016, $2.90 per share) (440.8) (390.7) (378.2)Ending balance 6,198.1 6,103.4 5,668.4Accumulated other comprehensive loss Beginning balance (1,179.2) (1,538.8) (1,334.6)Other comprehensive income (loss) 237.3 359.6 (204.2)Ending balance (941.9) (1,179.2) (1,538.8)Common stock in treasury, at cost Beginning balance (4,080.0) (3,909.1) (3,459.0)Purchases (1,500.5) (337.3) (500.4)Shares delivered under incentive plans 79.0 166.4 50.3Ending balance (5,501.5) (4,080.0) (3,909.1)
Total shareowners’ equity $ 1,617.5 $ 2,663.6 $ 1,990.1
See Notes to Consolidated Financial Statements.
42
Table of Contents
NOTES TO CONSOLIDATED FINANCIAL STATEMENTS
1. Basis of Presentation and Accounting Policies
Rockwell Automation, Inc. (“Rockwell Automation” or “the Company”), a leader in industrial automation and information, makes its customers more productiveand the world more sustainable .
BasisofPresentation
Our consolidated financial statements are prepared in accordance with accounting principles generally accepted in the United States (U.S. GAAP).
PrinciplesofConsolidation
The accompanying consolidated financial statements include the accounts of the Company and its wholly-owned and controlled majority-owned subsidiaries.Intercompany accounts and transactions have been eliminated in consolidation. Investments in affiliates over which we do not have control but exercise significantinfluence are accounted for using the equity method of accounting. These affiliated companies are not material individually or in the aggregate to our financialposition, results of operations or cash flows.
UseofEstimates
The preparation of consolidated financial statements in accordance with U.S. GAAP requires us to make estimates and assumptions that affect the reportedamounts of assets and liabilities at the date of the consolidated financial statements and revenues and expenses during the periods reported. Actual results coulddiffer from those estimates. We use estimates in accounting for, among other items, customer returns, rebates and incentives; allowance for doubtful accounts;excess and obsolete inventory; discount valuation of PTC Inc. ("PTC") common stock; share-based compensation; acquisitions; product warranty obligations;retirement benefits; litigation, claims and contingencies, including environmental matters, conditional asset retirement obligations and contractualindemnifications; and income taxes. We account for changes to estimates and assumptions prospectively when warranted by factually-based experience.
RevenueRecognition
We recognize revenue when it is realized or realizable and earned. Product and solution sales consist of industrial automation and information solutions; hardwareand software products; and custom-engineered systems. Service sales include multi-vendor customer technical support and repair, asset management andoptimization consulting and training. All service sales recorded in the Consolidated Statement of Operations are associated with our Control Products & Solutionssegment.
For approximately 85 percent of our consolidated sales, we record sales when all of the following have occurred: persuasive evidence of a sales agreement exists;pricing is fixed or determinable; collection is reasonably assured; and hardware and software products have been delivered and acceptance has occurred, as may berequired according to contract terms, or services have been rendered. Within this category, we will at times enter into arrangements that involve the delivery ofmultiple hardware and software products and/or the performance of services, such as installation and commissioning. The timing of delivery, though varied basedupon the nature of the undelivered component, is generally short-term in nature. For these arrangements, revenue is allocated to each deliverable based on thatelement's relative selling price, provided the delivered element has value to customers on a standalone basis and, if the arrangement includes a general right ofreturn, delivery or performance of the undelivered items is probable and substantially in our control. Relative selling price is obtained from sources such as vendor-specific objective evidence, which is based on our separate selling price for that or a similar item, or from third-party evidence such as how competitors havepriced similar items. If such evidence is not available, we use our best estimate of the selling price, which includes various internal factors such as our pricingstrategy and market factors.
We recognize substantially all of the remainder of our sales as construction-type contracts using either the percentage-of-completion or completed contractmethods of accounting. We record sales relating to these contracts using the percentage-of-completion method when we determine that progress toward completionis reasonably and reliably estimable; we use the completed contract method for all others. Under the percentage-of-completion method, we recognize sales andgross profit as work is performed using the relationship between actual costs incurred and total estimated costs at completion. Under the percentage-of-completionmethod, we adjust sales and gross profit for revisions of estimated total contract costs or revenue in the period the change is identified. We record estimated losseson contracts when they are identified.
43

Table of ContentsNOTES TO CONSOLIDATED FINANCIAL STATEMENTS (Continued)
1. Basis of Presentation and Accounting Policies (Continued)
We use contracts and customer purchase orders to determine the existence of a sales agreement. We use shipping documents and customer acceptance, whenapplicable, to verify delivery. We assess whether the fee is fixed or determinable based on the payment terms associated with the transaction and whether the salesprice is subject to refund or adjustment. We assess collectibility based on the creditworthiness of the customer as determined by credit evaluations and analysis, aswell as the customer’s payment history.
Shipping and handling costs billed to customers are included in sales and the related costs are included in cost of sales in the Consolidated Statement of Operations.
Returns,RebatesandIncentives
Our primary incentive program provides distributors with cash rebates or account credits based on agreed amounts that vary depending on the customer to whomour distributor ultimately sells the product. We also offer various other incentive programs that provide distributors and direct sale customers with cash rebates,account credits or additional hardware and software products, solutions and services based on meeting specified program criteria. Certain distributors are offered aright to return product, subject to contractual limitations.
We record accruals for customer returns, rebates and incentives at the time of revenue recognition based primarily on historical experience. Returns, rebates andincentives are recognized as a reduction of sales if distributed in cash or customer account credits. Rebates and incentives are recognized in cost of sales foradditional hardware and software products, solutions and services to be provided. Accruals are reported as a current liability in our Consolidated Balance Sheet or,where a right of setoff exists, as a reduction of accounts receivable.
TaxesonRevenueProducingTransactions
Taxes assessed by governmental authorities on revenue producing transactions, including sales, value added, excise and use taxes, are recorded on a net basis(excluded from revenue).
CashandCashEquivalents
Cash and cash equivalents include time deposits, certificates of deposit, and other fixed income securities with original maturities of three months or less at thetime of purchase.
Receivables
We record an allowance for doubtful accounts based on customer-specific analysis and general matters such as current assessments of past due balances andeconomic conditions. Receivables are recorded net of an allowance for doubtful accounts of $17.1 million at September 30, 2018 and $24.9 million atSeptember 30, 2017 . In addition, receivables are recorded net of an allowance for certain customer returns, rebates and incentives of $8.7 million at September 30,2018 and $11.9 million at September 30, 2017 .
Inventories
Inventories are recorded at the lower of cost or market using the first-in, first-out (FIFO) or average cost methods. Market is determined on the basis of estimatedrealizable values.
Investments
Investments include time deposits, certificates of deposit, other fixed income securities and equity securities. Investments with original maturities longer than threemonths at the time of purchase and less than one year from period end are classified as short-term. All other investments are classified as long-term. Fixed incomesecurities meeting the definition of a security are accounted for as available-for-sale and recorded at fair value. Equity securities are recorded at fair value. Allother investments are recorded at cost, which approximates fair value.
Property
Property, including internal-use software, is recorded at cost. We calculate depreciation of property using the straight-line method over 5 to 40 years for buildingsand improvements, 3 to 20 years for machinery and equipment and 3 to 10 years for computer hardware and internal-use software. We capitalize significantrenewals and enhancements and write off replaced units. We expense maintenance and repairs, as well as renewals of minor amounts. Property acquired during theyear that is accrued within accounts payable or other current liabilities at year end is considered to be a non-cash investing activity and is excluded from cash usedfor capital expenditures in the Consolidated Statement of Cash Flows. Capital expenditures of $43.2 million , $29.6 million and $29.9 million were accrued withinaccounts payable and other current liabilities at September 30, 2018 , 2017 and 2016 , respectively.
44
Table of ContentsNOTES TO CONSOLIDATED FINANCIAL STATEMENTS (Continued)
1. Basis of Presentation and Accounting Policies (Continued)
IntangibleAssets
Goodwill and other intangible assets generally result from business acquisitions. We account for business acquisitions by allocating the purchase price to tangibleand intangible assets acquired and liabilities assumed at their fair values; the excess of the purchase price over the allocated amount is recorded as goodwill.
We review goodwill and other intangible assets with indefinite useful lives for impairment annually or more frequently if events or circumstances indicateimpairment may be present. Any excess in carrying value over the estimated fair value is charged to results of operations. We perform our annual impairment testduring the second quarter of our fiscal year.
We amortize certain customer relationships on an accelerated basis over the period of which we expect the intangible asset to generate future cash flows. Weamortize all other intangible assets with finite useful lives on a straight-line basis over their estimated useful lives. Useful lives assigned range from 3 to 15 yearsfor trademarks, 8 to 20 years for customer relationships, 5 to 17 years for technology and 5 to 30 years for other intangible assets.
Intangible assets also include costs of software developed or purchased by our software business to be sold, leased or otherwise marketed. Amortization of thesecomputer software products is calculated on a product-by-product basis as the greater of (a) the unamortized cost at the beginning of the year times the ratio of thecurrent year gross revenue for a product to the total of the current and anticipated future gross revenue for that product or (b) the straight-line amortization over theremaining estimated economic life of the product.
ImpairmentofLong-LivedAssets
We evaluate the recoverability of the recorded amount of long-lived assets whenever events or changes in circumstances indicate that the recorded amount of anasset may not be fully recoverable. Impairment is assessed when the undiscounted expected future cash flows derived from an asset are less than its carryingamount. If we determine that an asset is impaired, we measure the impairment to be recognized as the amount by which the recorded amount of the asset exceedsits fair value. We report assets to be disposed of at the lower of the recorded amount or fair value less cost to sell. We determine fair value using a discountedfuture cash flow analysis.
DerivativeFinancialInstruments
We use derivative financial instruments in the form of foreign currency forward exchange contracts to manage certain foreign currency risks. We enter into thesecontracts to hedge our exposure to foreign currency exchange rate variability in the expected future cash flows associated with certain third-party and intercompanytransactions denominated in foreign currencies forecasted to occur within the next two years. We also use these contracts to hedge portions of our net investmentsin certain non-U.S. subsidiaries against the effect of exchange rate fluctuations on the translation of foreign currency balances to the U.S. dollar. Additionally, weuse derivative financial instruments in the form of interest rate swap contracts to manage our borrowing costs of certain long-term debt. We designate and accountfor these derivative financial instruments as hedges under U.S. GAAP.
Furthermore, we use foreign currency forward exchange contracts that are not designated as hedges to offset transaction gains or losses associated with some of ourassets and liabilities resulting from intercompany loans or other transactions with third parties that are denominated in currencies other than our entities' functionalcurrencies. It is our policy to execute such instruments with global financial institutions that we believe to be creditworthy and not to enter into derivative financialinstruments for speculative purposes. Foreign currency forward exchange contracts are usually denominated in currencies of major industrial countries.
45
Table of ContentsNOTES TO CONSOLIDATED FINANCIAL STATEMENTS (Continued)
1. Basis of Presentation and Accounting Policies (Continued)
FairValueofFinancialInstruments
We record various financial instruments recorded at fair value. U.S. GAAP defines fair value as the price that would be received for an asset or paid to transfer aliability (exit price) in an orderly transaction between market participants in the principal or most advantageous market for the asset or liability. U.S. GAAP alsoclassifies the inputs used to measure fair value into the following hierarchy:
Level 1: Quoted prices in active markets for identical assets or liabilities. Level 2:
Quoted prices in active markets for similar assets or liabilities, quoted prices for identical or similar assets or liabilities in markets that are notactive, or inputs other than quoted prices that are observable for the asset or liability.
Level 3: Unobservable inputs for the asset or liability.
We hold financial instruments consisting of cash and short-term debt. The fair values of our cash and short-term debt approximate their carrying amounts asreported in our Consolidated Balance Sheet due to the short-term nature of these instruments.
We also hold financial instruments consisting of long-term debt, investments and derivatives. The valuation methodologies for these financial instruments aredescribed in Notes 5, 8, 9, and 12 in the Financial Statements. The methods described in these Notes may produce a fair value calculation that may not beindicative of net realizable value or reflective of future fair values. Furthermore, while we believe our valuation methods are appropriate and consistent with othermarket participants, the use of different methodologies or assumptions to determine the fair value of certain financial instruments could result in a different fairvalue measurement at the reporting date.
ForeignCurrencyTranslation
We translate assets and liabilities of subsidiaries operating outside of the United States with a functional currency other than the U.S. dollar into U.S. dollars usingexchange rates at the end of the respective period. We translate sales, costs and expenses at average exchange rates effective during the respective period. Wereport foreign currency translation adjustments as a component of other comprehensive income (loss). Currency transaction gains and losses are included in resultsof operations in the period incurred.
ResearchandDevelopmentExpenses
We expense research and development (R&D) costs as incurred; these costs were $371.8 million in 2018 , $348.2 million in 2017 and $319.3 million in 2016 . Weinclude R&D expenses in cost of sales in the Consolidated Statement of Operations.
IncomeTaxes
We account for uncertain tax positions by determining whether it is more likely than not that a tax position will be sustained upon examination based on thetechnical merits of the position. For tax positions that meet the more-likely-than-not recognition threshold, we determine the amount of benefit to recognize in theconsolidated financial statements based on our assertion of the most likely outcome resulting from an examination, including the resolution of any related appealsor litigation processes.
EarningsPerShare
We present basic and diluted earnings per share (EPS) amounts. Basic EPS is calculated by dividing earnings available to common shareowners, which is incomeexcluding the allocation to participating securities, by the weighted average number of common shares outstanding during the year, excluding unvested restrictedstock. Diluted EPS amounts are based upon the weighted average number of common and common-equivalent shares outstanding during the year. We use thetreasury stock method to calculate the effect of outstanding share-based compensation awards, which requires us to compute total employee proceeds as the sumof the amount the employee must pay upon exercise of the award and the amount of unearned share-based compensation costs attributed to future services. Share-based compensation awards for which the total employee proceeds of the award exceed the average market price of the same award over the period have anantidilutive effect on EPS, and accordingly, we exclude them from the calculation. Antidilutive share-based compensation awards for the years endedSeptember 30, 2018 ( 0.9 million shares), 2017 ( 0.7 million shares) and 2016 ( 2.2 million shares) were excluded from the diluted EPS calculation. U.S. GAAPrequires unvested share-based payment awards that contain non-forfeitable rights to dividends or dividend equivalents, whether paid or unpaid, to be treated asparticipating securities and included in the computation of earnings per share pursuant to the two-class method. Our participating securities are composed ofunvested restricted stock and non-employee director restricted stock units.
46
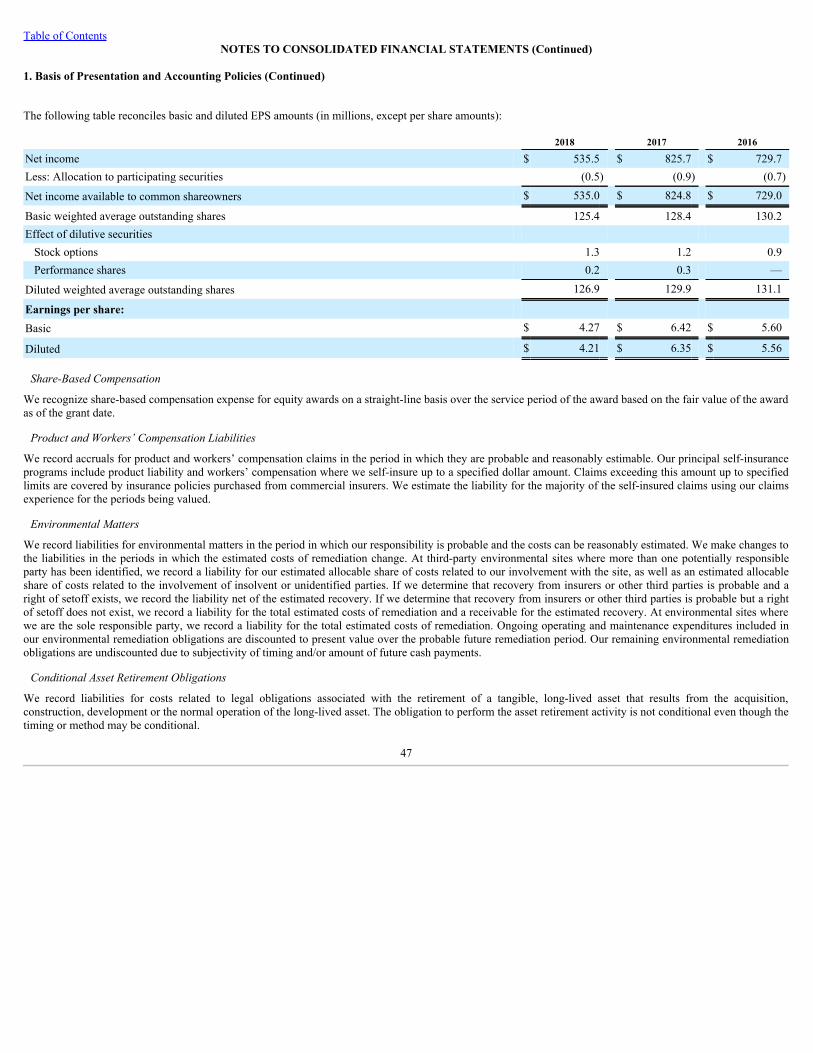
Table of ContentsNOTES TO CONSOLIDATED FINANCIAL STATEMENTS (Continued)
1. Basis of Presentation and Accounting Policies (Continued)
The following table reconciles basic and diluted EPS amounts (in millions, except per share amounts):
2018 2017 2016
Net income $ 535.5 $ 825.7 $ 729.7Less: Allocation to participating securities (0.5) (0.9) (0.7)
Net income available to common shareowners $ 535.0 $ 824.8 $ 729.0
Basic weighted average outstanding shares 125.4 128.4 130.2Effect of dilutive securities
Stock options 1.3 1.2 0.9Performance shares 0.2 0.3 —
Diluted weighted average outstanding shares 126.9 129.9 131.1
Earnings per share: Basic $ 4.27 $ 6.42 $ 5.60
Diluted $ 4.21 $ 6.35 $ 5.56
Share-BasedCompensation
We recognize share-based compensation expense for equity awards on a straight-line basis over the service period of the award based on the fair value of the awardas of the grant date.
ProductandWorkers’CompensationLiabilities
We record accruals for product and workers’ compensation claims in the period in which they are probable and reasonably estimable. Our principal self-insuranceprograms include product liability and workers’ compensation where we self-insure up to a specified dollar amount. Claims exceeding this amount up to specifiedlimits are covered by insurance policies purchased from commercial insurers. We estimate the liability for the majority of the self-insured claims using our claimsexperience for the periods being valued.
EnvironmentalMatters
We record liabilities for environmental matters in the period in which our responsibility is probable and the costs can be reasonably estimated. We make changes tothe liabilities in the periods in which the estimated costs of remediation change. At third-party environmental sites where more than one potentially responsibleparty has been identified, we record a liability for our estimated allocable share of costs related to our involvement with the site, as well as an estimated allocableshare of costs related to the involvement of insolvent or unidentified parties. If we determine that recovery from insurers or other third parties is probable and aright of setoff exists, we record the liability net of the estimated recovery. If we determine that recovery from insurers or other third parties is probable but a rightof setoff does not exist, we record a liability for the total estimated costs of remediation and a receivable for the estimated recovery. At environmental sites wherewe are the sole responsible party, we record a liability for the total estimated costs of remediation. Ongoing operating and maintenance expenditures included inour environmental remediation obligations are discounted to present value over the probable future remediation period. Our remaining environmental remediationobligations are undiscounted due to subjectivity of timing and/or amount of future cash payments.
ConditionalAssetRetirementObligations
We record liabilities for costs related to legal obligations associated with the retirement of a tangible, long-lived asset that results from the acquisition,construction, development or the normal operation of the long-lived asset. The obligation to perform the asset retirement activity is not conditional even though thetiming or method may be conditional.
47
Table of ContentsNOTES TO CONSOLIDATED FINANCIAL STATEMENTS (Continued)
1. Basis of Presentation and Accounting Policies (Continued)
RecentlyIssuedAccountingPronouncements
In March 2017, the FASB issued a new standard regarding the presentation of net periodic pension and postretirement benefit costs. This standard requires theservice cost component to be reported in the income statement in the same line item as other compensation costs arising from services rendered by the relatedemployees during the period. The other components of net periodic benefit cost are required to be presented separately from the service cost component in either aseparate line item or within another appropriate line item with disclosure of where those costs are recorded. This standard also requires that only the service costcomponent is eligible for capitalization, when applicable. This standard is effective for us for reporting periods starting October 1, 2018 and will be appliedretrospectively. The non-service components of net periodic pension and postretirement benefit cost, which are to be reclassified to other income (expense) in theConsolidated Statement of Operations upon adoption of the new standard, are expense of $23.8 million , $77.6 million and $67.8 million for the years endedSeptember 30, 2018 , 2017 and 2016 , respectively.
In February 2016, the FASB issued a new standard on accounting for leases that requires lessees to recognize right-of-use assets and lease liabilities for mostleases, among other changes to existing lease accounting guidance. The new standard also requires additional qualitative and quantitative disclosures about leasingactivities. This standard is effective for us for reporting periods beginning October 1, 2019. We are currently evaluating the impact the adoption of this standardwill have on our consolidated financial statements and related disclosures.
In May 2014, the FASB issued a new standard on revenue recognition related to contracts with customers. This standard supersedes nearly all existing revenuerecognition guidance and involves a five-step principles-based approach to recognizing revenue. The underlying principle is to recognize revenue when promisedgoods or services are transferred to customers in an amount that reflects the consideration that is expected to be received for those goods or services. The newstandard will also require additional qualitative and quantitative disclosures about contracts with customers, significant judgments made in applying the revenue-guidance, and assets recognized from the costs to obtain or fulfill a contract. We adopted the new revenue standard, using the modified retrospective transitionmethod, which results in an adjustment to the opening balance of retained earnings as of October 1, 2018, our adoption date. The estimated cumulative impact ofadopting the new standard is an increase in the opening balance sheet retained earnings of less than $10 million . The primary drivers of the impact were changesfrom the capitalization and deferral of certain contract costs and the timing of revenue, net of costs, for software licenses bundled with services and projectspreviously accounted for on a completed contract basis. These were partially offset by a deferral of revenue, net of costs, related to the allocation of revenue tohardware and software products and services provided to our customers free of charge as incentives. We do not expect the adoption will have a material impact toour consolidated financial statements, including the presentation of revenues in our Consolidated Statement of Operations.
48
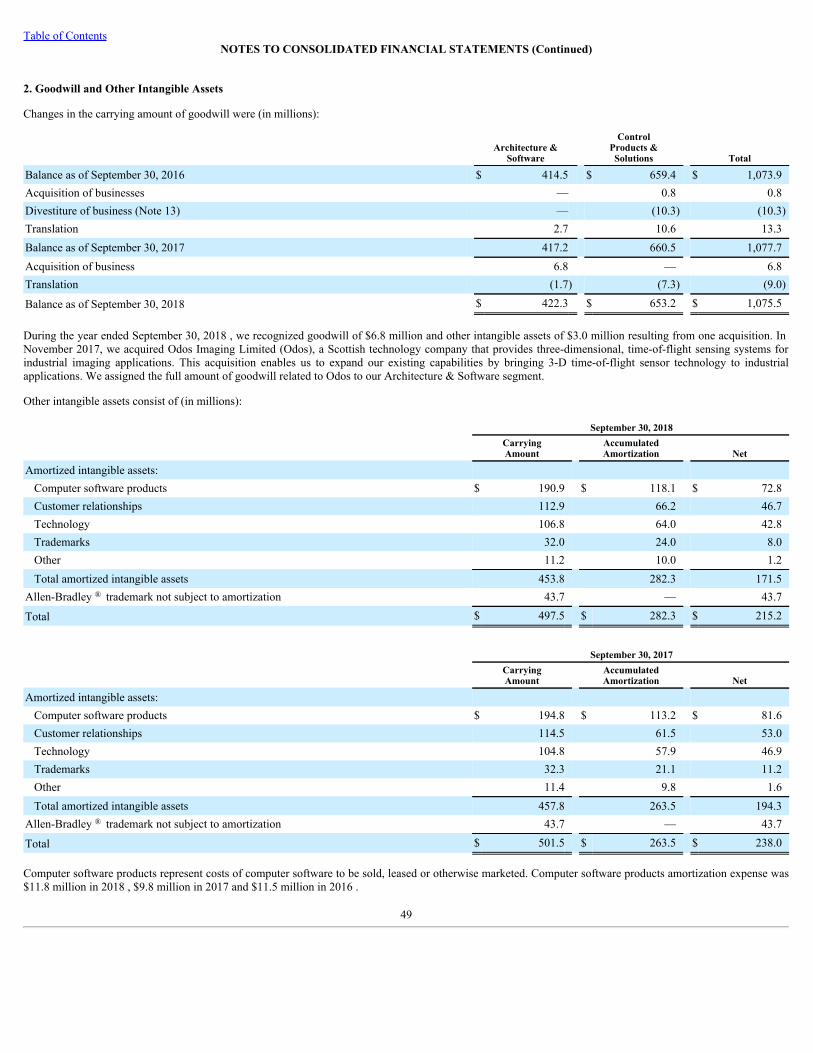
Table of ContentsNOTES TO CONSOLIDATED FINANCIAL STATEMENTS (Continued)
2. Goodwill and Other Intangible Assets
Changes in the carrying amount of goodwill were (in millions):
Architecture &
Software
ControlProducts &Solutions Total
Balance as of September 30, 2016 $ 414.5 $ 659.4 $ 1,073.9Acquisition of businesses — 0.8 0.8Divestiture of business (Note 13) — (10.3) (10.3)Translation 2.7 10.6 13.3Balance as of September 30, 2017 417.2 660.5 1,077.7Acquisition of business 6.8 — 6.8Translation (1.7) (7.3) (9.0)
Balance as of September 30, 2018 $ 422.3 $ 653.2 $ 1,075.5
During the year ended September 30, 2018 , we recognized goodwill of $6.8 million and other intangible assets of $3.0 million resulting from one acquisition. InNovember 2017, we acquired Odos Imaging Limited (Odos), a Scottish technology company that provides three-dimensional, time-of-flight sensing systems forindustrial imaging applications. This acquisition enables us to expand our existing capabilities by bringing 3-D time-of-flight sensor technology to industrialapplications. We assigned the full amount of goodwill related to Odos to our Architecture & Software segment.
Other intangible assets consist of (in millions):
September 30, 2018
CarryingAmount
AccumulatedAmortization Net
Amortized intangible assets: Computer software products $ 190.9 $ 118.1 $ 72.8Customer relationships 112.9 66.2 46.7Technology 106.8 64.0 42.8Trademarks 32.0 24.0 8.0Other 11.2 10.0 1.2Total amortized intangible assets 453.8 282.3 171.5
Allen-Bradley ® trademark not subject to amortization 43.7 — 43.7
Total $ 497.5 $ 282.3 $ 215.2
September 30, 2017
CarryingAmount
AccumulatedAmortization Net
Amortized intangible assets: Computer software products $ 194.8 $ 113.2 $ 81.6Customer relationships 114.5 61.5 53.0Technology 104.8 57.9 46.9Trademarks 32.3 21.1 11.2Other 11.4 9.8 1.6Total amortized intangible assets 457.8 263.5 194.3
Allen-Bradley ® trademark not subject to amortization 43.7 — 43.7
Total $ 501.5 $ 263.5 $ 238.0
Computer software products represent costs of computer software to be sold, leased or otherwise marketed. Computer software products amortization expense was$11.8 million in 2018 , $9.8 million in 2017 and $11.5 million in 2016 .
49
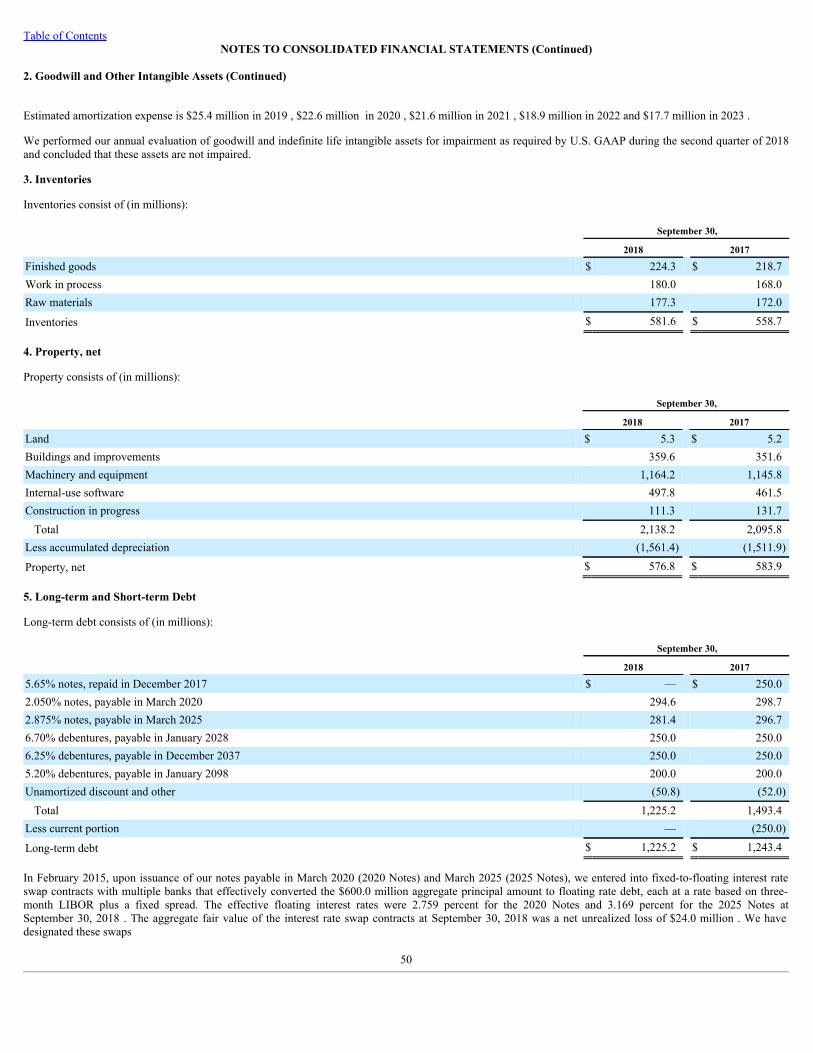
Table of ContentsNOTES TO CONSOLIDATED FINANCIAL STATEMENTS (Continued)
2. Goodwill and Other Intangible Assets (Continued)
Estimated amortization expense is $25.4 million in 2019 , $22.6 million in 2020 , $21.6 million in 2021 , $18.9 million in 2022 and $17.7 million in 2023 .
We performed our annual evaluation of goodwill and indefinite life intangible assets for impairment as required by U.S. GAAP during the second quarter of 2018and concluded that these assets are not impaired.
3. Inventories
Inventories consist of (in millions):
September 30,
2018 2017
Finished goods $ 224.3 $ 218.7Work in process 180.0 168.0Raw materials 177.3 172.0
Inventories $ 581.6 $ 558.7
4. Property, net
Property consists of (in millions):
September 30,
2018 2017
Land $ 5.3 $ 5.2Buildings and improvements 359.6 351.6Machinery and equipment 1,164.2 1,145.8Internal-use software 497.8 461.5Construction in progress 111.3 131.7
Total 2,138.2 2,095.8Less accumulated depreciation (1,561.4) (1,511.9)
Property, net $ 576.8 $ 583.9
5. Long-term and Short-term Debt
Long-term debt consists of (in millions):
September 30,
2018 2017
5.65% notes, repaid in December 2017 $ — $ 250.02.050% notes, payable in March 2020 294.6 298.72.875% notes, payable in March 2025 281.4 296.76.70% debentures, payable in January 2028 250.0 250.06.25% debentures, payable in December 2037 250.0 250.05.20% debentures, payable in January 2098 200.0 200.0Unamortized discount and other (50.8) (52.0)
Total 1,225.2 1,493.4Less current portion — (250.0)
Long-term debt $ 1,225.2 $ 1,243.4
In February 2015, upon issuance of our notes payable in March 2020 (2020 Notes) and March 2025 (2025 Notes), we entered into fixed-to-floating interest rateswap contracts with multiple banks that effectively converted the $600.0 million aggregate principal amount to floating rate debt, each at a rate based on three-month LIBOR plus a fixed spread. The effective floating interest rates were 2.759 percent for the 2020 Notes and 3.169 percent for the 2025 Notes atSeptember 30, 2018 . The aggregate fair value of the interest rate swap contracts at September 30, 2018 was a net unrealized loss of $24.0 million . We havedesignated these swaps
50
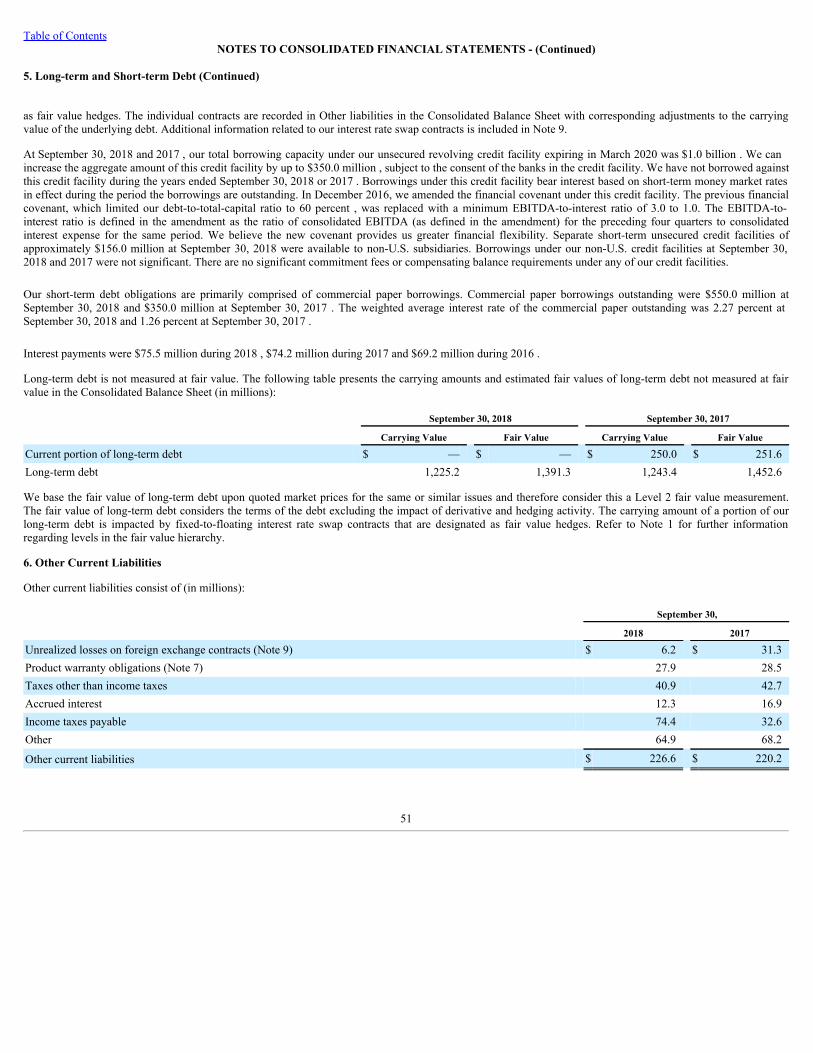
Table of ContentsNOTES TO CONSOLIDATED FINANCIAL STATEMENTS - (Continued)
5. Long-term and Short-term Debt (Continued)
as fair value hedges. The individual contracts are recorded in Other liabilities in the Consolidated Balance Sheet with corresponding adjustments to the carryingvalue of the underlying debt. Additional information related to our interest rate swap contracts is included in Note 9.
At September 30, 2018 and 2017 , our total borrowing capacity under our unsecured revolving credit facility expiring in March 2020 was $1.0 billion . We canincrease the aggregate amount of this credit facility by up to $350.0 million , subject to the consent of the banks in the credit facility. We have not borrowed againstthis credit facility during the years ended September 30, 2018 or 2017 . Borrowings under this credit facility bear interest based on short-term money market ratesin effect during the period the borrowings are outstanding. In December 2016, we amended the financial covenant under this credit facility. The previous financialcovenant, which limited our debt-to-total-capital ratio to 60 percent , was replaced with a minimum EBITDA-to-interest ratio of 3.0 to 1.0. The EBITDA-to-interest ratio is defined in the amendment as the ratio of consolidated EBITDA (as defined in the amendment) for the preceding four quarters to consolidatedinterest expense for the same period. We believe the new covenant provides us greater financial flexibility. Separate short-term unsecured credit facilities ofapproximately $156.0 million at September 30, 2018 were available to non-U.S. subsidiaries. Borrowings under our non-U.S. credit facilities at September 30,2018 and 2017 were not significant. There are no significant commitment fees or compensating balance requirements under any of our credit facilities.
Our short-term debt obligations are primarily comprised of commercial paper borrowings. Commercial paper borrowings outstanding were $550.0 million atSeptember 30, 2018 and $350.0 million at September 30, 2017 . The weighted average interest rate of the commercial paper outstanding was 2.27 percent atSeptember 30, 2018 and 1.26 percent at September 30, 2017 .
Interest payments were $75.5 million during 2018 , $74.2 million during 2017 and $69.2 million during 2016 .
Long-term debt is not measured at fair value. The following table presents the carrying amounts and estimated fair values of long-term debt not measured at fairvalue in the Consolidated Balance Sheet (in millions):
September 30, 2018 September 30, 2017
Carrying Value Fair Value Carrying Value Fair Value
Current portion of long-term debt $ — $ — $ 250.0 $ 251.6Long-term debt 1,225.2 1,391.3 1,243.4 1,452.6
We base the fair value of long-term debt upon quoted market prices for the same or similar issues and therefore consider this a Level 2 fair value measurement.The fair value of long-term debt considers the terms of the debt excluding the impact of derivative and hedging activity. The carrying amount of a portion of ourlong-term debt is impacted by fixed-to-floating interest rate swap contracts that are designated as fair value hedges. Refer to Note 1 for further informationregarding levels in the fair value hierarchy.
6. Other Current Liabilities
Other current liabilities consist of (in millions):
September 30,
2018 2017
Unrealized losses on foreign exchange contracts (Note 9) $ 6.2 $ 31.3Product warranty obligations (Note 7) 27.9 28.5Taxes other than income taxes 40.9 42.7Accrued interest 12.3 16.9Income taxes payable 74.4 32.6Other 64.9 68.2
Other current liabilities $ 226.6 $ 220.2
51
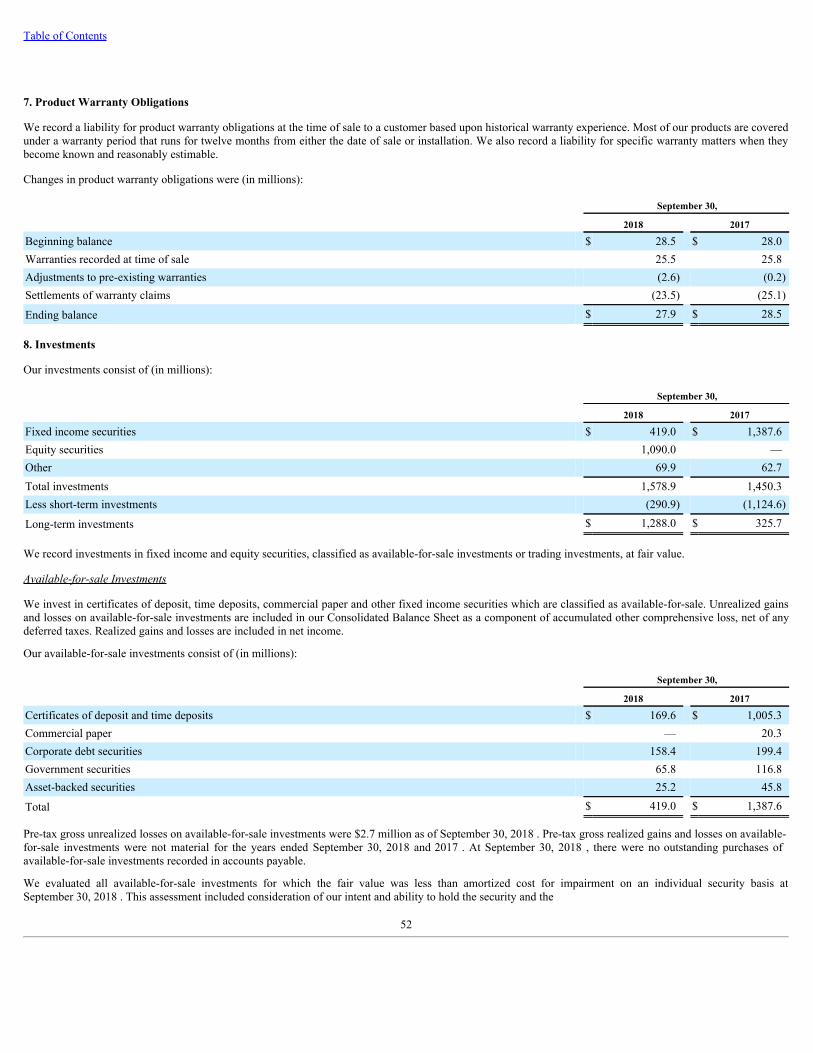
Table of Contents
7. Product Warranty Obligations
We record a liability for product warranty obligations at the time of sale to a customer based upon historical warranty experience. Most of our products are coveredunder a warranty period that runs for twelve months from either the date of sale or installation. We also record a liability for specific warranty matters when theybecome known and reasonably estimable.
Changes in product warranty obligations were (in millions):
September 30,
2018 2017
Beginning balance $ 28.5 $ 28.0Warranties recorded at time of sale 25.5 25.8Adjustments to pre-existing warranties (2.6) (0.2)Settlements of warranty claims (23.5) (25.1)
Ending balance $ 27.9 $ 28.5
8. Investments
Our investments consist of (in millions):
September 30,
2018 2017
Fixed income securities $ 419.0 $ 1,387.6Equity securities 1,090.0 —Other 69.9 62.7Total investments 1,578.9 1,450.3Less short-term investments (290.9) (1,124.6)
Long-term investments $ 1,288.0 $ 325.7
We record investments in fixed income and equity securities, classified as available-for-sale investments or trading investments, at fair value.
Available-for-saleInvestments
We invest in certificates of deposit, time deposits, commercial paper and other fixed income securities which are classified as available-for-sale. Unrealized gainsand losses on available-for-sale investments are included in our Consolidated Balance Sheet as a component of accumulated other comprehensive loss, net of anydeferred taxes. Realized gains and losses are included in net income.
Our available-for-sale investments consist of (in millions):
September 30,
2018 2017
Certificates of deposit and time deposits $ 169.6 $ 1,005.3Commercial paper — 20.3Corporate debt securities 158.4 199.4Government securities 65.8 116.8Asset-backed securities 25.2 45.8
Total $ 419.0 $ 1,387.6
Pre-tax gross unrealized losses on available-for-sale investments were $2.7 million as of September 30, 2018 . Pre-tax gross realized gains and losses on available-for-sale investments were not material for the years ended September 30, 2018 and 2017 . At September 30, 2018 , there were no outstanding purchases ofavailable-for-sale investments recorded in accounts payable.
We evaluated all available-for-sale investments for which the fair value was less than amortized cost for impairment on an individual security basis atSeptember 30, 2018 . This assessment included consideration of our intent and ability to hold the security and the
52
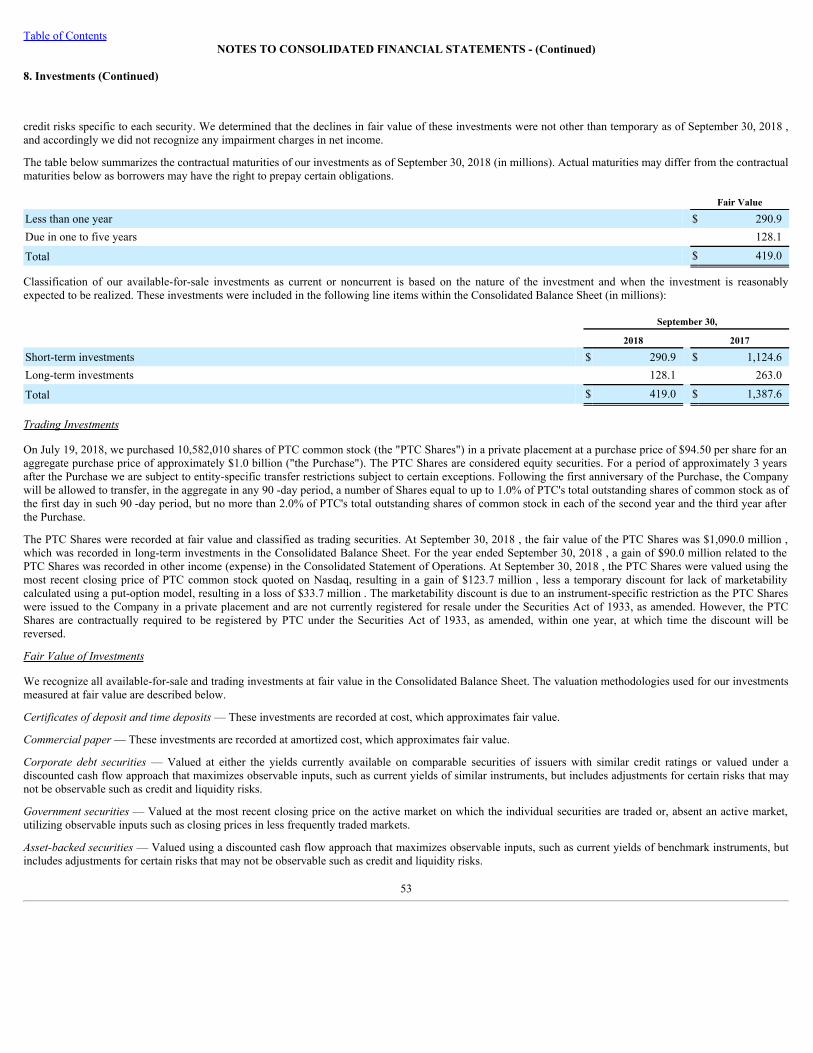
Table of ContentsNOTES TO CONSOLIDATED FINANCIAL STATEMENTS - (Continued)
8. Investments (Continued)
credit risks specific to each security. We determined that the declines in fair value of these investments were not other than temporary as of September 30, 2018 ,and accordingly we did not recognize any impairment charges in net income.
The table below summarizes the contractual maturities of our investments as of September 30, 2018 (in millions). Actual maturities may differ from the contractualmaturities below as borrowers may have the right to prepay certain obligations.
Fair Value
Less than one year $ 290.9Due in one to five years 128.1
Total $ 419.0
Classification of our available-for-sale investments as current or noncurrent is based on the nature of the investment and when the investment is reasonablyexpected to be realized. These investments were included in the following line items within the Consolidated Balance Sheet (in millions):
September 30,
2018 2017
Short-term investments $ 290.9 $ 1,124.6Long-term investments 128.1 263.0
Total $ 419.0 $ 1,387.6
TradingInvestments
On July 19, 2018, we purchased 10,582,010 shares of PTC common stock (the "PTC Shares") in a private placement at a purchase price of $94.50 per share for anaggregate purchase price of approximately $1.0 billion ("the Purchase"). The PTC Shares are considered equity securities. For a period of approximately 3 yearsafter the Purchase we are subject to entity-specific transfer restrictions subject to certain exceptions. Following the first anniversary of the Purchase, the Companywill be allowed to transfer, in the aggregate in any 90 -day period, a number of Shares equal to up to 1.0% of PTC's total outstanding shares of common stock as ofthe first day in such 90 -day period, but no more than 2.0% of PTC's total outstanding shares of common stock in each of the second year and the third year afterthe Purchase.
The PTC Shares were recorded at fair value and classified as trading securities. At September 30, 2018 , the fair value of the PTC Shares was $1,090.0 million ,which was recorded in long-term investments in the Consolidated Balance Sheet. For the year ended September 30, 2018 , a gain of $90.0 million related to thePTC Shares was recorded in other income (expense) in the Consolidated Statement of Operations. At September 30, 2018 , the PTC Shares were valued using themost recent closing price of PTC common stock quoted on Nasdaq, resulting in a gain of $123.7 million , less a temporary discount for lack of marketabilitycalculated using a put-option model, resulting in a loss of $33.7 million . The marketability discount is due to an instrument-specific restriction as the PTC Shareswere issued to the Company in a private placement and are not currently registered for resale under the Securities Act of 1933, as amended. However, the PTCShares are contractually required to be registered by PTC under the Securities Act of 1933, as amended, within one year, at which time the discount will bereversed.
FairValueofInvestments
We recognize all available-for-sale and trading investments at fair value in the Consolidated Balance Sheet. The valuation methodologies used for our investmentsmeasured at fair value are described below.
Certificatesofdepositandtimedeposits— These investments are recorded at cost, which approximates fair value.
Commercialpaper— These investments are recorded at amortized cost, which approximates fair value.
Corporate debt securities— Valued at either the yields currently available on comparable securities of issuers with similar credit ratings or valued under adiscounted cash flow approach that maximizes observable inputs, such as current yields of similar instruments, but includes adjustments for certain risks that maynot be observable such as credit and liquidity risks.
Governmentsecurities— Valued at the most recent closing price on the active market on which the individual securities are traded or, absent an active market,utilizing observable inputs such as closing prices in less frequently traded markets.
Asset-backedsecurities— Valued using a discounted cash flow approach that maximizes observable inputs, such as current yields of benchmark instruments, butincludes adjustments for certain risks that may not be observable such as credit and liquidity risks.
53
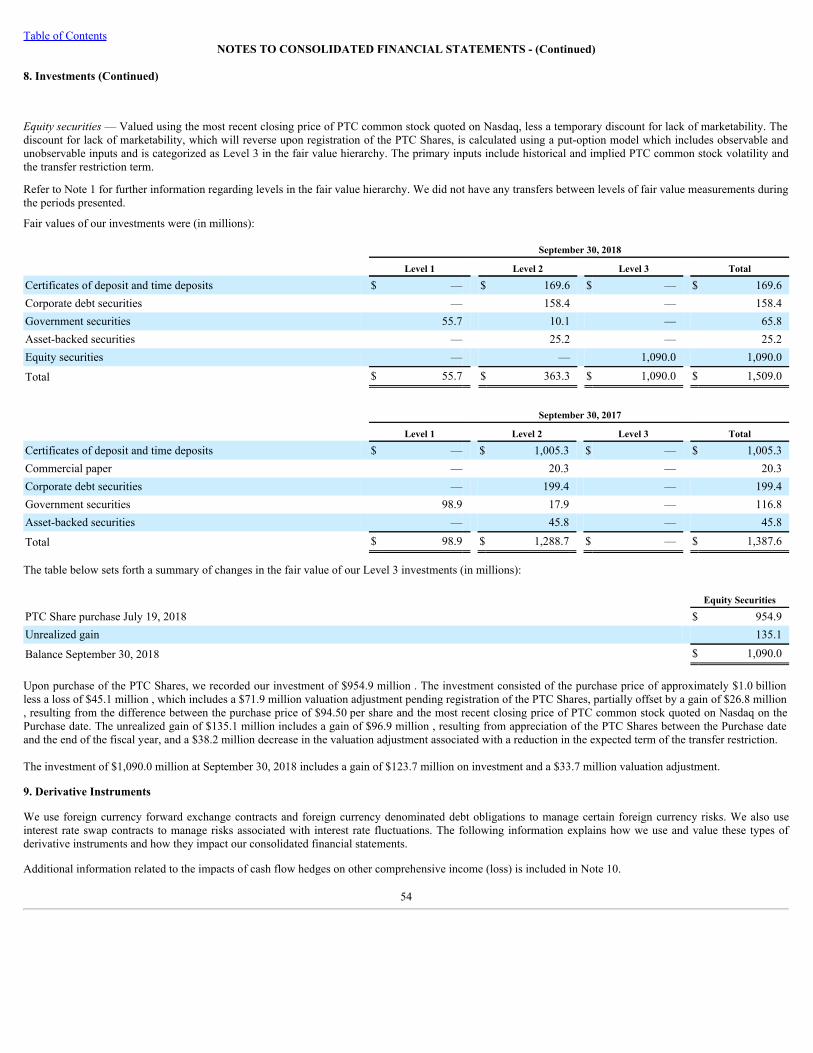
Table of ContentsNOTES TO CONSOLIDATED FINANCIAL STATEMENTS - (Continued)
8. Investments (Continued)
Equitysecurities— Valued using the most recent closing price of PTC common stock quoted on Nasdaq, less a temporary discount for lack of marketability. Thediscount for lack of marketability, which will reverse upon registration of the PTC Shares, is calculated using a put-option model which includes observable andunobservable inputs and is categorized as Level 3 in the fair value hierarchy. The primary inputs include historical and implied PTC common stock volatility andthe transfer restriction term.
Refer to Note 1 for further information regarding levels in the fair value hierarchy. We did not have any transfers between levels of fair value measurements duringthe periods presented.
Fair values of our investments were (in millions):
September 30, 2018
Level 1 Level 2 Level 3 Total
Certificates of deposit and time deposits $ — $ 169.6 $ — $ 169.6Corporate debt securities — 158.4 — 158.4Government securities 55.7 10.1 — 65.8Asset-backed securities — 25.2 — 25.2Equity securities — — 1,090.0 1,090.0
Total $ 55.7 $ 363.3 $ 1,090.0 $ 1,509.0
September 30, 2017
Level 1 Level 2 Level 3 Total
Certificates of deposit and time deposits $ — $ 1,005.3 $ — $ 1,005.3Commercial paper — 20.3 — 20.3Corporate debt securities — 199.4 — 199.4Government securities 98.9 17.9 — 116.8Asset-backed securities — 45.8 — 45.8
Total $ 98.9 $ 1,288.7 $ — $ 1,387.6
The table below sets forth a summary of changes in the fair value of our Level 3 investments (in millions):
Equity Securities
PTC Share purchase July 19, 2018 $ 954.9Unrealized gain 135.1
Balance September 30, 2018 $ 1,090.0
Upon purchase of the PTC Shares, we recorded our investment of $954.9 million . The investment consisted of the purchase price of approximately $1.0 billionless a loss of $45.1 million , which includes a $71.9 million valuation adjustment pending registration of the PTC Shares, partially offset by a gain of $26.8 million, resulting from the difference between the purchase price of $94.50 per share and the most recent closing price of PTC common stock quoted on Nasdaq on thePurchase date. The unrealized gain of $135.1 million includes a gain of $96.9 million , resulting from appreciation of the PTC Shares between the Purchase dateand the end of the fiscal year, and a $38.2 million decrease in the valuation adjustment associated with a reduction in the expected term of the transfer restriction.
The investment of $1,090.0 million at September 30, 2018 includes a gain of $123.7 million on investment and a $33.7 million valuation adjustment.
9. Derivative Instruments
We use foreign currency forward exchange contracts and foreign currency denominated debt obligations to manage certain foreign currency risks. We also useinterest rate swap contracts to manage risks associated with interest rate fluctuations. The following information explains how we use and value these types ofderivative instruments and how they impact our consolidated financial statements.
Additional information related to the impacts of cash flow hedges on other comprehensive income (loss) is included in Note 10.
54
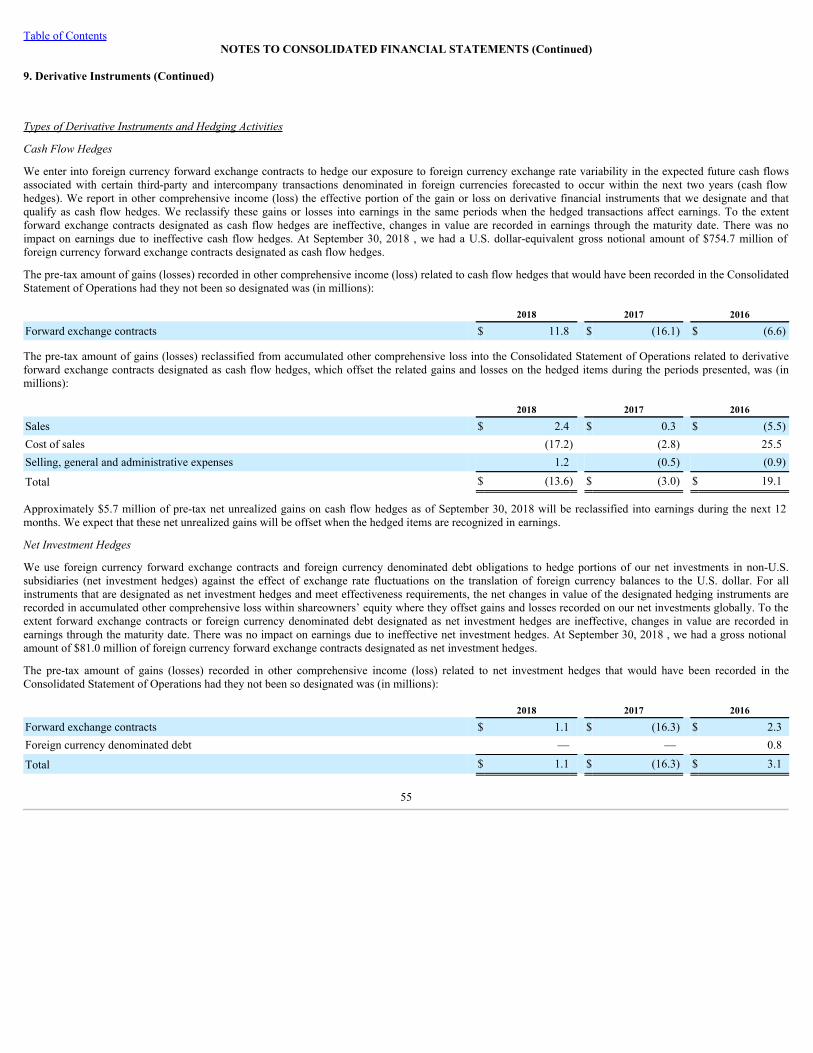
Table of ContentsNOTES TO CONSOLIDATED FINANCIAL STATEMENTS (Continued)
9. Derivative Instruments (Continued)
TypesofDerivativeInstrumentsandHedgingActivities
CashFlowHedges
We enter into foreign currency forward exchange contracts to hedge our exposure to foreign currency exchange rate variability in the expected future cash flowsassociated with certain third-party and intercompany transactions denominated in foreign currencies forecasted to occur within the next two years (cash flowhedges). We report in other comprehensive income (loss) the effective portion of the gain or loss on derivative financial instruments that we designate and thatqualify as cash flow hedges. We reclassify these gains or losses into earnings in the same periods when the hedged transactions affect earnings. To the extentforward exchange contracts designated as cash flow hedges are ineffective, changes in value are recorded in earnings through the maturity date. There was noimpact on earnings due to ineffective cash flow hedges. At September 30, 2018 , we had a U.S. dollar-equivalent gross notional amount of $754.7 million offoreign currency forward exchange contracts designated as cash flow hedges.
The pre-tax amount of gains (losses) recorded in other comprehensive income (loss) related to cash flow hedges that would have been recorded in the ConsolidatedStatement of Operations had they not been so designated was (in millions):
2018 2017 2016
Forward exchange contracts $ 11.8 $ (16.1) $ (6.6)
The pre-tax amount of gains (losses) reclassified from accumulated other comprehensive loss into the Consolidated Statement of Operations related to derivativeforward exchange contracts designated as cash flow hedges, which offset the related gains and losses on the hedged items during the periods presented, was (inmillions):
2018 2017 2016
Sales $ 2.4 $ 0.3 $ (5.5)Cost of sales (17.2) (2.8) 25.5Selling, general and administrative expenses 1.2 (0.5) (0.9)
Total $ (13.6) $ (3.0) $ 19.1
Approximately $5.7 million of pre-tax net unrealized gains on cash flow hedges as of September 30, 2018 will be reclassified into earnings during the next 12months. We expect that these net unrealized gains will be offset when the hedged items are recognized in earnings.
NetInvestmentHedges
We use foreign currency forward exchange contracts and foreign currency denominated debt obligations to hedge portions of our net investments in non-U.S.subsidiaries (net investment hedges) against the effect of exchange rate fluctuations on the translation of foreign currency balances to the U.S. dollar. For allinstruments that are designated as net investment hedges and meet effectiveness requirements, the net changes in value of the designated hedging instruments arerecorded in accumulated other comprehensive loss within shareowners’ equity where they offset gains and losses recorded on our net investments globally. To theextent forward exchange contracts or foreign currency denominated debt designated as net investment hedges are ineffective, changes in value are recorded inearnings through the maturity date. There was no impact on earnings due to ineffective net investment hedges. At September 30, 2018 , we had a gross notionalamount of $81.0 million of foreign currency forward exchange contracts designated as net investment hedges.
The pre-tax amount of gains (losses) recorded in other comprehensive income (loss) related to net investment hedges that would have been recorded in theConsolidated Statement of Operations had they not been so designated was (in millions):
2018 2017 2016
Forward exchange contracts $ 1.1 $ (16.3) $ 2.3Foreign currency denominated debt — — 0.8
Total $ 1.1 $ (16.3) $ 3.1
55
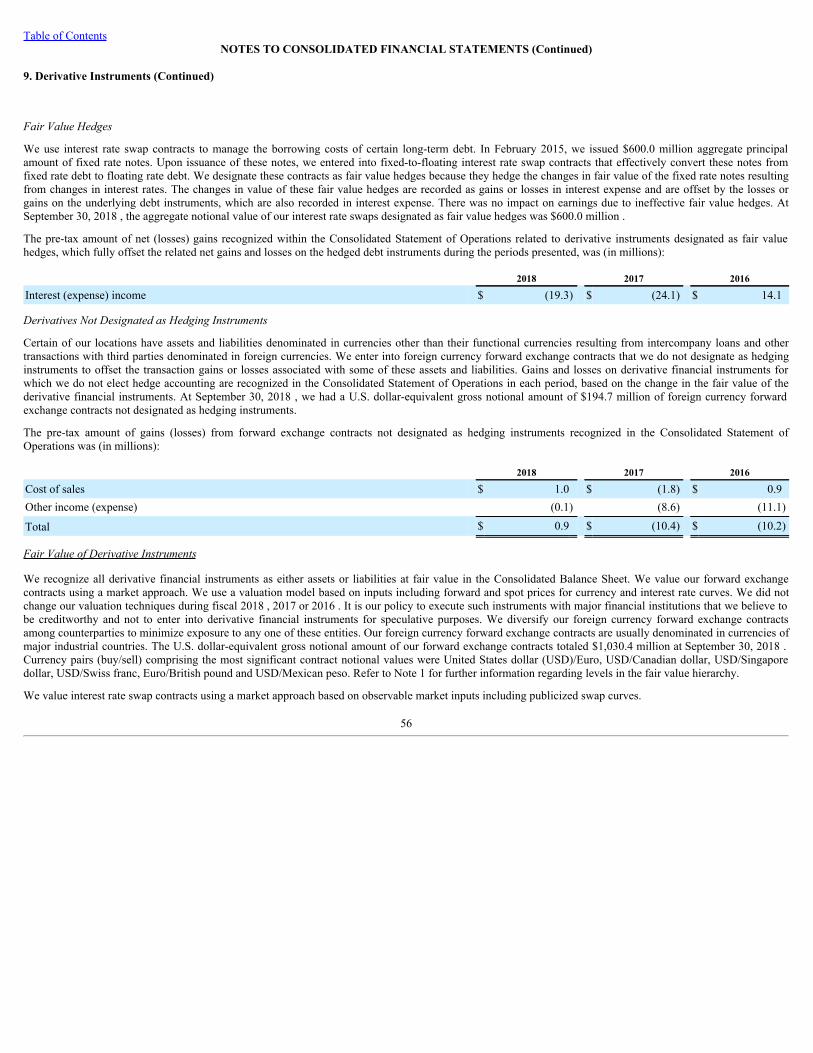
Table of ContentsNOTES TO CONSOLIDATED FINANCIAL STATEMENTS (Continued)
9. Derivative Instruments (Continued)
FairValueHedges
We use interest rate swap contracts to manage the borrowing costs of certain long-term debt. In February 2015, we issued $600.0 million aggregate principalamount of fixed rate notes. Upon issuance of these notes, we entered into fixed-to-floating interest rate swap contracts that effectively convert these notes fromfixed rate debt to floating rate debt. We designate these contracts as fair value hedges because they hedge the changes in fair value of the fixed rate notes resultingfrom changes in interest rates. The changes in value of these fair value hedges are recorded as gains or losses in interest expense and are offset by the losses orgains on the underlying debt instruments, which are also recorded in interest expense. There was no impact on earnings due to ineffective fair value hedges. AtSeptember 30, 2018 , the aggregate notional value of our interest rate swaps designated as fair value hedges was $600.0 million .
The pre-tax amount of net (losses) gains recognized within the Consolidated Statement of Operations related to derivative instruments designated as fair valuehedges, which fully offset the related net gains and losses on the hedged debt instruments during the periods presented, was (in millions):
2018 2017 2016
Interest (expense) income $ (19.3) $ (24.1) $ 14.1
DerivativesNotDesignatedasHedgingInstruments
Certain of our locations have assets and liabilities denominated in currencies other than their functional currencies resulting from intercompany loans and othertransactions with third parties denominated in foreign currencies. We enter into foreign currency forward exchange contracts that we do not designate as hedginginstruments to offset the transaction gains or losses associated with some of these assets and liabilities. Gains and losses on derivative financial instruments forwhich we do not elect hedge accounting are recognized in the Consolidated Statement of Operations in each period, based on the change in the fair value of thederivative financial instruments. At September 30, 2018 , we had a U.S. dollar-equivalent gross notional amount of $194.7 million of foreign currency forwardexchange contracts not designated as hedging instruments.
The pre-tax amount of gains (losses) from forward exchange contracts not designated as hedging instruments recognized in the Consolidated Statement ofOperations was (in millions):
2018 2017 2016
Cost of sales $ 1.0 $ (1.8) $ 0.9Other income (expense) (0.1) (8.6) (11.1)
Total $ 0.9 $ (10.4) $ (10.2)
FairValueofDerivativeInstruments
We recognize all derivative financial instruments as either assets or liabilities at fair value in the Consolidated Balance Sheet. We value our forward exchangecontracts using a market approach. We use a valuation model based on inputs including forward and spot prices for currency and interest rate curves. We did notchange our valuation techniques during fiscal 2018 , 2017 or 2016 . It is our policy to execute such instruments with major financial institutions that we believe tobe creditworthy and not to enter into derivative financial instruments for speculative purposes. We diversify our foreign currency forward exchange contractsamong counterparties to minimize exposure to any one of these entities. Our foreign currency forward exchange contracts are usually denominated in currencies ofmajor industrial countries. The U.S. dollar-equivalent gross notional amount of our forward exchange contracts totaled $1,030.4 million at September 30, 2018 .Currency pairs (buy/sell) comprising the most significant contract notional values were United States dollar (USD)/Euro, USD/Canadian dollar, USD/Singaporedollar, USD/Swiss franc, Euro/British pound and USD/Mexican peso. Refer to Note 1 for further information regarding levels in the fair value hierarchy.
We value interest rate swap contracts using a market approach based on observable market inputs including publicized swap curves.
56
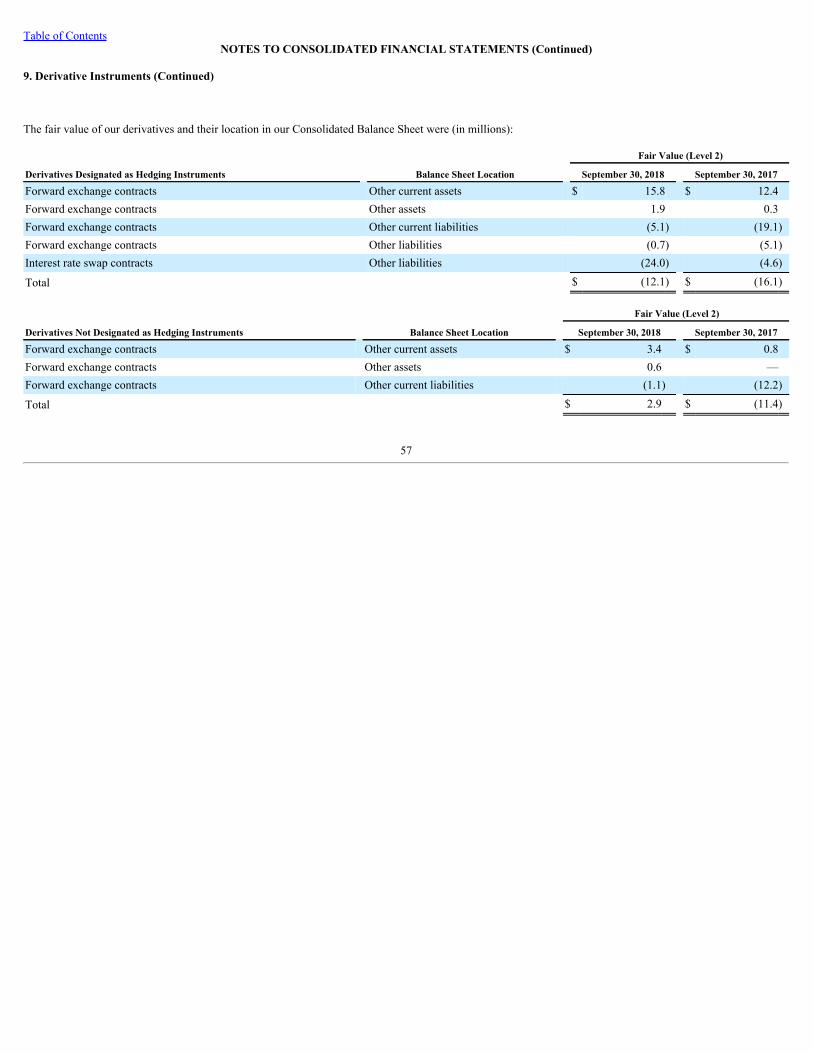
Table of ContentsNOTES TO CONSOLIDATED FINANCIAL STATEMENTS (Continued)
9. Derivative Instruments (Continued)
The fair value of our derivatives and their location in our Consolidated Balance Sheet were (in millions):
Fair Value (Level 2)
Derivatives Designated as Hedging Instruments Balance Sheet Location September 30, 2018 September 30, 2017
Forward exchange contracts Other current assets $ 15.8 $ 12.4Forward exchange contracts Other assets 1.9 0.3Forward exchange contracts Other current liabilities (5.1) (19.1)Forward exchange contracts Other liabilities (0.7) (5.1)Interest rate swap contracts Other liabilities (24.0) (4.6)
Total $ (12.1) $ (16.1)
Fair Value (Level 2)
Derivatives Not Designated as Hedging Instruments Balance Sheet Location September 30, 2018 September 30, 2017
Forward exchange contracts Other current assets $ 3.4 $ 0.8Forward exchange contracts Other assets 0.6 —Forward exchange contracts Other current liabilities (1.1) (12.2)
Total $ 2.9 $ (11.4)
57
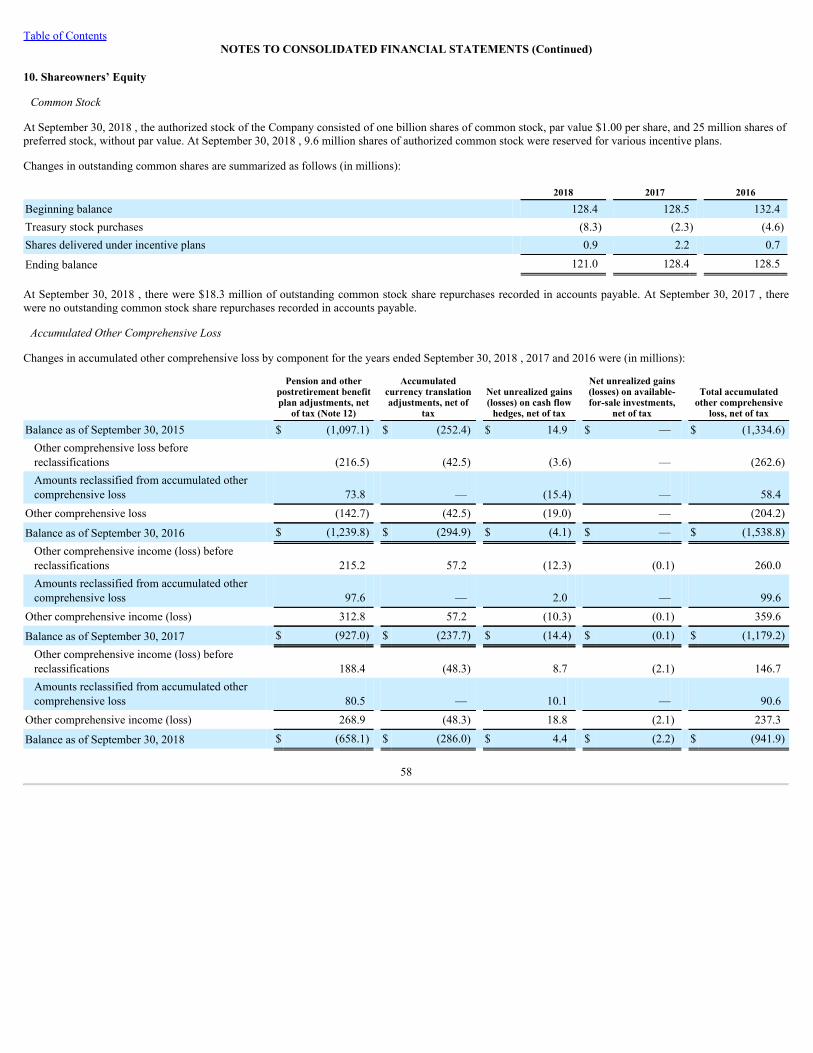
Table of ContentsNOTES TO CONSOLIDATED FINANCIAL STATEMENTS (Continued)
10. Shareowners’ Equity
CommonStock
At September 30, 2018 , the authorized stock of the Company consisted of one billion shares of common stock, par value $1.00 per share, and 25 million shares ofpreferred stock, without par value. At September 30, 2018 , 9.6 million shares of authorized common stock were reserved for various incentive plans.
Changes in outstanding common shares are summarized as follows (in millions):
2018 2017 2016
Beginning balance 128.4 128.5 132.4Treasury stock purchases (8.3) (2.3) (4.6)Shares delivered under incentive plans 0.9 2.2 0.7
Ending balance 121.0 128.4 128.5
At September 30, 2018 , there were $18.3 million of outstanding common stock share repurchases recorded in accounts payable. At September 30, 2017 , therewere no outstanding common stock share repurchases recorded in accounts payable.
AccumulatedOtherComprehensiveLoss
Changes in accumulated other comprehensive loss by component for the years ended September 30, 2018 , 2017 and 2016 were (in millions):
Pension and otherpostretirement benefitplan adjustments, net
of tax (Note 12)
Accumulatedcurrency translationadjustments, net of
tax
Net unrealized gains(losses) on cash flow
hedges, net of tax
Net unrealized gains(losses) on available-for-sale investments,
net of tax
Total accumulatedother comprehensive
loss, net of tax
Balance as of September 30, 2015 $ (1,097.1) $ (252.4) $ 14.9 $ — $ (1,334.6)Other comprehensive loss beforereclassifications (216.5) (42.5) (3.6) — (262.6)Amounts reclassified from accumulated othercomprehensive loss 73.8 — (15.4) — 58.4
Other comprehensive loss (142.7) (42.5) (19.0) — (204.2)
Balance as of September 30, 2016 $ (1,239.8) $ (294.9) $ (4.1) $ — $ (1,538.8)Other comprehensive income (loss) beforereclassifications 215.2 57.2 (12.3) (0.1) 260.0Amounts reclassified from accumulated othercomprehensive loss 97.6 — 2.0 — 99.6
Other comprehensive income (loss) 312.8 57.2 (10.3) (0.1) 359.6
Balance as of September 30, 2017 $ (927.0) $ (237.7) $ (14.4) $ (0.1) $ (1,179.2)Other comprehensive income (loss) beforereclassifications 188.4 (48.3) 8.7 (2.1) 146.7Amounts reclassified from accumulated othercomprehensive loss 80.5 — 10.1 — 90.6
Other comprehensive income (loss) 268.9 (48.3) 18.8 (2.1) 237.3
Balance as of September 30, 2018 $ (658.1) $ (286.0) $ 4.4 $ (2.2) $ (941.9)
58
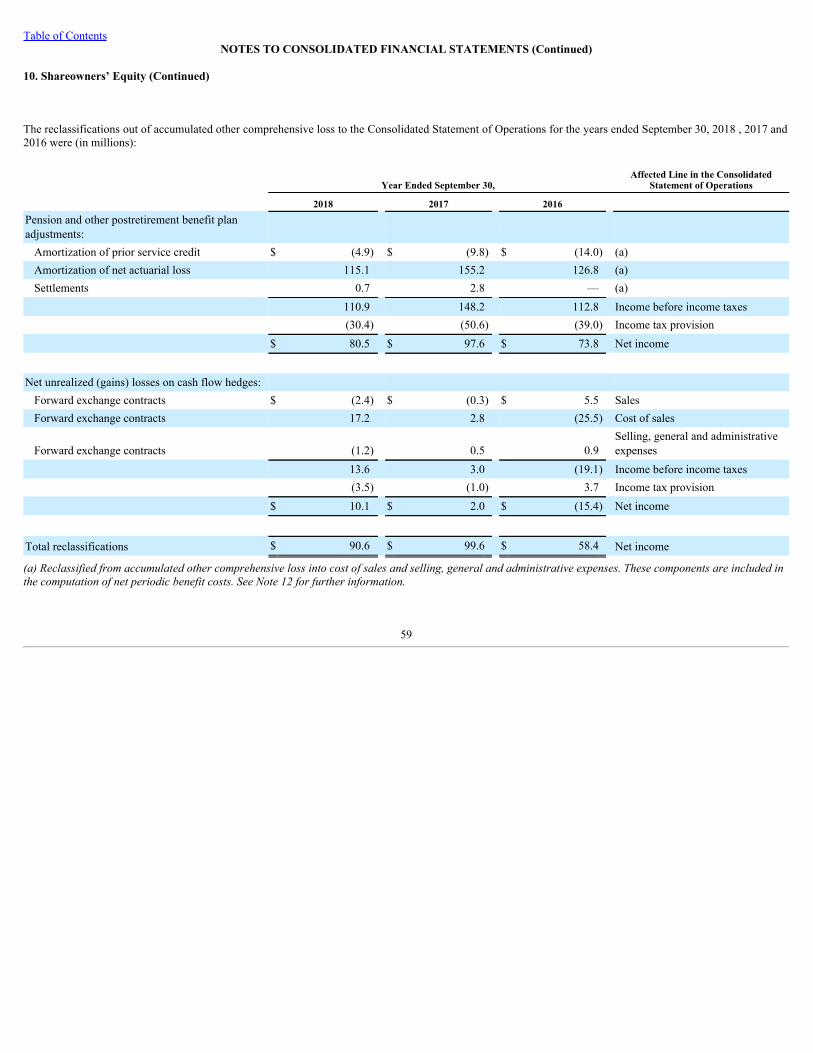
Table of ContentsNOTES TO CONSOLIDATED FINANCIAL STATEMENTS (Continued)
10. Shareowners’ Equity (Continued)
The reclassifications out of accumulated other comprehensive loss to the Consolidated Statement of Operations for the years ended September 30, 2018 , 2017 and2016 were (in millions):
Year Ended September 30, Affected Line in the Consolidated
Statement of Operations
2018 2017 2016 Pension and other postretirement benefit planadjustments:
Amortization of prior service credit $ (4.9) $ (9.8) $ (14.0) (a)Amortization of net actuarial loss 115.1 155.2 126.8 (a)Settlements 0.7 2.8 — (a)
110.9 148.2 112.8 Income before income taxes (30.4) (50.6) (39.0) Income tax provision $ 80.5 $ 97.6 $ 73.8 Net income
Net unrealized (gains) losses on cash flow hedges: Forward exchange contracts $ (2.4) $ (0.3) $ 5.5 SalesForward exchange contracts 17.2 2.8 (25.5) Cost of sales
Forward exchange contracts (1.2) 0.5 0.9 Selling, general and administrativeexpenses
13.6 3.0 (19.1) Income before income taxes (3.5) (1.0) 3.7 Income tax provision $ 10.1 $ 2.0 $ (15.4) Net income
Total reclassifications $ 90.6 $ 99.6 $ 58.4 Net income
(a)Reclassifiedfromaccumulatedothercomprehensivelossintocostofsalesandselling,generalandadministrativeexpenses.Thesecomponentsareincludedinthecomputationofnetperiodicbenefitcosts.SeeNote12forfurtherinformation.
59
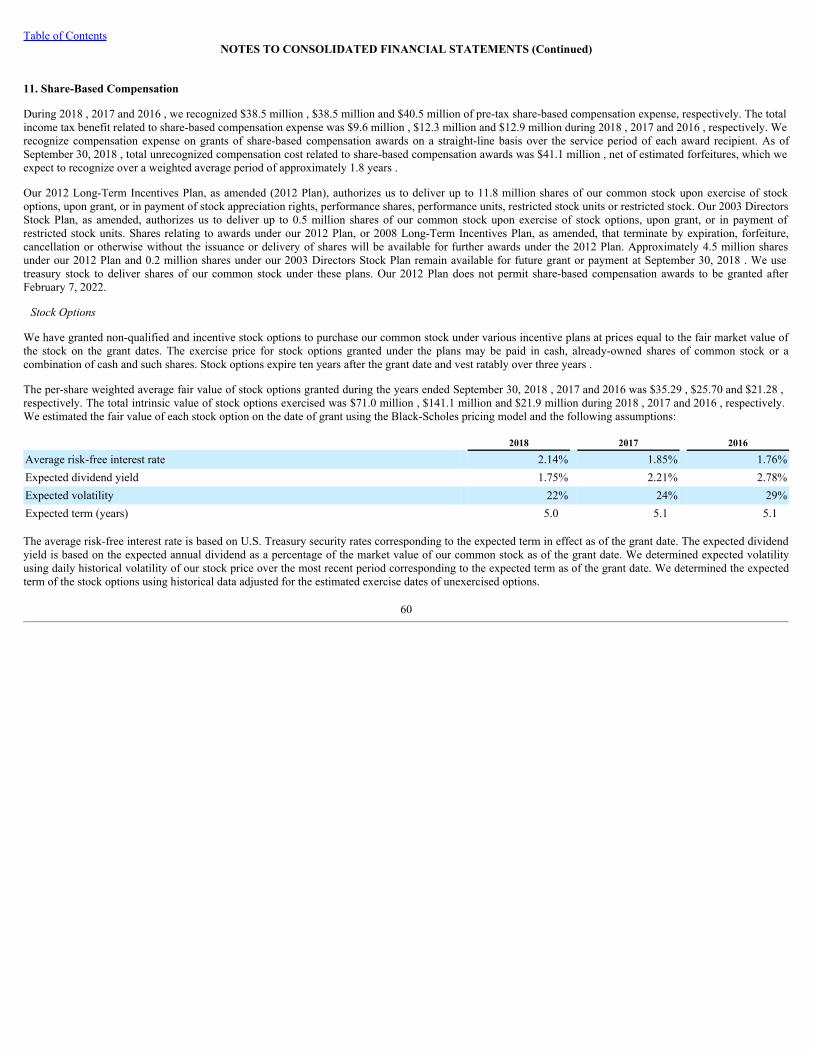
Table of ContentsNOTES TO CONSOLIDATED FINANCIAL STATEMENTS (Continued)
11. Share-Based Compensation
During 2018 , 2017 and 2016 , we recognized $38.5 million , $38.5 million and $40.5 million of pre-tax share-based compensation expense, respectively. The totalincome tax benefit related to share-based compensation expense was $9.6 million , $12.3 million and $12.9 million during 2018 , 2017 and 2016 , respectively. Werecognize compensation expense on grants of share-based compensation awards on a straight-line basis over the service period of each award recipient. As ofSeptember 30, 2018 , total unrecognized compensation cost related to share-based compensation awards was $41.1 million , net of estimated forfeitures, which weexpect to recognize over a weighted average period of approximately 1.8 years .
Our 2012 Long-Term Incentives Plan, as amended (2012 Plan), authorizes us to deliver up to 11.8 million shares of our common stock upon exercise of stockoptions, upon grant, or in payment of stock appreciation rights, performance shares, performance units, restricted stock units or restricted stock. Our 2003 DirectorsStock Plan, as amended, authorizes us to deliver up to 0.5 million shares of our common stock upon exercise of stock options, upon grant, or in payment ofrestricted stock units. Shares relating to awards under our 2012 Plan, or 2008 Long-Term Incentives Plan, as amended, that terminate by expiration, forfeiture,cancellation or otherwise without the issuance or delivery of shares will be available for further awards under the 2012 Plan. Approximately 4.5 million sharesunder our 2012 Plan and 0.2 million shares under our 2003 Directors Stock Plan remain available for future grant or payment at September 30, 2018 . We usetreasury stock to deliver shares of our common stock under these plans. Our 2012 Plan does not permit share-based compensation awards to be granted afterFebruary 7, 2022.
StockOptions
We have granted non-qualified and incentive stock options to purchase our common stock under various incentive plans at prices equal to the fair market value ofthe stock on the grant dates. The exercise price for stock options granted under the plans may be paid in cash, already-owned shares of common stock or acombination of cash and such shares. Stock options expire ten years after the grant date and vest ratably over three years .
The per-share weighted average fair value of stock options granted during the years ended September 30, 2018 , 2017 and 2016 was $35.29 , $25.70 and $21.28 ,respectively. The total intrinsic value of stock options exercised was $71.0 million , $141.1 million and $21.9 million during 2018 , 2017 and 2016 , respectively.We estimated the fair value of each stock option on the date of grant using the Black-Scholes pricing model and the following assumptions:
2018 2017 2016
Average risk-free interest rate 2.14% 1.85% 1.76%Expected dividend yield 1.75% 2.21% 2.78%Expected volatility 22% 24% 29%Expected term (years) 5.0 5.1 5.1
The average risk-free interest rate is based on U.S. Treasury security rates corresponding to the expected term in effect as of the grant date. The expected dividendyield is based on the expected annual dividend as a percentage of the market value of our common stock as of the grant date. We determined expected volatilityusing daily historical volatility of our stock price over the most recent period corresponding to the expected term as of the grant date. We determined the expectedterm of the stock options using historical data adjusted for the estimated exercise dates of unexercised options.
60
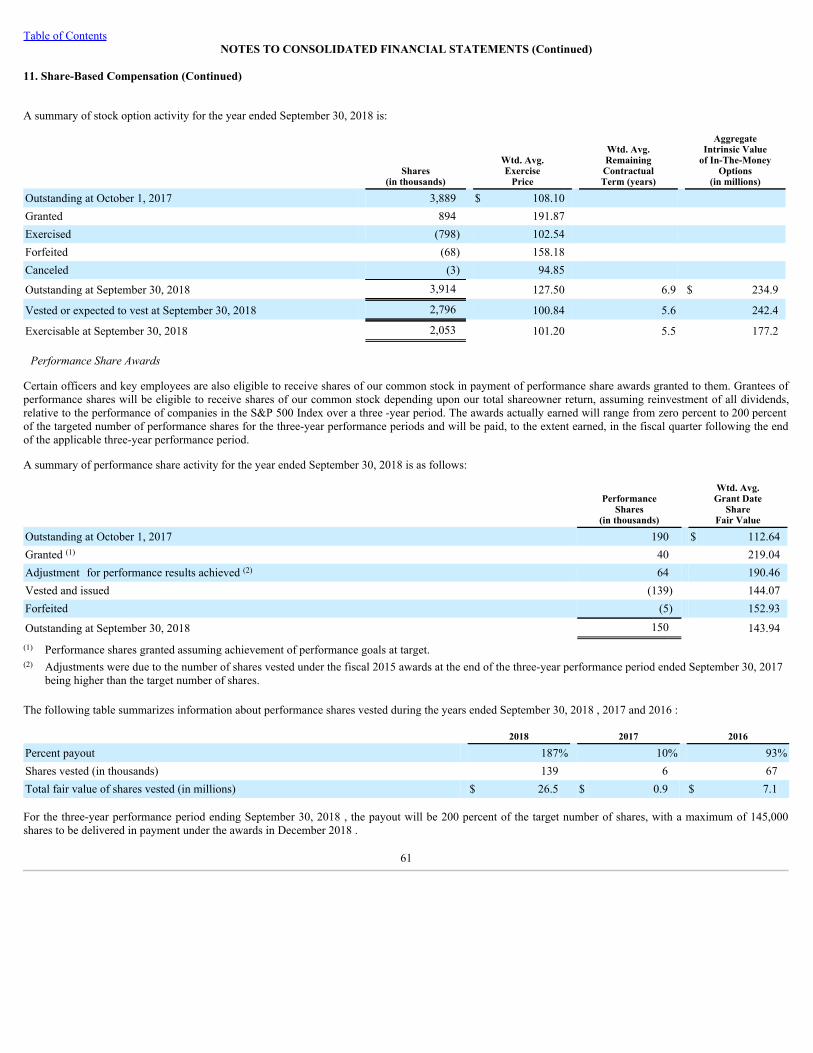
Table of ContentsNOTES TO CONSOLIDATED FINANCIAL STATEMENTS (Continued)
11. Share-Based Compensation (Continued)
A summary of stock option activity for the year ended September 30, 2018 is:
Shares
(in thousands)
Wtd. Avg.Exercise
Price
Wtd. Avg.Remaining
ContractualTerm (years)
AggregateIntrinsic Value
of In-The-MoneyOptions
(in millions)
Outstanding at October 1, 2017 3,889 $ 108.10 Granted 894 191.87 Exercised (798) 102.54 Forfeited (68) 158.18 Canceled (3) 94.85
Outstanding at September 30, 2018 3,914 127.50 6.9 $ 234.9
Vested or expected to vest at September 30, 2018 2,796 100.84 5.6 242.4
Exercisable at September 30, 2018 2,053 101.20 5.5 177.2
PerformanceShareAwards
Certain officers and key employees are also eligible to receive shares of our common stock in payment of performance share awards granted to them. Grantees ofperformance shares will be eligible to receive shares of our common stock depending upon our total shareowner return, assuming reinvestment of all dividends,relative to the performance of companies in the S&P 500 Index over a three -year period. The awards actually earned will range from zero percent to 200 percentof the targeted number of performance shares for the three-year performance periods and will be paid, to the extent earned, in the fiscal quarter following the endof the applicable three-year performance period.
A summary of performance share activity for the year ended September 30, 2018 is as follows:
PerformanceShares
(in thousands)
Wtd. Avg.Grant Date
ShareFair Value
Outstanding at October 1, 2017 190 $ 112.64Granted (1) 40 219.04Adjustment for performance results achieved (2) 64 190.46Vested and issued (139) 144.07Forfeited (5) 152.93
Outstanding at September 30, 2018 150 143.94(1) Performance shares granted assuming achievement of performance goals at target.(2) Adjustments were due to the number of shares vested under the fiscal 2015 awards at the end of the three-year performance period ended September 30, 2017
being higher than the target number of shares.
The following table summarizes information about performance shares vested during the years ended September 30, 2018 , 2017 and 2016 :
2018 2017 2016
Percent payout 187% 10% 93%Shares vested (in thousands) 139 6 67Total fair value of shares vested (in millions) $ 26.5 $ 0.9 $ 7.1
For the three-year performance period ending September 30, 2018 , the payout will be 200 percent of the target number of shares, with a maximum of 145,000shares to be delivered in payment under the awards in December 2018 .
61
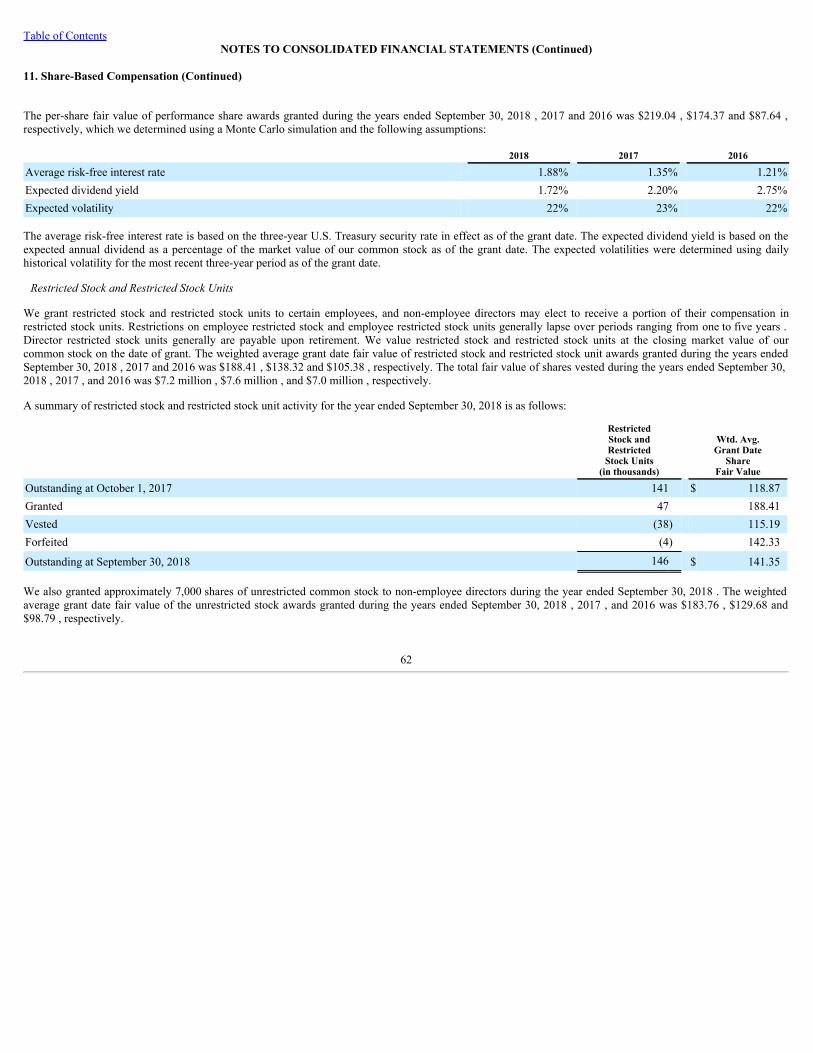
Table of ContentsNOTES TO CONSOLIDATED FINANCIAL STATEMENTS (Continued)
11. Share-Based Compensation (Continued)
The per-share fair value of performance share awards granted during the years ended September 30, 2018 , 2017 and 2016 was $219.04 , $174.37 and $87.64 ,respectively, which we determined using a Monte Carlo simulation and the following assumptions:
2018 2017 2016
Average risk-free interest rate 1.88% 1.35% 1.21%Expected dividend yield 1.72% 2.20% 2.75%Expected volatility 22% 23% 22%
The average risk-free interest rate is based on the three-year U.S. Treasury security rate in effect as of the grant date. The expected dividend yield is based on theexpected annual dividend as a percentage of the market value of our common stock as of the grant date. The expected volatilities were determined using dailyhistorical volatility for the most recent three-year period as of the grant date.
RestrictedStockandRestrictedStockUnits
We grant restricted stock and restricted stock units to certain employees, and non-employee directors may elect to receive a portion of their compensation inrestricted stock units. Restrictions on employee restricted stock and employee restricted stock units generally lapse over periods ranging from one to five years .Director restricted stock units generally are payable upon retirement. We value restricted stock and restricted stock units at the closing market value of ourcommon stock on the date of grant. The weighted average grant date fair value of restricted stock and restricted stock unit awards granted during the years endedSeptember 30, 2018 , 2017 and 2016 was $188.41 , $138.32 and $105.38 , respectively. The total fair value of shares vested during the years ended September 30,2018 , 2017 , and 2016 was $7.2 million , $7.6 million , and $7.0 million , respectively.
A summary of restricted stock and restricted stock unit activity for the year ended September 30, 2018 is as follows:
RestrictedStock andRestricted
Stock Units(in thousands)
Wtd. Avg.Grant Date
ShareFair Value
Outstanding at October 1, 2017 141 $ 118.87Granted 47 188.41Vested (38) 115.19Forfeited (4) 142.33
Outstanding at September 30, 2018 146 $ 141.35
We also granted approximately 7,000 shares of unrestricted common stock to non-employee directors during the year ended September 30, 2018 . The weightedaverage grant date fair value of the unrestricted stock awards granted during the years ended September 30, 2018 , 2017 , and 2016 was $183.76 , $129.68 and$98.79 , respectively.
62
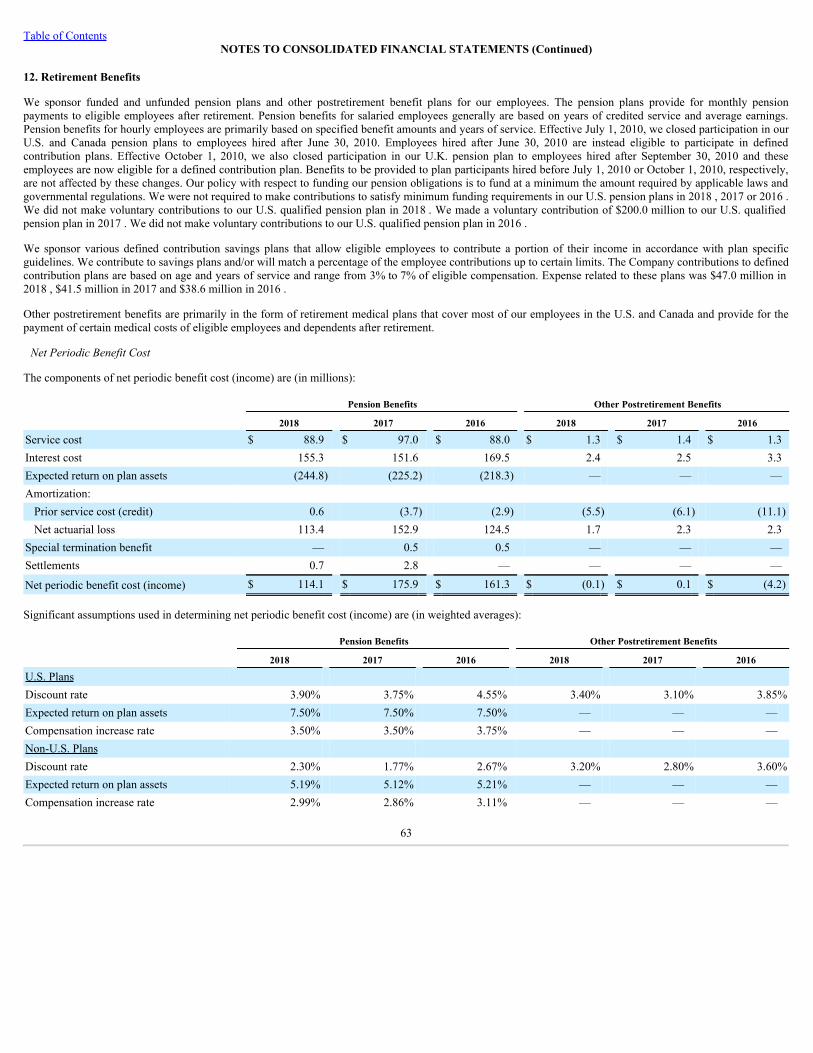
Table of ContentsNOTES TO CONSOLIDATED FINANCIAL STATEMENTS (Continued)
12. Retirement Benefits
We sponsor funded and unfunded pension plans and other postretirement benefit plans for our employees. The pension plans provide for monthly pensionpayments to eligible employees after retirement. Pension benefits for salaried employees generally are based on years of credited service and average earnings.Pension benefits for hourly employees are primarily based on specified benefit amounts and years of service. Effective July 1, 2010, we closed participation in ourU.S. and Canada pension plans to employees hired after June 30, 2010. Employees hired after June 30, 2010 are instead eligible to participate in definedcontribution plans. Effective October 1, 2010, we also closed participation in our U.K. pension plan to employees hired after September 30, 2010 and theseemployees are now eligible for a defined contribution plan. Benefits to be provided to plan participants hired before July 1, 2010 or October 1, 2010, respectively,are not affected by these changes. Our policy with respect to funding our pension obligations is to fund at a minimum the amount required by applicable laws andgovernmental regulations. We were not required to make contributions to satisfy minimum funding requirements in our U.S. pension plans in 2018 , 2017 or 2016 .We did not make voluntary contributions to our U.S. qualified pension plan in 2018 . We made a voluntary contribution of $200.0 million to our U.S. qualifiedpension plan in 2017 . We did not make voluntary contributions to our U.S. qualified pension plan in 2016 .
We sponsor various defined contribution savings plans that allow eligible employees to contribute a portion of their income in accordance with plan specificguidelines. We contribute to savings plans and/or will match a percentage of the employee contributions up to certain limits. The Company contributions to definedcontribution plans are based on age and years of service and range from 3% to 7% of eligible compensation. Expense related to these plans was $47.0 million in2018 , $41.5 million in 2017 and $38.6 million in 2016 .
Other postretirement benefits are primarily in the form of retirement medical plans that cover most of our employees in the U.S. and Canada and provide for thepayment of certain medical costs of eligible employees and dependents after retirement.
NetPeriodicBenefitCost
The components of net periodic benefit cost (income) are (in millions):
Pension Benefits Other Postretirement Benefits
2018 2017 2016 2018 2017 2016
Service cost $ 88.9 $ 97.0 $ 88.0 $ 1.3 $ 1.4 $ 1.3Interest cost 155.3 151.6 169.5 2.4 2.5 3.3Expected return on plan assets (244.8) (225.2) (218.3) — — —Amortization:
Prior service cost (credit) 0.6 (3.7) (2.9) (5.5) (6.1) (11.1)Net actuarial loss 113.4 152.9 124.5 1.7 2.3 2.3
Special termination benefit — 0.5 0.5 — — —Settlements 0.7 2.8 — — — —
Net periodic benefit cost (income) $ 114.1 $ 175.9 $ 161.3 $ (0.1) $ 0.1 $ (4.2)
Significant assumptions used in determining net periodic benefit cost (income) are (in weighted averages):
Pension Benefits Other Postretirement Benefits
2018 2017 2016 2018 2017 2016
U.S. Plans Discount rate 3.90% 3.75% 4.55% 3.40% 3.10% 3.85%Expected return on plan assets 7.50% 7.50% 7.50% — — —Compensation increase rate 3.50% 3.50% 3.75% — — —Non-U.S. Plans Discount rate 2.30% 1.77% 2.67% 3.20% 2.80% 3.60%Expected return on plan assets 5.19% 5.12% 5.21% — — —Compensation increase rate 2.99% 2.86% 3.11% — — —
63
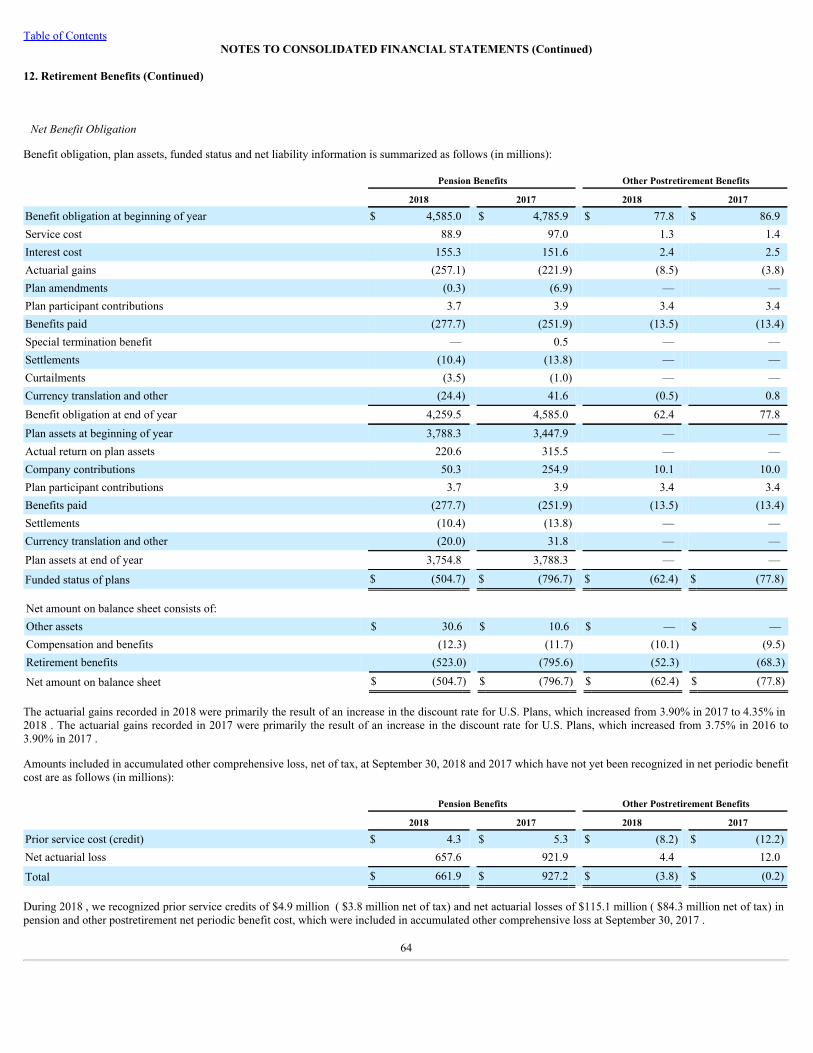
Table of ContentsNOTES TO CONSOLIDATED FINANCIAL STATEMENTS (Continued)
12. Retirement Benefits (Continued)
NetBenefitObligation
Benefit obligation, plan assets, funded status and net liability information is summarized as follows (in millions):
Pension Benefits Other Postretirement Benefits
2018 2017 2018 2017
Benefit obligation at beginning of year $ 4,585.0 $ 4,785.9 $ 77.8 $ 86.9Service cost 88.9 97.0 1.3 1.4Interest cost 155.3 151.6 2.4 2.5Actuarial gains (257.1) (221.9) (8.5) (3.8)Plan amendments (0.3) (6.9) — —Plan participant contributions 3.7 3.9 3.4 3.4Benefits paid (277.7) (251.9) (13.5) (13.4)Special termination benefit — 0.5 — —Settlements (10.4) (13.8) — —Curtailments (3.5) (1.0) — —Currency translation and other (24.4) 41.6 (0.5) 0.8Benefit obligation at end of year 4,259.5 4,585.0 62.4 77.8Plan assets at beginning of year 3,788.3 3,447.9 — —Actual return on plan assets 220.6 315.5 — —Company contributions 50.3 254.9 10.1 10.0Plan participant contributions 3.7 3.9 3.4 3.4Benefits paid (277.7) (251.9) (13.5) (13.4)Settlements (10.4) (13.8) — —Currency translation and other (20.0) 31.8 — —Plan assets at end of year 3,754.8 3,788.3 — —
Funded status of plans $ (504.7) $ (796.7) $ (62.4) $ (77.8)
Net amount on balance sheet consists of: Other assets $ 30.6 $ 10.6 $ — $ —Compensation and benefits (12.3) (11.7) (10.1) (9.5)Retirement benefits (523.0) (795.6) (52.3) (68.3)
Net amount on balance sheet $ (504.7) $ (796.7) $ (62.4) $ (77.8)
The actuarial gains recorded in 2018 were primarily the result of an increase in the discount rate for U.S. Plans, which increased from 3.90% in 2017 to 4.35% in2018 . The actuarial gains recorded in 2017 were primarily the result of an increase in the discount rate for U.S. Plans, which increased from 3.75% in 2016 to3.90% in 2017 .
Amounts included in accumulated other comprehensive loss, net of tax, at September 30, 2018 and 2017 which have not yet been recognized in net periodic benefitcost are as follows (in millions):
Pension Benefits Other Postretirement Benefits
2018 2017 2018 2017
Prior service cost (credit) $ 4.3 $ 5.3 $ (8.2) $ (12.2)Net actuarial loss 657.6 921.9 4.4 12.0
Total $ 661.9 $ 927.2 $ (3.8) $ (0.2)
During 2018 , we recognized prior service credits of $4.9 million ( $3.8 million net of tax) and net actuarial losses of $115.1 million ( $84.3 million net of tax) inpension and other postretirement net periodic benefit cost, which were included in accumulated other comprehensive loss at September 30, 2017 .
64
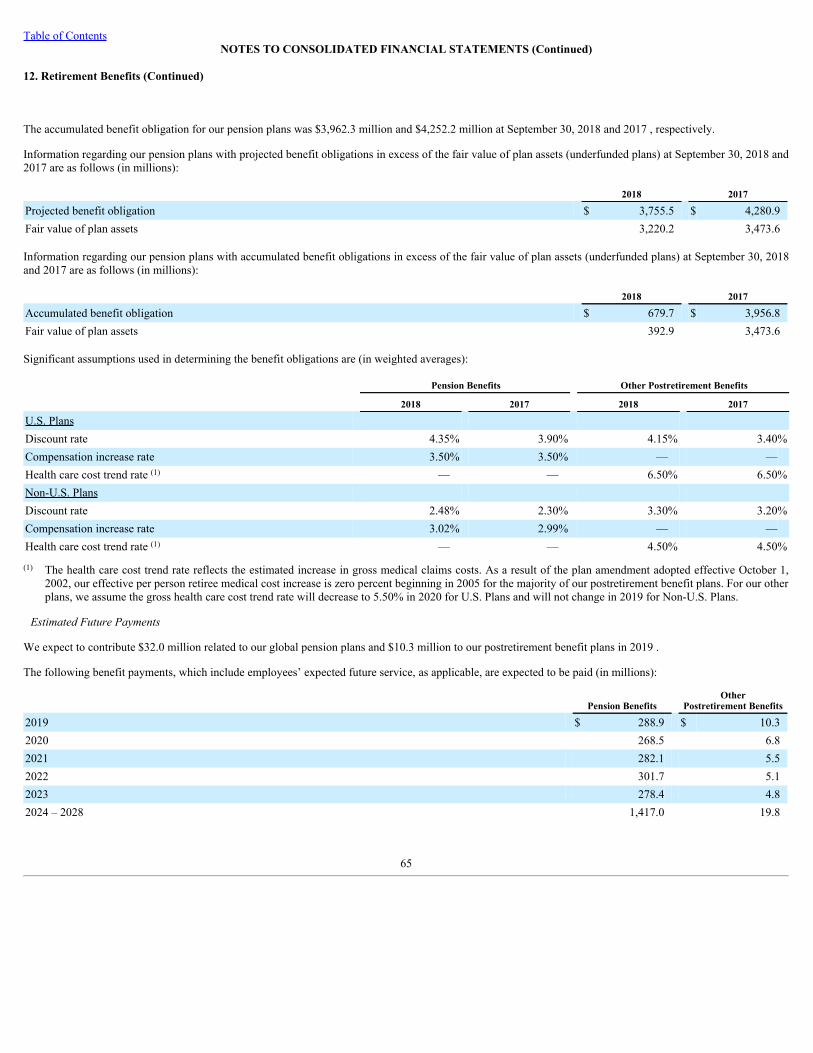
Table of ContentsNOTES TO CONSOLIDATED FINANCIAL STATEMENTS (Continued)
12. Retirement Benefits (Continued)
The accumulated benefit obligation for our pension plans was $3,962.3 million and $4,252.2 million at September 30, 2018 and 2017 , respectively.
Information regarding our pension plans with projected benefit obligations in excess of the fair value of plan assets (underfunded plans) at September 30, 2018 and2017 are as follows (in millions):
2018 2017
Projected benefit obligation $ 3,755.5 $ 4,280.9Fair value of plan assets 3,220.2 3,473.6
Information regarding our pension plans with accumulated benefit obligations in excess of the fair value of plan assets (underfunded plans) at September 30, 2018and 2017 are as follows (in millions):
2018 2017
Accumulated benefit obligation $ 679.7 $ 3,956.8Fair value of plan assets 392.9 3,473.6
Significant assumptions used in determining the benefit obligations are (in weighted averages):
Pension Benefits Other Postretirement Benefits
2018 2017 2018 2017
U.S. Plans Discount rate 4.35% 3.90% 4.15% 3.40%Compensation increase rate 3.50% 3.50% — —Health care cost trend rate (1) — — 6.50% 6.50%Non-U.S. Plans Discount rate 2.48% 2.30% 3.30% 3.20%Compensation increase rate 3.02% 2.99% — —Health care cost trend rate (1) — — 4.50% 4.50%
(1) The health care cost trend rate reflects the estimated increase in gross medical claims costs. As a result of the plan amendment adopted effective October 1,2002, our effective per person retiree medical cost increase is zero percent beginning in 2005 for the majority of our postretirement benefit plans. For our otherplans, we assume the gross health care cost trend rate will decrease to 5.50% in 2020 for U.S. Plans and will not change in 2019 for Non-U.S. Plans.
EstimatedFuturePayments
We expect to contribute $32.0 million related to our global pension plans and $10.3 million to our postretirement benefit plans in 2019 .
The following benefit payments, which include employees’ expected future service, as applicable, are expected to be paid (in millions):
Pension Benefits Other
Postretirement Benefits
2019 $ 288.9 $ 10.32020 268.5 6.82021 282.1 5.52022 301.7 5.12023 278.4 4.82024 – 2028 1,417.0 19.8
65
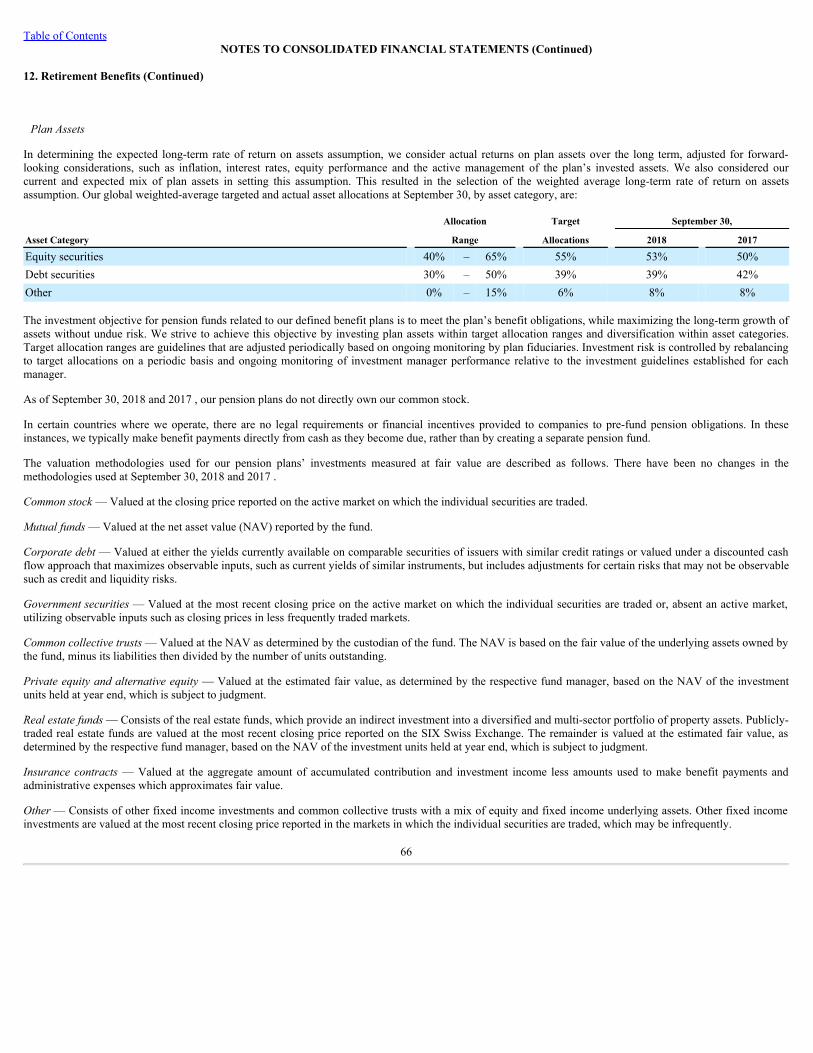
Table of ContentsNOTES TO CONSOLIDATED FINANCIAL STATEMENTS (Continued)
12. Retirement Benefits (Continued)
PlanAssets
In determining the expected long-term rate of return on assets assumption, we consider actual returns on plan assets over the long term, adjusted for forward-looking considerations, such as inflation, interest rates, equity performance and the active management of the plan’s invested assets. We also considered ourcurrent and expected mix of plan assets in setting this assumption. This resulted in the selection of the weighted average long-term rate of return on assetsassumption. Our global weighted-average targeted and actual asset allocations at September 30, by asset category, are:
Allocation Target September 30,
Asset Category Range Allocations 2018 2017
Equity securities 40% – 65% 55% 53% 50%Debt securities 30% – 50% 39% 39% 42%Other 0% – 15% 6% 8% 8%
The investment objective for pension funds related to our defined benefit plans is to meet the plan’s benefit obligations, while maximizing the long-term growth ofassets without undue risk. We strive to achieve this objective by investing plan assets within target allocation ranges and diversification within asset categories.Target allocation ranges are guidelines that are adjusted periodically based on ongoing monitoring by plan fiduciaries. Investment risk is controlled by rebalancingto target allocations on a periodic basis and ongoing monitoring of investment manager performance relative to the investment guidelines established for eachmanager.
As of September 30, 2018 and 2017 , our pension plans do not directly own our common stock.
In certain countries where we operate, there are no legal requirements or financial incentives provided to companies to pre-fund pension obligations. In theseinstances, we typically make benefit payments directly from cash as they become due, rather than by creating a separate pension fund.
The valuation methodologies used for our pension plans’ investments measured at fair value are described as follows. There have been no changes in themethodologies used at September 30, 2018 and 2017 .
Commonstock— Valued at the closing price reported on the active market on which the individual securities are traded.
Mutualfunds— Valued at the net asset value (NAV) reported by the fund.
Corporatedebt— Valued at either the yields currently available on comparable securities of issuers with similar credit ratings or valued under a discounted cashflow approach that maximizes observable inputs, such as current yields of similar instruments, but includes adjustments for certain risks that may not be observablesuch as credit and liquidity risks.
Governmentsecurities— Valued at the most recent closing price on the active market on which the individual securities are traded or, absent an active market,utilizing observable inputs such as closing prices in less frequently traded markets.
Commoncollectivetrusts— Valued at the NAV as determined by the custodian of the fund. The NAV is based on the fair value of the underlying assets owned bythe fund, minus its liabilities then divided by the number of units outstanding.
Privateequityandalternativeequity— Valued at the estimated fair value, as determined by the respective fund manager, based on the NAV of the investmentunits held at year end, which is subject to judgment.
Realestatefunds— Consists of the real estate funds, which provide an indirect investment into a diversified and multi-sector portfolio of property assets. Publicly-traded real estate funds are valued at the most recent closing price reported on the SIX Swiss Exchange. The remainder is valued at the estimated fair value, asdetermined by the respective fund manager, based on the NAV of the investment units held at year end, which is subject to judgment.
Insurance contracts— Valued at the aggregate amount of accumulated contribution and investment income less amounts used to make benefit payments andadministrative expenses which approximates fair value.
Other— Consists of other fixed income investments and common collective trusts with a mix of equity and fixed income underlying assets. Other fixed incomeinvestments are valued at the most recent closing price reported in the markets in which the individual securities are traded, which may be infrequently.
66
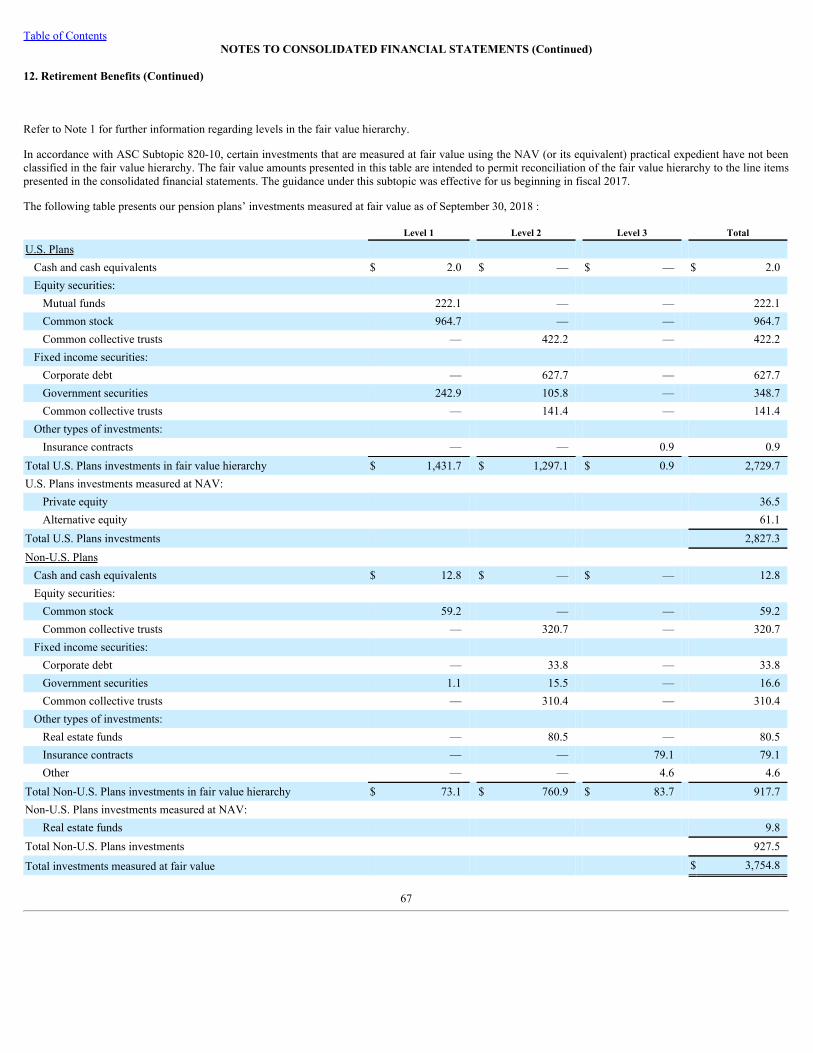
Table of ContentsNOTES TO CONSOLIDATED FINANCIAL STATEMENTS (Continued)
12. Retirement Benefits (Continued)
Refer to Note 1 for further information regarding levels in the fair value hierarchy.
In accordance with ASC Subtopic 820-10, certain investments that are measured at fair value using the NAV (or its equivalent) practical expedient have not beenclassified in the fair value hierarchy. The fair value amounts presented in this table are intended to permit reconciliation of the fair value hierarchy to the line itemspresented in the consolidated financial statements. The guidance under this subtopic was effective for us beginning in fiscal 2017.
The following table presents our pension plans’ investments measured at fair value as of September 30, 2018 :
Level 1 Level 2 Level 3 Total
U.S. Plans Cash and cash equivalents $ 2.0 $ — $ — $ 2.0 Equity securities: Mutual funds 222.1 — — 222.1 Common stock 964.7 — — 964.7 Common collective trusts — 422.2 — 422.2 Fixed income securities: Corporate debt — 627.7 — 627.7 Government securities 242.9 105.8 — 348.7 Common collective trusts — 141.4 — 141.4 Other types of investments: Insurance contracts — — 0.9 0.9Total U.S. Plans investments in fair value hierarchy $ 1,431.7 $ 1,297.1 $ 0.9 2,729.7U.S. Plans investments measured at NAV: Private equity 36.5 Alternative equity 61.1Total U.S. Plans investments 2,827.3Non-U.S. Plans Cash and cash equivalents $ 12.8 $ — $ — 12.8 Equity securities: Common stock 59.2 — — 59.2 Common collective trusts — 320.7 — 320.7 Fixed income securities: Corporate debt — 33.8 — 33.8 Government securities 1.1 15.5 — 16.6 Common collective trusts — 310.4 — 310.4 Other types of investments: Real estate funds — 80.5 — 80.5 Insurance contracts — — 79.1 79.1 Other — — 4.6 4.6Total Non-U.S. Plans investments in fair value hierarchy $ 73.1 $ 760.9 $ 83.7 917.7Non-U.S. Plans investments measured at NAV: Real estate funds 9.8Total Non-U.S. Plans investments 927.5
Total investments measured at fair value $ 3,754.8
67
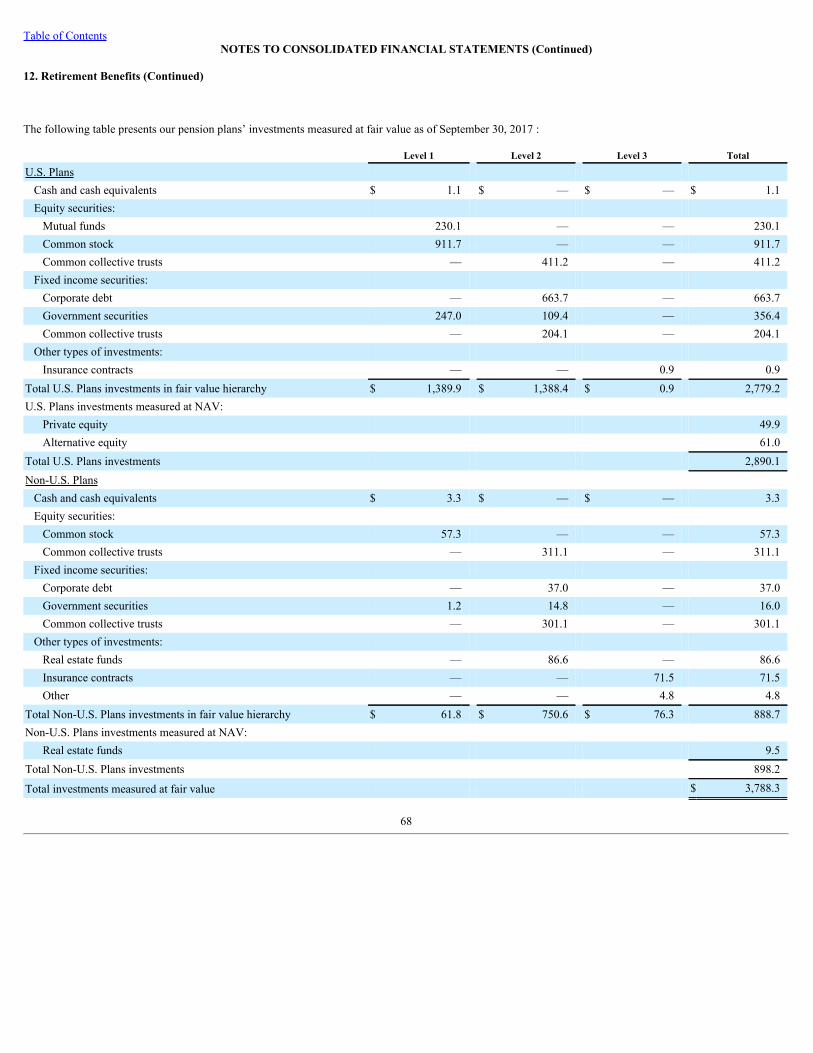
Table of ContentsNOTES TO CONSOLIDATED FINANCIAL STATEMENTS (Continued)
12. Retirement Benefits (Continued)
The following table presents our pension plans’ investments measured at fair value as of September 30, 2017 :
Level 1 Level 2 Level 3 Total
U.S. Plans Cash and cash equivalents $ 1.1 $ — $ — $ 1.1 Equity securities: Mutual funds 230.1 — — 230.1 Common stock 911.7 — — 911.7 Common collective trusts — 411.2 — 411.2 Fixed income securities: Corporate debt — 663.7 — 663.7 Government securities 247.0 109.4 — 356.4 Common collective trusts — 204.1 — 204.1 Other types of investments: Insurance contracts — — 0.9 0.9Total U.S. Plans investments in fair value hierarchy $ 1,389.9 $ 1,388.4 $ 0.9 2,779.2U.S. Plans investments measured at NAV: Private equity 49.9 Alternative equity 61.0Total U.S. Plans investments 2,890.1Non-U.S. Plans Cash and cash equivalents $ 3.3 $ — $ — 3.3 Equity securities: Common stock 57.3 — — 57.3 Common collective trusts — 311.1 — 311.1 Fixed income securities: Corporate debt — 37.0 — 37.0 Government securities 1.2 14.8 — 16.0 Common collective trusts — 301.1 — 301.1 Other types of investments: Real estate funds — 86.6 — 86.6 Insurance contracts — — 71.5 71.5 Other — — 4.8 4.8Total Non-U.S. Plans investments in fair value hierarchy $ 61.8 $ 750.6 $ 76.3 888.7Non-U.S. Plans investments measured at NAV: Real estate funds 9.5Total Non-U.S. Plans investments 898.2
Total investments measured at fair value $ 3,788.3
68
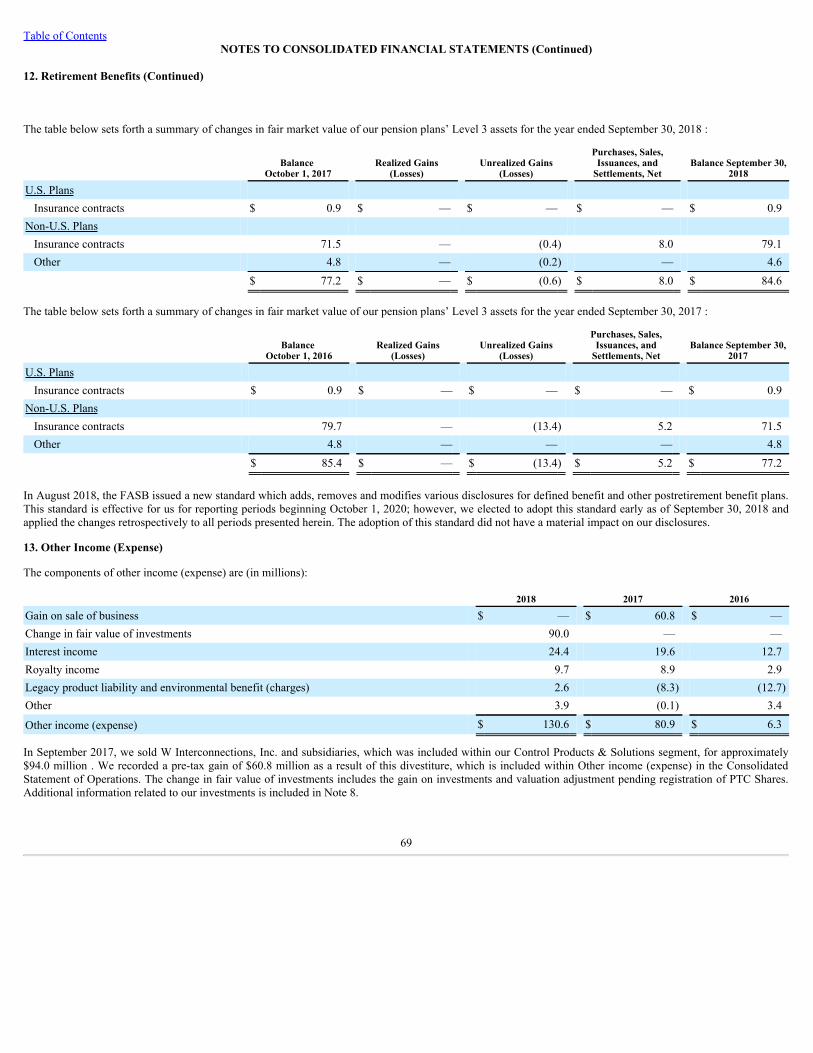
Table of ContentsNOTES TO CONSOLIDATED FINANCIAL STATEMENTS (Continued)
12. Retirement Benefits (Continued)
The table below sets forth a summary of changes in fair market value of our pension plans’ Level 3 assets for the year ended September 30, 2018 :
Balance
October 1, 2017 Realized Gains
(Losses) Unrealized Gains
(Losses)
Purchases, Sales,Issuances, and
Settlements, Net Balance September 30,
2018
U.S. Plans Insurance contracts $ 0.9 $ — $ — $ — $ 0.9Non-U.S. Plans Insurance contracts 71.5 — (0.4) 8.0 79.1 Other 4.8 — (0.2) — 4.6
$ 77.2 $ — $ (0.6) $ 8.0 $ 84.6
The table below sets forth a summary of changes in fair market value of our pension plans’ Level 3 assets for the year ended September 30, 2017 :
Balance
October 1, 2016 Realized Gains
(Losses) Unrealized Gains
(Losses)
Purchases, Sales,Issuances, and
Settlements, Net Balance September 30,
2017
U.S. Plans Insurance contracts $ 0.9 $ — $ — $ — $ 0.9Non-U.S. Plans Insurance contracts 79.7 — (13.4) 5.2 71.5 Other 4.8 — — — 4.8
$ 85.4 $ — $ (13.4) $ 5.2 $ 77.2
In August 2018, the FASB issued a new standard which adds, removes and modifies various disclosures for defined benefit and other postretirement benefit plans.This standard is effective for us for reporting periods beginning October 1, 2020; however, we elected to adopt this standard early as of September 30, 2018 andapplied the changes retrospectively to all periods presented herein. The adoption of this standard did not have a material impact on our disclosures.
13. Other Income (Expense)
The components of other income (expense) are (in millions):
2018 2017 2016
Gain on sale of business $ — $ 60.8 $ —Change in fair value of investments 90.0 — —Interest income 24.4 19.6 12.7Royalty income 9.7 8.9 2.9Legacy product liability and environmental benefit (charges) 2.6 (8.3) (12.7)Other 3.9 (0.1) 3.4
Other income (expense) $ 130.6 $ 80.9 $ 6.3
In September 2017, we sold W Interconnections, Inc. and subsidiaries, which was included within our Control Products & Solutions segment, for approximately$94.0 million . We recorded a pre-tax gain of $60.8 million as a result of this divestiture, which is included within Other income (expense) in the ConsolidatedStatement of Operations. The change in fair value of investments includes the gain on investments and valuation adjustment pending registration of PTC Shares.Additional information related to our investments is included in Note 8.
69
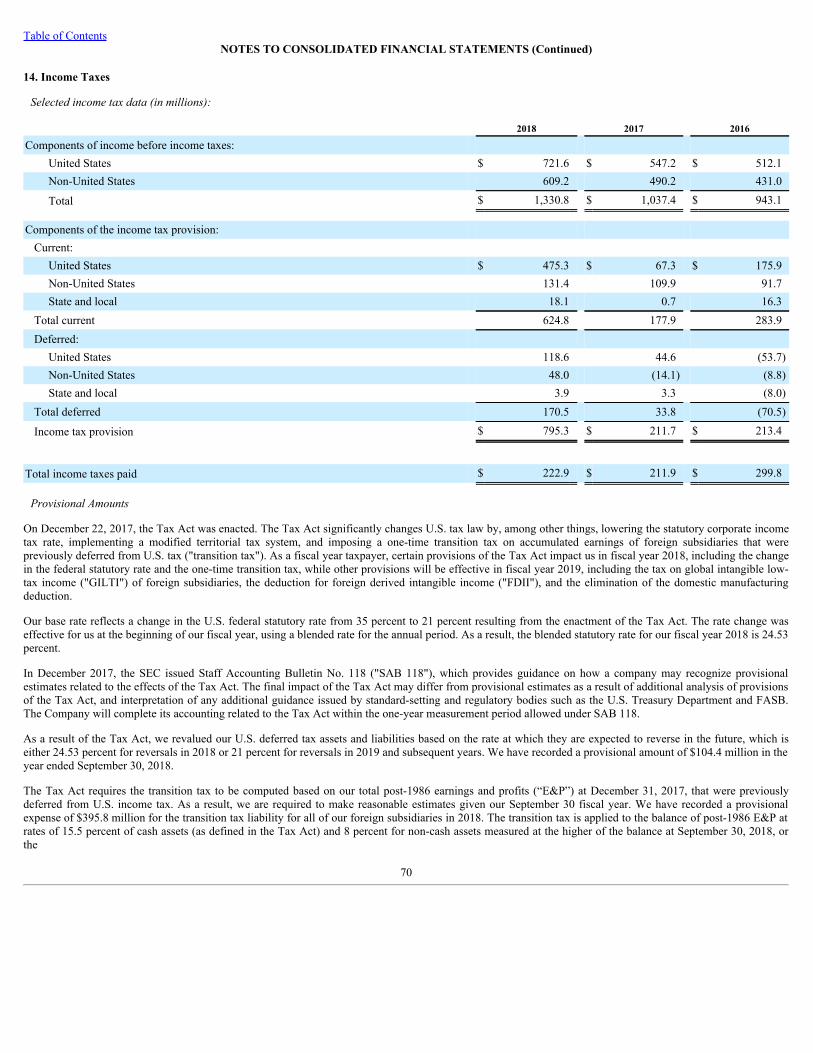
Table of ContentsNOTES TO CONSOLIDATED FINANCIAL STATEMENTS (Continued)
14. Income Taxes
Selectedincometaxdata(inmillions):
2018 2017 2016
Components of income before income taxes: United States $ 721.6 $ 547.2 $ 512.1Non-United States 609.2 490.2 431.0
Total $ 1,330.8 $ 1,037.4 $ 943.1
Components of the income tax provision: Current:
United States $ 475.3 $ 67.3 $ 175.9Non-United States 131.4 109.9 91.7State and local 18.1 0.7 16.3
Total current 624.8 177.9 283.9Deferred:
United States 118.6 44.6 (53.7)Non-United States 48.0 (14.1) (8.8)State and local 3.9 3.3 (8.0)
Total deferred 170.5 33.8 (70.5)
Income tax provision $ 795.3 $ 211.7 $ 213.4
Total income taxes paid $ 222.9 $ 211.9 $ 299.8
ProvisionalAmounts
On December 22, 2017, the Tax Act was enacted. The Tax Act significantly changes U.S. tax law by, among other things, lowering the statutory corporate incometax rate, implementing a modified territorial tax system, and imposing a one-time transition tax on accumulated earnings of foreign subsidiaries that werepreviously deferred from U.S. tax ("transition tax"). As a fiscal year taxpayer, certain provisions of the Tax Act impact us in fiscal year 2018, including the changein the federal statutory rate and the one-time transition tax, while other provisions will be effective in fiscal year 2019, including the tax on global intangible low-tax income ("GILTI") of foreign subsidiaries, the deduction for foreign derived intangible income ("FDII"), and the elimination of the domestic manufacturingdeduction.
Our base rate reflects a change in the U.S. federal statutory rate from 35 percent to 21 percent resulting from the enactment of the Tax Act. The rate change waseffective for us at the beginning of our fiscal year, using a blended rate for the annual period. As a result, the blended statutory rate for our fiscal year 2018 is 24.53percent.
In December 2017, the SEC issued Staff Accounting Bulletin No. 118 ("SAB 118"), which provides guidance on how a company may recognize provisionalestimates related to the effects of the Tax Act. The final impact of the Tax Act may differ from provisional estimates as a result of additional analysis of provisionsof the Tax Act, and interpretation of any additional guidance issued by standard-setting and regulatory bodies such as the U.S. Treasury Department and FASB.The Company will complete its accounting related to the Tax Act within the one-year measurement period allowed under SAB 118.
As a result of the Tax Act, we revalued our U.S. deferred tax assets and liabilities based on the rate at which they are expected to reverse in the future, which iseither 24.53 percent for reversals in 2018 or 21 percent for reversals in 2019 and subsequent years. We have recorded a provisional amount of $104.4 million in theyear ended September 30, 2018.
The Tax Act requires the transition tax to be computed based on our total post-1986 earnings and profits (“E&P”) at December 31, 2017, that were previouslydeferred from U.S. income tax. As a result, we are required to make reasonable estimates given our September 30 fiscal year. We have recorded a provisionalexpense of $395.8 million for the transition tax liability for all of our foreign subsidiaries in 2018. The transition tax is applied to the balance of post-1986 E&P atrates of 15.5 percent of cash assets (as defined in the Tax Act) and 8 percent for non-cash assets measured at the higher of the balance at September 30, 2018, orthe
70
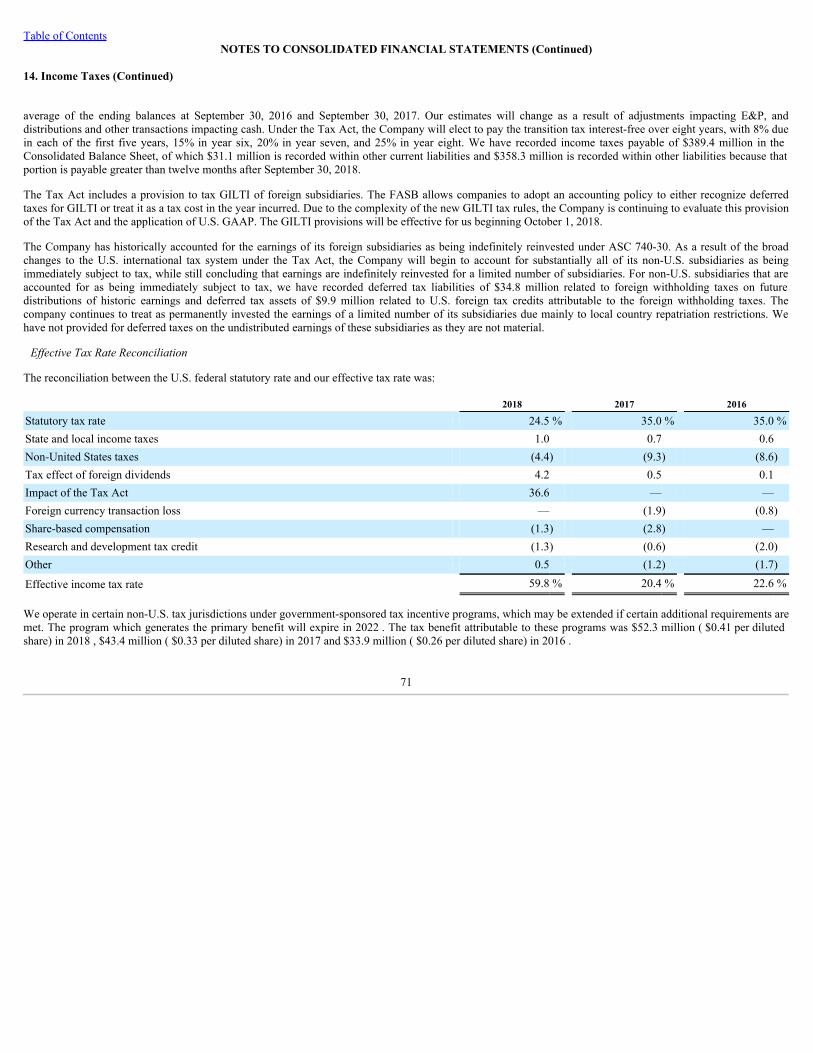
Table of ContentsNOTES TO CONSOLIDATED FINANCIAL STATEMENTS (Continued)
14. Income Taxes (Continued)
average of the ending balances at September 30, 2016 and September 30, 2017. Our estimates will change as a result of adjustments impacting E&P, anddistributions and other transactions impacting cash. Under the Tax Act, the Company will elect to pay the transition tax interest-free over eight years, with 8% duein each of the first five years, 15% in year six, 20% in year seven, and 25% in year eight. We have recorded income taxes payable of $389.4 million in theConsolidated Balance Sheet, of which $31.1 million is recorded within other current liabilities and $358.3 million is recorded within other liabilities because thatportion is payable greater than twelve months after September 30, 2018.
The Tax Act includes a provision to tax GILTI of foreign subsidiaries. The FASB allows companies to adopt an accounting policy to either recognize deferredtaxes for GILTI or treat it as a tax cost in the year incurred. Due to the complexity of the new GILTI tax rules, the Company is continuing to evaluate this provisionof the Tax Act and the application of U.S. GAAP. The GILTI provisions will be effective for us beginning October 1, 2018.
The Company has historically accounted for the earnings of its foreign subsidiaries as being indefinitely reinvested under ASC 740-30. As a result of the broadchanges to the U.S. international tax system under the Tax Act, the Company will begin to account for substantially all of its non-U.S. subsidiaries as beingimmediately subject to tax, while still concluding that earnings are indefinitely reinvested for a limited number of subsidiaries. For non-U.S. subsidiaries that areaccounted for as being immediately subject to tax, we have recorded deferred tax liabilities of $34.8 million related to foreign withholding taxes on futuredistributions of historic earnings and deferred tax assets of $9.9 million related to U.S. foreign tax credits attributable to the foreign withholding taxes. Thecompany continues to treat as permanently invested the earnings of a limited number of its subsidiaries due mainly to local country repatriation restrictions. Wehave not provided for deferred taxes on the undistributed earnings of these subsidiaries as they are not material.
EffectiveTaxRateReconciliation
The reconciliation between the U.S. federal statutory rate and our effective tax rate was:
2018 2017 2016
Statutory tax rate 24.5 % 35.0 % 35.0 %State and local income taxes 1.0 0.7 0.6Non-United States taxes (4.4) (9.3) (8.6)Tax effect of foreign dividends 4.2 0.5 0.1Impact of the Tax Act 36.6 — —Foreign currency transaction loss — (1.9) (0.8)Share-based compensation (1.3) (2.8) —Research and development tax credit (1.3) (0.6) (2.0)Other 0.5 (1.2) (1.7)
Effective income tax rate 59.8 % 20.4 % 22.6 %
We operate in certain non-U.S. tax jurisdictions under government-sponsored tax incentive programs, which may be extended if certain additional requirements aremet. The program which generates the primary benefit will expire in 2022 . The tax benefit attributable to these programs was $52.3 million ( $0.41 per dilutedshare) in 2018 , $43.4 million ( $0.33 per diluted share) in 2017 and $33.9 million ( $0.26 per diluted share) in 2016 .
71
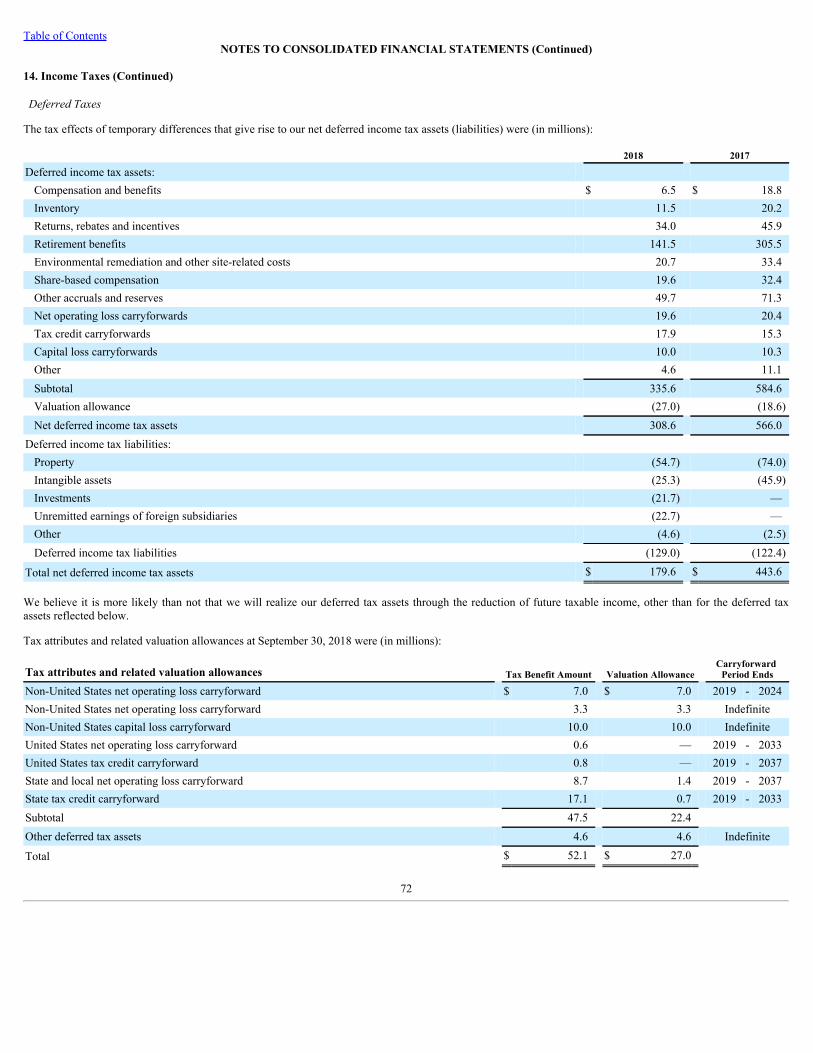
Table of ContentsNOTES TO CONSOLIDATED FINANCIAL STATEMENTS (Continued)
14. Income Taxes (Continued)
DeferredTaxes
The tax effects of temporary differences that give rise to our net deferred income tax assets (liabilities) were (in millions):
2018 2017
Deferred income tax assets: Compensation and benefits $ 6.5 $ 18.8Inventory 11.5 20.2Returns, rebates and incentives 34.0 45.9Retirement benefits 141.5 305.5Environmental remediation and other site-related costs 20.7 33.4Share-based compensation 19.6 32.4Other accruals and reserves 49.7 71.3Net operating loss carryforwards 19.6 20.4Tax credit carryforwards 17.9 15.3Capital loss carryforwards 10.0 10.3Other 4.6 11.1Subtotal 335.6 584.6Valuation allowance (27.0) (18.6)Net deferred income tax assets 308.6 566.0
Deferred income tax liabilities: Property (54.7) (74.0)Intangible assets (25.3) (45.9)Investments (21.7) —Unremitted earnings of foreign subsidiaries (22.7) —Other (4.6) (2.5)Deferred income tax liabilities (129.0) (122.4)
Total net deferred income tax assets $ 179.6 $ 443.6
We believe it is more likely than not that we will realize our deferred tax assets through the reduction of future taxable income, other than for the deferred taxassets reflected below.
Tax attributes and related valuation allowances at September 30, 2018 were (in millions):
Tax attributes and related valuation allowances Tax Benefit Amount Valuation Allowance Carryforward
Period Ends
Non-United States net operating loss carryforward $ 7.0 $ 7.0 2019 - 2024Non-United States net operating loss carryforward 3.3 3.3 IndefiniteNon-United States capital loss carryforward 10.0 10.0 IndefiniteUnited States net operating loss carryforward 0.6 — 2019 - 2033United States tax credit carryforward 0.8 — 2019 - 2037State and local net operating loss carryforward 8.7 1.4 2019 - 2037State tax credit carryforward 17.1 0.7 2019 - 2033Subtotal 47.5 22.4 Other deferred tax assets 4.6 4.6 Indefinite
Total $ 52.1 $ 27.0
72
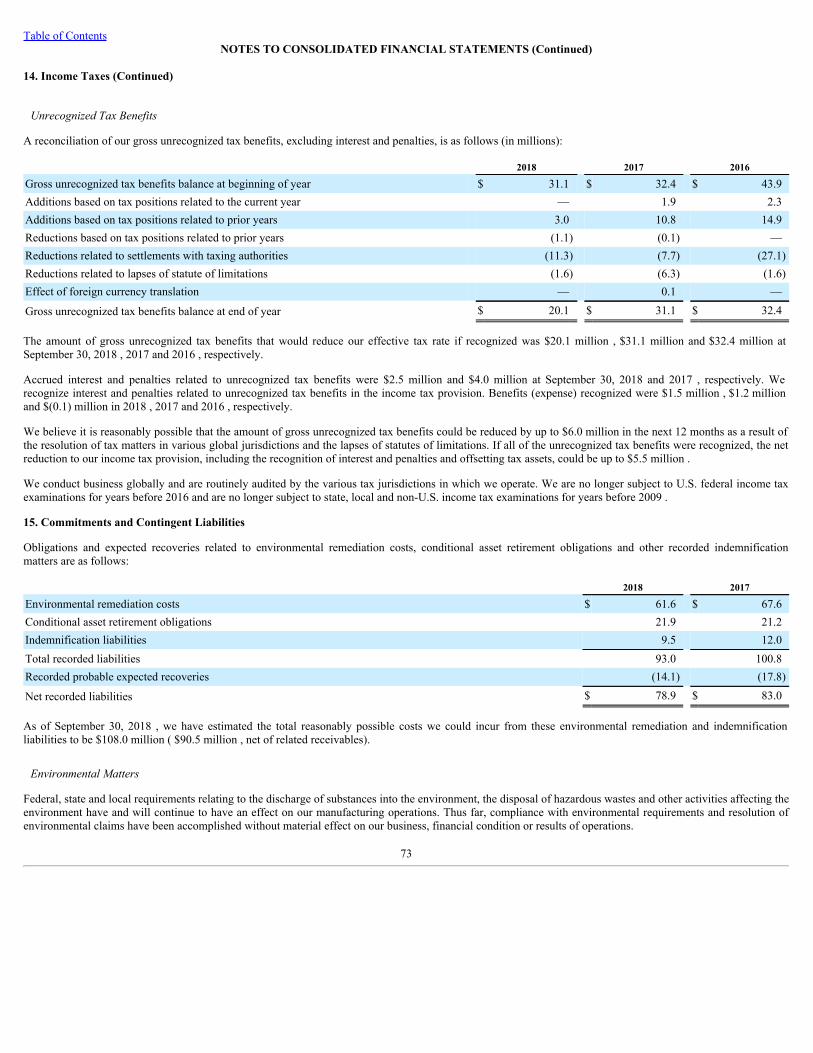
Table of ContentsNOTES TO CONSOLIDATED FINANCIAL STATEMENTS (Continued)
14. Income Taxes (Continued)
UnrecognizedTaxBenefits
A reconciliation of our gross unrecognized tax benefits, excluding interest and penalties, is as follows (in millions):
2018 2017 2016
Gross unrecognized tax benefits balance at beginning of year $ 31.1 $ 32.4 $ 43.9Additions based on tax positions related to the current year — 1.9 2.3Additions based on tax positions related to prior years 3.0 10.8 14.9Reductions based on tax positions related to prior years (1.1) (0.1) —Reductions related to settlements with taxing authorities (11.3) (7.7) (27.1)Reductions related to lapses of statute of limitations (1.6) (6.3) (1.6)Effect of foreign currency translation — 0.1 —
Gross unrecognized tax benefits balance at end of year $ 20.1 $ 31.1 $ 32.4
The amount of gross unrecognized tax benefits that would reduce our effective tax rate if recognized was $20.1 million , $31.1 million and $32.4 million atSeptember 30, 2018 , 2017 and 2016 , respectively.
Accrued interest and penalties related to unrecognized tax benefits were $2.5 million and $4.0 million at September 30, 2018 and 2017 , respectively. Werecognize interest and penalties related to unrecognized tax benefits in the income tax provision. Benefits (expense) recognized were $1.5 million , $1.2 millionand $(0.1) million in 2018 , 2017 and 2016 , respectively.
We believe it is reasonably possible that the amount of gross unrecognized tax benefits could be reduced by up to $6.0 million in the next 12 months as a result ofthe resolution of tax matters in various global jurisdictions and the lapses of statutes of limitations. If all of the unrecognized tax benefits were recognized, the netreduction to our income tax provision, including the recognition of interest and penalties and offsetting tax assets, could be up to $5.5 million .
We conduct business globally and are routinely audited by the various tax jurisdictions in which we operate. We are no longer subject to U.S. federal income taxexaminations for years before 2016 and are no longer subject to state, local and non-U.S. income tax examinations for years before 2009 .
15. Commitments and Contingent Liabilities
Obligations and expected recoveries related to environmental remediation costs, conditional asset retirement obligations and other recorded indemnificationmatters are as follows:
2018 2017
Environmental remediation costs $ 61.6 $ 67.6Conditional asset retirement obligations 21.9 21.2Indemnification liabilities 9.5 12.0Total recorded liabilities 93.0 100.8Recorded probable expected recoveries (14.1) (17.8)
Net recorded liabilities $ 78.9 $ 83.0
As of September 30, 2018 , we have estimated the total reasonably possible costs we could incur from these environmental remediation and indemnificationliabilities to be $108.0 million ( $90.5 million , net of related receivables).
EnvironmentalMatters
Federal, state and local requirements relating to the discharge of substances into the environment, the disposal of hazardous wastes and other activities affecting theenvironment have and will continue to have an effect on our manufacturing operations. Thus far, compliance with environmental requirements and resolution ofenvironmental claims have been accomplished without material effect on our business, financial condition or results of operations.
73
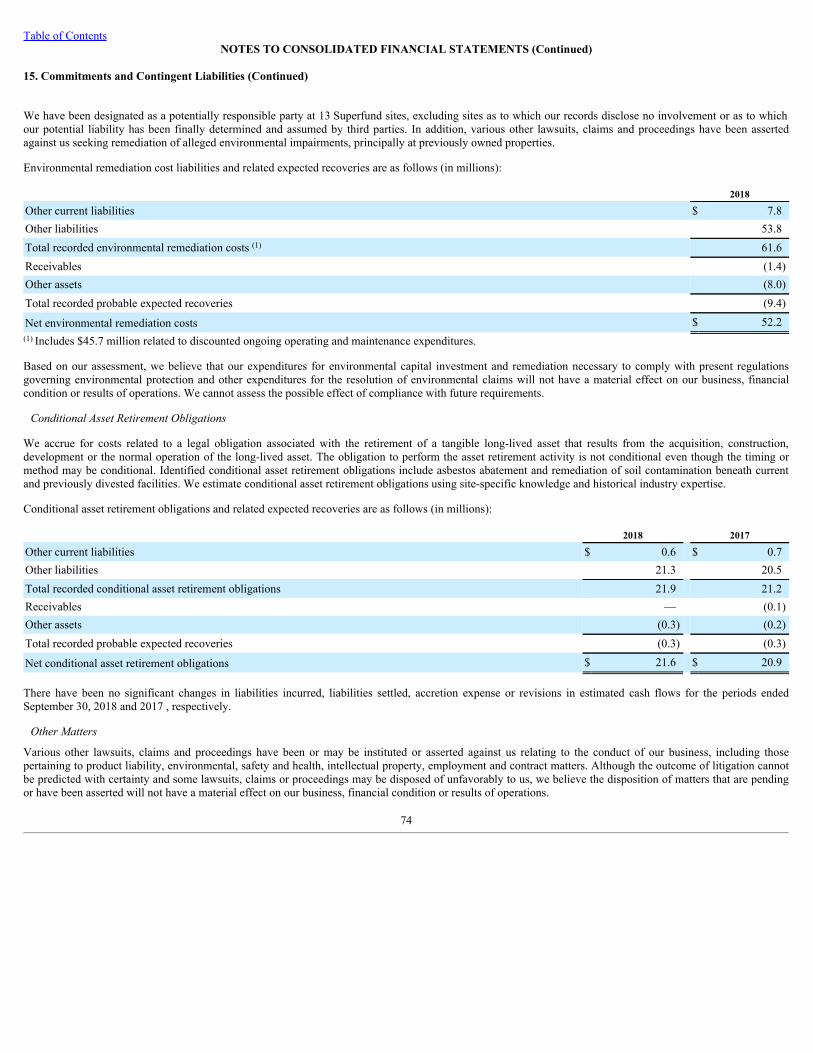
Table of ContentsNOTES TO CONSOLIDATED FINANCIAL STATEMENTS (Continued)
15. Commitments and Contingent Liabilities (Continued)
We have been designated as a potentially responsible party at 13 Superfund sites, excluding sites as to which our records disclose no involvement or as to whichour potential liability has been finally determined and assumed by third parties. In addition, various other lawsuits, claims and proceedings have been assertedagainst us seeking remediation of alleged environmental impairments, principally at previously owned properties.
Environmental remediation cost liabilities and related expected recoveries are as follows (in millions):
2018
Other current liabilities $ 7.8Other liabilities 53.8Total recorded environmental remediation costs (1) 61.6Receivables (1.4)Other assets (8.0)Total recorded probable expected recoveries (9.4)
Net environmental remediation costs $ 52.2(1) Includes $45.7 million related to discounted ongoing operating and maintenance expenditures.
Based on our assessment, we believe that our expenditures for environmental capital investment and remediation necessary to comply with present regulationsgoverning environmental protection and other expenditures for the resolution of environmental claims will not have a material effect on our business, financialcondition or results of operations. We cannot assess the possible effect of compliance with future requirements.
ConditionalAssetRetirementObligations
We accrue for costs related to a legal obligation associated with the retirement of a tangible long-lived asset that results from the acquisition, construction,development or the normal operation of the long-lived asset. The obligation to perform the asset retirement activity is not conditional even though the timing ormethod may be conditional. Identified conditional asset retirement obligations include asbestos abatement and remediation of soil contamination beneath currentand previously divested facilities. We estimate conditional asset retirement obligations using site-specific knowledge and historical industry expertise.
Conditional asset retirement obligations and related expected recoveries are as follows (in millions):
2018 2017
Other current liabilities $ 0.6 $ 0.7Other liabilities 21.3 20.5Total recorded conditional asset retirement obligations 21.9 21.2Receivables — (0.1)Other assets (0.3) (0.2)Total recorded probable expected recoveries (0.3) (0.3)
Net conditional asset retirement obligations $ 21.6 $ 20.9
There have been no significant changes in liabilities incurred, liabilities settled, accretion expense or revisions in estimated cash flows for the periods endedSeptember 30, 2018 and 2017 , respectively.
OtherMatters
Various other lawsuits, claims and proceedings have been or may be instituted or asserted against us relating to the conduct of our business, including thosepertaining to product liability, environmental, safety and health, intellectual property, employment and contract matters. Although the outcome of litigation cannotbe predicted with certainty and some lawsuits, claims or proceedings may be disposed of unfavorably to us, we believe the disposition of matters that are pendingor have been asserted will not have a material effect on our business, financial condition or results of operations.
74
Table of ContentsNOTES TO CONSOLIDATED FINANCIAL STATEMENTS (Continued)
15. Commitments and Contingent Liabilities (Continued)
We (including our subsidiaries) have been named as a defendant in lawsuits alleging personal injury as a result of exposure to asbestos that was used in certaincomponents of our products many years ago. Currently there are a few thousand claimants in lawsuits that name us as defendants, together with hundreds of othercompanies. In some cases, the claims involve products from divested businesses, and we are indemnified for most of the costs. However, we have agreed to defendand indemnify asbestos claims associated with products manufactured or sold by our former Dodge mechanical and Reliance Electric motors and motor repairservices businesses prior to their divestiture by us, which occurred on January 31, 2007. We are also responsible for half of the costs and liabilities associated withasbestos cases against our former Rockwell International Corporation's divested measurement and flow control business. But in all cases, for those claimants whodo show that they worked with our products or products of divested businesses for which we are responsible, we nevertheless believe we have meritoriousdefenses, in substantial part due to the integrity of the products, the encapsulated nature of any asbestos-containing components, and the lack of any impairingmedical condition on the part of many claimants. We defend those cases vigorously. Historically, we have been dismissed from the vast majority of these claimswith no payment to claimants.
We have maintained insurance coverage that we believe covers indemnity and defense costs, over and above self-insured retentions, for claims arising from ourformer Allen-Bradley subsidiary. Following litigation against Nationwide Indemnity Company (Nationwide) and Kemper Insurance (Kemper), the insurancecarriers that provided liability insurance coverage to Allen-Bradley, we entered into separate agreements on April 1, 2008 with both insurance carriers to furtherresolve responsibility for ongoing and future coverage of Allen-Bradley asbestos claims. In exchange for a lump sum payment, Kemper bought out its remainingliability and has been released from further insurance obligations to Allen-Bradley. Nationwide entered into a cost share agreement with us to pay the substantialmajority of future defense and indemnity costs for Allen-Bradley asbestos claims. We believe that this arrangement with Nationwide will continue to providecoverage for Allen-Bradley asbestos claims throughout the remaining life of the asbestos liability.
We also have rights to historic insurance policies that provide indemnity and defense costs, over and above self-insured retentions, for claims arising out of certainasbestos liabilities relating to the divested measurement and flow control business. Following litigation against several insurers to pursue coverage for these claims,we entered into separate agreements with the insurers that resulted in both lump sum payments and coverage-in-place agreements. We believe these arrangementswill provide substantial coverage for future defense and indemnity costs for these asbestos claims throughout the remaining life of asbestos liability.
The uncertainties of asbestos claim litigation make it difficult to predict accurately the ultimate outcome of asbestos claims. That uncertainty is increased by thepossibility of adverse rulings or new legislation affecting asbestos claim litigation or the settlement process. Subject to these uncertainties and based on ourexperience defending asbestos claims, we do not believe these lawsuits will have a material effect on our business, financial condition or results of operations.
We have, from time to time, divested certain of our businesses. In connection with these divestitures, certain lawsuits, claims and proceedings may be instituted orasserted against us related to the period that we owned the businesses, either because we agreed to retain certain liabilities related to these periods or because suchliabilities fall upon us by operation of law. In some instances the divested business has assumed the liabilities; however, it is possible that we might be responsibleto satisfy those liabilities if the divested business is unable to do so.
In connection with the spin-offs of our former automotive business, semiconductor systems business and Rockwell Collins avionics and communications business,the spun-off companies have agreed to indemnify us for substantially all contingent liabilities related to the respective businesses, including environmental andintellectual property matters.
In conjunction with the sale of our Dodge mechanical and Reliance Electric motors and motor repair services businesses, we agreed to indemnify Baldor ElectricCompany for costs and damages related to certain legal, legacy environmental and asbestos matters of these businesses arising before January 31, 2007, for whichthe maximum exposure would be capped at the amount received for the sale.
75
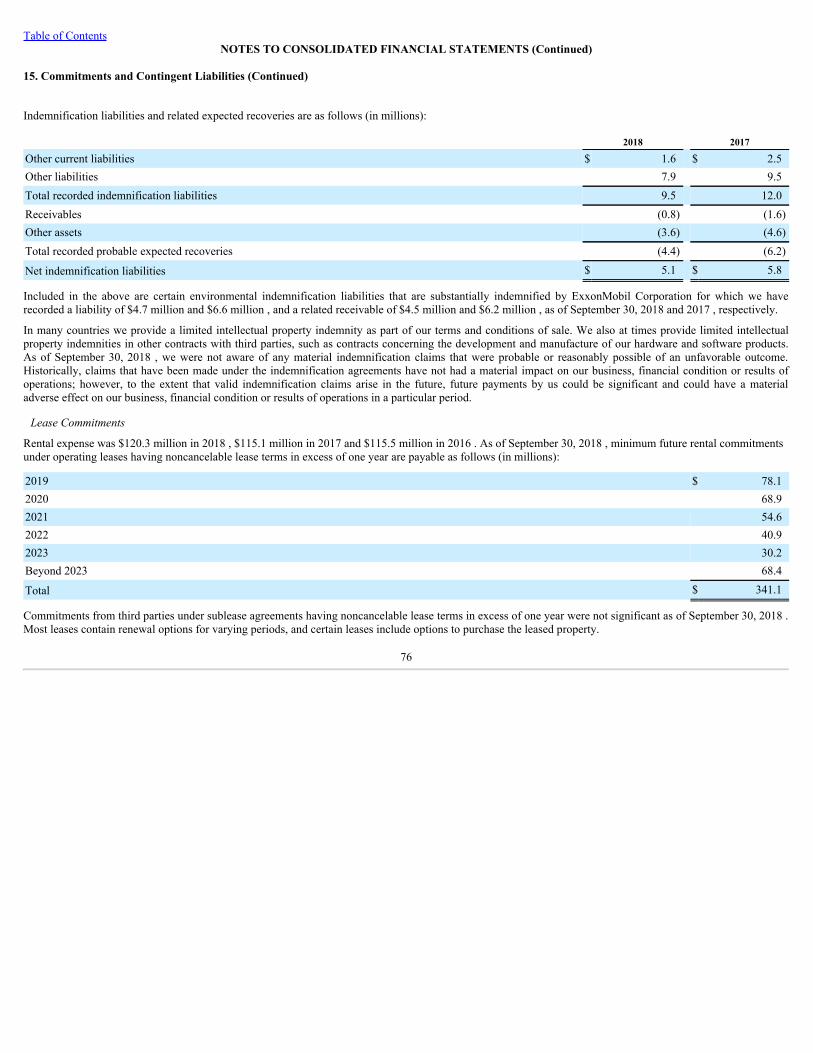
Table of ContentsNOTES TO CONSOLIDATED FINANCIAL STATEMENTS (Continued)
15. Commitments and Contingent Liabilities (Continued)
Indemnification liabilities and related expected recoveries are as follows (in millions):
2018 2017
Other current liabilities $ 1.6 $ 2.5Other liabilities 7.9 9.5Total recorded indemnification liabilities 9.5 12.0Receivables (0.8) (1.6)Other assets (3.6) (4.6)Total recorded probable expected recoveries (4.4) (6.2)
Net indemnification liabilities $ 5.1 $ 5.8
Included in the above are certain environmental indemnification liabilities that are substantially indemnified by ExxonMobil Corporation for which we haverecorded a liability of $4.7 million and $6.6 million , and a related receivable of $4.5 million and $6.2 million , as of September 30, 2018 and 2017 , respectively.
In many countries we provide a limited intellectual property indemnity as part of our terms and conditions of sale. We also at times provide limited intellectualproperty indemnities in other contracts with third parties, such as contracts concerning the development and manufacture of our hardware and software products.As of September 30, 2018 , we were not aware of any material indemnification claims that were probable or reasonably possible of an unfavorable outcome.Historically, claims that have been made under the indemnification agreements have not had a material impact on our business, financial condition or results ofoperations; however, to the extent that valid indemnification claims arise in the future, future payments by us could be significant and could have a materialadverse effect on our business, financial condition or results of operations in a particular period.
LeaseCommitments
Rental expense was $120.3 million in 2018 , $115.1 million in 2017 and $115.5 million in 2016 . As of September 30, 2018 , minimum future rental commitmentsunder operating leases having noncancelable lease terms in excess of one year are payable as follows (in millions):
2019 $ 78.12020 68.92021 54.62022 40.92023 30.2Beyond 2023 68.4
Total $ 341.1
Commitments from third parties under sublease agreements having noncancelable lease terms in excess of one year were not significant as of September 30, 2018 .Most leases contain renewal options for varying periods, and certain leases include options to purchase the leased property.
76
Table of ContentsNOTES TO CONSOLIDATED FINANCIAL STATEMENTS (Continued)
16. Business Segment Information
Rockwell Automation, a leader in industrial automation and information, makes its customers more productive and the world more sustainable . We determine ouroperating segments based on the information used by our chief operating decision maker, our Chief Executive Officer, to allocate resources and assessperformance. Based upon this information, we organize our hardware and software products, solutions and services into two operating segments: Architecture &Software and Control Products & Solutions.
Architecture&Software
The Architecture & Software segment contains all of the hardware, software and communication components of our integrated control and information architecturewhich are capable of controlling the customer’s industrial processes and connecting with their business enterprise. Architecture & Software has a broad portfolio ofhardware and software products including:
• Control platforms that perform multiple control disciplines and monitoring of applications, including discrete, batch and continuous process, drives control,motion control and machine safety control. Our platform products include controllers, electronic operator interface devices, electronic input/output devices,communication and networking products and industrial computers. The information-enabled Logix controllers provide integrated multi-discipline control thatis modular and scalable.
• Software products that include configuration and visualization software used to operate and supervise control platforms, advanced process control software,manufacturing execution systems (MES) and information solutions software that enables customers to improve operational productivity and meet regulatoryrequirements.
• Other products, including sensors, machine safety components and linear motion control products.
ControlProducts&Solutions
The Control Products & Solutions segment combines a comprehensive portfolio of intelligent motor control and industrial control products, application expertiseand project management capabilities. This comprehensive portfolio includes:
• Low and medium voltage electro-mechanical and electronic motor starters, motor and circuit protection devices, AC/DC variable frequency drives, pushbuttons, signaling devices, termination and protection devices, relays and timers.
• Value-added solutions ranging from packaged solutions such as configured drives and motor control centers to automation and information solutions wherewe provide design, integration and start-up services for custom-engineered hardware and software.
• Services designed to help maximize a customer’s automation investment and provide total life-cycle support, including technical support and repair, assetmanagement, training, predictive and preventative maintenance, and safety and network consulting.
77
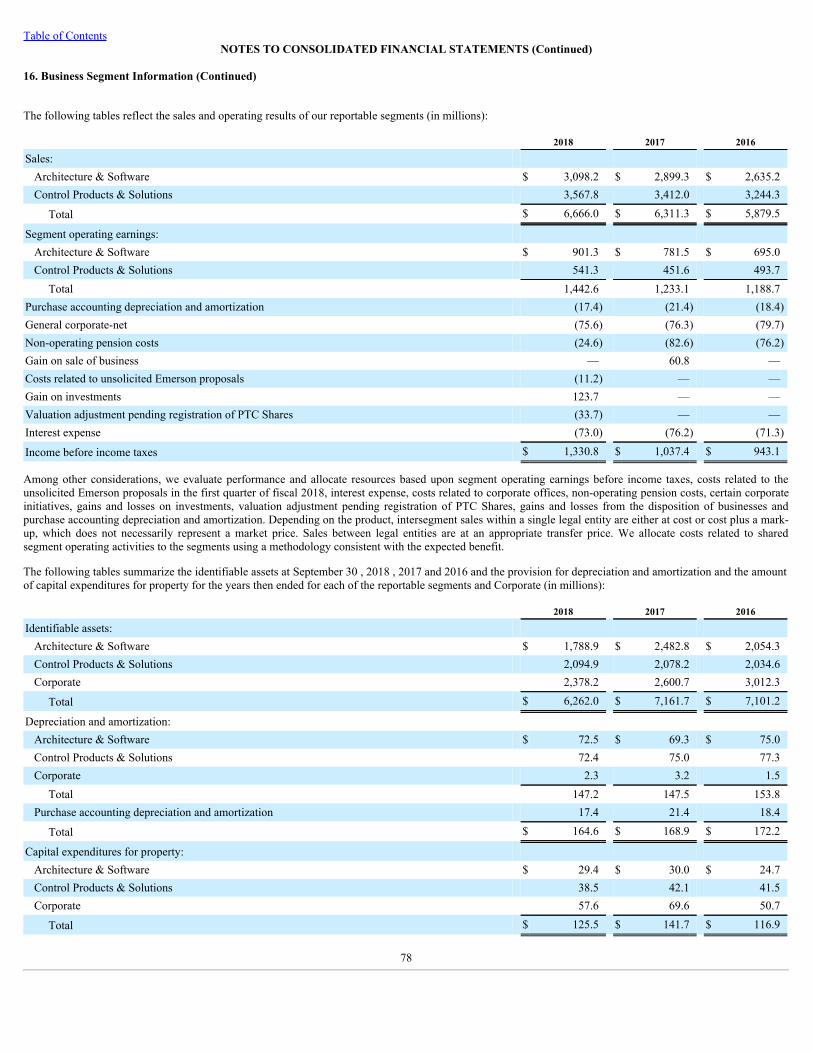
Table of ContentsNOTES TO CONSOLIDATED FINANCIAL STATEMENTS (Continued)
16. Business Segment Information (Continued)
The following tables reflect the sales and operating results of our reportable segments (in millions):
2018 2017 2016
Sales: Architecture & Software $ 3,098.2 $ 2,899.3 $ 2,635.2Control Products & Solutions 3,567.8 3,412.0 3,244.3
Total $ 6,666.0 $ 6,311.3 $ 5,879.5
Segment operating earnings: Architecture & Software $ 901.3 $ 781.5 $ 695.0Control Products & Solutions 541.3 451.6 493.7
Total 1,442.6 1,233.1 1,188.7Purchase accounting depreciation and amortization (17.4) (21.4) (18.4)General corporate-net (75.6) (76.3) (79.7)Non-operating pension costs (24.6) (82.6) (76.2)Gain on sale of business — 60.8 —Costs related to unsolicited Emerson proposals (11.2) — —Gain on investments 123.7 — —Valuation adjustment pending registration of PTC Shares (33.7) — —Interest expense (73.0) (76.2) (71.3)
Income before income taxes $ 1,330.8 $ 1,037.4 $ 943.1
Among other considerations, we evaluate performance and allocate resources based upon segment operating earnings before income taxes, costs related to theunsolicited Emerson proposals in the first quarter of fiscal 2018, interest expense, costs related to corporate offices, non-operating pension costs, certain corporateinitiatives, gains and losses on investments, valuation adjustment pending registration of PTC Shares, gains and losses from the disposition of businesses andpurchase accounting depreciation and amortization. Depending on the product, intersegment sales within a single legal entity are either at cost or cost plus a mark-up, which does not necessarily represent a market price. Sales between legal entities are at an appropriate transfer price. We allocate costs related to sharedsegment operating activities to the segments using a methodology consistent with the expected benefit.
The following tables summarize the identifiable assets at September 30 , 2018 , 2017 and 2016 and the provision for depreciation and amortization and the amountof capital expenditures for property for the years then ended for each of the reportable segments and Corporate (in millions):
2018 2017 2016
Identifiable assets: Architecture & Software $ 1,788.9 $ 2,482.8 $ 2,054.3Control Products & Solutions 2,094.9 2,078.2 2,034.6Corporate 2,378.2 2,600.7 3,012.3
Total $ 6,262.0 $ 7,161.7 $ 7,101.2
Depreciation and amortization: Architecture & Software $ 72.5 $ 69.3 $ 75.0Control Products & Solutions 72.4 75.0 77.3Corporate 2.3 3.2 1.5
Total 147.2 147.5 153.8Purchase accounting depreciation and amortization 17.4 21.4 18.4
Total $ 164.6 $ 168.9 $ 172.2
Capital expenditures for property: Architecture & Software $ 29.4 $ 30.0 $ 24.7Control Products & Solutions 38.5 42.1 41.5Corporate 57.6 69.6 50.7
Total $ 125.5 $ 141.7 $ 116.9
78
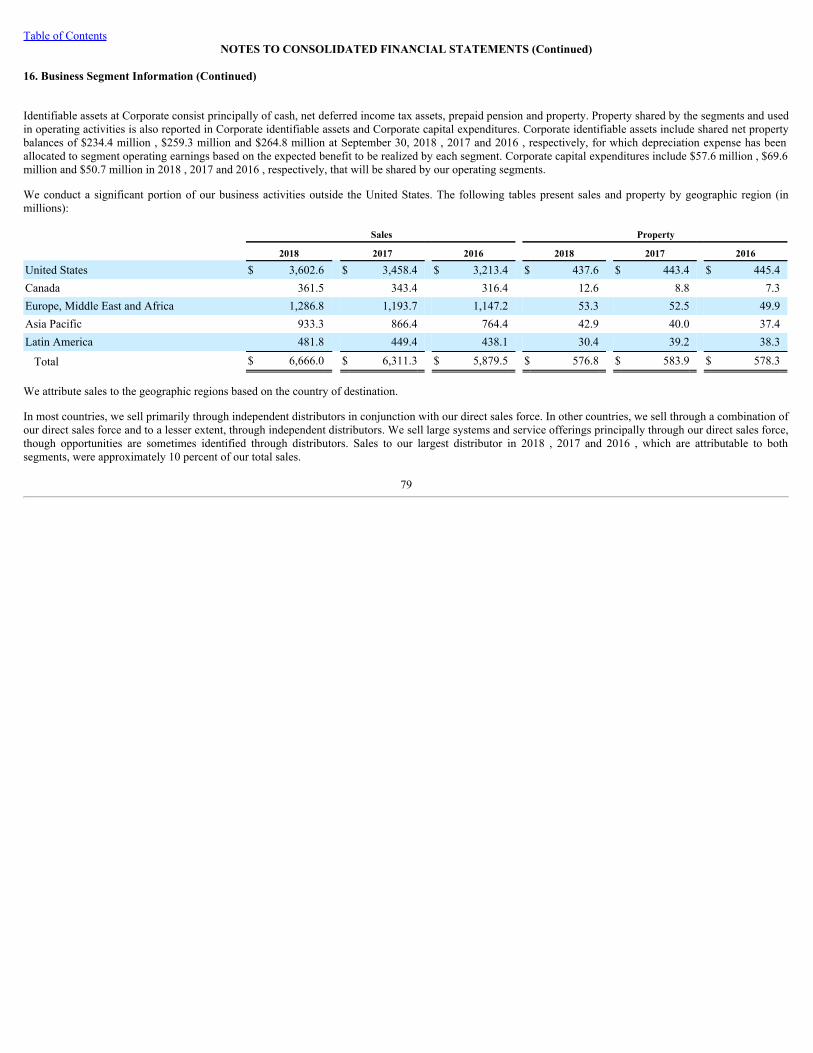
Table of ContentsNOTES TO CONSOLIDATED FINANCIAL STATEMENTS (Continued)
16. Business Segment Information (Continued)
Identifiable assets at Corporate consist principally of cash, net deferred income tax assets, prepaid pension and property. Property shared by the segments and usedin operating activities is also reported in Corporate identifiable assets and Corporate capital expenditures. Corporate identifiable assets include shared net propertybalances of $234.4 million , $259.3 million and $264.8 million at September 30, 2018 , 2017 and 2016 , respectively, for which depreciation expense has beenallocated to segment operating earnings based on the expected benefit to be realized by each segment. Corporate capital expenditures include $57.6 million , $69.6million and $50.7 million in 2018 , 2017 and 2016 , respectively, that will be shared by our operating segments.
We conduct a significant portion of our business activities outside the United States. The following tables present sales and property by geographic region (inmillions):
Sales Property
2018 2017 2016 2018 2017 2016
United States $ 3,602.6 $ 3,458.4 $ 3,213.4 $ 437.6 $ 443.4 $ 445.4Canada 361.5 343.4 316.4 12.6 8.8 7.3Europe, Middle East and Africa 1,286.8 1,193.7 1,147.2 53.3 52.5 49.9Asia Pacific 933.3 866.4 764.4 42.9 40.0 37.4Latin America 481.8 449.4 438.1 30.4 39.2 38.3
Total $ 6,666.0 $ 6,311.3 $ 5,879.5 $ 576.8 $ 583.9 $ 578.3
We attribute sales to the geographic regions based on the country of destination.
In most countries, we sell primarily through independent distributors in conjunction with our direct sales force. In other countries, we sell through a combination ofour direct sales force and to a lesser extent, through independent distributors. We sell large systems and service offerings principally through our direct sales force,though opportunities are sometimes identified through distributors. Sales to our largest distributor in 2018 , 2017 and 2016 , which are attributable to bothsegments, were approximately 10 percent of our total sales.
79
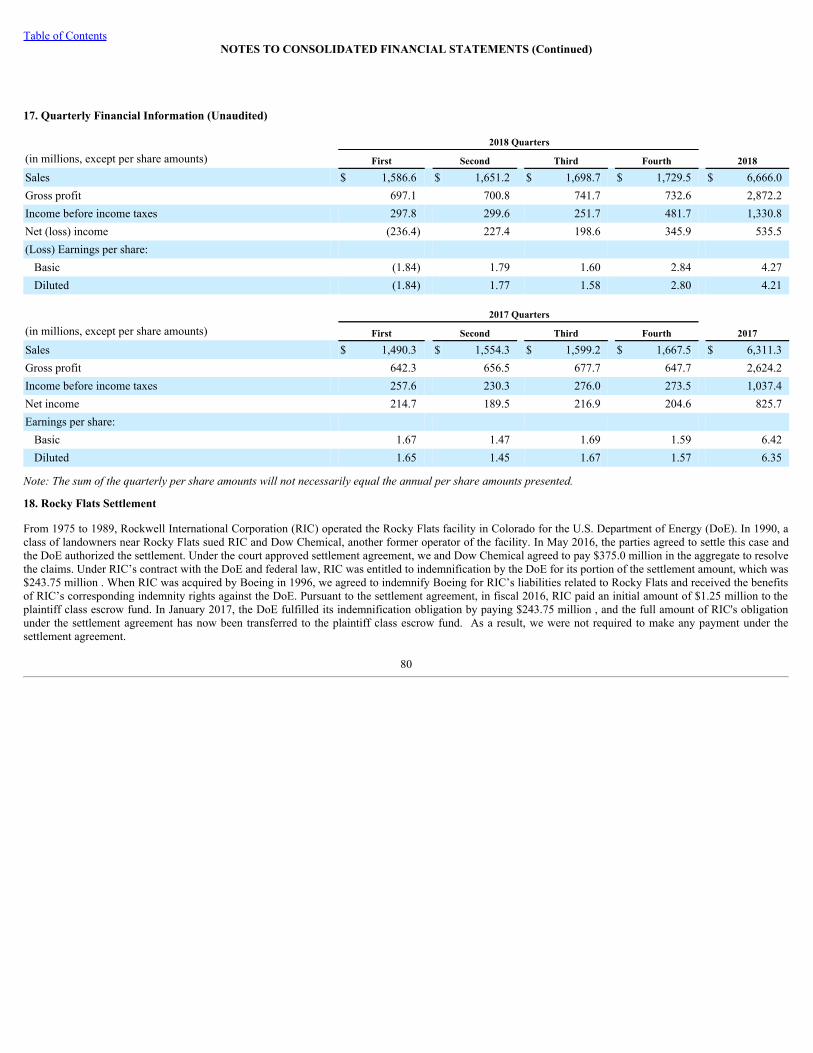
Table of ContentsNOTES TO CONSOLIDATED FINANCIAL STATEMENTS (Continued)
17. Quarterly Financial Information (Unaudited)
2018 Quarters
(in millions, except per share amounts) First Second Third Fourth 2018
Sales $ 1,586.6 $ 1,651.2 $ 1,698.7 $ 1,729.5 $ 6,666.0Gross profit 697.1 700.8 741.7 732.6 2,872.2Income before income taxes 297.8 299.6 251.7 481.7 1,330.8Net (loss) income (236.4) 227.4 198.6 345.9 535.5(Loss) Earnings per share:
Basic (1.84) 1.79 1.60 2.84 4.27Diluted (1.84) 1.77 1.58 2.80 4.21
2017 Quarters
(in millions, except per share amounts) First Second Third Fourth 2017
Sales $ 1,490.3 $ 1,554.3 $ 1,599.2 $ 1,667.5 $ 6,311.3Gross profit 642.3 656.5 677.7 647.7 2,624.2Income before income taxes 257.6 230.3 276.0 273.5 1,037.4Net income 214.7 189.5 216.9 204.6 825.7Earnings per share:
Basic 1.67 1.47 1.69 1.59 6.42Diluted 1.65 1.45 1.67 1.57 6.35
Note:Thesumofthequarterlypershareamountswillnotnecessarilyequaltheannualpershareamountspresented.
18. Rocky Flats Settlement
From 1975 to 1989, Rockwell International Corporation (RIC) operated the Rocky Flats facility in Colorado for the U.S. Department of Energy (DoE). In 1990, aclass of landowners near Rocky Flats sued RIC and Dow Chemical, another former operator of the facility. In May 2016, the parties agreed to settle this case andthe DoE authorized the settlement. Under the court approved settlement agreement, we and Dow Chemical agreed to pay $375.0 million in the aggregate to resolvethe claims. Under RIC’s contract with the DoE and federal law, RIC was entitled to indemnification by the DoE for its portion of the settlement amount, which was$243.75 million . When RIC was acquired by Boeing in 1996, we agreed to indemnify Boeing for RIC’s liabilities related to Rocky Flats and received the benefitsof RIC’s corresponding indemnity rights against the DoE. Pursuant to the settlement agreement, in fiscal 2016, RIC paid an initial amount of $1.25 million to theplaintiff class escrow fund. In January 2017, the DoE fulfilled its indemnification obligation by paying $243.75 million , and the full amount of RIC's obligationunder the settlement agreement has now been transferred to the plaintiff class escrow fund. As a result, we were not required to make any payment under thesettlement agreement.
80
REPORT OF INDEPENDENT REGISTERED PUBLIC ACCOUNTING FIRM
To the Board of Directors and Shareowners of
Rockwell Automation, Inc.
Milwaukee, Wisconsin
Opinions on the Financial Statements and Internal Control over Financial Reporting
We have audited the accompanying consolidated balance sheets of Rockwell Automation, Inc. and subsidiaries (the “Company”) as of September 30, 2018 and2017 , and the related consolidated statements of operations, comprehensive income, cash flows, and shareowners’ equity for each of the three years in the periodended September 30, 2018 , and the related notes and schedule listed in the Index at Item 15 (a)(2) (collectively referred to as the "financial statements"). We alsohave audited the Company’s internal control over financial reporting as of September 30, 2018 , based on criteria established in InternalControl—IntegratedFramework(2013)issued by the Committee of Sponsoring Organizations of the Treadway Commission (COSO).
In our opinion, the consolidated financial statements referred to above present fairly, in all material respects, the financial position of the Company as ofSeptember 30, 2018 and 2017 , and the results of its operations and its cash flows for each of the three years in the period ended September 30, 2018 , inconformity with accounting principles generally accepted in the United States of America. Also, in our opinion, the Company maintained, in all material respects,effective internal control over financial reporting as of September 30, 2018 , based on criteria established in Internal Control —IntegratedFramework(2013)issued by COSO .
Basis for Opinions
The Company’s management is responsible for these financial statements and financial statement schedule, for maintaining effective internal control over financialreporting, and for its assessment of the effectiveness of internal control over financial reporting, included in the accompanying Management’s Report on InternalControl over Financial Reporting. Our responsibility is to express an opinion on these financial statements and financial statement schedule and an opinion on theCompany’s internal control over financial reporting based on our audits. We are a public accounting firm registered with the Public Company AccountingOversight Board (United States) (PCAOB) and are required to be independent with respect to the Company in accordance with the U.S. federal securities laws andthe applicable rules and regulations of the Securities and Exchange Commission and the PCAOB.
We conducted our audits in accordance with the standards of the PCAOB. Those standards require that we plan and perform the audit to obtain reasonableassurance about whether the financial statements are free of material misstatement, whether due to error or fraud, and whether effective internal control overfinancial reporting was maintained in all material respects.
Our audits of the financial statements included performing procedures to assess the risks of material misstatement of the financial statements, whether due to erroror fraud, and performing procedures to respond to those risks. Such procedures included examining, on a test basis, evidence supporting the amounts anddisclosures in the financial statements. Our audits also included evaluating the accounting principles used and significant estimates made by management, as wellas evaluating the overall financial statement presentation. Our audit of internal control over financial reporting included obtaining an understanding of internalcontrol over financial reporting, assessing the risk that a material weakness exists, and testing and evaluating the design and operating effectiveness of internalcontrol based on the assessed risk. Our audits also included performing such other procedures as we considered necessary in the circumstances. We believe that ouraudits provide a reasonable basis for our opinions.
Definition and Limitations of Internal Control over Financial Reporting
A company’s internal control over financial reporting is a process designed to provide reasonable assurance regarding the reliability of financial reporting and thepreparation of financial statements for external purposes in accordance with generally accepted accounting principles. A company’s internal control over financialreporting includes those policies and procedures that (1) pertain to the maintenance of records that, in reasonable detail, accurately and fairly reflect thetransactions and dispositions of the assets of the company; (2) provide reasonable assurance that transactions are recorded as necessary to permit preparation offinancial statements in accordance with generally accepted accounting principles and that receipts and expenditures of the company are being made only inaccordance with authorizations of management and directors of the company; and (3) provide reasonable assurance regarding prevention or timely detection ofunauthorized acquisition, use, or disposition of the company’s assets that could have a material effect on the financial statements.
Because of the inherent limitations of internal control over financial reporting may not prevent or detect misstatements. Also, projections of any evaluation of theeffectiveness to future periods are subject to the risk that the controls may become inadequate because of changes in conditions, or that the degree of compliancewith the policies or procedures may deteriorate.
/s/ DELOITTE & TOUCHE LLP
Milwaukee, Wisconsin
November 9, 2018
We have served as the Company's auditor since 1967.
81
Table of Contents
Item 9. Changes in and Disagreements with Accountants on Accounting and Financial Disclosure
None.
Item 9A. Controls and Procedures
Evaluation of Disclosure Controls and Procedures
Under the supervision and with the participation of our management, including the Chief Executive Officer and Chief Financial Officer, we have evaluated theeffectiveness, as of September 30, 2018 , of our disclosure controls and procedures, as defined in Rule 13a-15(e) and Rule 15d-15(e) under the Exchange Act.Based on that evaluation, our Chief Executive Officer and Chief Financial Officer have concluded that our disclosure controls and procedures were effective as ofSeptember 30, 2018 .
Management’s Report on Internal Control Over Financial Reporting
We are responsible for establishing and maintaining adequate internal control over financial reporting, as defined in Rule 13a-15(f) under the Exchange Act. Ourinternal control over financial reporting is a process designed to provide reasonable assurance regarding the reliability of our financial reporting and the preparationof financial statements for external purposes in accordance with generally accepted accounting principles. Under the supervision and with the participation of ourmanagement, including the Chief Executive Officer and Chief Financial Officer, we evaluated the effectiveness of our internal control over financial reportingbased on the framework in InternalControl—IntegratedFramework(2013)issued by the Committee of Sponsoring Organizations of the Treadway Commission(COSO). Based on that evaluation, management has concluded that our internal control over financial reporting was effective as of September 30, 2018 .
The effectiveness of our internal control over financial reporting, as of September 30, 2018 , has been audited by Deloitte & Touche LLP, as stated in their reportthat is included on the previous two pages.
Because of its inherent limitations, internal control over financial reporting may not prevent or detect misstatements. Also, projections of any evaluation ofeffectiveness to future periods are subject to the risk that controls may become inadequate because of the changes in conditions, or that the degree of compliancewith the policies or procedures may deteriorate.
Changes in Internal Control Over Financial Reporting
There has not been any change in our internal control over financial reporting (as such term is defined in Rule 13a-15(f)) under the Exchange Act during the fiscalquarter to which this report relates that has materially affected, or is reasonably likely to materially affect, our internal control over financial reporting. TheCompany adopted the new revenue recognition standard on October 1, 2018. The adoption of this guidance required additional functionality within our enterprise-wide information technology system in addition to new accounting processes, policies and procedures. The Company also implemented new internal controls forrevenue recognition, including the adjustments to retained earnings required under the modified retrospective method of adoption and the related disclosuresrequired under the new guidance.
Item 9B. Other Information
None.
82
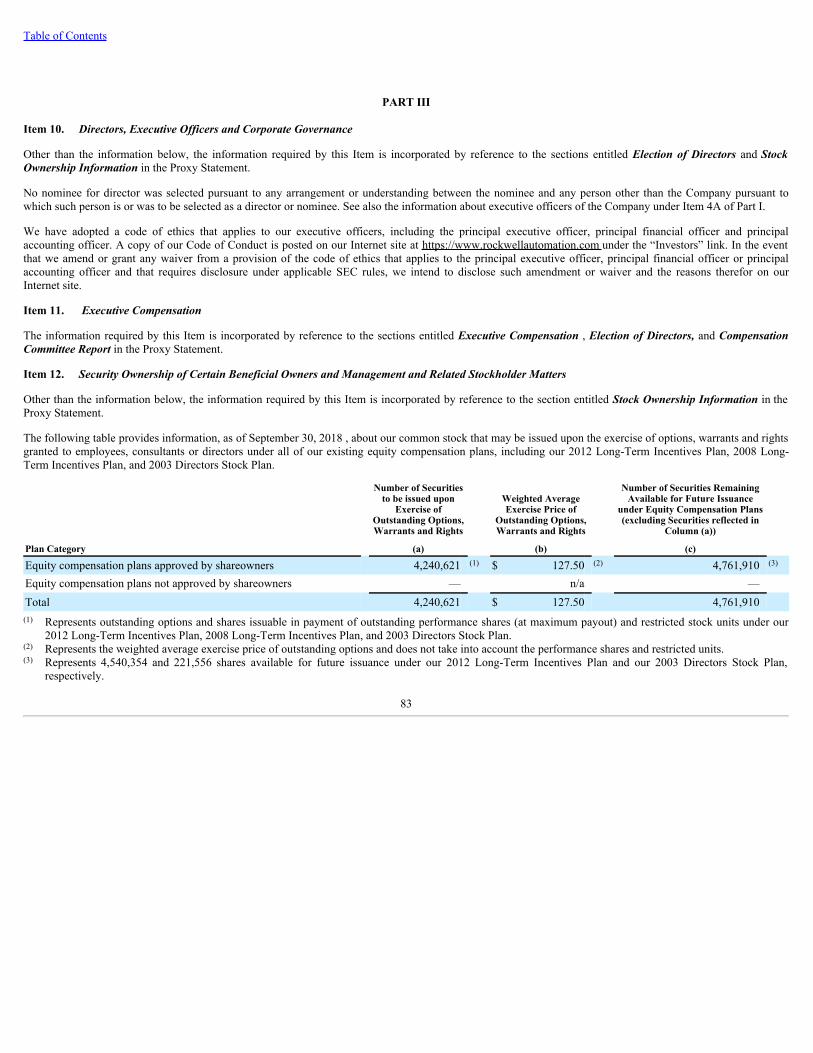
Table of Contents
PART III
Item 10. Directors, Executive Officers and Corporate Governance
Other than the information below, the information required by this Item is incorporated by reference to the sections entitled Election of Directors and StockOwnership Information in the Proxy Statement.
No nominee for director was selected pursuant to any arrangement or understanding between the nominee and any person other than the Company pursuant towhich such person is or was to be selected as a director or nominee. See also the information about executive officers of the Company under Item 4A of Part I.
We have adopted a code of ethics that applies to our executive officers, including the principal executive officer, principal financial officer and principalaccounting officer. A copy of our Code of Conduct is posted on our Internet site at https://www.rockwellautomation.com under the “Investors” link. In the eventthat we amend or grant any waiver from a provision of the code of ethics that applies to the principal executive officer, principal financial officer or principalaccounting officer and that requires disclosure under applicable SEC rules, we intend to disclose such amendment or waiver and the reasons therefor on ourInternet site.
Item 11. Executive Compensation
The information required by this Item is incorporated by reference to the sections entitled Executive Compensation , Election of Directors, and CompensationCommittee Report in the Proxy Statement.
Item 12. Security Ownership of Certain Beneficial Owners and Management and Related Stockholder Matters
Other than the information below, the information required by this Item is incorporated by reference to the section entitled Stock Ownership Information in theProxy Statement.
The following table provides information, as of September 30, 2018 , about our common stock that may be issued upon the exercise of options, warrants and rightsgranted to employees, consultants or directors under all of our existing equity compensation plans, including our 2012 Long-Term Incentives Plan, 2008 Long-Term Incentives Plan, and 2003 Directors Stock Plan.
Number of Securitiesto be issued upon
Exercise ofOutstanding Options,Warrants and Rights
Weighted AverageExercise Price of
Outstanding Options,Warrants and Rights
Number of Securities RemainingAvailable for Future Issuance
under Equity Compensation Plans(excluding Securities reflected in
Column (a))
Plan Category (a) (b) (c) Equity compensation plans approved by shareowners 4,240,621 (1) $ 127.50 (2) 4,761,910 (3) Equity compensation plans not approved by shareowners — n/a — Total 4,240,621 $ 127.50 4,761,910 (1) Represents outstanding options and shares issuable in payment of outstanding performance shares (at maximum payout) and restricted stock units under our
2012 Long-Term Incentives Plan, 2008 Long-Term Incentives Plan, and 2003 Directors Stock Plan.(2) Represents the weighted average exercise price of outstanding options and does not take into account the performance shares and restricted units.(3) Represents 4,540,354 and 221,556 shares available for future issuance under our 2012 Long-Term Incentives Plan and our 2003 Directors Stock Plan,
respectively.
83

Table of Contents
Item 13. Certain Relationships and Related Transactions, and Director Independence
The information required by this Item is incorporated by reference to the section entitled Election of Directors in the Proxy Statement.
Item 14. Principal Accountant Fees and Services
The information required by this Item is incorporated by reference to the section entitled Audit Matters in the Proxy Statement.
84
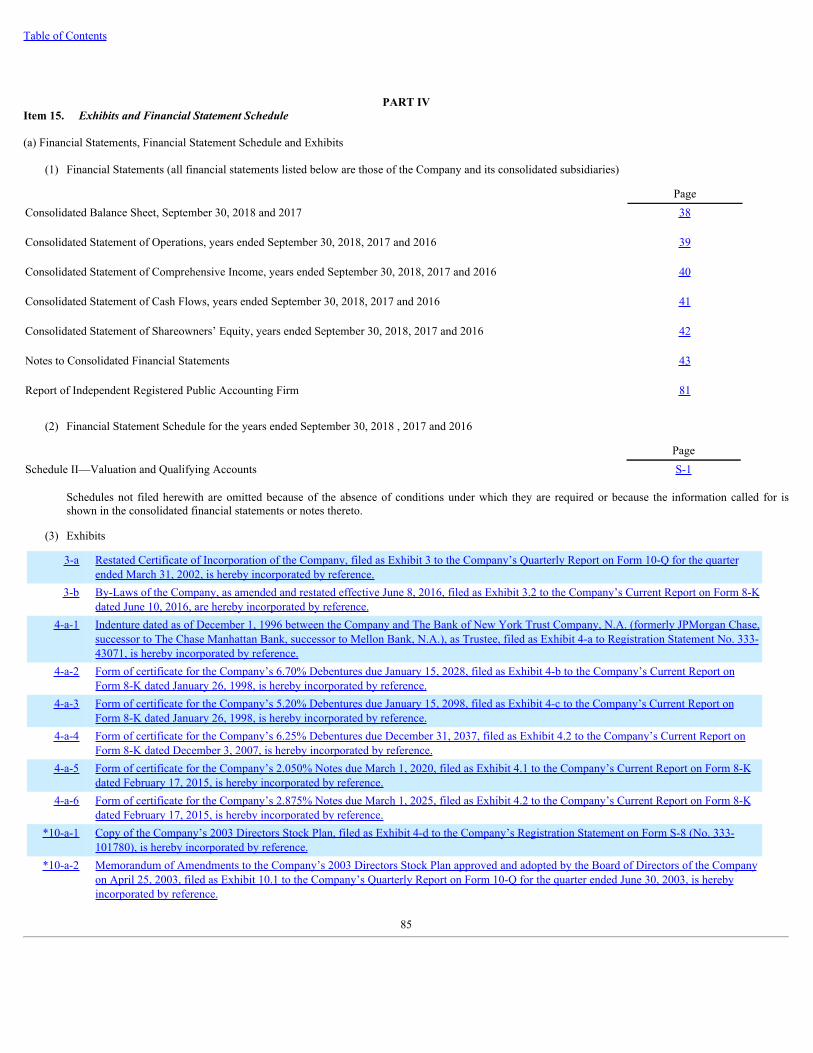
Table of Contents
PART IVItem 15. Exhibits and Financial Statement Schedule
(a) Financial Statements, Financial Statement Schedule and Exhibits
(1) Financial Statements (all financial statements listed below are those of the Company and its consolidated subsidiaries)
PageConsolidated Balance Sheet, September 30, 2018 and 2017 38 Consolidated Statement of Operations, years ended September 30, 2018, 2017 and 2016 39 Consolidated Statement of Comprehensive Income, years ended September 30, 2018, 2017 and 2016 40 Consolidated Statement of Cash Flows, years ended September 30, 2018, 2017 and 2016 41 Consolidated Statement of Shareowners’ Equity, years ended September 30, 2018, 2017 and 2016 42 Notes to Consolidated Financial Statements 43 Report of Independent Registered Public Accounting Firm 81
(2) Financial Statement Schedule for the years ended September 30, 2018 , 2017 and 2016
PageSchedule II—Valuation and Qualifying Accounts S-1
Schedules not filed herewith are omitted because of the absence of conditions under which they are required or because the information called for isshown in the consolidated financial statements or notes thereto.
(3) Exhibits
3-a
Restated Certificate of Incorporation of the Company, filed as Exhibit 3 to the Company’s Quarterly Report on Form 10-Q for the quarterended March 31, 2002, is hereby incorporated by reference.
3-b
By-Laws of the Company, as amended and restated effective June 8, 2016, filed as Exhibit 3.2 to the Company’s Current Report on Form 8-Kdated June 10, 2016, are hereby incorporated by reference.
4-a-1
Indenture dated as of December 1, 1996 between the Company and The Bank of New York Trust Company, N.A. (formerly JPMorgan Chase,successor to The Chase Manhattan Bank, successor to Mellon Bank, N.A.), as Trustee, filed as Exhibit 4-a to Registration Statement No. 333-43071, is hereby incorporated by reference.
4-a-2
Form of certificate for the Company’s 6.70% Debentures due January 15, 2028, filed as Exhibit 4-b to the Company’s Current Report onForm 8-K dated January 26, 1998, is hereby incorporated by reference.
4-a-3
Form of certificate for the Company’s 5.20% Debentures due January 15, 2098, filed as Exhibit 4-c to the Company’s Current Report onForm 8-K dated January 26, 1998, is hereby incorporated by reference.
4-a-4
Form of certificate for the Company’s 6.25% Debentures due December 31, 2037, filed as Exhibit 4.2 to the Company’s Current Report onForm 8-K dated December 3, 2007, is hereby incorporated by reference.
4-a-5
Form of certificate for the Company’s 2.050% Notes due March 1, 2020, filed as Exhibit 4.1 to the Company’s Current Report on Form 8-Kdated February 17, 2015, is hereby incorporated by reference.
4-a-6
Form of certificate for the Company’s 2.875% Notes due March 1, 2025, filed as Exhibit 4.2 to the Company’s Current Report on Form 8-Kdated February 17, 2015, is hereby incorporated by reference.
*10-a-1
Copy of the Company’s 2003 Directors Stock Plan, filed as Exhibit 4-d to the Company’s Registration Statement on Form S-8 (No. 333-101780), is hereby incorporated by reference.
*10-a-2
Memorandum of Amendments to the Company’s 2003 Directors Stock Plan approved and adopted by the Board of Directors of the Companyon April 25, 2003, filed as Exhibit 10.1 to the Company’s Quarterly Report on Form 10-Q for the quarter ended June 30, 2003, is herebyincorporated by reference.
85
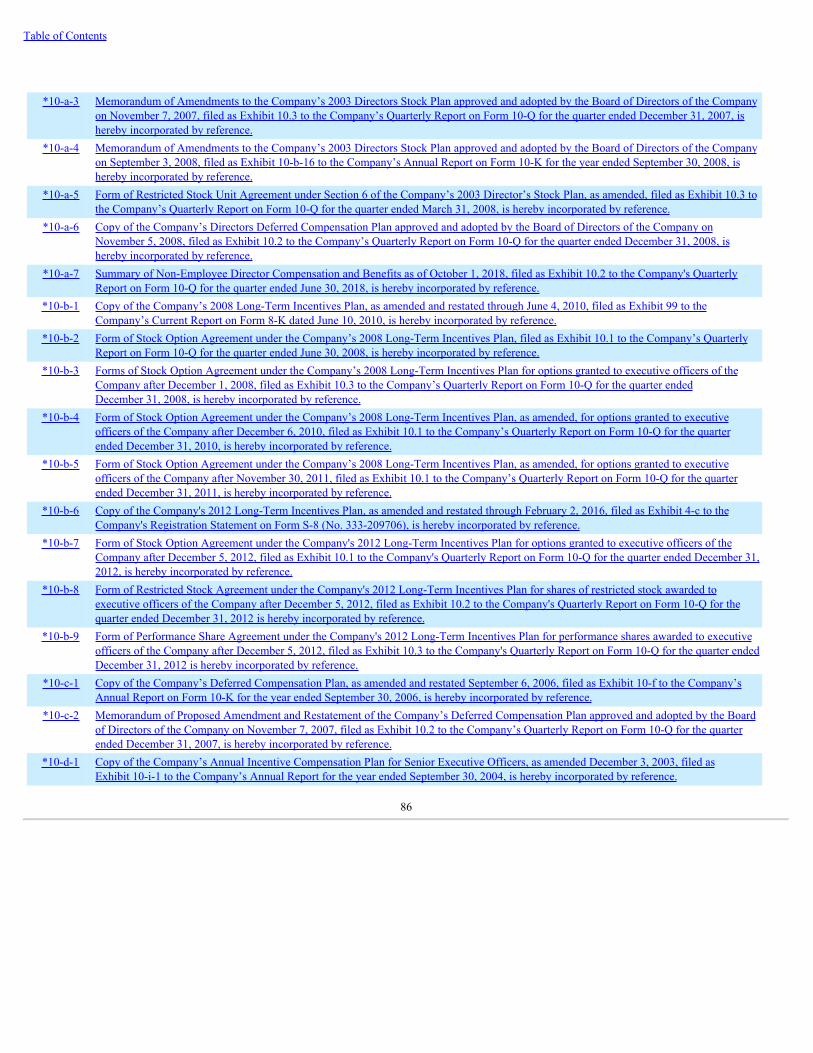
Table of Contents
*10-a-3
Memorandum of Amendments to the Company’s 2003 Directors Stock Plan approved and adopted by the Board of Directors of the Companyon November 7, 2007, filed as Exhibit 10.3 to the Company’s Quarterly Report on Form 10-Q for the quarter ended December 31, 2007, ishereby incorporated by reference.
*10-a-4
Memorandum of Amendments to the Company’s 2003 Directors Stock Plan approved and adopted by the Board of Directors of the Companyon September 3, 2008, filed as Exhibit 10-b-16 to the Company’s Annual Report on Form 10-K for the year ended September 30, 2008, ishereby incorporated by reference.
*10-a-5
Form of Restricted Stock Unit Agreement under Section 6 of the Company’s 2003 Director’s Stock Plan, as amended, filed as Exhibit 10.3 tothe Company’s Quarterly Report on Form 10-Q for the quarter ended March 31, 2008, is hereby incorporated by reference.
*10-a-6
Copy of the Company’s Directors Deferred Compensation Plan approved and adopted by the Board of Directors of the Company onNovember 5, 2008, filed as Exhibit 10.2 to the Company’s Quarterly Report on Form 10-Q for the quarter ended December 31, 2008, ishereby incorporated by reference.
*10-a-7
Summary of Non-Employee Director Compensation and Benefits as of October 1, 2018, filed as Exhibit 10.2 to the Company's QuarterlyReport on Form 10-Q for the quarter ended June 30, 2018, is hereby incorporated by reference.
*10-b-1
Copy of the Company’s 2008 Long-Term Incentives Plan, as amended and restated through June 4, 2010, filed as Exhibit 99 to theCompany’s Current Report on Form 8-K dated June 10, 2010, is hereby incorporated by reference.
*10-b-2
Form of Stock Option Agreement under the Company’s 2008 Long-Term Incentives Plan, filed as Exhibit 10.1 to the Company’s QuarterlyReport on Form 10-Q for the quarter ended June 30, 2008, is hereby incorporated by reference.
*10-b-3
Forms of Stock Option Agreement under the Company’s 2008 Long-Term Incentives Plan for options granted to executive officers of theCompany after December 1, 2008, filed as Exhibit 10.3 to the Company’s Quarterly Report on Form 10-Q for the quarter endedDecember 31, 2008, is hereby incorporated by reference.
*10-b-4
Form of Stock Option Agreement under the Company’s 2008 Long-Term Incentives Plan, as amended, for options granted to executiveofficers of the Company after December 6, 2010, filed as Exhibit 10.1 to the Company’s Quarterly Report on Form 10-Q for the quarterended December 31, 2010, is hereby incorporated by reference.
*10-b-5
Form of Stock Option Agreement under the Company’s 2008 Long-Term Incentives Plan, as amended, for options granted to executiveofficers of the Company after November 30, 2011, filed as Exhibit 10.1 to the Company’s Quarterly Report on Form 10-Q for the quarterended December 31, 2011, is hereby incorporated by reference.
*10-b-6
Copy of the Company's 2012 Long-Term Incentives Plan, as amended and restated through February 2, 2016, filed as Exhibit 4-c to theCompany's Registration Statement on Form S-8 (No. 333-209706), is hereby incorporated by reference.
*10-b-7
Form of Stock Option Agreement under the Company's 2012 Long-Term Incentives Plan for options granted to executive officers of theCompany after December 5, 2012, filed as Exhibit 10.1 to the Company's Quarterly Report on Form 10-Q for the quarter ended December 31,2012, is hereby incorporated by reference.
*10-b-8
Form of Restricted Stock Agreement under the Company's 2012 Long-Term Incentives Plan for shares of restricted stock awarded toexecutive officers of the Company after December 5, 2012, filed as Exhibit 10.2 to the Company's Quarterly Report on Form 10-Q for thequarter ended December 31, 2012 is hereby incorporated by reference.
*10-b-9
Form of Performance Share Agreement under the Company's 2012 Long-Term Incentives Plan for performance shares awarded to executiveofficers of the Company after December 5, 2012, filed as Exhibit 10.3 to the Company's Quarterly Report on Form 10-Q for the quarter endedDecember 31, 2012 is hereby incorporated by reference.
*10-c-1
Copy of the Company’s Deferred Compensation Plan, as amended and restated September 6, 2006, filed as Exhibit 10-f to the Company’sAnnual Report on Form 10-K for the year ended September 30, 2006, is hereby incorporated by reference.
*10-c-2
Memorandum of Proposed Amendment and Restatement of the Company’s Deferred Compensation Plan approved and adopted by the Boardof Directors of the Company on November 7, 2007, filed as Exhibit 10.2 to the Company’s Quarterly Report on Form 10-Q for the quarterended December 31, 2007, is hereby incorporated by reference.
*10-d-1
Copy of the Company’s Annual Incentive Compensation Plan for Senior Executive Officers, as amended December 3, 2003, filed asExhibit 10-i-1 to the Company’s Annual Report for the year ended September 30, 2004, is hereby incorporated by reference.
86
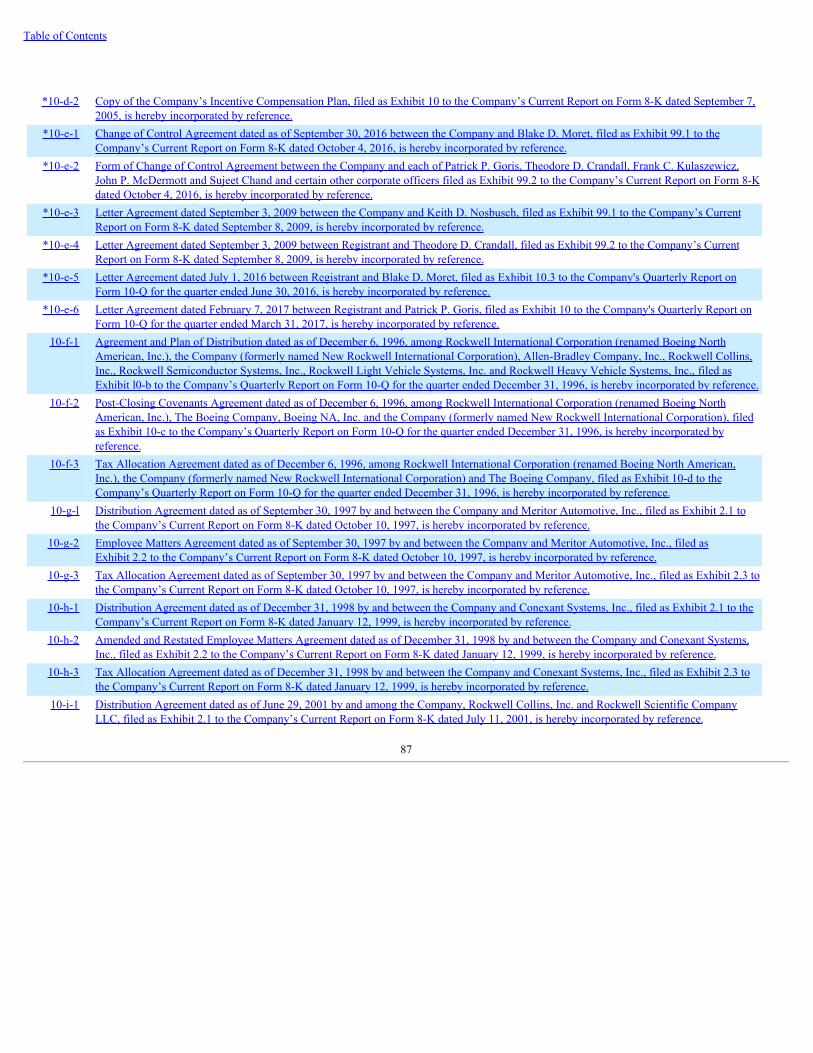
Table of Contents
*10-d-2
Copy of the Company’s Incentive Compensation Plan, filed as Exhibit 10 to the Company’s Current Report on Form 8-K dated September 7,2005, is hereby incorporated by reference.
*10-e-1
Change of Control Agreement dated as of September 30, 2016 between the Company and Blake D. Moret, filed as Exhibit 99.1 to theCompany’s Current Report on Form 8-K dated October 4, 2016, is hereby incorporated by reference.
*10-e-2
Form of Change of Control Agreement between the Company and each of Patrick P. Goris, Theodore D. Crandall, Frank C. Kulaszewicz,John P. McDermott and Sujeet Chand and certain other corporate officers filed as Exhibit 99.2 to the Company’s Current Report on Form 8-Kdated October 4, 2016, is hereby incorporated by reference.
*10-e-3
Letter Agreement dated September 3, 2009 between the Company and Keith D. Nosbusch, filed as Exhibit 99.1 to the Company’s CurrentReport on Form 8-K dated September 8, 2009, is hereby incorporated by reference.
*10-e-4
Letter Agreement dated September 3, 2009 between Registrant and Theodore D. Crandall, filed as Exhibit 99.2 to the Company’s CurrentReport on Form 8-K dated September 8, 2009, is hereby incorporated by reference.
*10-e-5
Letter Agreement dated July 1, 2016 between Registrant and Blake D. Moret, filed as Exhibit 10.3 to the Company's Quarterly Report onForm 10-Q for the quarter ended June 30, 2016, is hereby incorporated by reference.
*10-e-6
Letter Agreement dated February 7, 2017 between Registrant and Patrick P. Goris, filed as Exhibit 10 to the Company's Quarterly Report onForm 10-Q for the quarter ended March 31, 2017, is hereby incorporated by reference.
10-f-1
Agreement and Plan of Distribution dated as of December 6, 1996, among Rockwell International Corporation (renamed Boeing NorthAmerican, Inc.), the Company (formerly named New Rockwell International Corporation), Allen-Bradley Company, Inc., Rockwell Collins,Inc., Rockwell Semiconductor Systems, Inc., Rockwell Light Vehicle Systems, Inc. and Rockwell Heavy Vehicle Systems, Inc., filed asExhibit l0-b to the Company’s Quarterly Report on Form 10-Q for the quarter ended December 31, 1996, is hereby incorporated by reference.
10-f-2
Post-Closing Covenants Agreement dated as of December 6, 1996, among Rockwell International Corporation (renamed Boeing NorthAmerican, Inc.), The Boeing Company, Boeing NA, Inc. and the Company (formerly named New Rockwell International Corporation), filedas Exhibit 10-c to the Company’s Quarterly Report on Form 10-Q for the quarter ended December 31, 1996, is hereby incorporated byreference.
10-f-3
Tax Allocation Agreement dated as of December 6, 1996, among Rockwell International Corporation (renamed Boeing North American,Inc.), the Company (formerly named New Rockwell International Corporation) and The Boeing Company, filed as Exhibit 10-d to theCompany’s Quarterly Report on Form 10-Q for the quarter ended December 31, 1996, is hereby incorporated by reference.
10-g-l
Distribution Agreement dated as of September 30, 1997 by and between the Company and Meritor Automotive, Inc., filed as Exhibit 2.1 tothe Company’s Current Report on Form 8-K dated October 10, 1997, is hereby incorporated by reference.
10-g-2
Employee Matters Agreement dated as of September 30, 1997 by and between the Company and Meritor Automotive, Inc., filed asExhibit 2.2 to the Company’s Current Report on Form 8-K dated October 10, 1997, is hereby incorporated by reference.
10-g-3
Tax Allocation Agreement dated as of September 30, 1997 by and between the Company and Meritor Automotive, Inc., filed as Exhibit 2.3 tothe Company’s Current Report on Form 8-K dated October 10, 1997, is hereby incorporated by reference.
10-h-1
Distribution Agreement dated as of December 31, 1998 by and between the Company and Conexant Systems, Inc., filed as Exhibit 2.1 to theCompany’s Current Report on Form 8-K dated January 12, 1999, is hereby incorporated by reference.
10-h-2
Amended and Restated Employee Matters Agreement dated as of December 31, 1998 by and between the Company and Conexant Systems,Inc., filed as Exhibit 2.2 to the Company’s Current Report on Form 8-K dated January 12, 1999, is hereby incorporated by reference.
10-h-3
Tax Allocation Agreement dated as of December 31, 1998 by and between the Company and Conexant Systems, Inc., filed as Exhibit 2.3 tothe Company’s Current Report on Form 8-K dated January 12, 1999, is hereby incorporated by reference.
10-i-1
Distribution Agreement dated as of June 29, 2001 by and among the Company, Rockwell Collins, Inc. and Rockwell Scientific CompanyLLC, filed as Exhibit 2.1 to the Company’s Current Report on Form 8-K dated July 11, 2001, is hereby incorporated by reference.
87
Table of Contents
10-i-2
Employee Matters Agreement dated as of June 29, 2001 by and among the Company, Rockwell Collins, Inc. and Rockwell ScientificCompany LLC, filed as Exhibit 2.2 to the Company’s Current Report on Form 8-K dated July 11, 2001, is hereby incorporated by reference.
10-i-3
Tax Allocation Agreement dated as of June 29, 2001 by and between the Company and Rockwell Collins, Inc., filed as Exhibit 2.3 to theCompany’s Current Report on Form 8-K dated July 11, 2001, is hereby incorporated by reference.
10-j-1
$1,000,000,000 Five-Year Credit Agreement dated as of March 24, 2015 among the Company, the Banks listed on the signature pagesthereof, JPMorgan Chase Bank, N.A., as Administrative Agent, Bank of America, N.A. and Goldman Sachs Bank USA, as SyndicationAgents, and The Bank of New York Mellon, BMO Harris Bank N.A., Citibank, N.A., Deutsche Bank Securities Inc., The Northern TrustCompany, PNC Bank National Association, U.S. Bank National Association, and Wells Fargo Bank, National Association, as DocumentationAgents, filed as Exhibit 99 to the Company’s Current Report on Form 8-K dated March 27, 2015, is hereby incorporated by reference.
10-j-2
First Amendment to Five-Year Credit Agreement dated as of December 12, 2016 among the Company, the Banks signatory thereto andJPMorgan Chase Bank, as Administrative Agent, filed as Exhibit 10 to the Company's Quarterly Report on Form 10-Q for the quarter endedDecember 31, 2016, is hereby incorporated by reference.
10-k
Purchase and Sale Agreement dated as of August 24, 2005 by and between the Company and First Industrial Acquisitions, Inc., including theform of Lease Agreement attached as Exhibit I thereto, together with the First Amendment to Purchase and Sale Agreement dated as ofSeptember 30, 2005 and the Second Amendment to Purchase and Sale Agreement dated as of October 31, 2005, filed as Exhibit 10-p to theCompany’s Annual Report on Form 10-K for the year ended September 30, 2005, is hereby incorporated by reference.
10-l-1
Purchase Agreement, dated as of November 6, 2006, by and among Rockwell Automation, Inc., Rockwell Automation of Ohio, Inc.,Rockwell Automation Canada Control Systems, Grupo Industrias Reliance S.A. de C.V., Rockwell Automation GmbH (formerly known asRockwell International GmbH) and Baldor Electric Company, contained in the Company’s Current Report on Form 8-K dated November 9,2006, is hereby incorporated by reference.
10-l-2
First Amendment to Purchase Agreement dated as of January 24, 2007 by and among Rockwell Automation, Inc., Rockwell Automation ofOhio, Inc., Rockwell Automation Canada Control Systems, Grupo Industrias Reliance S.A. de C.V., Rockwell Automation GmbH and BaldorElectric Company, filed as Exhibit 10.2 to the Company’s Quarterly Report on Form 10-Q for the quarter ended March 31, 2007, is herebyincorporated by reference.
10-m-1
Securities Purchase Agreement, dated June 11, 2018, between the Company and PTC Inc., filed as Exhibit 10.1 to the Company's CurrentReport on Form 8-K dated June 11, 2018, is hereby incorporated by reference.
10-m-2
Registration Rights Agreement dated July 19, 2018, between the Company and PTC Inc., filed as Exhibit 10.1 to the Company's CurrentReport on Form 8-K dated as July 20, 2018, is hereby incorporated by reference.
21 List of Subsidiaries of the Company.23 Consent of Independent Registered Public Accounting Firm.24
Powers of Attorney authorizing certain persons to sign this Annual Report on Form 10-K on behalf of certain directors and officers of theCompany.
31.1 Certification of Periodic Report by the Chief Executive Officer pursuant to Rule 13a-14(a) of the Securities Exchange Act of 1934.31.2 Certification of Periodic Report by the Chief Financial Officer pursuant to Rule 13a-14(a) of the Securities Exchange Act of 1934.32.1 Certification of Periodic Report by the Chief Executive Officer pursuant to Section 906 of the Sarbanes-Oxley Act of 2002.32.2 Certification of Periodic Report by the Chief Financial Officer pursuant to Section 906 of the Sarbanes-Oxley Act of 2002.101 Interactive Data Files.
_________________________
* Management contract or compensatory plan or arrangement.
Item 16. Form 10-K Summary
None.
88
Table of Contents
SIGNATURES
Pursuant to the requirements of Section 13 or 15(d) of the Securities Exchange Act of 1934, the registrant has duly caused this report to be signedon its behalf by the undersigned, thereunto duly authorized.
ROCKWELL AUTOMATION, INC. By /s/ PATRICK P. GORIS Patrick P. Goris Senior Vice President and Chief Financial OfficerDated: November 9, 2018
Pursuant to the requirements of the Securities Exchange Act of 1934, this report has been signed below on the 9 th day of November 2018 by thefollowing persons on behalf of the registrant and in the capacities indicated.
By /s/ P ATRICK P. G ORIS
Patrick P. Goris Senior Vice President and Chief Financial Officer (Principal Financial Officer) By /s/ D AVID M. D ORGAN
David M. Dorgan Vice President and Controller (Principal Accounting Officer) Blake D. Moret* Chairman of the Board, President and Chief Executive Officer (Principal Executive Officer) and Director Keith D. Nosbusch* Director J. Phillip Holloman* Director Steven R. Kalmanson* Director James P. Keane* Director Lawrence D. Kingsley* Director William T. McCormick, Jr.* Director Donald R. Parfet * Director Lisa A. Payne* Director Thomas W. Rosamilia* Director Patricia A. Watson*

Director *By /s/ R EBECCA W. H OUSE
Rebecca W. House, Attorney-in-fact** **By authority of powers of attorney filed herewith
89
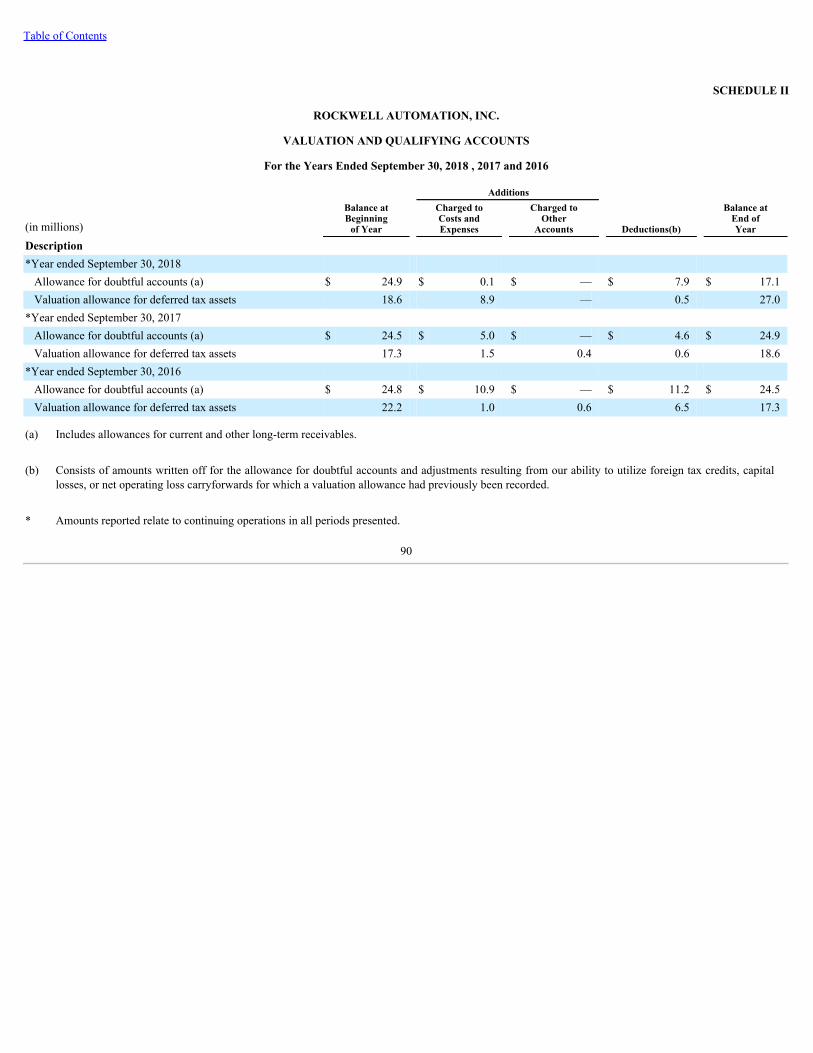
Table of Contents
SCHEDULE II
ROCKWELL AUTOMATION, INC.
VALUATION AND QUALIFYING ACCOUNTS
For the Years Ended September 30, 2018 , 2017 and 2016
Additions
(in millions)
Balance atBeginning
of Year
Charged toCosts andExpenses
Charged toOther
Accounts Deductions(b)
Balance atEnd ofYear
Description *Year ended September 30, 2018
Allowance for doubtful accounts (a) $ 24.9 $ 0.1 $ — $ 7.9 $ 17.1Valuation allowance for deferred tax assets 18.6 8.9 — 0.5 27.0
*Year ended September 30, 2017 Allowance for doubtful accounts (a) $ 24.5 $ 5.0 $ — $ 4.6 $ 24.9Valuation allowance for deferred tax assets 17.3 1.5 0.4 0.6 18.6
*Year ended September 30, 2016 Allowance for doubtful accounts (a) $ 24.8 $ 10.9 $ — $ 11.2 $ 24.5Valuation allowance for deferred tax assets 22.2 1.0 0.6 6.5 17.3
(a) Includes allowances for current and other long-term receivables.
(b) Consists of amounts written off for the allowance for doubtful accounts and adjustments resulting from our ability to utilize foreign tax credits, capitallosses, or net operating loss carryforwards for which a valuation allowance had previously been recorded.
* Amounts reported relate to continuing operations in all periods presented.
90
Table of Contents
INDEX TO EXHIBITS*
Exhibit No. Exhibit
21 List of Subsidiaries of the Company.
23 Consent of Independent Registered Public Accounting Firm.
24 Powers of Attorney authorizing certain persons to sign this Annual Report on Form 10-K on behalf of certain directors and officers of the
Company.
31.1 Certification of Periodic Report by the Chief Executive Officer pursuant to Rule 13a-14(a) of the Securities Exchange Act of 1934.
31.2 Certification of Periodic Report by the Chief Financial Officer pursuant to Rule 13a-14(a) of the Securities Exchange Act of 1934.
32.1 Certification of Periodic Report by the Chief Executive Officer pursuant to Section 906 of the Sarbanes-Oxley Act of 2002.
32.2 Certification of Periodic Report by the Chief Financial Officer pursuant to Section 906 of the Sarbanes-Oxley Act of 2002.
101 Interactive Data Files.
* See Part IV, Item 15(a)(3) for exhibits incorporated by reference.
91
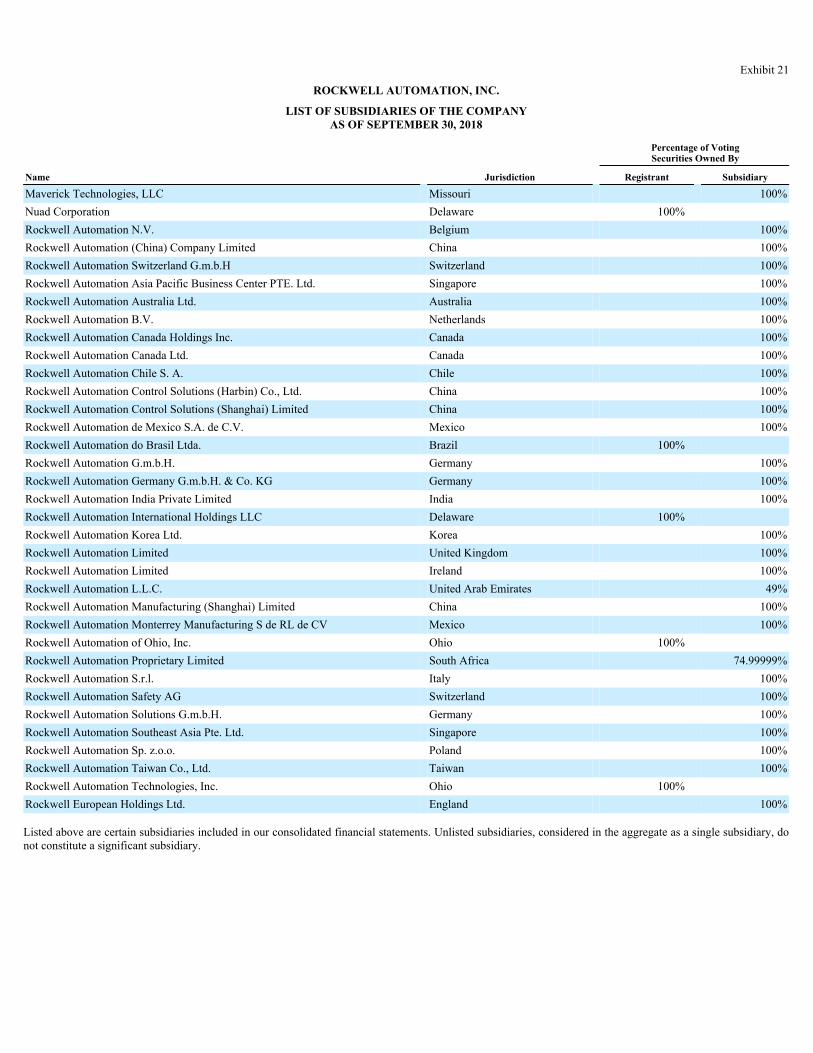
Exhibit 21
ROCKWELL AUTOMATION, INC.
LIST OF SUBSIDIARIES OF THE COMPANYAS OF SEPTEMBER 30, 2018
Percentage of VotingSecurities Owned By
Name Jurisdiction Registrant Subsidiary
Maverick Technologies, LLC Missouri 100%Nuad Corporation Delaware 100% Rockwell Automation N.V. Belgium 100%Rockwell Automation (China) Company Limited China 100%Rockwell Automation Switzerland G.m.b.H Switzerland 100%Rockwell Automation Asia Pacific Business Center PTE. Ltd. Singapore 100%Rockwell Automation Australia Ltd. Australia 100%Rockwell Automation B.V. Netherlands 100%Rockwell Automation Canada Holdings Inc. Canada 100%Rockwell Automation Canada Ltd. Canada 100%Rockwell Automation Chile S. A. Chile 100%Rockwell Automation Control Solutions (Harbin) Co., Ltd. China 100%Rockwell Automation Control Solutions (Shanghai) Limited China 100%Rockwell Automation de Mexico S.A. de C.V. Mexico 100%Rockwell Automation do Brasil Ltda. Brazil 100% Rockwell Automation G.m.b.H. Germany 100%Rockwell Automation Germany G.m.b.H. & Co. KG Germany 100%Rockwell Automation India Private Limited India 100%Rockwell Automation International Holdings LLC Delaware 100% Rockwell Automation Korea Ltd. Korea 100%Rockwell Automation Limited United Kingdom 100%Rockwell Automation Limited Ireland 100%Rockwell Automation L.L.C. United Arab Emirates 49%Rockwell Automation Manufacturing (Shanghai) Limited China 100%Rockwell Automation Monterrey Manufacturing S de RL de CV Mexico 100%Rockwell Automation of Ohio, Inc. Ohio 100% Rockwell Automation Proprietary Limited South Africa 74.99999%Rockwell Automation S.r.l. Italy 100%Rockwell Automation Safety AG Switzerland 100%Rockwell Automation Solutions G.m.b.H. Germany 100%Rockwell Automation Southeast Asia Pte. Ltd. Singapore 100%Rockwell Automation Sp. z.o.o. Poland 100%Rockwell Automation Taiwan Co., Ltd. Taiwan 100%Rockwell Automation Technologies, Inc. Ohio 100% Rockwell European Holdings Ltd. England 100%
Listed above are certain subsidiaries included in our consolidated financial statements. Unlisted subsidiaries, considered in the aggregate as a single subsidiary, donot constitute a significant subsidiary.

Exhibit 23CONSENT OF INDEPENDENT REGISTERED PUBLIC ACCOUNTING FIRM
We consent to the incorporation by reference in Registration Statement Nos. 333-101780, 333-149581, 333-150019, 333-157203, 333-165727, 333-180557, 333-184400, 333-205022, and 333-209706 on Form S-8 of our report dated November 9, 2018 , relating to the consolidated financial statements and financial statementschedule of Rockwell Automation, Inc. and the effectiveness of Rockwell Automation Inc.'s internal control over financial reporting, appearing in this AnnualReport on Form 10-K of Rockwell Automation, Inc. for the year ended September 30, 2018 .
/s/ DELOITTE & TOUCHE LLP
Milwaukee, WisconsinNovember 9, 2018
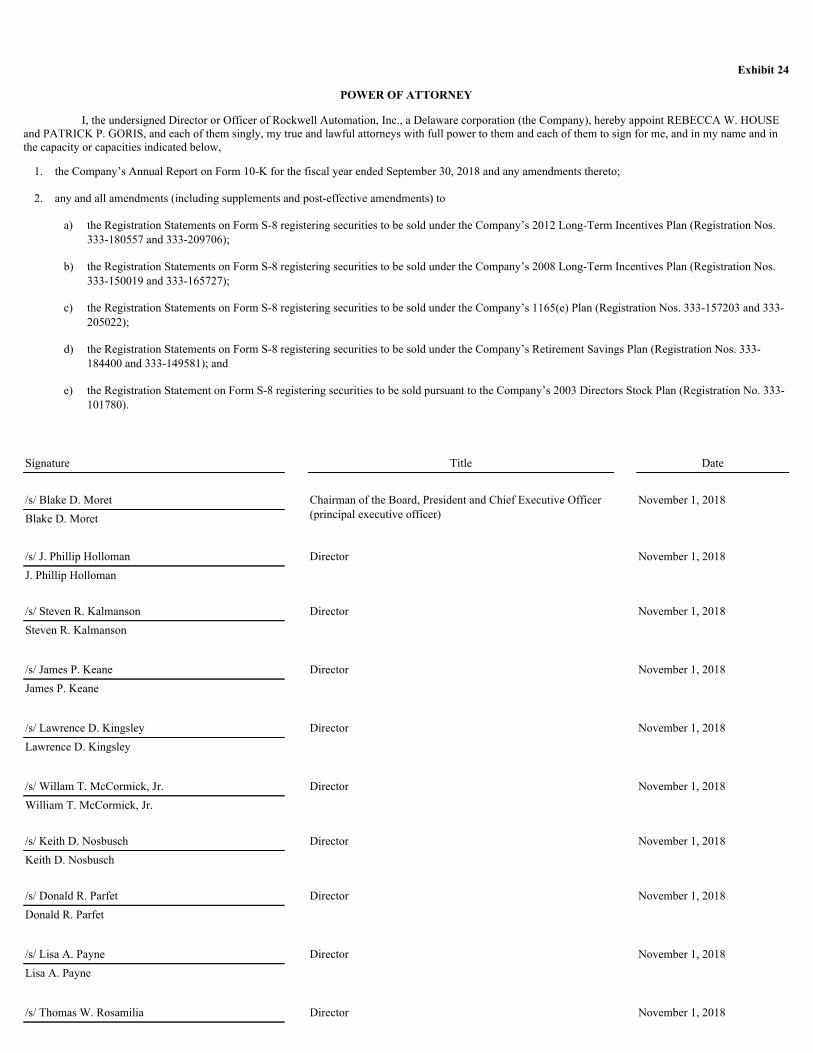
Exhibit 24
POWER OF ATTORNEY
I, the undersigned Director or Officer of Rockwell Automation, Inc., a Delaware corporation (the Company), hereby appoint REBECCA W. HOUSEand PATRICK P. GORIS, and each of them singly, my true and lawful attorneys with full power to them and each of them to sign for me, and in my name and inthe capacity or capacities indicated below,
1. the Company’s Annual Report on Form 10-K for the fiscal year ended September 30, 2018 and any amendments thereto;
2. any and all amendments (including supplements and post-effective amendments) to
a) the Registration Statements on Form S-8 registering securities to be sold under the Company’s 2012 Long-Term Incentives Plan (Registration Nos.
333-180557 and 333-209706);
b) the Registration Statements on Form S-8 registering securities to be sold under the Company’s 2008 Long-Term Incentives Plan (Registration Nos.333-150019 and 333-165727);
c) the Registration Statements on Form S-8 registering securities to be sold under the Company’s 1165(e) Plan (Registration Nos. 333-157203 and 333-205022);
d) the Registration Statements on Form S-8 registering securities to be sold under the Company’s Retirement Savings Plan (Registration Nos. 333-184400 and 333-149581); and
e) the Registration Statement on Form S-8 registering securities to be sold pursuant to the Company’s 2003 Directors Stock Plan (Registration No. 333-101780).
Signature Title Date /s/ Blake D. Moret Chairman of the Board, President and Chief Executive Officer
(principal executive officer) November 1, 2018
Blake D. Moret
/s/ J. Phillip Holloman Director November 1, 2018J. Phillip Holloman /s/ Steven R. Kalmanson Director November 1, 2018Steven R. Kalmanson
/s/ James P. Keane Director November 1, 2018James P. Keane
/s/ Lawrence D. Kingsley Director November 1, 2018Lawrence D. Kingsley
/s/ Willam T. McCormick, Jr. Director November 1, 2018William T. McCormick, Jr. /s/ Keith D. Nosbusch Director November 1, 2018Keith D. Nosbusch /s/ Donald R. Parfet Director November 1, 2018Donald R. Parfet
/s/ Lisa A. Payne Director November 1, 2018Lisa A. Payne
/s/ Thomas W. Rosamilia Director November 1, 2018

Thomas W. Rosamilia
/s/ Patricia A. Watson Director November 1, 2018Patricia A. Watson
/s/ Patrick P. Goris Senior Vice Presidentand Chief Financial Officer(principal financial officer)
November 1, 2018Patrick P. Goris
/s/ Rebecca W. House Senior Vice President,General Counsel andSecretary
November 1, 2018Rebecca W. House
/s/ David M. Dorgan Vice President andController (principalaccounting officer)
November 1, 2018David M. Dorgan
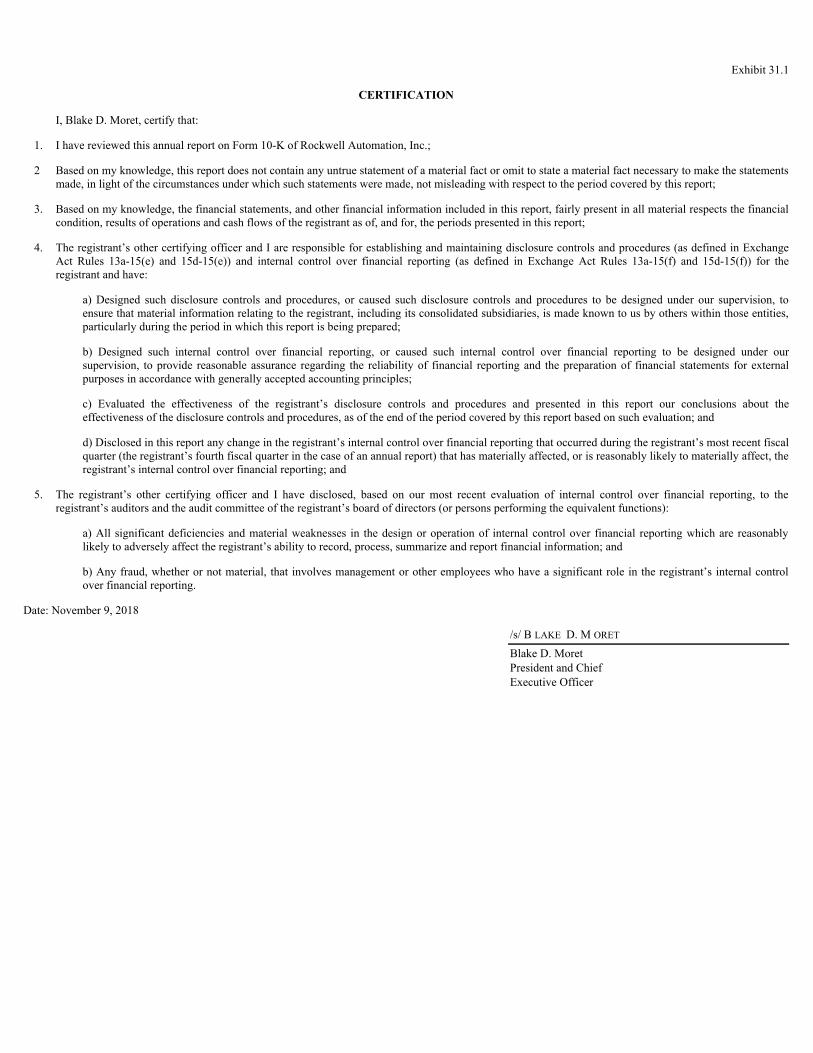
Exhibit 31.1
CERTIFICATION
I, Blake D. Moret, certify that:
1. I have reviewed this annual report on Form 10-K of Rockwell Automation, Inc.;
2 Based on my knowledge, this report does not contain any untrue statement of a material fact or omit to state a material fact necessary to make the statementsmade, in light of the circumstances under which such statements were made, not misleading with respect to the period covered by this report;
3. Based on my knowledge, the financial statements, and other financial information included in this report, fairly present in all material respects the financialcondition, results of operations and cash flows of the registrant as of, and for, the periods presented in this report;
4. The registrant’s other certifying officer and I are responsible for establishing and maintaining disclosure controls and procedures (as defined in ExchangeAct Rules 13a-15(e) and 15d-15(e)) and internal control over financial reporting (as defined in Exchange Act Rules 13a-15(f) and 15d-15(f)) for theregistrant and have:
a) Designed such disclosure controls and procedures, or caused such disclosure controls and procedures to be designed under our supervision, toensure that material information relating to the registrant, including its consolidated subsidiaries, is made known to us by others within those entities,particularly during the period in which this report is being prepared;
b) Designed such internal control over financial reporting, or caused such internal control over financial reporting to be designed under oursupervision, to provide reasonable assurance regarding the reliability of financial reporting and the preparation of financial statements for externalpurposes in accordance with generally accepted accounting principles;
c) Evaluated the effectiveness of the registrant’s disclosure controls and procedures and presented in this report our conclusions about theeffectiveness of the disclosure controls and procedures, as of the end of the period covered by this report based on such evaluation; and
d) Disclosed in this report any change in the registrant’s internal control over financial reporting that occurred during the registrant’s most recent fiscalquarter (the registrant’s fourth fiscal quarter in the case of an annual report) that has materially affected, or is reasonably likely to materially affect, theregistrant’s internal control over financial reporting; and
5. The registrant’s other certifying officer and I have disclosed, based on our most recent evaluation of internal control over financial reporting, to theregistrant’s auditors and the audit committee of the registrant’s board of directors (or persons performing the equivalent functions):
a) All significant deficiencies and material weaknesses in the design or operation of internal control over financial reporting which are reasonablylikely to adversely affect the registrant’s ability to record, process, summarize and report financial information; and
b) Any fraud, whether or not material, that involves management or other employees who have a significant role in the registrant’s internal controlover financial reporting.
Date: November 9, 2018
/s/ B LAKE D. M ORET
Blake D. Moret President and ChiefExecutive Officer
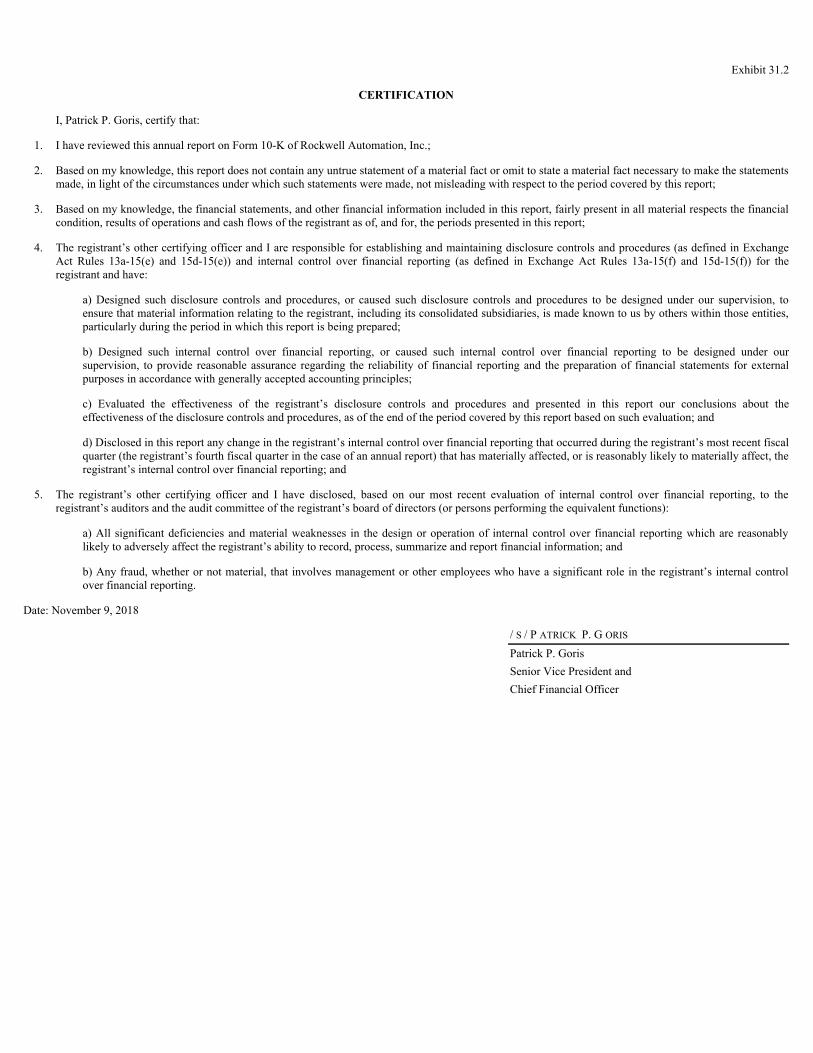
Exhibit 31.2
CERTIFICATION
I, Patrick P. Goris, certify that:
1. I have reviewed this annual report on Form 10-K of Rockwell Automation, Inc.;
2. Based on my knowledge, this report does not contain any untrue statement of a material fact or omit to state a material fact necessary to make the statementsmade, in light of the circumstances under which such statements were made, not misleading with respect to the period covered by this report;
3. Based on my knowledge, the financial statements, and other financial information included in this report, fairly present in all material respects the financialcondition, results of operations and cash flows of the registrant as of, and for, the periods presented in this report;
4. The registrant’s other certifying officer and I are responsible for establishing and maintaining disclosure controls and procedures (as defined in ExchangeAct Rules 13a-15(e) and 15d-15(e)) and internal control over financial reporting (as defined in Exchange Act Rules 13a-15(f) and 15d-15(f)) for theregistrant and have:
a) Designed such disclosure controls and procedures, or caused such disclosure controls and procedures to be designed under our supervision, toensure that material information relating to the registrant, including its consolidated subsidiaries, is made known to us by others within those entities,particularly during the period in which this report is being prepared;
b) Designed such internal control over financial reporting, or caused such internal control over financial reporting to be designed under oursupervision, to provide reasonable assurance regarding the reliability of financial reporting and the preparation of financial statements for externalpurposes in accordance with generally accepted accounting principles;
c) Evaluated the effectiveness of the registrant’s disclosure controls and procedures and presented in this report our conclusions about theeffectiveness of the disclosure controls and procedures, as of the end of the period covered by this report based on such evaluation; and
d) Disclosed in this report any change in the registrant’s internal control over financial reporting that occurred during the registrant’s most recent fiscalquarter (the registrant’s fourth fiscal quarter in the case of an annual report) that has materially affected, or is reasonably likely to materially affect, theregistrant’s internal control over financial reporting; and
5. The registrant’s other certifying officer and I have disclosed, based on our most recent evaluation of internal control over financial reporting, to theregistrant’s auditors and the audit committee of the registrant’s board of directors (or persons performing the equivalent functions):
a) All significant deficiencies and material weaknesses in the design or operation of internal control over financial reporting which are reasonablylikely to adversely affect the registrant’s ability to record, process, summarize and report financial information; and
b) Any fraud, whether or not material, that involves management or other employees who have a significant role in the registrant’s internal controlover financial reporting.
Date: November 9, 2018
/ S / P ATRICK P. G ORIS
Patrick P. GorisSenior Vice President andChief Financial Officer
Exhibit 32.1
CERTIFICATION OF PERIODIC REPORT
I, Blake D. Moret, President and Chief Executive Officer of Rockwell Automation, Inc. (the “Company”) certify, pursuant to Section 906 of the Sarbanes-OxleyAct of 2002, 18 U.S.C. Section 1350, that:
(1) the Annual Report on Form 10-K of the Company for the year ended September 30, 2018 (the “Report”) fully complies with the requirements of Section13(a) of the Securities Exchange Act of 1934; and
(2) the information contained in the Report fairly presents, in all material respects, the financial condition and results of operations of the Company.
Date: November 9, 2018
/s/ B LAKE D. M ORET
Blake D. Moret President and ChiefExecutive Officer
Exhibit 32.2
CERTIFICATION OF PERIODIC REPORT
I, Patrick P. Goris, Senior Vice President and Chief Financial Officer of Rockwell Automation, Inc. (the “Company”) certify, pursuant to Section 906 of theSarbanes-Oxley Act of 2002, 18 U.S.C. Section 1350, that:
(1) the Annual Report on Form 10-K of the Company for the year ended September 30, 2018 (the “Report”) fully complies with the requirements of Section13(a) of the Securities Exchange Act of 1934; and
(2) the information contained in the Report fairly presents, in all material respects, the financial condition and results of operations of the Company.
Date: November 9, 2018
/ S / P ATRICK P. G ORIS
Patrick P. GorisSenior Vice President andChief Financial Officer