Part A Understanding and Applying the ABS Data Quality ... · production processes and help...
21
ABS DATA QUALITY MANUAL Part A – Understanding and Applying the ABS Data Quality Framework
Transcript of Part A Understanding and Applying the ABS Data Quality ... · production processes and help...
ABS DATA QUALITY MANUAL Part A – Understanding and Applying the ABS Data
Quality Framework
ABS DATA QUALITY MANUAL Part A – Understanding and Applying the ABS Data Quality Framework
ABS DATA QUALITY MANUAL Part A – Understanding and Applying the ABS Data Quality Framework 2
Table of Contents
Introduction ............................................................................................................................................ 3
About this document .......................................................................................................................... 3
Data Quality Management Goal and Context ......................................................................................... 3
Data Quality Context for the Australian Bureau of Statistics ............................................................. 3
The Seven Dimensions of Quality ........................................................................................................... 4
Quality Declarations ................................................................................................................................ 5
About quality declarations .................................................................................................................. 5
When to create a declaration ............................................................................................................. 5
Producing declarations ....................................................................................................................... 5
Further information ............................................................................................................................ 5
Assessing Risk through the Quality Dimensions ..................................................................................... 6
Dimensions in Detail ............................................................................................................................... 6
1. Institutional Environment ............................................................................................................... 7
2. Relevance ........................................................................................................................................ 9
3. Timeliness ...................................................................................................................................... 11
4. Accuracy ........................................................................................................................................ 13
5. Coherence ...................................................................................................................................... 15
6. Interpretability .............................................................................................................................. 17
7. Accessibility ................................................................................................................................... 19
Document Control................................................................................................................................. 21
ABS DATA QUALITY MANUAL Part A – Understanding and Applying the ABS Data Quality Framework
ABS DATA QUALITY MANUAL Part A – Understanding and Applying the ABS Data Quality Framework 3
INTRODUCTION About the ABS Data Quality Manual The ABS Data Quality Manual has been developed to provide guidance and support for all statistical staff in managing quality for their statistical collections. It has been divided in to three parts: - Part A – Understanding and Applying the ABS Data Quality Framework, - Part B – Quality Gates in the Statistical Process, and; - Part C – Quality Incident Management and Reporting.
Part A – Understanding and Applying the ABS Data Quality Framework This part, Part A – Understanding and Applying the ABS Data Quality Framework, will assist readers in recognising the different contexts and applications for each dimension within the ABS Data Quality Framework. For each dimension, this part of the manual will explain:
the definition,
how to assess the quality, and;
how to write a quality declaration.
DATA QUALITY MANAGEMENT GOAL AND CONTEXT
The Data Quality Management Goal is to assure the quality of our statistical data outputs and
production processes and help integrate quality management into the business of the ABS. This is
achieved by supporting efficient quality management with tools, framework, guidelines, policies and
developing standardised statistical quality infrastructure services.
Data Quality Context for the Australian Bureau of Statistics
The ABS is Australia’s national statistical agency, providing trusted official statistics on a wide range of economic, social, population and environmental matters of importance to Australia. The ABS also has an important statistical leadership role. One of our key success factors is that decisions on important matters are informed by quality official statistics and value-added statistical solutions.
The statistical landscape is becoming more complex, expectations of decision makers are growing, and the ABS is being challenged to deliver the best possible statistical program in more efficient and innovative ways. The ABS recognises that we need to continue delivering high quality and timely official statistics, while innovating to take advantage of new information opportunities, strengthening our partnerships, and driving high performance.
The ABS operates under the Public Governance, Performance and Accountability Act 2013 and is a part of the Treasury portfolio. It is in this context that the ABS aims to continue to deliver quality, timely statistics on important matters.
In God we trust, all others must bring data
(W Edwards Deming)
ABS DATA QUALITY MANUAL Part A – Understanding and Applying the ABS Data Quality Framework
ABS DATA QUALITY MANUAL Part A – Understanding and Applying the ABS Data Quality Framework 4
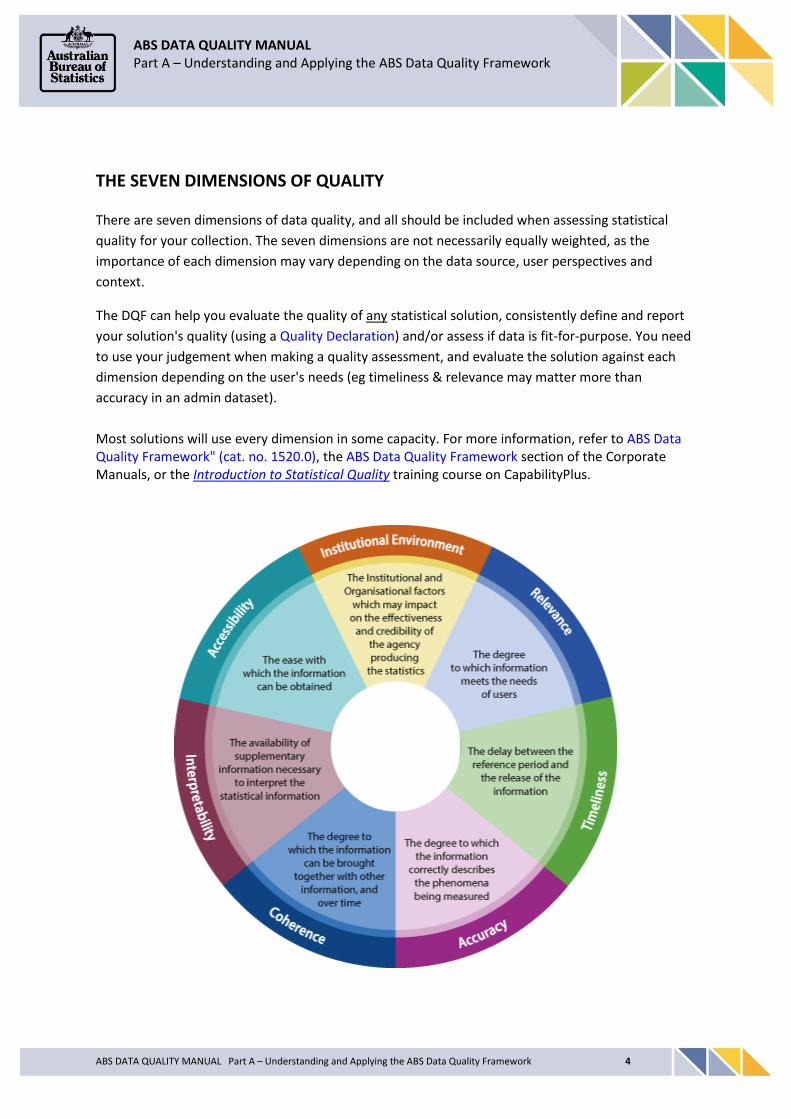
THE SEVEN DIMENSIONS OF QUALITY
There are seven dimensions of data quality, and all should be included when assessing statistical
quality for your collection. The seven dimensions are not necessarily equally weighted, as the
importance of each dimension may vary depending on the data source, user perspectives and
context.
The DQF can help you evaluate the quality of any statistical solution, consistently define and report
your solution's quality (using a Quality Declaration) and/or assess if data is fit-for-purpose. You need
to use your judgement when making a quality assessment, and evaluate the solution against each
dimension depending on the user's needs (eg timeliness & relevance may matter more than
accuracy in an admin dataset).
Most solutions will use every dimension in some capacity. For more information, refer to ABS Data Quality Framework" (cat. no. 1520.0), the ABS Data Quality Framework section of the Corporate Manuals, or the Introduction to Statistical Quality training course on CapabilityPlus.
ABS DATA QUALITY MANUAL Part A – Understanding and Applying the ABS Data Quality Framework
ABS DATA QUALITY MANUAL Part A – Understanding and Applying the ABS Data Quality Framework 5
QUALITY DECLARATIONS
About quality declarations
Quality declarations are informative, plain English statements which describe the quality of
statistical products as assessed against the seven dimensions of the ABS Data Quality Framework.
They are brief statements highlighting key aspects of the data, allowing users to easily assess if their
data is fit-for-purpose. Declarations complement, but do not replace, existing explanatory and
technical notes, and more detailed documentation.
Examples of how to write a declaration for each dimension can be found later in this manual.
When to create a declaration A quality declaration should be created for all new statistical products. This covers any new
collection conducted under our Act and most products disseminated on our website.
Some specialist products such as CURFs and other datasets also require quality declarations. They
only have to be updated when circumstances in a collection change.
Producing declarations At present, we prepare declarations in the Collections Management System (CMS) and Website
Content Approvals (WCA). Step-by-step instructions on creating quality declarations are
demonstrated in the Design and Prepare Quality Declarations training module in CapabilityPlus.
Monthly or quarterly publications usually carry over the same contents unless there has been a
change in the collection.
A review of the quality declaration should occur whenever there is a change in the collection that
impacts on a dimension of quality, for example:
A change in geographical standards for a household survey may reduce the coherence of the time series.
A change in the definition of a data item may make that data irrelevant for users.
If the reference period changes the timeliness dimension would need to be updated.
Further information
For further information on preparing a quality declaration, including step-by-step instructions on
creating quality declarations in the Collections Management System (CMS) and Website Contents
Approvals (WCA), please refer to the Design and Prepare Quality Declarations training module in
CapabilityPlus.
For information on preparing quality declarations for Confidentialised Unit Record Files (CURFs)
please see Quality Declarations for CURFs.
As quality declarations will be displayed on the ABS website, the Publishing Standards and Guidelines
for Web Content should be consulted.
ABS DATA QUALITY MANUAL Part A – Understanding and Applying the ABS Data Quality Framework
ABS DATA QUALITY MANUAL Part A – Understanding and Applying the ABS Data Quality Framework 6
ASSESSING RISK THROUGH THE QUALITY DIMENSIONS
Risk is the effect of uncertainty of objectives. Statistical risk, as defined in the ABS Data Quality
Framework, is the risk that the ABS publishes statistics that are not considered fit-for-purpose by its
users. The ABS’ Risk Management Framework fully explains risk in an ABS context. The dimensions of
quality can be used to assess statistical risks, for example:
Institutional Environment – the risk that the estimates are not credible
Relevance – the risk that the estimates are irrelevant
Timeliness – the risk that the estimates are delayed/too late to be useful
Accuracy – the risk that the estimates are inaccurate
Coherence – the risk that the estimates are incoherent
Interpretability – the risk that the estimates are misinterpreted
Accessibility – the risk that the estimates are inaccessible
DIMENSIONS IN DETAIL
The following section will go through each dimension, outlining the key concepts and applications.
For each dimension, this manual includes:
- a brief description, - assessment criteria, - a case study , and; - an example of a quality declaration.
ABS DATA QUALITY MANUAL Part A – Understanding and Applying the ABS Data Quality Framework
ABS DATA QUALITY MANUAL Part A – Understanding and Applying the ABS Data Quality Framework 7
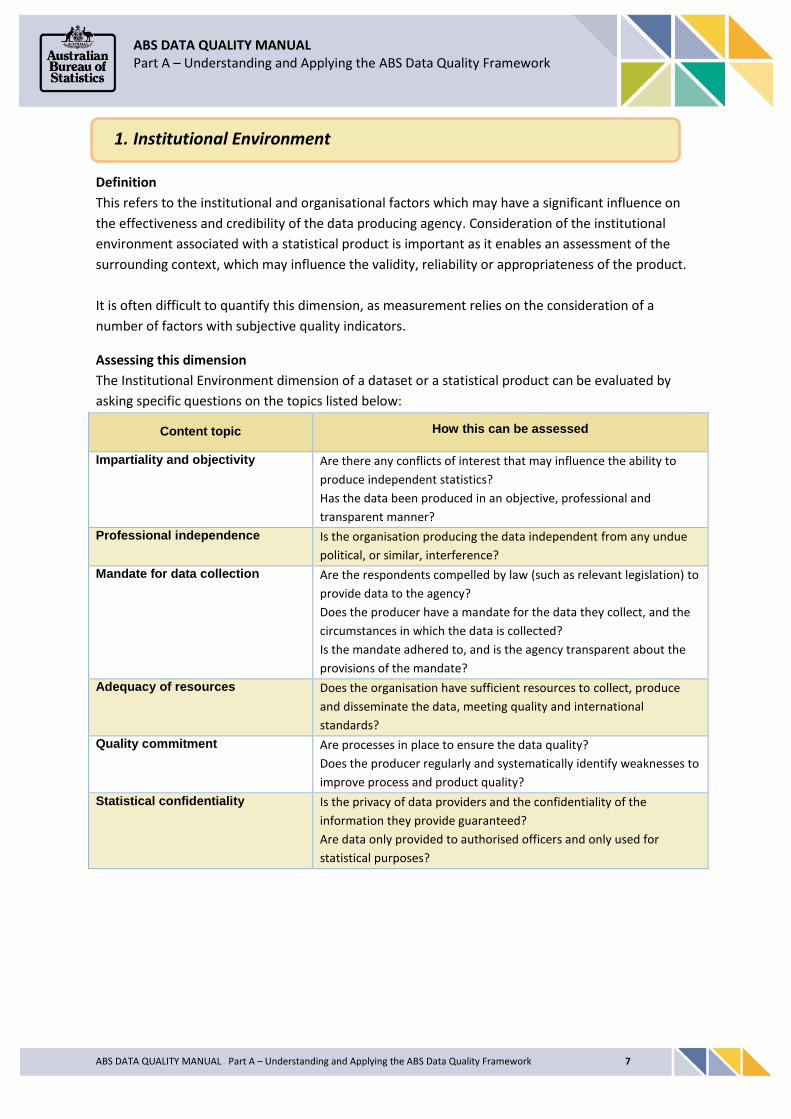
Definition
This refers to the institutional and organisational factors which may have a significant influence on
the effectiveness and credibility of the data producing agency. Consideration of the institutional
environment associated with a statistical product is important as it enables an assessment of the
surrounding context, which may influence the validity, reliability or appropriateness of the product.
It is often difficult to quantify this dimension, as measurement relies on the consideration of a
number of factors with subjective quality indicators.
Assessing this dimension
The Institutional Environment dimension of a dataset or a statistical product can be evaluated by
asking specific questions on the topics listed below:
Content topic How this can be assessed
Impartiality and objectivity
Are there any conflicts of interest that may influence the ability to
produce independent statistics?
Has the data been produced in an objective, professional and
transparent manner?
Professional independence Is the organisation producing the data independent from any undue
political, or similar, interference?
Mandate for data collection Are the respondents compelled by law (such as relevant legislation) to
provide data to the agency?
Does the producer have a mandate for the data they collect, and the
circumstances in which the data is collected?
Is the mandate adhered to, and is the agency transparent about the
provisions of the mandate?
Adequacy of resources Does the organisation have sufficient resources to collect, produce
and disseminate the data, meeting quality and international
standards?
Quality commitment Are processes in place to ensure the data quality?
Does the producer regularly and systematically identify weaknesses to
improve process and product quality?
Statistical confidentiality Is the privacy of data providers and the confidentiality of the
information they provide guaranteed?
Are data only provided to authorised officers and only used for
statistical purposes?
1. Institutional Environment

ABS DATA QUALITY MANUAL Part A – Understanding and Applying the ABS Data Quality Framework
ABS DATA QUALITY MANUAL Part A – Understanding and Applying the ABS Data Quality Framework 8
But why is it important?
When using a dataset to make their decision, users are placing their trust in both the quality of the
organisation that produced the data and the methods that were used to obtain and report on the
data. Below is an example of where the quality of the institutional environment of a producer is
compromised, and how it can affect the data:
Institutional Environment and your quality declaration
For products that are primarily produced from data collected under the Census and Statistics Act,
1905, a link to standard wording on the institutional environment of the ABS may be provided.
Customised information will be written when the product is from administrative data or multiple
sources. This information may be brief with detailed information included in a second layer if
necessary.
Product from administrative data – Births, Australia (cat. no. 3301.0) For information on the institutional environment of the Australian Bureau of Statistics (ABS), including the legislative obligations of the ABS, financing and governance arrangements, and mechanisms for scrutiny of ABS operations, please see ABS Institutional Environment. Birth statistics published by the ABS are sourced from birth registration systems administered by state and territory Registrars of Births, Deaths and Marriages, based on data provided on a registration form completed by the parent(s) of the child. Registration of births is compulsory in Australia under relevant state/territory legislation.
1 Don’t lie to me Argentina Why we are removing a figure from our indicators page – The Economist, 25 Feb
2012 2 IMF censures Argentina for dodgy economic data, threatens sanctions – Russian Television – 2 Feb 2013
3 Argentina GDP Defies JPMorgan and Reignites Data Scepticism – Charlie Devereux, Bloomberg – 25 Sep 2014
Case Study – Argentina’s official statistics IMF threatens sanctions on Argentina due to perceived poor quality official statistics. Political interference in statistics (and poor quality of reporting) can have a dramatic impact on a country in the long term. After ongoing concerns1, the IMF issued Argentina with a censure document in 2013, which had the potential to lead to sanctions and being barred from the necessary financing to run its economy. The source of concern was a breach of its obligations to the fund to provide reliable information on its economy. Specifically, one of the major concerns was that inflation was being underreported for several years in order to reduce payments on inflation indexed debt (and political gain).2 Although “more reliable” numbers were published later in the year, leading industry sources (JP Morgan) remain concerned with the lack of coherence of the 2015 estimates.3
ABS DATA QUALITY MANUAL Part A – Understanding and Applying the ABS Data Quality Framework
ABS DATA QUALITY MANUAL Part A – Understanding and Applying the ABS Data Quality Framework 9
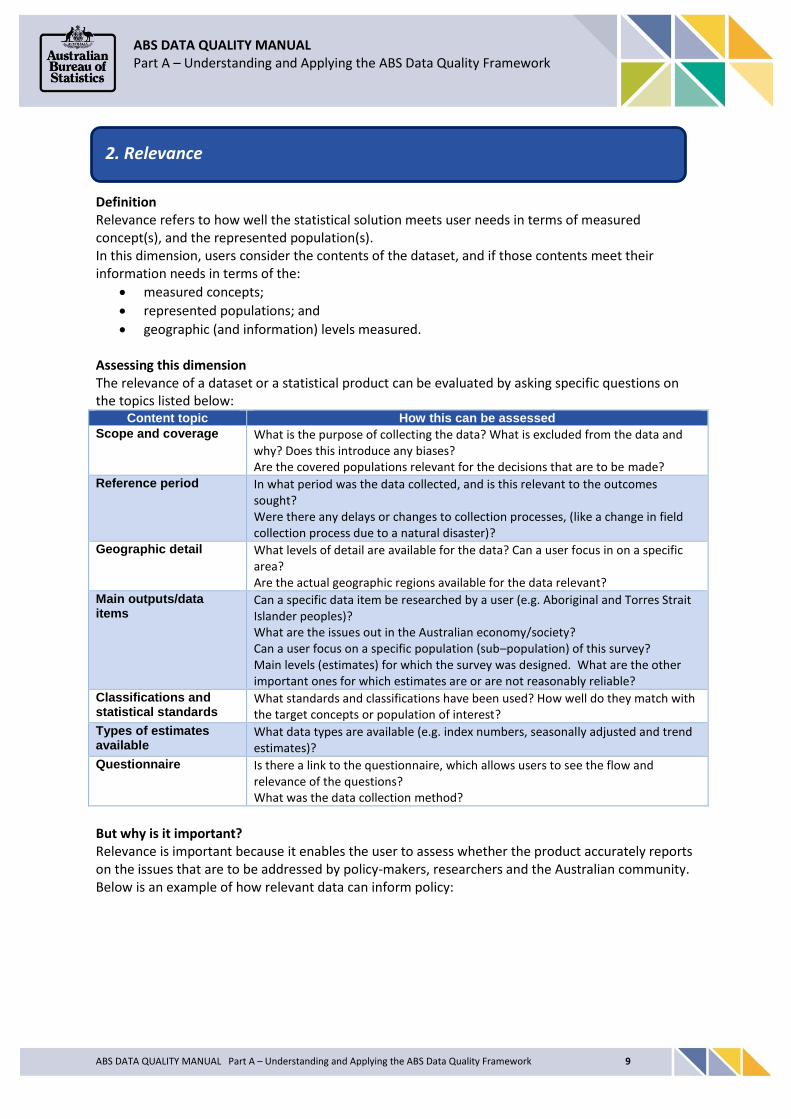
Definition Relevance refers to how well the statistical solution meets user needs in terms of measured concept(s), and the represented population(s). In this dimension, users consider the contents of the dataset, and if those contents meet their information needs in terms of the:
measured concepts;
represented populations; and
geographic (and information) levels measured. Assessing this dimension The relevance of a dataset or a statistical product can be evaluated by asking specific questions on the topics listed below:
Content topic How this can be assessed Scope and coverage What is the purpose of collecting the data? What is excluded from the data and
why? Does this introduce any biases? Are the covered populations relevant for the decisions that are to be made?
Reference period In what period was the data collected, and is this relevant to the outcomes sought? Were there any delays or changes to collection processes, (like a change in field collection process due to a natural disaster)?
Geographic detail What levels of detail are available for the data? Can a user focus in on a specific area? Are the actual geographic regions available for the data relevant?
Main outputs/data items
Can a specific data item be researched by a user (e.g. Aboriginal and Torres Strait Islander peoples)? What are the issues out in the Australian economy/society? Can a user focus on a specific population (sub–population) of this survey? Main levels (estimates) for which the survey was designed. What are the other important ones for which estimates are or are not reasonably reliable?
Classifications and statistical standards
What standards and classifications have been used? How well do they match with the target concepts or population of interest?
Types of estimates available
What data types are available (e.g. index numbers, seasonally adjusted and trend estimates)?
Questionnaire Is there a link to the questionnaire, which allows users to see the flow and relevance of the questions? What was the data collection method?
But why is it important? Relevance is important because it enables the user to assess whether the product accurately reports on the issues that are to be addressed by policy-makers, researchers and the Australian community. Below is an example of how relevant data can inform policy:
2. Relevance
ABS DATA QUALITY MANUAL Part A – Understanding and Applying the ABS Data Quality Framework
ABS DATA QUALITY MANUAL Part A – Understanding and Applying the ABS Data Quality Framework 10
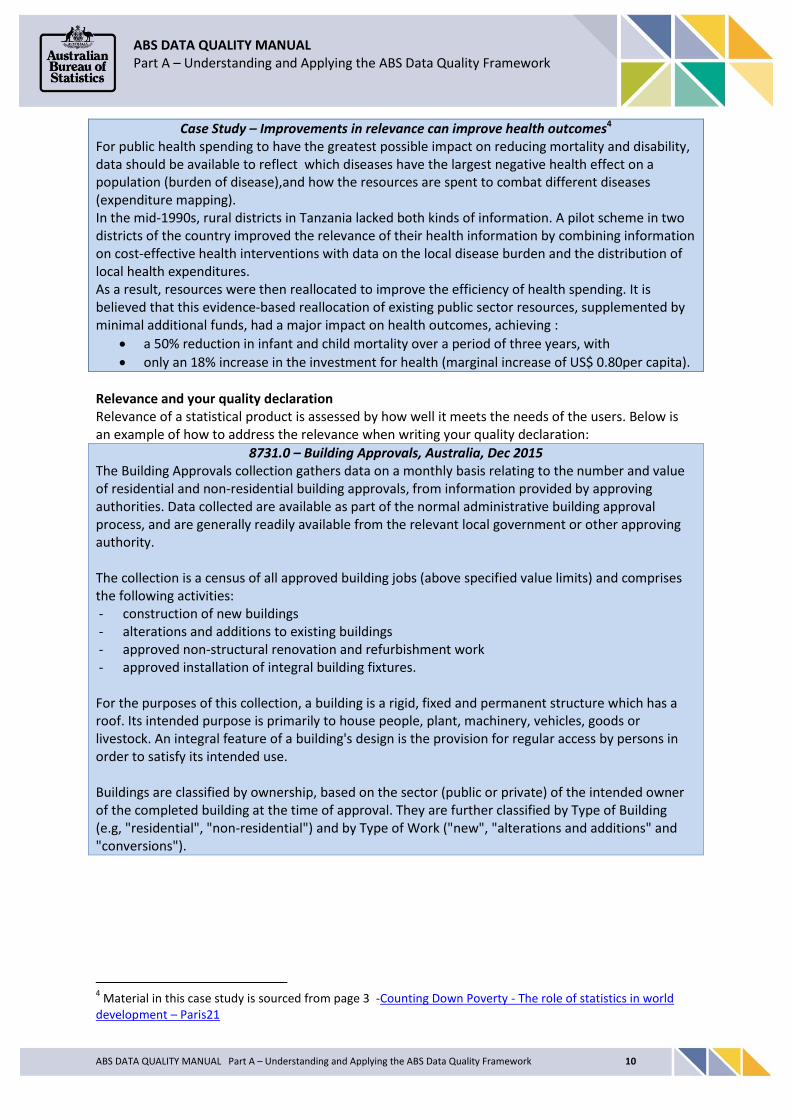
Case Study – Improvements in relevance can improve health outcomes4 For public health spending to have the greatest possible impact on reducing mortality and disability, data should be available to reflect which diseases have the largest negative health effect on a population (burden of disease),and how the resources are spent to combat different diseases (expenditure mapping). In the mid-1990s, rural districts in Tanzania lacked both kinds of information. A pilot scheme in two districts of the country improved the relevance of their health information by combining information on cost-effective health interventions with data on the local disease burden and the distribution of local health expenditures. As a result, resources were then reallocated to improve the efficiency of health spending. It is believed that this evidence-based reallocation of existing public sector resources, supplemented by minimal additional funds, had a major impact on health outcomes, achieving :
a 50% reduction in infant and child mortality over a period of three years, with
only an 18% increase in the investment for health (marginal increase of US$ 0.80per capita).
Relevance and your quality declaration Relevance of a statistical product is assessed by how well it meets the needs of the users. Below is an example of how to address the relevance when writing your quality declaration:
8731.0 – Building Approvals, Australia, Dec 2015 The Building Approvals collection gathers data on a monthly basis relating to the number and value of residential and non-residential building approvals, from information provided by approving authorities. Data collected are available as part of the normal administrative building approval process, and are generally readily available from the relevant local government or other approving authority. The collection is a census of all approved building jobs (above specified value limits) and comprises the following activities: - construction of new buildings - alterations and additions to existing buildings - approved non-structural renovation and refurbishment work - approved installation of integral building fixtures. For the purposes of this collection, a building is a rigid, fixed and permanent structure which has a roof. Its intended purpose is primarily to house people, plant, machinery, vehicles, goods or livestock. An integral feature of a building's design is the provision for regular access by persons in order to satisfy its intended use. Buildings are classified by ownership, based on the sector (public or private) of the intended owner of the completed building at the time of approval. They are further classified by Type of Building (e.g, "residential", "non-residential") and by Type of Work ("new", "alterations and additions" and "conversions").
4 Material in this case study is sourced from page 3 -Counting Down Poverty - The role of statistics in world
development – Paris21

ABS DATA QUALITY MANUAL Part A – Understanding and Applying the ABS Data Quality Framework
ABS DATA QUALITY MANUAL Part A – Understanding and Applying the ABS Data Quality Framework 11
Definition This dimension refers to both:
the delay between the reference period (to which the data pertain) and when the data becomes available; and
the delay between the advertised date and when the data becomes available. Assessing this dimension The timeliness of a statistical solution or product can be addressed by considering the following topics:
Content topic How this can be assessed Timing When is the data released?
What is the delay between the reference period and release of the data, and will this affect the ability to make informed decisions? Is there a gap between the advertised and actual release dates?
Frequency How frequently is this data collection conducted (e.g. one-off, monthly, quarterly, annual)? Are there likely to be subsequent surveys or data collection issues for this topic? Will there be updates or revisions to the data after release?
But why is it important? Monitoring performance and making informed decisions relies on timely access to quality data, so producers should minimise delays in making data available. Users need to be confident that statistics will be released on schedule, and available in a timely fashion. A significant lag between reference periods and reporting reduces the ability of statistics to support timely decision making, strategic planning and forecasting. Below is an example of how political influence can affect the timely release of data, and subsequently disrupt effective decision making:
5 University of California delays release of admission data until next month – Suhana Hussain, The Daily
Californian April 2015
Case Study - UC delays admissions data In 2015, the University of California delayed the release of admissions data5, which was usually released in April. It was speculated that the data could reveal an increase of people on waiting lists, which would feed in to criticisms of the university that there was decreased access for California students. If the University were to release data which depicted a decrease in admissions, it would negatively impact their position in requesting additional funding. A budget stand-off concerning the University was currently in progress, amid political tensions over whether to increase the tuition fees, which was in direct conflict with the Governors’ plan to keep tuition flat. The delay in the release of the data meant that budget discussions were challenging.
3. Timeliness
ABS DATA QUALITY MANUAL Part A – Understanding and Applying the ABS Data Quality Framework
ABS DATA QUALITY MANUAL Part A – Understanding and Applying the ABS Data Quality Framework 12
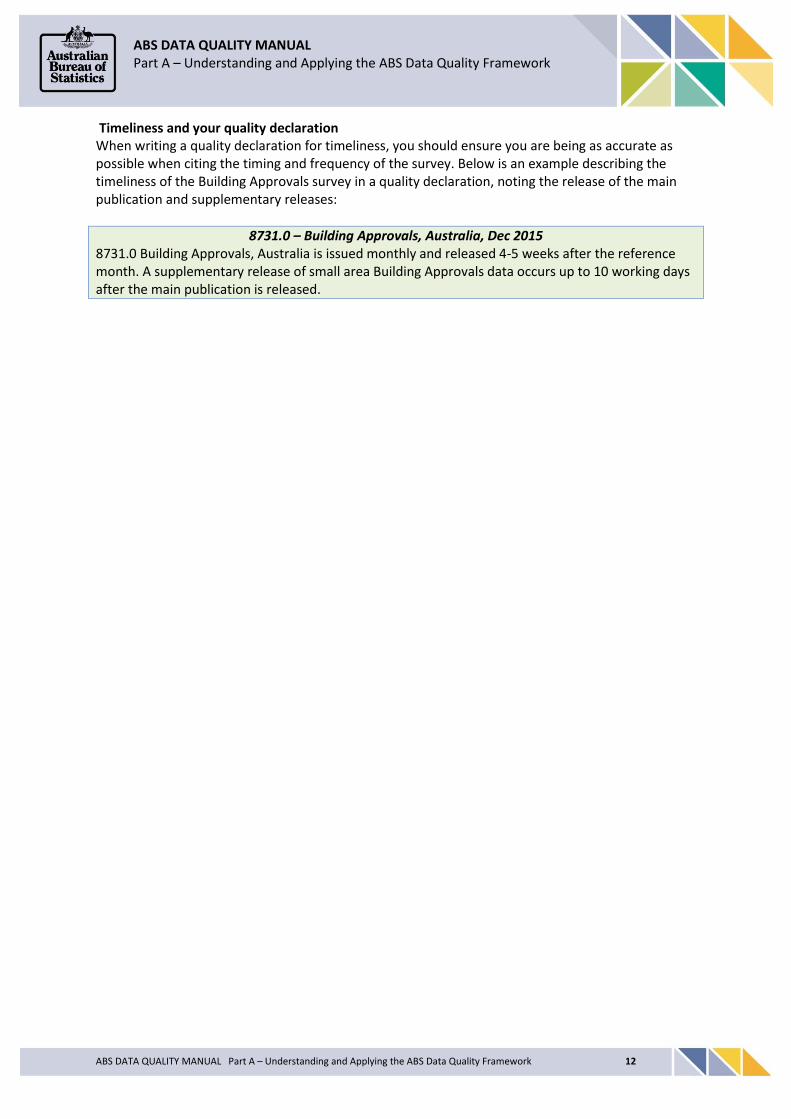
Timeliness and your quality declaration When writing a quality declaration for timeliness, you should ensure you are being as accurate as possible when citing the timing and frequency of the survey. Below is an example describing the timeliness of the Building Approvals survey in a quality declaration, noting the release of the main publication and supplementary releases:
8731.0 – Building Approvals, Australia, Dec 2015 8731.0 Building Approvals, Australia is issued monthly and released 4-5 weeks after the reference month. A supplementary release of small area Building Approvals data occurs up to 10 working days after the main publication is released.
ABS DATA QUALITY MANUAL Part A – Understanding and Applying the ABS Data Quality Framework
ABS DATA QUALITY MANUAL Part A – Understanding and Applying the ABS Data Quality Framework 13
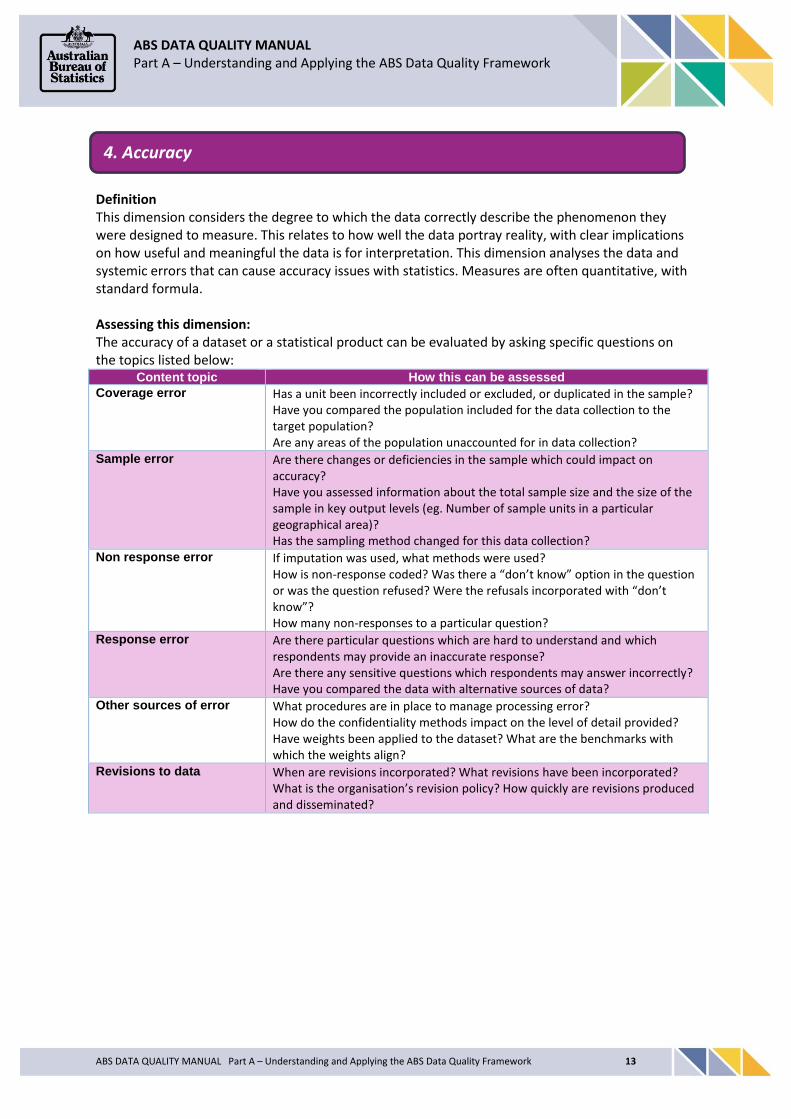
Definition This dimension considers the degree to which the data correctly describe the phenomenon they were designed to measure. This relates to how well the data portray reality, with clear implications on how useful and meaningful the data is for interpretation. This dimension analyses the data and systemic errors that can cause accuracy issues with statistics. Measures are often quantitative, with standard formula. Assessing this dimension: The accuracy of a dataset or a statistical product can be evaluated by asking specific questions on the topics listed below:
Content topic How this can be assessed Coverage error Has a unit been incorrectly included or excluded, or duplicated in the sample?
Have you compared the population included for the data collection to the target population? Are any areas of the population unaccounted for in data collection?
Sample error Are there changes or deficiencies in the sample which could impact on accuracy? Have you assessed information about the total sample size and the size of the sample in key output levels (eg. Number of sample units in a particular geographical area)? Has the sampling method changed for this data collection?
Non response error If imputation was used, what methods were used? How is non-response coded? Was there a “don’t know” option in the question or was the question refused? Were the refusals incorporated with “don’t know”? How many non-responses to a particular question?
Response error Are there particular questions which are hard to understand and which respondents may provide an inaccurate response? Are there any sensitive questions which respondents may answer incorrectly? Have you compared the data with alternative sources of data?
Other sources of error What procedures are in place to manage processing error? How do the confidentiality methods impact on the level of detail provided? Have weights been applied to the dataset? What are the benchmarks with which the weights align?
Revisions to data When are revisions incorporated? What revisions have been incorporated? What is the organisation’s revision policy? How quickly are revisions produced and disseminated?
4. Accuracy

ABS DATA QUALITY MANUAL Part A – Understanding and Applying the ABS Data Quality Framework
ABS DATA QUALITY MANUAL Part A – Understanding and Applying the ABS Data Quality Framework 14
But why is it important? Population data is often used to inform policy and budgetary decisions and if inaccurate, can lead to errors in policy or government initiatives. Below is an example of how ensuring your data accuracy is important:
Case Study – Statistics Canada National Household Survey Statistics Canada uncovered serious errors as a result of a last minute quality check on the 2013 National Household Survey6. The data is used to inform policy on a variety of topics, including roads and housing, and services such as hospitals and recreation centres. This was the first time the survey was conducted voluntarily and therefore meant that extensive data manipulation was required. As such, the survey was inherently more prone to errors. A range of experts had previously stated that the change in collection method (from mandatory to voluntary) would provide less reliable data. The finding of errors meant that the release of data was postponed.
Accuracy and your quality declaration Describing the accuracy of your data in a quality declaration requires ensuring you address any factors which could affect the accuracy of the estimates. This includes changes in the collection process, any possible reasons for incomplete data, and changes in regulations from State to State. Below is an excerpt on accuracy from a quality declaration for the Building Approvals survey:
8731.0 – Building Approvals, Australia, Dec 2015 The Building Approvals collection is a census and hence is not subject to sampling error. However, issues such as coverage of reporting authorities and completeness and timeliness of reporting, as well as the quality of the data reported, do exist. Building Approvals data is collected as administrative by-product from local government and other reporting authorities and can be sensitive to changes in legislation and administrative practices which can vary from State to State. The introduction of private certification introduced another step in the building approval process. Private certifiers lodge approval details with reporting authorities, who then load them to their systems and report all building approvals in their jurisdiction to the ABS. This extra step can cause a lag in the provision of building approvals to the ABS. This can mean, for some authorities, that complete data for a particular month is not available until the following month. Revisions as a result of data collection problems are made to Building Approval estimates. There are a number of reasons for data collection problems such as reporting authorities experiencing problems with their processing systems, reporting incomplete data and not reporting within the correct timeframe. In these cases an estimate is included for that month. Overall, revisions are generally confined to the last 12-18 months, depending on their significance. Value data reported for houses are generally a reliable indicator of the completed value, but for "other residential buildings" and "non-residential buildings" they can differ significantly from the completed value of the building. This is because final costs and contracts have not been established before council approval is gained.
6 StatsCan halts data release over survey error – Barrie McKenna, The Globe and Mail, 2013
ABS DATA QUALITY MANUAL Part A – Understanding and Applying the ABS Data Quality Framework
ABS DATA QUALITY MANUAL Part A – Understanding and Applying the ABS Data Quality Framework 15
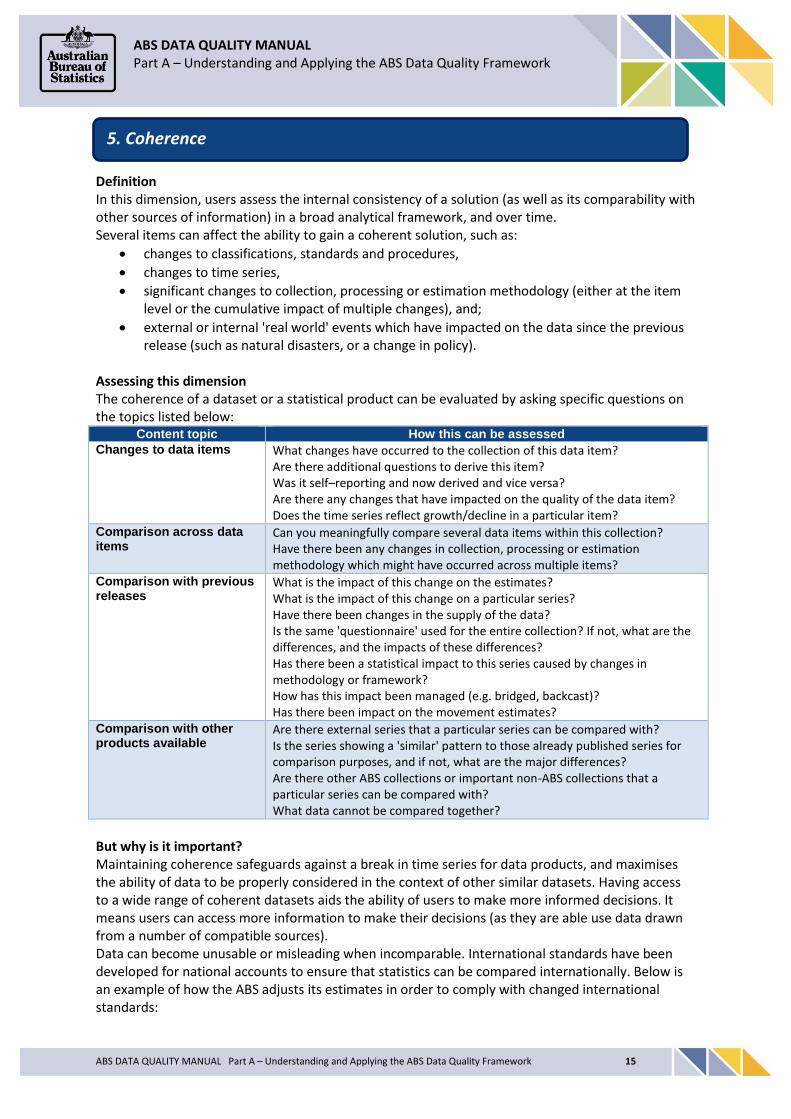
Definition In this dimension, users assess the internal consistency of a solution (as well as its comparability with other sources of information) in a broad analytical framework, and over time. Several items can affect the ability to gain a coherent solution, such as:
changes to classifications, standards and procedures,
changes to time series,
significant changes to collection, processing or estimation methodology (either at the item level or the cumulative impact of multiple changes), and;
external or internal 'real world' events which have impacted on the data since the previous release (such as natural disasters, or a change in policy).
Assessing this dimension The coherence of a dataset or a statistical product can be evaluated by asking specific questions on the topics listed below:
Content topic How this can be assessed Changes to data items What changes have occurred to the collection of this data item?
Are there additional questions to derive this item? Was it self–reporting and now derived and vice versa? Are there any changes that have impacted on the quality of the data item? Does the time series reflect growth/decline in a particular item?
Comparison across data items
Can you meaningfully compare several data items within this collection? Have there been any changes in collection, processing or estimation methodology which might have occurred across multiple items?
Comparison with previous releases
What is the impact of this change on the estimates? What is the impact of this change on a particular series? Have there been changes in the supply of the data? Is the same 'questionnaire' used for the entire collection? If not, what are the differences, and the impacts of these differences? Has there been a statistical impact to this series caused by changes in methodology or framework? How has this impact been managed (e.g. bridged, backcast)? Has there been impact on the movement estimates?
Comparison with other products available
Are there external series that a particular series can be compared with? Is the series showing a 'similar' pattern to those already published series for comparison purposes, and if not, what are the major differences? Are there other ABS collections or important non-ABS collections that a particular series can be compared with? What data cannot be compared together?
But why is it important? Maintaining coherence safeguards against a break in time series for data products, and maximises the ability of data to be properly considered in the context of other similar datasets. Having access to a wide range of coherent datasets aids the ability of users to make more informed decisions. It means users can access more information to make their decisions (as they are able use data drawn from a number of compatible sources). Data can become unusable or misleading when incomparable. International standards have been developed for national accounts to ensure that statistics can be compared internationally. Below is an example of how the ABS adjusts its estimates in order to comply with changed international standards:
5. Coherence
ABS DATA QUALITY MANUAL Part A – Understanding and Applying the ABS Data Quality Framework
ABS DATA QUALITY MANUAL Part A – Understanding and Applying the ABS Data Quality Framework 16
Case Study – Changes to international standards The ABS produces the International Accounts statistics and National Accounts which measure economic performance internationally and are compiled in accordance with international standards and related classifications. In 2006, these international standards were revised7, which meant it was necessary for the ABS to redress some areas of now non-compliance to ensure international comparability. Changes across the suite of macro-economic statistics were made, with extensive consultations, and implemented over a number of years to ensure that the integrity of the time series was not jeopardised. Full and complete information on the changes was provided to users of the data. By guaranteeing the coherence of time series, the reliability of the ABS’ economic statistics was maintained.
Coherence and your quality declaration If there are any factors that can affect the comparability of data over time, they should be outlined in your quality declaration. The internal and external factors affecting coherence of the Building Approvals survey are provided in the example below:
8731.0 – Building Approvals, Australia, Dec 2015 Most data are directly comparable over different collection cycles. The original estimates of the number and value of dwelling units approved, in new residential buildings, are available at the Australia level from January 1956. The Type of Work classification refers to the building activity carried out: new, alterations and additions, or conversions. Up to and including the December 1997 issue of 8731.0, conversions were published as part of a category called "Conversions, etc". This category included dwellings created by: - alterations and additions to residential buildings, - conversion of non-residential buildings to residential buildings (i.e. "conversions"), and - construction of non-residential buildings. From the January 1998 issue onwards, the three components of "conversions, etc" are shown separately in their own right in some tables. However, the corresponding value of the dwellings created as part of the construction of non-residential buildings (the third component above) remains in the value of the appropriate non-residential building category. The Value of Approval includes the 10% Goods and Services Tax (GST) from 1/07/2000. However, this is unlikely to have caused a significant one-off impact between June and July because it is likely that values inclusive of GST had been gradually included in the series for the 6 months or more leading up to 1/07/2000. This is because if a building job was not expected to have been completed prior to 1/07/2000, then it was known that the portion not completed would be subject to the GST. For further discussion see the Technical Note "Factors that influence the valuation of building approvals" in 8731.0 Building Approvals, Australia, Jul 2000 issue. The survey has adjusted to increasing current prices by adjusting the size of the approvals that are included in the collection. From July 1990 these statistics include: - All approved residential building jobs (new and alterations and additions) valued at $10,000 or
more; - All approved non-residential building jobs (new and alterations and additions) valued at $50,000
or more.
7 http://www.abs.gov.au/ausstats/[email protected]/mf/5310.0.55.001 - 5310.0.55.001 - Information Paper:
Introduction of revised international standards in ABS economic statistics in 2009, 2007

ABS DATA QUALITY MANUAL Part A – Understanding and Applying the ABS Data Quality Framework
ABS DATA QUALITY MANUAL Part A – Understanding and Applying the ABS Data Quality Framework 17
Definition This dimension measures the interpretability of the data particularly through the availability, presentation and comprehensiveness of supporting information. This includes making sure that the producer is providing enough key information to support correct interpretation. Factors such as the variables used, the availability of metadata (including concepts, classifications, and measures of accuracy) should be considered. Assessing this dimension The interpretability of a dataset or a statistical product can be evaluated by asking specific questions on the topics listed below:
Content topic How this can be assessed Presentation of the information
Is information available to help users gauge the potential magnitude of error in the data? Does the data have analytical summaries to assist in drawing out key messages? Is the presentation format readable and understandable?
Availability of supplementary information
What supplementary information is available to help users interpret the data (e.g. concept, sources and methods, time series methods)? Are common misunderstood terms defined (e.g. youth, response vs enumeration rate, underemployment, unemployment, wealth, GDP)? Are there any information papers or articles available to help provide more insight into the concepts?
But why is it important? No one product can satisfy every single user need, and not all users have the same level of statistical knowledge. Data producers help users make informed decisions by giving them enough information to understand and use the data. This aids understanding, and helps guard against inferential errors. If data is incorrectly interpreted, users could get an incorrect picture of what the data was intending to measure. Below is an example of how poorly presented statistics can affect the ability of users to correctly analyse the data:
Case Study – Violence Against Women The Washington Post published an opinion editorial in 20148 stating that sexual assault was less likely to occur in circumstances where the woman was married. This was as a result of a misinterpretation of the data, and suggested that the blame lay with the victim for not being married. The data was displayed in a chart of rate of female victims and only one other variable, which was household composition. Domestic violence analysis is generally attributed to a variety of other factors which were not stated on this chart. The piece stated that the chart depicted a lower rate of violence for married individuals, without comparing other factors such age, location, and the likelihood of violence being reported. Victimisation is known to be higher in younger males and females, who are less likely to be married as a result of their age, and married couples are less likely to report violence. Because the data did not reflect the variety of contributing factors, the data was misinterpreted.
8 The Washington Post Misused the Data on Violence Against Women – Mona Chalabi, 2014
6. Interpretability

ABS DATA QUALITY MANUAL Part A – Understanding and Applying the ABS Data Quality Framework
ABS DATA QUALITY MANUAL Part A – Understanding and Applying the ABS Data Quality Framework 18
Interpretability and your quality declaration To ensure that the data is correctly interpreted, you should explain any volatility in the data and provide links to explanatory notes or information papers where applicable in your quality declaration, for example:
8731.0 – Building Approvals, Australia, Dec 2015 The major series estimates for this collection are available in original, seasonally adjusted and trend series. To find out more information on seasonal adjustment and trend estimates please see Timeseries Analysis Frequently Asked Questions or 8731.0 Building Approvals explanatory notes. Where it has been identified by a council or other approving authority that approvals submitted from its jurisdiction are on a GST-exclusive basis, the ABS has made adjustments to the data to ensure that values are consistent with other data collected and are inclusive of GST.
ABS DATA QUALITY MANUAL Part A – Understanding and Applying the ABS Data Quality Framework
ABS DATA QUALITY MANUAL Part A – Understanding and Applying the ABS Data Quality Framework 19
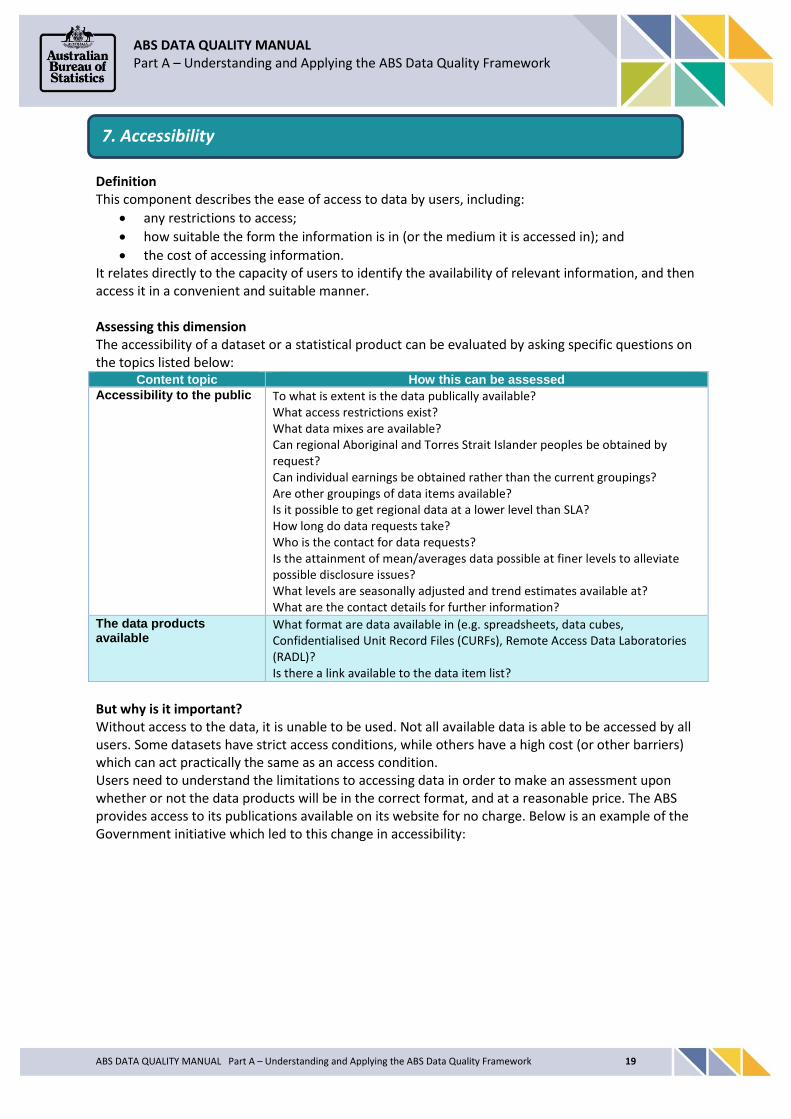
Definition This component describes the ease of access to data by users, including:
any restrictions to access;
how suitable the form the information is in (or the medium it is accessed in); and
the cost of accessing information. It relates directly to the capacity of users to identify the availability of relevant information, and then access it in a convenient and suitable manner. Assessing this dimension The accessibility of a dataset or a statistical product can be evaluated by asking specific questions on the topics listed below:
Content topic How this can be assessed Accessibility to the public To what is extent is the data publically available?
What access restrictions exist? What data mixes are available? Can regional Aboriginal and Torres Strait Islander peoples be obtained by request? Can individual earnings be obtained rather than the current groupings? Are other groupings of data items available? Is it possible to get regional data at a lower level than SLA? How long do data requests take? Who is the contact for data requests? Is the attainment of mean/averages data possible at finer levels to alleviate possible disclosure issues? What levels are seasonally adjusted and trend estimates available at? What are the contact details for further information?
The data products available
What format are data available in (e.g. spreadsheets, data cubes, Confidentialised Unit Record Files (CURFs), Remote Access Data Laboratories (RADL)? Is there a link available to the data item list?
But why is it important? Without access to the data, it is unable to be used. Not all available data is able to be accessed by all users. Some datasets have strict access conditions, while others have a high cost (or other barriers) which can act practically the same as an access condition. Users need to understand the limitations to accessing data in order to make an assessment upon whether or not the data products will be in the correct format, and at a reasonable price. The ABS provides access to its publications available on its website for no charge. Below is an example of the Government initiative which led to this change in accessibility:
7. Accessibility

ABS DATA QUALITY MANUAL Part A – Understanding and Applying the ABS Data Quality Framework
ABS DATA QUALITY MANUAL Part A – Understanding and Applying the ABS Data Quality Framework 20
Case Study – Review of cost barriers to data In 2005, the Australian Government reviewed its pricing policy based on the principles of fair access to Government services9. The cost recovery guidelines were reviewed in order to “heighten the transparency, consistency and accountability of cost recovery to Government agencies”. Taxpayers were paying for these services with their tax dollars, so it was unreasonable that users would have to pay again. The ABS had to comprehensively review their pricing policy to ensure that it adhered to the new standards. In response to community expectations, the ABS sought and obtained additional funding for free access to ABS publications on its website. This meant that the Australian public now had easy and free access to statistical products and was considered a centenary tribute to the people of Australia.
Accessibility and your quality declaration The format in which the data is accessed should be clearly outlined in your quality declaration to ensure that it is suitable for the user needs. The ABS Privacy Policy, and any other relevant policies or legislation, should be referenced to ensure users understand the restrictions on accessing ABS data. For example:
8731.0 – Building Approvals, Australia, Dec 2015 Building approvals data is administrative by-product data that is available to the general public. However, the data is collected under authority of the Census and Statistics Act, and data published or made available can relate to individual building jobs approved. Information relating to individual approvals can be released under clause 2 (2) (d) of the Statistics Determination 1983. Data cubes containing small area information are available from the ABS website. The data cubes are available at the Statistical Local Area level under the ASGC for financial years from 2001-02 to 2011-12. Data cubes at the Statistical Area 2 level of the ASGS are available for financial years from 2011-12 onwards. If the information you require is not available as a standard product or service, then ABS Consultancy Services can help you with customised services to suit your needs. Inquiries should be made to the National Information and Referral Service on 1300 135 070. The ABS Privacy Policy outlines how the ABS will handle any personal information that you provide to us.
9 UNECE Information paper ‘Informing the Nation – Open access to statistical information in Australia, 2009 http://www.unece.org/fileadmin/DAM/stats/documents/ece/ces/ge.45/2009/wp.11.e.pdf

ABS DATA QUALITY MANUAL Part A – Understanding and Applying the ABS Data Quality Framework
ABS DATA QUALITY MANUAL Part A – Understanding and Applying the ABS Data Quality Framework 21
DOCUMENT CONTROL
Version: 1.0 – Jessica O’Rourke (01 April 2016)
Approved by: Phillip Wise, Statistical Risk and Quality Assurance