Schools Reconciliation Challenge Art Exhibition Catalogue 2013

Report
A Tale of Eight Regions: Part 2: Challenge and Support
Across the Regional Schools
Commissioner Areas
National Foundation for Educational Research (NFER)

A Tale of Eight Regions Part 2: Challenge and Support Across the Regional Schools Commissioner Areas
Jude Hillary
Susan Bamford
Daniele Bernardinelli Geoff Gee
Published in May 2017 By the National Foundation for Educational Research, The Mere, Upton Park, Slough, Berkshire SL1 2DQ www.nfer.ac.uk
© 2017 National Foundation for Educational Research Registered Charity No. 313392 ISBN: 978-1-911039-40-2 How to cite this publication: Hillary, J., Bamford, S., Bernardinelli, D. and Gee, G. (2017). A Tale of Eight Regions. Part 2: Challenge and Support Across the Regional Schools Commissioner Areas. Slough: NFER.
.

Contents
About this report 1
1 At a glance 2
2 Policy update 3
3 Underperforming schools across RSC regions 5
4 Potential capacity in the system 11
5 Region profiles 15
6 References 24
Appendix A: Changes since ‘A Guide to Regional Schools Commissioners’ (2015 report) 25
Appendix B: Definitions of underperforming schools, and changes over time 27
Appendix C: Methodology 31

A Tale of Eight Regions: Part 2: Challenge and Support Across the Regional Schools Commissioner Areas 1
About this report
Regional Schools Commissioners (RSCs) were appointed in
September 2014 to oversee the growing number of academies in
England. In 2015, NFER published A Guide to Regional Schools
Commissioners (Durbin et al., 2015), which explained the background
to RSCs and presented an analysis of the characteristics and
challenges faced in each of the eight RSC regions.
We have returned to RSCs now that they have been in operation for
more than two years to provide an update of the characteristics of the
areas they are responsible for and the challenges they face. We have
produced some new analyses of underperforming schools in these
areas, and analysed the structures in which academies are organised
and managed across the regions.
We have published this analysis across two reports. The first (Hillary
et al., 2016) focused on how the schools’ landscape has changed, by
region, since RSCs were introduced. We examined this in terms of
the number and percentage of academies and free schools in each
region. The report provided:
an overview of academies and free schools
the organisational structures in which they operate in England
an analysis of changes over the previous 12 months
a comparative analysis of the differences across the school
landscape in RSC areas
eight individual ‘region profiles’.
In this, our second report, we use the latest performance data to
explore the future challenges RSCs face in terms of schools in their
regions requiring action and the availability of new sponsors to meet
this need.

A Tale of Eight Regions: Part 2: Challenge and Support Across the Regional Schools Commissioner Areas 2
1 At a glance
Regional Schools Commissioners (RSCs) took up post for the first
time in September 2014 and are now firmly embedded within the
fabric of the English education system. This report, the second of two
published in late 2016/early 2017, builds on our inaugural September
2015 publication on RSCs. This part provides an updated in-depth
analysis of underperforming schools and capacity (based on
performance rather than finance) within the system to support them.
As in the earlier reports, this is presented as a comparative
‘overview’, followed by eight individual ‘region profiles’.
Underperformance varies by phase and school type
According to our definition of underperformance (see Appendix B),
about 17 per cent of LA maintained schools and academies in
England were underperforming as at September 2016. However,
within this figure there is a marked disparity between phases, with
one in four secondary schools underperforming compared to one in
seven in the primary sector. There are differences between phases
for all school types apart from converter academies which were
similar.
Some RSCs have greater challenges than others
There is considerable variation between RSC regions in the number
of schools with poor Ofsted outcomes, schools below the floor, and
coasting schools. Two regions have in excess of 500 schools needing
attention, while another has about half the amount. These two regions
also have the largest number of schools with very serious
underperformance issues. These disparities in workload could affect
the RSCs’ ability to tackle underperformance as effectively as is
needed. Published performance metrics that highlight both the scale
of challenge and the RSCs’ responses to this would improve
transparency and enable better external scrutiny.
The number of underperforming schools has fallen
The numbers of schools with poor Ofsted outcomes and/or falling
below the floor have decreased since 2014 when RSCs first took up
office. However, we cannot say whether this is genuinely a real
improvement related to the actions of the RSCs or something else. It
could be a consequence of other factors such as the introduction of
the new Ofsted inspection framework in September 2015 or the new
attainment measures that were introduced in 2016.
Finding new sponsors remains crucial
Available capacity in Multi-Academy Trusts (MATs) exceeds the
demand for new sponsors needed to take on the most serious
underperforming schools nationally, but there are stark regional
differences. Lancashire and West Yorkshire faces an overall shortfall
in available sponsors, but other RSCs may also have local shortfalls
when matching need to available capacity. A key priority for these
RSCs will be to identify and attract new sponsors.
Underperforming trusts will be a growing challenge
As academy numbers have increased, so have the numbers that are
underperforming. Single Academy Trusts (SATs) make up ten per
cent of the most serious underperforming group. Academies which
have been in the same MAT for over three years account for nearly a
further 20 per cent. RSCs will need to be seen to be addressing
underperformance in SATs and academies in MATs as proactively as
they do for LA controlled schools to maintain public credibility.

A Tale of Eight Regions: Part 2: Challenge and Support Across the Regional Schools Commissioner Areas 3
2 Policy update
The role of RSCs continues to evolve. Whilst our two previous reports
in this series set out the statutory framework that defined the roles
and responsibilities of RSCs, further key policies have been
introduced in December 2016 and January 2017 that have
implications for the work of the RSCs.
Opportunity areas
The designation of 12 Opportunity Areas (OAs) (DfE 2017a) is a
major new initiative to target resources at schools in areas with poor
social mobility. The criteria used to identify OAs (GB. Parliament.
HoC, 2016) and activities planned to address local issues mean they
will mostly complement rather than draw on RSC resources. However,
most RSC regions contain at least one OA so there is potential for
overlap between OA activities and the oversight of the RSCs.
Funding and sources of school improvement
The Government made announcements at the end of 2016 about the
funding of school improvement (DfE 2016a). This confirmed £50
million a year to fund a continuing role for local authorities (LAs) to
‘monitor and commission’ school improvement, at least for the period
2017 to 2020. The level of funding was challenged by the Local
Government Association (LGA, 2016) that claimed it represented a
substantial cut. Alongside this will be £140 million for a new ‘Strategic
School Improvement Fund’ for academies and maintained schools.
This is targeted at schools in most need to help them drive up
standards, use their resources most effectively and deliver more good
school places. Schools will be able to apply to the fund either alone,
or as a group of schools, with the encouragement and support of a
teaching school/National Leaders of Education (NLE), their LA or
RSC.
RSCs have a role in determining the type of support or intervention
needed in both academies and maintained schools, and also have
some funds to commission such support. RSCs have a range of
options available and need to maintain information about the capacity
that could be used to address the needs of schools in their areas.
This could include capacity within LAs as well as the availability of
NLEs and the capacity of MATs. RSCs will also have a £13 million
regional academy growth fund (RAGF) to support successful
academy trusts to grow and to improve standards in underperforming
schools. They will prioritise applications that meet the specific needs
in their region and of OAs where applicable.
National Funding Formula
The consultation on the National Funding Formula set out proposals
for the continuing role of LAs, describing how they will operate
alongside the RSCs in the landscape of the ‘middle tier’ for the period
2017 to 2020 (DfE 2017b). It highlighted that an effective budgeting
process within schools should be based on their improvement plan.
This confirms the continuing role of the LA in oversight, intervention
and support of schools, working alongside the RSCs.
Decision-making framework for RSCs
In December 2016, the Department for Education (DfE) published a
decision-making framework for RSCs (DfE 2016b). This report sets
out RSC core functions and the circumstances under which they
might intervene/act, which is summarised in the table overleaf.
A Tale of Eight Regions: Part 2: Challenge and Support Across the Regional Schools Commissioner Areas 4
RSC CORE FUNCTION WHAT ACTIONS/STEPS AN RSC MIGHT TAKE
1. Intervening in underperforming academies and free schools
Tackling educational underperformance in
academies and free schools
- Commission appropriate support; issue a pre-warning or warning notice; terminate an academy’s funding
agreement; identify a new sponsor to take over an underperforming academy.
Intervening in academies where
governance is inadequate
- Ensure discussions are held with the Education Funding Agency and others to ensure that all issues about the trust
are considered and appropriate action is taken.
Taking action against poorly performing
sponsors and multi-academy trusts
- Reassess MATs at key milestones through the academic year and at key stages of their growth to consider their
capacity to support and enable academies in the MAT to improve.
2. Addressing performance concerns in LA maintained schools
Tackling underperformance in maintained
schools
- Any maintained schools judged to be inadequate by Ofsted are required to become a sponsored academy. The
RSC will need to find a suitable sponsor and issue the Academy Order.
- Work with LAs to identify additional support needed for underperforming maintained schools.
- Consider issuing a warning notice, depending on the severity of the case, to a maintained school.
3. Approving conversions of new academies
Applications from maintained schools to
convert to academy status
- Approve or decline applications from maintained schools to convert to academy status.
- Judge whether a school is ‘performing well’ and can convert as a SAT or as part of a MAT.
- Find a suitable sponsor for schools that do not meet the ‘performing well’ criteria.
4. Approving new sponsors and the creation of multi-academy trusts
Applications from sponsors to operate in a
region or regions
- RSCs need to encourage suitable organisations in their area to apply to become sponsors.
- RSCs also decide who can be a sponsor in their region.
Taking decisions on the creation and
growth of multi-academy trusts
- RSCs need to be assured that the governance and leadership in a MAT is clear and robust and has the ability to
drive improvement in all of its schools before allowing further expansion.
5. Ensuring that the pipeline of outstanding free school proposers is secure and capable of delivering great new schools
Advising on free school applications and
proposals under LA free school
presumption arrangements
- RSCs advise ministers on free school applications and will make recommendations about which applications to
reject or approve.
6. Taking decisions on changes to academies and free schools
Significant changes to academies and free
schools
- RSCs decide on applications from an academy or free school to make material changes (which in general may
have an impact on the number, type and/or location of school places).
Other - RSCs decide on changes to admission arrangements and exemptions from providing Christian collective worship
Source: DfE, 2016c

A Tale of Eight Regions: Part 2: Challenge and Support Across the Regional Schools Commissioner Areas 5
3 Underperforming schools
across RSC regions
Introduction
In our first report in 2015, we examined differences in the level of
challenge across RSC regions due to underperforming schools.
Here we present updated estimates. However, the role of RSCs has
continued to evolve since our first report. During this time, DfE has
published more information to clarify RSC roles and responsibilities.
This includes a more nuanced explanation about how RSCs should
work with other organisations (e.g. LAs) to tackle underperforming
schools and when they can intervene in academies.
Changes since our 2015 report
Our research has also evolved since our first report to try to reflect
our latest understanding of the role and responsibilities of RSCs.
The main differences between this and our first report are
summarised in the box below. The effect of these changes in
approach is explained in Appendix A.
Main changes since our 2015 report
We have extended the scope of our definition of an
underperforming school. In our 2015 report, schools falling
below the floor or ‘coasting’ were classed as underperforming,
whereas in this report, we have also included schools rated by
Ofsted as inadequate or requiring improvement (RI).
We have split underperforming schools into two groups to
reflect the fact that some types of underperformance will be of
greater concern to RSCs. The ’immediate need’ group includes
schools where underperformance is deemed very serious, where
the RSC is likely to need to intervene in the near future. The
'watch list' group includes all other underperforming schools.
RSCs will want to monitor these schools to ensure they are
receiving the appropriate support to improve, but they do not
currently require direct, rapid intervention.
We have changed the way we assess whether there is
sufficient capacity to help underperforming schools. In our
2015 report, we compared the capacity available in MATs to total
need (i.e. all schools below the floor and coasting). However,
now that we can distinguish between types of underperformance,
we have compared available capacity within MATs that appear
ready to expand to the number of ‘immediate need’ schools.
These new definitions are designed to better align with the types of
school underperformance covered in the Schools Causing Concern
guidance (DfE 2016c).
Definitional differences
In both this and our previous report, we have included a wider set of
schools in our definition of schools below the floor and coasting
schools compared to those used by DfE. This is because we are
looking at underperformance from the perspective of the level of
challenge that this places on RSCs, whereas DfE uses these
measures as part of their accountability system. The box below
summarises the main differences.

A Tale of Eight Regions: Part 2: Challenge and Support Across the Regional Schools Commissioner Areas 6
Definitions for schools that are below the floor and/or coasting
We do not use the same exclusion criteria that DfE uses when
calculating the numbers of schools meeting the floor and coasting
standards. The differences are:
DfE excludes all schools that close and reopen as a sponsor-led
academy during the reference period. They are not subject to the
floor standard until they have been open for at least one full
academic year or judged as coasting for three successive years.
We include these schools in our definitions as we believe that
RSCs will want to monitor these new academies to be assured
they are improving.
In DfE’s measures, schools are not subject to the floor and
coasting standards if they have fewer than 11 pupils in their key
stage 2/4 cohorts during the reference period. This is because
these schools are more susceptible to year-on-year fluctuations
in the ability of their cohorts. However, we retain them within our
definition as a number have fallen below the floor standard in
multiple years. RSCs should therefore be aware of these
schools and be monitoring their performance.
DfE includes a small number of further education colleges that
take pupils at age 14 in their definition. These are not included in
our estimates.
As a result of these differences, we have 821 schools below the
floor at Key Stage 2 compared to DfE’s figure of 665 (for Key Stage
4, the figures are 280 and 282 respectively). We have 620 schools
which are coasting at Key Stage 2 compared to DfE’s figure of 477
(Key Stage 4 figures are 376 and 319 respectively).
Analysis by phase, school type and region
The diagram below shows the total number of English state schools
that are underperforming. This illustrates that some schools fall into
more than one category for underperformance.
Figure 3.1 Analysis of reasons for underperformance
* Schools judged as being inadequate or requiring improvement
Underperformance varies by phase and school
type
We start by examining the proportion of underperforming schools in
2016 by phase of education and by type of school. The following
table shows there is a disparity between phases, with one in four
secondary schools underperforming compared to about one in
seven in the primary sector.

A Tale of Eight Regions: Part 2: Challenge and Support Across the Regional Schools Commissioner Areas 7
Table 3.1 Underperforming schools by phase* and type
School Type
Primary
%
Secondary
%
LA maintained 14 31
Converter academies 15 16
Sponsor-led academies 28 43
Free Schools (incl. UTCs and Studios) 7 26
All schools % 15 27
Number* 2503 904
* All-through schools, as well as middle deemed secondary schools, are included
in the secondary schools category, although they might be classified as
underperforming based on their KS2 results.
Breaking this down further by type of school reveals some other
interesting patterns.
The proportion of schools that are underperforming in the
secondary sector is markedly higher than in the primary sector
for all school types apart from converter academies where the
levels are similar.
The proportion of underperforming LA maintained schools in the
primary sector is broadly in line with that of converter academies
but half that of sponsored academies.
The proportion of underperforming LA maintained secondary
schools is double the primary sector level.
We have explored the reasons for the differences between primary
and secondary phases. For all school types apart from converter
academies (where there is no difference between phases), the
higher incidence of underperformance is driven by differences in
Ofsted judgements and in the proportion of schools below the floor.
Of particular note, one in 11 LA primary schools are judged as
inadequate or requiring improvement compared to one in four LA
secondary schools.
The challenge of tackling underperforming
schools varies by RSC region
When looking at underperforming schools by region, it is important
to note that there is a large variation in the number of schools in an
RSC region. With 1709 schools, the North of England has the
fewest schools among RSC regions, while its neighbour,
Lancashire and West Yorkshire, has the most with 3156 schools. In
the figures below, we have deliberately presented absolute
numbers of schools requiring action rather than percentages as
absolute numbers provide the greatest insight into an RSC’s
workload.
Primary phase
There is considerable variation between RSC regions in the primary
sector with the total number of underperforming schools ranging
from 183 in the North of England to 398 in the East Midlands and
the Humber. While it is not solely the RSC’s responsibility to lead in
tackling all underperforming schools in their region, they will
nonetheless want to monitor them to ensure that lead organisations
(e.g. LAs) have actions in place to help the schools improve. As
shown in Figure 3.2, given this variation in underperforming schools

A Tale of Eight Regions: Part 2: Challenge and Support Across the Regional Schools Commissioner Areas 8
between regions, this suggests that some RSCs will have a greater
workload than others.
Figure 3.2 Primary schools requiring action
Secondary phase
The picture is more mixed across school types in the secondary
sector, which reflects the higher level of academisation (two-thirds
of secondary schools were academies in September 2016
compared to just over a fifth in the primary sector). As shown in
Figure 3.3, the absolute numbers vary across region from 70 in the
East of England and North-East London to 185 in Lancashire and
West Yorkshire, revealing that one RSC has nearly three times the
workload when tackling underperforming secondary schools. In
percentage terms, both the East Midlands and the Humber and the
North of England have similar levels of underperforming secondary
schools to Lancashire and West Yorkshire (around 35 per cent).
Figure 3.3 Secondary schools requiring action
Figure 3.3 also shows a breakdown by school type. Of particular
note is the number of free schools requiring help by region, which is
perhaps larger than might be expected. This is because this
category includes University Technical Colleges (UTCs) and Studio
Schools. Of the 217 secondary free schools including UTCs and
Studio Schools, 26 per cent are underperforming. However, this
varies markedly by school type within this group, with only 16 per
cent of Free Schools underperforming, compared to 35 per cent for
UTCs and 50 per cent for Studio Schools. The main reason for
these schools requiring support is because they have fallen below
the floor standard.
0 50 100 150 200 250 300 350 400 450
North of England
Lancashire and West Yorkshire
East Midlands and the Humber
West Midlands
East of England and North-East London
South-Central England and North-West London
South-East England and South London
South-West England
Maintained Sponsored Academies Converter Academies Free Schools
0 50 100 150 200
North of England
Lancashire and West Yorkshire
East Midlands and the Humber
West Midlands
East of England and North-East London
South-Central England and North-West London
South-East England and South London
South-West England
Maintained Sponsored Academies Converter Academies Free Schools

A Tale of Eight Regions: Part 2: Challenge and Support Across the Regional Schools Commissioner Areas 9
The number of schools which are below the floor
and/or with a poor Ofsted outcome has fallen
since 2014.
We have explored how the numbers of schools below the floor and
schools judged by Ofsted as inadequate or requiring improvement
have changed since RSCs first took up post. It is not possible to do
this for coasting schools as these were only formally introduced in
2016.
Figure 3.4 Changes since 2014 by underperformance category
The largest category of underperformance is schools judged by
Ofsted as being inadequate or requiring improvement. The
proportion of schools with a poor Ofsted outcome has decreased by
eight percentage points in both the primary and secondary sectors
since 2014. All RSC regions saw a drop, but the three regions with
the largest proportion of schools with poor Ofsted outcomes in 2014
(East of England and North-East London, South-East England and
South London, and East Midlands and the Humber) saw the largest
reductions by 2016.
There are also fewer schools below our measure of the floor
standard in both the primary and secondary phases compared to
2014. The proportion of schools below the floor at Key Stage 2 fell
by nearly one percentage point to 5.6 per cent while the proportion
at Key Stage 4 decreased by 2.4 percentage points to 9.4 per cent.
Most RSC regions saw a reduction over the same time period, with
the notable exceptions of the North of England and South-Central
England and North-West London.
Although there have been reductions in underperforming school
numbers since 2014, the data does not shed light on why these
changes have occurred. It is not known whether these have
resulted from the actions of RSCs or is a consequence of the
introduction of the new Ofsted inspection framework in September
2015, the new attainment measures that were introduced in 2016,
or other factors driving improvement. Caution is needed in drawing
conclusions from the data.
See Appendix B for further analysis of the different categories of
underperformance, and how they have changed over time.
The number of schools in immediate need varies
by region
There are a range of reasons why schools may be classified as
underperforming, some of which are more serious than others. For
example, DfE’s Schools Causing Concern guidance (DfE 2016c),
places a firm requirement on RSCs to issue an Academy Order to
any LA maintained school judged by Ofsted as being inadequate, to
0% 5% 10% 15% 20% 25%
Below floor standards - Key Stage 4
Below floor standards - Key Stage 2
Ofsted Requires Improvement - Secondary
Ofsted Requires Improvement - Primary
Ofsted Inadequate - Secondary
Ofsted Inadequate - Primary
Percentage of schools in 2014 Percentage of schools in 2016

A Tale of Eight Regions: Part 2: Challenge and Support Across the Regional Schools Commissioner Areas 10
turn them into a sponsor-led academy as soon as a sponsor can be
found. Conversely, this guidance describes a softer, less rigid
approach that enables RSCs to use judgement in terms of deciding
what support to give coasting schools to help them improve.
Schools in immediate need
We have defined our ‘immediate need’ category as:
schools judged by Ofsted to be inadequate
schools that are below the floor in 2016, which were also below
the floor in at least one of the prior two years
schools judged by Ofsted as requiring improvement which are
also below the floor in the current year.
The immediate need group includes some academies that are
already in a MAT. Where an academy has been in the same MAT
for less than three years, we have assumed an intervention has
already taken place, so an RSC will wait to see whether a school
starts to improve. However, academies that have been in the same
MAT for more than three years, which are still causing concern, are
included in this immediate need group as the RSC may be s
strongly thinking about re-brokering their sponsorship
arrangements.
To reflect this, we have split our analysis into two groups. The first
group comprises schools where the underperformance is deemed
very serious, and where the RSC is likely to make some kind of
immediate and critical intervention. The second category, which we
label as our 'watch list group' includes all other underperforming
schools. RSCs will need to monitor these schools and ensure they
receive the appropriate support to improve as they may need firmer
interventions in future if improvements are not made.
There are 573 underperforming schools in immediate need. Most of
these (406) are LA maintained schools, while 58 are SATs and 109
are academies which have been in the same MAT for at least three
years. Of the 3407 underperforming schools in 2016, the remaining
2834 are in the watch list group.
Figure 3.5 Number of underperforming schools in immediate need
There are clear differences between RSC regions in the number of
schools with serious underperformance issues. Lancashire and
West Yorkshire has the most with 109 such schools, which is more
than double the lowest RSC region, South-East England and South
London, which only has 50.
0 20 40 60 80 100 120
North of England
Lancashire and West Yorkshire
East Midlands and the Humber
West Midlands
East of England and North-East London
South-Central England and North-West London
South-East England and South London
South-West England
LA maintained SATs Academies in MATs for 3+ years
A Tale of Eight Regions: Part 2: Challenge and Support Across the Regional Schools Commissioner Areas 11
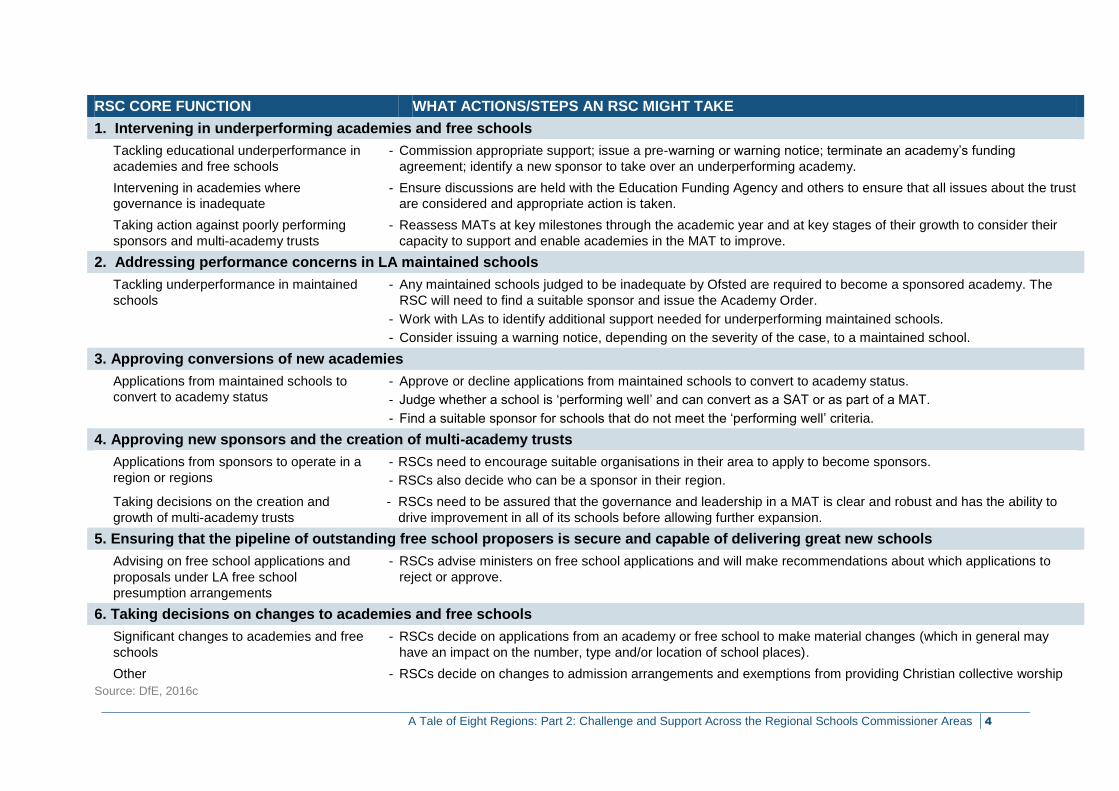
4 Potential capacity in the
system
We have discussed the number of schools needing help and now
we turn our attention to explore the potential capacity in the system
to help these schools.
A core RSC function is to tackle underperformance in LA
maintained schools and in academies/free schools. One of the key
actions an RSC can take in the most serious cases is to transition
an underperforming LA maintained school into an academy and
place it in a high-performing MAT, or to re-broker the sponsorship
for an underperforming academy. Both rely on RSCs having access
to a pool of suitable MATs that are willing and ready to take on the
additional responsibility of providing support to one or more
underperforming schools.
Identifying MATs that are ready for expansion
One of the key considerations for RSCs is when a MAT is ready for
expansion. To improve the RSCs’ management of MATs,
particularly their expansion, the National Schools Commissioner, Sir
David Carter, developed a four-tier trust system, which classifies
MATs as follows:
(a) Starter trusts: MATs with up to five academies all in the same
region
(b) Established trusts: MATs with between six and 15 academies
in the same region
(c) Regional trusts: MATs with between 16 and 30 academies,
which operate across regions
(d) System trusts: MATs with over 30 academies which may be
located across the country.
As part of deciding whether a MAT is ready to expand from one
category to another, there are a range of factors that RSCs will take
into account. Among other things, this will include the MAT’s size,
the ratio of good to underperforming schools within the MAT,
whether a MAT has achieved successful improvements for lower-
performing schools that they previously took on, governance
arrangements, budget and quality of leadership.
Our methodology
It is not possible to measure all of these factors from the available
quantitative data. The method we have used to estimate which MAT
trusts are ready to expand is set out below.
Identify the number of positive-performing schools within a MAT.
These are schools above the floor, not coasting, and judged as
good or outstanding by Ofsted.
Identify the number of underperforming schools in a MAT (see
Section 3).
Calculate the ratio of positive to underperforming schools and
classify a MAT as ready to expand if this ratio is at least 2:1,
with the exception of smaller MATs where the actual ratio is 2:1,
4:2 or 6:3, for which taking on additional underperforming
schools could stretch the MAT too much.
See the methodology section in Appendix C for more details.

A Tale of Eight Regions: Part 2: Challenge and Support Across the Regional Schools Commissioner Areas 12
Using this methodology, we estimate that 60 per cent of MATs are
ready to expand. However, the picture varies by type of trust, with
smaller MATs being much more likely to be ready to expand than
the largest ones, which may be a consequence of the latter rapidly
expanding in recent years.
Table 4.1 Analysis of trusts which are ready to expand
Academy Grouping Number of
trusts
Number of trusts that are
ready to expand
Percentage of trusts that are
ready to expand
Multi-Academy Trusts
Starter MAT 853 514 60
Established MAT 150 86 57
Regional MAT 17 10 59
System MAT 11 4 36
Total MATs 1031 614 60
We have also estimated the additional capacity that MATs which
are ready to expand could provide. If all of these trusts expanded to
their maximum potential size, they would have capacity to take on
915 underperforming schools.
Accessible capacity exceeds immediate need
nationally but there are regional differences
We now compare the potential available capacity in the system to
the level of immediate demand for new sponsors across regions.
Table 4.2 Potential additional capacity versus immediate need for new sponsors
RSC Area Accessible additional
capacity
Immediate need for
new sponsors
Whether have
sufficient capacity
Ratio of accessible capacity to immediate
need1
North of England 63 59 Capacity 1.1 to 1
Lancashire and West Yorkshire
75 109 Need 0.7 to 1
East Midlands and the Humber
125 89 Capacity 1.4 to 1
West Midlands 126 84 Capacity 1.5 to 1
East of England and North-East London
102 57 Capacity 1.8 to 1
South-Central England and North-West London
108 71 Capacity 1.5 to 1
South-East England and South London
165 50 Capacity 3.3 to 1
South-West England 151 54 Capacity 2.8 to 1
England 915 573 Capacity 1.6 to 1
When looking at available capacity and comparing it to immediate
need for new sponsors, we see that across England supply
1 This assumes that any MAT with available capacity could take on any
school with an immediate need. However, in practice, some MATs may only have schools in one phase and may not be willing to take on an underperforming school from a different phase. Therefore the level of challenge may actually be greater that these ratios of available capacity to immediate need suggest.

A Tale of Eight Regions: Part 2: Challenge and Support Across the Regional Schools Commissioner Areas 13
exceeds demand by a ratio of 1.6 to 1. However, the national
picture disguises differences between RSC regions. The two most
southern regions appear to be in a very healthy situation with at
least 2.8 slots of available capacity for each school in immediate
need. However, there is insufficient available capacity in Lancashire
and West Yorkshire to meet the immediate need for new sponsors
to take on the most serious underperforming schools. Also,
available capacity in the North of England is lower than the national
average. This low level of available capacity in the northern RSCs is
likely to be due to differences in the level of academisation between
regions, which our earlier report identified (Hillary et al., 2016).
Growing available sponsor capacity will be a key
priority for most RSCs
Although Table 4.2 shows that almost all RSCs regions have more
available capacity compared to immediate need, it is likely that
many of the RSCs will nonetheless have difficulties matching
suitable sponsors to need. RSC regions cover large areas of the
country and it is possible that the capacity and need could be at
opposite ends of the region. In addition, some MATs might be
unwilling to take on an underperforming school, perhaps because
they only have schools in one phase but the underperforming
school in need of support is in the other phase. It is therefore likely
that a key priority for many of the RSCs will be to identify new
sponsors.
One potential source of help that RSCs may look towards to expand
their sponsor capacity are high-performing SATs in their regions.
Many of these are converter academies that deliberately chose to
become a SAT, so may not be willing to convert to a MAT and take
on additional responsibilities for underperforming schools. However,
SATs exist in large numbers in most RSC regions, are mostly high
performing and have a track record of operating successfully as an
academy, so they should be an attractive option for RSCs who
need to expand their sponsor capacity.
High-performing SATs
We define a high-performing SAT as one which meets at least one
of the following criteria:
judged as outstanding by Ofsted
being in the top quartile for attainment and having a progress
score which is greater than 0 for all subjects at KS2
being in the top quartile for attainment 8 and above median
progress 8 score or top quartile progress 8 score and above
median attainment 8 at KS4.
Figure 4.1 Number of high-performing SATs by region
0 50 100 150 200 250 300
North of England
Lancashire and West Yorkshire
East Midlands and the Humber
West Midlands
East of England and North-East London
South-Central England and North-West London
South-East England and South London
South-West England

A Tale of Eight Regions: Part 2: Challenge and Support Across the Regional Schools Commissioner Areas 14
Our analysis shows there are 1330 high-performing SATs. There
are clear variations in the number by RSC region, with the North of
England and Lancashire and West Yorkshire having the lowest
number of high-performing SATs of all RSCs. Despite this, these
regions have a large number of high-performing SATs relative to
the available capacity from MATs which are ready to expand. It
would therefore certainly ease available sponsor pressures if the
RSCs could successfully persuade some of these SATs to become
a MAT and take on responsibility for an underperforming school.
A growing part of the challenge for RSCs will be
tackling underperformance in trusts
Figure 4.2 Percentage of immediate need group that are SATs and academies in MATs for 3+ years
A large part of the challenge for RSCs will be working with local
authorities to tackle underperforming LA maintained schools.
However, as the proportion of schools that are academies has
increased, so have the number of underperforming academies, and
tackling these will become an increasing part of the RSCs’ role.
Already, this is quite significant, with ten per cent of schools in most
immediate need of help being SATs and nearly a fifth being
academies which have been in the same MAT for over three years.
The picture varies significantly by RSC region with nearly a half of
the immediate need group in South-Central England and North-
West London comprising SATs and academies in MATs. This
compares to East of England and North-East London where the
rate is just over a fifth. RSCs will need to demonstrate that they are
taking steps to address underperformance in SATs and academies
in MATs as proactively as they do for LA maintained schools to
maintain public confidence in the academisation programme.
0% 10% 20% 30% 40%
North of England
Lancashire and West Yorkshire
East Midlands and the Humber
West Midlands
East of England and North-East London
South-Central England and North-West London
South-East England and South London
South-West England
SATs Academies in same MAT for 3+ years

A Tale of Eight Regions: Part 2: Challenge and Support Across the Regional Schools Commissioner Areas 15
5 Region profiles
North of England 16 Lancashire and West Yorkshire 17 East Midlands and the Humber 18 West Midlands 19 East of England and North-East London 20 South-Central England and North-West London 21 South-East England and South London 22 South West England 23

A Tale of Eight Regions: Part 2: Challenge and Support Across the Regional Schools Commissioner Areas 16
North of England 1709 schools 422,833 pupils 12% of primaries academised 52% of secondaries academised
The North of England has a relatively high number of underperforming schools. The available capacity to need ratio in the region is amongst the lowest of all RSC regions, and finding new sponsors could be a challenge.
1. The North of England has 275 underperforming
schools, the lowest number of all RSC regions,
albeit that this region has the smallest number of
schools.
2. There are low to average proportions of schools in
each category of underperformance (poor Ofsted
outcomes, coasting schools and below the floor) in
the primary sector, but higher proportions amongst
secondary schools.
3. The region has 59 underperforming schools
identified as having an immediate need, which the
RSC may soon need to find new sponsors for.
4. There are 49 MATs that are ready for expansion
with capacity to take on 63 underperforming
schools. The ratio of available capacity to
immediate need is the second lowest at 1.1 to 1.
The North of England has 92 secondary schools that are underperforming, which is a third of its total stock.
However, the region has the lowest number and proportion of underperforming primary schools of any RSC region.
The region contains the LA with the highest proportion of immediate need schools, but also has three LAs with no immediate need schools.
The region has low available capacity and relatively few high-performing SATs that the RSC might approach to find new trusts to help.
Key facts:
16.1% of schools are
underperforming
Key facts:
3.5% Schools need immediate help
187 Trusts operating
in the region
49 MATs have
available capacity
NFER Regional Schools Commissioner Area Profile

A Tale of Eight Regions: Part 2: Challenge and Support Across the Regional Schools Commissioner Areas 17
Lancashire and West Yorkshire
3156 schools 1,030,862 pupils 12% of primaries academised 54% of secondaries academised
Lancashire and West Yorkshire faces major challenges in terms of underperforming school numbers and having insufficient levels of available capacity to meet its needs.
1. Lancashire and West Yorkshire has 521
underperforming schools, the second largest of
all regions, although it has the most schools.
2. There are low to average proportions of schools
in each underperformance category (poor
Ofsted, schools coasting and below the floor) in
the primary sector, but the highest in the
secondary sector.
3. The region has 109 underperforming schools
identified as having an immediate need, by far
the largest of all RSC regions.
4. There are 56 MATs that are ready for expansion
with capacity to take on 75 underperforming
schools. There is insufficient available capacity
to meet the immediate need (ratio 0.7 to 1).
Lancashire and West Yorkshire has the highest number and highest proportion of underperforming secondary schools.
However, the region has slightly more than the average number of underperforming primary schools.
Lancashire and West Yorkshire contains three of the top ten LAs with the highest proportion of schools with an immediate need.
The region has very low available capacity, but there are 141 high-performing SATs that the RSC might approach to find new trusts to help.
Key facts:
16.5% of schools are
underperforming
Key facts:
3.5% Schools need
immediate help
304 Trusts operating
in the region
56 MATs have
available capacity
NFER Regional Schools Commissioner Area Profile

A Tale of Eight Regions: Part 2: Challenge and Support Across the Regional Schools Commissioner Areas 18
East Midlands and the Humber
2517 schools 749,837 pupils 27% of primaries academised 74% of secondaries academised
East Midlands and the Humber faces challenges in terms of number of underperforming schools and comparatively low levels of available capacity.
1. East Midlands and the Humber, with 534 LA
maintained schools and academies requiring
attention, has the highest number of
underperforming schools of all RSC regions.
2. The region also has amongst the highest proportion
of underperforming schools across each category
(poor Ofsted, coasting schools and schools below
the floor) in both phases.
3. There are 89 underperforming schools in the region
identified as having an immediate need, which the
RSC may need to find new sponsors for in the near
future, which is the second highest.
4. There are 83 MATs that are ready for expansion
with capacity to take on 125 underperforming
schools. The ratio of available capacity to immediate
need in the region is 1.4 to 1.
East Midlands and the Humber, with 136 underperforming secondary schools, has the second highest number amongst RSC regions.
The region has 398 underperforming primary schools, the highest number of all RSC areas.
East Midlands and the Humber contains four of the top ten LAs with the highest proportion of schools with an immediate need.
In addition to the 125 spaces available in the region, there are 160 high-performing SATs that the RSC might approach to find extra capacity.
Key facts:
21.2% of schools are
underperforming
Key facts:
3.5% Schools need immediate help
414 Trusts operating
in the region
83 MATs have
available capacity
NFER Regional Schools Commissioner Area Profile
A Tale of Eight Regions: Part 2: Challenge and Support Across the Regional Schools Commissioner Areas 19
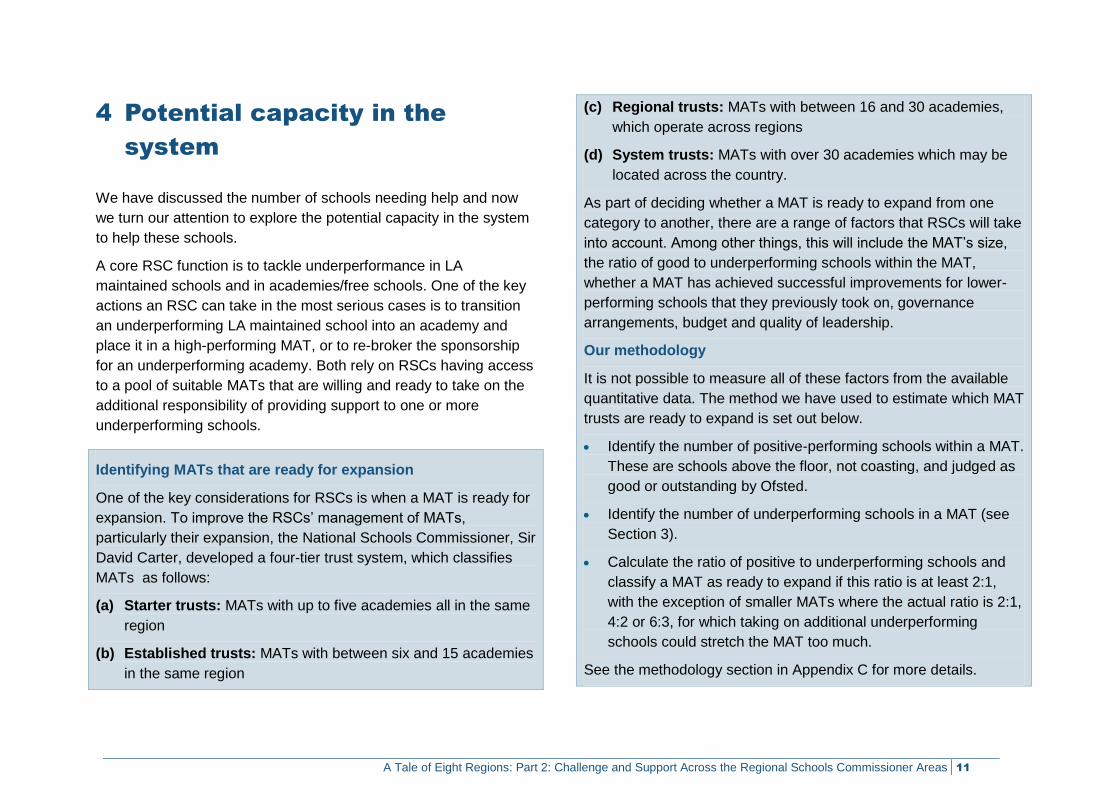
West Midlands 2490 schools 793,321 pupils 22% of primaries academised 68% of secondaries academised
The West Midlands faces a high level of challenge but has sufficient capacity in the short term to manage. It has a large number of high-performing SATs who could provide additional future capacity.
1. The West Midlands has 488 underperforming
schools in its region, the third largest of all RSC
regions.
2. The region has a high proportion of
underperforming primary schools due to poor
Ofsted outcomes and coasting schools, but a
moderate proportion of underperforming schools
across the other dimensions and phases.
3. The region has 84 underperforming schools
identified as having an immediate need, which the
RSC may need to find new sponsors for in the
near future.
4. There are 90 MATs that are ready for expansion
with capacity to take on 126 underperforming
schools. The ratio of available capacity to
immediate need in the region is 1.5 to 1.
The region, with 140 underperforming secondary schools, has a relatively high number compared to most other regions.
The region also has the joint second highest number of underperforming primary schools.
All of the LAs in the West Midlands have schools with an immediate need, with most LAs with the high proportions clustered around Birmingham.
The region has more available capacity than immediate need. There are 178 high-performing SATs that the RSC could approach if they want to find more capacity.
Key facts:
19.6% of schools are
underperforming
Key facts:
3.4% Schools need
immediate help
394 Trusts operating
in the region
90 MATs have
available capacity
NFER Regional Schools Commissioner Area Profile
A Tale of Eight Regions: Part 2: Challenge and Support Across the Regional Schools Commissioner Areas 20
East of England and North-East London
2237 schools 763,386 pupils 24% of primaries academised 73% of secondaries
academised
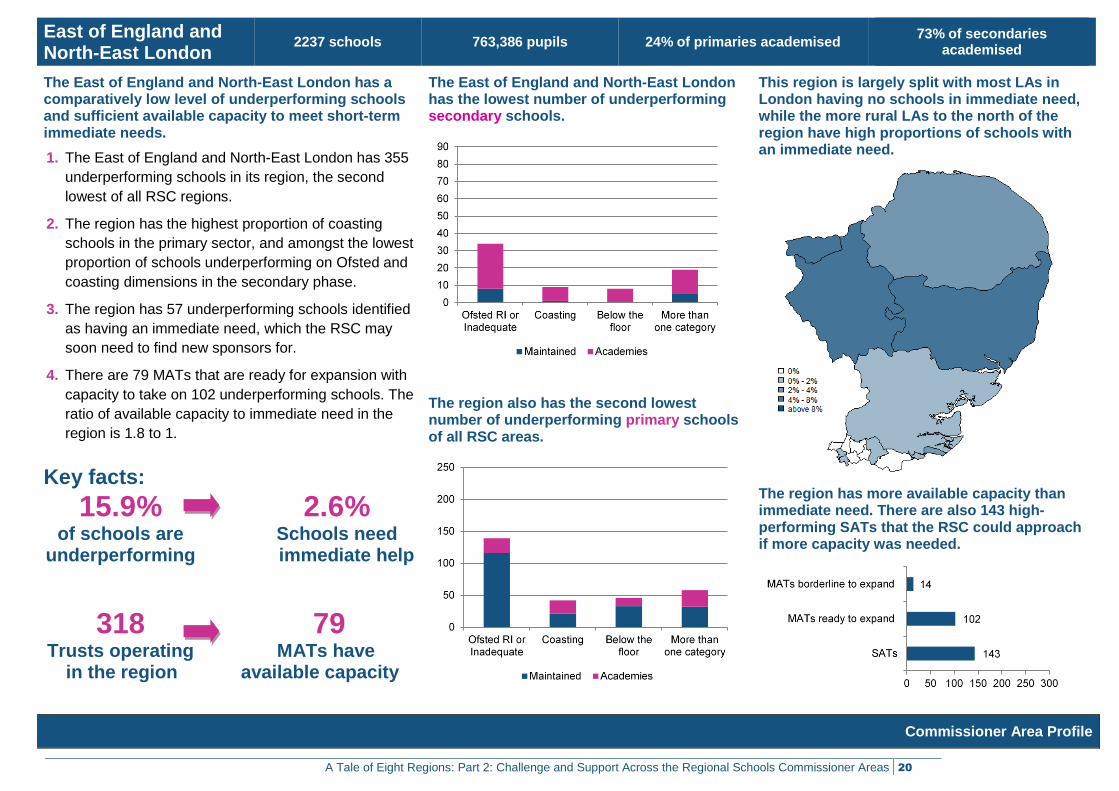
The East of England and North-East London has a comparatively low level of underperforming schools and sufficient available capacity to meet short-term immediate needs.
1. The East of England and North-East London has 355
underperforming schools in its region, the second
lowest of all RSC regions.
2. The region has the highest proportion of coasting
schools in the primary sector, and amongst the lowest
proportion of schools underperforming on Ofsted and
coasting dimensions in the secondary phase.
3. The region has 57 underperforming schools identified
as having an immediate need, which the RSC may
soon need to find new sponsors for.
4. There are 79 MATs that are ready for expansion with
capacity to take on 102 underperforming schools. The
ratio of available capacity to immediate need in the
region is 1.8 to 1.
The East of England and North-East London has the lowest number of underperforming secondary schools.
The region also has the second lowest number of underperforming primary schools of all RSC areas.
This region is largely split with most LAs in London having no schools in immediate need, while the more rural LAs to the north of the region have high proportions of schools with an immediate need.
The region has more available capacity than immediate need. There are also 143 high- performing SATs that the RSC could approach if more capacity was needed.
Key facts:
15.9% of schools are
underperforming
Key facts:
2.6% Schools need immediate help
318 Trusts operating
in the region
79 MATs have
available capacity
NFER Regional Schools Commissioner Area Profile
A Tale of Eight Regions: Part 2: Challenge and Support Across the Regional Schools Commissioner Areas 21
South-Central England and North-West London
2787 schools 951,061 pupils 18% of primaries academised 75% of secondaries academised
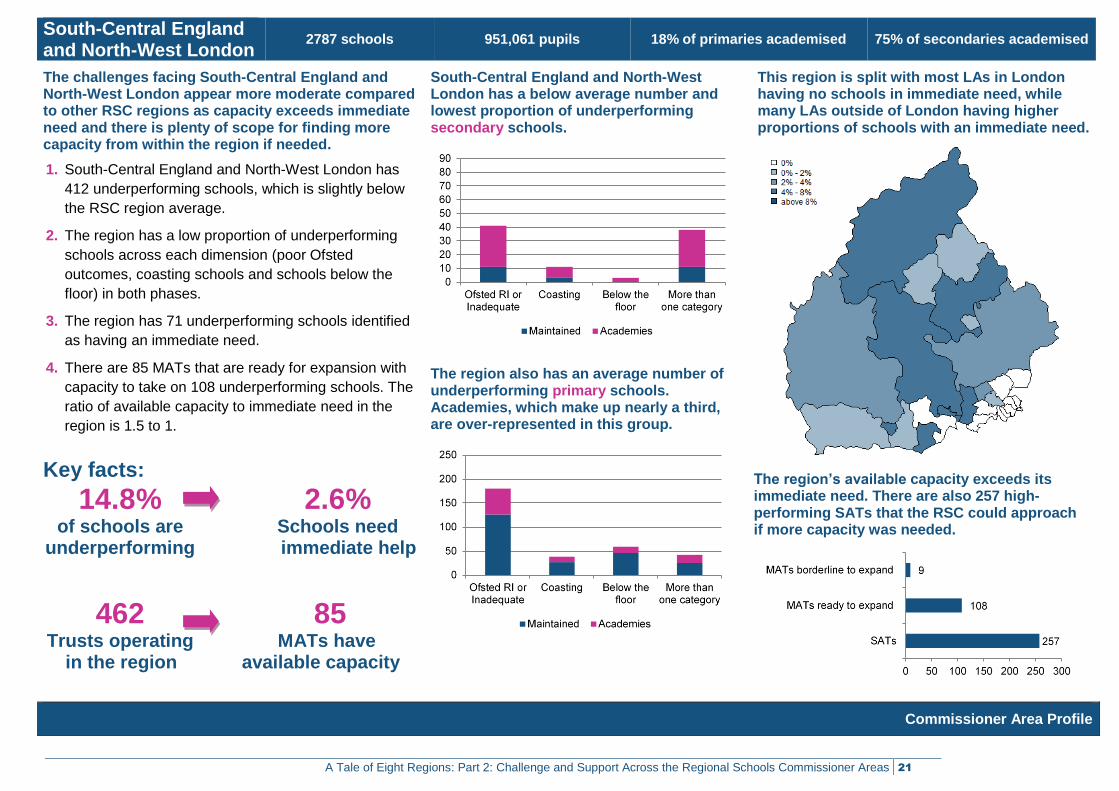
The challenges facing South-Central England and North-West London appear more moderate compared to other RSC regions as capacity exceeds immediate need and there is plenty of scope for finding more capacity from within the region if needed.
1. South-Central England and North-West London has
412 underperforming schools, which is slightly below
the RSC region average.
2. The region has a low proportion of underperforming
schools across each dimension (poor Ofsted
outcomes, coasting schools and schools below the
floor) in both phases.
3. The region has 71 underperforming schools identified
as having an immediate need.
4. There are 85 MATs that are ready for expansion with
capacity to take on 108 underperforming schools. The
ratio of available capacity to immediate need in the
region is 1.5 to 1.
South-Central England and North-West London has a below average number and lowest proportion of underperforming secondary schools.
The region also has an average number of underperforming primary schools. Academies, which make up nearly a third, are over-represented in this group.
This region is split with most LAs in London having no schools in immediate need, while many LAs outside of London having higher proportions of schools with an immediate need.
The region’s available capacity exceeds its immediate need. There are also 257 high- performing SATs that the RSC could approach if more capacity was needed.
Key facts:
14.8% of schools are
underperforming
Key facts:
2.6% Schools need immediate help
462 Trusts operating
in the region
85 MATs have
available capacity
NFER Regional Schools Commissioner Area Profile

A Tale of Eight Regions: Part 2: Challenge and Support Across the Regional Schools Commissioner Areas 22
South-East England and South London
3067 schools 1,083,861 pupils 21% of primaries academised 64% of secondaries academised
South-East England and South London, with the lowest number of schools in immediate need and largest amount of spare capacity, appears to have fewer challenges than other RSC regions.
1. South-East England and South London has 456
underperforming schools, which is slightly more than
the RSC average. As the region has the second
largest number of schools, it has the second lowest
proportion of underperforming schools.
2. The region has an average proportion of schools with
poor Ofsted results in the primary sector and a low
proportion of underperforming schools across all other
dimensions and phases.
3. The region has 50 underperforming schools identified
as having an immediate need, which is both the
lowest number and proportion amongst RSC regions.
4. There are 112 MATs that are ready for expansion with
capacity to take on 165 underperforming schools. The
ratio of available capacity to immediate need in the
region is 3.3 to 1, the highest of all RSCs.
The number of underperforming secondary schools in the region is in line with the RSC average. Nearly a half are LA maintained which are over-represented in this group.
The region has the joint second highest number of underperforming primary schools.
This region is split with most LAs in London having no schools in immediate need, while many LAs outside of London have higher proportions of schools with an immediate need.
The region’s available capacity comfortably exceeds its immediate need. There are also 196 high-performing SATs that the RSC could approach if more capacity was needed.
Key facts:
14.9% of schools are
underperforming
Key facts:
1.6% Schools need immediate help
419 Trusts operating
in the region
112 MATs have
available capacity
NFER Regional Schools Commissioner Area Profile
A Tale of Eight Regions: Part 2: Challenge and Support Across the Regional Schools Commissioner Areas 23
South-West England 2211 schools 599,741 pupils 32% of primaries academised 76% of secondaries academised
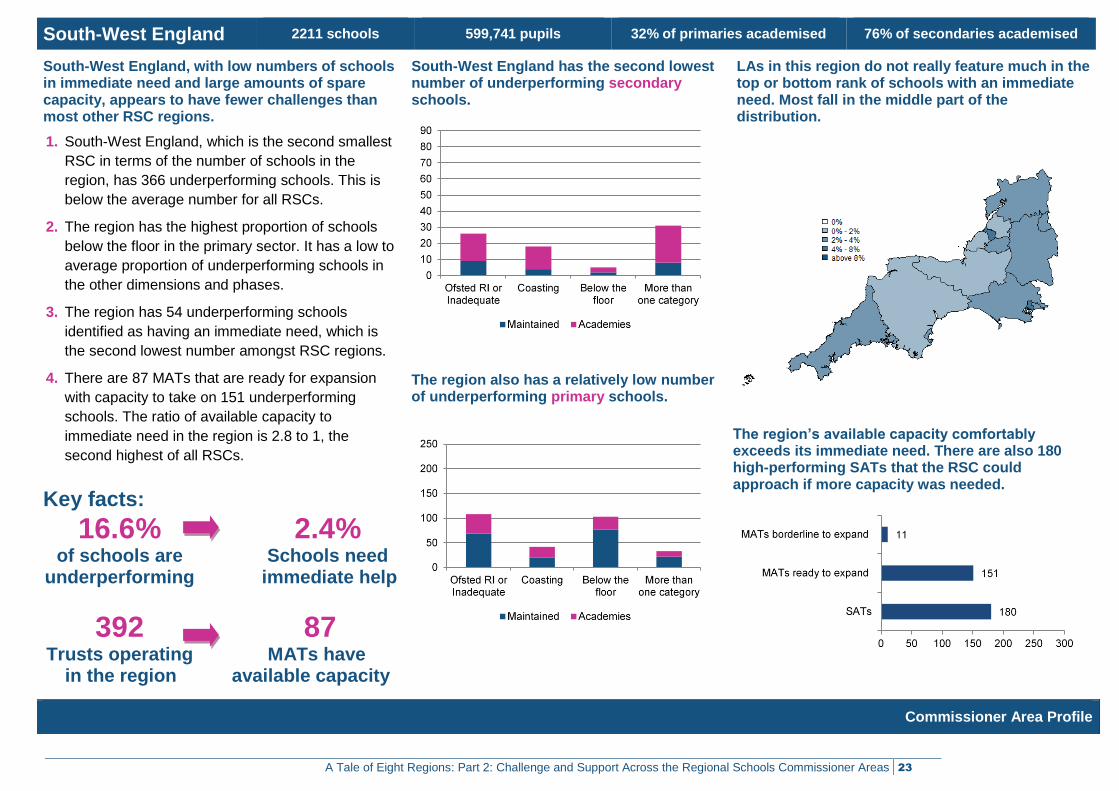
South-West England, with low numbers of schools in immediate need and large amounts of spare capacity, appears to have fewer challenges than most other RSC regions.
1. South-West England, which is the second smallest
RSC in terms of the number of schools in the
region, has 366 underperforming schools. This is
below the average number for all RSCs.
2. The region has the highest proportion of schools
below the floor in the primary sector. It has a low to
average proportion of underperforming schools in
the other dimensions and phases.
3. The region has 54 underperforming schools
identified as having an immediate need, which is
the second lowest number amongst RSC regions.
4. There are 87 MATs that are ready for expansion
with capacity to take on 151 underperforming
schools. The ratio of available capacity to
immediate need in the region is 2.8 to 1, the
second highest of all RSCs.
South-West England has the second lowest number of underperforming secondary schools.
The region also has a relatively low number of underperforming primary schools.
LAs in this region do not really feature much in the top or bottom rank of schools with an immediate need. Most fall in the middle part of the distribution.
The region’s available capacity comfortably exceeds its immediate need. There are also 180 high-performing SATs that the RSC could approach if more capacity was needed.
Key facts:
16.6% of schools are
underperforming
Key facts:
2.4% Schools need
immediate help
392 Trusts operating
in the region
87 MATs have
available capacity
NFER Regional Schools Commissioner Area Profile

A Tale of Eight Regions: Part 2: Challenge and Support Across the Regional Schools Commissioner Areas 24
6 References
Department for Education (2016a). New Funding for School
Improvement [online]. Available:
https://www.gov.uk/government/news/new-funding-for-school-
improvement--2 [17 February, 2017].
Department for Education (2016b). Regional Schools
Commissioners Decision Making Framework [online]. Available:
https://www.gov.uk/government/uploads/system/uploads/attachmen
t_data/file/577885/RSC_decision_making_framework_December_2
016.pdf [16 March, 2017].
Department for Education (2016c). Schools Causing Concern:
Intervening in Failing, Underperforming and Coasting Schools.
Guidance for Local Authorities and RSCs. London: DfE [online].
Available:
https://www.gov.uk/government/uploads/system/uploads/attachmen
t_data/file/510080/schools-causing-concern-guidance.pdf [17
February, 2017].
Department for Education (2017a). Education Secretary Announces
Six New Opportunity Areas [online]. Available:
https://www.gov.uk/government/news/education-secretary-
announces-6-new-opportunity-areas [17 February, 2017].
Department for Education (2017b). Schools National Funding
Formula – Stage 2. Overview [online]. Available:
https://consult.education.gov.uk/funding-policy-unit/schools-
national-funding-formula2/ [17 February, 2017].
Durbin,B., Wespieser,K., Bernardinelli, D. and Gee, G. (2015). A
Guide to Regional Schools Commissioners. Slough: NFER [online].
Available: https://www.nfer.ac.uk/publications/RSCR01 [25
November, 2016].
Hillary, J., Easton, C., Bernardinelli, D. and Gee, G. (2016). A Tale
of Eight Regions. Part 1: A Snapshot of the Evolving School System
across the Regional Schools Commissioner Areas. Slough: NFER.
[online]. Available:
https://www.nfer.ac.uk/publications/RSCS01/RSCS01.pdf [3 April,
2017].
Great Britain. Parliament. House of Commons (2016). Educational
Excellence Everywhere (Cm.9230) [online]. Available:
https://www.gov.uk/government/uploads/system/uploads/attachmen
t_data/file/508447/Educational_Excellence_Everywhere.pdf [16
March, 2017].
Local Government Association (2016). Councils Call for Education
Services Grant Cut to be Reversed [online]. Available:
http://www.local.gov.uk/web/guest/media-releases/-
/journal_content/56/10180/8092376/NEWS [17 February, 2017].

A Tale of Eight Regions: Part 2: Challenge and Support Across the Regional Schools Commissioner Areas 25
Appendix A: Changes since ‘A
Guide to Regional Schools
Commissioners’ (2015 report)
As the RSC role has continued to evolve since our first report in
2015 and more information has become available to explain the
RSCs’ role and responsibilities, so our research method has
evolved to try to reflect the latest understanding. We have made
some major changes to our methodology, which means that it is not
possible to directly compare our findings in this report with those in
our 2015 report. This appendix sets out the key differences.
New definition of underperforming schools
In our 2015 report, underperforming schools comprised schools that
were below the floor or coasting. In this report, in line with the
Schools Causing Concern guidance (DfE 2016c) published in
March 2016, we have widened this definition to include schools
rated by Ofsted as being inadequate or requiring improvement. This
has significantly increased the number of underperforming schools.
To illustrate, we would have had 1755 underperforming schools in
2016 had we retained our previous definition compared to 3407
using our wider definition.
Improved methodology to estimate capacity
In our 2015 report, we constructed a measure to assess how ready
existing sponsors were to expand and take on underperforming
schools. This measure indicated that there were 271 sponsors with
a high potential to take on new underperforming schools
immediately or with some support.
We have improved our methodology for measuring potential
available capacity in this report. Our method compares the ratio of
positive performing to underperforming schools within a MAT.
Those with a ratio of at least two positive to one underperforming
schools are deemed to be ready to expand (excluding MATs with a
ratio of 2:1, 4:2 and 6:3). There were 614 such MATs which
satisfied our conditions of being ready to expand.
We have then estimated how many additional underperforming
schools the MATs we identify as ready to expand might be able to
accommodate (i.e. to the point after the addition of another
underperforming school took their ratio below 2:1). We found that
MATs which were ready to expand had a maximum potential
capacity to take on 915 underperforming schools.
To summarise, the available capacity within the system in our latest
report is much greater than our previous report because:
Our new methodology uses MATs rather than sponsors (and not
all MATs are signed up to be sponsors).
We have estimated the maximum potential under performing
schools that MATs which are ready to expand could take on.
There are also more MATs in operation in September 2016 than
there were in July 2015.
Categories of underperforming schools
In the period of time since the previous report, DfE has passed
legislation to bring coasting schools into being, and has published
guidance setting out RSCs’ responsibilities with regard to this and
A Tale of Eight Regions: Part 2: Challenge and Support Across the Regional Schools Commissioner Areas 26
other types of underperforming schools. Prior to this, we were not
able to distinguish between different categories of underperforming
schools. However, using the latest Schools Causing Concern
guidance, we have been able to split these schools into two groups,
as follows.
Schools in 'immediate need', comprising schools where
underperformance is deemed very serious, where the RSC is
likely to need to make some kind of rapid intervention.
'Watch list' schools, which contains all other underperforming
schools. This includes all coasting schools and a large number
of schools judged by Ofsted to require improvement which are
not underperforming for any other reasons.
In our 2015 report, in order to assess sponsor capacity, we
compared the 1980 underperforming schools which were below the
floor or coasting to the 271 sponsors which we had estimated had a
high potential to take on new underperforming schools immediately
or with some support. However, in this report, we are able to
present a more nuanced assessment about whether there is
sufficient sponsorship capacity by comparing the 915 maximum
potential capacity spaces in MATs which are ready to expand to the
573 schools in the immediate need underperformance group, which
RSCs might be thinking will need to be found a suitable MAT to join.
As we have refined how we have defined or calculated both the
schools in need and the available capacity figures, the figures are
not directly comparable to our 2015 methodology.

A Tale of Eight Regions: Part 2: Challenge and Support Across the Regional Schools Commissioner Areas 27
Appendix B: Definitions of
underperforming schools, and
changes over time
Reasons for school underperformance
According to our definition of school underperformance, there were
3407 underperforming schools in 2016. LA maintained schools
have far more underperforming schools than other school types,
much of which is in the primary sector where around four in five
schools are still LA controlled.
Figure B1 Number of inadequate underperforming schools
The main reason why schools are underperforming is because
Ofsted has judged them to be inadequate or as requiring
improvement. However, a fair number are underperforming for
multiple reasons, particularly sponsor-led academies where over a
third of this school type are underperforming for two or more
reasons.
Ofsted judgements
There has been a reduction in the number of schools that are
inadequate or which require improvement since September 2014,
when RSCs first took up their roles. Then, almost 20 per cent of
schools had a poor Ofsted outcome, but two years on, this has
fallen to 12 per cent of schools. Although this reduction coincides
with the period that RSCs have been in operation, it is not known
what is driving this improvement. It could be a consequence of the
introduction of the new Ofsted inspection framework in September
2015 or other factors. Caution is needed in drawing conclusions
from the data.
Schools judged by Ofsted to be inadequate
The proportion of schools judged by Ofsted to be inadequate fell by
one percentage point in the two years to 2016 to 1.5 per cent of all
schools. This varies markedly by phase: the proportion of
inadequate primary schools decreased from 1.8 per cent in 2014 to
0.9 per cent in 2016, whereas the proportion of inadequate
secondary schools decreased from 6.1 per cent to 4.3 per cent over
the same period.
In terms of the number of inadequate schools by RSC region, West
Midlands has most with 54 while South-East England and South
0
500
1000
1500
2000
2500
Maintained Academy Converters
Academy Sponsors Free Schools
Poor Ofsted rating Coasting Below the floor More than one reason

A Tale of Eight Regions: Part 2: Challenge and Support Across the Regional Schools Commissioner Areas 28
London with 19 has fewest. All regions have seen a decrease in
the number of inadequate schools, but South-East England and
South London has seen the greatest reduction, falling from 74
inadequate schools in 2014 (third highest of RSCs) to 19 in 2016
(lowest).
Figure B2 Number of inadequate schools
Schools judged by Ofsted as requiring improvement
The number of schools judged as requiring improvement fell by
seven percentage points between 2014 and 2016 to ten per cent,
with all RSC regions seeing a fall. The three regions with the largest
proportion of schools with poor Ofsted outcomes in 2014 (East
Midlands and the Humber, East of England and North-East London,
and South-East England and South London) all saw the largest
reductions by 2016.
As with inadequate schools, there are big differences in the
proportion of schools requiring improvement by phase. The
proportion of primary schools requiring improvement fell by over
seven percentage points to 8.8 per cent in 2016, whereas the
proportion of secondary schools fell from 22.9 per cent in 2014 to
16.8 per cent in 2016.
Figure B3 Number of schools requiring improvement
Schools below the floor
The second most common cause of underperformance is schools
that fall below the floor standard. The number of schools falling
below the floor has fluctuated from one year to the next since 2014,
particularly in the primary sector. Although there are fewer schools
below the floor in both the primary and secondary phases in 2016
compared to 2014, the number of schools below the floor in 2016 is
higher than in 2015. This is because there was a large fall in the
0
20
40
60
80
100
2014 2016
0
100
200
300
400
500
600
2014 2016

A Tale of Eight Regions: Part 2: Challenge and Support Across the Regional Schools Commissioner Areas 29
number of schools below the floor between 2014 and 2015, and
between 2015 and 2016, the number of schools below the floor
increased. Some 4.9 per cent of primary schools and 8.3 per cent of
secondary schools fell below the floor in 2016. As with the Ofsted
time series data, there may be a number of reasons why the
number of schools below the floor has decreased, so caution
should be used when interpreting these changes over time.
As with Ofsted outcomes, there is again variation in the level of
challenge across regions as a result of schools falling below the
floor. East Midlands and the Humber has 80 per cent more schools
falling below the Key Stage 2 floor standards in 2016 compared to
the North of England.
Figure B4 Number of primary schools below the floor
Looking at Key Stage 4, although the number of schools below the
floor in Lancashire and West Yorkshire has fallen by one-eighth,
this RSC region has by far the largest number of such schools. It
has three and a half times the number of schools below the floor
than the East of England and North-East London, the region with
the lowest number.
Figure B5 Number of secondary schools below the floor
Coasting schools
The Education & Adoption Act 2016 allowed the Department for
Education to identify ‘coasting’ schools for the first time in 2016.
The Department defines these as schools that consistently fail to
ensure pupils reach their potential.
0 20 40 60 80 100 120 140 160 180
North of England
Lancashire and West Yorkshire
East Midlands and the Humber
West Midlands
East of England and North-East London
South-Central England and North-West …
South-East England and South London
South-West England
Below the KS2 floor in 2014 Below the KS2 floor in 2016
0 20 40 60 80 100
North of England
Lancashire and West Yorkshire
East Midlands and the Humber
West Midlands
East of England and North-East London
South-Central England and North-West London
South-East England and South London
South-West England
Below the KS4 floor in 2014 Below the KS4 floor in 2016

A Tale of Eight Regions: Part 2: Challenge and Support Across the Regional Schools Commissioner Areas 30
The ‘coasting’ definition captures school performance over three
years. In 2016 it will consider performance from the 2013/14,
2014/15 and 2015/16 academic years, and a school is only
identified as coasting if it falls within the coasting definition in all
three years.
The number of schools deemed to be coasting at Key Stage 2 is
relatively equally distributed across most regions with the number
varying between 74 and 95. However, the North of England, with
only 28 coasting schools, has well under half the number of the next
lowest RSC.
Looking at Key Stage 4, the picture is more mixed, with Lancashire
and West Yorkshire having the highest number of coasting schools,
four times as many as the East of England and North-East London,
which has the lowest number.
Figure B6 Number of coasting schools by phase
0 20 40 60 80 100
South-West England
South-East England and South …
South-Central England and North-…
East of England and North-East …
West Midlands
East Midlands and the Humber
Lancashire and West Yorkshire
North of England
Coasting at KS2 Coasting at KS4

A Tale of Eight Regions: Part 2: Challenge and Support Across the Regional Schools Commissioner Areas 31
Appendix C: Methodology
Data Sources
Number of schools and
school types by RSCS
region and local authority
Numbers and percentages of schools by type and phase in each RSC region and local authority are based on
data from Edubase, reflecting school status as of 16 September 2016.
The analysis includes all mainstream state-funded primary, secondary and all-through schools. All-through
schools are grouped together with secondary schools for analysis by phase.
The analysis excludes post-16 institutions (i.e. further education colleges, sixth form colleges and sixth form
centres, 16-19 academies and free schools), special schools and alternative provisions.
School performance Number and percentages of coasting schools and schools below floor standards are based on data from the
DfE performance tables for the academic years 2013/14, 2014/15 and 2015/16.
For the purpose of this analysis, current academies have been matched to their predecessors to link
attainment over time.
Number and percentages of schools classified as requiring improvement or inadequate are based on Ofsted’s
monthly management information publications, with data including inspections up to 31 October 2016.
Multi-Academy Trust
(MATs)
Data on academy trusts is available from Edubase and reflects the status quo as of 16 September 2016.
The size of MATs was calculated based on the total number of institutions recorded as being part of a trust,
including post-16 institutions, as well as special schools and alternative provisions. However, post-16
institutions, special schools and alternative provisions have been excluded from the analysis. Therefore, the
reported number of trusts excludes those consisting entirely of post-16 institutions, special schools or
alternative provisions. Also, the number of schools and pupils in each trust excludes those same institutions.
Definitions
Underperforming schools Our definition of underperformance follows closely the official definitions from DfE. However, as noted in the
report, we do not apply the same exclusion criteria as we are using these definitions for descriptive purposes
rather than school accountability.

A Tale of Eight Regions: Part 2: Challenge and Support Across the Regional Schools Commissioner Areas 32
Key Stage 2
A school is classified as being below the floor at Key Stage 2 in the academic year 2015/16 if:
the percentage of pupils meeting the expected standards in English reading, English writing and
Mathematics is below 65%, and
the school achieves a progress score in English reading below -5, or a progress score in English writing
below -7, or a progress score in Mathematics below -5.
A school is classified as being below the floor at Key Stage 2 in the academic years 2013/14 and 2014/15 if:
the percentage of pupils achieving level 4 or above in English reading, English writing and Mathematics is
below 65%, and
the percentage of pupils achieving the expected progress in English reading, English writing and
Mathematics is below the national median for all three.
A school is classified as being coasting at Key Stage 2 in the academic year 2015/16 if:
In 2015/16, the percentage of pupils meeting the expected standards in English reading, English writing
and Mathematics is below 85%, and the school achieves a progress score in English reading below -2.5,
or a progress score in English writing below -3.5, or a progress score in Mathematics below -2.5.
In 2013/14 and 2014/15, the percentage of pupils achieving level 4 or above in English reading, English
writing and Mathematics is below 85% and the percentage of pupils achieving expected progress is below
the national median for all three components.
Key Stage 4
A school is classified as being below the floor at Key Stage 4 for the academic year 2015/16 if:
the progress 8 measure is below -0.5, and
the upper bound of the progress 8 confidence interval is below zero.
A school is classified as being below the floor at Key Stage 4 for the academic years 2013/14 and 2014/15 if:
the proportion of pupils achieving 5 A*-C GCSEs (or equivalents) including English and Mathematics is
fewer than 40%, and
- proportion of pupils achieving expected progress is below the national median for both English and

A Tale of Eight Regions: Part 2: Challenge and Support Across the Regional Schools Commissioner Areas 33
Mathematics.
A school is classified as being coasting at Key Stage 4 in the academic year 2015/16 if:
in 2015/16, the progress 8 measure is below -0.25 and the upper bound of its confidence interval is below
zero
in 2013/14 and 2014/15, the percentage of pupils achieving 5 A*-C GCSEs (or equivalents) including
English and Mathematics is fewer than 60%, and the proportion of pupils achieving expected progress is
below the national median for both English and Mathematics.
Underperformance and
levels of need
A school is classified as underperforming if it is either:
below the floor standards in 2015/16, or
coasting in 2015/16, or
rated by Ofsted as requires improvement or inadequate.
Within the group of underperforming schools, a school is classified as being in immediate need if:
it is rated as inadequate by Ofsted, or
it is below the floor standards in 2015/16, and has been below the standard at least once in either 2013/14
or 2014/15
it is below the floor standards in 2015/16, and has been rated as requires improvement by Ofsted.
Where an academy falls within our definition of immediate need, we have assumed that it is not in immediate
need if it is part of a MAT, and has joined that MAT in or after September 2013. This means an academy is
classified as being in immediate need if it is a Single Academy Trust, or if it has joined its current MAT prior to
September 2013.
High-performing schools For the purpose of identifying the capacity to expand of Multi-Academy Trusts (see box below), we have also
defined high-performing schools as follows.
A school is classified as high performing at Key Stage 2 in the academic year 2015/16 if:
the percentage of pupils meeting the expected standards in English reading, English writing and
Mathematics is within the top 25% nationally, and
progress scores in English reading, English writing and Mathematics are all above zero.

A Tale of Eight Regions: Part 2: Challenge and Support Across the Regional Schools Commissioner Areas 34
A school is classified as high performing at Key Stage 4 for the academic year 2015/16 if:
the progress 8 measure is within the top 25% nationally, and the attainment 8 score is above the national
median, or
the attainment 8 score is within the top 25% nationally, and the progress 8 measure is above the national
median.
Classification of Multi-
Academy Trusts (MATs)
Our basic classification of MATs is based on our size calculations (which include post-16 institutions as well
as special schools and alternative provisions, see box above), and follows the guidelines proposed by the
National School Commissioner, Sir David Carter.
MATs are classified as follows:
Starter MATs are MATs with up to five schools
Established MATs are MATs with between 6 and 15 schools
National MATs are MATs with between 16 and 30 schools
System Leader MATs are MATs with more than 30 schools.
Note that Starter and Established MATs are generally concentrated in one region, although a small number of
them control schools across two or more neighbouring regions. On the other hand, National and System
Leader MATs are generally cross regional, with only a small number of National MATs being located in a
single region.
MATs readiness to expand For the purpose of our analysis, we have defined a MAT’s readiness to expand on the basis of the proportion
of good schools to underperforming schools in the MAT. We have a two-tier classification, where a MAT is
assessed at both national and regional level.
The definition of underperforming schools is explained above.
A school has been classified as good if:
it is rated good or outstanding by Ofsted, and
is not coasting in 2015/16, and has not fallen under the coasting threshold in the last two academic years
(note that falling below the floor standard would automatically imply falling below the coasting threshold).
This definition leaves some schools with a 'neutral' classification. This would be the case when they do not
A Tale of Eight Regions: Part 2: Challenge and Support Across the Regional Schools Commissioner Areas 35
have any of the necessary data to produce a classification (many new free schools fall in this category), or
because the school performance is variable across the three years of data considered.
We classify a MAT as ready to expand (at the national level) if the overall ratio of good schools to
underperforming schools is at least 2:1, with the following exceptions:
a single-school MAT is classified as ready to expand if the school is classified as high performing
small MATs with an exact ratio of 2:1 (i.e. where the actual numbers are 2:1, 4:2 or 6:3) are classified as
borderline as taking on an additional underperforming school would potentially stretch them too far.
At a regional level, a MAT is classified as ready to expand in a specific region if:
the MAT is classified as ready to expand at the national level, and
there are at least as many good as underperforming schools within the MAT in that specific region.
We define the capacity to expand of a MAT as the number of underperforming schools it can potentially take
on given the current number of good schools. This is calculated as the number of schools that would bring the
ratio of good to underperforming schools below 2:1. As an example, a MAT with 15 good schools and five
underperforming schools would be able to take on up to three more underperforming schools, as the third one
is the one that would bring the ratio below 2:1.
For cross-regional MATs, we allocate capacity to expand proportionally to the number of good schools within
the MAT in the region. Regions with smaller overall capacity are given preference in the case of a tie.

A Tale of Eight Regions: Part 2: Challenge and Support Across the Regional Schools Commissioner Areas 36
NFER ref. RSCS ISBN. 978-1-911039-40-2