Part 117 FSMA Final Rulemaking for Current Good ...€¦ · FSMA Final Rulemaking for Current Good...
182
DEPARTMENT OF HEALTH AND HUMAN SERVICES Food and Drug Administration Part 117 FSMA Final Rulemaking for Current Good Manufacturing Practice and Hazard Analysis and Risk-Based Preventive Controls for Human Food Final Regulatory Impact Analysis Final Regulatory Flexibility Analysis Final Unfunded Mandates Reform Act Analysis Final Paperwork Reduction Act Analysis Economics Staff
Transcript of Part 117 FSMA Final Rulemaking for Current Good ...€¦ · FSMA Final Rulemaking for Current Good...

DEPARTMENT OF HEALTH AND HUMAN SERVICES
Food and Drug Administration
Part 117
FSMA Final Rulemaking for Current Good Manufacturing
Practice and Hazard Analysis and Risk-Based Preventive
Controls for Human Food
Final Regulatory Impact Analysis
Final Regulatory Flexibility Analysis
Final Unfunded Mandates Reform Act Analysis
Final Paperwork Reduction Act Analysis
Economics Staff

1
Executive Summary
This final regulation requires domestic and foreign facilities to adopt a food safety plan, perform
a hazard analysis, and to institute preventive controls for the mitigation of those hazards. It also
includes requirements for facilities to institute risk-based environmental monitoring, product
testing and a supplier program as appropriate to the food, the facility and the nature of the
preventive controls, as well as a requirement to institute controls to help prevent hazards
associated with economically motivated adulteration. The total annualized domestic costs are
estimated to be approximately $381 million per year, estimated with a 3 percent discount rate,
and $382 million per year, estimated at 7 percent when discounted over 10 years. We estimate
that processed foods covered by this rulemaking are responsible for approximately 903,000
foodborne illnesses each year, at a total cost to the American public of approximately $2.2
billion. Our break-even analysis shows that for the rule to be cost effective, it would have to
prevent $382 million worth of foodborne illnesses; approximately 17 percent of the total annual
illnesses, or approximately 157,000 illnesses when using a discount rate of 7 percent. For the
rule to be cost effective using a discount rate of 3 percent, it would have to prevent $381 million
worth of foodborne illnesses (about 17 percent or 156,000 illnesses).

2
Table of Contents IV. Economic Analysis of Impacts .............................................................................................................. 4
A. Final Regulatory Impact Analysis ........................................................................................................ 4 B. Summary of Costs and Benefits of the Final Requirements ................................................................. 5 C. Comparison of Estimated Costs Between Proposed Rule plus Supplemental Proposal and the Final Rule ........................................................................................................................................................... 9 D. Need for Regulation ........................................................................................................................... 13 E. Comments on the Preliminary and Supplemental Regulatory Impact Analysis and our Responses .. 15 F. Economic Analysis of the Cost of Illnesses that Could Potentially Be Prevented by the Rule .......... 40
1. Baseline Risk of Foodborne Illness ................................................................................................ 41
2. Reduced Foodborne Illness due to Implementation of the Rule ..................................................... 50
3. Analysis of Benefits ........................................................................................................................ 51
G. Economic Analysis Costs: Overview of Cost Conventions and Facilities Covered .......................... 52 1. Measuring Costs .............................................................................................................................. 52
2. Coverage of the Analysis ................................................................................................................ 57
H. Costs Associated with Revisions to Subparts A and B- General Provisions and Current Good Manufacturing Practices (CGMPs) ......................................................................................................... 68 I. Costs Associated with Subpart C-Hazard Analysis and Risk-Based Preventive Controls .................. 72
1. Food Safety Plan ............................................................................................................................. 72
2. Hazard Analysis .............................................................................................................................. 73
3. Hazard Analysis to Prevent Economically Motivated Adulteration ............................................... 79
4. Preventive Controls ......................................................................................................................... 80
5. Supplier Approval and Verification Program – Part 117, New Subpart G ................................... 104
6. Recall Plans ................................................................................................................................... 116
7. Monitoring .................................................................................................................................... 119
8. Corrective Actions ........................................................................................................................ 119
9. Verification ................................................................................................................................... 126
3
10. Costs to Review and Analyze the Rule ....................................................................................... 137
11. Cost Impact for Foreign Facilities .............................................................................................. 138
K. UNCERTAINTY ANALYSIS ................................................................................................................. 149 VI. Final Small Entity Analysis ................................................................................................................ 153
A. Introduction ...................................................................................................................................... 153 B. Economic Effects on Small Entities ................................................................................................. 154
1. Regulated Entities ......................................................................................................................... 154
2. Regulatory Flexibility Options ...................................................................................................... 159
VII. Unfunded Mandates .......................................................................................................................... 160 VIII. Small Business Regulatory Enforcement Fairness Act .................................................................... 161 IX. Paperwork Reduction Act of 1995 ...................................................................................................... 162
A. Recordkeeping Requirements ....................................................................................................... 162 B. Information Collection Burden Estimate ..................................................................................... 174
1. Recordkeeping Burden .............................................................................................................. 174
2. Reporting Burden ...................................................................................................................... 177
3. Third Party Disclosure Burden ................................................................................................. 178
References ................................................................................................................................................. 179

4
IV. Economic Analysis of Impacts
A. FINAL REGULATORY IMPACT ANALYSIS
FDA has examined the impacts of the final rule under Executive Order 12866, Executive
Order 13563, the Regulatory Flexibility Act (5 U.S.C. 601-612), and the Unfunded Mandates
Reform Act of 1995 (Public Law 104-4). Executive Orders 12866 and 13563 direct Agencies to
assess all costs and benefits of available regulatory alternatives and, when regulation is
necessary, to select regulatory approaches that maximize net benefits (including potential
economic, environmental, public health and safety, and other advantages; distributive impacts;
and equity). Executive Order 13563 emphasizes the importance of quantifying both costs and
benefits, of reducing costs, of harmonizing rules, and of promoting flexibility. OMB has
determined that this final rule is an economically significant regulatory action as defined by
Executive Order 12866.
The Regulatory Flexibility Act requires Agencies to analyze regulatory options that
would minimize any significant impact of a rule on small entities. Because facilities with less
than 20 employees (both qualified and non-qualified facilities) will bear a large portion of the
costs, the agency concludes that the final rule will have a significant economic impact on a
substantial number of small entities.
Section 202(a) of the Unfunded Mandates Reform Act of 1995 requires that Agencies
prepare a written statement, which includes an assessment of anticipated costs and benefits,
before proposing “any rule that includes any Federal mandate that may result in the expenditure
by State, local, and tribal governments, in the aggregate, or by the private sector, of
$100,000,000 or more (adjusted annually for inflation) in any one year.” The current threshold

5
after adjustment for inflation is $144 million, using the most current (2014) Implicit Price
Deflator for the Gross Domestic Product. We expect this final rule to result in a 1-year
expenditure that will exceed this amount.
B. SUMMARY OF COSTS AND BENEFITS OF THE FINAL REQUIREMENTS
The requirements of this final Current Good Manufacturing Practice, Hazard Analysis,
and Risk-Based Preventive Controls for Human Food regulation (Preventive Controls Rule or the
Rule) may lead to higher costs for both the industry and consumers. As described in the
preamble, the final rule includes revised requirements for domestic and foreign facilities subject
to subpart B, Current Good Manufacturing Practice in Manufacturing, Packing, or Holding
Human Food, to (1) modernize practices; (2) adjust and clarify what activities fall within the
long-standing exemption from the CGMP requirements for establishments engaged solely in the
harvesting, storage, or distribution of one or more raw agricultural commodities (RACs); (3)
delete some non-binding provisions of current part 110; to (4) re-establish the provisions of
current part 110 in new part 117 (21 CFR part 117) and to provide education and training in food
safety and personal hygiene for food production workers that work in establishments that are
subject to subparts B or C.
The final rule also requires domestic and foreign facilities subject to subpart C to adopt a
food safety plan, perform a hazard analysis, and to institute preventive controls, as appropriate,
for the mitigation of those hazards. The final regulation also includes requirements for facilities
subject to subpart C to institute risk-based environmental monitoring, product testing and a
supply-chain program as appropriate to the food, the facility and the nature of the preventive
controls, as well as a requirement to institute controls to help prevent hazards associated with

6
economically motivated adulteration (EMA). When these provisions are adopted, facilities
would be required, as appropriate to ensure the effectiveness of the preventive control, to
monitor their controls, verify that they were effective, take any appropriate corrective actions,
and maintain records that document these actions.
The affected food establishments will incur costs to comply with this final regulation.
Depending on how the firms in the affected markets respond to these requirements, some of the
costs may ultimately be borne by consumers as prices rise. The higher prices, however, will
likely not be sufficient to fully offset the costs borne by food establishments.
We estimate that the present value of total costs for domestic facilities over 10 years
using a discount rate of 7 percent will be $2.7 billion and $3.3 billion with a discount rate of 3
percent. Total annualized domestic costs will be approximately $382 million per year at 7
percent and $381 million at 3 percent. Total costs for foreign facilities will be $5.8 billion at 7
percent and $7.0 billion at 3 percent. Total annualized costs to foreign facilities will be
approximately $820 million at 7 percent and approximately $817 million at 3 percent. The total
domestic and foreign cost will be approximately $8.4 billion at 7 percent and $10.2 billion at 3
percent. The domestic and foreign total annualized cost will be $1.2 billion per year at 7 percent
and $1.2 billion at 3 percent.
The major costs to domestic facilities for this final rule using a discount rate of 7 percent
and discounted over 10 years are to adopt or perform:
Subpart A § 117.4 Education & Training: $35 million
Subpart C § 117.130 Hazard analysis: $50 million
§ 117.135 Preventive controls.
(1) Process controls: $65 million

7
(2) Food Allergen controls: $14 million
(3) Sanitation controls: $12 million
§ 117.139 Recall plan: $6 million
§ 117.145 Monitoring: $27 million
§ 117.150 Corrective actions and corrections: $29 million
§ 117.165 Verification of implementation and effectiveness: $56 million
Subpart D § 117.201 Requirements that apply to a qualified facility: $8 million
Subpart G § 117.405 Supply chain program: $64 million
Table 1 summarizes our estimate of the FRIA costs and health benefits.
Table 1. Summary costs and health benefits.($ millions)
PCHF Provision
One-Time Cost
First Yr
Compliance Period
One-Time Cost
Second Yr
Compliance Period
(Small Businesses
<500 FTE’s)
One-Time Cost
Third Yr
Compliance Period
(Very Small Businesses
<$1 million)
Annual Cost
(Annually Recurring
Costs)
Total Annualized Cost at 7%
Total Annualized Cost at 3%
Learn about Rule $6 $96 $21 $0 $16 $14
Education and Training $17 $148 $21 $15 $35 $34
Attest Qualified Status to FDA $0 $0 $1 $0 $0 $0
One-time Label Change $0 $0 $67 $0 $8 $7
Total Costs Subpart A & D $17 $148 $88 $15 $43 $41

8
Subpart C Hazard Analysis and Risk-Based Preventive Controls
Hazard Analysis $0 $51 $0 $26 $29 $29 Hazard Analysis for Economically Motivated Adulteration
$1 $11 $0 $22 $21 $21
Process Controls $2 $57 $0 $66 $65 $65
Allergen Controls $1 $15 $0 $14 $14 $14
Sanitation Controls $1 $27 $0 $10 $12 $12
Environmental Monitoring $0 $2 $0 $17 $15 $15
Product Testing $0 $0 $0 $45 $41 $42 Supplier Approval and Verification Program
$4 $11 $0 $70 $64 $65
Corrective Actions $0 $4 $0 $33 $29 $30
Recall Plans $0 $4 $0 $6 $6 $6 Monitoring/Verification $0 $1 $0 $31 $27 $27
Total Costs Subparts C& G $9 $183 $0 $340 $323 $326
Total Domestic Costs $32 $427 $109 $355 $382 $381
Total Foreign Costs $68 $915 $234 $760 $820 $817
Total Costs $100 $1,342 $344 $1,115 $1,202 $1,198
Total Health Benefits
Not Quantified. Break-even occurs when 157,000 illnesses are prevented per year (based on
domestic costs discounted at 7 percent)
*Numbers might not add up due to rounding.
** Our definition of very small business includes, in addition to food sales, the market value of human food that is manufactured, processed, packed, or held without sale. Throughout our analysis, whenever we refer to the definition of a very small business, we are also referring to this broader definition.

9
Table 1b summarizes our estimate of the timing of the FRIA costs over the next 10 year period
following the effective date of the rule.
Table 1b. Summary of Domestic Costs with Staggered Compliance Periods ($ millions)
500 > FTEs (Small
Businesses <500 FTE’s)
(Very Small Businesses
<$1 million)
Total Undiscounted
Present Value of Total $343 $3,346 $109 $3,799
Compliance Year
1 $63
$63
2 $31 $782
$782
3 $31 $325 $110 $465
4 $31 $325
$356
5 $31 $325
$356
6 $31 $325
$356
7 $31 $325
$356
8 $31 $325
$356
9 $31 $325
$356
10 $31 $325
$356 *Numbers might not add up due to rounding.
C. COMPARISON OF ESTIMATED COSTS BETWEEN PROPOSED RULE PLUS SUPPLEMENTAL PROPOSAL AND THE FINAL RULE
Table 2 presents a side-by-side comparison of the updated estimated costs of the
proposed rule, the proposed rule plus the supplemental and the final rule. To present a valid
comparison, we updated our (previously published) estimated costs of the proposed rule using
our latest data and techniques, we use a discount period of ten years, we correct our discounting
method, and we use the latest wage rates and overhead and the most recent facility count.
We made a number of changes to our analysis of the costs for the proposed rule plus the
supplemental rule and the final rule. We corrected for an error that we made in discounting that
was used throughout our analysis in our estimated annualized costs. We incorrectly added an
additional year of recurring costs for small entities that are subject to subpart C. The
10
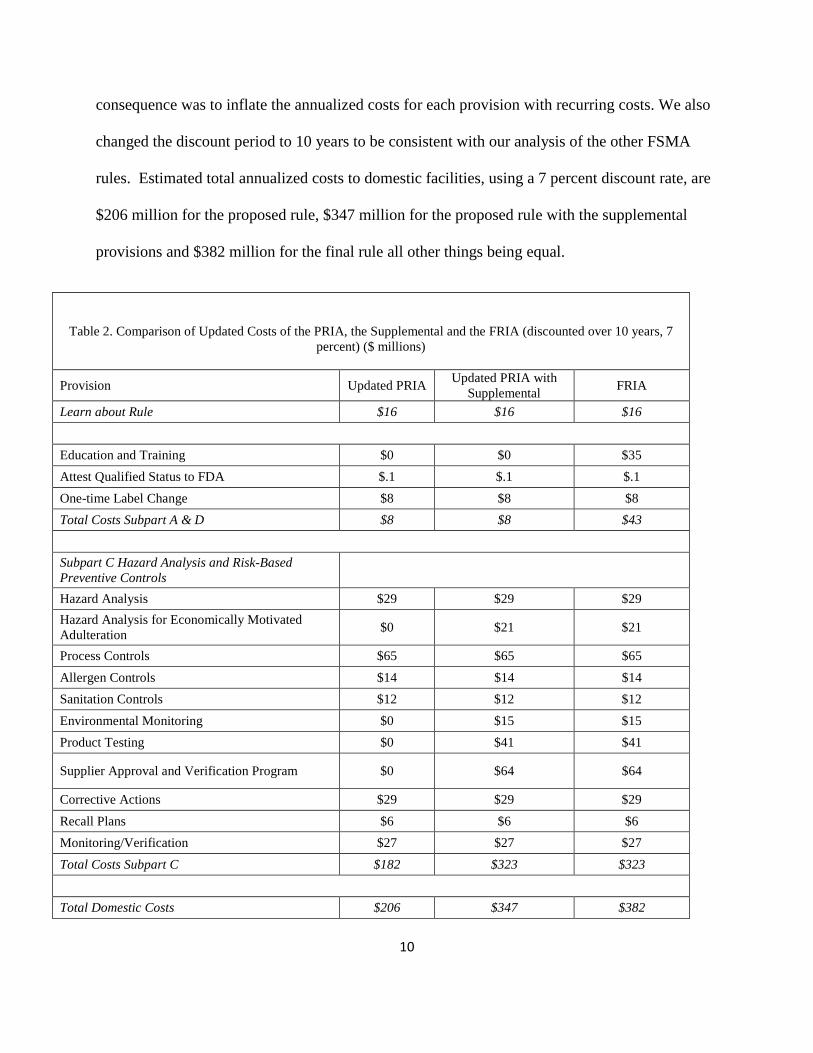
consequence was to inflate the annualized costs for each provision with recurring costs. We also
changed the discount period to 10 years to be consistent with our analysis of the other FSMA
rules. Estimated total annualized costs to domestic facilities, using a 7 percent discount rate, are
$206 million for the proposed rule, $347 million for the proposed rule with the supplemental
provisions and $382 million for the final rule all other things being equal.
Table 2. Comparison of Updated Costs of the PRIA, the Supplemental and the FRIA (discounted over 10 years, 7 percent) ($ millions)
Provision Updated PRIA Updated PRIA with Supplemental FRIA
Learn about Rule $16 $16 $16
Education and Training $0 $0 $35 Attest Qualified Status to FDA $.1 $.1 $.1 One-time Label Change $8 $8 $8 Total Costs Subpart A & D $8 $8 $43
Subpart C Hazard Analysis and Risk-Based Preventive Controls
Hazard Analysis $29 $29 $29 Hazard Analysis for Economically Motivated Adulteration $0 $21 $21
Process Controls $65 $65 $65 Allergen Controls $14 $14 $14 Sanitation Controls $12 $12 $12 Environmental Monitoring $0 $15 $15 Product Testing $0 $41 $41
Supplier Approval and Verification Program $0 $64 $64
Corrective Actions $29 $29 $29 Recall Plans $6 $6 $6 Monitoring/Verification $27 $27 $27 Total Costs Subpart C $182 $323 $323
Total Domestic Costs $206 $347 $382
11
One significant cause for the increase in our estimated cost is the change in our estimate
of costs of labor hours. Following DHHS guidelines, we corrected our estimate for computing
overhead costs to include a 100 percent adjustment relative to the money wage, rather than the
50 percent adjustment used in the original estimates. New DHHS guidelines for computing labor
costs recommend (based on general industry data) benefits plus other overhead costs equal 100
percent of pre-tax wages (Ref 2 ). This correction results in a roughly 16 percent ($60 million)
increase in estimated costs. We also updated the base year for computing wage rates from 2010
to 2013, the most recent year for which the Bureau of Labor Statistics has complete wage rate
data. This update alone results in an 8 percent ($30 million) increase in costs. The sum effect of
the two updates to the wage estimates results in a roughly 24 percent ($90 million) change in
estimated annualized costs.
We obtained more recent data for the facility count and corrected our method of
estimation of which firms are qualified and which are non-qualified as described more fully in
our discussion of covered facilities. Our estimate of the total facilities covered decreases from
the 97,646 registered in 2010 to 83,809 using the latest registration database. However, total
compliance costs increase, because more non-qualified facilities now are covered (more than
46,500 vs. the roughly 40,000 previously estimated). The new facility count and estimate of the
number of non-qualified facilities results in a 14 percent (roughly $50 million) net increase in
costs.
Based on data and information gathered from and in response to public comments, as
well as other new sources, we changed the way we modeled the cost estimates of a number of

12
provisions.1 For example, we reduced the hours necessary for very small businesses to learn
about the rule, their time to conduct a hazard analysis, the costs for adopting new process
controls, the number of facilities that would require sanitation controls, and the costs of holding.
These adjustments led to significant decreases in total estimated costs of learning the rule, hazard
analysis, process controls, and corrective actions. We also revised upward the costs to validate
process controls, along with the number of facilities and processes that would have to conduct
validation. We further adjusted the likely frequency of testing, the number of samples likely
necessary, the costs of an audit, and the population of audited firms. These adjustments led to
significant increases in the total estimated costs of environmental monitoring, product testing,
and supplier approval and verification. However, the net effect of all of these changes from new
information is a roughly 12 percent decrease (almost $45 million) in total estimated costs.
The combined effect of updating and correcting our method for estimating discount rates,
changing the discount period to 10 years, changing overhead costs, using the most recent
baseline for calculating wage rates, the most recent facility count, and other adjustments to
estimates based on public comment and other information, change the estimate of total domestic
costs of the proposed rule from approximately $371 million to $382 million, a 3 percent increase.
As stated, the additional requirements in the final rule for education and training in food
hygiene and food safety in the final rule, accounts for the roughly 9 percent increase in costs
between the adjusted estimate of the proposed rule with supplemental of $347 million and the
estimated cost of the final rule ($382 million).
We use a 10 year discount period, the correct method for discounting, the revised wage
rates, the most recent base year, the revised facility count, and other adjustments throughout our
1
These changes are described in detail in the full analysis of costs later in this document.
13
analysis of the final rule.
D. NEED FOR REGULATION
This regulation is mandated by statute. Section 103 of the FDA Food Safety
Modernization Act of 2011 (FSMA) states that FDA must establish, through rulemaking,
science-based minimum standards for conducting a hazard analysis, documenting hazards,
implementing preventive controls, and documenting the implementation of the preventive
controls. The need for the rule is because producers and consumers, acting in the unregulated
market place, are unable to observe the health risks of potentially injurious foodborne hazards
that would be necessary to make well informed choices about the processing, distribution, sale
and final consumption of potentially hazardous food products. The absence of observable risk
information reduces the incentives for producers to invest in the socially optimal level of food
safety across the supply chain from the farm through production and distribution to retailers.
The entities doing food manufacturing, processing, packing and holding make many
decisions about what investments to make to reduce food safety risk for their consumers. When
doing so, they take into account the probability of their practices causing a contamination event,
the probability that they will be found legally responsible for causing the event, and the damage
the event would cause to their firm if they are discovered to be responsible. If the probability of
event, multiplied by the probability of detection, multiplied by the damage to the firm, is equal to
or greater than the cost of prevention, then they will invest in prevention.
If the probability of detection is lower than 100 percent, and the private damages are
approximately equal to the social damages, then managers will invest less in prevention than the
social optimum. Many provisions of this rule, such as recordkeeping requirements, increase the
14
probability of detection. However, it is not feasible to increase the probability of detection to 100
percent, so in many cases, the rule mandates that managers do what they would do if they knew
that the probability of detection was 100 percent. Furthermore, the maximum damage that a
major contamination event can cause to the owners of a food production company is the value of
the company or the owners’ wealth. The social damage that a major food outbreak causes, in
many cases, is greater than the private damage done to people who could have invested to stop it.
If an outbreak causes more damage than the value of the company, then its probability multiplied
by the value of the company may be less than the cost of prevention, while its probability
multiplied by the total social damage is greater than the cost of prevention. In this case, it is not
rational for profit-maximizing managers to invest in the socially optimal levels of prevention.
This rule protects public health by addressing these situations.
Further, consumers are unable to distinguish between firms and products that have
invested in food safety at socially desirable levels from those that have not. Firms that invest in
socially desirable levels of food safety might incur higher production costs causing them to
compete at a disadvantage with firms that do not. With diminished market incentives, when
driven solely by consumer demand, establishments might not voluntarily invest sufficiently in
food safety. Establishments might not conduct a hazard analysis, document hazards that require
preventive controls, invest in preventive controls, including supplier approval and verification
programs, or conduct environmental monitoring or, product testing when needed. Information
about the microbial, chemical and physical risks associated with food covered by the regulation,
when imperfect and largely hidden to consumers, means that neither the legal system nor the
marketplace may be able to provide adequate economic incentives for the production of safe

15
food. The Government may therefore be able to improve social welfare through targeted
regulation.
E. COMMENTS ON THE PRELIMINARY AND SUPPLEMENTAL REGULATORY IMPACT ANALYSIS AND OUR RESPONSES
Our proposed rule “Current Good Manufacturing Practice and Hazard Analysis and Risk-
Based Preventive Controls for Human Food” was published on January 16, 2013 (78 FR 3646)
and its comment period, extended several times, ended on November 22, 2013. We prepared a
full “Preliminary Regulatory Impact Analysis (PRIA (Ref 3))” that was a reference to the
proposed rule. We also issued a supplemental notice of proposed rulemaking that was published
on September 29, 2014 (79 FR 58524), in which we requested comments on specific issues and
which included as a reference an updated PRIA for the provisions of the supplemental notice.
The comment period for the supplemental notice ended on December 15, 2014.
In the following paragraphs, we describe and respond to the comments that we received
on both our analysis for the original PRIA and our updated analysis for the supplemental notice.
We respond to comments regarding our analysis of the Paperwork Reduction Act (PRA) in the
section for the final PRA.
Comment 1) Some comments stated that we failed to quantify benefits or show that the
regulation will have a net benefit. In addition, the benefits as stated are uncertain and the impact
of the regulation on public health is not clear. Comments cited the evolving nature of the science
of food safety and the uncertainty of the practices and procedures that actually reduce risk in the
food supply.
Response 1) The absence of published independent economic studies that quantify the
health benefits of HACCP or similar food safety systems, and the limited number of studies that

16
assess the effectiveness of the individual provisions, made quantifying benefits of this rule-
making difficult. New, original research is necessary to fully ascertain the effectiveness of the
proposed food safety system. The inherent uncertainty and difficulty in quantifying the efficacy
of this system of safety measures when adopted for an entire industry has necessitated that we
retain our break-even calculation. We did attempt to quantify the benefits of this rule-making in
three other original ways: use of an internal expert elicitation, use of an external expert
elicitation, and by conducting a difference-in-difference analysis to analyze pre- and post-
HACCP regulation effects on foodborne versus non-foodborne illnesses. We describe these
attempts more fully in Ref 4.
Comment 2) Some comments were concerned about the calculation for undetected
illnesses; that it was highly speculative, had been calculated incorrectly from the Scallan et al.
reference to the original PRIA, and that the burden of these illnesses was over-valued.
Response 2) In our calculation of the burden of unknown illnesses due to processing we
correctly use the methodology set forth in the Scallan et al. paper. Dr. Scallan was consulted for
the estimation model we use here, and she concurred that we were using their estimates in the
correct way. We also have accounted for, in our illness burden calculation, the likelihood that
unknown illnesses are less serious in nature. This is reflected in the weighted average cost of
each type of illness; the average burden of a case of listeriosis is estimated to be well over one
million dollars while the burden of an unknown illness is estimated to average around four
hundred dollars per illness. For the benefits estimates in the final rule, we will present the
estimated burden of foodborne illness resulting from products under the scope of this rule-
making both with and without including the burden from unknown illnesses.

17
Comment 3) Some comments suggested that we had understated the benefits of the rule-
making; the value of avoided foodborne illnesses is higher than we estimated.
Response 3) We use estimates of the burden of foodborne illness that have been
published in the journal Risk Analysis. (Ref. 8) These estimates have thus been peer reviewed.
These cost estimates include more long-term health outcomes than other published estimates of
foodborne illness burden; we include all long term health outcomes supported in the literature.
We also include all costs of deaths as appropriate for all identified and unidentified illnesses.
We carefully included all illnesses from outbreaks where the root cause could be attributed to
processing; we use FDA and CDC data to reach our conclusions on which outbreaks and
illnesses to include.
Comment 4) FSMA required FDA, with significant USDA collaboration, to conduct a
study of the food processing sector under FDA’s regulatory jurisdiction. The study is necessary
to provide data for the implementation of FSMA. Several comments stated that we significantly
underestimated the number of co-located mixed-type facilities and that we did not sufficiently
collaborate with USDA. These comments strongly urged us to revisit our estimate of the number
of these facilities subject to the rule and to collaborate with the USDA. Our PRIA states that we
estimate the number of mixed-type facilities impacted by the rule to be 1,673. One comment
estimates that there are more mixed-type facilities in just Michigan, alone. Another estimate
suggests that there might be approximately 11,088 farms that might be considered farm mixed-
type facilities solely based on their value-added processing activities. The comment believes that
our estimate only represents currently recognized manufacturers that also perform farming
activities and that our estimate does not represent facilities that are currently recognized as
farms, based on our proposed definition of “farm” but will now be considered mixed-type
18
facilities. The comment believes that significantly increasing the number of these facilities
means that the cost of compliance for these operations will be higher.
Response 4) We concur with the substance of these comments. In response to these
comments, we revised and extended our analysis. We included representatives from USDA’s
Economic Research Service, USDA’s Agricultural Marketing Service, and the American Farm
Bureau to help oversee our revised study. To better estimate the number of mixed-type facilities,
we also significantly expanded our data sources. Our original analysis was based solely on the
merger of data from Dun & Bradstreet and FDA’s Food Facility Registration data when both
have an SIC code for manufacturer/processor and farming, which we believed would reflect the
number of manufacturing facilities that are also classified as farms. We updated that data source
to make it more current, and we added several new data sources. To better account for farms that
also perform processing activities, we included Census of Agriculture (Ag Census) data both to
provide a count of total U.S. farms and to estimate the number of farms conducting food
processing activities, to the extent that the data identifies processing activities. We also included
Agricultural Resource Management Survey (ARMS) data because it included questions about
some processing activities for select commodities.
Because the Ag Census and ARMS are silent about many processing activities, we also
obtained estimates from commodity specialists at trade associations, at USDA, and at
universities with in-depth knowledge of the processing activities for specific agricultural
commodities. We also asked numerous directors of promotion and marketing boards, marketing
agreements, and marketing orders for various vegetables, fruits, and tree nuts to request
information about the portion of farms that conduct food processing activities. We now estimate

19
there are approximately 33,500 farms that might be considered co-located mixed-type facilities.
(Ref. 9)
Comment 5) Some comments informed us that our PRIA failed to consider that many
activities are often performed by teams of employees or functional departments, rather than
individuals. As an example, comments refer to our estimates for the number of labor hours needed
to develop sanitation monitoring procedures as ranging from 4 to 14 hours. T he comments
suggest that our time estimates may be inaccurate because, according to them, we fail to account
for industry practices that involve the deployment of cross-functional food safety teams,
including consultants, to develop these types of procedures. The comment states such cross-
functional teams are typically composed of representatives from the following functional areas:
quality, maintenance, engineering, production, logistics, supply chain, and R&D. Such teams
collaborate to either develop new or revise existing food safety procedures and systems, a process
that can sometimes take months to complete. Additionally, comments question our time
estimates for specific tasks. For example, we estimate that 24 to 48 total labor hours would be
required for a first hazard analysis, and a subsequent hazard analysis would require 12 to 24 total
labor hours. Comments assert that we greatly underestimate the time required for hazard analyses
when fully accounting for the multi-disciplinary approach where teams of individuals from
different areas of expertise participate in the analysis process. Likewise, the scientific research
required for analysis takes a significant amount of time. The comments request that we reassess
our estimates.
Response 5) We disagree that we failed to account for the many activities often
performed by teams of employees or functional departments. On the contrary, the experts from
whom we derived our estimates explicitly concur when they state that “The HACCP program is

20
ideally and commonly developed by a team led by the Quality or Technical Services Manager.
This individual does the bulk of the work, including most of the writing. HACCP teams almost
always consist of quality and production staff and may include personnel from purchasing,
engineering, receiving, shipping, warehouse departments, as well as laboratory staff and
representatives of production employees. The core HACCP team can range widely in size, from
4 up to 15 people. Some team members, however, only provide input to specific parts of the
program. For instance, purchasing would likely provide input on the ingredients section. Some
companies may bring in a third party HACCP firm to either write the HACCP plan or serve as a
facilitator for the in-house team (Ref. 10).
We decline to change the estimated time to conduct a hazard analysis. The basis for the
assertion that we underestimated the time was that we did not account for the team approach for
the hazard analysis process; as explained above this was considered in deriving our estimates.
Comments do not provide any evidence to support their assertion that we underestimated the
time.
Comment 6) Some comments further suggest that our estimate for the cost to implement
recall controls understates the time needed to develop the initial recall procedures as ranging from
7 hours for facilities with 20 to 99 employees and smaller to 19 hours for facilities with both
100 to 400 employees and with 500 or more employees. Comments indicated that developing an
initial recall procedure would involve at least three functions: legal, regulatory, and quality, and
could require a minimum of fifty hours.
Response 6) We revised our estimate for the number of hours to develop an initial recall
plan for covered facilities with both 100 to 400 employees and with 500 or more employees to
21
reflect the estimate of fifty hours. We limited the revision to larger facilities, as they are the ones
likely to employ legal, regulatory and quality personnel to develop the recall procedure.
Comment 7) Some comments note that the rule is intended to apply equally to both
foreign and domestic facilities, but that we lack any information about the anticipated benefits
from compliance by foreign facilities. The comments indicate that in order to accurately assess
the health benefits to consumers, the benefits to both domestic and foreign consumers should be
considered.
Response 7) We agree that both domestic and foreign facilities that export to the U.S.
will be covered by the rule and that the implementation of the provisions of the rule by foreign
facilities for the production of food for consumption in that country can reduce the risk to foreign
consumers from exposure to contaminated foods, which should reduce the number of foodborne
illnesses. We lack information about the foreign consumer’s current exposure to the hazards
associated with contaminated foods across the many countries that currently sell covered foods
to both their domestic and U.S. markets. We also lack information about the likely changes that
covered foreign facilities would introduce to comply with the rule that would be implemented for
food sold to foreign consumers. Compliance could benefit foreign populations, but we lack any
data that would allow us to estimate the health impact; moreover, per OMB Circular A-4, such
benefits would be outside the scope of this regulatory impact analysis.
Comment 8) Some comments assert that we base our regulatory impact analysis on
incomplete evidence and outdated information. They assert that our estimates are riddled with
unsubstantiated and flawed assumptions. As an example, comments took issue with our
statements that
22
FDA lacks actual data on which to base its statements about cleaning protocols: The Food
GMP [Good Manufacturing Practices] survey showed that facilities of all sizes reported
that they conduct cleaning and sanitation operations. To estimate the costs of this
alternative, we assume that the cleaning problems are associated with poor practices, not
from the absence of cleaning. Consequently, we assume that facilities would not incur
the costs for additional cleaning materials, nor would they require any additional time for
cleaning. We assume that workers spend sufficient time cleaning, but do not clean well.
The comment also asserts that we made our statement about cleaning and sanitation
operations based on “expert opinions” elicited from small and arbitrarily selected groups of
individuals with professional backgrounds in the food safety field. The comments assert that the
ERG reports do not demonstrate that the 4 to 12 individuals interviewed about various
compliance-cost issues represent the consensus of opinion in a field in which there are thousands
of professional practitioners, or even a statistically random sample of such professionals. Even if
the opinions elicited were statistically representative of the opinions of other professionals in the
field, there is no basis shown for presuming that the opinions of such professionals accurately
represent the actual conditions in the present-day food manufacturing environment.
Response 8) We agree that our assumption that facilities of all sizes conduct cleaning and
sanitation operations lacks formal data to support our claim. However, there are existing
requirements in 21 CFR 110 for establishments to maintain clean and sanitary conditions of
buildings and fixtures and to clean and sanitize equipment and utensils. The analysis of our RIA
only addresses actual regulatory changes that would cause behavioral changes. We are not
introducing a new requirement to clean and sanitize so no new behavioral change would be
caused by our rule. We clarify this point in our final analysis.

23
We disagree with comments taking issue with the use of an expert elicitation. Expert
elicitations are not polls of experts or statistically random samples. Significant academic
literature about the use of expert elicitations shows that the best practice for conducting an expert
elicitation is to select a relatively small panel of heterogeneous experts where the experts are
chosen on the basis of their reputation, experience, and publications. Our experts were not
selected arbitrarily, randomly, or because they represent a consensus view. Our experts were
selected on the basis of their reputation and experience.
Comment 9) Comments also assert that the key ERG document upon which we rely for
many of our conclusions, “Good Manufacturing Practices for the 21st Century – Food
Processing,” is based on information compiled over 10 years ago. The comments indicate that
both manufacturing practices and scientific knowledge about relevant food safety issues and
preventive control effectiveness have changed significantly over the past 10 years. Comments
assert that FSMA mandates that we provide a science-based regulatory system, and that a truly
science based regulatory system needs to be based on up-to-date empirical data, not information
and opinions of a decade ago.
Response 9) We agree that FSMA mandates a science-based regulatory system, that a
truly science-based regulatory system needs to be based on up-to-date empirical data, and that
manufacturing practices and scientific knowledge about relevant food safety issues and
preventive control effectiveness have changed significantly over the years. The document that
the comment cited was used at an early stage of our thinking to help us identify the likely best
food safety practices to inform policy. Our thinking has evolved considerably since then, in part
because of the many public comments that we received for the study conducted by ERG and
subsequent studies that are considerably more recent. The study conducted by ERG was not used

24
in our PRIA. The key sources of evidence upon which we rely for our analysis are described in
the cost analysis of the PRIA.
Comment 10) Comments claim that our analyses of the impacts on small business
overlook the issue of one-time startup costs, and how one-time startup costs might
disproportionately affect small processors. They assert that our calculation of expenses is based
on annualized costs, which assume that smaller entities have the cash reserves to absorb their
share of these costs in the first year, or they would have the cash flow to allow the depreciation
of the costs. The comments indicate that if we use the same ratio of total first year costs to total
annualized costs for all covered facilities of 61 percent of first-year costs, then first-year costs
would total more than $21,000 for small processors, which is a significant burden.
Response 10) We disagree that our analysis overlooks the issue of one-time startup costs.
Our analysis estimates the costs to a facility for conducting or implementing the initial or first-
year education and training, hazard analysis, and for process, allergen and sanitation controls,
including the development of written procedures for the same, as applicable, among other initial
investments in food safety. We recognize that not just startup but all compliance costs may
represent a significant financial burden. Our provision to allow greater compliance time for
certain facilities, our guidance documents and our plans for outreach, education, and technical
assistance are meant to address the greater financial and technical challenges that smaller
facilities may face. For additional information on our approaches to provide assistance to
minimize the burden on small facilities see the FSMA page of our website. (Ref. 11)
Our analysis annualizes costs using both 3 percent and 7 percent as discount rates.
Estimating the annualized equivalent cost of the addition of both start up and recurring costs
allows a comparison of costs based on a single number, the annualized costs. Our analysis is not
25
based on an assumption that smaller entities have the cash reserves to absorb their share of these
costs in the first year. Our practice of showing equivalent annualized costs is unrelated to any
assumptions about cash reserves or the financial ability of a facility to pay for the compliance
costs of the rule.
Comment 11) Comments state that we displayed bias in favor of large businesses
because our PRIA has insufficiently evaluated less burdensome options for small businesses.
Their review of our PRIA’s coverage of training programs revealed what they thought was a
poor understanding of very small firms because we state that “facilities with less than 20
employees indicated that they do not provide any food safety and sanitation training to newly
hired production employees, while all responding facilities with 500 or more employees
indicated that they provide training of some type.” The comments state that in our description of
the training practices for facilities of different sizes, we state that for the smaller firms, spending
“less than an hour” is included with “no training,” while for larger firms, “less than one hour” is
considered “training.”
Response 11) We concur that our brief summary description of what constitutes “no
training” was not consistent, but we do not agree that this instance alone suggests bias. Our
estimate of the costs for employee training in facilities of all sizes was based on the same
analytical method, to first estimate baseline training practices from our Food GMP survey, and
then to estimate the costs for food production workers on the basis of the same general training
requirement – for 2 hours in food safety and 2 hours in personal hygiene, when the production
workers do not already receive such training. We have removed any inconsistencies in the
description of training for this FRIA.

26
Comment 12) Some comments assert that we underestimated the costs to large facilities.
One comment estimates that our proposal, as currently written, could cost the industry as much
as $18.8 billion to implement in the first year – more than 20 times greater than our first year
implementation cost estimate of $775 million (PRIA estimate). The comment relies on their
understanding of the seafood industry’s experience implementing our seafood HACCP
regulation. Comments estimate the annual cost to adopt a single critical control point to manage
histamine was approximately $95,000 per year, which included the cost of conducting an initial
hazard analysis, training for the HACCP team and employees, performing HACCP monitoring
and verification, and finished product testing, among other activities. They contrast their
experience with our estimate of the cost of our final seafood HACCP rule of $23,000 for
domestic facilities in the first year of implementation and $13,000 for subsequent years (the
comment references FDA Procedures for the Safe and Sanitary Processing and Importing of Fish
and Fishery Products, Final Rule, 60 Fed. Reg. 65096, 65180 (Dec. 18, 1995)).
Response 12) The comment lacks a detailed analysis and data to allow us to sufficiently
understand how the estimate of $18.8 billion was derived. Even if we erred in our estimate to
comply with our seafood HACCP rule, we disagree that it follows that we erred in our analysis
of the costs for this rule.
Comment 13) Some comments also assert that the costs that industry will incur to
implement the preventive controls proposal as it is currently written far exceed the $13,000
average annualized costs per facility identified in our PRIA. They estimate the costs will range
between $364,040 and $524,960 per affected facility to implement only a portion of the
requirements. Their $364,040 estimate for each affected facility includes approximately
$352,040 to manage an average of 20 prerequisite programs (PPs) per facility in a Critical
27
Control Point (CCP) - like manner and $12,000 per facility to rewrite each of its food safety
plans. Similarly, their higher end estimate of $524,960 for each affected facility includes
$512,960 to manage an average of 20 PPs per facility in a CCP-like manner and the same
$12,000 per facility to conduct new hazard analyses and rewrite each of its food safety plans.
Comments also indicated that between $45,332 and $65,895 is spent to manage one CCP
on an annual basis. This cost includes activities related to monitoring, verification, validation,
and recordkeeping. The comment estimated that the average cost for managing other non-CCP
controls, such as PPs, would range from $10,128 to $14,599 per year per control with an average
of approximately 20 PPs per affected facility. Using these numbers, the cost of applying CCP-
like management criteria to a preventive control such as a PP would range from $35,204 to
$51,296. Based on these cost figures, comments indicate that the cost to industry would range
from approximately $704,080 to $1,025,920 per affected facility. Comments maintain that even
if only half of the current food safety controls contained in prerequisite programs were treated as
substantially similar to CCPs, the cost to industry to comply with the proposal as currently
written would be between $352,040 and $512,960 per affected facility. Comments assert that
because none of the costs associated with managing preventive controls in a manner similar to
CCPs are included in the PRIA, our estimate for the industry’s costs to implement the preventive
controls proposal is flawed.
Response 13) We understand that some facilities might incur costs significantly greater
than our estimated average cost of $13,000. Our estimate for the average cost is based on the
total cost for facilities subject to subpart C, plus average costs for all facilities subject to subpart
A and D and the cost to learn about the requirements, divided by the total number of covered
facilities. As an average, it includes many facilities that will not incur any or only minimal costs

28
to comply. Other facilities that lack many requirements will incur larger costs. We estimate
average costs to comply with each provision separately, and we show the average costs in our
summary cost tables for each provision.
The costs provided in the comments are based on the erroneous assumption that the rule
would require all preventive controls to be managed the same as CCPs in existing HACCP plans.
As described in the preamble of our 2014 supplemental notice on the preventive controls rule for
human foods (see 79 FR 58524 at 58541- 58542), we revised our framework for hazard analysis
to clarify that the 2013 proposed preventive controls rule would not have required that all
preventive controls be established at CCPs and that preventive controls include controls, other
than those at critical control points, that persons knowledgeable about the safe manufacturing,
processing, packing or holding of food would, based on the outcome of a hazard analysis,
establish to significantly minimize or prevent a hazard in a food. We do not expect that facilities
with existing food safety plans will need to re-write such plans to comply with the rule. We
introduced the term preventive control management components (i.e., monitoring, corrective
actions, and verification) and provide flexibility to apply these to preventive controls, noting that
they depend on the food, the facility, and the nature of the preventive control. We also stated that
the recordkeeping requirements do not require duplication of existing records if those records
contain all of the required information and satisfy the recordkeeping requirements of the
regulation. Existing records may be supplemented as necessary to include all of the required
information. In addition, the required information does not need to be kept in one set of records.
As described in significant detail in our preamble, we have further revised this rule to provide
additional clarification of our intent. These clarifications should reduce the concern that we
intended processors to protect against any and all possible hazards or that processors must adopt
29
CCPs for all applicable preventive controls. Based on the clarifications in our codified and the
information provided by this comment, we have revised our estimate for the number of processes
or prerequisite programs per large facility from an average of 12 per facility to an average of 20
per facility.
Comment 14) Comments further assert that our PRIA incorrectly assumes that the
majority of large manufacturing facilities currently using HACCP models will incur no cost to
conduct and devise new food safety systems to comply with the proposed rule. Comments state
that a survey of food processors revealed that most affected facilities will need to conduct a new
hazard analysis and make significant modifications to their food safety systems at an estimated
cost of approximately $12,000 per affected facility. Comments cite our estimate that
approximately 66 percent of facilities currently use HACCP systems, with the number varying
largely according to facility size. Comments further cite our estimate that 97 percent of facilities
with 100 to 499 employees operate using HACCP systems, and that 100 percent of facilities with
more than 500 employees employ HACCP-based systems. Accordingly, for the approximately
4,684 domestic facilities with more than 100 employees, we estimate that only three percent
would not be using HACCP-based systems and thus will be required to conduct hazard analyses
to comply. The comments disagree with our calculation that only those facilities not currently
using HACCP models will need to conduct hazard analyses to comply with our rule. They
explain that the proposed rule takes an approach that differs from the way successful food safety
programs are frequently managed today. When conducting a hazard analysis, successful
programs often consider prerequisite programs in concluding that hazards are not “reasonably
likely to occur” – an approach the proposed rule does not appear to address or accommodate.

30
Comments further explain that regulatory standards that change the way facilities with
HACCP systems manage food safety – for example, the way prerequisite programs are factored
into a hazard analysis – would trigger a need for facilities with existing HACCP systems to
reexamine their hazard analyses and food safety plans to comply with the proposal. Comments
estimate that the 458 facilities with more than 500 employees will incur between $3.3 million
and $6.7 million to conduct new hazard analyses and modify their current, successful food safety
systems compared with our estimate of $0.
For the 4,226 facilities with between 100 and 499 employees, comments estimate the
costs to conduct new hazard analyses will be between $18.6 million and $37 million compared
with our estimate of $1.14 million. The comments provide estimates of the average cost of
conducting a new hazard analysis to comply with the preventive controls proposal would be
approximately $12,000 per affected facility. When this $12,000 per affected facility figure is
multiplied by the 4,684 affected facilities with greater than 100 employees, the resulting cost is
approximately $56 million, which is nearly 50 times greater than our $1.14 million cost estimate.
Response 14) We disagree that the rule takes an approach that differs significantly from
the way successful food safety programs are frequently managed today . We proposed a number
of changes in our supplemental notice on the preventive controls rule for human food to provide
flexibility to address concerns about re-writing existing plans or programs to conform to the
requirements of the preventive controls rule (79 FR 58524 at 58542). Specifically, we provided
that preventive controls include controls, other than those at critical control points, that persons
knowledgeable about the safe manufacturing, processing, packing or holding of food would,
based on the outcome of a hazard analysis, establish to significantly minimize or prevent a
hazard in a food; the preventive control management components (i.e., monitoring, corrective

31
actions, and verification) depend on the food, the facility, and the nature of the preventive
control; and the recordkeeping requirements do not require duplication of existing records if
those records contain all of the required information and satisfy the recordkeeping requirements
of the regulation. The proposed rule used three terms (i.e., “hazard,” “known or reasonably
foreseeable hazard,” and the proposed term “significant hazard”) to establish a tiered approach to
the requirements for hazard analysis and risk-based preventive controls. The term “hazard’ is the
broadest of these three terms– any biological, chemical (including radiological), or physical
agent that is reasonably likely to cause illness or injury. To conduct its hazard analysis, a
facility starts by first narrowing down the universe of all potential hazards to those that are
“known or reasonably foreseeable” for each type of food manufactured, processed, packed, or
held at its facility. The outcome of the facility’s hazard analysis is a determination of
“significant hazards” – i.e., the subset of those known or reasonably foreseeable hazards that
require a preventive control. To make this clearer, we have revised the proposed definitions of
“hazard” and “significant hazard,” and changed the term “significant hazard” to “hazard
requiring a preventive control.” We did not use the term “prerequisite program” in the proposed
regulatory text, but we acknowledged that often preventive controls, other than those at critical
control points, are important parts of a food safety system and could include components of
prerequisite programs and/or GMPs, and must therefore be included in the food safety plan that
would be required by this rule. This framework is consistent with existing food safety programs;
we do not expect facilities that have food safety systems that include HACCP plans and
prerequisite programs would need to make many changes to be consistent with the preventive
controls rule.

32
Comment 15) Comments disagree that our rule would not impose additional costs on
large food companies, and indicate that all food companies would incur expenses from revising
existing food safety plans. Comments believe that addressing radiological hazards as a separate
hazard category would require the re-development of ingredient and process assessments and
hazard analyses. Modification of these documents would require a significant dedication of
resources, and create an undue burden on the industry for no food safety improvement.
Response 15) We disagree that all food companies would incur expenses to revise their
food safety plans to include radiological hazards. Our requirement is that you must conduct a
hazard analysis to identify and evaluate known or reasonably foreseeable hazards for each type
of food at your facility to determine whether there are any hazards requiring a preventive control.
As noted in our supplemental proposal (79 FR 58524 at 58557), although radiological hazards
would not be common, we believe that facilities in the past have considered them as chemical
hazards when conducting a hazard analysis for the development of HACCP plans. The revised
regulatory text uses the phrase “chemical (including radiological)” in the definition of “hazard”
and as applicable throughout the regulation. If radiological hazards are a known or reasonably
foreseeable hazard, then those hazards should be treated as other known or reasonably
foreseeable hazards, and would already be included in our cost estimates for conducting the
hazard analysis and adopting risk-based preventive controls.
Comment 16) Comments state that the costs for converting documents, training
materials, contracts, specifications, etc. from 21 CFR Part 110 to 21 CFR Part 117 should be
estimated. They believe that making this seemingly small change does not in and of itself
advance public health and yet adds costs to the proposed regulation. They believe that this
change also would impact local, state and federal agencies as well.

33
Response 16) We acknowledge that we did not formally estimate the cost of converting
or changing documents, training materials, specifications, etc., from 21 CFR Part 110 to 21 CFR
Part 117. We assume that most companies that have contracts, specifications and other such
documents that refer to 21 CFR 110 (Current Good Manufacturing Practice) would periodically
update these documents and that changes to refer to subpart B of 21 CFR 117 instead of 21 CFR
110 would be addressed at that time. We have added a requirement in subpart A (§ 117.4(b)(2))
that each individual engaged in manufacturing, processing, packing, or holding food (including
temporary and seasonal personnel) or in the supervision thereof, must receive training in the
principles of food hygiene and food safety, including the importance of employee health and
personal hygiene, as appropriate to the food, the facility and the person’s assigned duties. We
agree that existing GMP training may need to be updated to be consistent with this requirement
and to reflect changes in the CGMPs. However, we do not believe that this would require major
changes. We amended our regulation for CGMPs (currently established in part 110 (21 CFR part
110)) to (1) modernize it; (2) adjust and clarify what activities fall within the long-standing
exemption from the CGMP requirements for establishments engaged solely in the harvesting,
storage, or distribution of one or more raw agricultural commodities (RACs); (3) delete some
non-binding provisions of current part 110; (4) revise some non-binding provisions to establish
new requirements in proposed part 117, and (5) re-establish the provisions of current part 110 in
new part 117 (21 CFR part 117).
Comment 17) Comments indicate that we failed to estimate the cost for grain elevators to
comply. Such facilities would be covered under the definition of “holding.” Comments state
that the cost of compliance for grain storage facilities would be significant because only a very

34
small fraction of these facilities currently employ food safety programs that incorporate the use
of hazard analysis and preventive control principles.
Response 17) As described in the supplemental proposal (79 FR 58524 at 58536-58537)
we proposed to revise the definition of “holding” because of concerns that our proposed
exemption from the requirements for hazard analysis and risk-based preventive controls for
facilities that are solely engaged in the storage of RACs (other than fruits and vegetables)
intended for further distribution or processing from the requirements would be meaningless for
grain elevators because they perform other activities such as fumigating, cleaning, and drying.
Our proposed revision to “holding” would include activities performed incidental to storage of
food (e.g., activities performed for the safe or effective storage of that food and activities that are
performed as a practical necessity for the distribution of RACs, such as fumigating grain to
control pest infestation during storage; cleaning grain using various mechanisms (sifting, sieving,
and screening); conveying grain throughout the facility; drying grain received with high moisture
content; and blending lots of grain. We are finalizing a definition of holding that addresses the
concerns about grain elevators. We lack data about practices specific to grain elevators but we
believe that almost all would be exempt.
Comment 18) Comments note that proposed § 117.305 requires that electronic records be
kept in accordance with part 11 and such a requirement would create a need to redesign existing
recordkeeping systems for many facilities. This would result in an excessive financial burden on
the industry with no food safety improvement. Comments urge us to consider a simplified
requirement for electronic records to assure the authenticity of such records and exempt Part 117
records from compliance with Part 11. Comments further note that that we did not estimate

35
compliance costs for electronic records in our PRIA. Compliance would result in a significant
cost, if required.
Response 18) We recognize the high cost of electronic record keeping in accordance with
part 11 and based our estimate for recordkeeping costs on establishments adopting the least cost
alternatives, which are typically written records. As discussed in the preamble to the final rule,
the rule would not require compliance with part 11, although the rule does permit the use of
electronic records.
Comment 19) Some comments asserted that we incorrectly estimated the costs of holding
product pending testing results or that we didn’t include those costs in our analysis; the
comments included examples of outside storage costs based on the number of pallets or cases
and type of storage needed.
Response 19) We disagree. We did include in our analysis the costs for storing product as
necessary pending testing results. We expect that facilities will hold product pending the testing
results of ingredient or product testing. We do not expect facilities to hold product pending the
results of environmental monitoring. We did increase holding costs for product testing in this
final rule analysis to make sure we captured the cost of holding and storing product from all
product lines, as may be necessary, for each facility identified. This was a correction to an error
we made in the supplemental PRIA regarding holding costs; we had failed to carry through the
holding costs for all product lines affected.
Number of pallets or cases per day, as suggested by commenters for estimating holding
costs, varies significantly by industry sector and facility size and type. This measure is not
readily available for all industry sectors or facility sizes. We note that using the average daily
value of production per manufacturing line as a measure for holding costs is a measure that is
36
obtainable and more easily applied across all industry sectors; it is an appropriate measure as it
represents the value of the goods.
Comment 20) Some comments disagreed with the number of environmental samples we
estimated facilities would submit to a lab for analysis. Comments submitted examples of the
number of samples and costs for environmental monitoring of non-pathogenic hazards such as
allergens, heavy metals, sulfites, and pesticide residues.
Response 20) We agree that the number of samples will greatly vary based on the size of
the facility and type of product manufactured. We have increased the range of the number of
samples that we use in our estimation for this final analysis. Instead of estimating costs for 5 or
15 samples on a monthly basis for Salmonella and Listeria environmental monitoring, we have
increased samples to 5-10 samples for facilities with less than 100 employees and to 15-20
samples for facilities with over 100 employees. In addition, we have increased sampling
frequency for Salmonella environmental monitoring to an average of 19 sampling occasions per
year (range 12-25 occasions), up from monthly testing (12 testing occasions). We have
increased sampling frequency for Listeria environmental monitoring from monthly testing (12
occasions) to weekly testing (51 occasions annually). We note that environmental monitoring is
meant to be a verification of a preventive control measure such as sanitation controls; not the
control measure itself. We also note that the environmental monitoring provision requirement is
limited to environmental pathogens.
Comment 21) Some comments disagreed with the amount of time that we estimated to
collect both environmental and product samples, suggesting we increase employee time and the
hourly labor rate for this activity. Comments suggested that more employee time would
37
additionally be needed for corrective actions in the event that a positive environmental or product
sample was found.
Response 21) We have increased the time estimated to collect samples from 15 to 20
minutes per sample in response to comments. And while we concur that some facilities may
have multiple people involved in an environmental monitoring or product testing program, it is
the smaller facilities that are more likely to need to begin undertaking these verification activities
as a result of this rule-making. A smaller facility will likely not be able to devote as many
resources to sample collection as larger facilities, thus we believe estimating one employee’s
time to collect samples is appropriate. If environmental monitoring or product testing results
indicate a problem, and a corrective action is warranted, those costs and resource allocations are
covered under that section of the economic analysis. We have increased our hourly labor rate
from the estimates used for the PRIA. Our revised wage rates are now more closely aligned to
what comments suggested.
Comment 22) Some comments suggested that we failed to include enough suppliers when
calculating the annual costs of audits.
Response 22) We calculated costs of an audit on a per supplier basis, so we calculated the
costs based on the number of suppliers; not the number of manufacturers times their individual
number of suppliers. Therefore, we have included in our analysis audit costs to all suppliers that
would likely have an audit conducted as a supplier verification activity based on the nature of
ingredient or type of product they are supplying. However, we do add additional costs in the
final rule estimates for audits to account for the fact that each supplier may send the
documentation from the audit to multiple customers. We also include, as we signaled in the
supplemental PRIA, the costs of farm audits for some farms that are suppliers to receiving
38
facilities. We estimate that 5 percent to 10 percent of farms covered under the produce safety
rule (those that sell to a manufacturer/processor that does not employ a kill-step) will need an
audit as an ingredient supplier to food manufacturing and processing.
Comment 23) Some comments suggested that our per audit cost estimate was reasonable;
while other comments suggested that our audit cost was underestimated. In particular, some
comments recommended an increase in travel costs related to conducting an audit and some
comments recommended an increase in the fees for the actual audit.
Response 23) We increased both the cost per audit and the travel and incidental costs
associated with audits for our final rule analysis. We have increased the audit costs for non-farm
audits from a range of $2600 to $5000 per audit estimated in the supplemental PRIA to a range
of $5000 and $7500 per audit, depending on facility size. We have increased travel and
incidental costs from the estimated $625 per audit in the supplemental PRIA to $1000 for the
final rule.
Comment 24) Comments suggested we needed to include some indirect costs for the
opportunity cost of employee time and resources that need to be diverted to give attention to the
auditor conducting the facility audit.
Response 24) We agree that it is likely that at least one employee would need to be
facilitating the audit or auditor in some fashion to complete the audit. We have added these
opportunity costs to our analysis.
Comment 25) Some comments were concerned that we did not include the costs of
corrective actions that resulted from supplier audits.
Response 25) We agree that costs of corrective actions as the result of an audit should be
included and have added those costs to the final rule audit cost estimates. We base our corrective

39
actions costs on those used in the corrective actions section of this analysis and, in the case of
farms, the costs of corrective actions for farms as estimated under the produce safety rule.
Comment 26) Some comments asserted that the costs of sampling for ingredient testing
were too low and did not include the costs for chemical tests for allergens, heavy metals, natural
toxins or unapproved colors or pesticide residues.
Response 26) We have increased the costs of the tests used for pathogen testing of
ingredients for the final analysis. Ingredient testing is a supplier verification activity option; it
will be utilized only if this testing is useful in verifying that the supplier is adequately controlling
the hazard. It is our understanding that industry does not commonly conduct allergen testing on
ingredients to verify supplier controls for allergen cross-contact. It is also our understanding that
it is a usual industry practice to conduct testing for natural toxins as appropriate to the
commodity and, where existing commodity programs address natural toxins (e.g., aflatoxin in
peanuts, mycotoxin testing in grains), no additional costs would result as a result of this rule. It
is also our understanding that testing for heavy metals or colors is also already used as necessary.
We have included in the final rule analysis some costs for testing ingredients for pesticide
residues. Domestically supplied ingredients should not be at risk for unapproved pesticides;
foreign supplied ingredients may need this testing as pesticides approved for use on food
commodities varies from country to country.
Comment 27) Comments suggested that the ingredient testing frequency estimated in the
PRIA was accurate on a per ingredient, per supplier basis, but suggested it could vary.
Comments suggested that the number of samples per occasion would likely be higher than four.

40
Response 27) We concur with comments and increased the number of ingredient samples
per sampling occasion to an average of 12 samples per testing occasion for the final rule
analysis.
Comment 28) Some comments were concerned that our testing cost estimate had not
taken into account the cost of the statisticians and food safety experts who would be required to
develop scientifically valid sampling and testing plans. Facilities are required to have a written
supply chain program, which would include the specifics for any sampling or testing plan that
the manufacturer wished to require of its suppliers.
Response 28) We estimate the cost of creating this written document. Small facilities will
likely draw from already developed sampling plans; sources for such estimates are discussed in
the preamble to this rule-making.
F. ECONOMIC ANALYSIS OF THE COST OF ILLNESSES THAT COULD POTENTIALLY BE PREVENTED BY THE RULE
The rule would implement the requirements of FSMA for covered facilities to establish
and implement a food safety system that includes a hazard analysis and risk-based preventive
controls. The primary benefit of this rule would be an expected decrease in the incidence of
illnesses caused by the manufacturing, processing, packing or holding of human food. While
quantification of the human health benefits derived from this rule is difficult and complex, for
the purpose of this analysis, we developed a conceptual framework that describes how
implementing this rule would likely reduce the level of foodborne illness. Estimating the human
health benefits from the rule’s reduction of foodborne illness would require the following: (1) a
measure for the current risk of foodborne illnesses attributable to FDA-regulated food under the
scope of this rule; (2) a measure of lost health as measured by morbidity and mortality effects
41
attributable to foodborne illnesses; (3) a value of lost health; (4) the changes from baseline food
manufacturing practices due to the rule; and (5) an estimate for the effectiveness of the
preventive controls in preventing foodborne illnesses that would otherwise have occurred.
1. Baseline Risk of Foodborne Illness To estimate the number of baseline illnesses attributable to only foods under the scope of
this rule-making, we begin with only those outbreaks and food allergic reactions that we can
directly attribute to FDA-regulated foods that are manufactured, processed, packed or held in
food facilities. Table 3 presents all outbreaks, organized by food commodity and agent which can
be linked to foods under the scope of this rule-making based on illnesses recorded in FDA’s
outbreak database, which does not include unidentified or unreported cases. It does not include
any outbreaks linked to handling or storage at retail establishments, restaurants, or homes. In
total, for the years 2003-2012, there were 4,314 illnesses from 58 separate outbreaks that are
linked to foods that fall under the scope of this rule-making (Ref 8); this averages out to about
5.8 outbreaks, 431 illnesses, and 3.5 deaths per year.
We use outbreak data from 2003-2012 because they represent the most current and
comprehensive data available. We are unable to look at years beyond 2012, because the full
outbreak data from CDC after 2012 has not been completely collected, sorted, cleaned, and made
available for public use. We do not go back further because there are regulations in the industry
that took effect prior to these dates, and we want to look at a baseline estimate with all current
regulations in place and functioning. Additionally, collection methods by both FDA and CDC
have improved vastly in recent years, and data further back may be more subject to
underreporting biases. Table 3 summarizes our outbreak data for the illnesses attributed to foods
covered under the scope of our rule.
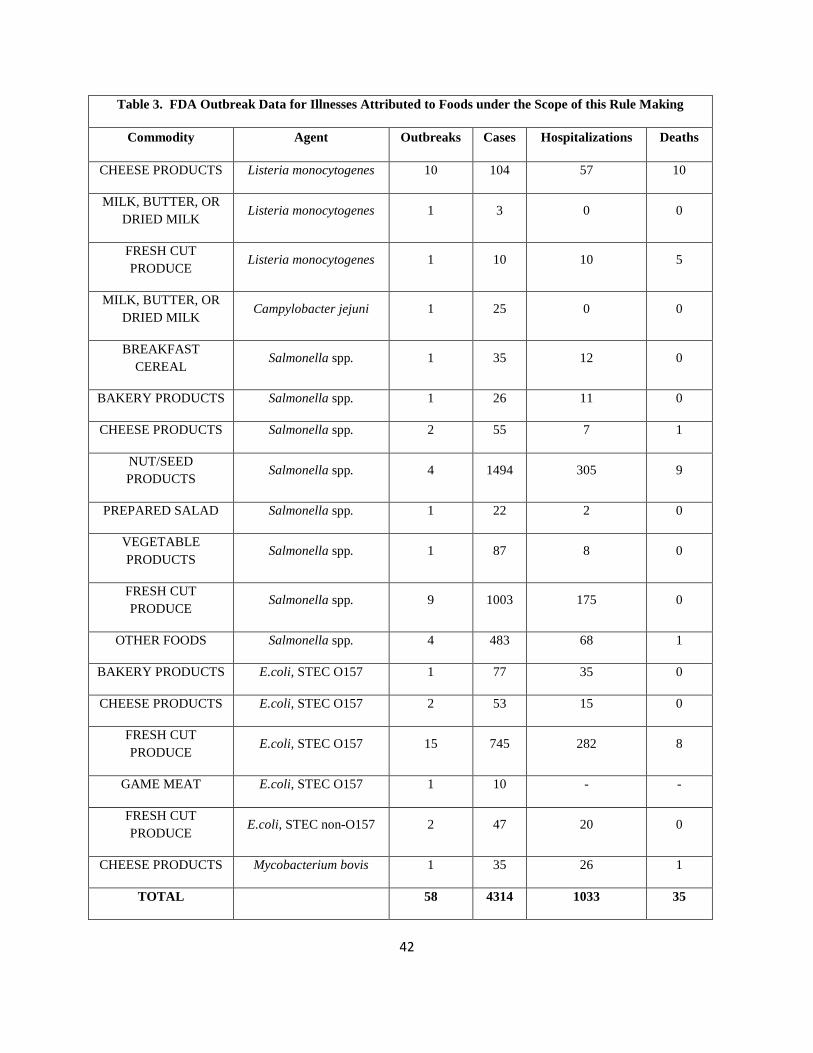
42
Table 3. FDA Outbreak Data for Illnesses Attributed to Foods under the Scope of this Rule Making
Commodity Agent Outbreaks Cases Hospitalizations Deaths
CHEESE PRODUCTS Listeria monocytogenes 10 104 57 10
MILK, BUTTER, OR DRIED MILK
Listeria monocytogenes 1 3 0 0
FRESH CUT PRODUCE
Listeria monocytogenes 1 10 10 5
MILK, BUTTER, OR DRIED MILK
Campylobacter jejuni 1 25 0 0
BREAKFAST CEREAL
Salmonella spp. 1 35 12 0
BAKERY PRODUCTS Salmonella spp. 1 26 11 0
CHEESE PRODUCTS Salmonella spp. 2 55 7 1
NUT/SEED PRODUCTS
Salmonella spp. 4 1494 305 9
PREPARED SALAD Salmonella spp. 1 22 2 0
VEGETABLE PRODUCTS
Salmonella spp. 1 87 8 0
FRESH CUT PRODUCE
Salmonella spp. 9 1003 175 0
OTHER FOODS Salmonella spp. 4 483 68 1
BAKERY PRODUCTS E.coli, STEC O157 1 77 35 0
CHEESE PRODUCTS E.coli, STEC O157 2 53 15 0
FRESH CUT PRODUCE
E.coli, STEC O157 15 745 282 8
GAME MEAT E.coli, STEC O157 1 10 - -
FRESH CUT PRODUCE
E.coli, STEC non-O157 2 47 20 0
CHEESE PRODUCTS Mycobacterium bovis 1 35 26 1
TOTAL 58 4314 1033 35

43
Table 4 presents our estimation of the annual number of illnesses attributable to foods
that would fall under the scope of this rule-making; the estimates are based on FDA outbreak
data combined with CDC outbreak data2 (Ref 9) and adjusted for unidentified pathogens. While
the FDA database contains information on only 58 outbreaks during the 2003-2012 period
attributable to foods covered by this rule, it is likely that there are many more unidentified or
unreported cases. To deal with this undercounting, we have developed a method to extrapolate
from the number of reported outbreaks to an estimated total number of cases associated with the
food covered by this rule. The method is described below.
To estimate the number of total illnesses associated with FDA-regulated processed foods,
we employ a two-step calculation: First, to determine the percent of illness attributable to
processed foods, we examine FDA-specific outbreak data and the whole universe of identified
pathogen illnesses, accounting for all outbreaks associated with an identified food vehicle.
Dividing the number of observed FDA illnesses by the total gives us the percentage attributable
to FDA. This number is then multiplied by Scallan et al.’s estimate of the total annual incidence
of each specific foodborne pathogen (Ref. 14). This step corrects for numerous downward biases
in the CDC database of illnesses such as under-reporting of illness and under-identification of a
foodborne illness. Multiplying the percentage attributable to FDA by the annual incidence yields
the annual estimated illnesses attributable to FDA-regulated processed food.
We have already adjusted our illness estimates to eliminate any illnesses due to products
produced by exempt facilities (e.g., we do not include illnesses due to contamination of seafood).
2 CDC outbreak data does not allow us to differentiate outbreaks by the source of contamination. To that extent, CDC data possibly includes outbreaks related to contamination of FDA-regulated food that were linked to handling or storage at retail establishments, restaurants, or homes.

44
To further adjust our estimate of illnesses to eliminate any illness that may be caused by a
qualified facility, we use data from Dun &Bradstreet (D&B). (Ref. 15) D&B data show facilities
with revenues of more than $1,000,000 account for more than 99.4 percent of the total sales.
Thus, less than 0.6 percent of the food sold will be from facilities that are “qualified” as very
small businesses (VSB). If the marginal risk of illnesses associated with a unit of output were
distributed uniformly across facilities,3 then we could see a total reduction in preventable
illnesses from processed foods of about 0.6 percent.
We multiply the total number of estimated preventable illnesses attributable to FDA-
regulated processed foods by 4 to obtain a number of unidentified illnesses, which is consistent
with Scallan et al., who estimate that unidentified illnesses make up about 80 percent of all
foodborne illnesses. Using this calculation, the total number of preventable foodborne illnesses
caused by microbial contamination of FDA-regulated processed food is estimated to be 860,083.
Table 4 shows our estimate for the annual number of illnesses attributable to foods covered
under the scope of this rule.
Table 4. Estimated Annual Number of Illnesses Attributable to Food Under the Scope of this Rule-Making
Agent FDA Cases (2003-2008)
Total Cases (2003-2008)
Percentage Attributable
to FDA Products
Estimated Annual
Foodborne Illnesses
(Scallan)
Estimated Illnesses
Attributable to FDA
Products
Estimated Illnesses
Attributable to FDA
Products Covered by
this Rule
Listeria monocytogenes
117 361 32% 1,680 545 542
Mycobacterium bovis
35 35 100% 54 54 54
3 There has been no evidence to suggest that the marginal risk of illness from a unit of output from a large facility is smaller or larger than the marginal risk of illness from a unit of output from a small facility.
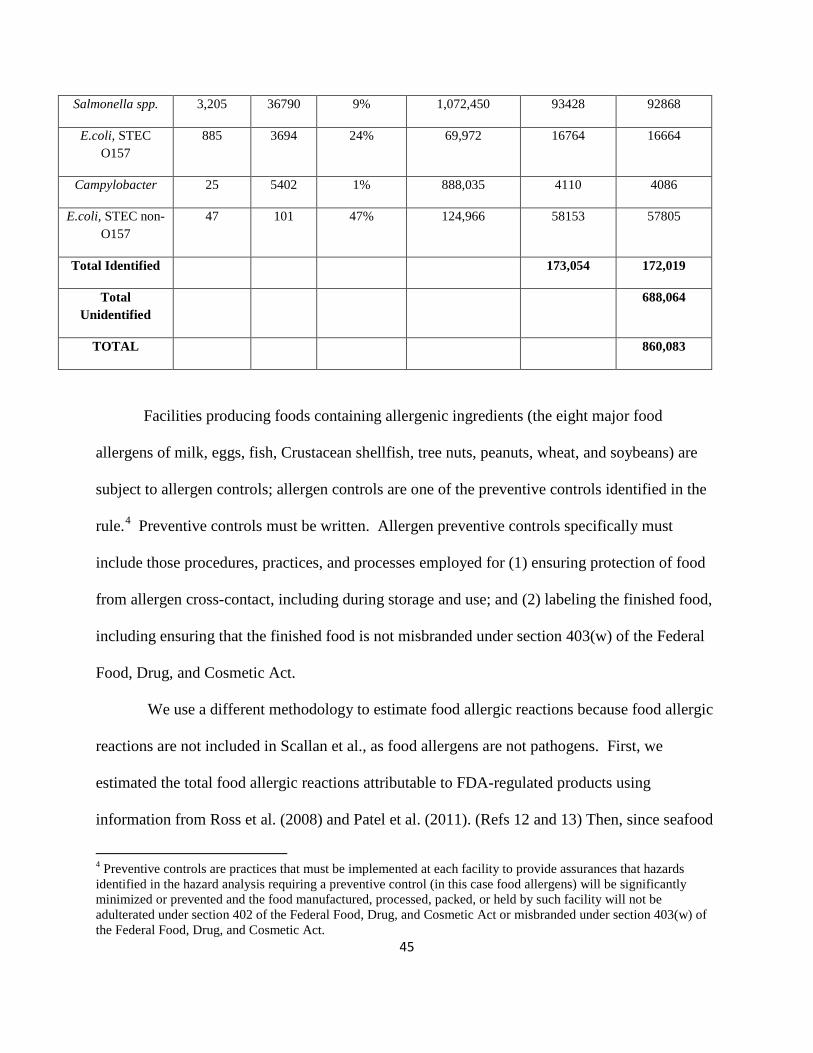
45
Salmonella spp. 3,205 36790 9% 1,072,450 93428 92868
E.coli, STEC O157
885 3694 24% 69,972 16764 16664
Campylobacter 25 5402 1% 888,035 4110 4086
E.coli, STEC non- O157
47 101 47% 124,966 58153 57805
Total Identified 173,054 172,019
Total Unidentified
688,064
TOTAL 860,083
Facilities producing foods containing allergenic ingredients (the eight major food
allergens of milk, eggs, fish, Crustacean shellfish, tree nuts, peanuts, wheat, and soybeans) are
subject to allergen controls; allergen controls are one of the preventive controls identified in the
rule.4 Preventive controls must be written. Allergen preventive controls specifically must
include those procedures, practices, and processes employed for (1) ensuring protection of food
from allergen cross-contact, including during storage and use; and (2) labeling the finished food,
including ensuring that the finished food is not misbranded under section 403(w) of the Federal
Food, Drug, and Cosmetic Act.
We use a different methodology to estimate food allergic reactions because food allergic
reactions are not included in Scallan et al., as food allergens are not pathogens. First, we
estimated the total food allergic reactions attributable to FDA-regulated products using
information from Ross et al. (2008) and Patel et al. (2011). (Refs 12 and 13) Then, since seafood
4 Preventive controls are practices that must be implemented at each facility to provide assurances that hazards identified in the hazard analysis requiring a preventive control (in this case food allergens) will be significantly minimized or prevented and the food manufactured, processed, packed, or held by such facility will not be adulterated under section 402 of the Federal Food, Drug, and Cosmetic Act or misbranded under section 403(w) of the Federal Food, Drug, and Cosmetic Act.

46
producers are not subject to the requirements for food allergen controls in the rule, we reduced
our estimate of the total number of allergic reactions that involve FDA-regulated products
subject to this rule-making by an additional 24 percent based on Ross et al.’s estimate of the
share of food allergic reactions annually related to shellfish consumption (93,632 x 0.76 =
71,160).
Finally, to examine just those allergic reactions that are due to foods under the scope of
this rule-making and those reactions that the allergen controls may help reduce we use
information on unsolicited calls from consumers to the Food Allergy and Anaphylaxis Network
(FAAN). (Ref. 18) Out of 206 phone calls related to problems with packaged food, 28 percent of
calls were due to a product that contained an unlabeled allergen (possible cross-contact during
manufacturing),5 26 percent were due to a visible ingredient in the product that was not disclosed
on the label, and 7 percent were due to completely wrong contents in the package.6 Thus, we
estimate that on an annual basis this rule making could help reduce some portion of 43,408
allergic reactions ((71,160 x 0.28 = 19,925) + (71,160 x 0.26 = 18,502) + (71,160 x 0.07 =
4,981)). Our estimate does not account for those first-time allergic reactions that occur when
consumers are unaware that they are allergic to one or more of the eight major allergens. We
lack data about how many annual reactions are due to consumers with first-time reactions. These
first-time reactions are presumably not because of unintentional contamination, e.g., cross-
contact, or undeclared allergens in their processed food, and therefore, presumably not avoidable
5Among the episodes of cross-contact, 65 percent were called to FAAN’s attention because of otherwise unexplained reactions to the product and 35 percent were based on consumer initiated calls to the manufacturer. The potential for error was confirmed by the company in 88 percent of these incidents (e.g., shared processing equipment). (Ref. 17) 6Other problems reported included, allergen newly disclosed on the label (22 percent), Outer package label different from individual package label inside (6 percent), ambiguous terminology (5 percent), reaction from milk product labeled “Pareve” (3 percent), label in English placed over foreign language label (1.5 percent), and different package sizes of same product have different ingredients (1.5 percent). (Ref. 17)

47
by our rule. This is presented in Table 5.
Table 5. Estimated Number of Allergic Reactions Attributable to FDA-Regulated Foods Under the Scope of this rule-making
Percent of cases
annually
Total Cases Annually Average Annually
Allergen reactions from 8 major food allergens due to packaged food
28,359-158,904 93,632
Reactions due to seafood
24% 6,806-38,137 22,472
Reactions less seafood
21,553-120,767 71,160
Cross-contact from unlabeled allergen
28% 6,035-33,815 19,925
Visible ingredient in product not declared on label
26% 5,604-31,399 18,502
Wrong contents in package
7% 1,509-8,454 4,981
Total reactions that may be reduced due to this rule-making
13,148-73,668 43,408
We estimate the cost of reducing foodborne illnesses from processed foods by
multiplying the annual number of illnesses per pathogen by the estimated cost per case. The
estimated cost per case is a pathogen-specific estimate of the dollar burden that a typical case of
this particular foodborne illness places on an individual. (Ref. 8) Table 6 presents the burden of
illness attributable to microbial contamination of and undeclared allergens in FDA-regulated
processed foods. Column two contains the total number of attributed illnesses, previously
calculated. This number is multiplied by the expected dollar loss per case, in column three, to
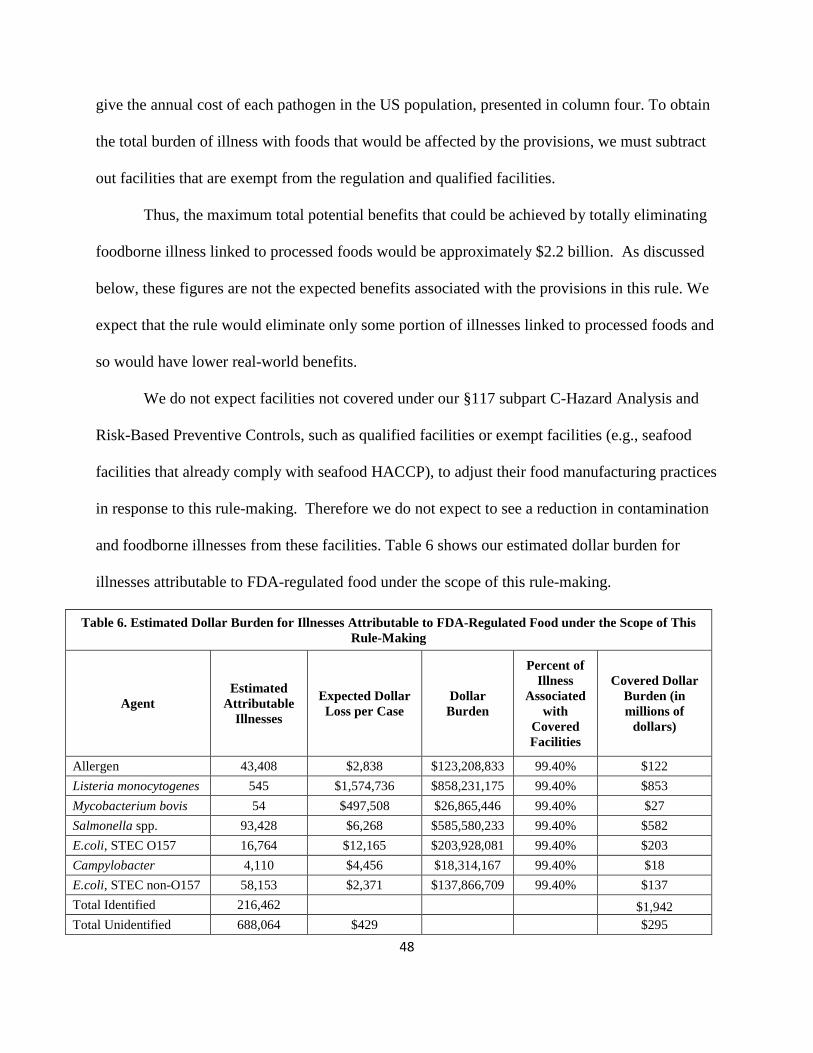
48
give the annual cost of each pathogen in the US population, presented in column four. To obtain
the total burden of illness with foods that would be affected by the provisions, we must subtract
out facilities that are exempt from the regulation and qualified facilities.
Thus, the maximum total potential benefits that could be achieved by totally eliminating
foodborne illness linked to processed foods would be approximately $2.2 billion. As discussed
below, these figures are not the expected benefits associated with the provisions in this rule. We
expect that the rule would eliminate only some portion of illnesses linked to processed foods and
so would have lower real-world benefits.
We do not expect facilities not covered under our §117 subpart C-Hazard Analysis and
Risk-Based Preventive Controls, such as qualified facilities or exempt facilities (e.g., seafood
facilities that already comply with seafood HACCP), to adjust their food manufacturing practices
in response to this rule-making. Therefore we do not expect to see a reduction in contamination
and foodborne illnesses from these facilities. Table 6 shows our estimated dollar burden for
illnesses attributable to FDA-regulated food under the scope of this rule-making.
Table 6. Estimated Dollar Burden for Illnesses Attributable to FDA-Regulated Food under the Scope of This Rule-Making
Agent Estimated
Attributable Illnesses
Expected Dollar Loss per Case
Dollar Burden
Percent of Illness
Associated with
Covered Facilities
Covered Dollar Burden (in millions of
dollars)
Allergen 43,408 $2,838 $123,208,833 99.40% $122 Listeria monocytogenes 545 $1,574,736 $858,231,175 99.40% $853 Mycobacterium bovis 54 $497,508 $26,865,446 99.40% $27 Salmonella spp. 93,428 $6,268 $585,580,233 99.40% $582 E.coli, STEC O157 16,764 $12,165 $203,928,081 99.40% $203 Campylobacter 4,110 $4,456 $18,314,167 99.40% $18 E.coli, STEC non-O157 58,153 $2,371 $137,866,709 99.40% $137 Total Identified 216,462 $1,942 Total Unidentified 688,064 $429 $295

49
Total 904,526 $2,237
For several reasons, the estimates of the cost burden attributed to foods under the scope
of this rule on an annual basis may not provide a full accounting. First, we only have detailed
information on illnesses caused by bacterial pathogens, viruses, and toxins. We do not have
detailed information on injuries that might be the result of physical contaminants in
manufactured food products. We also do not have information on foodborne illnesses or
conditions that would be the result of chronic exposure to a food contaminant such as pesticide
residues or mycotoxins, where illness would likely only result over time. While we note that the
controls established in this rule are intended to prevent these sorts of contamination, we are
aware of no evidence that would indicate that these are significant problems at this time.
Secondly, our starting point, the FDA outbreak database, represents only illnesses where
the cause of the food contamination could be directly linked to foods under the scope of this rule.
This creates a smaller than probable weighting factor when estimating FDA-regulated foods’
share of total foodborne illnesses from the CDC outbreak database. In some instances,
foodborne illnesses in the FDA outbreak database that we did not use in the estimation (i.e., the
problem was attributed to retail or in the household) may have had a root cause at the
manufacturing level. For example, consumer mishandling of a product that led to the sufficient
growth of bacteria in a food to cause illness could have been ultimately caused by food
contamination (and the bacteria’s survival) during processing. We are unable to determine how
significant this confounding factor may be.
Finally, the FDA outbreak database is limited to cases where the FDA got involved in the
outbreak. Again, this creates a smaller than possible weighting factor for estimating the total

50
FDA-regulated foods’ share of illnesses from the CDC outbreak database; we have full
information on reported foodborne outbreaks but limited access to all outbreaks that may have
been caused by FDA-regulated products or processes. FDA is called in to help with foodborne
outbreaks and trace backs at the request of CDC or the state and local health authorities.
Intrastate outbreaks may only be responded to by state and local authorities and may not be
reported to CDC. If the outbreak was not reported to CDC or FDA, and FDA was not requested
to assist state and local authorities with a particular outbreak, FDA will not have information on
that particular outbreak in our internal database. Consequently, we assume that the proportion of
illnesses attributable to FDA-regulated products is the same for outbreaks in which FDA’s
involvement is requested as it is in outbreaks for which FDA’s involvement is not requested.
Outbreaks associated with FDA-regulated foods under the scope of this rule-making have an
average of 74 illnesses while all outbreaks have an average of 20 illnesses. This difference could
indicate that many of the smaller outbreaks, which are not associated with an identified food
vehicle or pathogen, and thus excluded from our counts, could be attributable to FDA-regulated
foods under the scope of this rule-making. It could also be that FDA’s presence is most
frequently requested when an outbreak is likely to be traced to products that we regulate.7
2. Reduced Foodborne Illness due to Implementation of the Rule As described in the preamble in greater detail, this rule establishes requirements for food
safety plans; hazard analysis; preventive controls (including process controls, sanitation controls,
7 Scallan et al (Ref. 14) includes multipliers to account for the underreporting of all foodborne illnesses diagnosed in the U.S. If we have the correct proportion due to FDA foods, their numbers would appropriately reflect the burden of FDA products. However, we may be identifying an artificially low portion of illnesses due to FDA products because we are missing information. Because we are missing information, this means we may be taking an artificially low percentage of Scallan et al.’s full characterization on illnesses, making our numbers potentially lower than reality.

51
allergen controls, and supplier controls); monitoring; corrective actions; verification; and
recordkeeping (including documentation). We developed a conceptual framework for evaluating
the potential cases of foodborne illness that would be prevented as a result of implementing this
rule. The effectiveness of this regulation and the corresponding reduction in food contamination
and foodborne illness will depend on how successfully preventive controls address the sources of
contamination and how well the controls are implemented.
We expect that components of the rule would work together as part of an interrelated
system to reduce the risk of food contamination. (The rule also functions as one component of
several food safety regulations required by FSMA.) Some of the rule’s individual provisions may
be partial substitutes for one another, while others complement each other. Although the
activities required by the rule are distinct, the effects of each action are related.
3. Analysis of Benefits
We lack published independent studies that estimate the change in health outcomes from
adopting our preventive controls across the food industry. Because of the absence of
independent studies that quantify health benefits, we conducted a break-even calculation. In
addition to our break-even calculation, we attempted to quantify the benefits of this rule-making
in three alternative ways by using an: internal expert elicitation, external expert elicitation,
(Ref.4, 5) and by conducting a difference-in-difference analysis to analyze pre- and post-HACCP
regulation (Ref. 6) effects on foodborne versus non-foodborne illnesses. Our attempts to
quantify health benefits using the results of each of these studies are described more fully in Ref
7. Due to the data constraints, the estimates of benefits contain a large degree of uncertainty.
Break-Even Calculation

52
For the rule to be cost effective, the rule would have to prevent $382 million worth of
foodborne illness (about 17 percent or 157,000 illnesses) on an annual basis to cover the
domestic costs to industry (with a discount rate of 7 percent). When costs to foreign facilities are
included with domestic costs, the rule would have to prevent $1.2 billion worth of foodborne
illness (about 55 percent or 490,000 illnesses) on an annual basis using a discount rate of 7
percent.
For the rule to be cost effective using a discount rate of 3 percent, it would have to prevent
$381 million worth of foodborne illness (about 17 percent or 156,000 illnesses) on an annual
basis to cover the domestic costs to industry. When costs to foreign facilities are also included
with domestic costs, the rule would have to prevent $1.2 billion worth of foodborne illness
(about 55 percent or 490,000 illnesses) on an annual basis at a discount rate of 3 percent.8
G. ECONOMIC ANALYSIS COSTS: OVERVIEW OF COST CONVENTIONS AND FACILITIES COVERED
1. Measuring Costs
For the final rule, we updated the cost measurements used for the proposed rule based on
the best available information from government, industry, academic sources, and the comments.
As with the PRIA, we list some common conventions used throughout the cost analysis here.
• All wage rates used come from the Bureau of Labor Statistics, Occupational Employment
Statistics, May 2013, National Industry-Specific Occupational Employment and Wage
8 As mentioned in the regulatory impact analysis of the FSMA Foreign Supplier Verification Program (FSVP) proposed rule, that rule, once finalized, is not anticipated to yield benefits of its own, but will instead enhance the effectiveness of other FSMA rulemakings; it would therefore be appropriate to include some portion of FSVP costs in this break-even assessment, which would increase the number of illnesses that must be avoided for benefits to equal or exceed costs. However, we do not have an estimate of the portion of FSVP costs that would need to be added to this rule-making to make that calculation.
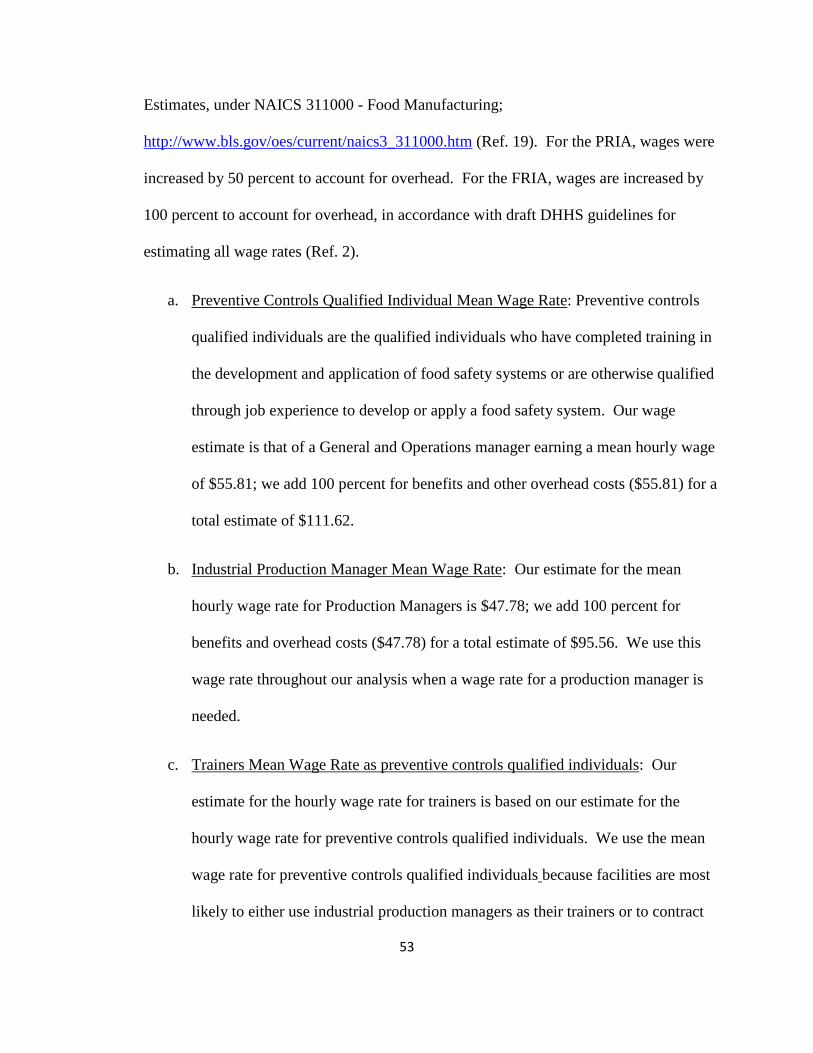
53
Estimates, under NAICS 311000 - Food Manufacturing;
http://www.bls.gov/oes/current/naics3_311000.htm (Ref. 19). For the PRIA, wages were
increased by 50 percent to account for overhead. For the FRIA, wages are increased by
100 percent to account for overhead, in accordance with draft DHHS guidelines for
estimating all wage rates (Ref. 2).
a. Preventive Controls Qualified Individual Mean Wage Rate: Preventive controls
qualified individuals are the qualified individuals who have completed training in
the development and application of food safety systems or are otherwise qualified
through job experience to develop or apply a food safety system. Our wage
estimate is that of a General and Operations manager earning a mean hourly wage
of $55.81; we add 100 percent for benefits and other overhead costs ($55.81) for a
total estimate of $111.62.
b. Industrial Production Manager Mean Wage Rate: Our estimate for the mean
hourly wage rate for Production Managers is $47.78; we add 100 percent for
benefits and overhead costs ($47.78) for a total estimate of $95.56. We use this
wage rate throughout our analysis when a wage rate for a production manager is
needed.
c. Trainers Mean Wage Rate as preventive controls qualified individuals: Our
estimate for the hourly wage rate for trainers is based on our estimate for the
hourly wage rate for preventive controls qualified individuals. We use the mean
wage rate for preventive controls qualified individuals because facilities are most
likely to either use industrial production managers as their trainers or to contract
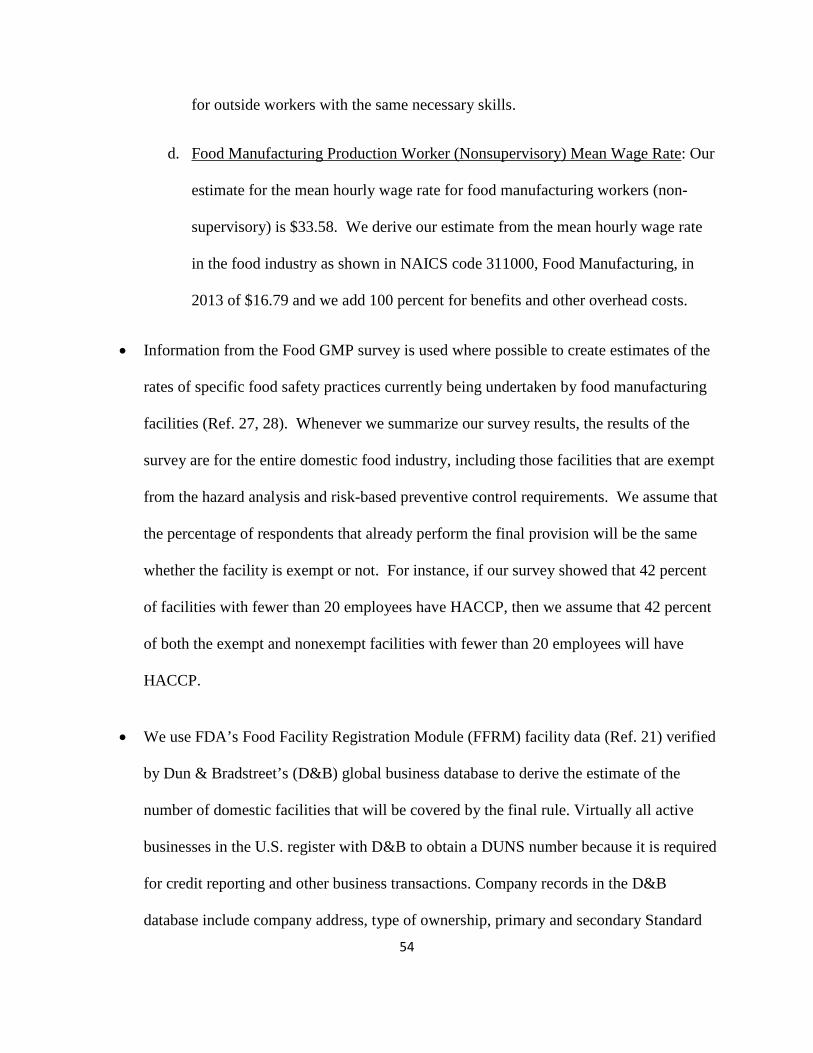
54
for outside workers with the same necessary skills.
d. Food Manufacturing Production Worker (Nonsupervisory) Mean Wage Rate: Our
estimate for the mean hourly wage rate for food manufacturing workers (non-
supervisory) is $33.58. We derive our estimate from the mean hourly wage rate
in the food industry as shown in NAICS code 311000, Food Manufacturing, in
2013 of $16.79 and we add 100 percent for benefits and other overhead costs.
• Information from the Food GMP survey is used where possible to create estimates of the
rates of specific food safety practices currently being undertaken by food manufacturing
facilities (Ref. 27, 28). Whenever we summarize our survey results, the results of the
survey are for the entire domestic food industry, including those facilities that are exempt
from the hazard analysis and risk-based preventive control requirements. We assume that
the percentage of respondents that already perform the final provision will be the same
whether the facility is exempt or not. For instance, if our survey showed that 42 percent
of facilities with fewer than 20 employees have HACCP, then we assume that 42 percent
of both the exempt and nonexempt facilities with fewer than 20 employees will have
HACCP.
• We use FDA’s Food Facility Registration Module (FFRM) facility data (Ref. 21) verified
by Dun & Bradstreet’s (D&B) global business database to derive the estimate of the
number of domestic facilities that will be covered by the final rule. Virtually all active
businesses in the U.S. register with D&B to obtain a DUNS number because it is required
for credit reporting and other business transactions. Company records in the D&B
database include company address, type of ownership, primary and secondary Standard

55
Industry Classification (SIC) codes, number of employees, sales volume and other
relevant business data. (Ref. 15)
• To estimate the number of foreign facilities that would be covered by our rule, we use the
number of foreign facilities that were registered with FDA’s Food Facility Registration
Module (FFRM) database at the time of our analysis in February 2015. (Ref. 21)
• To estimate the number of mixed or co-located facilities, we revised and extended the
analysis that was used for the PRIA, as we describe in our response to comment 4. We
merged the most recent data as of late 2014 from D&B and FDA’s FFRM data when both
have an SIC code for manufacturer/processor. To better account for farms that also
perform processing activities, we included Census of Agriculture (Ag Census) data both
to provide a count of total U.S. farms and to estimate the number of farms conducting
food processing activities, to the extent that the data identifies processing activities. We
also included the Agricultural Resource Management Survey (ARMS) data because it
included questions about some processing activities for select commodities. As we also
mention in response to comment 4, because the Ag Census and ARMS are silent about
many processing activities, we obtained estimates from commodity specialists at trade
associations, at USDA, and at universities with in-depth knowledge of the processing
activities for specific agricultural commodities. We also relied on numerous directors of
promotion and marketing boards, marketing agreements, and marketing orders for
various vegetables, fruits, and tree nuts to request information from them about the
portion of farms that conduct food processing activities. We now estimate there are
approximately 33,500 farms that might be considered mixed-type facilities. (Ref. 9)

56
• We annualize compliance costs over a 10 year horizon at a 7 percent discount rate and at
a 3 percent discount rate.
• We use information from three expert elicitations to help estimate costs of the final rule:
a. Foreign Food GMPs – Expert Elicitation Results – September 3, 2009 (Ref. 22)
b. Economic Analysis of New FDA Food cGMP Regulations and Related
Legislative Initiatives – Subtask 2: Expert Opinions on Current Food
Manufacturing Practices – June 30, 2010 (Ref. 23)
c. Economic Analysis of New FDA Food cGMP Regulations and Related
Legislative Initiatives – Subtask 3: Expert Opinions on Current Food
Manufacturing Practices of Distributors/Consolidators/Wholesalers and Packers
of Produce and Processed Foods – September 17, 2010 (Ref. 24)
• We estimate that all facilities operate 50-52 weeks per year.
• We use Table 3-1: Typical Food Manufacturing Facility Characteristics, from Evaluation
of Recordkeeping Benefits for Food Manufacturers, Final Report, March 30, 2007 (Ref.
25) in creating estimations of number of products produced by a facility, number of
manufacturing processes per facility, number of raw material and ingredient suppliers per
facility, and number of production lines per facility by food industry sector. Estimates in
this table are based on expert opinion.
• To estimate the recordkeeping costs, the time to perform the various recordkeeping
functions, the frequency of recordkeeping by record type, and the average minutes spent
keeping records by record type, we relied upon FDA’s Evaluation of Recordkeeping
Costs for Food Manufacturers, a recordkeeping cost model that was developed for FDA.

57
The model was used to estimate the costs for a variety of recordkeeping activities that
were needed for several previous food safety related rules (Ref. 26). The basic method of
the model for estimating the average recordkeeping cost is to multiply an estimate for the
average time it takes to prepare a record, which is usually the time it takes to document a
food safety action, by the average wage rate of the workers that are doing the
recordkeeping.
• To estimate the hours necessary to develop written procedures and the hours necessary to
update the written procedures annually, we use Tables 2-4 through 2-10 from FDA’s
Evaluation of Recordkeeping Costs for Food Manufacturers. Estimates in these tables are
based on expert opinion (Ref. 26).
• The main cost analysis focuses solely on the costs of the final rule to domestic facilities
that manufacture, process, pack, or hold human food. We discuss impacts of this final
rule on foreign facilities that manufacture, process, pack, or hold human food for
consumption in the U.S. in section I.11.
2. Coverage of the Analysis
a. All Facilities
i. Description of Facility Data from the proposed rule and supplemental PRIAs
Our estimate for the coverage of the rule was for all facilities required to register with
FDA under section 415 of the FD&C Act with the exception of facilities exempted in accordance
with §117.5 of the rule. We initially estimated that 97,646 domestic and 180,605 foreign
facilities would be covered by the rule, as shown in Table 10. Our estimate of the number of

58
domestic facilities includes all FDA-regulated food establishments, warehouses, and fruit and
vegetable wholesalers (which includes fresh-cut processors) operating in the fifty states, the
District of Columbia, as well as the U.S. territories. The 180,605 foreign facilities include every
facility covered by the proposed rule that shipped food or raw materials and ingredients to the
U.S. in FY2010.
Table 10 - Number of Domestic and Foreign Food Facilities Covered by the Proposed Rule
<20
employees 20 to 99
employees 100 to 499 employees
> 500 employees Total
Foreign Facilities
Number of Food Manufacturers 54,206 9,389 3,948 453 67,996 Number of Warehouses 6,896 880 157 15 7,948 Number of Wholesalers 19,373 2,014 306 9 21,702 Total 80,475 12,283 4,411 477 97,646 180,605
Our estimate for the coverage of the final rule is also for all facilities required to register
with FDA under section 415 of the FD&C Act with the exception of facilities exempted in
accordance with §117.5 of the final rule. We consulted several sources to derive our estimate of
the number of domestic and foreign facilities used in our analysis. Our estimate of the number of
domestic facilities includes all FDA-regulated food establishments, warehouses, and fruit and
vegetable wholesalers (which includes fresh-cut processors) operating in the fifty states, the
District of Columbia, as well as the U.S. territories.
We made a separate estimate for the number of domestic farm mixed-type facilities that
are also food processors under the definitions of this rule. Farms that are also processors are
referred to as mixed-type facilities. We estimate there are approximately 33,500 farms that might
perform one or more of the processing activities that would render them mixed-type facilities.
(Ref. 9)

59
As more fully described in the preamble, farms are not covered by this rule, and the rule
contains special provisions applicable to a farm mixed-type facility that is a small or very small
business. Specifically, a small business that is a farm mixed-type facility is exempt from the
requirements for hazard analysis and risk-based preventive controls if the only activities that it
conducts are the low-risk activity/food combinations listed in § 117.5(g) and (h). A very small
business that is a farm mixed-type facility, but does not satisfy the criteria for the exemptions for
only conducting low-risk activity/food combinations, is eligible for modified requirements,
rather than the full requirements for hazard analysis and risk-based preventive controls.
To estimate the number of foreign facilities covered by the rule, we consulted FDA’s
FFRM, which collects information on all registered importers of FDA-regulated products into
the U.S. in accordance with section 415 of the Federal Food, Drug, & Cosmetic Act (21 U.S.C.
350d). All domestic and foreign facilities that manufacture, process, pack or hold food for
consumption in the United States must biennially register with FDA unless exempted (e.g.,
restaurants). Foreign facilities that export to the U.S. must satisfy all the requirements of this
rule.
ii. Description of Facility Data Updated For the Final Rule
For the final rule analysis, we modified our method for determining the number of
qualified and non-qualified facilities to be more consistent with the language of FSMA. We
originally estimated qualified facilities based on the number of facilities with less than $1 million
in annual sales, rather than the number of firms with less than $1 million in annual sales. The
statute (see section 418(l)(1)(B) of the Act) provides for exemptions from specific rule
requirements based on the size of the firm; “…the facility, including any subsidiary or affiliate of

60
the facility, is, collectively a very small business…” The facility-to-firm adjustment combines
annual sales from individual facilities at the firm level. The effect of this adjustment is that more
facilities will be required to comply with the final rule requirements at any given definition of
“very small business” because they are affiliates of larger firms rather than independent smaller
entities.
In addition to the change in interpretation of the unit of measurement for the very small
business definition for the final rule analysis, we were also able to update our facility count using
FDA’s FRRM. Since the analysis of the original final rule was conducted, FDA has completed
validation of the food facilities registered with the agency using D&B data.9 Therefore, FFRM
facility counts represent the most accurate inventory of facilities subject to this final rule-making.
Table 11 - All Covered Firms for Final PCHF rule: $1M VSB Cut-off
Category
Facilities
Firms Employees Market Share Total
<20 employee
s 20 to 99
employees 100 to 499 employees
> 500 employee
s
Qualified 37,139 36,708 388 36 7
36,603 141,352 0.6%
Non-Qualified
46,685 24,038 16,371 5,517 749
29,918 2,376,492 99.4%
Total 83,819 60,746 16,759 5,553 751
66,521 2,517,844
Table 12 provides a more detailed firm break-out. We note that there is some overlap between
firms that manufacture food and have food storage facilities.
Table 12 - Firms that Manufacture Food: $1M Cutoff
Category Facilities Firms Employees Market 9 In 2008, after evaluating potential alternatives, the FDA Data Standards Council designated Dun & Bradstreet’s DUNS number as the FDA data standard for Universal Business Entity Identifier. Currently, the DUNS system identifies, validates and links to more than 220 million business entities in more than 200 countries around the world.
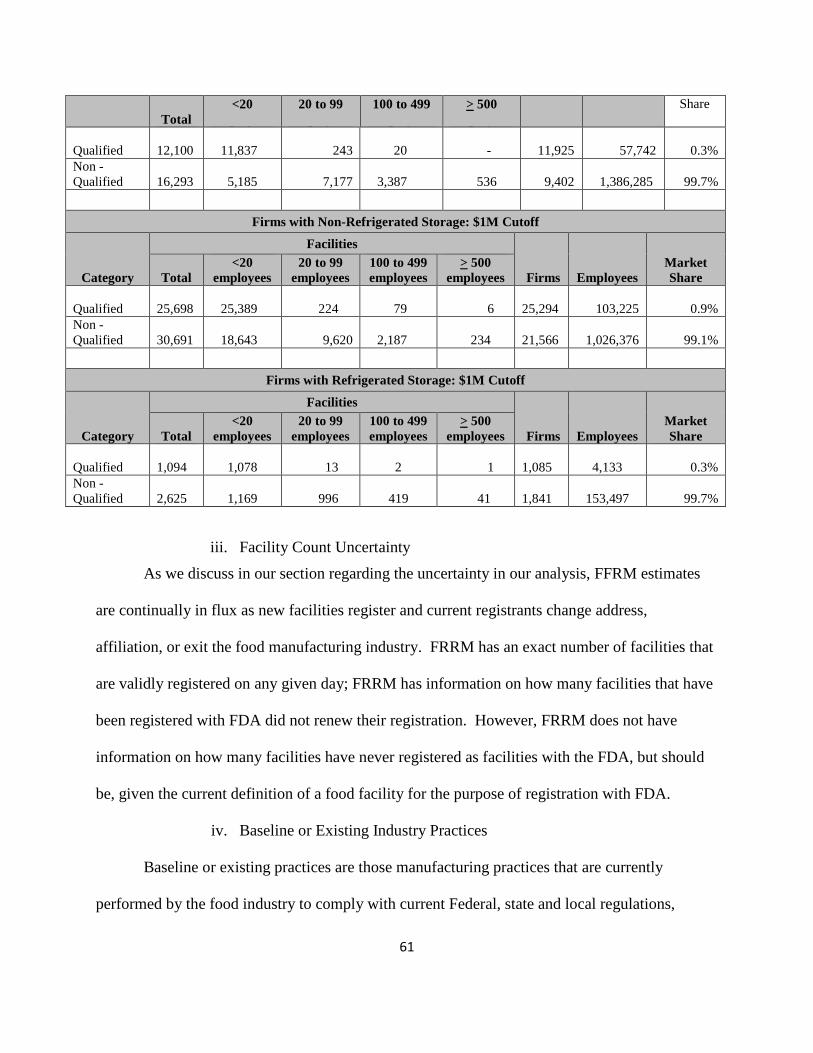
61
Total <20
employees 20 to 99
employees 100 to 499 employees
> 500 employees
Share
Qualified 12,100 11,837 243 20 - 11,925 57,742 0.3%
Non -Qualified
16,293 5,185 7,177 3,387 536 9,402 1,386,285 99.7%
Firms with Non-Refrigerated Storage: $1M Cutoff
Category
Facilities
Firms Employees Market Share Total
<20 employees
20 to 99 employees
100 to 499 employees
> 500 employees
Qualified 25,698 25,389 224 79 6
25,294 103,225 0.9%
Non -Qualified
30,691 18,643 9,620 2,187 234
21,566 1,026,376 99.1%
Firm s with Refrig erated Storag e: $1M Cutoff
Category
Facilities
Firms Employees Market Share Total
<20 employees
20 to 99 employees
100 to 499 employees
> 500 employees
Qualified 1,094 1,078 13 2 1
1,085 4,133 0.3%
Non -Qualified
2,625 1,169 996 419 41
1,841 153,497 99.7%
iii. Facility Count Uncertainty
As we discuss in our section regarding the uncertainty in our analysis, FFRM estimates
are continually in flux as new facilities register and current registrants change address,
affiliation, or exit the food manufacturing industry. FRRM has an exact number of facilities that
are validly registered on any given day; FRRM has information on how many facilities that have
been registered with FDA did not renew their registration. However, FRRM does not have
information on how many facilities have never registered as facilities with the FDA, but should
be, given the current definition of a food facility for the purpose of registration with FDA.
iv. Baseline or Existing Industry Practices
Baseline or existing practices are those manufacturing practices that are currently
performed by the food industry to comply with current Federal, state and local regulations,

62
international and industry-wide standards and the manufacturer’s own private safety and quality
standards. It is necessary to know about the industry’s current practices because the cost of the
rule will be to those facilities that will have to change their current practices in order to comply
with the rule. To learn about the domestic food industry’s baseline manufacturing practices and
to help us estimate the number of facilities that are likely to change practices to comply with the
rule, we hired ERG to conduct a survey of the food industry (Ref. 20).
Participation in the Food GMP survey was by domestic facilities only and participation
was voluntary; respondent identifiers that would permit an association of specific responses to
specific respondents were not accessible to FDA to help ensure the confidentiality and
anonymity of the respondents. The only survey information that FDA received from ERG was
aggregated summary statistical information with no facility identifiers. For more information
about our survey methodology, see FDA supporting statements A & B, dated August 29, 2008
(Refs. 27 and 28) and the final survey report (Ref. 20). In the absence of data to the contrary we
have assumed that conditions in foreign facilities are equivalent to conditions in domestic
facilities.
b. Qualified Facilities
Qualified facilities are subject to the modified requirements in Subpart D § 117.201. A
qualified facility is a facility that has revenues of less than $500,000 on average annually and
sells more than 50 percent of its product to qualified end users (i.e., consumers (in any location)
or to restaurants, and retail food establishments within the same state as the qualified facility or
not more than 275 miles from the manufacturing site). Additionally facilities that meet the FDA
definition of a very small business are qualified facilities. FDA is defining a very small business
as one with less than $1 million annually in sales.

63
i. Number of Qualified Facilities
Tables 11 and 12 show our estimate of the facility breakdown by manufacturers,
warehouses, and wholesalers for facilities that are qualified and facilities that are not qualified.
We were able to employ data from D&B to estimate the number of manufacturers, warehouses,
and wholesalers that reported sales of below $1 million annually to estimate facilities’ employee
numbers.
ii. Choices Available to Qualified Facilities
As previously stated, qualified food facilities do not have to comply with the
requirements for Part 117, Subpart C Hazard Analysis and Risk-Based Preventive Controls.
Qualified facilities are required to submit attestations to FDA that they are qualified facilities,
and they may incur a label change for their products. We estimate that it will be less
burdensome for facilities to attest to their qualified facility status electronically rather than send
information in to FDA by mail. Online, qualified facilities can attest to : 1) their financial
information such as by indicating annual sales for the facility on average are less than the amount
necessary to be a qualified facility under our definition for a very small business and that 2a)
either they have identified potential hazards associated with the foods being processed at their
facility, have implemented preventive controls to address the hazards, and are monitoring the
preventive controls to ensure the controls are effective, or that 2b) they are in compliance with
State, local, county or other applicable non-Federal food safety laws. If potential qualified
facilities decide to follow Option 2b instead of 2a they must, in addition to attesting to
compliance with non-Federal food safety requirements, include on the label of their food
products the name and business address of the facility where the food was manufactured or
processed (or in the case of products without a food label, the notification must appear
64
prominently and conspicuously, at the point of purchase, on a label, poster, sign, placard, or
documents delivered contemporaneously with the food in the normal course of business, or in an
electronic notice, in the case of Internet sales).
Qualified facilities will likely choose Option 2b as the less expensive of the options
available to qualified facilities. Therefore, the costs of this rule to qualified facilities will be: 1)
the cost of attesting to financial information to show that the average annual monetary value of
all food sold plus the market value of human food manufactured, processed, packed, or held
without sale is less than the necessary amount to qualify, 2) the costs of attesting that the facility
is in compliance with State, local, county, or other applicable non-Federal food safety laws, and
3) the costs of making changes to their food labels to include the name and complete business
address, including the street address or P.O. box, city, state, and zip code for domestic facilities,
and comparable full address information for foreign facilities, where the food was manufactured
or processed.
iii. Costs to Qualified Facilities to Attest to Qualified Status
We assume that domestic and foreign facility financial and compliance information will
already be available in the form of tax records, facility accounting records, or some other readily
available records, although the final rule does not specify what documents would be necessary.
It is possible that some qualified facilities will attest to having completed a hazard analysis,
implementing preventive controls, and conduct monitoring at their facilities instead of attesting
that the facility is in compliance with State, local, county, or other law. We do not know how
many qualified facilities, if any, have completed a hazard analysis, implemented preventive
controls, and conduct monitoring. We expect the time to attest to having a hazard analysis to be
similar to attesting to compliance with State, local, county or other applicable non-Federal food
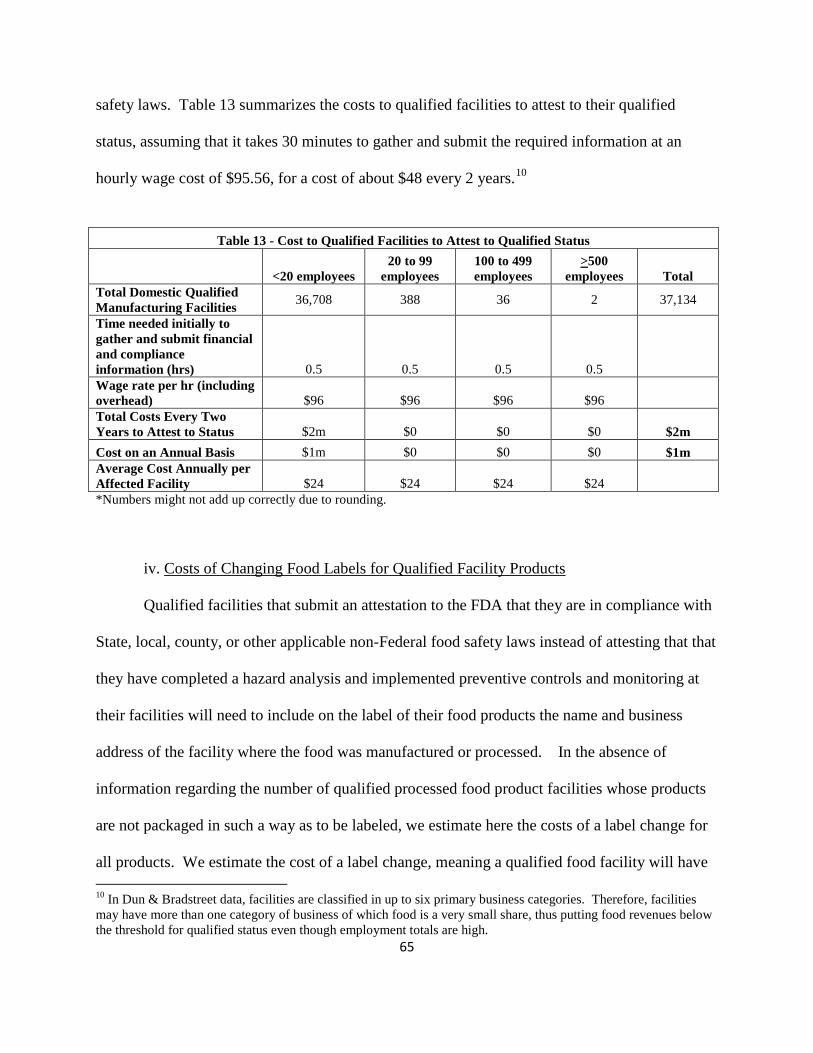
65
safety laws. Table 13 summarizes the costs to qualified facilities to attest to their qualified
status, assuming that it takes 30 minutes to gather and submit the required information at an
hourly wage cost of $95.56, for a cost of about $48 every 2 years.10
Table 13 - Cost to Qualified Facilities to Attest to Qualified Status
<20 employees 20 to 99
employees 100 to 499 employees
>500 employees Total
Total Domestic Qualified Manufacturing Facilities 36,708 388 36 2 37,134
Time needed initially to gather and submit financial and compliance information (hrs) 0.5 0.5 0.5 0.5 Wage rate per hr (including overhead) $96 $96 $96 $96 Total Costs Every Two Years to Attest to Status $2m $0 $0 $0 $2m Cost on an Annual Basis $1m $0 $0 $0 $1m Average Cost Annually per Affected Facility $24 $24 $24 $24 *Numbers might not add up correctly due to rounding.
iv. Costs of Changing Food Labels for Qualified Facility Products
Qualified facilities that submit an attestation to the FDA that they are in compliance with
State, local, county, or other applicable non-Federal food safety laws instead of attesting that that
they have completed a hazard analysis and implemented preventive controls and monitoring at
their facilities will need to include on the label of their food products the name and business
address of the facility where the food was manufactured or processed. In the absence of
information regarding the number of qualified processed food product facilities whose products
are not packaged in such a way as to be labeled, we estimate here the costs of a label change for
all products. We estimate the cost of a label change, meaning a qualified food facility will have 10 In Dun & Bradstreet data, facilities are classified in up to six primary business categories. Therefore, facilities may have more than one category of business of which food is a very small share, thus putting food revenues below the threshold for qualified status even though employment totals are high.

66
two years to change their food labels to include the name and business address where the food
was manufactured. A label change to include facility name and address is considered a minor
label change, e.g., only 1 color is needed. We estimate that every qualified facility will be
producing between 3 and 18 different products (3 to 18 different Stock Keeping Units (SKUs)),
depending on facility size, which will require label changes. We base this estimate on the
average number of production lines per facility by facility size as reported in our Recordkeeping
Benefits Model Final Report (Ref. 25).
The costs of label changes presented here could be an overestimate if some qualified
facilities choose to attest that they have completed a hazard analysis, and implemented
preventive controls and monitoring rather than attesting that they are in compliance with State,
local, county or other applicable non-Federal law. The costs of label changes could be an
underestimate if on average facilities handle more than 3 to 18 labeled products in their facility.
We expect that most qualified facilities will not have completed a hazard analysis and
implemented preventive controls and monitoring, and thus will have to change their labels to
show the name and business address of the facility where the food was produced. Table 14
summarizes the costs to add the facility address to food labels.
Table 14 - Cost to Add Facility Address to Food Labels
<20 employees 20 to 99
employees 100 to 499 employees
>500 employees Total
Total Domestic Qualified Manufacturing Facilities 36,708 388 36 2 37,134
Number of SKUs per Facility 3 7 13 18 Cost per SKU for one-time change $587 $587 $587 $587 Total Costs of One-Time Label Change $65m $2m $<1 $0 $67m Annualized Total Costs @ 7%
$8m
Annualized Total Costs @ 3%
$7m
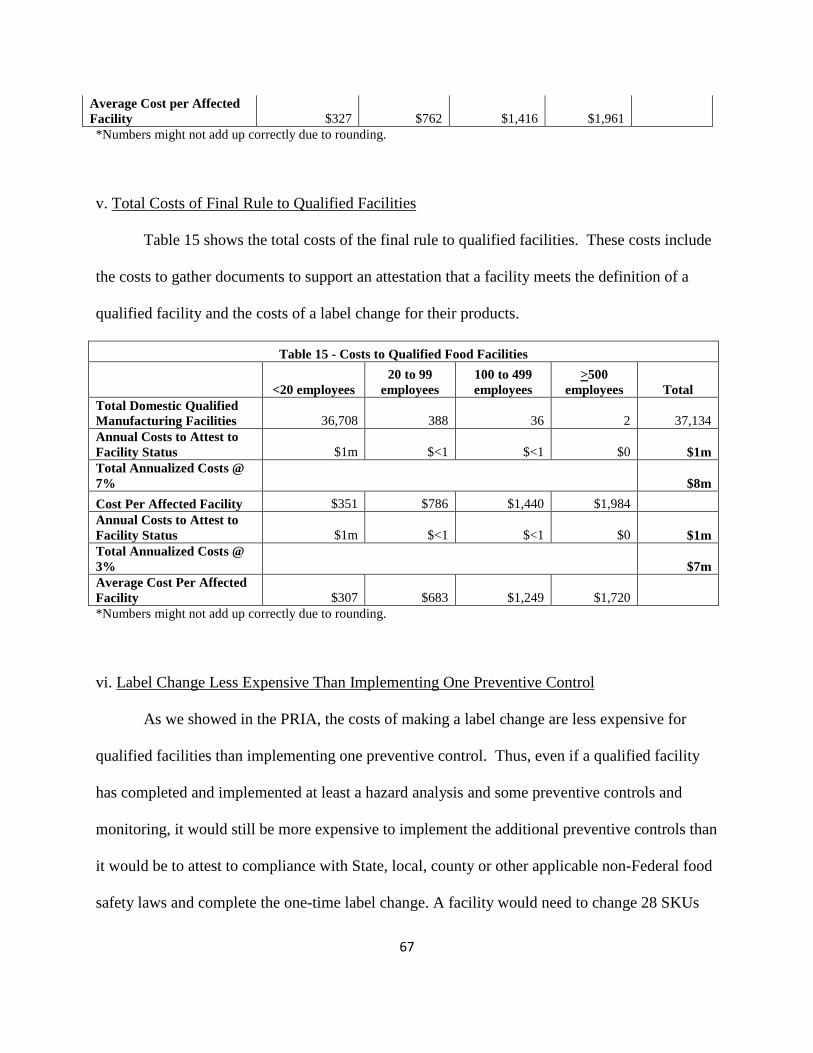
67
Average Cost per Affected Facility $327 $762 $1,416 $1,961 *Numbers might not add up correctly due to rounding.
v. Total Costs of Final Rule to Qualified Facilities
Table 15 shows the total costs of the final rule to qualified facilities. These costs include
the costs to gather documents to support an attestation that a facility meets the definition of a
qualified facility and the costs of a label change for their products.
Table 15 - Costs to Qualified Food Facilities
<20 employees 20 to 99
employees 100 to 499 employees
>500 employees Total
Total Domestic Qualified Manufacturing Facilities 36,708 388 36 2 37,134 Annual Costs to Attest to Facility Status $1m $<1 $<1 $0 $1m Total Annualized Costs @ 7%
$8m
Cost Per Affected Facility $351 $786 $1,440 $1,984 Annual Costs to Attest to Facility Status $1m $<1 $<1 $0 $1m Total Annualized Costs @ 3%
$7m
Average Cost Per Affected Facility $307 $683 $1,249 $1,720 *Numbers might not add up correctly due to rounding.
vi. Label Change Less Expensive Than Implementing One Preventive Control
As we showed in the PRIA, the costs of making a label change are less expensive for
qualified facilities than implementing one preventive control. Thus, even if a qualified facility
has completed and implemented at least a hazard analysis and some preventive controls and
monitoring, it would still be more expensive to implement the additional preventive controls than
it would be to attest to compliance with State, local, county or other applicable non-Federal food
safety laws and complete the one-time label change. A facility would need to change 28 SKUs

68
before the costs of a label change would be more prohibitive than completing a hazard analysis.
H. COSTS ASSOCIATED WITH REVISIONS TO SUBPARTS A AND B- GENERAL PROVISIONS AND CURRENT GOOD MANUFACTURING PRACTICES (CGMPS)
Final § 117 subpart B revises current § 110 subpart B to clarify that references to cross
contamination are meant to include cross-contact. Because this provision only clarifies the
meaning of the existing rule, we assume that facilities would not incur a cost. Subpart A was also
revised to include a general requirement for education and training.
a. Education and Training
Revised §117.4 requires education and training so that each individual engaged in
manufacturing, processing, packing, or holding food (including temporary and seasonal
personnel) or in the supervision thereof, must receive training in the principles of food hygiene
and food safety, as appropriate to the food, the facility and the individual’s assigned duties.
Additionally, management of the establishment must establish and maintain records that
document required training of personnel.
To understand baseline education and training practices, we used responses from the
Food GMP survey. Our Food GMP survey included questions about types of training, duration of
training, types of employees trained, and whether management conducts refresher training. The
final survey report provides a complete summary of all the responses to the training questions.
For purposes of this analysis we assume facilities would not incur an additional cost for new
training materials because the results of the Food GMP survey indicate that 90 percent of all
facilities already conduct at least some food safety and personnel hygiene training and because
adequate training material is readily available on-line for free. The cost to comply with the
education and training provisions would be to those facilities that do not currently provide

69
sufficient education and training to newly hired employees and experienced employees. The
additional cost to comply would be for the additional labor hours used for training by the
production workers and the qualified individuals that conduct the training. Using labor hours as
the measure of the costs reflects the lost production time that employees must devote to training.
We assume an average of two hours is needed to train employees in the principles of food safety
per year and another two hours are needed to train employees in personnel hygiene per year. We
also assume that facilities that provide one or fewer hours would incur the cost of adding one
hour to their training time for each subject. The major changes from the PRIA are to assume that
first line managers at an hourly wage rate of $56 are qualified individuals for the purposes of
conducting the training, rather than other qualified individuals at an hourly wage rate of almost
$112. We also assume that the training would only be necessary once, at the time an employee
starts, rather than training annually. We assume there is employee turnover, and new employees
that are hired to replace formerly trained employees will still need to be trained. Table 16 shows
our estimate for the costs to establishments by manufacturer, warehouse and wholesaler facility
type to comply with the requirement for training in food safety.
Table 16 - Estimate for One-Time Food Safety Training Costs by Domestic Manufacturing, Warehouses and Wholesalers Facility Size
<20
employees 20 to 99
employees 100 to 499 employees
> 500 employees Total
Total Domestic Facilities 60,746 16,759 5,553 751 83,809 Percent of Facilities w/o Any Food Safety Training 10% 2% 5% 0% Total Facilities that Require 2 Hrs of Food Safety Training 6,135 362 274 0 6,772 Hourly Wage Rate for 1st Line Supervisor – Trainers $56 $56 $56 $56 Hourly Wage Rate for Production line Workers $34 $34 $34 $34 Avg Number of Employees that require Training 5 to 15 30 to 80 200 to 400 550 to 700

70
Average Labor Hrs to Conduct Training 2 2 2 2 Subtotal Food Safety Training Costs – Additional 2 Hours $5m $1m $6m $0m $12m
Percent of Facilities that require 1 additional hr 32% 60% 48% 60% Total Facilities that Require Additional 1 Hr of Food Safety Training 19,171 10,079 2,644 448 32,342 Hourly Wage Rate for– 1st Line Supervisor Trainers $56 $56 $56 $56 Hourly Wage Rate for Production line Workers $34 $34 $34 $34 Avg Number of Employees that require Training 5 to 15 30 to 80 200 to 400 550 to 700 Average Labor Hrs to Conduct Training 2 2 2 2 Subtotal Food Safety Training Costs – Additional1 Hours $8m $19m $27m $9m $63m
Total Costs to Provide Food Safety Training $13m $21m $33m $9m $75m
Total Facilities that Require Food Safety Training Records 25,307 10,441 2,918 0 38,666 Hourly Wage Rate for Production line Workers $34 $34 $34 $34
Minutes per Record 2 to 4 2 to 4 2 to 4 2 to 4
Hours per Record .03 to .07 .03 to .07 .03 to .07 .03 to .07 Avg Number of Employees that require Training 5 to 15 30 to 80 200 to 400 550 to 700
Avg Records per Employee 1 1 1 1
Total Recordkeeping Costs $1m $2m $3m $0m $6m *Numbers might not add up due to rounding.
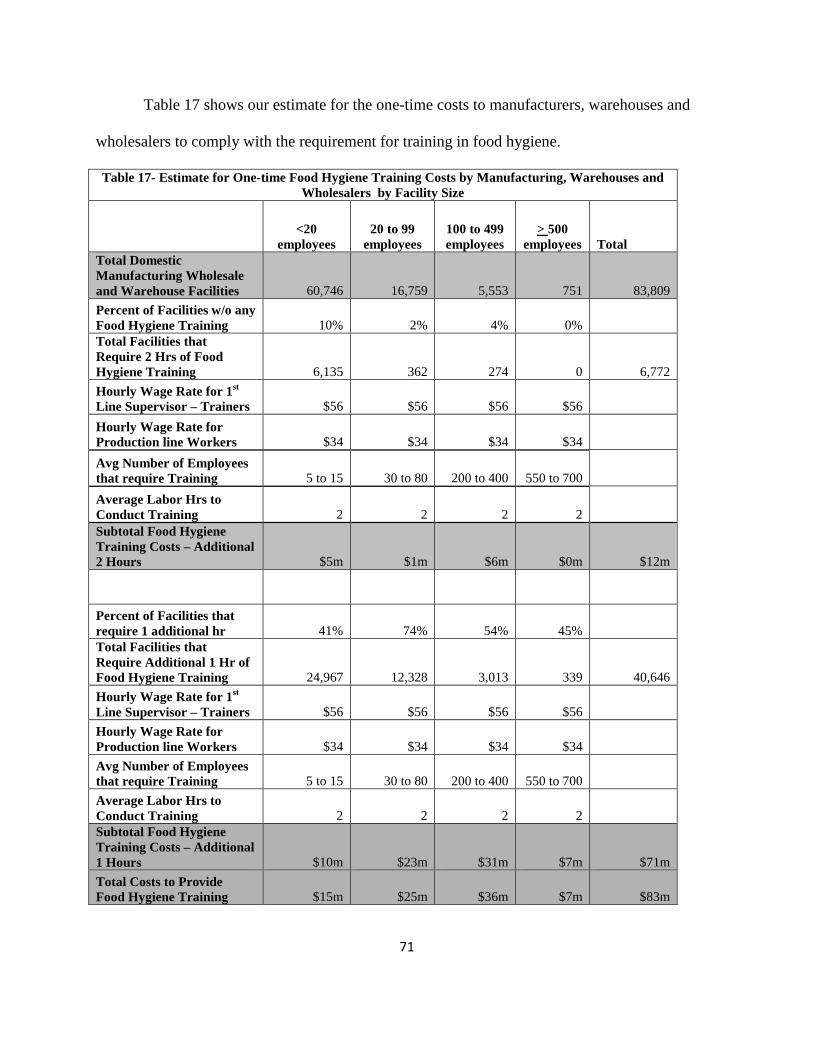
71
Table 17 shows our estimate for the one-time costs to manufacturers, warehouses and
wholesalers to comply with the requirement for training in food hygiene.
Table 17- Estimate for One-time Food Hygiene Training Costs by Manufacturing, Warehouses and Wholesalers by Facility Size
<20
employees 20 to 99
employees 100 to 499 employees
> 500 employees Total
Total Domestic Manufacturing Wholesale and Warehouse Facilities 60,746 16,759 5,553 751 83,809 Percent of Facilities w/o any Food Hygiene Training 10% 2% 4% 0% Total Facilities that Require 2 Hrs of Food Hygiene Training 6,135 362 274 0 6,772 Hourly Wage Rate for 1st Line Supervisor – Trainers $56 $56 $56 $56 Hourly Wage Rate for Production line Workers $34 $34 $34 $34 Avg Number of Employees that require Training 5 to 15 30 to 80 200 to 400 550 to 700
Average Labor Hrs to Conduct Training 2 2 2 2 Subtotal Food Hygiene Training Costs – Additional2 Hours $5m $1m $6m $0m $12m
Percent of Facilities that require 1 additional hr 41% 74% 54% 45% Total Facilities that Require Additional 1 Hr of Food Hygiene Training 24,967 12,328 3,013 339 40,646 Hourly Wage Rate for 1st Line Supervisor – Trainers $56 $56 $56 $56 Hourly Wage Rate for Production line Workers $34 $34 $34 $34 Avg Number of Employees that require Training 5 to 15 30 to 80 200 to 400 550 to 700 Average Labor Hrs to Conduct Training 2 2 2 2 Subtotal Food Hygiene Training Costs – Additional 1 Hours $10m $23m $31m $7m $71m Total Costs to Provide Food Hygiene Training $15m $25m $36m $7m $83m

72
Total Facilities that Require Food Hygiene Training Records 40,736 9,329 2,576 215 52,875 Hourly Wage Rate for Production line Workers $34 $34 $34 $34
Minutes per Record 2 to 4 2 to 4 2 to 4 2 to 4
Hours per Record .03 to .07 .03 to .07 .03 to .07 .03 to .07 Avg Number of Employees that require Training 5 to 15 30 to 80 200 to 400 550 to 700
Avg Records per Employee 1 1 1 1
Total Recordkeeping Costs $1m $2m $3m $1m $7m *Numbers might not add up due to rounding.
Table 18 presents a summary of all training and recordkeeping costs.
Table 18 - Total Education and Training Costs Summary* ($ million)
<20
employees 20 to 99
employees 100 to 499 employees
> 500 employees Total
Total Facilities 60,746 16,759 5,553 751 83,809 Food Safety Training Costs $12 $20 $32 $9 $75 Food Hygiene Training Costs $15 $25 $36 $7 $82 Training Records Costs $2 $4 $6 $2 $14 Total First Year Costs $29 $50 $75 $18 $171 Total Annualized Costs @7%** $35 Total Annualized Costs @3%** $34 *Numbers might not add up due to rounding. ** Includes education and training costs for mixed use facilities.
I. COSTS ASSOCIATED WITH SUBPART C-HAZARD ANALYSIS AND RISK-BASED PREVENTIVE CONTROLS
1. Food Safety Plan
a. Creating a food safety plan
The owner, operator, or agent in charge of facilities subject to subpart C of the rule must
prepare, or have prepared, a written food safety plan that documents and describes their

73
procedures used to comply with subpart C, Hazard Analysis and Risk-Based Preventive
Controls. The food safety plan must include: 1) a written hazard analysis, 2) written preventive
controls, 3) written supply chain program, 4) a written recall plan, 5) written procedures for
monitoring the implementation of the preventive controls, 6) written procedures for corrective
actions, and 7) written verification procedures. The food safety plan must be prepared by one or
more preventive controls qualified individuals.
Facilities that do not already have food safety plans or that lack some of the required
elements will incur the cost to develop their plans or the missing elements of their plans. The
costs to develop the written hazard analysis are shown in section 2 of our analysis, the costs to
develop the other written procedures required for a facility’s food safety plan are found in the
sections of this PRIA covering the costs of performing those particular procedures, respectively.
b. Reanalysis of the Food Safety Plan
Section 117.170 of the rule requires that each facility reassess its food safety plan as a
whole at least once every three years; whenever a significant change is made in the activities
conducted at a facility that creates a reasonable potential for a new hazard or a significant
increase in a previously identified hazard; whenever the facility owner, operator or agent in
charge becomes aware of new information about potential hazards associated with the food;
whenever appropriate after an unanticipated food safety problem; and whenever a preventive
control, combination of preventive controls, or the food safety plan is found to be ineffective.
2. Hazard Analysis
Section 117.130 requires the owner or operator, or agent in charge of an affected facility
to have a written hazard analysis that includes, as a first step, the identification of known or

74
reasonably foreseeable hazards for each type of food manufactured, processed, packed, or held at
the facility. As a second step, the analysis requires the evaluation of the probability that the
hazard will occur in the absence of preventive controls and severity of the illness or injury that
can be caused if the hazard were to occur. The identification of the hazards is required to
consider biological hazards including microbiological hazards such as parasites, environmental
pathogens and other pathogens; chemical hazards including radiological hazards and substances
such as pesticide and drug residues, natural toxins, decomposition, unapproved food or color
additives, and food allergens; and physical hazards such as stones, glass and metal fragments.
The identification of hazards will be performed by preventive controls qualified
individuals in collaboration with a team of personnel that are knowledgeable about the raw
materials and ingredients and processes within the facility. In general, the scope of the hazard
analysis depends on the number of food products that are processed, the production complexity,
and the storage requirements for each of the food products. The scope of the hazard analysis
requires consideration of naturally occurring hazards and hazards that may be unintentionally
introduced or those that may be intentionally introduced for purposes of economic gain. We deal
with the hazard analysis for hazards that may be intentionally introduced for purposes of
economic gain (economically motivated adulteration) separately. The time necessary to conduct
the hazard analysis is not strictly related to the size of the facility; variables such as the
complexity of the process steps or food type also influence the time for conducting a hazard
analysis.
To understand the baseline use of hazard analysis in the food manufacturing industry, the
FDA Food GMP survey asked respondents whether they have a HACCP System. All facilities
with more than 500 employees report having a HACCP system. Over 58 percent of the

75
responding facilities with fewer than 20 employees indicated that they do not have a HACCP
system. Among facilities with 20 to 99 employees, 18 percent report not having a HACCP system
and 3 percent of facilities with 100 to 499 employees report not having a HACCP system. Food
Manufacturing magazine (Market Update, 2008) also surveyed the state of HACCP in the
industry. Their summary published in October 2008, reported that 80.7 percent of the HACCP
plans address physical hazards and 72.9 percent address microbiological contaminants (Ref. 29)
ERG experts judged that a hazard analysis, when it is prepared for the first time, may take
24 to 48 hours to conduct. Subsequent written hazard analyses would most likely require 12 to
24 hours to conduct. The time required will vary with the complexity of the product lines (Ref.
23). A preventive controls qualified individual must prepare (or oversee the preparation of) the
written hazard analysis. Larger or more diversified firms might require 6 to 10 hazard analyses
per facility (Ref. 23). Table 19 summarizes our labor hour estimates for preparing a written
hazard analysis.
We used our expert’s estimate for the total time to conduct and write the hazard analysis
of 24 to 48 hours as shown in Table 19 and we assumed that it will take approximately 4 to 8
hours of the 24 to 48 hours to write the analysis. Of the total time to update the hazard analysis,
we assume it will take 2 to 4 hours for the writing alone.
Table 19 - Written Hazard Analysis Labor Hours Type Total Labor Hours for Written Hazard Analysis (per Product Line) First Hazard Analysis 24 to 48 hours Subsequent Hazard Analysis 12 to 24 hours
Facilities subject to subpart C, Hazard Analysis and Risk-Based Preventive Controls, will
be required to conduct a hazard analysis when they lack such an analysis of their facility. If a
covered facility currently operates using HACCP, then we assume that they have conducted a

76
hazard analysis that would comply with the requirements of the rule. If a facility does not
currently operate under HACCP, then we assume that they have not conducted a hazard analysis,
and they will need to do so to comply. Table 20 summarizes our estimate for the initial costs for
manufacturing facilities to conduct a written hazard analysis.
Table 20. Costs to Manufacturing Facilities to Conduct Initial Written Hazard Analysis by Facility Size
<20
employees 20 to 99
employees 100 to 499 employees
> 500 employees Total
Total Domestic Manufacturing Facilities Subject to Subpart C 5,185 7,177 3,387 536 16,285 Percent of Facilities w/o Hazard Analysis 58% 18% 3% 0% Total Facilities that require Hazard Analysis 3,020 1,295 101 0 4,416 Hourly Wage Rate for Qualified Individuals $112 $112 $112 $112 Number of Processes per Facility 1-3 1-3 20 20 Average Labor Hrs to Conduct Hazard Analysis per Process 20 to 40 20 to 40 20 to 40 20 to 40 Total Costs to Conduct Initial Hazard Analysis
$20m $9m $7m $0m $36m
Average Labor Hrs to Write Hazard Analysis per Process 4 to 8 4 to 8 4 to 8 4 to 8 Total Costs to Write Initial Hazard Analysis $4m $2m $1m $0m $7m Total One-time Costs for Initial Hazard Analysis $24m $10m $8m $0m $42m
*Numbers might not add up correctly due to rounding.
Table 21 summarizes our estimate for manufacturing facilities to conduct an on-going
hazard analysis and to update their written analysis on an annual basis.
Table 21. Estimated Costs to Manufacturing Facilities to Annually Update the Hazard Analysis by Facility Size
<20 employees
20 to 99 employees
100 to 499 employees
> 500 employees
Total
Total Domestic Manufacturing Facilities
5,185 7,177 3,387 536 16,285
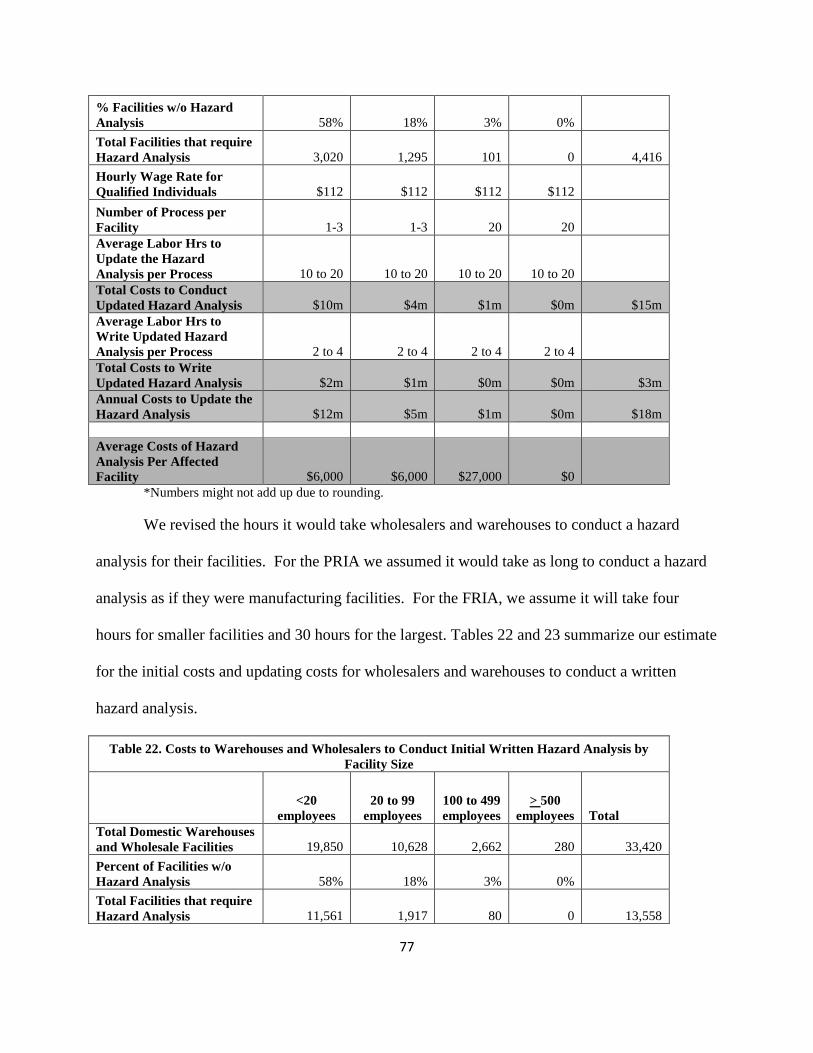
77
% Facilities w/o Hazard Analysis 58% 18% 3% 0% Total Facilities that require Hazard Analysis 3,020 1,295 101 0 4,416 Hourly Wage Rate for Qualified Individuals $112 $112 $112 $112 Number of Process per Facility 1-3 1-3 20 20 Average Labor Hrs to Update the Hazard Analysis per Process 10 to 20 10 to 20 10 to 20 10 to 20 Total Costs to Conduct Updated Hazard Analysis $10m $4m $1m $0m $15m Average Labor Hrs to Write Updated Hazard Analysis per Process 2 to 4 2 to 4 2 to 4 2 to 4 Total Costs to Write Updated Hazard Analysis $2m $1m $0m $0m $3m Annual Costs to Update the Hazard Analysis $12m $5m $1m $0m $18m Average Costs of Hazard Analysis Per Affected Facility $6,000 $6,000 $27,000 $0
*Numbers might not add up due to rounding.
We revised the hours it would take wholesalers and warehouses to conduct a hazard
analysis for their facilities. For the PRIA we assumed it would take as long to conduct a hazard
analysis as if they were manufacturing facilities. For the FRIA, we assume it will take four
hours for smaller facilities and 30 hours for the largest. Tables 22 and 23 summarize our estimate
for the initial costs and updating costs for wholesalers and warehouses to conduct a written
hazard analysis.
Table 22. Costs to Warehouses and Wholesalers to Conduct Initial Written Hazard Analysis by Facility Size
<20
employees 20 to 99
employees 100 to 499 employees
> 500 employees Total
Total Domestic Warehouses and Wholesale Facilities 19,850 10,628 2,662 280 33,420 Percent of Facilities w/o Hazard Analysis 58% 18% 3% 0% Total Facilities that require Hazard Analysis 11,561 1,917 80 0 13,558

78
Hourly Wage Rate for Qualified Individuals $112 $112 $112 $112 Number of Processes per Facility 1 1 3 10 Average Labor Hrs to Conduct Hazard Analysis per Process 4 4 10 30 Total Costs to Conduct Initial Hazard Analysis
$5m $1m $0m $0m $6m
Average Labor Hrs to Write Hazard Analysis per Process 1 1 3 6 Total Costs to Write Initial Hazard Analysis $1m $0m $0m $0m $1m Total Costs to Conduct Initial Hazard Analysis $6m $1m $0m $0m $7m
*Numbers might not add up due to rounding.
Table 23. Costs to Warehouses and Wholesalers Facilities to Annually Update the Hazard Analysis by Facility Size
<20 employees
20 to 99 employees
100 to 499 employees
> 500 employees
Total
Total Domestic Warehouses and Wholesaler Facilities
19,850 10,628 2,662 280 33,420
% Facilities w/o Hazard Analysis 58% 18% 3% 0% Total Facilities that require Hazard Analysis 11,561 1,917 80 0 13,558 Hourly Wage Rate for Qualified Individuals $112 $112 $112 $112 Number of Process per Facility 1 1 3 10 Average Labor Hrs to Update the Hazard Analysis per Process 4 4 10 30 Total Costs to Conduct Updated Hazard Analysis $5m $1m $0m $0m $6m Average Labor Hrs to Write Updated Hazard Analysis per Process 1 1 3 6 Total Costs to Conduct Updated Hazard Analysis $1m $0m $0m $0m $1m Annual Costs to Update the Hazard Analysis $6m $1m $0m $0m $6m Total Costs Annualized @ 7% (one-time + on-going) $29m

79
Total Costs Annualized @3% (one-time + on-going) $29m Total Costs of Hazard Analysis Per Affected Facility $670 $670 $3,000 $0
*Numbers might not add up due to rounding.
3. Hazard Analysis to Prevent Economically Motivated Adulteration Section 117.130 requires the owner or operator, or agent in charge of an affected facility
to evaluate the hazards that might be intentionally introduced for purposes of economic gain.
We did not change our estimates from those presented in the supplemental PRIA. We re-present
the final table of costs associated with this requirement here.
Table 24. Cost of Hazard Analysis to Prevent Economically Motivated Adulteration Facility Type Small Medium Large V. Large Total Facility Employees <20 20-99 100-499 >500 Facilities Covered 5,185 7,177 3,387 536 16,285 Wage Rate $96 $96 $96 $96
Processes per Facility 2 2 6 10 Total Processes 10,370 14,354 20,322 5,360
Conducting the Initial Hazard Analysis Labor Hours per Process 2 2 2 2 Initial One-time Costs $2m $3m $4m $1m $10m
Writing the Initial Hazard Analysis Labor Hours per Process 0.5 0.5 0.5 0.5 Initial One-time Costs $0m $1m $1m $0m $2m
Total Initial Costs $ 2m $4m $5m $1m $12m Hazard Analysis - Annual Updating
Labor Hours per Process 0.5 0.5 0.5 0.5 Recurring Costs $0m $1m $1m $0m $2m
Hazard Analysis - Annual Writing Labor Hours per Process 0.1 0.1 0.1 0.1 Recurring Costs $0m $0m $0m $0m $0m
Hazard Analysis - Totals Recurring Costs $1m $1m $1m $0m $3m
Allergen Testing Processes Requiring Testing 17% 17% 17% 17% Testing Costs per Process $1,000 $1,000 $1,000 $1,000
Allergen Testing Costs $2m $2m $3m $1m $9m

80
Non-Domestic Dairy Product Testing Processes Requiring Testing 6.9% 6.9% 6.9% 6.9% Testing Costs per Process $1,000 $1,000 $1,000 $1,000
Non-Domestic Dairy Testing Costs $1m $1m $1m $0m $3m Spice Testing
Processes Requiring Testing 21% 21% 21% 21% Testing Costs per Process $500 $500 $500 $500 Spice Testing Costs $1m $2m $2m $1m $5m
Other Product Testing Processes Requiring Testing 10% 10% 10% 10%
Testing Costs per Process $300 $300 $300 $300 Other Testing Costs $0m $0m $1m $0m $1m
Total Annualized Cost of EMA Provisions 7% Discount Rate
$21m
3% Discount Rate
$21m Average Cost per facility $1,000 $1,000 $3,000 $5,000 $1,000
*Numbers might not add up due to rounding.
4. Preventive Controls
a. Process Controls
i. Process Control Cost Estimates
Our § 117.135(c)(1) requires facilities subject to subpart C to implement process controls
into their manufacturing process. Process controls are the procedures, practices, and processes
performed on food during processing operations to ensure they are controlling hazards. A metal
detector is a common process control for preventing metal fragments, a physical hazard, from
adulterating foods. The application of heat is a common process control to adequately reduce
pathogens in foods.
Process controls would be required to include, when applicable, the maximum or
minimum value or combination of values that is necessary to control the select hazards identified
in the hazard analysis. Maximum or minimum values are the limits at which process controls are

81
effective against the identified hazards. A production process with a thermal kill step above 165º
F might only be effective if the production temperature is known to actually reach the minimum
temperature of 165º F for a sufficient period, such as 15 seconds. Ensuring the effectiveness of a
thermal process control might require a correctly functioning thermometer that is installed,
calibrated, monitored and its effectiveness verified with a program of on-going records review by
preventive controls qualified individuals, which may include production managers or quality
assurance staff.
The regulatory cost of adopting process controls is the cost to purchase and install the
new equipment or adopt new procedures to comply with the rule; the time for preventive controls
qualified individuals to develop the written procedures to incorporate the process controls into
the production line; the labor hours to train the production personnel in the use of the new
procedures; the costs to calibrate any newly installed equipment in order to better ensure the
effectiveness of the controls; the labor hours used by manufacturing workers, managers and
qualified personal to monitor and record the results of the controls.
We assume that facilities which currently have process controls will face no additional
costs to comply with this provision. To estimate the number of facilities that currently lack
process controls, we referred to the Food GMP survey. The survey asks about the use of
HACCP. While the use of HACCP is not identical to the use of process controls, it is a close
approximation. Some facilities will use process controls, such as metal detectors and thermal kill
steps, but do not use HACCP, but all facilities that use HACCP, by definition, use critical control
points and critical limits, so they necessarily use what we are describing as process controls. The
use of HACCP, in other words, is a lower bound estimate for the use of process controls. The
survey results show that almost 66 percent of all facilities use HACCP, including 42 percent of

82
facilities with fewer than 20 employees and 100 percent of facilities with 500 or more
employees.
In the survey, the use of written procedures for operational control practices indicates the
use of process controls, although we recognize that facilities might use process controls but not
have written procedures, a description for their use, or records that document their use. The
survey results for this question show that 64 percent of all facilities have written procedures,
including 47 percent of all facilities with fewer than 20 employees and 100 percent of facilities
with 500 or more employees.
The use of production and process control records is another indication of the use of
process controls. Facilities that use process controls are very likely to keep records of their use,
so we estimate that the presence of records indicates the presence of process controls. Likewise,
we assume the absence of records indicates the absence of process controls or at least the
absence of adequate process controls. However, we also recognize that production process
records might be for production processes that are not specifically process controls as defined by
the rule, so the relationship between the use of production process records and process controls is
not exact. The survey results show that 80 percent of all facilities use production process
records, including 64 percent of facilities with fewer than 20 employees and 100 percent of
facilities with 500 or more employees. The results reflect an upper bound estimate for the
current use of process controls. To estimate the mean number of facilities that use process
controls we took the average of the responses to our question about the use of HACCP with our
estimate for the use of process control records for a total of 47 percent of facilities with 20
employees or fewer.
We assume, based on our experts’ judgment, that there are generally one to three process

83
controls per product line depending on the type of the food manufactured. (Ref. 23) There may
be one or several points in a process that should be monitored, depending upon the type of
product being manufactured. It is possible that a facility would only have a single process
control, especially for a facility that makes only one line of products or groupings of products
with similar characteristics, such as a line of jams and jellies of various flavors and sizes. Even a
large facility that only produced a single product might have only a single process control. It is
likely that there will be more than one process control as the complexity of the manufacturing
increases and two to three process controls per product line may be more typical.
Our estimate for the cost of purchasing and installing common process controls such as
pH meters and thermometers among the other common devices described in the preamble to
monitor the freezing, dehydrating, heat processing, acidifying and the refrigerating of foods is
$1,000 to $5,000 per process for an average cost of $3,000 per process control per process. Our
cost estimate is based on the range of published prices for process control mechanisms that we
identified on-line as common brand name process control mechanisms. 11
Process controls require validation in accordance with section 117.160. Our analysis in
the PRIA neglected to account for the cost of validation. We assume that facilities that adopt
new process controls will also have to validate the controls, and we assume that some number of
the facilities that currently have process controls have not validated them and will have to do so
to be in compliance. We lack data about the number of facilities that currently have process
controls but have not validated them, so we assume that approximately 10 percent of these
facilities will incur the cost to validate their processes. Published estimates for the cost to
11 For instance, we found the cost for common process controls such as pH measurement electrode devices to range from $50 to a high of $420. The cost for electrode calibration devices ranged from a low of $75 to a high of $750. Temperature thermometers ranged from $75 to about $400. Water activity monitors ranged from a low of $250 to over $3,950.
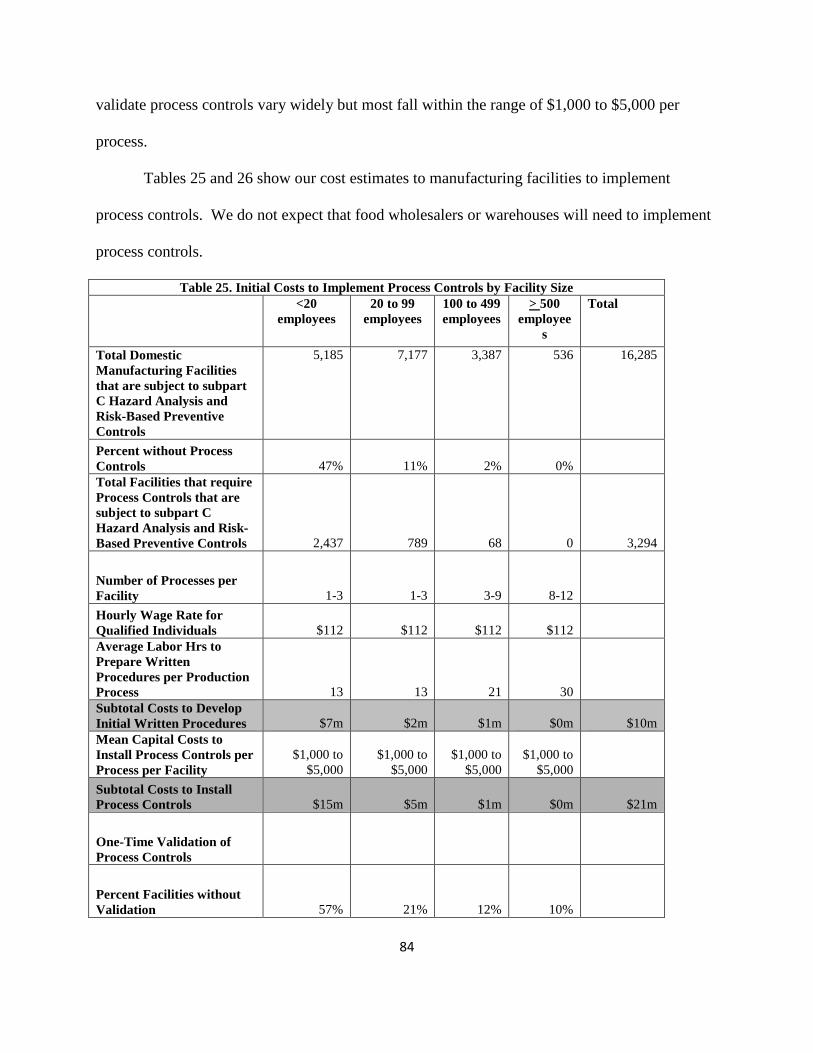
84
validate process controls vary widely but most fall within the range of $1,000 to $5,000 per
process.
Tables 25 and 26 show our cost estimates to manufacturing facilities to implement
process controls. We do not expect that food wholesalers or warehouses will need to implement
process controls.
Table 25. Initial Costs to Implement Process Controls by Facility Size <20
employees 20 to 99
employees 100 to 499 employees
> 500 employee
s
Total
Total Domestic Manufacturing Facilities that are subject to subpart C Hazard Analysis and Risk-Based Preventive Controls
5,185 7,177 3,387 536 16,285
Percent without Process Controls 47% 11% 2% 0% Total Facilities that require Process Controls that are subject to subpart C Hazard Analysis and Risk-Based Preventive Controls 2,437 789 68 0 3,294
Number of Processes per Facility 1-3 1-3 3-9 8-12 Hourly Wage Rate for Qualified Individuals $112 $112 $112 $112 Average Labor Hrs to Prepare Written Procedures per Production Process 13 13 21 30 Subtotal Costs to Develop Initial Written Procedures $7m $2m $1m $0m $10m Mean Capital Costs to Install Process Controls per Process per Facility
$1,000 to $5,000
$1,000 to $5,000
$1,000 to $5,000
$1,000 to $5,000
Subtotal Costs to Install Process Controls $15m $5m $1m $0m $21m
One-Time Validation of Process Controls
Percent Facilities without Validation 57% 21% 12% 10%

85
Total NON-Qualified Facilities that Require Validation of Process Controls 2,681 868 75 54 3,677
Number of Processes per Facility 2 2 6 10
Cost to Validate Process Control per Facility (One-time)
$1,000 to $5,000
$1,000 to $5,000
$1,000 to $5,000
$1,000 to $5,000
Mean Cost to Validate All Process Control (One-time) $16m $5m $1m $2m $24m
Number of Employees that Require Training per Process per Facility 5 5 5 5 Hours of Initial Training per Employee 2 2 2 2 Hourly Wage Rate for Production Line Workers $34 $34 $34 $34 Subtotal Costs to Train Production Workers $3m $1m $0m $0m $4m Minutes per Record to Document Initial Training 2 to 4 2 to 4 2 to 4 2 to 4 Subtotal Initial Recordkeeping Costs for Training $0m $0m $0m $0m $0m
Total One-Time Process Control Costs $40m $13m $4m $2m $59m
*Numbers might not add up due to rounding.
Table 26. Estimated On-Going Costs to Implement Process Controls by Facility Size <20
employees 20 to 99
employees 100 to 499 employees
> 500 employees
Total
Total Domestic Manufacturing Facilities subject to subpart C Hazard Analysis and Risk-Based Preventive Controls 5,185 7,177 3,387 536 16,285 Percent without Process Controls 47% 11% 2% 0% Total Facilities that require Process Controls subject to subpart C Hazard Analysis and Risk-Based Preventive Controls 2,437 789 68 0 3,294

86
Number of Processes per Facility 1-3 1-3 3-9 8-12 Hourly Wage Rate for Qualified Individuals $112 $112 $112 $112 Labor Hrs to Update Written Procedures per Production Process 4 4 7 11 Subtotal Costs to Annually Update Written Procedures $2m $1m $<1m $0m $3m Number of Employees that Require Training in Updated Written Procedures per Process per Facility 5 5 5 5 Hours of Initial Training per Employee 2 2 2 2
Hourly Wage Rate for Production Line Workers $34 $34 $34 $34 Subtotal Costs to Train Production Workers in Updated Written Procedures $1m $1m $<1m $0m $2m Minutes per Record to Document Training in Updated Written Procedures 2 to 4 2 to 4 2 to 4 2 to 4 Subtotal Recordkeeping Costs for Training in Updated Written Procedures $<1m $<1m $<1m $<1m $<1m
Hourly Wage Rate for QC Personnel to Perform Calibration $96 $96 $96 $96
Hours to Calibrate Process Controls per Process per Year 1 to 4 1 to 4 1 to 4 1 to 4
Subtotal Annual Costs to Perform Calibration $3m $1m $<1m $0m $4m
Hours to Generate Calibration Records per Process .12 to .55 .12 to .55 .12 to .55 .12 to .55
Number of calibration records per process per year 24 24 24 24
Subtotal Recordkeeping Costs to Document Calibration $4m $1m $<1m $0m $5m

87
Hourly Wage Rate Process Control Monitoring $34 $34 $34 $34 Average Hours Monitoring each Process Annually 274 274 1095 1825
Subtotal Monitoring Costs $22m $7m $2m $0m $32m Records to Document Monitoring of Process Controls (Minutes per Record) 2 to 4 2 to 4 2 to 4 2 to 4
Monitoring Records per Process per Year 365 365 365 365
Subtotal Costs to Document Monitoring $3m $1m $<1m $0m $4m Hours to Generate Verification Instrumentation Calibration Records per Process .12 to .55 .12 to .55 .12 to .55 .12 to .55 Number of verification instrumentation calibration records per process per year 24 24 24 24 Subtotal Recordkeeping Costs to Document Verification Instrumentation Calibration $4m $1m $<1m $0m $5m
Hourly Wage Rate for Qualified Individual to Perform Records Review $96 $96 $96 $96 Hours to Perform Records Review Annually (365 records x .05 hrs/record) 18.25 18.25 18.25 18.25 Subtotal Annual Visual Observation Verification - Records Review Costs $4m $1m $0m $0m $5m
Total Annual On-going Process Control Costs $47m $15m $4m $0m $66m
Total Costs Annualized (One-Time annualized + On-Going) (7%) $65m Total Costs Annualized (One-Time annualized + On-Going) (3%) $65m Avg. Cost of Process Controls Per Affected $22,000 $22,000 $73,000 $0 $23,000
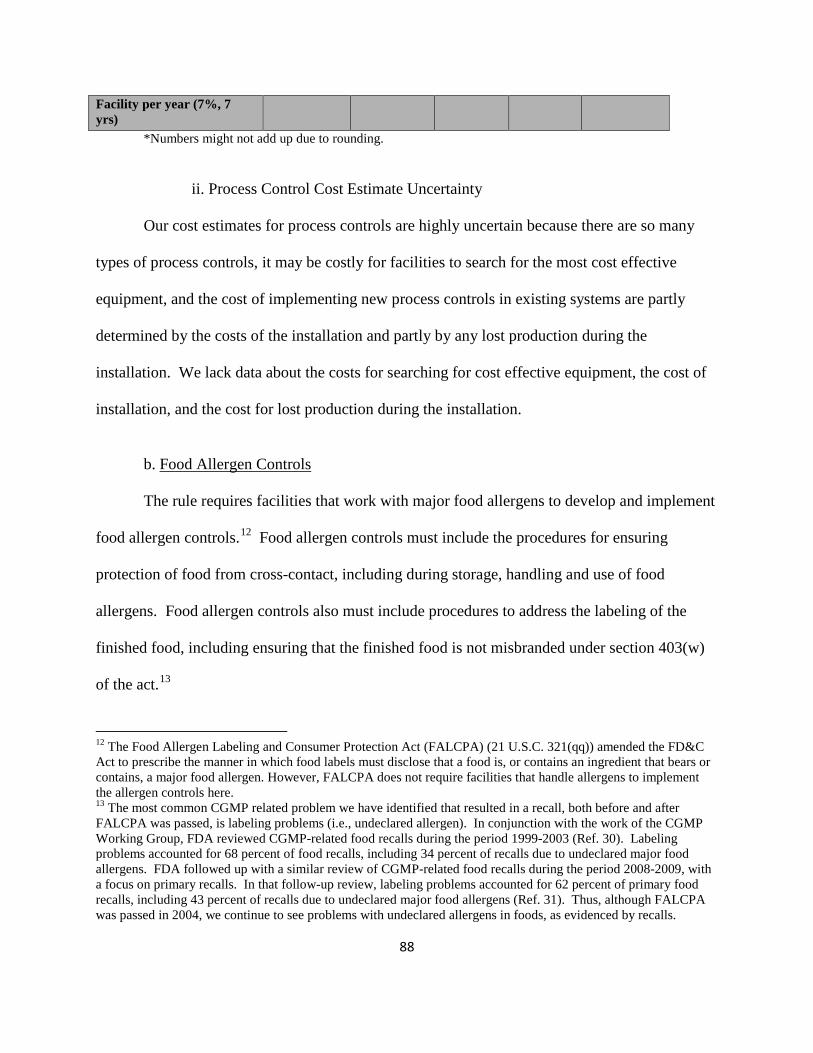
88
Facility per year (7%, 7 yrs)
*Numbers might not add up due to rounding.
ii. Process Control Cost Estimate Uncertainty
Our cost estimates for process controls are highly uncertain because there are so many
types of process controls, it may be costly for facilities to search for the most cost effective
equipment, and the cost of implementing new process controls in existing systems are partly
determined by the costs of the installation and partly by any lost production during the
installation. We lack data about the costs for searching for cost effective equipment, the cost of
installation, and the cost for lost production during the installation.
b. Food Allergen Controls The rule requires facilities that work with major food allergens to develop and implement
food allergen controls.12 Food allergen controls must include the procedures for ensuring
protection of food from cross-contact, including during storage, handling and use of food
allergens. Food allergen controls also must include procedures to address the labeling of the
finished food, including ensuring that the finished food is not misbranded under section 403(w)
of the act.13
12 The Food Allergen Labeling and Consumer Protection Act (FALCPA) (21 U.S.C. 321(qq)) amended the FD&C Act to prescribe the manner in which food labels must disclose that a food is, or contains an ingredient that bears or contains, a major food allergen. However, FALCPA does not require facilities that handle allergens to implement the allergen controls here. 13 The most common CGMP related problem we have identified that resulted in a recall, both before and after FALCPA was passed, is labeling problems (i.e., undeclared allergen). In conjunction with the work of the CGMP Working Group, FDA reviewed CGMP-related food recalls during the period 1999-2003 (Ref. 30). Labeling problems accounted for 68 percent of food recalls, including 34 percent of recalls due to undeclared major food allergens. FDA followed up with a similar review of CGMP-related food recalls during the period 2008-2009, with a focus on primary recalls. In that follow-up review, labeling problems accounted for 62 percent of primary food recalls, including 43 percent of recalls due to undeclared major food allergens (Ref. 31). Thus, although FALCPA was passed in 2004, we continue to see problems with undeclared allergens in foods, as evidenced by recalls.

89
As a result of this rule, facilities subject to subpart C, Hazard Analysis and Risk-Based
Preventive Controls, may need to develop new allergen labeling controls. The need for a
particular facility to develop new labeling controls for the hazards identified in the hazard
analysis depends on the type of food, the type of facility, and whether or not that facility already
has acceptable labeling controls. Under this requirement, if a facility needs labeling controls to
address one or more of the hazards that it has identified in its hazard analysis, then we estimate
those labeling controls to include, at a minimum, a review of label application that addresses
applying the correct label to a particular product. We expect that label controls will be an
important preventive control for facilities whose products contain allergens.
i. Proper Storage and Use of Food Allergens
Food allergen controls must include the procedures to ensure proper storage, handling
and use of raw materials and ingredients containing food allergens and proper storage of finished
products to protect foods from allergen cross-contact. Facilities subject to subpart C, Hazard
Analysis and Risk-Based Preventive Controls that use any food allergens are subject to this
requirement. Results from the Food GMP survey indicate that approximately 60 percent of
facilities with fewer than 20 employees, 74 percent of facilities with 20 to 99 employees, 68
percent of facilities with 100 to 499 employees, and approximately 79 percent of facilities with
over 500 employees do not manufacture or process ingredients that are, or are derived from, any
of the eight main allergens that currently require labeling. For those facilities that do use at least
one of these main food allergens, approximately 96 percent of facilities with fewer than 20
employees, approximately 72 percent of facilities with 20 to 99 employees, approximately 68
percent of facilities with 100 to 499 employees, and approximately 42 percent of facilities with
over 500 employees do not appear to have complete written food allergen control plans. Further,

90
because not all facilities would need procedures to protect against allergen cross-contact, and
because we lack data about how many facilities there are with allergens, we assume that between
25 to 75 percent of all facilities with allergens will require written procedures.
Based on our expert elicitation, we assume that it will take six to eight hours to develop
facility-specific procedures. Facilities without procedures will require training in the proper use
of the procedures. We assume that it will take approximately one hour to train staff in the correct
use of the procedures. The employees that will monitor and verify the correct use of the food
allergen controls are likely to be the same employees that will monitor and verify the sanitation
controls. Our estimate for the costs to develop the written procedures for monitoring and
verifying the food allergen controls are included in the costs to develop the written procedures
for monitoring and for verifying the sanitation controls. Only one set of written procedures
would need to be developed because the monitoring and verification functions are so similar.
We have estimated allergen control costs for manufacturing facilities only; we do not expect
wholesalers or warehouses to need allergen controls. Table 27 summarizes our costs estimates to
adopt allergen controls.
Table 27. Estimated Costs for Food Allergen Controls for Proper Storage by Facility Size
<20
employees 20 to 99
employees 100 to 499 employees
>500 employees Total
Total Domestic Manufacturing Facilities subject to Subpart C Hazard Analysis and Risk-Based Preventive Controls 5,185 7,177 3,387 536 16,285 % Facilities that use any of 8 major allergens 60% 74% 68% 79% % Facilities w/o written procedures for food allergen controls 96% 72% 68% 42% If 50% require allergen control procedures based on a range of 25% to 75% 50% 50% 50% 50% Total Facilities w/o written procedures subject to subpart C Hazard Analysis and Risk-Based Preventive Controls 1,487 1,901 787 88 4,263

91
Cost per Facility to Develop Facility-specific written procedures $427 $641 $793 $976 Subtotal Cost to Develop Written Procedures for Food Allergen Controls $1m $2m $1m $0m $5m Cost per Facility to Annually Update Facility-specific Written Procedures $43 $64 $79 $98 Subtotal Cost to Update Written Procedures Annually $0m $0m $0m $0m $0m Number of Workers that Require Training 5 to 15 10 to 20 20 to 30 40 to 60 Training Costs per Facility (Hourly Wage for Production Worker x 2 hrs x no of workers x Wage for Manager Trainer) $542 $752 $1,172 $2,222
Subtotal Annual Training Costs $1m $2m $1m $0m $5m One-time Cost for Containers, Partitions and other equipment per facility $0 to $2,000 $0 to $5,000 $0 to $10,000 $0 to $10,000 Subtotal Cost for Container/Partition/Design to Prevent Cross-Contact $1m $5m $4m $1m $11m
Total One-time Costs $3m $7m $5m $1m $16m
Total Recurring Costs $1m $3m $2m $0m $7m Annualized one-time cost + recurring costs (7%) $8m Annualized one-time cost + recurring costs (3%) $8m Avg Annual Costs per Affected Facility $1,300 $2,100 $3,700 $7,000 $2,200
*Numbers might not add up due to rounding.
ii. Label Application Review
Food allergen controls for labels should include checking the labels on finished products
to ensure that the correct label is applied. We assume that only facilities subject to subpart C,
Hazard Analysis and Risk-Based Preventive Controls that handle food allergens will need to
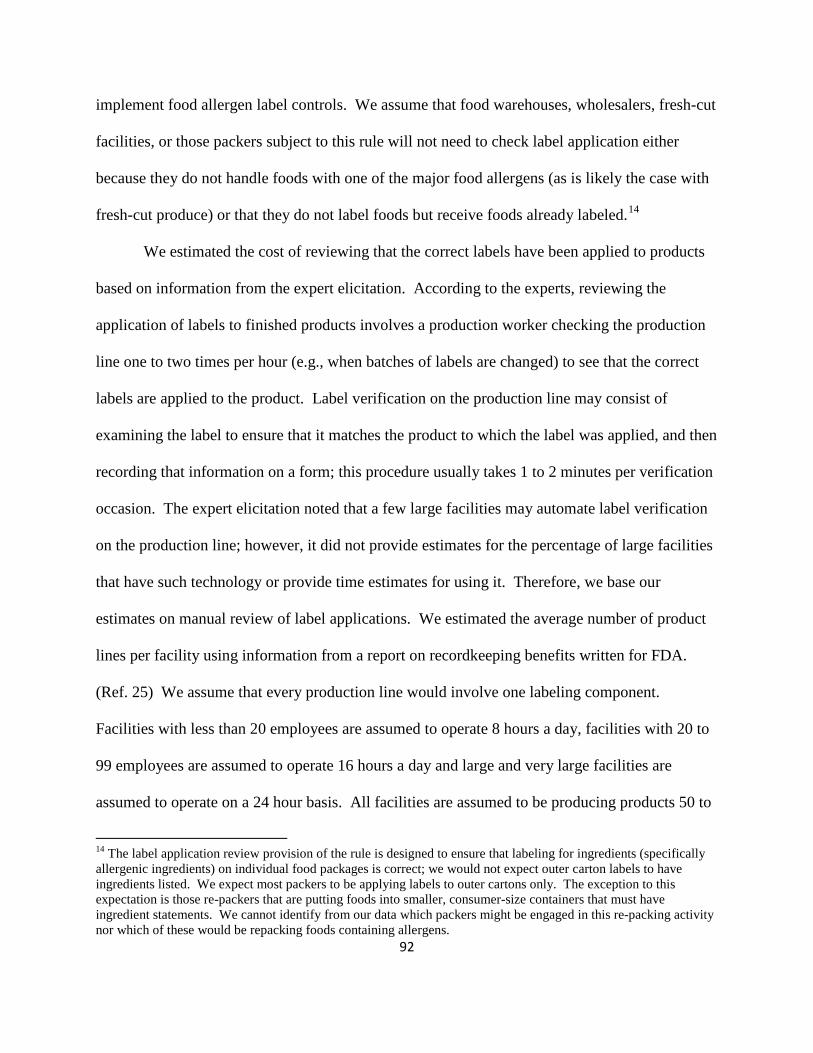
92
implement food allergen label controls. We assume that food warehouses, wholesalers, fresh-cut
facilities, or those packers subject to this rule will not need to check label application either
because they do not handle foods with one of the major food allergens (as is likely the case with
fresh-cut produce) or that they do not label foods but receive foods already labeled.14
We estimated the cost of reviewing that the correct labels have been applied to products
based on information from the expert elicitation. According to the experts, reviewing the
application of labels to finished products involves a production worker checking the production
line one to two times per hour (e.g., when batches of labels are changed) to see that the correct
labels are applied to the product. Label verification on the production line may consist of
examining the label to ensure that it matches the product to which the label was applied, and then
recording that information on a form; this procedure usually takes 1 to 2 minutes per verification
occasion. The expert elicitation noted that a few large facilities may automate label verification
on the production line; however, it did not provide estimates for the percentage of large facilities
that have such technology or provide time estimates for using it. Therefore, we base our
estimates on manual review of label applications. We estimated the average number of product
lines per facility using information from a report on recordkeeping benefits written for FDA.
(Ref. 25) We assume that every production line would involve one labeling component.
Facilities with less than 20 employees are assumed to operate 8 hours a day, facilities with 20 to
99 employees are assumed to operate 16 hours a day and large and very large facilities are
assumed to operate on a 24 hour basis. All facilities are assumed to be producing products 50 to
14 The label application review provision of the rule is designed to ensure that labeling for ingredients (specifically allergenic ingredients) on individual food packages is correct; we would not expect outer carton labels to have ingredients listed. We expect most packers to be applying labels to outer cartons only. The exception to this expectation is those re-packers that are putting foods into smaller, consumer-size containers that must have ingredient statements. We cannot identify from our data which packers might be engaged in this re-packing activity nor which of these would be repacking foods containing allergens.

93
52 weeks per year.
We based our assumptions about the estimated percentage of facilities that use allergens
and do not review label application using information from the Food GMP survey. In the Food
GMP survey, we asked facilities that handle products containing one of the major allergens two
questions relating to reviewing label application. First, we asked facilities whether they have
allergen control plans that address processes to verify that they use the appropriate labels.
Second, we asked facilities whether they have written procedures to verify that labels match their
intended products at the beginning or end of every production run or if they have written
procedures to reconcile the number of labels issued and the number of labels used. We use this
information in Table 27 to establish a baseline describing which facilities handling raw materials
and other ingredients containing allergens and not conducting label application review will need
to do so and at what cost.
We include the burden of recordkeeping for label review in Table 28. We assume that a
preventive controls qualified individual will review label application records once a week for all
product lines.
Table 28. Costs for Label Application Review
<20
employees 20 to 99
employees 100 to 499 employees >500 employees Total
Total Number Of Domestic Manufacturing Facilities 5,185 7,177 3,387 536 16,285 Percent Of Facilities That Do Not Handle Allergens 59% 74% 68% 76% Remaining Facilities Estimated to Handle Allergens 2,117 1,833 1,078 131 5,158 Percent Of Facilities That Use Allergens and Do Not Review Label Application 1.5% 3.5% 2.2% 0.0% Number Of Facilities That Need To Start Label Application Review 32 64 24 0 120 Frequency of Review Per 1 1 1 1
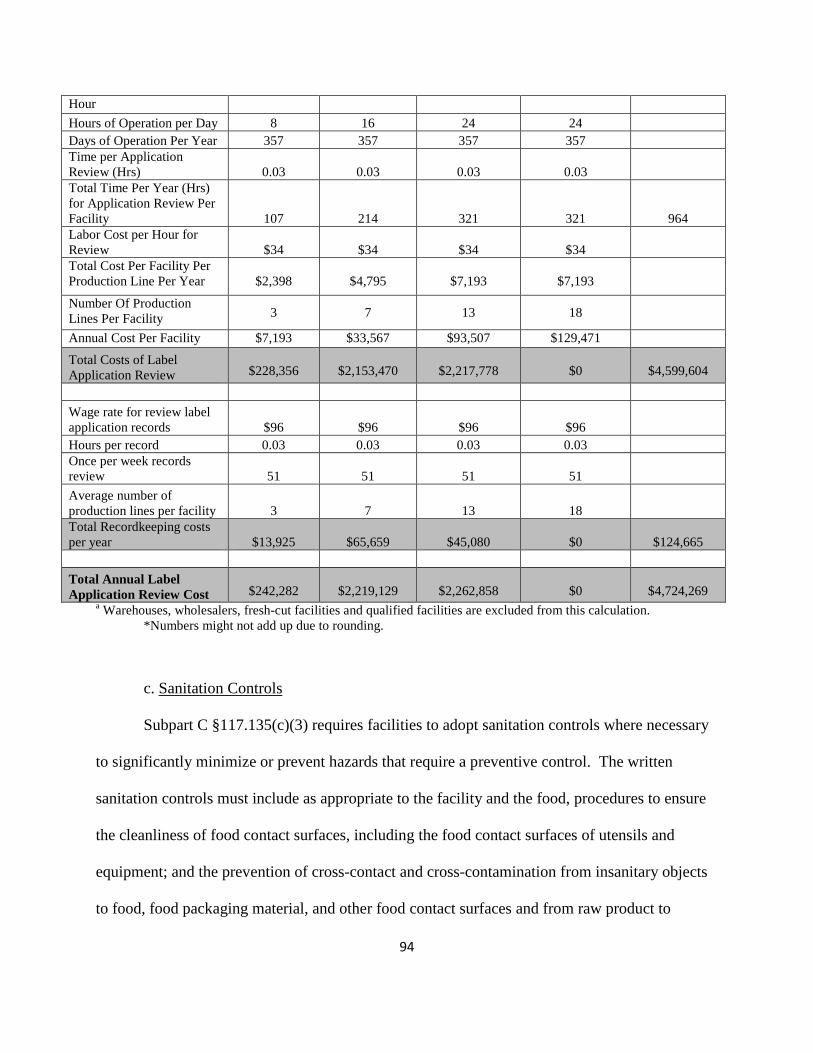
94
Hour Hours of Operation per Day 8 16 24 24 Days of Operation Per Year 357 357 357 357 Time per Application Review (Hrs) 0.03 0.03 0.03 0.03 Total Time Per Year (Hrs) for Application Review Per Facility 107 214 321 321 964 Labor Cost per Hour for Review $34 $34 $34 $34 Total Cost Per Facility Per Production Line Per Year
$2,398
$4,795
$7,193
$7,193
Number Of Production Lines Per Facility 3 7 13 18
Annual Cost Per Facility $7,193 $33,567 $93,507 $129,471
Total Costs of Label Application Review
$228,356
$2,153,470
$2,217,778
$0
$4,599,604
Wage rate for review label application records $96 $96 $96 $96 Hours per record 0.03 0.03 0.03 0.03 Once per week records review 51 51 51 51 Average number of production lines per facility 3 7 13 18 Total Recordkeeping costs per year
$13,925
$65,659
$45,080
$0
$124,665
Total Annual Label Application Review Cost
$242,282
$2,219,129
$2,262,858
$0
$4,724,269
a Warehouses, wholesalers, fresh-cut facilities and qualified facilities are excluded from this calculation. *Numbers might not add up due to rounding.
c. Sanitation Controls
Subpart C §117.135(c)(3) requires facilities to adopt sanitation controls where necessary
to significantly minimize or prevent hazards that require a preventive control. The written
sanitation controls must include as appropriate to the facility and the food, procedures to ensure
the cleanliness of food contact surfaces, including the food contact surfaces of utensils and
equipment; and the prevention of cross-contact and cross-contamination from insanitary objects
to food, food packaging material, and other food contact surfaces and from raw product to

95
processed product.
Sanitation controls are the procedures to control sources of environmental pathogens,
biological hazards due to employee handling, and food allergens in order to prevent
contamination and cross-contact of food products. Effective sanitation controls remove
undesirable material from the food contact surfaces and the environment. When sanitation
controls are not effective, microorganisms and food product residues may be present at levels
that can affect the safety of the food.
As we mention in response to the comments, existing requirements in 21 CFR 110 are for
establishments to maintain clean and sanitary conditions of buildings and fixtures and to clean
and sanitize equipment and utensils. The analysis in this RIA only addresses actual regulatory
changes that would cause behavioral changes. We are not introducing a new requirement to clean
and sanitize so no new behavioral change would be caused by our rule so the costs of cleaning
and sanitizing are not included in this analysis.
We based our analysis on the costs to develop separate sanitation control procedures for
food contact surfaces, raw materials and storage areas, and for combined in-process production
and finished goods areas. We lack data about how many facilities will require sanitation controls
so we assumed that approximately 50 percent of all manufacturing facilities subject to subpart C
that stated that they lack sanitation controls in our survey would adopt them.
i. Cleanliness of Food Contact Surfaces
Section §117.135(c)(3) requires that facilities develop procedures to promote the
cleanliness of food contact surfaces. The written procedures should describe the cleaning steps
for the pieces of equipment and utensils with food contact surfaces, including what detergents,
sanitizers and cleaning tools to use. To estimate the cost to comply, we first estimated the

96
number of facilities that lack the procedures. The universe of facilities that are covered by this
provision are all facilities that are subject to subpart C, Hazard Analysis and Risk-Based
Preventive Controls.
Our section for the revisions to subpart B, Good Manufacturing Practices, at §117.35
addresses the requirements and the impact of the revisions to sanitary operations.15 To estimate
the impact of adopting risk-based sanitation controls to comply with §117.135(c)(3), we used the
results of the FDA GMP survey. In response to a question about whether written procedures for
cleaning your food-contact surfaces exist, about 29 percent of facilities with fewer than 20
employees, 16 percent of facilities with 20 to 99 employees, and 11 percent of facilities with 100
to 499 employees responded in the negative. All responding facilities with 500 or more
employees indicated that they have written procedures for cleaning their food contact surfaces.
FDA used the expert elicitation to help estimate the cost to develop new written
procedures for food contact surfaces. From the expert elicitation final report, the experts
summarized their estimate for the low and high costs necessary to develop facility-specific and
equipment-specific written procedures. From the expert elicitation, the primary factor that
affects the effort, and therefore the cost, is facility size and numbers of pieces of equipment. We
assume that it typically takes six to eight hours per piece of equipment to develop the written
procedures, which includes the time to review their procedures and equipment requirements,
hold internal meetings, develop an initial draft, and then to develop a final draft. As previously
mentioned sanitation workers should be appropriately trained. Training typically includes
chemical safety and job-specific training on the specific written procedures (Ref. 23). We
15 The Part C sanitation controls requirements are largely for written procedures to help ensure that the sanitation practices targeting control of hazards are adequate and are conducted as necessary for the requirements in Part B. Part B does not require written procedures.
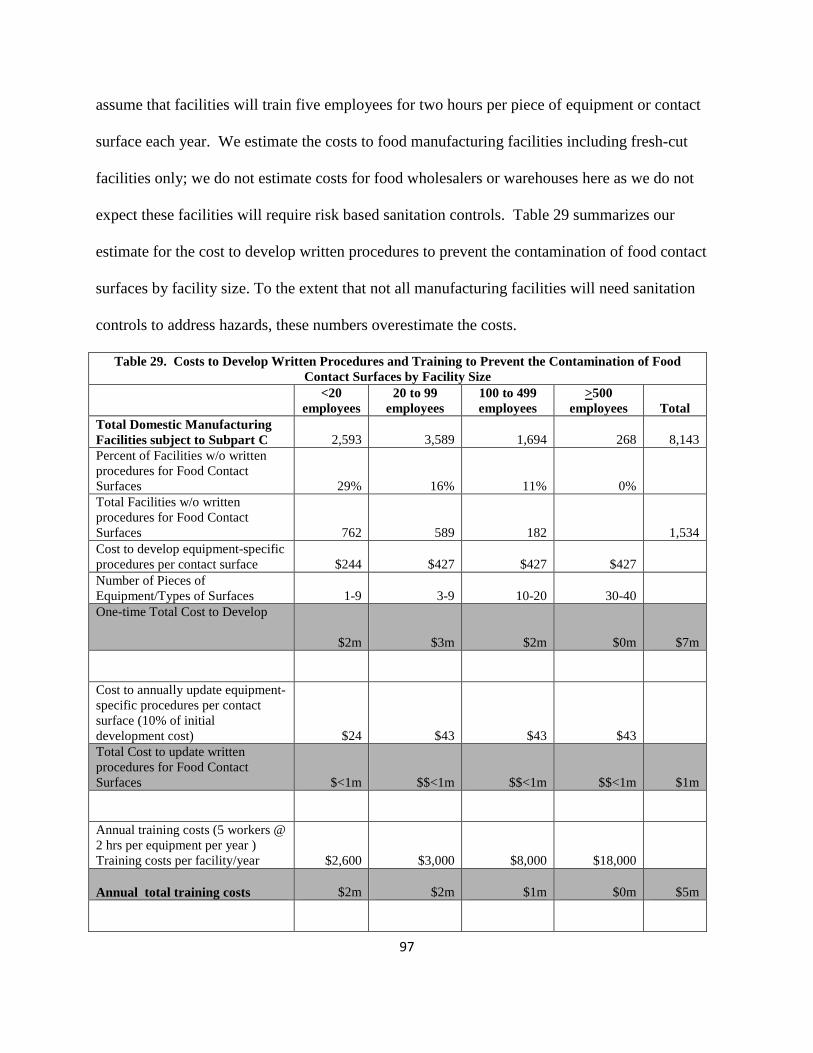
97
assume that facilities will train five employees for two hours per piece of equipment or contact
surface each year. We estimate the costs to food manufacturing facilities including fresh-cut
facilities only; we do not estimate costs for food wholesalers or warehouses here as we do not
expect these facilities will require risk based sanitation controls. Table 29 summarizes our
estimate for the cost to develop written procedures to prevent the contamination of food contact
surfaces by facility size. To the extent that not all manufacturing facilities will need sanitation
controls to address hazards, these numbers overestimate the costs.
Table 29. Costs to Develop Written Procedures and Training to Prevent the Contamination of Food Contact Surfaces by Facility Size
<20
employees 20 to 99
employees 100 to 499 employees
>500 employees Total
Total Domestic Manufacturing Facilities subject to Subpart C 2,593 3,589 1,694 268 8,143 Percent of Facilities w/o written procedures for Food Contact Surfaces 29% 16% 11% 0% Total Facilities w/o written procedures for Food Contact Surfaces 762 589 182 1,534 Cost to develop equipment-specific procedures per contact surface $244 $427 $427 $427 Number of Pieces of Equipment/Types of Surfaces 1-9 3-9 10-20 30-40 One-time Total Cost to Develop written procedures for Food Contact Surfaces $2m $3m $2m $0m $7m
Cost to annually update equipment-specific procedures per contact surface (10% of initial development cost) $24 $43 $43 $43 Total Cost to update written procedures for Food Contact Surfaces $<1m $$<1m $$<1m $$<1m $1m
Annual training costs (5 workers @ 2 hrs per equipment per year ) Training costs per facility/year $2,600 $3,000 $8,000 $18,000
Annual total training costs $2m $2m $1m $0m $5m

98
Annual training records costs (one record (12 minutes/record) per worker per equipment per year) $$<1m $$<1m $$<1m $0m $$<1m
Total one-time costs $2m $3m $2m $0m $7m
Total annual costs $2m $2m $2m $0m $6m Annualized one-time cost + recurring costs (7%) $6m Annualized one-time cost + recurring costs (3%) $6m
Average Costs per Facility $3,000 $5,000 $11,000 $0 $5,000 *Numbers might not add up due to rounding.
ii. Prevention of Cross-Contamination and Protection of Food from Adulteration in Raw
Materials Receiving and Storage and In-Process and Finished Production Areas of Facility
Section 117.135(c)(3) requires that facilities develop written procedures to prevent allergen
cross-contact and cross-contamination from insanitary objects and personnel to food, food
packaging material and other food contact surfaces and from raw product to processed product.
Common practices that can cause cross-contact and cross-contamination include inadequate
cleaning of shared processing and packaging equipment, inadequate control of airborne dusts,
and inadequate attention to the traffic patterns created by equipment and personnel for the
movement of raw and processed materials through the facility.
The survey also asked “Do you have written procedures for cleaning your production
areas?” Almost 39 percent of facilities with fewer than 20 employees answered they do not have
written procedures. About 14 percent of facilities with 20 to 99 employees answered they do
not. The survey asked, “Do you have written procedures for cleaning your finished product
storage areas?” Almost 52 percent of facilities with fewer than 20 employees answered they do

99
not have written procedures. About 27 percent of facilities with 20 to 99 employees answered
they do not, and 27 percent of facilities with 100 to 499 employees responded in the negative.
Every facility with 500 or more employees answered that they have written procedures for each
of these questions. If a facility answered “no” to these questions, then we determined that they
lack written procedures and would need to develop them.
From FDA’s expert elicitation, we asked about the use of equipment-specific written
procedures, to protect against cross-contamination. Based on our expert elicitation, we assume
that facilities with fewer than 20 employees will have one to five pieces of equipment or
packaging material or other food items that will require written control procedures. Our experts
agreed that it typically takes six to eight hours per piece of equipment to develop these
procedures, which includes the time to evaluate the problem and write the procedures. We
assume that the effort required to develop sanitation control procedures is primarily a one-time
expense, although facilities also need to revise or add new written procedures when they add new
equipment or replace old equipment. We assume the annual sanitation control procedures update
can be roughly estimated as 10 percent of the initial cost, which includes the annual “turnover”
in plant or equipment layout or equipment.
We estimate costs to food manufacturing facilities only for Tables 30 and 31. We do not
estimate costs for food wholesalers or warehouses here as we expect few of these facilities to
have food exposed to the environment; therefore, these types of facilities would likely not have
cross-contact or cross-contamination issues.
Table 30. Estimated Costs to Develop Written Procedures to Prevent Cross-Contact and Cross-Contamination in Raw Materials Storage Areas by Facility Size
<20 employees
20 to 99 employees
100 to 499 employees
>500 employees
Total
Total number of Domestic Manufacturing Facilities 2,593 3,589 1,694 268 8,143
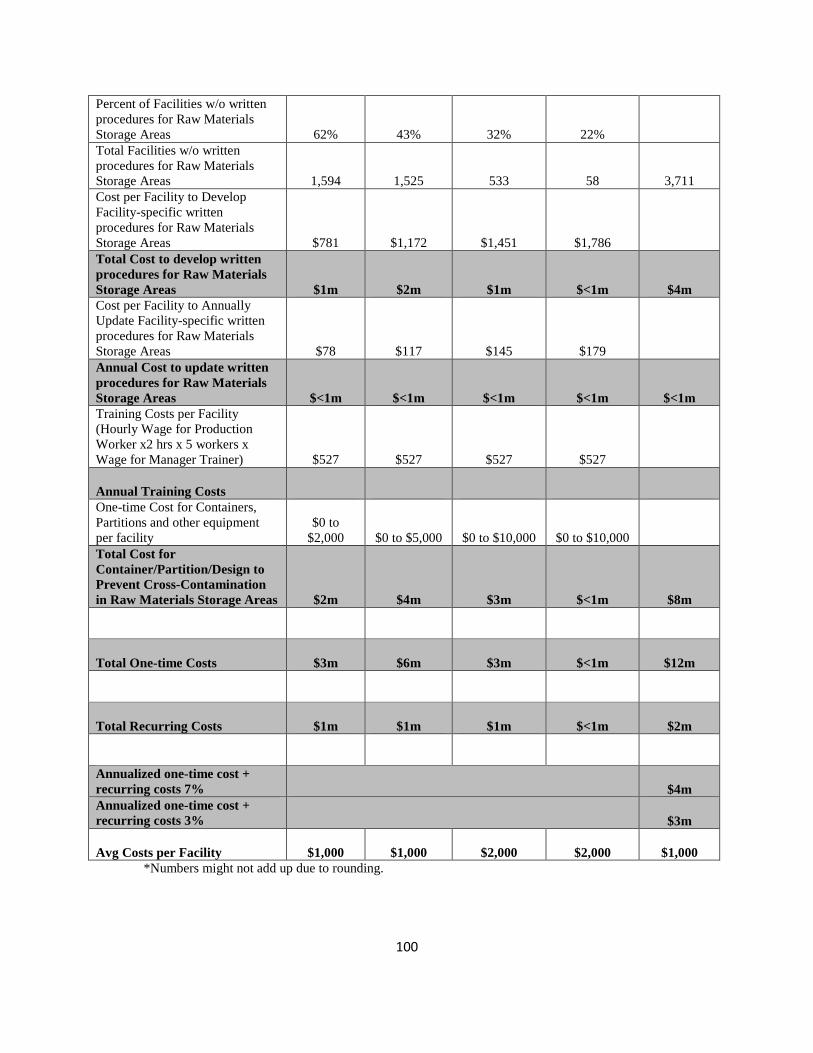
100
Percent of Facilities w/o written procedures for Raw Materials Storage Areas 62% 43% 32% 22% Total Facilities w/o written procedures for Raw Materials Storage Areas 1,594 1,525 533 58 3,711 Cost per Facility to Develop Facility-specific written procedures for Raw Materials Storage Areas $781 $1,172 $1,451 $1,786 Total Cost to develop written procedures for Raw Materials Storage Areas $1m $2m $1m $<1m $4m Cost per Facility to Annually Update Facility-specific written procedures for Raw Materials Storage Areas $78 $117 $145 $179 Annual Cost to update written procedures for Raw Materials Storage Areas $<1m $<1m $<1m $<1m $<1m Training Costs per Facility (Hourly Wage for Production Worker x2 hrs x 5 workers x Wage for Manager Trainer) $527 $527 $527 $527
Annual Training Costs One-time Cost for Containers, Partitions and other equipment per facility
$0 to $2,000 $0 to $5,000 $0 to $10,000 $0 to $10,000
Total Cost for Container/Partition/Design to Prevent Cross-Contamination in Raw Materials Storage Areas $2m $4m $3m $<1m $8m
Total One-time Costs $3m $6m $3m $<1m $12m
Total Recurring Costs $1m $1m $1m $<1m $2m
Annualized one-time cost + recurring costs 7% $4m Annualized one-time cost + recurring costs 3% $3m
Avg Costs per Facility $1,000 $1,000 $2,000 $2,000 $1,000 *Numbers might not add up due to rounding.

101
Table 31. Costs to Develop Written Procedures to Prevent Cross-Contact and Cross-Contamination in Production & In-Process Areas by Facility Size
<20
employees 20 to 99
employees 100 to 499 employees
>500 employees Total
Total number of Domestic Manufacturing Facilities 2,593 3,589 1,694 268 8,143 Percent of Facilities w/o written procedures for Production Areas 52% 27% 27% 22% Total Facilities w/o written procedures for Production Areas 1,335 951 449 58 2,792 Cost per Facility to Develop Facility-specific written procedures for Production Areas $781 $1,172 $1,451 $1,786 Total Cost to develop written procedures for Production Areas $1m $1m $1m $<10m $3m Cost per Facility to Annually Update Facility-specific written procedures for Production Areas $78 $117 $145 $179 Annual Cost to update written procedures for Production Areas $<1m $<1m $<1m $<1m $<1m Training Costs per Facility (Hourly Wage for Production Worker x2 hrs x 5 workers x Wage for Manager Trainer) $527 $527 $527 $527
Annual Training Costs $1m $1m $<1m $<1m $1m One-time Cost for Containers and Partitions per facility
$0 to $2,000 $0 to $5,000 $0 to $10,000 $0 to $10,000
Total Cost for Container/Partition/Design to Prevent Cross-Contamination in Production Areas $1m $2m $3m $<1m $6m
Total one-time Costs $2m $4m $3m $<1m $9m
Total Recurring Costs $1m $1m $<1m $<1m $2m
Annualized one-time cost + recurring costs @ 7% $3m Annualized one-time cost + recurring costs @ 3% $3m
Avg Costs per Facility $1,000 $1,000 $2,000 $2,000 $1,000 *Numbers might not add up due to rounding.
102
iii. Monitoring and Verification of Sanitation Control Procedures
Section 117.145 requires the owner, operator, or agent in charge of a facility to also
establish and implement written procedures for monitoring the sanitation control procedures, and
monitoring procedures must include the monitoring frequency. Our §117.155(a)(2) and (b)
require facilities to establish and implement written procedures to verify that the preventive
controls are adequate for controlling the identified hazards and the procedures must verify that
the monitoring is being conducted in accordance with §117.145. As before, we assume that the
facilities that lack written procedures for their sanitation controls will also lack written
procedures to monitor and verify that their sanitation procedures meet the requirements. To
estimate the sanitation control monitoring costs, we assume that only manufacturing facilities
will incur costs to comply with this requirement and that it will take four hours for a facility with
20 or fewer employees to prepare the written procedures, seven hours for larger facilities, and up
to 14 hours for the largest facilities. We assume that it will take four hours to train two
supervisors in the new procedures and it will take between 2 to 4 minutes to record that the
managers are trained in the new sanitation control procedures. To determine the time to monitor
the sanitation controls to ensure they are performed correctly, our experts agreed that it will take
a trained supervisor 2 to 4 minutes to monitor and document their observations when following a
checklist for a total of 89 hours per year for a facility with fewer than 20 employees, 179 hours
per year for a facility with 20 to 99 employees, and 1,071 hours per year for all larger facilities
(Ref. 23) We assume that verification will typically be performed by the visual inspection of the
sanitation controls as a check on the sanitation workers and monitoring activities and by careful
records review. We assume that it will take 89 hours per year per facility that does not already
perform verification. Table 32 summarizes our estimate of the costs to conduct these monitoring

103
and verification activities.
Table 32. Costs to Develop and Implement Monitoring and Verification Sanitation Controls by Facility Size
<20
employees 20 to 99
employees 100 to 499 employees
> 500 employees Total
Total number of Domestic Manufacturing Facilities subject to subpart C Hazard Analysis and Risk-Based Preventive Controls 2,593 3,589 1,694 268 8,143 Percent without Monitoring and Verification Procedures for Sanitation Controls 48% 15% 4% 0% Total Facilities without Monitoring and Verification Sanitation Procedures 1,244 538 59 0 1,841 Hourly Wage Rate for Qualified Individuals $112 $112 $112 $112 Labor Hrs to Develop Sanitation Monitoring Procedures 4 7 7 14 Subtotal Cost to Develop Monitoring Procedures for Sanitation Controls (one-time cost) $1m $<1m $<1m $<1m $1m Labor Hrs to Annually Update Monitoring Procedures 1 2 2 4 Subtotal Cost to Annually Update Monitoring procedures for Sanitation Controls (annual cost) $<1m $<1m $<1m $0m $<1m Number of Employees that Require Annual Training in Monitoring Procedures for Sanitation Controls per Facility 2 2 6 8 Hours of Annual Training per Employee 4 4 4 4
Hourly Wage Rate for Production Line Workers $34 $34 $34 $34 Subtotal Costs to Train Managers in Monitoring Sanitation Controls (annual cost) $1m $1m $<1m $0m $2m Percent facilities that do not maintain monitoring 40% 17% 10% 0%

104
records
Minutes per Record to Document Monitoring of Sanitation Controls 2 to 4 2 to 10 6 to 17 6 to 17 Total hours per year for monitoring 89 179 1071 1071 Subtotal Recordkeeping Costs in Monitoring and Verification Sanitation Procedures $3m $4m $6m $0m $13m Total hours per year for verification 89 89 89 89 Sanitation Control Verification – Visual Observation and Records Review (Annual) – based on 89 hours per year of management time for visual observation and records review $9m $5m $1m $0m $16m Total One-Time Costs to prepare monitoring and verification procedures $1m $<1m $<1m $0m $1m Total Annual Monitoring and Verification Sanitation Control Costs $14m $10m $7m $0m $31m
Total Costs Annualized (One-Time annualized + On-Going) (7%) $27m Total Costs Annualized (One-Time annualized + On-Going) (3%) $27m
Avg Costs per Facility $13,000 $16,000 $46,000 $0 $17,000 *Numbers might not add up due to rounding.
5. Supplier Approval and Verification Program – Part 117, New Subpart G When a receiving facility identifies a hazard requiring a supplier-applied control, it must
establish and implement a risk-based supply chain program (§117.405), including a written
program, approval of suppliers, determination of appropriate supplier verification activities and
their frequency, conduct of the activities, and records. The verification activities of such a
105
supply chain program may include onsite audits, sampling and testing of the raw materials or
other ingredients, reviewing supplier food safety records or other supplier verification activities
as appropriate based on the risk associated with the ingredient and the supplier. When a hazard
controlled by the supplier is one for which there is a reasonable probability that exposure to the
hazard will result in serious adverse health consequences or death to humans, the receiving
facility must have documentation of an annual onsite audit of the supplier (unless the facility
documents that other verification activities or less frequent onsite auditing of the supplier
provide adequate assurance that the hazards are controlled).
Receiving facilities that determine they need a supply chain program must have the
program in writing. Such a written program, in determining the appropriate verification
activities, must consider the hazard analysis of the food, including the nature of the hazard
controlled before receipt of the raw material or other ingredient; the entity that will be applying
the preventive controls for the hazards requiring a supplier-applied control; supplier
performance, including the supplier’s procedures, processes, and practices related to the safety of
the raw material and other ingredients; any applicable FDA food safety regulations and
information relevant to the supplier’s regulatory compliance with those regulations; the
supplier’s food safety history; results from testing raw materials and other ingredients; audits
relating to the safety of the food; responsiveness of supplier in correcting problems; and any
other factors as appropriate. We estimate that it will take a production manager 16 hours to write
such a program. We estimate this cost for facilities that manufacture food in the product
categories that we have identified as potentially applicable with respect to suppliers controlling a
hazard. Table 33 shows the cost of writing a program for these facilities.

106
We received several comments on the burden we estimated for supplier controls in the
PRIA. Some comments suggested that we failed to include enough suppliers when calculating
the annual costs of audits. We calculated costs of an audit on a per supplier basis, so we
calculated the costs based on the number of suppliers; not the number of manufacturers times
their individual number of suppliers. Therefore, we have included in our analysis audit costs for
all suppliers that would likely have an audit conducted as a supplier verification activity based on
the nature of ingredient or type of product they are supplying. However, we do add additional
costs in the final rule estimates for audits to account for the fact that each supplier may share the
documentation from the audit with multiple customers. We also include, as we signaled in the
supplemental PRIA, the costs of farm audits for some farms that are suppliers to
manufacturers/processors. We estimate that 5 percent to 10 percent of farms covered under the
produce safety rule that do not sell to a manufacturer/processor that employs a kill-step will need
an audit as an ingredient supplier to food manufacturing and processing.
Some comments suggested that our estimated cost per audit was reasonable; other
comments suggested that our audit cost was underestimated. In particular, some comments
recommended an increase in travel costs related to conducting an audit and some comments
recommended an increase in the fees for the actual audit. We have increased both the cost per
audit and the travel and incidental costs associated with audits for our final rule analysis. We
have increased the audit costs for non-farm audits from the $2600 to $5000 per audit estimated in
the supplemental PRIA to $5000 and $7500 per audit, depending on facility size. We have
increased travel and incidental costs from the estimated $625 per audit in the supplemental PRIA
to $1000 for the final rule.

107
Comments suggested we needed to include some indirect costs for the opportunity cost of
employee time and resources that need to be diverted to give attention to the auditor conducting
the facility audit. We agree that it is likely that at least one employee would need to be
facilitating the audit or auditor in some fashion to complete the audit. We have added these
opportunity costs to our analysis.
Some comments were concerned that we did not include the costs of corrective actions
that resulted from supplier audits. We agree that costs of corrective actions as the result of an
audit should be included and have added those costs to the final rule audit cost estimates. We
base our corrective actions costs on those used in the corrective actions section of this analysis
and, in the case of farms, the costs of corrective actions for farms as estimated under the produce
safety rule.
Some comments asserted that the costs of sampling for ingredient testing were too low
and did not include the costs for chemical tests for allergens, heavy metals, natural toxins or
unapproved colors or pesticide residues. We have increased the costs of the tests used for
pathogen testing of ingredients for the final analysis. Ingredient testing is a supplier verification
activity option; it will be utilized only if this testing is useful in verifying that the supplier is
adequately controlling the hazard. It is not our understanding that industry commonly conducts
allergen testing on ingredients to verify supplier controls for allergen cross-contact. It is also our
understanding that it is a usual industry practice to conduct testing for natural toxins as
appropriate to the commodity and, where existing commodity programs address natural toxins
(e.g., aflatoxin in peanuts, mycotoxin testing in grains) no additional costs would result as a
result of this rule. It is also our understanding that testing for heavy metals or colors is also
already used as necessary. We have included in the final rule analysis some costs for testing
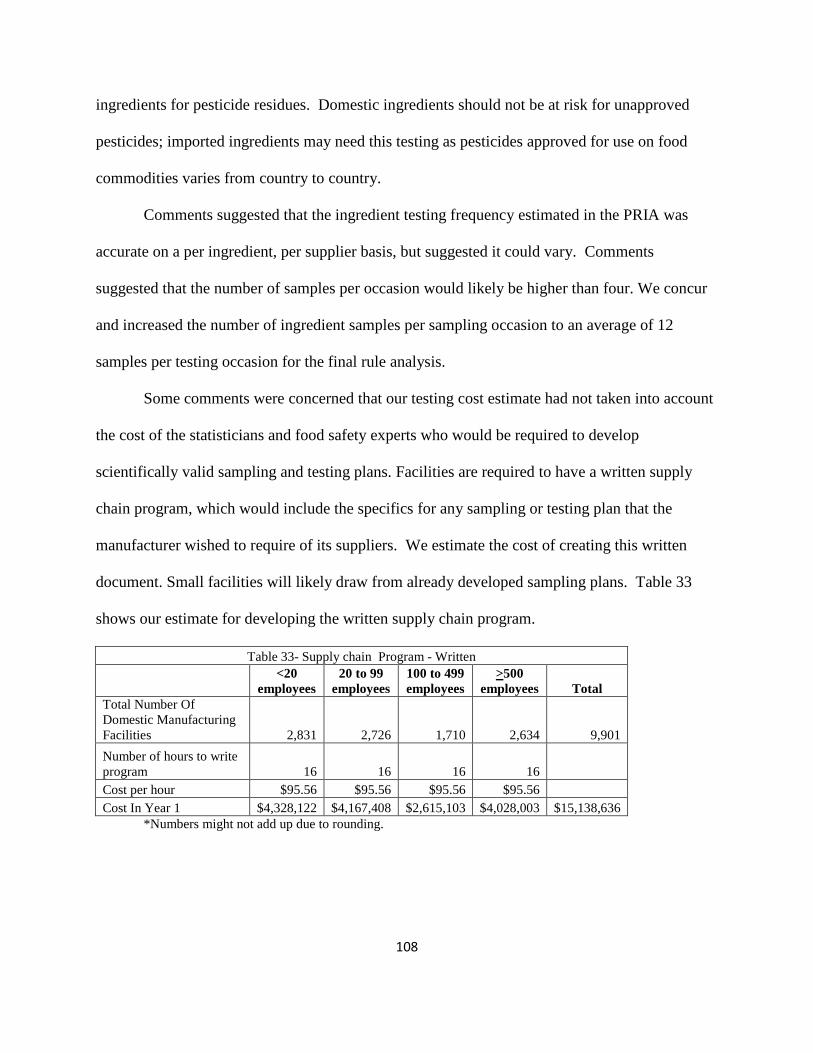
108
ingredients for pesticide residues. Domestic ingredients should not be at risk for unapproved
pesticides; imported ingredients may need this testing as pesticides approved for use on food
commodities varies from country to country.
Comments suggested that the ingredient testing frequency estimated in the PRIA was
accurate on a per ingredient, per supplier basis, but suggested it could vary. Comments
suggested that the number of samples per occasion would likely be higher than four. We concur
and increased the number of ingredient samples per sampling occasion to an average of 12
samples per testing occasion for the final rule analysis.
Some comments were concerned that our testing cost estimate had not taken into account
the cost of the statisticians and food safety experts who would be required to develop
scientifically valid sampling and testing plans. Facilities are required to have a written supply
chain program, which would include the specifics for any sampling or testing plan that the
manufacturer wished to require of its suppliers. We estimate the cost of creating this written
document. Small facilities will likely draw from already developed sampling plans. Table 33
shows our estimate for developing the written supply chain program.
Table 33- Supply chain Program - Written
<20
employees 20 to 99
employees 100 to 499 employees
>500 employees Total
Total Number Of Domestic Manufacturing Facilities 2,831 2,726 1,710 2,634 9,901 Number of hours to write program 16 16 16 16 Cost per hour $95.56 $95.56 $95.56 $95.56 Cost In Year 1 $4,328,122 $4,167,408 $2,615,103 $4,028,003 $15,138,636
*Numbers might not add up due to rounding.

109
a. Audits of Suppliers
For purposes of this analysis, as in the PRIA, FDA experts have identified facilities and
farms that provide ingredients where an audit would likely be the best activity for the receiving
facility to verify that the ingredient supplier controlled the hazard. The receiving facility, or
another entity acting in service of the receiving facility, will determine the most appropriate
verification activity. Table 34 shows our estimates for the cost to conduct audits for non-farm
suppliers.
Table 34. Annual Costs of Audits of Ingredient Suppliers SIC Code SIC Description
<20 employees
20 to 99 employees
100 to 499 employees
> 500 employees Total
2021 Butter 27 43 24 0 94 20220000 Cheese; natural and processed a 72 59 40 3 173 20229902 Natural cheese a 42 34 16 2 93
20230000 Dry, condensed and evaporated dairy products a 26 27 15 2 69
20230300 Dried and powdered milk and milk products 10 5 0 0 15
20230303 Dried milk 2 6 1 1 10 20230304 Dried nonfat milk 0 2 0 0 2 20230306 Dried whey 1 3 0 0 4 20230307 Milk preparations, dried 1 2 1 0 4 20230308 Powdered buttermilk 0 0 0 0 0 20230310 Powdered milk 2 8 6 0 16 20230311 Powdered skim milk 0 3 0 0 3 20230312 Powdered whey 1 3 2 0 6
20340000 Dried and dehydrated fruits, vegetables and soup mixes a 38 26 9 2 74
20340300 Dried and dehydrated vegetables 13 7 0 0 20
20340303 Vegetables, dried or dehydrated (except freeze-dried) 6 5 0 1 12
20370100 Frozen fruits and vegetables 6 6 5 3 20
20370104 Vegetables, quick frozen & cold pack, excl. potato products 7 13 28 5 53
2041 Flour, Grain Milling 255 246 69 9 579 2045 Flour, Blended & Prepared 90 82 52 6 230 2046 Wet Corn Milling 54 45 29 6 134 2052 Cookies & Crackers 377 232 116 28 753 2066 Chocolate & Cocoa Products 316 117 54 17 504 2068 Salted & Roasted Nuts & Seeds 107 100 33 2 242 2098 Macaroni, Spaghetti & Noodles 159 51 28 4 242

110
20990400 Seasonings and spices 79 47 8 1 135 20990402 Chili pepper or powder 9 5 1 0 15 20990403 Seasonings: dry mixes 35 13 7 0 55 20990404 Spices, including grinding 58 26 19 1 104 20990500 Sauce, gravy, dressing, and dip mixes 42 10 2 0 54 20990504 Sauces: dry mixes 10 3 0 0 13 Total 1,844 1,228 563 92 3,727
Facilities excluded by Very Small Business Definition 1,282 61 17 2 1,362
Facilities remaining after the exclusion 562 1,167 546 90 2,365 Percent of facilities that do not already conduct audits (survey result) 43% 21% 14% 0%
Number of facilities that may begin having audits conducted 244 241 74 0 560 Cost per audit $5,000 $5,000 $7,500 $7,500
Travel and incidental expenses per audit $1,000 $1,000 $1,000 $1,000 Opportunity Cost of other workers time while audit is
conducted $2,500 $2,500 $2,500 $2,500
Corrective Actions as the result of audits $3,000 $10,000 $21,000 $0 Total costs of audits annually $3m $4m $2m $0m $10m
Share documentation with multiple customers number of times share 6 8 11 16
hourly burden $32.70 $32.70 $32.70 $32.70 time burden per information share 0.15 0.15 0.15 0.15 Subtotal documentation sharing per supplier $27 $39 $52 $76 Document sharing cost total $7,000 $9,000 $4,000 $0 $20,000
Total Annual Costs for Audits and Audit Documentation Share $3m $4m $2m $0 $10m
a partial category *Numbers might not add up due to rounding.
Table 35 shows our cost estimate for conducting audits of farm suppliers.
Table 35. Annual Costs of Audits of Farms as Suppliers
Requirements of Farms under PC rule
$25K-$250K (Very Small)
$250K-$500K (Small)
over $500K (Large) Total
Farms under produce rule requirements that may have audits as suppliers to processors 30,952 5,128 10,105 46,185 Assume approximately 5% are suppliers to processors that would require an audit 1,500 260 500 2,260 costs of audit $1,500 $1,800 $2,200 travel for audit $1,000 $1,000 $1,000
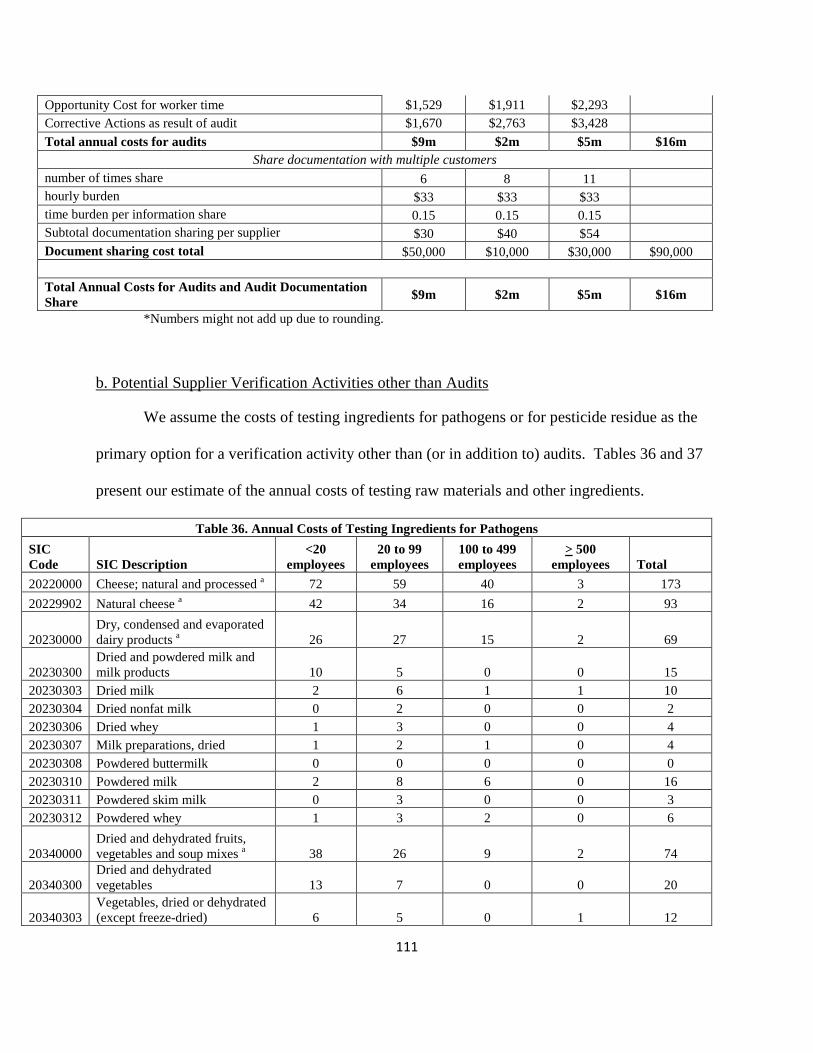
111
Opportunity Cost for worker time $1,529 $1,911 $2,293 Corrective Actions as result of audit $1,670 $2,763 $3,428 Total annual costs for audits $9m $2m $5m $16m
Share documentation with multiple customers number of times share 6 8 11
hourly burden $33 $33 $33 time burden per information share 0.15 0.15 0.15 Subtotal documentation sharing per supplier $30 $40 $54 Document sharing cost total $50,000 $10,000 $30,000 $90,000
Total Annual Costs for Audits and Audit Documentation Share $9m $2m $5m $16m
*Numbers might not add up due to rounding.
b. Potential Supplier Verification Activities other than Audits
We assume the costs of testing ingredients for pathogens or for pesticide residue as the
primary option for a verification activity other than (or in addition to) audits. Tables 36 and 37
present our estimate of the annual costs of testing raw materials and other ingredients.
Table 36. Annual Costs of Testing Ingredients for Pathogens SIC Code SIC Description
<20 employees
20 to 99 employees
100 to 499 employees
> 500 employees Total
20220000 Cheese; natural and processed a 72 59 40 3 173 20229902 Natural cheese a 42 34 16 2 93
20230000 Dry, condensed and evaporated dairy products a 26 27 15 2 69
20230300 Dried and powdered milk and milk products 10 5 0 0 15
20230303 Dried milk 2 6 1 1 10 20230304 Dried nonfat milk 0 2 0 0 2 20230306 Dried whey 1 3 0 0 4 20230307 Milk preparations, dried 1 2 1 0 4 20230308 Powdered buttermilk 0 0 0 0 0 20230310 Powdered milk 2 8 6 0 16 20230311 Powdered skim milk 0 3 0 0 3 20230312 Powdered whey 1 3 2 0 6
20340000 Dried and dehydrated fruits, vegetables and soup mixes a 38 26 9 2 74
20340300 Dried and dehydrated vegetables 13 7 0 0 20
20340303 Vegetables, dried or dehydrated (except freeze-dried) 6 5 0 1 12

112
20370100 Frozen fruits and vegetables 6 6 5 3 20
20370104 Vegetables, quick frozen & cold pack, excl. potato products 7 13 28 5 53
2041 Flour, Grain Milling 255 246 69 9 579 2043 Cereal Breakfast Foods 82 52 54 21 209 2045 Flour, Blended & Prepared 90 82 52 6 230 2046 Wet Corn Milling 54 45 29 6 134 2052 Cookies & Crackers 377 232 116 28 753 2066 Chocolate & Cocoa Products 316 117 54 17 504
2068 Salted & Roasted Nuts & Seeds 107 100 33 2 242
20990400 Seasonings and spices 79 47 8 1 135 20990402 Chili pepper or powder 9 5 1 0 15 20990403 Seasonings: dry mixes 35 13 7 0 55 20990404 Spices, including grinding 58 26 19 1 104
20990500 Sauce, gravy, dressing, and dip mixes 42 10 2 0 54
20990504 Sauces: dry mixes 10 3 0 0 13 20999901 Almond pastes 5 1 0 0 6
20999907 Coconut, desiccated and shredded 7 3 0 0 10
20999912 Peanut butter 23 14 9 0 46
Total 1,775 1,204 574 109 3,662
Facilities excluded by Very Small Business Definition 1,234 39 3 0 1,277
Facilities remaining after the exclusion 541 1,165 571 109 2,385
Facilities w/at least 1 potentially hazardous raw material that do not conduct periodic testing (survey result) 7% 17% 17% 3%
Number of facilities that may begin periodic testing 37 202 97 4 339
Cost per testing (12 samples average) $405 $405 $405 $405
Number of testing times per year 4 4 4 4
Total Costs of New Testing $0 $0 $0 $0 $1m
Average Sales Volume by Facility Size $3,326,854 $13,381,520 $96,994,965 $1,700,364,650
Operational days 357 357 357 357 Average Daily Value of Production $9,319 $37,483 $271,695 $4,762,926 Average Daily Value of Production per
product line $3,106 $5,355 $20,900 $264,607 Inventory Holding Cost per day 25% 25% 25% 25%
Percent needing to be held per day 100% 63% 17% 17%

113
Number of days held 4 4 4 4
Average Cost to Hold per Testing Episode $6,213 $13,387 $24,871 $427,340 Number of times per year 4 4 4 4
Total Annual Costs of Holding Pending Test Results per facility $24,850 $53,547 $99,482 $1,709,361
Number of facilities that may begin holding 37 202 97 4 339 Total Costs of Holding $1m $11m $10m $6m $28m Share documentation with multiple customers number of times share per occasion 6 8 11 16 number of occasions 4 4 4 4 hourly burden $33 $33 $33 $33 time burden per information share 0.15 0.15 0.15 0.15 Subtotal documentation sharing per supplier $108 $157 $206 $304 Document sharing cost total $3,967 $31,751 $19,890 $1,104 $56,712
Total Annual Costs of Periodic Pathogen Testing, Holding, Records, Documentation Sharing $1m $11m $10m $6m $28m
*Numbers might not add up due to rounding.
Table 37 shows our estimates for the cost of ingredient testing for pesticide residues.
Table 37. Annual Costs of Testing Ingredients for Pesticide Residues SIC Code SIC Description
<20 employees
20 to 99 employees
100 to 499 employees
> 500 employees Total
20370100 Frozen fruits and vegetables 6 6 5 3 20
20370104 Vegetables, quick frozen & cold pack, excl. potato products 7 13 28 5 53
5148 Fresh-Cut Fruits & Vegetables 327 111 31 3 470
Total 340 130 64 11 543 Facilities excluded by Very Small Business Definition 236 4 0 0 241 Facilities remaining after the exclusion 103 125 63 11 302 25% will need to test for pesticide residue 25% 25% 25% 25%
Number of facilities remaining 26 31 16 3 76 Percent already conducting testing (survey result) 96% 71% 65% 31%
Final number of facilities needing to start ingredient testing for pesticide residues 25 22 10 1
Cost per testing occasion (12 samples average) $1,305 $1,305 $1,305 $1,305
Number of testing times per year 4 4 4 4 Total Costs of New Testing $0m $0m $0m $0m $0m

114
Average Sales Volume by Facility Size $3,326,854 $13,381,520 $96,994,965 $1,700,364,650 Operational days 357 357 357 357 Average Daily Value of Production $9,319 $37,483 $271,695 $4,762,926 Average Daily Value of Production per
product line $3,106 $5,355 $20,900 $264,607 Inventory Holding Cost per day 25% 25% 25% 25% Percent needing to be held per day 100% 63% 17% 17% Number of days held 15 15 15 15 Average Cost to Hold per Testing Episode $23,297 $50,201 $93,264 $1,602,526 Number of times per year 4 4 4 4 Total Annual Costs of Holding Pending Test
Results per facility $93,189 $200,803 $373,058 $6,410,105 Number of facilities that may begin holding 25 22 10 1 58
Total Costs of Holding $2m $4m $4m $5m $16m Share documentation with multiple customers
number of times share per occasion 6 8 11 16 number of occasions 4 4 4 4 hourly burden $33 $33 $33 $33 time burden per information share 0.15 0.15 0.15 0.15 Subtotal documentation sharing per supplier $108 $157 $206 $304 Document sharing cost total $2,691 $3,513 $2,116 $252 $8,572
Total Annual Costs of Periodic Testing for Pesticide Residues, Holding, Records, Documentation Sharing $2m $5m $4m $5m $16m
*Numbers might not add up due to rounding.
c. Potential Verification Activities for Suppliers that are Qualified Facilities
When a supplier meets the requirements to be a “qualified facility” as defined under the
rule, a receiving facility can obtain written assurance from the supplier that it meets the
definition of a qualified facility and obtain written assurance at least every 2 years that the
supplier is producing raw materials or other ingredients in compliance with applicable FDA food
safety regulations (or, when applicable, relevant laws and regulations of a country whose food
safety system FDA has officially recognized as comparable or has determined to be equivalent to
that of the United States). The written assurance must include either (1) a brief description of the
preventive controls that the supplier is implementing to control the applicable hazard in the food
or (2) a statement that the facility is in compliance with State, local, county, tribal, or other
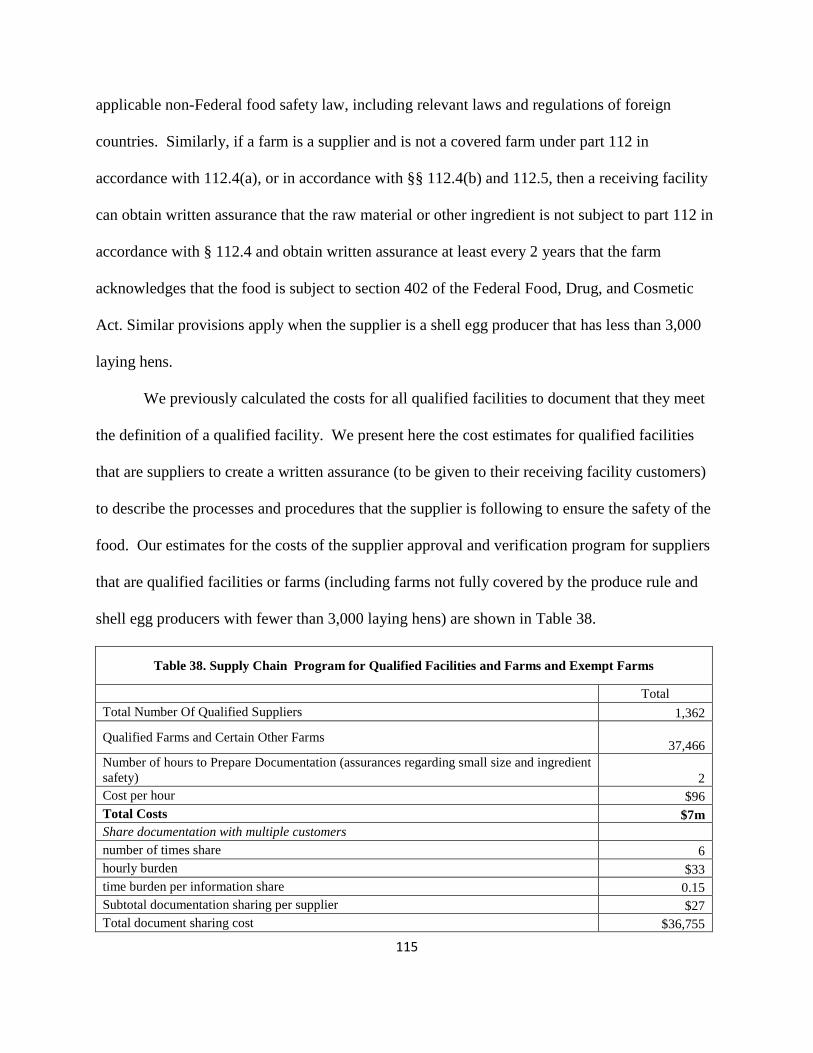
115
applicable non-Federal food safety law, including relevant laws and regulations of foreign
countries. Similarly, if a farm is a supplier and is not a covered farm under part 112 in
accordance with 112.4(a), or in accordance with §§ 112.4(b) and 112.5, then a receiving facility
can obtain written assurance that the raw material or other ingredient is not subject to part 112 in
accordance with § 112.4 and obtain written assurance at least every 2 years that the farm
acknowledges that the food is subject to section 402 of the Federal Food, Drug, and Cosmetic
Act. Similar provisions apply when the supplier is a shell egg producer that has less than 3,000
laying hens.
We previously calculated the costs for all qualified facilities to document that they meet
the definition of a qualified facility. We present here the cost estimates for qualified facilities
that are suppliers to create a written assurance (to be given to their receiving facility customers)
to describe the processes and procedures that the supplier is following to ensure the safety of the
food. Our estimates for the costs of the supplier approval and verification program for suppliers
that are qualified facilities or farms (including farms not fully covered by the produce rule and
shell egg producers with fewer than 3,000 laying hens) are shown in Table 38.
Table 38. Supply Chain Program for Qualified Facilities and Farms and Exempt Farms
Total Total Number Of Qualified Suppliers 1,362
Qualified Farms and Certain Other Farms 37,466 Number of hours to Prepare Documentation (assurances regarding small size and ingredient safety) 2 Cost per hour $96 Total Costs $7m Share documentation with multiple customers number of times share 6 hourly burden $33 time burden per information share 0.15 Subtotal documentation sharing per supplier $27 Total document sharing cost $36,755

116
Total costs annualized $4m Avg Cost per Facility $31
*Numbers might not add up due to rounding.
Table 39 shows our supplier verification cost summary.
Table 39. Supply chain Program Costs Summary
<20
employees 20 to 99
employees 100 to 499 employees
>500 employees Total
Annualized Costs of written program
$803,097
$773,276
$485,241
$747,409
$2,809,023
Annual Costs of Auditing Suppliers $12m $6m $7m $0m $26m Annual Costs of Testing Ingredients $3m $16m $14m $11m $44m Annualized Costs for Qualified Facilities, Exempt Farms who are Suppliers
$4m
Annualized Supplier Control Costs @ 7%
$64m
Annualized Supplier Control Costs @ 3%
$65m
*Numbers might not add up due to rounding.
6. Recall Plans Recall plans are the written procedures that describe the steps to be taken to recall food
products from the market as required in §117.139 for products with hazards that require a
preventive control. The recall procedures describe the steps that must be taken to recall the
products and assign responsibility for the recall. The recall procedures must include: a
description of how the facility will notify the direct consignees of the products being recalled
(including how to return or dispose of affected product); the procedures to notify the public when
appropriate to protect public health; the procedures for conducting effectiveness checks to verify
that the recall is carried out; and procedures to appropriately dispose of the recalled product.16
As mentioned in our response to comments, some suggest that our estimate for the cost to
implement recall controls understates the time needed to develop the initial recall procedures as
16 A list of FDA-regulated products that have been recalled can be found on FDA’s website at http://www.fda.gov/safety/recalls/default.htm.

117
ranging from 7 hours for facilities with 20 to 99 employees and smaller to 19 hours for facilities
with both 100 to 400 employees and with 500 or more employees. Comments indicated that
developing an initial recall procedure would involve at least three functions: legal, regulatory and
quality, and could require a minimum of 50 hours. We concur and revised our estimate for the
number of hours to develop an initial recall plan for covered facilities with both 100 to 400
employees and with 500 or more employees to reflect the estimate of 50 hours. We limited the
revision to larger facilities, as they are the ones likely to employ legal, regulatory and quality
personnel to develop the recall procedure.
The recall plan is intended to describe the actions that a facility would take to minimize
the disruptive effects of a recall. The costs to a facility to develop their recall plans are the costs
to identify the person responsible for the plan and the costs to determine the actions that should
be performed during a recall, including notifying direct consignees and the public, and
performing effectiveness checks to verify that the recall has been appropriately conducted. The
costs are incurred when the establishment does not otherwise have a recall plan.
We estimate costs of developing a recall plan for food manufacturing facilities that have
identified hazards that require a preventive control We do not estimate costs for food
wholesalers or warehouses as we expect these facilities generally do not to have hazards
requiring preventive controls. These facilities, for the most part, will not be processing food but
rather storing and distributing finished food manufactured by other entities who would conduct
the recall. Table 40 summarizes our cost estimate to implement recall controls.
Table 40. Recall Control Costs by Facility Size <20
employees 20 to 99
employees 100 to 499 employees
> 500 employees
Total
Total number Domestic 5,185 7,177 3,387 536 16,285
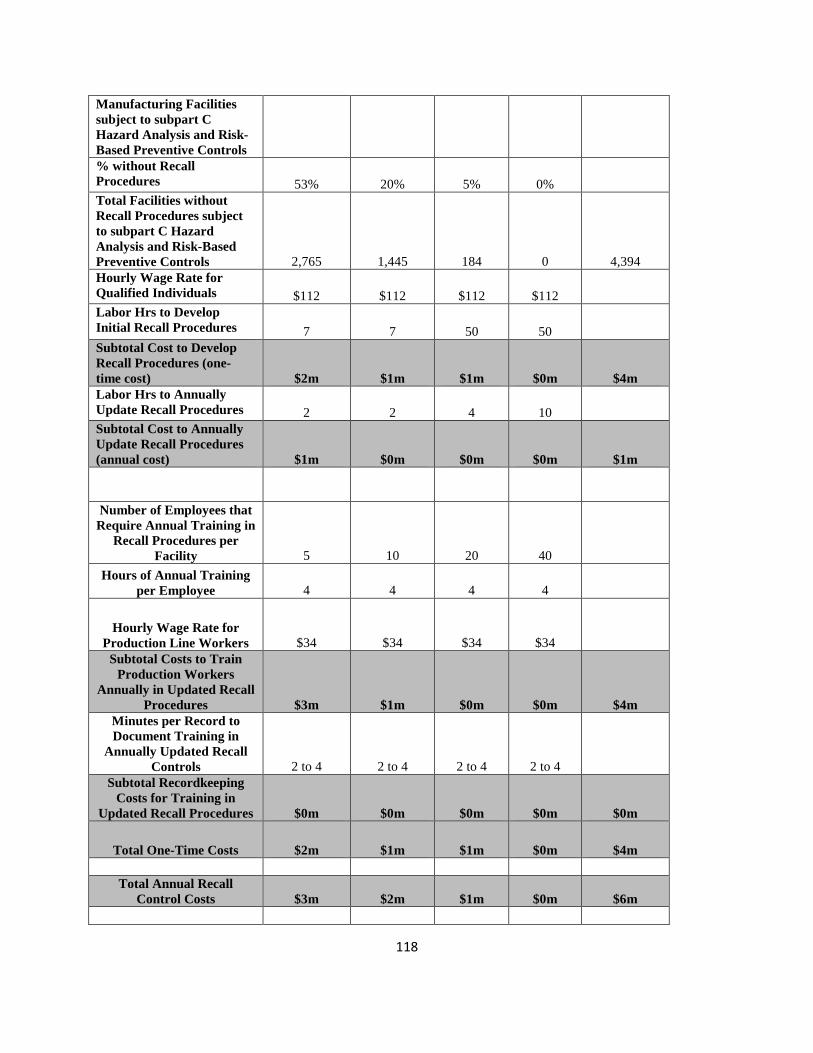
118
Manufacturing Facilities subject to subpart C Hazard Analysis and Risk-Based Preventive Controls % without Recall Procedures 53% 20% 5% 0% Total Facilities without Recall Procedures subject to subpart C Hazard Analysis and Risk-Based Preventive Controls 2,765 1,445 184 0 4,394 Hourly Wage Rate for Qualified Individuals $112 $112 $112 $112 Labor Hrs to Develop Initial Recall Procedures 7 7 50 50 Subtotal Cost to Develop Recall Procedures (one-time cost) $2m $1m $1m $0m $4m Labor Hrs to Annually Update Recall Procedures 2 2 4 10 Subtotal Cost to Annually Update Recall Procedures (annual cost) $1m $0m $0m $0m $1m
Number of Employees that
Require Annual Training in Recall Procedures per
Facility 5 10 20 40 Hours of Annual Training
per Employee 4 4 4 4
Hourly Wage Rate for Production Line Workers $34 $34 $34 $34
Subtotal Costs to Train Production Workers
Annually in Updated Recall Procedures $3m $1m $0m $0m $4m
Minutes per Record to Document Training in
Annually Updated Recall Controls 2 to 4 2 to 4 2 to 4 2 to 4
Subtotal Recordkeeping Costs for Training in
Updated Recall Procedures $0m $0m $0m $0m $0m
Total One-Time Costs $2m $1m $1m $0m $4m
Total Annual Recall Control Costs $3m $2m $1m $0m $6m

119
Total Costs Annualized (One-Time annualized +
On-Going) (7%) $6m Total Costs Annualized (One-Time annualized +
On-Going) (3%) $6m
Average Costs per Facility $1,000 $1,000 $4,000 $0 $1,000 *Numbers might not add up due to rounding.
7. Monitoring This rule requires that all facilities have procedures in place to monitor the
implementation of preventive controls; monitoring activities must be conducted, as appropriate
to ensure the effectiveness of the preventive controls, for sanitation, process, and allergen
controls. The costs of monitoring are incorporated into the specific sections of the FRIA, where
applicable.
8. Corrective Actions Section § 117.150 requires facilities subject to subpart C to establish and implement
written corrective action procedures that must be taken if preventive controls are not properly
implemented. The procedures must describe the steps to be taken to identify and correct a
problem that has occurred with implementation of a preventive control, to reduce the likelihood
the problem will recur when necessary, to ensure that all affected food is evaluated for safety,
and to prevent the affected food from entering commerce if it is adulterated. Corrective actions
taken in the event of unanticipated food safety problems must also include reanalyzing the food
safety plan to determine whether modifications are required. Alternatively, in some
circumstances a facility can simply correct a problem in a timely manner without taking all the
steps associated with a corrective action procedure. In the event of process deviations, which
might occur when critical factors do not comply with the requirements specified for the process

120
controls, corrective actions might be necessary. Corrective actions can include segregating and
holding the affected product, at least until all affected food is evaluated to determine their
acceptability for distribution.
According to FDA’s expert elicitation, common corrective actions can involve assessing
whether a facility needs more frequent equipment calibration or the use of two thermometers
instead of one; or it may involve improvements in a training program or the creation of a training
program that was previously lacking; the addition of a process control or monitoring point where
control was found lacking – for example, when foreign materials are found, the facility might
add a filter, magnet, or metal detector. Changes in raw material or packaging material inspection
procedures are a frequent corrective action to help prevent a mislabeling failure, among many
other possible corrective actions to ensure that the food safety plan is working (Ref. 23).
Our estimated costs for total new corrective actions, by facility size, are shown in Tables
41-45. To estimate the cost to adopt corrective action procedures, we first determined the
baseline use of corrective actions procedures. Every facility involved in food production should
have corrective action procedures as part of their food safety plan. To determine the number of
facilities that lack corrective action procedures, the FDA survey asked, “Which of the following
elements does your written food safety plan address?: Procedures for taking corrective action.”
Among facilities with fewer than 20 employees that have a food safety plan, 48 percent
responded no, that they lack written procedures for taking corrective action. Of the facilities
with 500 or more employees, 100 percent of those responding reported having a food safety plan,
and all of their food safety plans have corrective action procedures.
We estimate that facilities that answered “no” to this question will incur the cost of
developing corrective action procedures, performing the corrective actions, and recording the

121
results. We recognize that some facilities that responded “no” and lack written procedures might
still perform “informal” corrective actions or conduct trouble shooting when they discover safety
problems. Multiplying the total number of facilities by the percentage of facilities not already
performing corrective actions yields an approximate estimate for the number of facilities that
will incur a new cost of developing written procedures and implementing formal corrective
actions. All other facilities are excluded from estimation as they report that they are already
performing the required activities.
Once we estimated the number of facilities that will incur new corrective action costs
using the Food GMP survey, we estimated the actual cost of a complete corrective action by
facility size. To properly execute a corrective action, a facility would: 1) segregate, hold, rework
or destroy the affected product so that no product enters commerce that is potentially injurious to
their consumers’ health or otherwise adulterated; 2) identify and correct the cause of the failure;
3) take action when necessary to reduce the likelihood or recurrence of the incident; and 4)
possibly reassess their food safety plan.
We estimate cost of segregating and holding product as a percentage of a facility’s single
line production value. To calculate a single day’s value of production we utilize information
from the Annual Survey of Manufacturers (2009) (Ref. 32) provided by the U.S. Census Bureau
and facility information from D&B. According to the expert elicitation, about 75 percent of a
line’s production at a facility will need to be held for any given corrective action. A study
published in the Inventory Management Review suggests that the cost of holding product is
somewhere between 15 and 35 percent of its total value. We use 25 percent as the average cost
of holding product (Ref. 33). When both of these percentages are applied to the value of one
line’s production, we get the cost of holding product for a single corrective action. These

122
calculations are shown in Table 45.
Additionally, industry experts suggest that about five percent of production will need to
be destroyed, as part of corrective action procedures, to prevent its entrance into commerce.
Again, we apply this percentage to the total value of one line’s production to estimate the total
cost of downtime or lost product to a facility for each corrective action. Adding these two
numbers yields the total cost of holding and downtime in production due to a corrective action.
Next we estimate the cost to correct the failure and reassess the food safety plan. According to
our expert elicitation and FDA food safety experts, identifying the problem and correcting it
should take somewhere between one and nine hours, depending on the complexity of the
problem (Ref. 23). We assume that an average corrective action will take around five hours to
identify and correct and that the corrective action will likely be performed by a production
supervisor in a food manufacturing industry.
Next, we add the cost of holding products during an investigation and the cost of the
downtime of production to the cost to correct and reassess to get the total cost of the corrective
actions. Our experts estimated the average number of incidents per year that require corrective
actions as shown in Table 41.
Table 41. Expert Estimates of the Number of Incidents Needing Formal Corrective Action Per Year by Facility Size
Facility size Number of Incidents <20 employees 2 20 to 99 employees 4 100 to 499 employees 8 >500 employees
12
We then take the annual cost of corrective actions and multiply it by the number of
facilities that do not already have corrective action procedures.
We estimate costs of corrective actions to food manufacturing facilities only in Tables

123
42-44. We do not estimate costs for food wholesalers or warehouses as we expect these facilities
to be mostly middlemen in the food production chain. These facilities, for the most part, will not
be processing food but rather re-selling or storing finished food. We may have over or under-
estimated the costs if we misjudged the frequency of correcting failures or the frequency of
reassessing the food safety plan.
Table 42. Corrective Action Procedure Costs by Facility Size
<20
employees 20 to 99
employees 100 to 499 employees
>500 employees Total
Total Domestic Manufacturing Facilities that are subject to subpart C Hazard Analysis and Risk-Based Preventive Controls 5,185 7,177 3,387 536 16,285 % Facilities w/o written procedures for Corrective Actions 48% 21% 16% 0% Total Facilities w/o written procedures for Corrective Actions that are subject to subpart C Hazard Analysis and Risk-Based Preventive Controls 2,509 1,499 543 0 4,551
Hours to Develop General Corrective Action Procedures 7 7 11 16 Wage Rate (Manager) $112 $112 $112 $112 Subtotal One-time Total Cost to Develop Written Procedures for Corrective Actions $2m $1m $1m $0 $4m
Hrs to annually update Corrective Action Procedures per facility 0.7 0.7 0.7 0.7 Subtotal Cost to annually update Written Procedures for Corrective Actions $0m $0m $0m $0m $0m Number of Corrective Action procedures to be developed per Facility 2 4 8 12 Wage Rate or Production Line Workers $36 $36 $36 $36 Wage Rate (Manager-Trainers) $112 $112 $112 $112 Number of Workers that Require (Re)Training in Response to Incident that requires Corrective Action 5 5 5 5 Hrs to Train per Workers in Response to Incident that requires Corrective Action 2 2 2 2 Total Annual Training Costs $3m $3m $2m $0m $8m

124
Total Annual Training Records Costs (one record (12 minutes/record) per worker per incident per year) $0m $0m $0m $0m $0m *Numbers might not add up due to rounding.
Table 43. Corrective Action Costs to Identify and Correct Failures by Facility Size
<20
employees 20 to 99
employees 100 to 499 employees
>500 employees Total
Total Domestic Manufacturing Facilities that are subject to subpart C Hazard Analysis and Risk-Based Preventive Controls 5,185 7,177 3,387 536 16,285 % Facilities w/o written procedures for Corrective Actions 48% 21% 16% 0% Total Facilities w/o written procedures for Corrective Actions that are subject to subpart C Hazard Analysis and Risk-Based Preventive Controls 2,509 1,499 543 0 4,551 Average Hours to identify and take CA for each incident 1 to 9 1 to 9 1 to 9 1 to 9 Wage Rate (Manager) $112 $112 $112 $112 Total Annual Costs to Identify and Correct Failures $2m $3m $2m $0m $7m *Numbers might not add up due to rounding.
Table 44. Corrective Action Costs for New Parts and Equipment by Facility Size
<20
employees 20 to 99
employees 100 to 499 employees
>500 employees Total
Total Domestic Manufacturing Facilities that are subject to subpart C Hazard Analysis and Risk-Based Preventive Controls 5,185 7,177 3,387 536 16,285 % Facilities w/o written procedures for Corrective Actions 48% 21% 16% 0%

125
Average Annual Costs for new Parts and Equipment
$0 - $1,000
$0 - $5,000
$0 - $10,000
$0 - $10,000
Total Annual Costs for New Parts and Equipment $1m $4m $3m $0m $8m *Numbers might not add up due to rounding.
We revised our estimate for the value of facility production. For the PRIA, we estimated
the total value of the entire food manufacturing industry in 2009 from the Annual Survey of
Manufacturers provided by the U.S. Census Bureau minus the segment of the food industry not
covered by the rule. For the FRIA, we used an independent estimate for the annual value of
production per facility by size of $3 million for facilities with fewer than 20 employees; $13
million for facilities with 20 to 99 employees; $97 million for facilities with 100 to 499
employees and $1,700 million for facilities with more than 500 employees (Ref. 32).
As before, we estimate that the average facility will operate for 357 days of the year, after
which we divide this number by the total number of facilities in each size category to get the
value of production for a single manufacturer. Then, dividing the annual value of a single
manufacturer’s production by the number of operational days yields the value of one day’s
production by facility size. Our expert elicitation determined that the time involved is 0.21
equivalent days per incident, from which we determined the average value of lost production per
incident. The experts further judged that approximately 75 percent of the facilities will have to
hold their product after each incident. We estimate that facilities that hold their product will also
incur the cost of lost profit during the period of the hold. We assume that the profit margin for
these products is 10 percent of their value. Table 45 shows our estimate for the cost of product
losses and down time from activities that require corrective actions.
Table 45. Corrective Action Costs for Product Losses and Down Time of Production by Facility Size
<20
employees 20 to 99
employees 100 to 499 employees
>500 employees Total
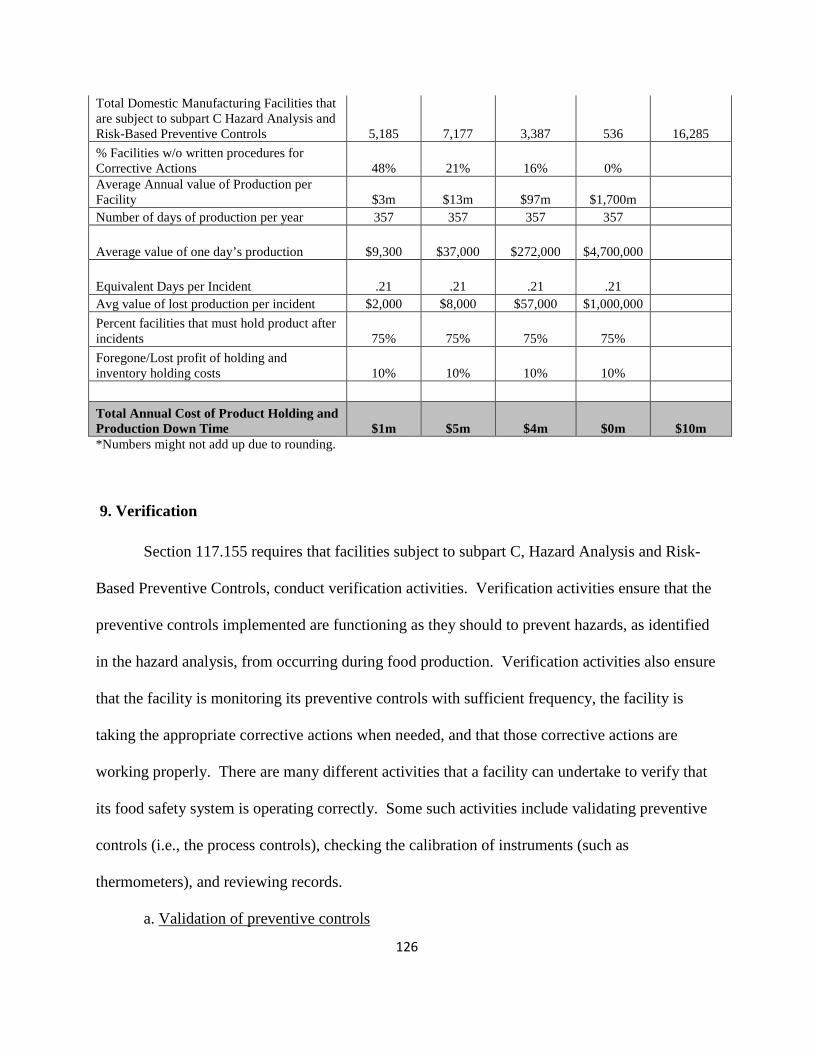
126
Total Domestic Manufacturing Facilities that are subject to subpart C Hazard Analysis and Risk-Based Preventive Controls 5,185 7,177 3,387 536 16,285 % Facilities w/o written procedures for Corrective Actions 48% 21% 16% 0% Average Annual value of Production per Facility $3m $13m $97m $1,700m Number of days of production per year 357 357 357 357
Average value of one day’s production $9,300 $37,000 $272,000 $4,700,000
Equivalent Days per Incident .21 .21 .21 .21 Avg value of lost production per incident $2,000 $8,000 $57,000 $1,000,000 Percent facilities that must hold product after incidents 75% 75% 75% 75% Foregone/Lost profit of holding and inventory holding costs 10% 10% 10% 10% Total Annual Cost of Product Holding and Production Down Time $1m $5m $4m $0m $10m *Numbers might not add up due to rounding.
9. Verification
Section 117.155 requires that facilities subject to subpart C, Hazard Analysis and Risk-
Based Preventive Controls, conduct verification activities. Verification activities ensure that the
preventive controls implemented are functioning as they should to prevent hazards, as identified
in the hazard analysis, from occurring during food production. Verification activities also ensure
that the facility is monitoring its preventive controls with sufficient frequency, the facility is
taking the appropriate corrective actions when needed, and that those corrective actions are
working properly. There are many different activities that a facility can undertake to verify that
its food safety system is operating correctly. Some such activities include validating preventive
controls (i.e., the process controls), checking the calibration of instruments (such as
thermometers), and reviewing records.
a. Validation of preventive controls

127
The costs of validating preventive controls are addressed, where applicable, in the cost
section for process controls.
b. Monitoring
The verification of monitoring is addressed in the appropriate sections of the analysis
where monitoring is needed. These sections include process controls and sanitation controls.
c. Corrective actions
Verification of appropriate corrective actions and the associated costs are included in the
section of the PRIA on corrective actions.
d. Verification Activities-Implementation and Effectiveness
Facilities subject to subpart C, Hazard Analysis and Risk-Based Preventive Controls, will
be required to verify that their process monitoring instruments and verification instruments have
been properly calibrated. The costs of verifying instrument calibration is calculated as part of the
costs of process controls. Written procedures for frequency of calibrating process monitoring
instruments and verification instruments are also included as part of the costs of written
procedures for process controls.
i. Environmental Monitoring
Environmental monitoring programs, when implemented appropriately based on the facility,
the food, and the nature of the preventive control, could be used to verify that the preventive
controls are effectively and significantly minimizing or preventing the occurrence of identified
hazards such as when contamination of an Ready-To-Eat (RTE) food with an environmental
pathogen is a hazard requiring a preventive control. Effective environmental pathogen controls,
if utilized, will be product, process, and plant specific. Generally, Salmonella is the organism of
128
concern for certain dry food products,17 where Salmonella would be introduced with a raw
material or other ingredient, and Listeria monocytogenes (Lm) is the organism of concern for
certain ready-to-eat foods produced in wet processing environments. If a facility adopts an
environmental monitoring program as a verification tool, it must identify the organisms of
concern, determine the points to sample and the frequency of sampling based on knowledge of
its specific operation and the controls that have been put into place, and be technically sound.
We received several comments related to our proposed costs for environmental
monitoring. Some comments asserted that we incorrectly estimated the costs of holding product
pending testing results or that we didn’t include those costs in our analysis. See discussion on
this in the section on “Product Testing.” In most circumstances we do not expect facilities to
hold product pending the results of environmental monitoring.
As we mentioned earlier, some comments disagreed with the number of environmental
samples we estimated facilities would submit to a lab for analysis. Comments submitted
examples of the number of samples and costs for environmental monitoring of non-pathogenic
hazards such as allergens, heavy metals, sulfites, and pesticide residues. We agree that the
number of samples will greatly vary based on the size of the facility and type of product
manufactured. We have increased the range of the number of samples that we use in our
estimation for the final analysis. Instead of estimating costs for 5 or 15 samples on a monthly
basis for Salmonella and Listeria environmental monitoring, we have increased samples to 5-10
samples for facilities with less than 100 employees and to 15-20 samples for facilities with over
17A number of outbreaks of salmonellosis have been associated with the consumption of ready-to-eat low-moisture products, including chocolate, powdered infant formula, raw almonds, toasted oats breakfast cereals, dry seasonings, paprika-seasoned potato chips, dried coconut, infant cereals and, more recently, peanut butter and children’s snacks made of puffed rice and corn with a vegetable seasoning.

129
100 employees. In addition, we have increased sampling frequency for Salmonella
environmental monitoring to an average of 19 sampling occasions per year (range 12-25
occasions), up from monthly testing (12 testing occasions). We have increased sampling
frequency for Listeria environmental monitoring from monthly testing (12 occasions) annually to
weekly testing (51 occasions) annually. We note that environmental monitoring is meant to be a
verification of a preventive control measure such as sanitation controls, not the control measure
itself. We also note that the environmental monitoring provision requirement is limited to
environmental pathogens.
As we mentioned earlier, some comments disagreed with the amount of time that we
estimated to collect both environmental and product samples, suggesting we increase employee
time and the hourly labor rate for this activity. Comments suggested that more employee time
would additionally be needed for corrective actions in the event that a positive environmental (or
product) sample was found. We concur that while some facilities may have multiple people
involved in an environmental monitoring (or product testing) program, it is the smaller facilities
that are more likely to need to begin undertaking these verification activities as a result of this
rule-making. A smaller facility will likely not be able to devote as many resources to sample
collection as larger facilities, thus we believe estimating one employee’s time to collect samples
is appropriate. If environmental monitoring (or product testing) results indicate a problem, and a
corrective action is warranted, those costs and resource allocations are covered under that section
of the economic analysis. We have increased our hourly labor rate from the estimates used for
the PRIA. Our revised wage rates are now more closely aligned to what comments suggested.
Table 46 summarizes our estimate of the annual cost of environmental monitoring for
Salmonella. Table 47 shows our primary estimate of the annual cost of environmental monitoring
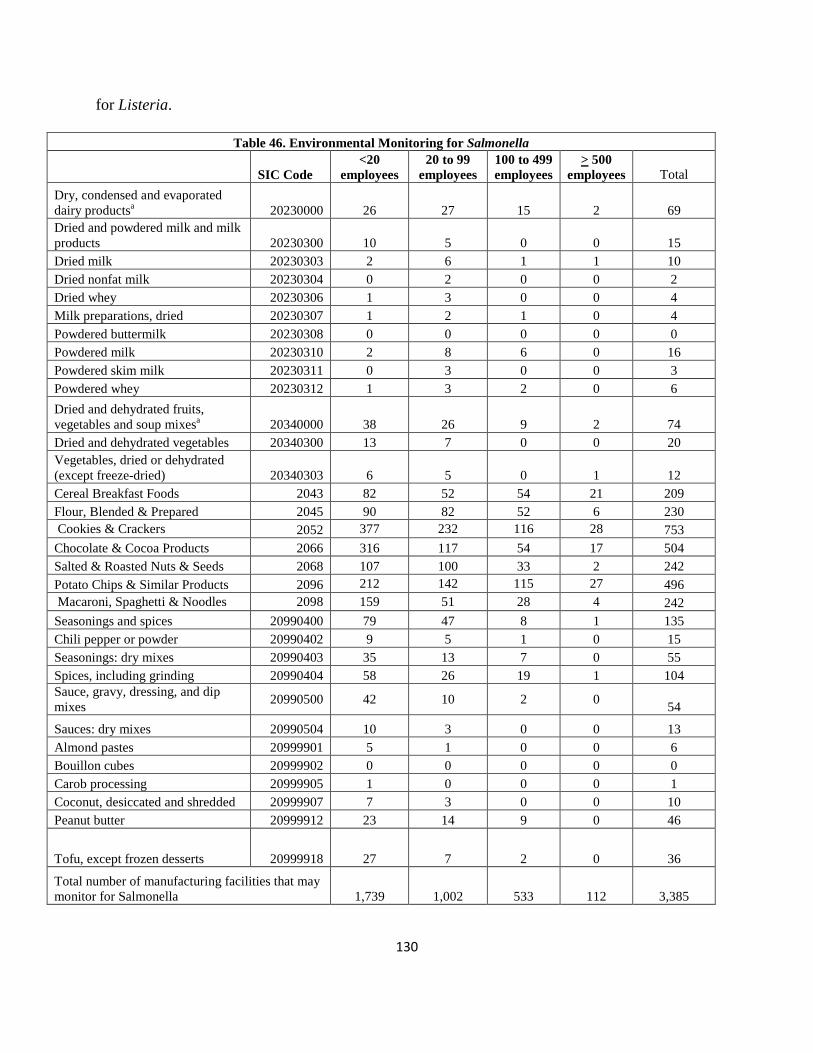
130
for Listeria.
Table 46. Environmental Monitoring for Salmonella
SIC Code <20
employees 20 to 99
employees 100 to 499 employees
> 500 employees Total
Dry, condensed and evaporated dairy productsa 20230000 26 27 15 2 69 Dried and powdered milk and milk products 20230300 10 5 0 0 15 Dried milk 20230303 2 6 1 1 10 Dried nonfat milk 20230304 0 2 0 0 2 Dried whey 20230306 1 3 0 0 4 Milk preparations, dried 20230307 1 2 1 0 4 Powdered buttermilk 20230308 0 0 0 0 0 Powdered milk 20230310 2 8 6 0 16 Powdered skim milk 20230311 0 3 0 0 3 Powdered whey 20230312 1 3 2 0 6 Dried and dehydrated fruits, vegetables and soup mixesa 20340000 38 26 9 2 74 Dried and dehydrated vegetables 20340300 13 7 0 0 20 Vegetables, dried or dehydrated (except freeze-dried) 20340303 6 5 0 1 12 Cereal Breakfast Foods 2043 82 52 54 21 209 Flour, Blended & Prepared 2045 90 82 52 6 230 Cookies & Crackers 2052 377 232 116 28 753 Chocolate & Cocoa Products 2066 316 117 54 17 504 Salted & Roasted Nuts & Seeds 2068 107 100 33 2 242 Potato Chips & Similar Products 2096 212 142 115 27 496 Macaroni, Spaghetti & Noodles 2098 159 51 28 4 242 Seasonings and spices 20990400 79 47 8 1 135 Chili pepper or powder 20990402 9 5 1 0 15 Seasonings: dry mixes 20990403 35 13 7 0 55 Spices, including grinding 20990404 58 26 19 1 104 Sauce, gravy, dressing, and dip mixes 20990500 42 10 2 0 54
Sauces: dry mixes 20990504 10 3 0 0 13 Almond pastes 20999901 5 1 0 0 6 Bouillon cubes 20999902 0 0 0 0 0 Carob processing 20999905 1 0 0 0 1 Coconut, desiccated and shredded 20999907 7 3 0 0 10 Peanut butter 20999912 23 14 9 0 46
Tofu, except frozen desserts 20999918 27 7 2 0 36
Total number of manufacturing facilities that may monitor for Salmonella 1,739 1,002 533 112 3,385

131
Facilities excluded by Very Small Business Definition 1,209 33 3 0 1,245 Facilities remaining after exclusion 530 969 530 112 2,140 Percent that already test (survey result) 21% 28% 50% 62%
Facilities that may begin testing 416 696 266 43 1,421
Average number begin testing 260 435 166 27 888
cost per facility for one 5-10 sample or 15-20 sample testing (depends on facility size) $434 $434 $934 $934
Number of testing times per year (average) 19 19 19 19
Total testing costs per facility annually $8,000 $8,000 $17,000 $17,000
Training materials cost (annualized over 7 yrs) $42 $42 $42 $42
Labor training cost $44 $44 $44 $44 Annual environmental monitoring costs for
Salmonella $2 m $4m $3m $0m $9m Avg cost per affected Facility $8,000 $8,000 $17,000 $17,000
a Partial category *Numbers might not add up due to rounding.
Table 47. Environmental Monitoring for Listeria
SIC Code <20
employees 20 to 99
employees 100 to 499 employees
> 500 employees Total
Butter 2021 27 43 24 0 94 Cheese; natural and processeda 20220000 72 59 40 3 173 Natural cheesea 20229902 42 34 16 2 93 Ice Cream 2024 425 178 81 13 697 Frozen fruits and vegetables 20370100 6 6 5 3 20 Vegetables, quick frozen & cold pack, excl. potato products 20370104 7 13 28 5 53 Ready-to-eat meals, salads, and sandwiches 20990700 15 23 7 4 49 Cole slaw, in bulk 20990702 4 1 0 0 5 Salads, fresh or refrigerated 20990705 40 32 13 2 87 Sandwiches, assembled and packaged: for wholesale market 20990706 18 17 10 2 47
Vegetables, peeled for the trade 20999920 9 10 2 0 21
Fresh-Cut Fruits & Vegetablesa 5148 327 111 31 3 470 Total number of facilities that may test for Listeria 991 526 256 37 1,809 Facilities excluded by Very Small Business Definition 689 17 1 0 708
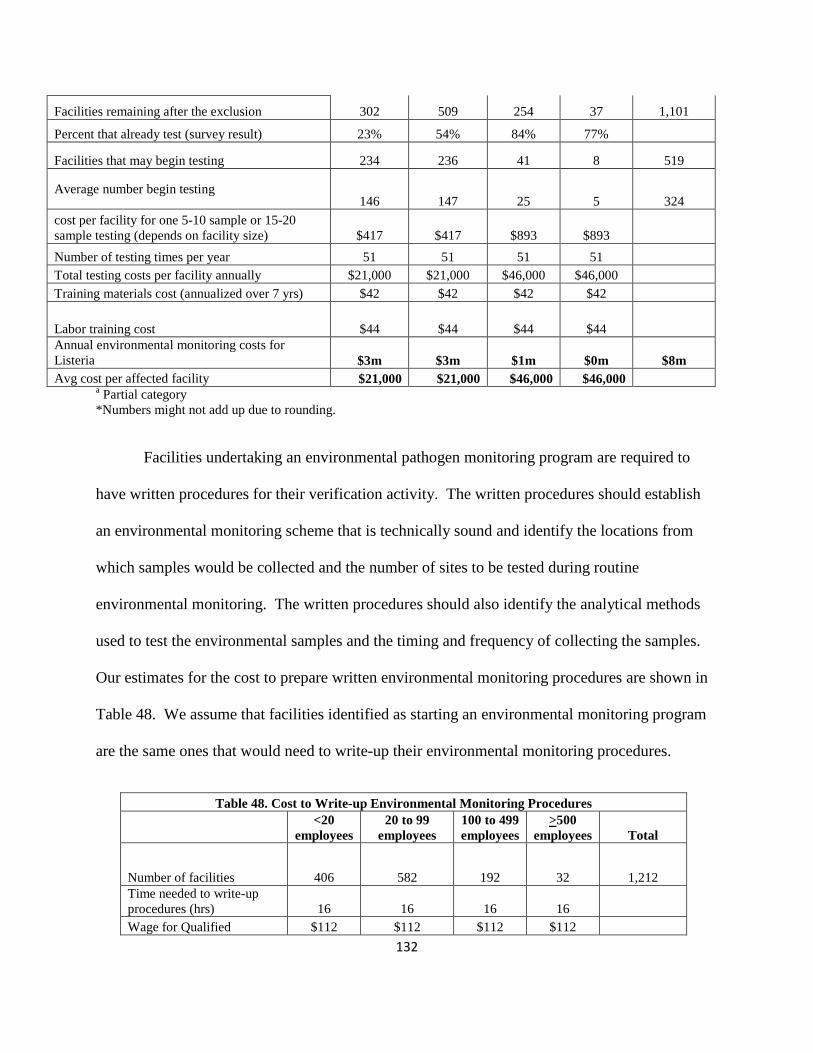
132
Facilities remaining after the exclusion 302 509 254 37 1,101
Percent that already test (survey result) 23% 54% 84% 77%
Facilities that may begin testing 234 236 41 8 519
Average number begin testing 146 147 25 5 324
cost per facility for one 5-10 sample or 15-20 sample testing (depends on facility size) $417 $417 $893 $893
Number of testing times per year 51 51 51 51 Total testing costs per facility annually $21,000 $21,000 $46,000 $46,000 Training materials cost (annualized over 7 yrs) $42 $42 $42 $42
Labor training cost $44 $44 $44 $44 Annual environmental monitoring costs for
Listeria $3m $3m $1m $0m $8m Avg cost per affected facility $21,000 $21,000 $46,000 $46,000
a Partial category *Numbers might not add up due to rounding.
Facilities undertaking an environmental pathogen monitoring program are required to
have written procedures for their verification activity. The written procedures should establish
an environmental monitoring scheme that is technically sound and identify the locations from
which samples would be collected and the number of sites to be tested during routine
environmental monitoring. The written procedures should also identify the analytical methods
used to test the environmental samples and the timing and frequency of collecting the samples.
Our estimates for the cost to prepare written environmental monitoring procedures are shown in
Table 48. We assume that facilities identified as starting an environmental monitoring program
are the same ones that would need to write-up their environmental monitoring procedures.
Table 48. Cost to Write-up Environmental Monitoring Procedures
<20
employees 20 to 99
employees 100 to 499 employees
>500 employees Total
Number of facilities 406 582 192 32 1,212 Time needed to write-up procedures (hrs) 16 16 16 16 Wage for Qualified $112 $112 $112 $112

133
Individual (including overhead) Total costs of Initial Write-up $1m $1m <$1m <$1m $2m
*Numbers might not add up due to rounding.
ii. Product Testing
Product testing programs, including ingredient, in-process, or finished product testing,
could be used to verify that preventive controls are effectively and significantly minimizing or
preventing the occurrence of identified hazards, when implemented appropriately based on the
facility, the food, and the nature of the preventive control. As noted earlier, some comments
asserted that we incorrectly estimated the costs of holding product pending testing results or that
we didn’t include those costs in our analysis; the comments included examples of outside storage
costs based on the number of pallets/cases and type of storage needed. We disagree. We did
include in our analysis the costs for storing product as necessary pending testing results. We
expect that facilities will hold product pending the testing results of ingredient or product testing.
We increased holding costs for product testing in this analysis to make sure we captured the cost
of holding and storing product from all product lines, as may be necessary, for each facility
identified. This was in correction to an error we made in the supplemental PRIA regarding
holding costs; we had failed to carry through the holding costs for all product lines affected.
Number of pallets or cases per day, as suggested by commenters for estimating holding
costs, vary significantly by industry sector and facility size and type. This measure is not readily
available for all industry sectors or facility sizes. We note that using the average daily value of
production per manufacturing line as a measure for holding costs is a measure that is obtainable
and more easily applied across all industry sectors, and it is an appropriate measure because it
represents the value of the goods.

134
We estimate that on a monthly basis facilities would conduct product testing to verify that
the food being produced is not contaminated. Table 48 shows primary estimates of the product
testing costs.
Table 49. Product Testing Costs
SIC Code SIC Description <20
employees 20 to 99
employees 100 to 499 employees
> 500 employee
s Total 20370100 Frozen fruits and vegetables 6 6 5 3 20
20370104 Vegetables, quick frozen & cold pack, excl. potato products 7 13 28 5 53
2043 Cereal Breakfast Foods 82 52 54 21 209 2066 Chocolate & Cocoa Products 316 117 54 17 504 2068 Salted & Roasted Nuts & Seeds 107 100 33 2 242
2096 Potato Chips & Similar Products 212 142 115 27 496
20990400 Seasonings and spices 79 47 8 1 135 20990402 Chili pepper or powder 9 5 1 0 15 20990403 Seasonings: dry mixes 35 13 7 0 55 20990404 Spices, including grinding 58 26 19 1 104
20990500 Sauce, gravy, dressing, and dip mixes 42 10 2 0 54
20990504 Sauces: dry mixes 10 3 0 0 13
20990700 Ready-to-eat meals, salads, and sandwiches 15 23 7 4 49
20990701 Box lunches, for sale off premises 36 3 0 0 39
20990702 Cole slaw, in bulk 4 1 0 0 5 20990705 Salads, fresh or refrigerated 40 32 13 2 87
20990706 Sandwiches, assembled and packaged: for wholesale market 18 17 10 2 47
20999901 Almond pastes 5 1 0 0 6 20999902 Bouillon cubes 0 0 0 0 0 20999905 Carob processing 1 0 0 0 1
20999907 Coconut, desiccated and shredded 7 3 0 0 10
20999912 Peanut butter 23 14 9 0 46 20999918 Tofu, except frozen desserts 27 7 2 0 36 20999920 Vegetables, peeled for the trade 9 10 2 0 21
Number of manufacturing facilities that may conduct product testing 1,148 645 369 85 2,247
Facilities excluded by Very Small Business Definition 798 21 2 0 822 Number of facilities remaining after exclusion of qualified facilities 350 624 367 85 1,425 Percent that already test (survey result) 69% 76% 83% 94%
Number of facilities that may begin testing 110 152 62 6 329
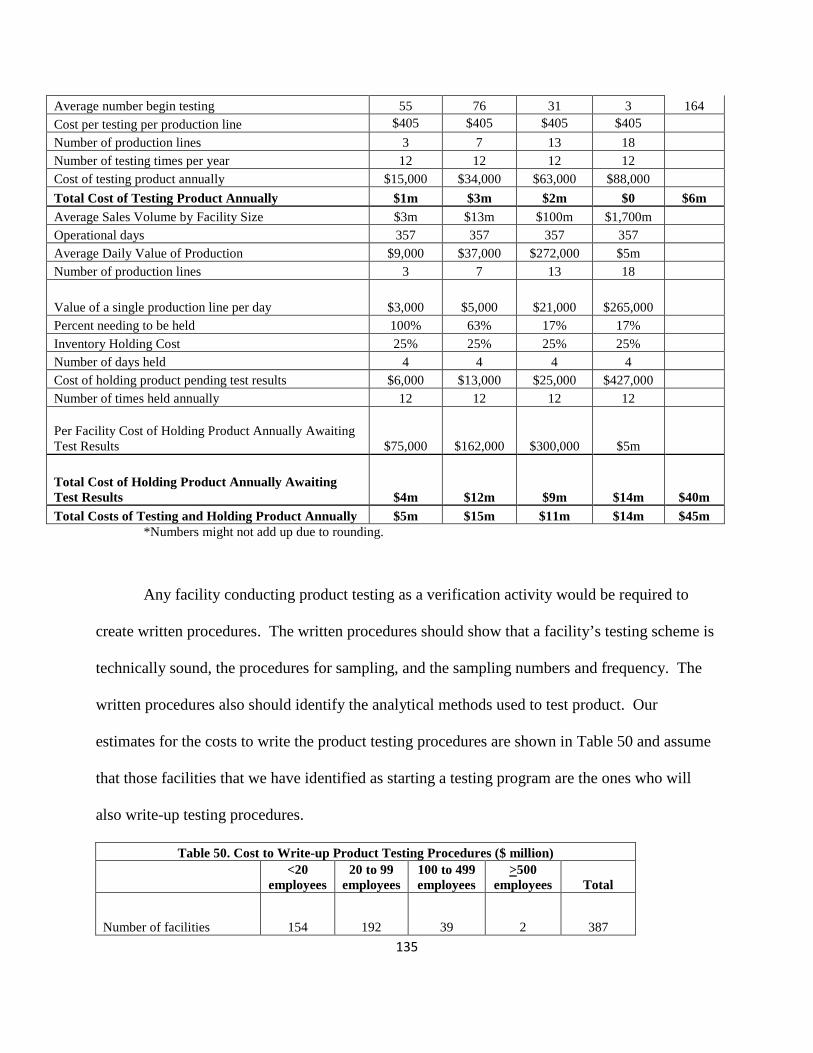
135
Average number begin testing 55 76 31 3 164 Cost per testing per production line $405 $405 $405 $405
Number of production lines 3 7 13 18 Number of testing times per year 12 12 12 12 Cost of testing product annually $15,000 $34,000 $63,000 $88,000 Total Cost of Testing Product Annually $1m $3m $2m $0 $6m
Average Sales Volume by Facility Size $3m $13m $100m $1,700m Operational days 357 357 357 357 Average Daily Value of Production $9,000 $37,000 $272,000 $5m Number of production lines 3 7 13 18
Value of a single production line per day $3,000 $5,000 $21,000 $265,000 Percent needing to be held 100% 63% 17% 17% Inventory Holding Cost 25% 25% 25% 25% Number of days held 4 4 4 4 Cost of holding product pending test results $6,000 $13,000 $25,000 $427,000 Number of times held annually 12 12 12 12
Per Facility Cost of Holding Product Annually Awaiting Test Results $75,000 $162,000 $300,000 $5m
Total Cost of Holding Product Annually Awaiting Test Results $4m $12m $9m $14m $40m Total Costs of Testing and Holding Product Annually $5m $15m $11m $14m $45m
*Numbers might not add up due to rounding.
Any facility conducting product testing as a verification activity would be required to
create written procedures. The written procedures should show that a facility’s testing scheme is
technically sound, the procedures for sampling, and the sampling numbers and frequency. The
written procedures also should identify the analytical methods used to test product. Our
estimates for the costs to write the product testing procedures are shown in Table 50 and assume
that those facilities that we have identified as starting a testing program are the ones who will
also write-up testing procedures.
Table 50. Cost to Write-up Product Testing Procedures ($ million)
<20
employees 20 to 99
employees 100 to 499 employees
>500 employees Total
Number of facilities 154 192 39 2 387
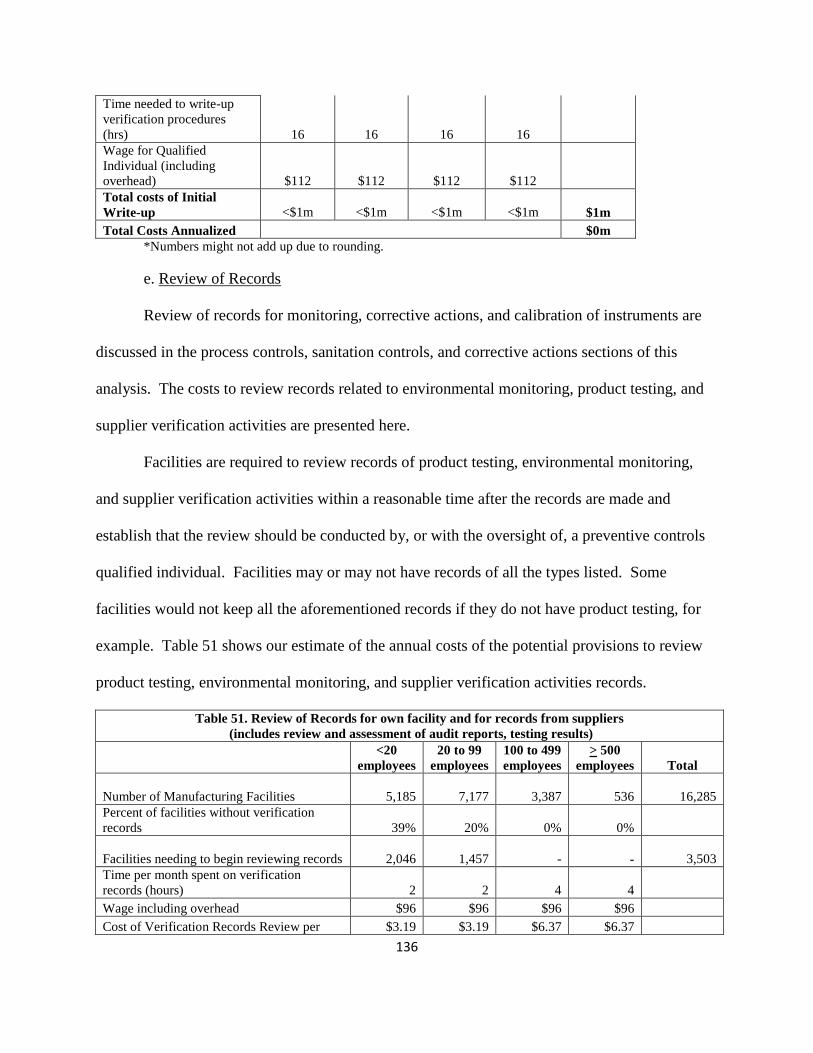
136
Time needed to write-up verification procedures (hrs) 16 16 16 16 Wage for Qualified Individual (including overhead) $112 $112 $112 $112 Total costs of Initial Write-up
<$1m
<$1m
<$1m
<$1m $1m
Total Costs Annualized $0m *Numbers might not add up due to rounding.
e. Review of Records
Review of records for monitoring, corrective actions, and calibration of instruments are
discussed in the process controls, sanitation controls, and corrective actions sections of this
analysis. The costs to review records related to environmental monitoring, product testing, and
supplier verification activities are presented here.
Facilities are required to review records of product testing, environmental monitoring,
and supplier verification activities within a reasonable time after the records are made and
establish that the review should be conducted by, or with the oversight of, a preventive controls
qualified individual. Facilities may or may not have records of all the types listed. Some
facilities would not keep all the aforementioned records if they do not have product testing, for
example. Table 51 shows our estimate of the annual costs of the potential provisions to review
product testing, environmental monitoring, and supplier verification activities records.
Table 51. Review of Records for own facility and for records from suppliers (includes review and assessment of audit reports, testing results)
<20
employees 20 to 99
employees 100 to 499 employees
> 500 employees Total
Number of Manufacturing Facilities
5,185
7,177
3,387
536
16,285 Percent of facilities without verification records 39% 20% 0% 0%
Facilities needing to begin reviewing records
2,046
1,457 - -
3,503 Time per month spent on verification records (hours)
2
2
4
4
Wage including overhead $96 $96 $96 $96 Cost of Verification Records Review per $3.19 $3.19 $6.37 $6.37
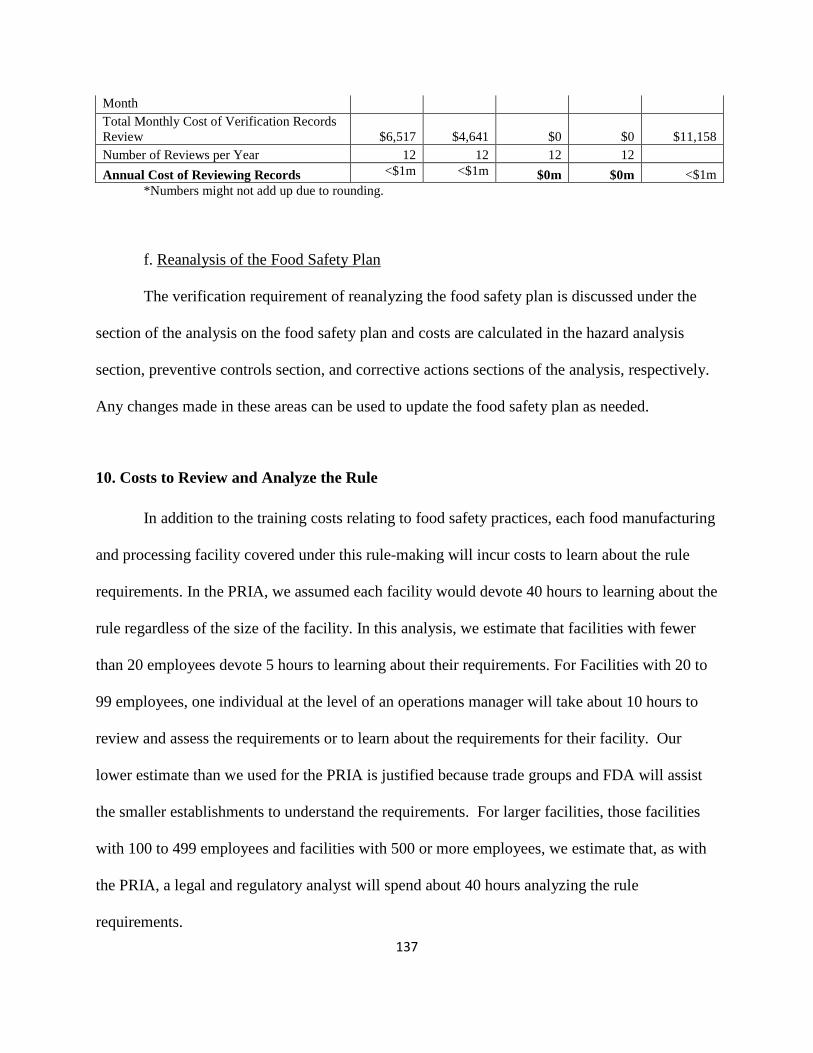
137
Month Total Monthly Cost of Verification Records Review $6,517 $4,641 $0 $0 $11,158 Number of Reviews per Year 12 12 12 12 Annual Cost of Reviewing Records <$1m <$1m $0m $0m <$1m
*Numbers might not add up due to rounding.
f. Reanalysis of the Food Safety Plan
The verification requirement of reanalyzing the food safety plan is discussed under the
section of the analysis on the food safety plan and costs are calculated in the hazard analysis
section, preventive controls section, and corrective actions sections of the analysis, respectively.
Any changes made in these areas can be used to update the food safety plan as needed.
10. Costs to Review and Analyze the Rule
In addition to the training costs relating to food safety practices, each food manufacturing
and processing facility covered under this rule-making will incur costs to learn about the rule
requirements. In the PRIA, we assumed each facility would devote 40 hours to learning about the
rule regardless of the size of the facility. In this analysis, we estimate that facilities with fewer
than 20 employees devote 5 hours to learning about their requirements. For Facilities with 20 to
99 employees, one individual at the level of an operations manager will take about 10 hours to
review and assess the requirements or to learn about the requirements for their facility. Our
lower estimate than we used for the PRIA is justified because trade groups and FDA will assist
the smaller establishments to understand the requirements. For larger facilities, those facilities
with 100 to 499 employees and facilities with 500 or more employees, we estimate that, as with
the PRIA, a legal and regulatory analyst will spend about 40 hours analyzing the rule
requirements.
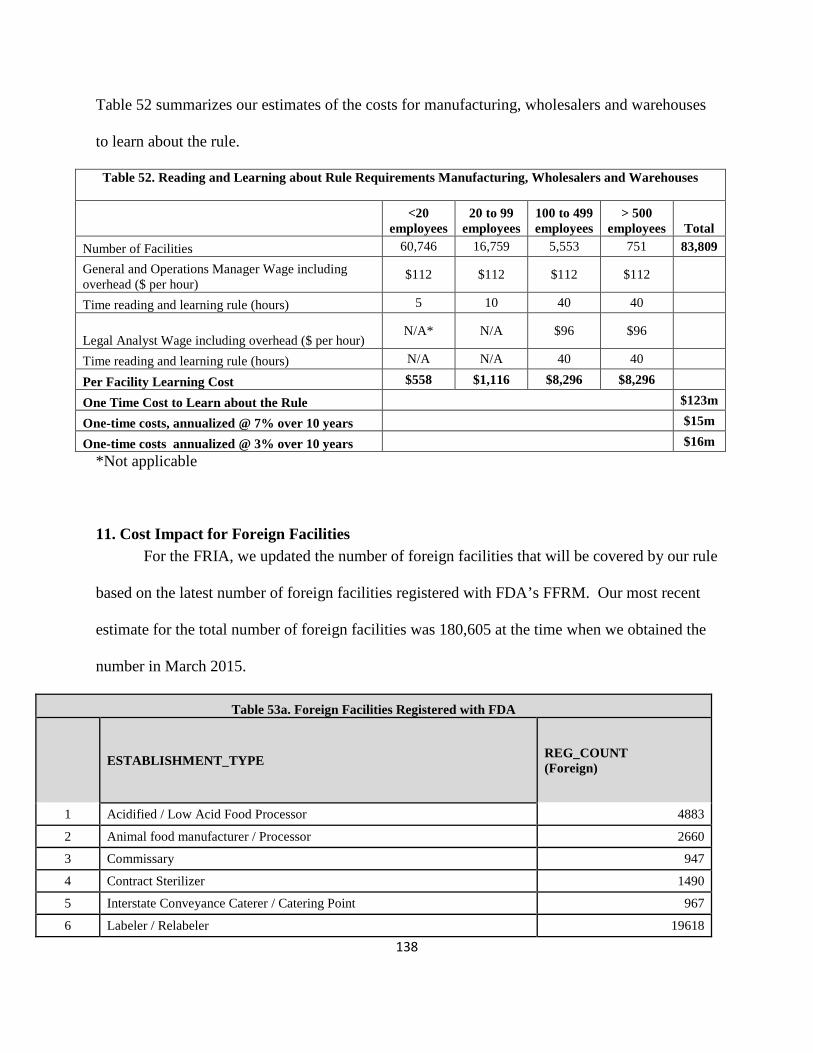
138
Table 52 summarizes our estimates of the costs for manufacturing, wholesalers and warehouses
to learn about the rule.
Table 52. Reading and Learning about Rule Requirements Manufacturing, Wholesalers and Warehouses
<20
employees 20 to 99
employees 100 to 499 employees
> 500 employees Total
Number of Facilities 60,746 16,759 5,553 751 83,809
General and Operations Manager Wage including overhead ($ per hour)
$112 $112 $112 $112
Time reading and learning rule (hours) 5 10 40 40
Legal Analyst Wage including overhead ($ per hour) N/A* N/A $96 $96
Time reading and learning rule (hours) N/A N/A 40 40 Per Facility Learning Cost $558 $1,116 $8,296 $8,296 One Time Cost to Learn about the Rule $123m
One-time costs, annualized @ 7% over 10 years $15m
One-time costs annualized @ 3% over 10 years $16m *Not applicable
11. Cost Impact for Foreign Facilities
For the FRIA, we updated the number of foreign facilities that will be covered by our rule
based on the latest number of foreign facilities registered with FDA’s FFRM. Our most recent
estimate for the total number of foreign facilities was 180,605 at the time when we obtained the
number in March 2015.
Table 53a. Foreign Facilities Registered with FDA
ESTABLISHMENT_TYPE REG_COUNT (Foreign)
1 Acidified / Low Acid Food Processor 4883
2 Animal food manufacturer / Processor 2660
3 Commissary 947
4 Contract Sterilizer 1490
5 Interstate Conveyance Caterer / Catering Point 967
6 Labeler / Relabeler 19618

139
7 Manufacturer / Processor 50141
8 Molluscan Shellfish Establishment 974
9 Other Activity Conducted 4365
10 Repacker / Packer 26899
11 Salvage Operator (Reconditioner) 1241
12 Warehouse / Holding Facility (e.g., storage facilities, including storage tanks, grain elevators) 34628
13 Establishment Type Not Selected 31792 Total 180,605
Of the 180,605 facilities that are registered, we estimate that approximately 60,853 are
foreign manufacturers that might incur compliance costs to continue importing to the US. These
are the foreign food manufacturers, so would not include animal food manufacturers,
commissaries, contract sterilizers or any of the other listed facilities that are either exempt or
unlikely to incur a significant expense to comply. Our estimate of 60,853 includes a
proportionate share of the category “Establishment Type Not Selected.” We assume that
approximately 34 percent of the 31,792 are covered food manufacturers, which we added to
those that listed themselves as manufactures for a total of 60,853.
Because we lack survey data about baseline foreign facility food safety practices and the
likely costs to incorporate all the changes to comply with the rule, we estimate the costs by
assuming that the average costs will be the same for foreign and domestic facilities; they will
have the same proportion of baseline practices and the same proportion of qualified and non-
qualified facilities. We take the ratio of foreign to domestic manufacturing facilities or
60,853/28,385 or 2.14 and multiple the ratio by the domestic costs shown in table 2. Applying
the average costs of the rule for domestic facilities yields an estimated total cost to foreign
facilities of $820 million using a 7 percent discount rate and $817 million using a 3 percent
discount rate.
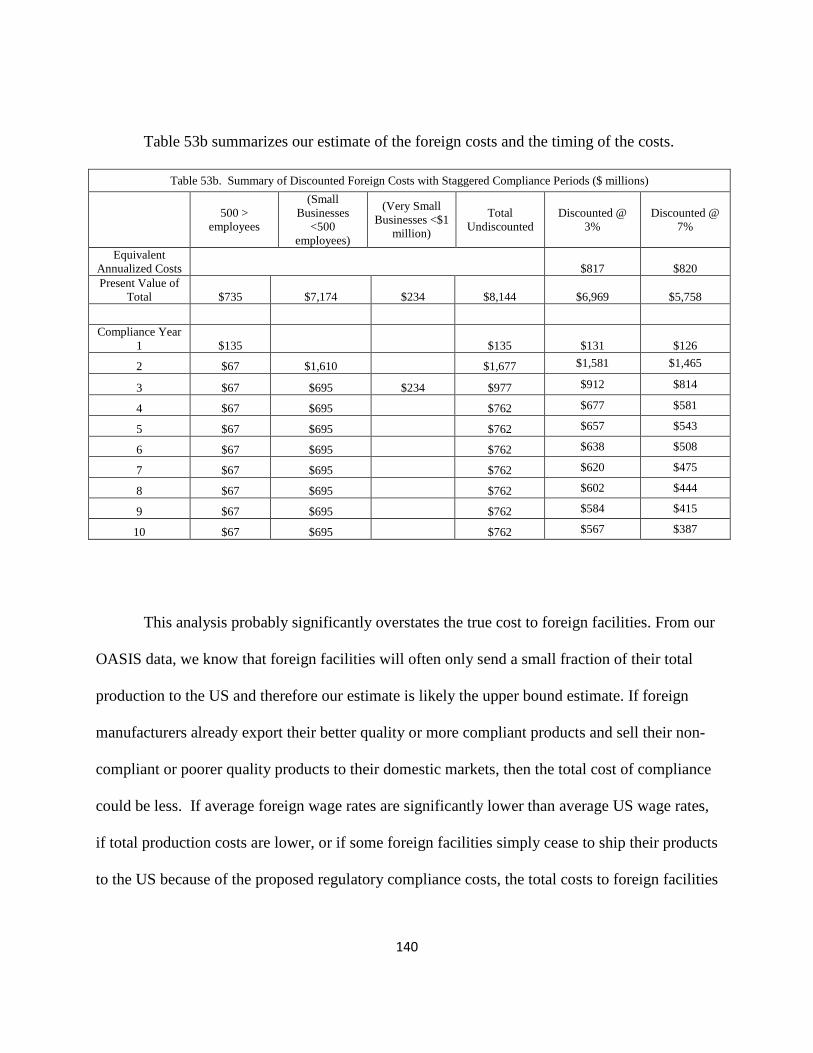
140
Table 53b summarizes our estimate of the foreign costs and the timing of the costs.
Table 53b. Summary of Discounted Foreign Costs with Staggered Compliance Periods ($ millions)
500 > employees
(Small Businesses
<500 employees)
(Very Small Businesses <$1
million)
Total Undiscounted
Discounted @ 3%
Discounted @ 7%
Equivalent Annualized Costs $817 $820 Present Value of
Total $735 $7,174 $234 $8,144 $6,969 $5,758
Compliance Year 1 $135
$135
$131
$126
2 $67 $1,610
$1,677 $1,581 $1,465
3 $67 $695 $234 $977 $912 $814
4 $67 $695
$762 $677 $581
5 $67 $695
$762 $657 $543
6 $67 $695
$762 $638 $508
7 $67 $695
$762 $620 $475
8 $67 $695
$762 $602 $444
9 $67 $695
$762 $584 $415
10 $67 $695
$762 $567 $387
This analysis probably significantly overstates the true cost to foreign facilities. From our
OASIS data, we know that foreign facilities will often only send a small fraction of their total
production to the US and therefore our estimate is likely the upper bound estimate. If foreign
manufacturers already export their better quality or more compliant products and sell their non-
compliant or poorer quality products to their domestic markets, then the total cost of compliance
could be less. If average foreign wage rates are significantly lower than average US wage rates,
if total production costs are lower, or if some foreign facilities simply cease to ship their products
to the US because of the proposed regulatory compliance costs, the total costs to foreign facilities

141
might be significantly less. Conversely, if compliance rates are significantly lower, or if average
foreign wage costs are higher, then the total costs to foreign facilities could be higher.
J. Other Regulatory Alternatives
FDA identified and assessed several regulatory alternatives for dealing with processing,
packing, and holding practices that might not prevent foods from becoming adulterated or
mislabeled. The alternatives include: (a) no new regulatory action, (b) a lower threshold for the
definition of a very small business, (c) longer or shorter compliance times, (d) reduced
requirements, and (e) non-risk-based preventive controls .
No New Regulatory Action
While not a legally viable alternative, imposing no new federal preventive control
requirements is the baseline for our analysis. FSMA requires that we issue a Preventive Control
regulation.
In the absence of FSMA, under this alternative, FDA would rely on:
•
•
•
•
the current food CGMP regulations (21 CFR part 110),
voluntary adoption of some or all provisions of the regulation,
current or enhanced State and local enforcement activity to bring about a reduction of
potential harm from adulterated or mislabeled foods, or
the tort system, with litigation or the threat of litigation serving to bring about the goals of the
rule.
The baseline system is already in place and the food industry generally understands the
requirements. However, the regimen lacks several of the most important provisions of the rule
that have the potential to prevent avoidable foodborne illnesses. By voluntarily introducing
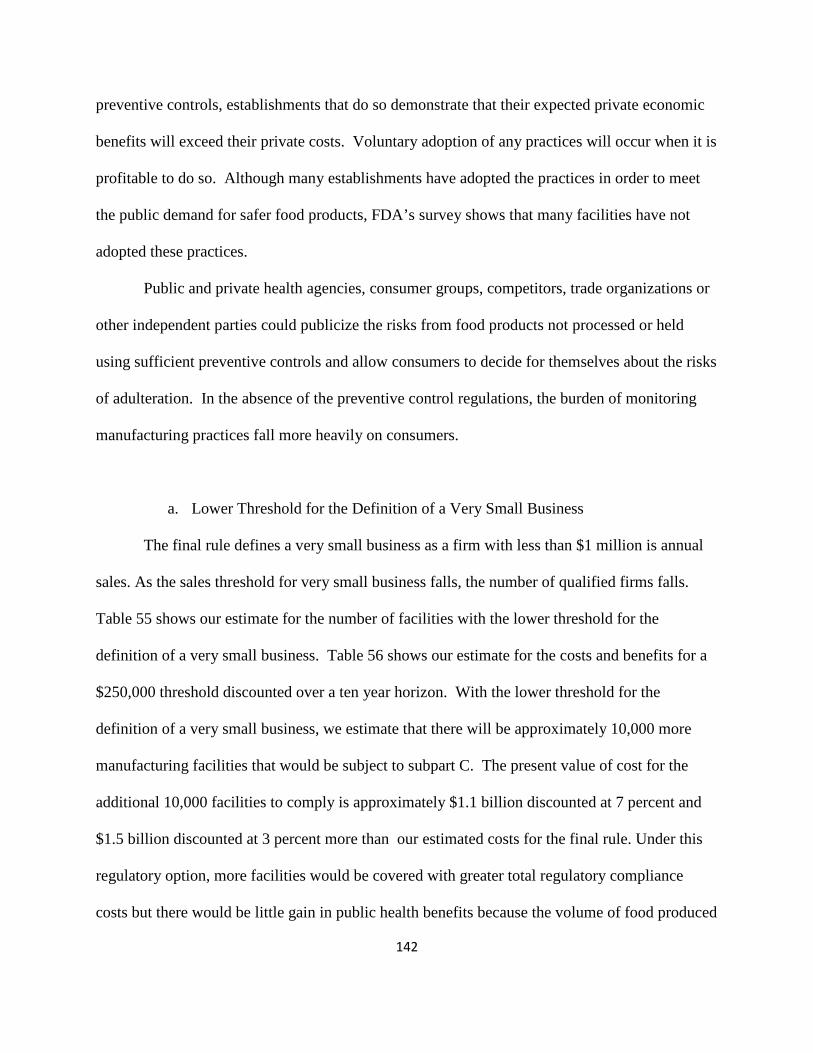
142
preventive controls, establishments that do so demonstrate that their expected private economic
benefits will exceed their private costs. Voluntary adoption of any practices will occur when it is
profitable to do so. Although many establishments have adopted the practices in order to meet
the public demand for safer food products, FDA’s survey shows that many facilities have not
adopted these practices.
Public and private health agencies, consumer groups, competitors, trade organizations or
other independent parties could publicize the risks from food products not processed or held
using sufficient preventive controls and allow consumers to decide for themselves about the risks
of adulteration. In the absence of the preventive control regulations, the burden of monitoring
manufacturing practices fall more heavily on consumers.
a. Lower Threshold for the Definition of a Very Small Business
The final rule defines a very small business as a firm with less than $1 million is annual
sales. As the sales threshold for very small business falls, the number of qualified firms falls.
Table 55 shows our estimate for the number of facilities with the lower threshold for the
definition of a very small business. Table 56 shows our estimate for the costs and benefits for a
$250,000 threshold discounted over a ten year horizon. With the lower threshold for the
definition of a very small business, we estimate that there will be approximately 10,000 more
manufacturing facilities that would be subject to subpart C. The present value of cost for the
additional 10,000 facilities to comply is approximately $1.1 billion discounted at 7 percent and
$1.5 billion discounted at 3 percent more than our estimated costs for the final rule. Under this
regulatory option, more facilities would be covered with greater total regulatory compliance
costs but there would be little gain in public health benefits because the volume of food produced

143
or sold by these facilities is small and therefore the exposure of the public to this food would
likely be minimal.
Table 55 - Food Manufacturers, Warehouses, and Wholesalers: Total Number of Facilities and Qualified and Non-Qualified Facilities Breakdown VSB <$250K
Food Manufacturers
Category Total
Facilities Small
Facilities Medium Facilities
Large Facilities
Very Large Facilities Firms
Market Share
Qualified
30,990 30,850 117 23
11,925 0.3% Non-qualified
(>$250k)
26,194 15,039 7,835 3,320
9,402 99.7%
Total
57,184 45,889 7,952 3,343
21,327
Firms with Non-Refrigerated Storage (Warehousing and wholesaling)
Category Total
Facilities Small
Facilities Medium Facilities
Large Facilities
Very Large Facilities Firms
Market Share
Qualified
3,283 3,281 2 -
25,294 0.9% Non-qualified
(>$250k)
3,436 2,559 744 133
21,566 99.1%
Firms with Refrigerated Storage (Warehousing and Wholesaling)
Category Total
Facilities Small
Facilities Medium Facilities
Large Facilities
Very Large Facilities Firms
Market Share
Qualified
5,024 5,011 13 -
1,085 0.3% Non-qualified
(>$250k)
13,613 11,661 1,693 259
1,841 99.7%
All Covered Facilities: <$250k Cutoff
Category Total
Facilities Small
Facilities Medium Facilities
Large Facilities
Very Large Facilities Firms
Qualified
37,134 36,708 388 36
36,603 0.6% Non-qualified
(>$250k)
46,685 24,038 16,371 5,517
29,918 99.4%
Total
83,819 60,746 16,759 5,553
66,521
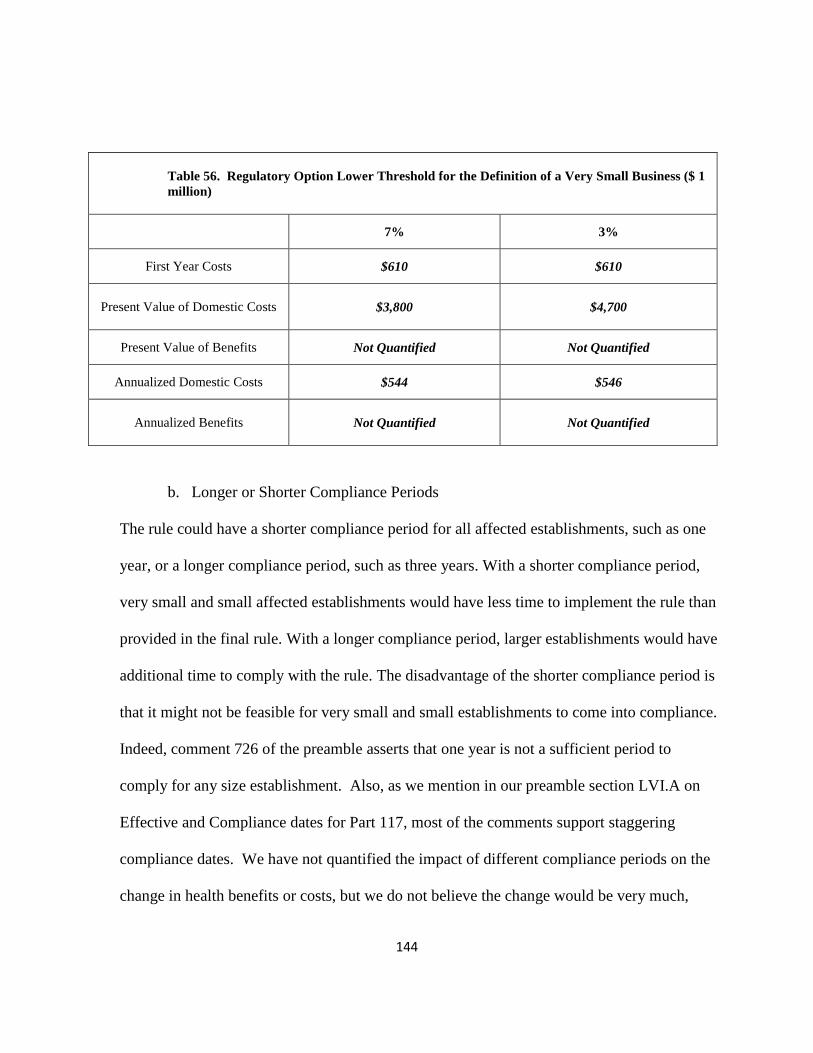
144
Table 56. Regulatory Option Lower Threshold for the Definition of a Very Small Business ($ 1 million)
7% 3%
First Year Costs $610 $610
Present Value of Domestic Costs
$3,800 $4,700
Present Value of Benefits Not Quantified Not Quantified
Annualized Domestic Costs $544 $546
Annualized Benefits
Not Quantified Not Quantified
b. Longer or Shorter Compliance Periods
The rule could have a shorter compliance period for all affected establishments, such as one
year, or a longer compliance period, such as three years. With a shorter compliance period,
very small and small affected establishments would have less time to implement the rule than
provided in the final rule. With a longer compliance period, larger establishments would have
additional time to comply with the rule. The disadvantage of the shorter compliance period is
that it might not be feasible for very small and small establishments to come into compliance.
Indeed, comment 726 of the preamble asserts that one year is not a sufficient period to
comply for any size establishment. Also, as we mention in our preamble section LVI.A on
Effective and Compliance dates for Part 117, most of the comments support staggering
compliance dates. We have not quantified the impact of different compliance periods on the
change in health benefits or costs, but we do not believe the change would be very much,

145
although we believe a longer compliance period would substantially delay the reduction in
foodborne illnesses.
c. Fewer Requirements
The rule could have only required the provisions proposed at the initial stage of
rulemaking and not include the requirements for education and training, environmental
monitoring, product testing, supplier approval and verification and hazard analysis for
economically motivated adulteration. The total annualized costs for the rule with fewer
requirements would be $209million discounted for 10 years at 7 percent as shown in Table 58.
Cutting provisions would increase the risk of foodborne illness.
Under this option, without a requirement for education and training in the principles of
food hygiene and food safety, employees might not learn about the importance of employee
health and personal hygiene to food safety, which is fundamental to the concept of CGMPs and
lack of which has been associated with foodborne illness and identified as the root cause of up to
a third of GMP-related recalls. In fact, requiring training was identified by both FDA and
industry as key in preventing problems with implementation of GMPs. Without an
environmental monitoring requirement, as appropriate, facilities might not apply this industry
best-practice for verifying sanitation controls for ready-to-eat foods exposed to the environment.
Recent outbreaks, including those from Listeria monocytogenes in soft cheeses and ice cream
and Salmonella in nut butters, have shown the importance of having robust environmental
monitoring programs. Without a requirement for product testing, as appropriate, a facility might
not conduct such verification activities; the importance of finished product testing is not always
obvious from public information, since most companies that do testing do not release products
until testing is completed and any foods positive for pathogens are reconditioned or

146
destroyed. However, in one high profile incident, a positive sample of a finished product
identified through routine verification testing was responsible for determining that hydrolyzed
vegetable protein was contaminated with Salmonella spp., resulting in over 177 products being
recalled. This recall likely prevented many cases of salmonellosis. Without supplier verification
activities that are appropriate to the hazard, facilities might not conduct such activities.
Contaminated ingredients have been identified as the source of outbreaks and recalls, e.g., snack
food made with dried vegetable powder containing Salmonella; Salmonella-contaminated peanut
butter in crackers, and, as noted above, hydrolyzed vegetable protein used in many foods.
Verification of supplier controls can prevent such situations. We are unable to quantify the
number of corrective actions taken as a result of audits of facilities and the potential
contamination events avoided as a result. However, we do know that many submissions to the
Reportable Food Registry identifying pathogens such as Salmonella in foods (e.g., spices) have
resulted from customers testing ingredients to verify that suppliers have controlled hazards in
raw materials or other ingredients. As we mentioned for our analysis of benefits, we lack
independent studies that quantify health benefits associated with the implementation of a
preventive controls program. Expert elicitations, suggests that these provisions would
substantially reduce the incidence of foodborne illness. We summarize the results in Table 58.
Table 58. Regulatory Option Fewer Requirements ($1 million)
7% 3%
First Year Costs $350 $350
Present Value of Domestic Costs $1,500 $1,800
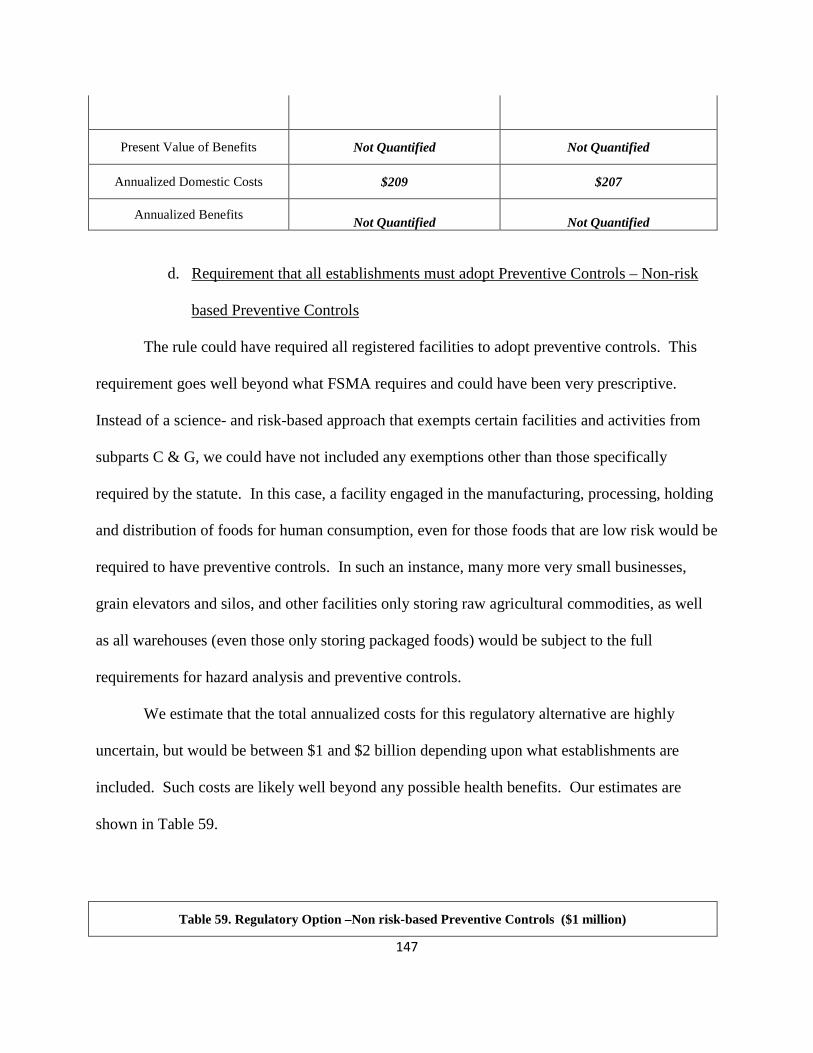
147
Present Value of Benefits Not Quantified Not Quantified
Annualized Domestic Costs $209 $207
Annualized Benefits Not Quantified
Not Quantified
d. Requirement that all establishments must adopt Preventive Controls – Non-risk
based Preventive Controls
The rule could have required all registered facilities to adopt preventive controls. This
requirement goes well beyond what FSMA requires and could have been very prescriptive.
Instead of a science- and risk-based approach that exempts certain facilities and activities from
subparts C & G, we could have not included any exemptions other than those specifically
required by the statute. In this case, a facility engaged in the manufacturing, processing, holding
and distribution of foods for human consumption, even for those foods that are low risk would be
required to have preventive controls. In such an instance, many more very small businesses,
grain elevators and silos, and other facilities only storing raw agricultural commodities, as well
as all warehouses (even those only storing packaged foods) would be subject to the full
requirements for hazard analysis and preventive controls.
We estimate that the total annualized costs for this regulatory alternative are highly
uncertain, but would be between $1 and $2 billion depending upon what establishments are
included. Such costs are likely well beyond any possible health benefits. Our estimates are
shown in Table 59.
Table 59. Regulatory Option –Non risk-based Preventive Controls ($1 million)
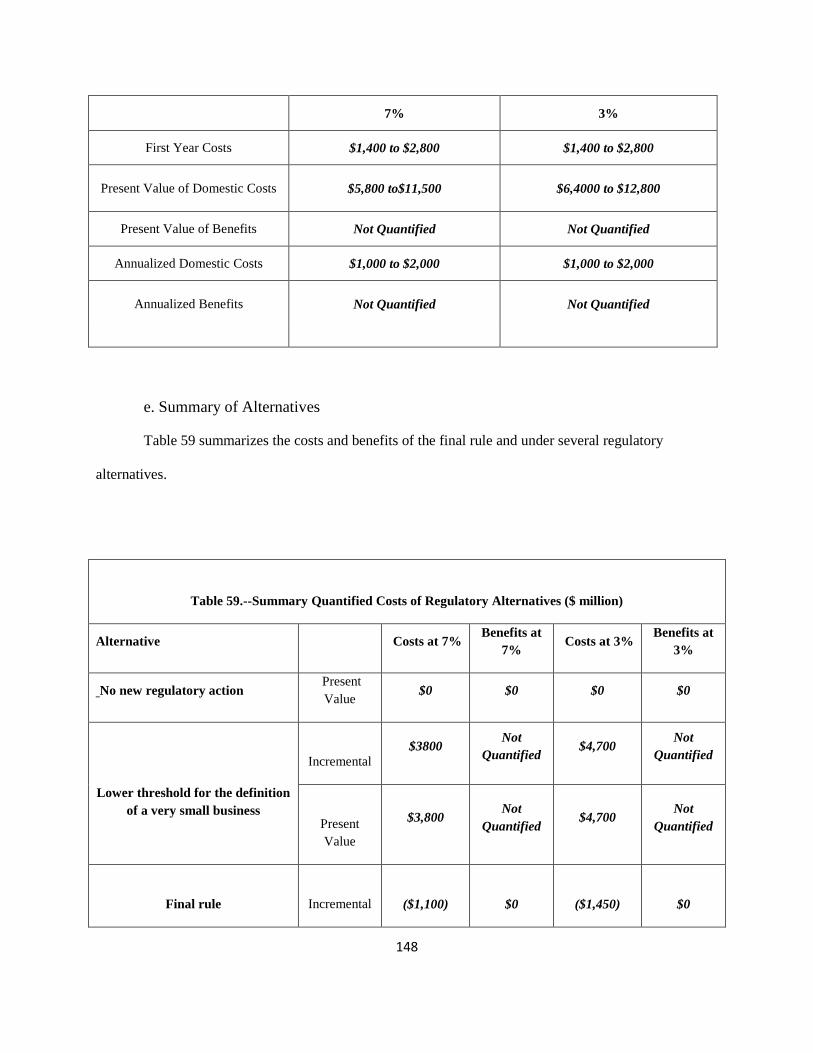
148
7% 3%
First Year Costs $1,400 to $2,800 $1,400 to $2,800
Present Value of Domestic Costs
$5,800 to$11,500 $6,4000 to $12,800
Present Value of Benefits Not Quantified Not Quantified
Annualized Domestic Costs $1,000 to $2,000 $1,000 to $2,000
Annualized Benefits
Not Quantified
Not Quantified
e. Summary of Alternatives
Table 59 summarizes the costs and benefits of the final rule and under several regulatory
alternatives.
Table 59.--Summary Quantified Costs of Regulatory Alternatives ($ million)
Alternative Costs at 7% Benefits at
7% Costs at 3%
Benefits at 3%
No new regulatory action Present Value $0 $0 $0 $0
Lower threshold for the definition of a very small business
Incremental $3800
Not Quantified
$4,700 Not
Quantified
Present Value
$3,800 Not
Quantified $4,700
Not Quantified
Final rule Incremental ($1,100) $0 ($1,450) $0

149
Present Value
$2,700 Not
Quantified $3,250
Not Quantified
Longer or Shorter compliance
period
Incremental
Not Quantified
Not Quantified
Not Quantified
Not Quantified
Present Value
Not Quantified
Not Quantified
Not Quantified
Not Quantified
Fewer requirements
Incremental
($1,200)
Not Quantified
($1,450)
Not Quantified
Present Value
$1, 500 Not
Quantified $1,800
Not Quantified
Greater requirements – require non-risk based Preventive
Controls
Incremental
$4,300 to $10,000
Not Quantified
$5,400 to $11,000
Not Quantified
Present Value
$5,800 to$11,500
Not Quantified
$6,400 to $12,800
Not Quantified
Note: incremental costs are relative to previously-listed alternative.
K. UNCERTAINTY ANALYSIS
a. Uncertainty in cost estimates
One source of uncertainty is our Food GMP survey. As we mentioned, our survey is
based on a representative sample of 2,700 food establishments that registered with FDA’s Food
Facility Registration Module database (FFRM) by randomly selecting the targeted facilities from
the database to ensure an equal chance that any facility of any product type and facility size
could be drawn. The sampling was drawn from facilities that were registered with FDA as of

150
mid-2009. Because the survey was completed in 2010, some practices will already have changed
by the time the rule is published. Many facilities enter the market and leave the market that
would not be captured by the survey. Further, the Food GMP survey design was based on three
size classes, small (<20 employees), medium (20-99 employees) and large (> 100 employees).
We noted that we lacked a survey class specifically for the largest size class, although we also
noted that did not mean that we could not generate summary statistics applicable to that large
size class using the survey data collected. We noted that our estimates for that size class and for
each size class are statistically valid, and generalizable to all domestic manufacturers, although
we acknowledged that the survey results for the largest facilities are likely to have a larger
degree of uncertainty associated with our estimate and that the survey results in general reflect a
degree of statistical uncertainty.
There has been a growing industry-wide understanding of the benefits of preventive
controls and more and more establishments are adopting some form of the controls that we
require in the absence of regulation. Our survey was conducted in FY 2010 and has a margin of
error of approximately 10 percent. If the survey overstates the number of facilities that lack our
controls today by 20 percent, the total costs for the final rule would decline to $333million as
shown in Table 59. Table 59. Summary of Total Costs if 20% fewer facilities would be required to adopt
the provisions of the rule ($ millions)
PCHF Provision
One-Time Cost
First Yr
Compliance Period
One-Time Cost
Second Yr
Compliance Period
(Small Businesses
<500 employees)
One-Time Cost
Third Yr
CompliancePeriod (Very Small
Businesses <$1
Annual Cost
(Annually Recurring
Costs) Total
Annualized Cost at 7%
Total Annualized Cost at 3%
million)

151
Learn about Rule $5 $81 $17 $0 $13 $11
Education and Training $14 $148 $21 $14 $30 $30 Attest Qualified Status to FDA $0 $0 $1 $0 $0 $0
One-time Label Change $0 $0 $53 $0 $6 $6 Total Costs Subpart A & D $14 $148 $75 $14 $36 $36
Subpart C Hazard Analysis and Risk-Based Preventive Controls
Hazard Analysis $0 $42 $0 $23 $25 $25 Hazard Analysis for Economically Motivated Adulteration
$1 $9 $0 $17 $17 $17
Process Controls $2 $57 $0 $53 $52 $52 Allergen Controls $1 $15 $0 $11 $11 $11 Sanitation Controls $1 $22 $0 $8 $10 $10 Environmental Monitoring $0 $2 $0 $17 $15 $15 Product Testing $0 $0 $0 $45 $41 $42 Supplier Approval and Verification Program $4 $11 $0 $70 $64 $65
Corrective Actions $0 $4 $0 $27 $24 $24 Recall Plans $0 $4 $0 $5 $4 $4 Monitoring/Verification $0 $1 $0 $25 $21 $22
Total Costs Subpart C $9 $167 $0 $301 $284 $287
Total Domestic Costs $28 $396 $92 $315 $333 $334
It is possible that we underestimated the number of facilities that would be required to
adopt the requirements or that we underestimated the costs for each of the facilities. If we
underestimated either by 20 percent, the true total costs would be $428 million as shown in Table
60.

152
Table 60. Summary of Total Costs if 20% more facilities would be required to adopt the provisions of the rule ($ millions)
PCHF Provision
One-Time Cost
One-Time Cost
One-Time Cost
Annual Cost
Total Annualized Cost at 7%
Total Annualized Cost at 3%
First Yr Compliance
Period
Second Yr Compliance
Period
Third Yr Compliance
Period
(Annually Recurring
Costs)
(Small Businesses
<500 employees)
(Very Small Businesses
<$1 million)
Learn about Rule $7 $112 $25 $0 $18 $16
Education and Training $19 $148 $21 $17 $39 $38
Attest Qualified Status to FDA $0 $0 $1 $0 $0 $0
One-time Label Change $0 $0 $79 $0 $9 $9
Total Costs Subpart A & D $19 $148 $101 $17 $48 $47
Subpart C Hazard Analysis and Risk-Based Preventive Controls
Hazard Analysis $0 $60 $0 $30 $33 $33
Hazard Analysis for Economically Motivated Adulteration $2 $13 $0 $26 $25 $25
Process Controls $2 $57 $0 $79 $78 $78
Allergen Controls $1 $15 $0 $16 $17 $17
Sanitation Controls $1 $33 $0 $12 $15 $15
Environmental Monitoring $0 $2 $0 $17 $15 $15
Product Testing $0 $0 $0 $45 $41 $42
Supplier Approval and Verification Program $4 $11 $0 $70 $64 $65
Corrective Actions $0 $4 $0 $40 $35 $36
Recall Plans $0 $4 $0 $7 $7 $7
Monitoring/Verification $0 $1 $0 $36 $32 $33
Total Costs Subpart C $10 $200 $0 $378 $362 $366
Total Domestic Costs $36 $460 $126 $395 $428 $429
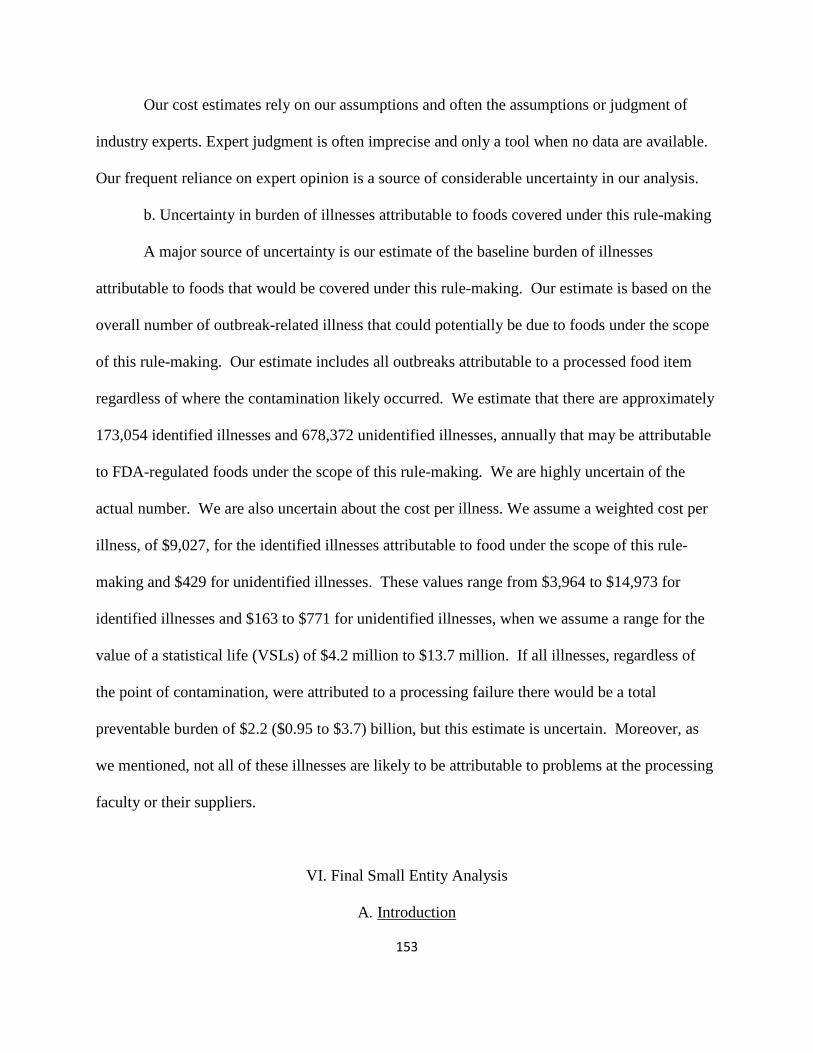
153
Our cost estimates rely on our assumptions and often the assumptions or judgment of
industry experts. Expert judgment is often imprecise and only a tool when no data are available.
Our frequent reliance on expert opinion is a source of considerable uncertainty in our analysis.
b. Uncertainty in burden of illnesses attributable to foods covered under this rule-making
A major source of uncertainty is our estimate of the baseline burden of illnesses
attributable to foods that would be covered under this rule-making. Our estimate is based on the
overall number of outbreak-related illness that could potentially be due to foods under the scope
of this rule-making. Our estimate includes all outbreaks attributable to a processed food item
regardless of where the contamination likely occurred. We estimate that there are approximately
173,054 identified illnesses and 678,372 unidentified illnesses, annually that may be attributable
to FDA-regulated foods under the scope of this rule-making. We are highly uncertain of the
actual number. We are also uncertain about the cost per illness. We assume a weighted cost per
illness, of $9,027, for the identified illnesses attributable to food under the scope of this rule-
making and $429 for unidentified illnesses. These values range from $3,964 to $14,973 for
identified illnesses and $163 to $771 for unidentified illnesses, when we assume a range for the
value of a statistical life (VSLs) of $4.2 million to $13.7 million. If all illnesses, regardless of
the point of contamination, were attributed to a processing failure there would be a total
preventable burden of $2.2 ($0.95 to $3.7) billion, but this estimate is uncertain. Moreover, as
we mentioned, not all of these illnesses are likely to be attributable to problems at the processing
faculty or their suppliers.
VI. Final Small Entity Analysis
A. Introduction

154
The Small Business Regulatory Flexibility Act requires agencies to analyze regulatory
options that would minimize any significant impact of a rule on small entities. Small entities
have fewer resources to devote to regulatory compliance and, therefore, may be more affected by
regulatory compliance costs. The agency finds that the rule will have a significant economic
impact on a substantial number of small entities.
B. Economic Effects on Small Entities 1. Regulated Entities
a. Number of Small Entities Affected The Small Business Administration defines food manufacturers as “small” according to
their number of employees. For the most part, food manufacturers employing 500 or fewer
persons are considered small businesses. However, there are some food manufacturing industry
segments where the employee maximum is higher (750 or 1,000 employees). Table 63 shows the
SBA size classifications for many of the various sectors of food manufacturing.
Table 63 - SBA Size Classification by Number of Employees
NAICS Subsector 311 – Food Manufacturing
Number of
Employees 311119 Other Animal Food Manufacturing 500 311211 Flour Milling 500 311212 Rice Milling 500 311213 Malt Manufacturing 500 311221 Wet Corn Milling 750 311222 Soybean Processing 500 311223 Other Oilseed Processing 1,000 311225 Fats and Oils Refining and Blending 1,000 311230 Breakfast Cereal Manufacturing 1,000 311311 Sugarcane Mills 500 311312 Cane Sugar Refining 750 311313 Beet Sugar Manufacturing 750
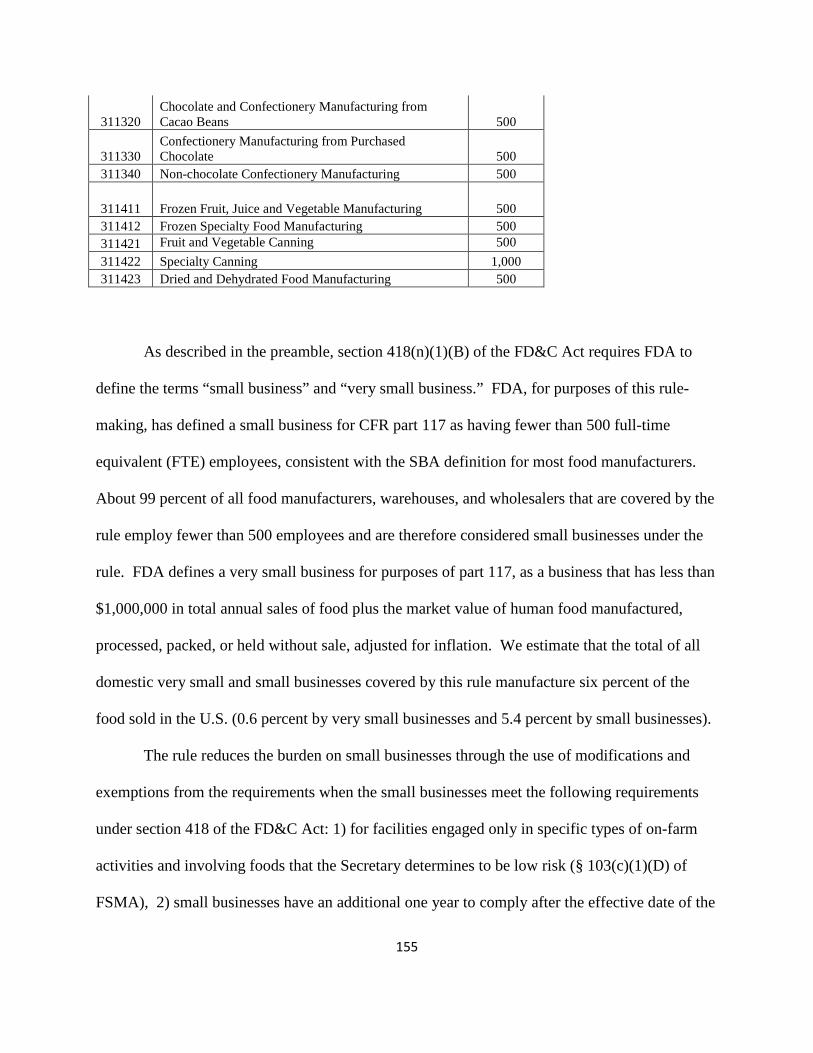
155
311320 Chocolate and Confectionery Manufacturing from Cacao Beans 500
311330 Confectionery Manufacturing from Purchased Chocolate 500
311340 Non-chocolate Confectionery Manufacturing 500
311411 Frozen Fruit, Juice and Vegetable Manufacturing 500 311412 Frozen Specialty Food Manufacturing 500 311421 Fruit and Vegetable Canning 500 311422 Specialty Canning 1,000 311423 Dried and Dehydrated Food Manufacturing 500
As described in the preamble, section 418(n)(1)(B) of the FD&C Act requires FDA to
define the terms “small business” and “very small business.” FDA, for purposes of this rule-
making, has defined a small business for CFR part 117 as having fewer than 500 full-time
equivalent (FTE) employees, consistent with the SBA definition for most food manufacturers.
About 99 percent of all food manufacturers, warehouses, and wholesalers that are covered by the
rule employ fewer than 500 employees and are therefore considered small businesses under the
rule. FDA defines a very small business for purposes of part 117, as a business that has less than
$1,000,000 in total annual sales of food plus the market value of human food manufactured,
processed, packed, or held without sale, adjusted for inflation. We estimate that the total of all
domestic very small and small businesses covered by this rule manufacture six percent of the
food sold in the U.S. (0.6 percent by very small businesses and 5.4 percent by small businesses).
The rule reduces the burden on small businesses through the use of modifications and
exemptions from the requirements when the small businesses meet the following requirements
under section 418 of the FD&C Act: 1) for facilities engaged only in specific types of on-farm
activities and involving foods that the Secretary determines to be low risk (§ 103(c)(1)(D) of
FSMA), 2) small businesses have an additional one year to comply after the effective date of the

156
rule (§ 103(i) of FSMA) and very small businesses have an additional two years, and 3) very
small businesses are deemed “qualified” and therefore, qualify for the exemptions from many of
the provisions of these regulations as discussed in section X.B.1 of the document (§ 418(l)(1)(B)
of the FD&C Act).
Table 64 summarizes our estimate of the total domestic food facilities count. For
purposes of the small business analysis, columns 3 to 5 of the table identify the facilities that
meet our definition of a small business. We estimate that a total of 83,068 domestic facilities are
small entities.
Table 64 - All Covered Firms for Final PCHF rule: $1M VSB Cut-off
Category
Facilities
Firms Total FTE’s Total <20 FTS’s
20 to 99 FTS’s
100 to 499 FTE’s > 500 FTE’s
Qualified 37,134 36,708 388 36 2 36,603 141,352 0.6% Non-Qualified 46,685 24,038 16,371 5,517 749 29,918 2,376,492 99.4%
Total 83,819 60,746 16,759 5,553 751 66,521 2,517,844
b. Costs to Small Businesses Using data from D&B, Table 65 summarizes the annual revenues for facilities by revenue
category; the table shows that only a small percentage of total industry sales are from facilities
with the smallest annual revenues. Facilities with revenues of more than $1,000,000 account for
about 99.4 percent of the total industry sales, so 0.6 percent or less than one percent of the food
sold will be from facilities that are "qualified” under this regulation.
Table 65. Small Establishment Market Share
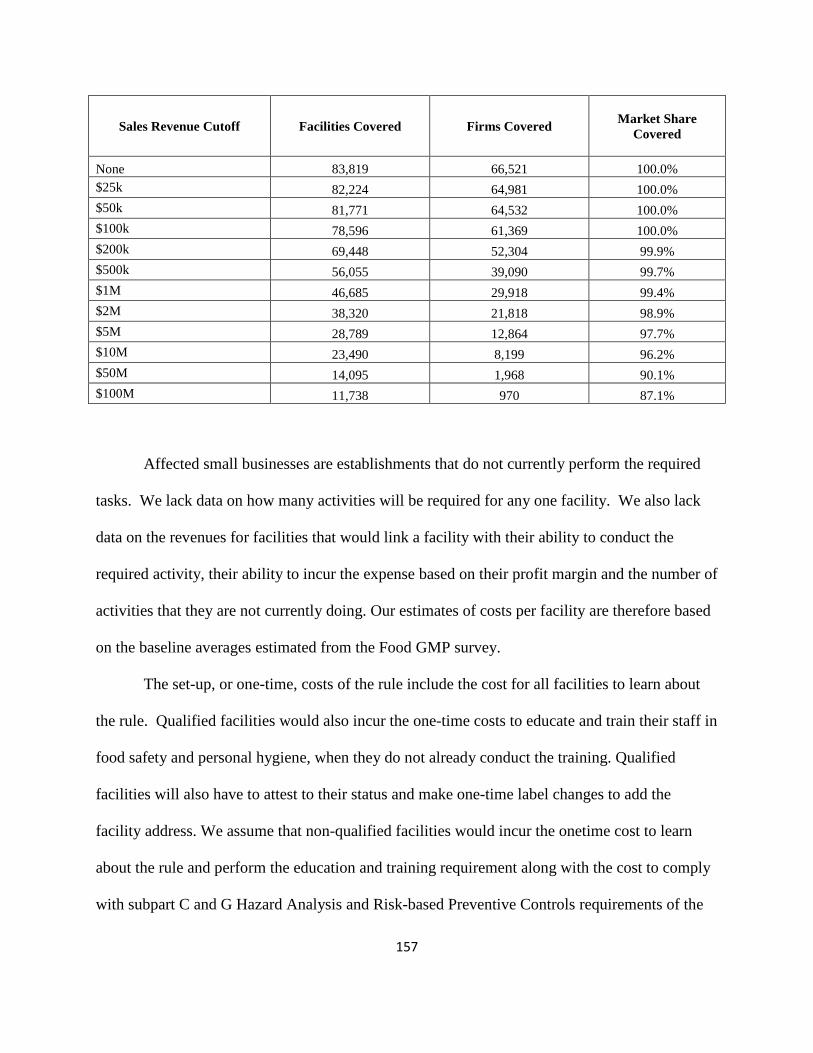
157
Sales Revenue Cutoff Facilities Covered Firms Covered Market Share Covered
None 83,819 66,521 100.0% $25k 82,224 64,981 100.0% $50k 81,771 64,532 100.0% $100k 78,596 61,369 100.0% $200k 69,448 52,304 99.9% $500k 56,055 39,090 99.7% $1M 46,685 29,918 99.4% $2M 38,320 21,818 98.9% $5M 28,789 12,864 97.7% $10M 23,490 8,199 96.2% $50M 14,095 1,968 90.1% $100M 11,738 970 87.1%
Affected small businesses are establishments that do not currently perform the required
tasks. We lack data on how many activities will be required for any one facility. We also lack
data on the revenues for facilities that would link a facility with their ability to conduct the
required activity, their ability to incur the expense based on their profit margin and the number of
activities that they are not currently doing. Our estimates of costs per facility are therefore based
on the baseline averages estimated from the Food GMP survey.
The set-up, or one-time, costs of the rule include the cost for all facilities to learn about
the rule. Qualified facilities would also incur the one-time costs to educate and train their staff in
food safety and personal hygiene, when they do not already conduct the training. Qualified
facilities will also have to attest to their status and make one-time label changes to add the
facility address. We assume that non-qualified facilities would incur the onetime cost to learn
about the rule and perform the education and training requirement along with the cost to comply
with subpart C and G Hazard Analysis and Risk-based Preventive Controls requirements of the

158
rule, so we include the cost for subpart C and G for just total non-qualified manufacturing
facilities. The average costs per entity are shown in Table 66. Average annualized costs (at 7
percent discount) per are about $24,000 per non-qualified facility; average annualized costs per
qualified facility are about $1,800.
Small establishments that do not perform a substantial number of the actions required by
the final rule will bear the costs for compliance with the provisions of this final rule. Although
the final rule will raise product prices, the price increase (which would largely be determined by
changes made by large establishments) may be much smaller than the increase in the average
costs of very small producers. The average burden to very small establishments with annual
revenues of $250 thousand will be about one percent of annual revenue. Establishments with
average annual revenues of $25,000 or less that incur the average compliance cost for a qualified
facility of $1,100 will incur costs of over 4 percent of their revenue, which is likely comparable
to half their entire profits; consequently, they will be at risk of going out of business.
Establishments with above average costs, and even establishments with average costs, might find
it difficult to continue to operate. Some of these may decide it is too costly and either change
product lines or go out of business. The regulatory costs of this rule may also discourage at least
some new small businesses from entering the industry. The food industry has traditionally been
characterized by substantial entry of small businesses.
Table 66. Small Business Costs per Domestic Firm
Average
One-Time Cost
Average Annual
Recurring Cost
Average Present Value of
Total Cost at 7%
Average Present Value of
Total Cost at 3%
Average Annualized Cost at 7%
Average Annualized Cost at 3%

159
Very Small Businesses
(<$1 million) $4,700 $200 $5,900 $6,000 $1,100 $1,000
Small Businesses
(<500 FTEs) $6,500 $4,100 $30,000 $33,000 $5,100 $5,000
2. Regulatory Flexibility Options
In the final rule, we have introduced several provisions for regulatory relief for small
entities. The most important are the modified requirements for very small businesses. In addition,
small and very small businesses have additional time to comply with the requirements: small
businesses have two years and very small businesses have three years to come into compliance
after the effective date of the final rule. This is an additional 12 months or 24 months beyond the
time given to larger facilities to comply with this rule.
If qualified facilities were to incur the same average cost per provision as facilities not
subject to subpart C, Hazard Analysis and Risk-Based Preventive Controls, then by exempting
them, our rule will reduce their average annualized costs by approximately $11,000 [($24,000
per non-qualified facility - $2,000 per qualified facility) x 0.5 for those that already perform the
activities].
The final rule provides substantial cost relief to small businesses. We identified two other
options for regulatory relief that were not adopted.
a. Longer compliance period for small businesses
Small entities may find it more difficult to learn about and implement the requirements
than it will be for large entities. Lengthening the compliance period for small businesses would
provide some additional regulatory relief by allowing small businesses to take advantage of
160
increases in industry knowledge and experience in implementing these regulations. A longer
compliance period will allow additional time to learn about the requirements of the rule, to hire
or train workers to become qualified individuals to help develop their food safety plan, to
conduct their hazard analysis, to develop their written procedures for and implement their
preventive controls, to set up record keeping, to make any improvements to their physical plant,
to purchase new or replacement equipment, to arrange financing, and for any other initial
expenditures of time, effort and money. It will also delay the impact of the annual costs of
compliance. We are unable to estimate the impact on costs from the industry experience effect of
the longer compliance period.
b. Fewer Requirements
An alternative to the provisions in the final rulemaking would be to not include the
requirements for education and training, environmental monitoring, product testing, supplier
approval and verification and hazard analysis for economically motivated adulteration. The
impact would reduce average costs for small businesses. Under this alternative, the annualized
costs per small business would be reduced from $5,500 to $3,000. The cost to the public is to
reduce the public health benefits.
VII. Unfunded Mandates
Section 202(a) of the Unfunded Mandates Reform Act of 1995 requires that agencies
prepare a written statement, which includes an assessment of anticipated costs and benefits,
before proposing “any rule that includes any Federal mandate that may result in the expenditure
by State, local, and tribal governments, in the aggregate, or by the private sector, of
$100,000,000 or more (adjusted annually for inflation) in any one year.” The current threshold

161
after adjustment for inflation is $144 million, using the most current (2014) Implicit Price
Deflator for the Gross Domestic Product. We have determined that the final rule has met the
threshold under the Unfunded Mandates Reform Act. We carried out the cost-benefit analysis in
preceding sections of this document. The other requirements under the Unfunded Mandates Act
of 1995 include assessing the final rule’s effects on:
•
•
•
•
•
•
•
Future costs;
Particular regions, communities, or industrial sectors;
National productivity;
Economic growth;
Full employment;
Job creation; and
Exports.
The relevant issues listed above are covered in detail in the cost benefit analysis of the
preceding sections. Note that since the requirements in the final rule do not mandate any changes
in products, current export products would not be required to change in any way. Furthermore,
because the costs of the final rule per firm are low relative to the revenue generated
by retail food establishments, the final rules would not significantly affect employment,
economic growth or national productivity.
VIII. Small Business Regulatory Enforcement Fairness Act
The Small Business Regulatory Enforcement Fairness Act of 1996 (Public Law 104-121)
defines a major rule for the purpose of congressional review as having caused or being likely to
cause one or more of the following: An annual effect on the economy of $100 million or more; a
major increase in costs or prices; significant adverse effects on competition, employment,

162
productivity, or innovation; or significant adverse effects on the ability of United States-based
enterprises to compete with foreign-based enterprises in domestic or export markets. In
accordance with the Small Business Regulatory Enforcement Fairness Act, the Office of
Management and Budget (OMB) has determined that this proposed rule is a major rule for the
purpose of congressional review.
IX. Paperwork Reduction Act of 1995
The final rule contains information collection provisions that are subject to review by
OMB under the Paperwork Reduction Act (PRA) of 1995 (44 U.S.C. 3501–3520). A description
of these provisions is given in the following paragraphs with an estimate of the annual
recordkeeping and reporting burdens. Included in the burden estimate is the time for reviewing
instructions, searching existing data sources, gathering and maintaining the data needed, and
completing and reviewing each collection of information.
Title: Current Good Manufacturing Practice, Hazard Analysis, And Risk-Based Preventive
Controls For Human Food
A. Recordkeeping Requirements
Description: The Food and Drug Administration (FDA) is amending its regulation for Current
Good Manufacturing Practice in Manufacturing, Packing, Or Holding Human Food (CGMPs) to
modernize it and to add requirements for domestic and foreign facilities that are required to
register under section 415 of the Federal Food, Drug, and Cosmetic Act (the FD&C Act) to
establish and implement hazard analysis and risk-based preventive controls for human food.
163
FDA is taking this action as part of its announced initiative to revisit the CGMPs since they were
last revised in 1986 and to implement new statutory provisions in section 418 of the FD&C Act.
Description of Respondents: Section 418 of the FD&C Act is applicable to the owner, operator or
agent in charge of a food facility required to register under section 415 of the FD&C Act.
Generally, a facility is required to register if it manufactures, processes, packs, or holds food for
consumption in the United States. There are 83,819 such facilities; 37,134 of these facilities are
considered “qualified” facilities and have reduced requirements in regard to this rule-making and
46,685 facilities that are subject to subpart C of the Hazard Analysis and Risk-Based Preventive
Controls and have more extensive requirements.
In the following paragraphs, we describe and respond to the comments that we received
for the PRA for both our 2013 proposed human preventive controls rule and our 2014
supplemental human preventive controls notice. We numbered each comment to help distinguish
between different comments. The number assigned to each comment is purely for organizational
purposes and does not signify the comment’s value, importance, or the order in which it was
received.
Comment29) Comments stated that we overestimated the recordkeeping burden because
we assume the burden is evenly distributed across all facilities beginning in the first year.
However, facilities that are not small or very small have one year from the effective date of the
rule to come into compliance. For small facilities, compliance is delayed for 2 years and very
small facilities will have 3 years. The agency’s 7 year horizon for discounting burdens would
need to be staggered to account for the delayed compliance dates in order to arrive at a consistent
annualized burden of the records collection.

164
Response 29) We clarify that our estimate for the recordkeeping burden for the first year
is for the first full year that all facilities are responsible for the requirements for the rule. We note
that the FRIA now uses a 10 year horizon for discounting burdens.
Comment 30) Comments support our estimate that many facilities already keep the
records required by section 418 of the FD&C Act and the proposed human preventive controls
rule as good business practice. Comments believe that preventive food safety systems are the
norm for the food industry. Comments believe this is demonstrated by what they cite as 57
percent of the industry already operating under HACCP programs. Not accounting for the effects
of widespread adoption of HACCP may result in an overestimate. The reason a majority of food
facilities have already implemented HACCP or a HACCP‐like systems is that preventive systems
are the best, most cost‐effective means of insuring against recall costs and potential criminal
liability for releasing adulterated product into commerce. If the industry standard is prevention,
then the baseline for calculating PRA burdens should be adjusted to account for that.
Response30) We concur that we do not account for those facilities that are in the process
of adopting our requirements independently. We do address the impact of a likely trend toward
adopting our requirements in the uncertainty analysis of our FRIA.
Comment31) Comments assert that knowledge transferred from facilities already
applying HACCP will be available to small and very small facilities during the delayed
implementation period. Delayed implementation periods usually contemplate smaller businesses
will benefit from increased availability of advanced technology and knowledge that can lower
the costs of compliance. Related, comments suggest that the PRA does not appear to have
considered that during the three‐year implementation period standardized templates and software
for hazard analyses and food safety plans may become available for food facilities. The
165
availability of templates and software would reduce the time needed for small and very small
facilities to prepare mandatory documents.
Response31) We concur that delayed implementation periods will benefit smaller
businesses from the increased availability of advanced technology and knowledge that can lower
the costs of compliance. We allowed the staggered compliance period for this very reason. We
revised our estimate of the costs to learn about the requirements of rule in the main analysis. In
our revised analysis, we estimate that facilities with fewer than 20 employees will devote 5 hours
to learning about their requirements, rather than 10 hours. For facilities with 20 to 99 employees,
one individual at the level of an operations manager will take about 10 hours to review and
assess the requirements or to learn about the requirements for their facility rather than 15 hours.
Comment 32) Comments suggest that the PRA review does not account for reduced
training costs for small and very small facilities derived from the availability for hire of trained
employees. The average turnover rate in manufacturing in 2010 was 15 percent, suggesting some
small businesses will be able to hire qualified individuals rather than training current employees.
Response 32) We agree that some new employees will already be trained but we believe
we accounted for those that are already trained by only including burden hours for employees at
facilities that disclosed to our survey that they did not conduct training. In addition, we
estimated a turnover rate of 10 percent which indicates that fewer new employees would require
training than proposed by the comments, indicating that we did not overestimate the burden
hours.
Comment 33) Comments assert that we underestimated the recordkeeping burden of the
proposed information collection, that our methodology and assumptions are wrong or that it is
not possible to adequately assess the accuracy of our recordkeeping burden estimates. Comments

166
further dispute our assessment that creation of a single food safety plan will require 110 hours
and that one plan will be required per facility. In the experience of the comments’ member
organization, it takes considerably longer, with a median of over 200 hours per facility.
Additionally, many plants currently have more than one HACCP plan in place. Large plants have
multiple products, raw materials, processes, and equipment. Comments report that one large
plant has 34 plans in place that took approximately 860 hours to develop and another large plant
has 25 plans in place that took approximately 1385 hours to develop.
Response33) We concur that establishments might have more than one HACCP plan in
place and we acknowledge that large establishments might require considerably more than 110
hours to develop a food safety plan. Our estimate is based on the average time to create a food
safety plan for establishments of all sizes, so our estimate includes very small facilities that are
likely to require considerably less than 110 hours, too.
Comment 34) Comments assert that it is not clear if our assessment includes the
considerable pre-work time that is required as an input to development of a HACCP plan. Pre-
work includes activities such as employee training, assembling the food safety plan team (which
may require outside experts, and specific company experts like microbiologists, procurement,
research and development, etc.), creating the processing and product profile, and creating a flow
diagram. Some estimated that approximately 150-300 hours of pre-work are needed per facility
before the actual HACCP plan is prepared.
Response34) Our analysis for the PRA includes pre-work time to the extent that pre-work
time includes preparing the documents that are required in accordance with the rule. The
preparation of records for the validation of process controls might be considered pre-work and
167
would be considered in our estimate. We disagree that all of the pre-work mentioned by the
comments should be included in our estimate of the burden hours.
Comment35) Comments believe that a robust food safety plan should be developed by a
multidisciplinary group of professionals with a broad skill set. These comments believe that it is
unclear what wage rate we used in our estimate of the operating and maintenance costs
associated with implementing and maintaining a food safety plan or if those estimates consider
the range of wages applicable to the broad team involved in plan development.
Response35) We concur that a multidisciplinary group of professionals is likely to be
involved in the plan development. Our estimate is based on an average wage rate for the type of
professional that would be likely to develop the specific document. We included our estimate for
the average wage rate that we used for each type of document in our description.
Comment36) Comments suggest that our estimate that facilities will keep records of 730
monitoring activities and that each record can be made in about three minutes (36.5 hours total
per year per facility), severely underestimates both the number of activities and the time
required.
Response36) Comments did not provide supporting evidence. In the absence of a better
substantiated estimate, we decline to revise our estimate.
Comment37) Comments assert that we severely underestimated the number of
monitoring records. Comments claim that several of their members reported over 50,000
monitoring events in their facilities annually. They provided as an example that if one
production line has two metal detectors and one barcode scanner, there would be three records
per shift, with three shifts per day. Assuming 300 days of operation per year, this one line would
have 2700 records per year. Most plants have multiple lines and conduct monitoring beyond
168
metal detectors and bar code scanners. A large plant may have well over 730 monitoring events
per day – not per year as FDA estimates.
Response 37) We concur that a large establishment might have significantly more
monitoring events. Our analysis is based on the average of all establishments, including very
small establishments that are unlikely to have many events. In the absence of substantiated
evidence for the large average number of monitoring events, we decline to revise our estimate.
Comment38) Comments stated that it is unclear what activities are included in our time
estimate. Comments claim that the amount of time required to produce a record will vary
depending on whether the estimate only includes documenting time to create the record or
whether it also includes the underlying task of monitoring and follow-up tasks like filing.
Furthermore, the number of monitoring events could be significantly higher than the estimate if
all preventive controls are subject to similar monitoring requirements as critical control points.
Thus, although some tasks may take only three minutes to monitor, our members suggest that six
minutes per monitoring event may be a more accurate estimate of the information collection
burden.
Response38) We concur with the comments that time will vary by what’s included in the
task. The PRA requires that we include in our burden estimate the time for reviewing
instructions, searching existing data sources, gathering and maintaining the data needed, and
completing and reviewing each collection of information. We believe our estimate of 3 minutes,
as an average over time, accurately reflects the entire requirement for recordkeeping, including
the initial time to create, maintain and file the records. Many, if not most, records can be
created, maintained and filed in batch to reduce time, especially when done electronically, so we
decline to revise our estimate of 3 minutes, in the absence of more evidence.
169
Comment39) Comments claim that our estimated burden for corrective action records
assumes that 18,291 facilities subject to preventive controls will have two corrective actions to
document, which will take one hour each to record. Our assessment does not explain the basis
for estimating that only 18,291 facilities will engage in corrective actions. Because occasional
deviations from expected values are an unavoidable part of any manufacturing environment, it
should be expected that all facilities subject to preventive controls regulations will have
corrective actions to document annually. Comments claim that our time estimate also appears to
be low. Comments report that their member’s facilities typically engage in between 10 and 60
corrective actions per year for critical control point deviations, which is considerably higher than
our proposed estimate of two actions per year. Although it may take only one hour to manage the
record involved with the corrective action, additional time that would be required to investigate
the underlying issue and implement the corrective action. The comments state that it can take
between two and four hours to investigate a single corrective action and come up with a solution.
Response39) We revised our estimate for the number of establishments that would be
subject to the requirements to 16,285 based on the most recent number of facilities registered
with FDA that are subject to subparts C and G. We address elsewhere our reason for not
requiring all facilities to be subject to subparts C and G. We recognize that some facilities will
conduct more than our estimate of two corrective actions per year. Our estimate is based on
actions that must be made to correct a problem that has occurred with the implementation of a
preventive control; or that might affect the safety of the food. Many corrective actions might
occur to address product quality problems, unrelated to food safety. Further, our estimate for the
PRA is necessarily only related to the recordkeeping burden, and should not include the

170
additional time that would be required to investigate the underlying issue and implement the
corrective action.
Comment40) Comments noted that our estimate for keeping verification records assumes
facilities will keep records of 244 verification events and that each record can be made in about
three minutes (12.2 hours total per year per facility). Comments claim that our assessment does
not explain whether this estimate considers the broad scope of activities included in the
definition of “verification” in the proposed rule (proposed § 117.150), although it should. The
proposed regulatory definition of verification not only includes verification of monitoring,
corrective actions, and implementation and effectiveness (e.g., calibration), but also includes
validation and reanalysis. Validation and reanalysis of a food safety plan are extensive activities
that take tens, if not hundreds, of hours to conduct. The estimate does not appear to account for
these activities. The comments notes that even when considering just the traditional activities
considered as verification under HACCP, their members’ experience shows that our current
verification estimate is too low. They received a wide range of estimates of the number of
verification events conducted annually—from about 200 to over 14,000 events per year.
Similarly, their members report that it takes them between 8 minutes and 2 hours per verification
event. It is unclear whether our estimate includes only the time to handle the record or also the
time to conduct the verification. The comments suggest this missing information in our estimate
may explain the range of responses in our survey. Comments claim that the time to conduct the
verification should be included.
Response 40) We concur that our estimates should assess the full scope of activities
associated with recordkeeping. Our analysis did neglect to include the recordkeeping activities
for the validation of process controls, which are an essential part of verification. We added our
171
estimate for the burden of validation and we revised our description about the recordkeeping
burden for the food safety plan to state that our estimate does include the burden of reanalysis of
the food safety plan. For the purposes of the PRA, our estimate of the burden of recordkeeping is
only for the time of recordkeeping, not the full verification activity. We decline to revise our
estimate based on the comment because insufficient evidence was presented about just the time
for recordkeeping.
Comment41) Comments noted that we estimate that 47,484 food manufacturers will need
to document the training of their preventive controls qualified individual, which will take 15
minutes per facility. (We note that the proposed rule defined and used the term “qualified
individual, but the term in the final rule is “preventive controls qualified individual” in the
describing these comments on this topic.) They are unclear why we estimate that only 47,484
food manufacturers and not all registered facilities subject to preventive controls would be
required to have a preventive controls qualified individual and to document that person’s
training. Comments state that their members found that we are accurate in our assumption that it
will take 15 minutes per facility, although they believe that our estimate for the documentation
may take 30 minutes in some situations. Comments also suggest that many facilities may need to
document more than one preventive controls qualified individual. Comments provide as an
example, that a thermal process authority outside of the plant may be a qualified individual in
terms of confirming the process has a validated kill step, while the same facility will likely have
a qualified individual responsible for approving the food safety plan. This situation would
increase the time burden beyond estimate.
Response41) Our estimate of 47,484 establishments that will need to document the
training of their preventive controls qualified individual/qualified individual was based on our
172
estimate of the number of facilities that are subject to subparts C and G of the rule. We updated
our estimate to 46,685 based on our most recent count of facilities registered with FDA. Our
estimate is based on the requirement that only one preventive controls qualified individual is
necessary to perform the requirements of the provisions that require a preventive controls
qualified individual. Moreover, some preventive controls qualified individuals may be qualified
by experience and there would not be a need for documentation of training.
Comment42) Comments note that our estimate for submitting a new domestic food
facility profile will take 15 minutes. Comments believe that we grossly underestimate the amount
of time retailers will need to respond to the form. Comments believe that the typical distribution
center carries 26 of the 27 product categories listed in the Draft Form. Providing detail on the
potential hazards and preventive controls implemented for each product will take retailers a total
of 20-30 or more hours per facility. Most chain retailers have multiple facilities. A national
retailer will easily have a dozen or more distribution centers. The largest food retailers will have
several dozen. It is conceivable that hundreds of hazard and preventive control entries will be
required to be made for each distribution center to respond to the Draft Form if such facilities are
required to input information on hazards they do not control. The typical distribution center
carries more than 13,000 different SKUs of FDA-regulated foods. Completing the form itself
will require several hours due to all of the entries. Compiling the information for each facility
will take 20-30 hours. Under the Paperwork Reduction Act, comments believes that we are
required to consider not only the time it takes to complete the form, but also the time it takes to
compile the information. Comments believe that we must revise our estimate of the burden
imposed by the information collection request (ICR).
173
Response42) We requested comment on whether to require submission to FDA of a
subset of the information that would be in a food safety plan. After considering comments, we
decided that we will not establish a requirement for submission of a facility profile. To the
extent that this comment is addressing the form used for registering a food facility with FDA,
such a comment is outside the scope of this rule-making. Moreover, an establishment that meets
the definition of a retail food establishment is not a facility required to register.
Comment43) Comments believe that our ICR contains redundant collections. Comments
believe that our existing Food Facility Registration Module requests information on facility type
and products handled, while our ICR seeks the same information. Commenters believe that we
should minimize redundancies to the greatest extent possible and use the information that we
already have. As such, we should not be requesting information on facility type, products
handled and, if it decides to as we recommend, types of storage, through this ICR. All of these
data points are already collected by the existing Food Facility Registration Module.
Response43) The ICR associated with this rule-making is not redundant. The ICR
associated with food facility registration with FDA is a separate rule-making and a separate
burden. This PRA contains the ICR for completing all the requirements for a food facility to
develop a hazard analysis and preventive controls; not register their facility.
Comment 44) Comments suggest that our estimated time and costs to comply with the
requirement to label products from certain qualified facilities do not come under the PRA
because the address requirement is a disclosure, and not an information collection.
Response44)
We concur that the requirement to add a qualified facility address to the product label is a
third-party disclosure burden, and because it is a disclosure burden, is subject to the PRA. We
174
revised our estimate for the hour burden for each of these disclosures to be 15 minutes as shown
in Table 69 of the PRA, to reflect that this will not be a coordinated label change for most
qualified facilities so most will not be updating their labels anyway.
B. Information Collection Burden Estimate
FDA estimates the burden for this information collection as follows:
1. Recordkeeping Burden
We estimate that about 46,685 facilities subject to subparts C and G Hazard Analysis and
Risk-Based Preventive Controls will need to create a food safety plan (§ 117.175(a)(1)) which is
a compilation of many written food safety procedures. We total the hour burdens as presented
throughout the FRIA to then create an average hour burden for each facility to create or complete
a food safety plan. We estimate that creation of the food safety plan will require 110 hours. The
total hour burden on an annual basis is 46,685 facilities x 110 hours = 5,135,350 hours. There
are no capital costs or operating and maintenance costs associated with this collection of
information.
We estimate the burden for disclosing to a customer, in documents to accompany foods
that require further processing, that the food has not been processed to address a specified hazard
(§ 117.136) is 15 minutes per record. We estimate that 16,285 establishments will each make
one of these disclosures for a total recordkeeping burden of 4,071 hours.
The burden for keeping monitoring records (§ 117.175(a)(2)) follows the same pattern as
that for the food safety plan. We estimate that there are 8,143 facilities subject to subparts C and
G Hazard Analysis and Risk-Based Preventive Controls that will need to keep additional records
175
of the monitoring that they do of different activities within their food facilities. Based on
estimates of monitoring created, when appropriate, throughout the FRIA, we estimate that each
of the 8,143 facilities will keep records of 730 monitoring activities and that each record can be
made in about 3 minutes (0.05 hours) for a total hour burden of 297,220.
For the burden for corrective action records (§ 117.175(a)(3) we estimate that twice per
year 16,285 facilities subject to subparts C and G Hazard Analysis and Risk-Based Preventive
Controls will have corrective actions to document. The documentation of those corrective
actions is expected to take one hour for each record for a total hour burden of 32,570.
We estimate that there are 8,143 facilities subject to subparts C and G Hazard Analysis
and Risk-Based Preventive Controls that will need to keep additional records of verification
activities. Based on estimates of verification records created, when appropriate, throughout the
FRIA, we estimate that 8,143 facilities will keep records of 244 verification activities and that
each record can be made in about 3 minutes (0.05 hours) for a total hour burden of 101,675.
The burden for keeping validation records (§ 117.160) follows the same pattern as that
for verification records. We estimate that there are 3,677 facilities subject to subparts C and G
Hazard Analysis and Risk-Based Preventive Controls that will need to keep additional records of
the validation of their process control activities within their food facilities. Based on estimates of
the establishments that will require validation, when appropriate, throughout the FRIA, we
estimate that each of the 3,677 facilities will keep records of six validation activities for a total
of 22,062 records. We estimate that each record can be made in about 15 minutes (0.25 hours)
for a total hour burden of 5,515.
The burden for keeping supplier records is for the use of approved suppliers and for
establishments subject to subpart C and G to document their audits § 117.475(c)(7), the sampling

176
and testing of their ingredients § 117.475(c)(8), and the review of their supplier’s relevant food
safety records § 117.475(c)(9) among up to 18 possible supplier related records, Our estimate
follows the same pattern as that for other records. We estimate that there are 16,285 facilities
subject to subparts C and G Hazard Analysis and Risk-Based Preventive Controls that will need
to keep as many as 18 additional records for an average of 10 records of their approved suppliers
and review records. , We estimate that each of the 16,285 establishments will maintain these
records and that the total time for this recordkeeping will be about 4 hours for a total hour burden
of 651,400.
We estimate that 46,685 establishments subject to subparts C and G Hazard Analysis and
Risk-Based Preventive Controls will need to document the training of their qualified individuals
and preventive controls qualified individuals and qualified individuals (§ 117.180(d)). We
estimate that this will require 15 minutes (0.25 hours) per facility total for a total hour burden of
11,671.
Under § 117.206(a)(5) facilities are required to keep records documenting (1) the
monitoring of temperature controls for refrigerated packaged food, (2) the corrective actions
taken when there is a problem with the control of temperature for refrigerated packaged food,
and (3) the verification activities relating to the temperature control of refrigerated packaged
food. We believe that the keeping of such records is already common industry practice and will
not constitute an additional paperwork burden.
Table 67 shows the estimated annual recordkeeping burden associated with this rule.
There are no capital costs or operating and maintenance costs associated with this collection of
information.

177
Table 67.--Estimated Annual Recordkeeping Burden
21 CFR Part 1, Subpart 117
No. Of Recordkeepers
No. of Records per Recordkeeper
Total Annual Records
Average Burden per Recordkeeping (in hours)
Total Hours
117.126 (c) and 117.170(d) food safety plan and reanalysis
46,685
1
46,685
110
5,135,350
117.136 assurance records
16,285 1 16,285 .25 4,070
117.145 (c) monitoring records
8,143
730
5,944,390
0.05
297,220
117.150 (d) corrective actions and corrections records
16,285
2
32,570
1
32,570
117.155(b) verification records
8,143
244
1,986,892
0.05
101,675
117.160 validation records
3,677 6 22,062 .25 5,515
117.475(c)(7), 117.475(c)(8), and 117.475(c)(9) among up to 18 supplier records
16,285 10 162,850 4 651,400
117.180(d) Records that document applicable training for the qualified individual.
46,685
1
46,685
.25
11,671
Total annual burden hours
6,239,471
1There are no capital costs or operating and maintenance costs associated with this collection of information
2. Reporting Burden
Table 68 shows the estimated annual reporting burden associated with this rule.
Qualified facilities must report their status as such a facility every 2 years; status will
likely be reported electronically through a web portal maintained by FDA. This requirement will
cause the 37,134 qualified facilities to spend 0.5 hour every 2 years reporting to FDA their status
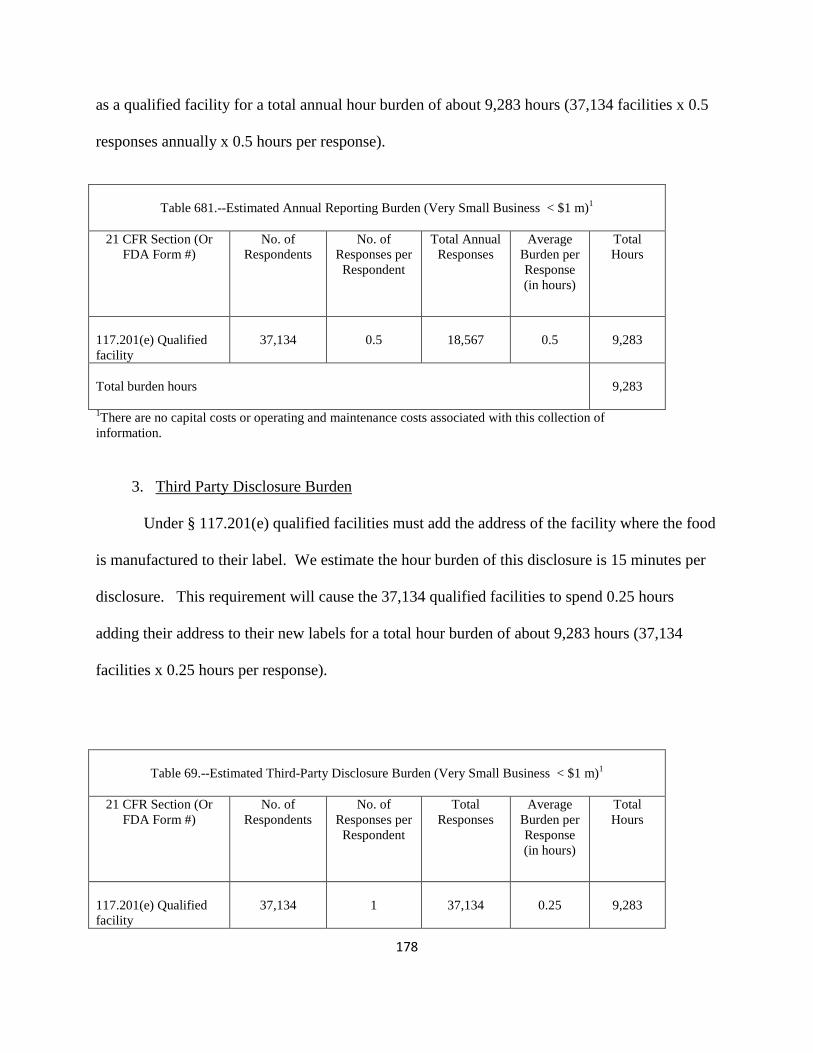
178
as a qualified facility for a total annual hour burden of about 9,283 hours (37,134 facilities x 0.5
responses annually x 0.5 hours per response).
Table 681.--Estimated Annual Reporting Burden (Very Small Business < $1 m)1
21 CFR Section (Or
FDA Form #) No. of
Respondents No. of
Responses per Respondent
Total Annual Responses
Average Burden per Response (in hours)
Total Hours
117.201(e) Qualified facility
37,134
0.5 18,567 0.5
9,283
Total burden hours
9,283
1There are no capital costs or operating and maintenance costs associated with this collection of information.
3. Third Party Disclosure Burden
Under § 117.201(e) qualified facilities must add the address of the facility where the food
is manufactured to their label. We estimate the hour burden of this disclosure is 15 minutes per
disclosure. This requirement will cause the 37,134 qualified facilities to spend 0.25 hours
adding their address to their new labels for a total hour burden of about 9,283 hours (37,134
facilities x 0.25 hours per response).
Table 69.--Estimated Third-Party Disclosure Burden (Very Small Business < $1 m)1
21 CFR Section (Or
FDA Form #) No. of
Respondents No. of
Responses per Respondent
Total Responses
Average Burden per Response (in hours)
Total Hours
117.201(e) Qualified facility
37,134
1 37,134 0.25
9,283

179
Total burden hours
9,283
1There are no capital costs or operating and maintenance costs associated with this collection of information.
References
1. FDA Supplemental Regulatory Impact Analysis for FSMA Supplemental Notice of Proposed Rulemaking for Current Good Manufacturing Practice and Hazard Analysis and Risk-Based Preventive Controls for Human Food, Docket No. FDA-2011-N-0920.
2. GUIDELINES FOR REGULATORY IMPACT ANALYSIS, U.S. Department of Health and Human Services, draft September 2014.
3. FDA Initial Regulatory Impact Analysis for FSMA Notice of Proposed Rulemaking for Current Good Manufacturing Practice and Hazard Analysis and Risk-Based Preventive Controls for Human Food, Docket No. FDA-2011-N-0920.
4. Memo to File, Expert elicitation exercise to assist with the characterization of likely reduction of contamination expected by implementation of the Final Rule- Preventive Controls for Human Food (PCHF), prepared by Angie Lasher, March 30, 2015
5. Estimated Changes in Contamination Rates Due to the FSMA Preventive Controls Rule (Contract HHSF-223-2011-10005B, Task Order 20), April 2015 , RTI International.
6. Memorandum of an analysis of the USDA meat and poultry PR/HACCP regulation and its effect on foodborne illness, prepared by Brandon Restrepo and Ehren Schuttringer, May 1, 2015.
7. Memorandum to File, FDA Summary of Methods to Quantify Health Benefits for Preventive Controls Human Food Final Rule, June 2015.
8. Minor, et al (2015) “The Per Case and Total Costs of Foodborne Illness in the United States”, Journal of Risk Analysis, online version ahead of print version. 2015 Jan 2. doi: 10.1111/risa.12316.
9. Food Processing Sector Study Final Report (Contract HHSF-223-2011-10005B, Task Order 20), August 2015 , RTI International.
10. ERG Draft Memorandum for FDA under Contract No. 223-01-2461, task order 7, April 19, 2010.
180
11. FDA FSMA and Small Business, http://www.fda.gov/Food/GuidanceRegulation/FSMA/ucm268229.htm accessed April 17, 2015.
12. FDA Internal Foodborne Outbreak Database. Related website: http://www.fda.gov/Food/RecallsOutbreaksEmergencies/Outbreaks/default.htm accessed April 17, 2015.
13. CDC NORS Foodborne Outbreak Online Database http://wwwn.cdc.gov/foodborneoutbreaks/ accessed April 2015.
14. Scallan E, Hoekstra RM, Angulo FJ, Tauxe RV, Widdowson M-A, Roy SL, et al. (2011) “Foodborne illness acquired in the United States—major pathogens” Emerg Infect Dis, Vol. 17, No. 1.
15. D&B 2014; Dun & Bradstreet Global Business Database 2014; purchased by FDA.
16. Ross, Marianne Phelan, et al (2008) “Analysis of food-allergic and anaphylactic events in the National Electronic Injury Surveillance System”, J Allergy Clin Immunol, Vol. 121, No. 1, 166-171.
17. Patel, Dipen A, et al (2011) “Estimating the economic burden of food-induced allergic reactions and anaphylaxis in the United States”, J Allergy Clin Immunol, Vol. 128, No. 1, pgs 110-115.
18. Altschul, Aimee S. et al (2001) “Manufacturing and labeling issues for commercial products: Relevance to food allergy”, J Allergy Clin Immunol, Vol. 108, Issue 3, p. 468.
19. Bureau of Labor Statistics, Occupational Employment Statistics, May 2013 National Industry-Specific Occupational Employment and Wage Estimates http://www.bls.gov/oes/2013/may/oessrci.htm#31-33 , accessed April 17, 2015.
20. 2010 Nationwide Survey of Food Industry Safety Practices, Draft final report, January 10, 2011. ERG for FDA under Contract No. 223-01-2461, task order 7.
21. FDA’s Food Facility Registration Module database (FFRM), internal FDA database accessed 2014.
22. Eastern Research Group (2009) Foreign Food GMPs—Expert Elicitation Results, Memorandum, September 3, 2009.
23. Eastern Research Group (2010) Economic Analysis of new FDA Food cGMP Regulations and Related Legislative Initiatives—Subtask 2: Expert Opinions on Current Food Manufacturing Practices—FINAL, Memorandum, June 30, 2010.

181
24. Eastern Research Group (2010) Economic Analysis of new FDA Food cGMP Regulations and Related Legislative Initiatives—Subtask 3: Expert Opinions on Current Food Manufacturing Practices of Distributors/Consolidators/Wholesalers and Packers of Produce and Processed Foods, Memorandum, September 17, 2010.
25. Eastern Research Group (2007) “Evaluation of Recordkeeping Benefits for Food Manufacturers” Final report, March 30, 2007. Contract No. 223-01-2461, Task Order No. 4.
26. Eastern Research Group (2007) “Evaluation of Recordkeeping Costs for Food Manufacturers” Final report, February 13, 2007. Contract No. 223-01-2461, Task Order No. 5.
27. Supporting Statement A, SURVEY OF CURRENT MANUFACTURING PRACTICES IN THE FOOD INDUSTRY, http://www.reginfo.gov/public/do/PRAViewDocument?ref_nbr=200709-0910-008
28. Supporting Statement B, SURVEY OF CURRENT MANUFACTURING PRACTICES IN THE FOOD INDUSTRY, http://www.reginfo.gov/public/do/PRAViewDocument?ref_nbr=200709-0910-008
29. Food Manufacturing magazine Market Update for April 2008, http://www.foodmanufacturing.com/scripts/News-Regulatory-Issues.asp accessed December 22, 2011.
30. FDA Memorandum, "Food GMP Modernization Working Group: Summary of Food Recalls, 1999-2003," 2004.
31. Summary of Food Recalls, 2008-2009, May 3, 2010, FDA
32. Annual Survey of Manufacturers (2009) U.S. Census Bureau
33. Inventory Management Review, September 15, 2005 http://www.inventorymanagementreview.org/2005/09/inventory_holdi.html accessed December 14, 2011.