Parametric design with Visual Programming in Dynamo with...
84
INOM EXAMENSARBETE SAMHÄLLSBYGGNAD, AVANCERAD NIVÅ, 30 HP , STOCKHOLM SVERIGE 2019 Parametric design with Visual Programming in Dynamo with Revit The conversion from CAD models to BIM and the design of analytical applications DARWN NEZAMALDIN KTH SKOLAN FÖR ARKITEKTUR OCH SAMHÄLLSBYGGNAD
Transcript of Parametric design with Visual Programming in Dynamo with...
INOM EXAMENSARBETE SAMHÄLLSBYGGNAD,AVANCERAD NIVÅ, 30 HP
, STOCKHOLM SVERIGE 2019
Parametric design with Visual Programming in Dynamo with Revit
The conversion from CAD models to BIM and the design of analytical applications
DARWN NEZAMALDIN
KTHSKOLAN FÖR ARKITEKTUR OCH SAMHÄLLSBYGGNAD

www.kth.se

Parametric design with Visual
programming in Dynamo with Revit
The conversion from CAD models to BIM and the design
of analytical applications
Nr 467
Darwn Nezamaldin
2019 January
Master Thesis
Supervisor
Kjartan Gudmundsson, KTH Byggvetenskap

i
Preface
This thesis aims to introduce civil engineering students and construction companies to the possibilities of using visual programming with Building Information Models and to illustrate those possibilities with examples in Dynamo with Revit. Hopefully this thesis will be helpful to everyone that needs to know more about parametric design and the possibilities of developing own applications for BIM models. This report can be read either in order or piece by piece depending on the knowledge of the reader.
Hopefully engineers can read through this thesis and acquire basic knowledge about Dynamo and to repeat what I have accomplished. With enough knowledge about Dynamo, engineers can create their own scrips for other beneficial tasks.
I would like to thank my supervisor Kjartan Gudmundsson for introducing the idea of Dynamo and parametric design to me and helped me along the way to complete this research. I would also like to thank my family and friends for supporting me throughout my research. And I would like to thank the Dynamo community that includes people with vast knowledge about the software that has helped me along my journey. Lastly, I would like to thank KTH for providing me with enough knowledge to complete this type of research.
ii
Abstract
Nowadays, there is a big strive to achieve faster and more accurate results of designing buildings in construction companies. Construction companies that work with the design part are continuously searching for methods to increase efficiency in the working process. Autodesk have introduced a software that uses parametric design to provide input to Revit models and to retrieve and manipulate the outcomes of Revit models. The Dynamo software uses visual programming and is connected directly to Revit where the user can gain access to Revit’s data structure where parameters can be controlled and manipulated.
This research consists of two parts. The first part shows how 2D Autocad drawing can be converted into 3D Revit models. This is done by using the 2D geometry as reference lines for placing BIM objects. The second part shows how the BIM model can then be used to analyze different elements with Dynamo. The calculations of element cost, weight and thermal transmission losses of floors, walls and roofs are used to illustrate this possibility.
All the main goals were achieved and are presented in the report for engineers to utilize. The report illustrates the basics of Dynamo, shows examples of how to it can be used while sharing the scripts that were used for this research. The report also encourages other competent students to continue where this thesis ended. Even though several tasks were achieved in this thesis, there are still much more to learn about parametric design and visual programming.
iii
Content
1 Introduction ................................................................................................................................... 2
1.1 Background ................................................................................................................................. 2
1.2 Purpose ........................................................................................................................................ 2
1.3 Goal .............................................................................................................................................. 2
1.4 Limitations ................................................................................................................................... 3
2 Theory ........................................................................................................................................... 4
2.1 BIM ............................................................................................................................................... 4
2.1.1 Why BIM is important ................................................................................................. 5
2.2 Revit background ........................................................................................................................ 5
2.2.1 The Revit Hierarchy ..................................................................................................... 6
2.2.2 Different type of BIM softwares ................................................................................. 7
2.3 Dynamo background .................................................................................................................. 7
2.4 API ................................................................................................................................................ 8
2.5 Object-oriented programming .................................................................................................. 9
2.6 Parametric design ..................................................................................................................... 10
2.7 The basics of Dynamo software............................................................................................... 11
2.8 Why Dynamo is necessary ....................................................................................................... 14
2.8.1 Automatization and repetitions ............................................................................... 14
2.8.2 Getting access to Revit’s data structure .................................................................. 14
2.8.3 Combination with other software ............................................................................ 14
2.8.4 Being able to test different tasks quicker ................................................................ 14
3 Method ........................................................................................................................................ 15
3.1 Explanation of the scripts ......................................................................................................... 16
3.1.1 Placing elements ........................................................................................................ 16
3.1.2 Analysis of elements .................................................................................................. 17
3.2 Nodes that are used in the scripts .......................................................................................... 18
3.2.1 Code block nodes ...................................................................................................... 18
3.2.2 Placing elements ........................................................................................................ 18
3.2.3 Placing windows and doors ...................................................................................... 20
3.2.4 Analysis of elements .................................................................................................. 20
3.2.5 Change of analysis outcome ..................................................................................... 22
3.3 Dynamo player .......................................................................................................................... 23
iv
4 Results ......................................................................................................................................... 24
4.1 Placing elements ....................................................................................................................... 24
4.2 Placing windows........................................................................................................................ 27
4.3 Analysis ...................................................................................................................................... 29
4.3.1 Floor cost analysis...................................................................................................... 29
4.3.2 Wall cost analysis ....................................................................................................... 31
4.3.3 Roof cost analysis ...................................................................................................... 33
5 Discussion and conclusion ............................................................................................................ 35
5.1 Conclusion ................................................................................................................................. 35
5.2 Discussion .................................................................................................................................. 35
5.3 Further work with Dynamo ...................................................................................................... 35
6 Sources ........................................................................................................................................ 36
7 Appendix...................................................................................................................................... 37
7.1 Appendix A, Placing elements.................................................................................................. 37
7.2 Appendix B, Placing windows and doors ................................................................................ 39
7.3 Floor analysis ............................................................................................................................. 40
7.3.1 Appendix C, Floor Cost .............................................................................................. 40
7.3.2 Appendix D, Floor thermal transmission losses ...................................................... 44
7.3.3 Appendix E, Floor weight .......................................................................................... 48
7.4 Roof analysis ............................................................................................................................. 52
7.4.1 Appendix F, Roof cost ................................................................................................ 52
7.4.2 Appendix G, Roof thermal transmission losses ....................................................... 56
7.4.3 Appendix H, Roof weight .......................................................................................... 60
7.5 Wall analysis .............................................................................................................................. 63
7.5.1 Appendix I, Wall cost ................................................................................................. 63
7.5.2 Appendix J, Wall thermal transmission losses......................................................... 68
7.5.3 Appendix K, Wall weight ........................................................................................... 73

2
1 Introduction
This chapter describes the background, purpose, goals and limitations of this thesis.
1.1 Background
The change in civil engineering industry is inevitable. These days, the strive for working more efficiently and saving time is one of the vast desires in engineering. To be able to save time and yet obtain more precise results is necessary. There are several methods to optimize the desired results.
Various construction companies have tried to automatize the structural work of civil engineers over the years. Only to move from hand drawings to using computer software and BIM, the companies have developed drastically. One of the new developments of automatization is parametric design. In this work it refers to using visual programming software that is directly connected to the main software for modeling.
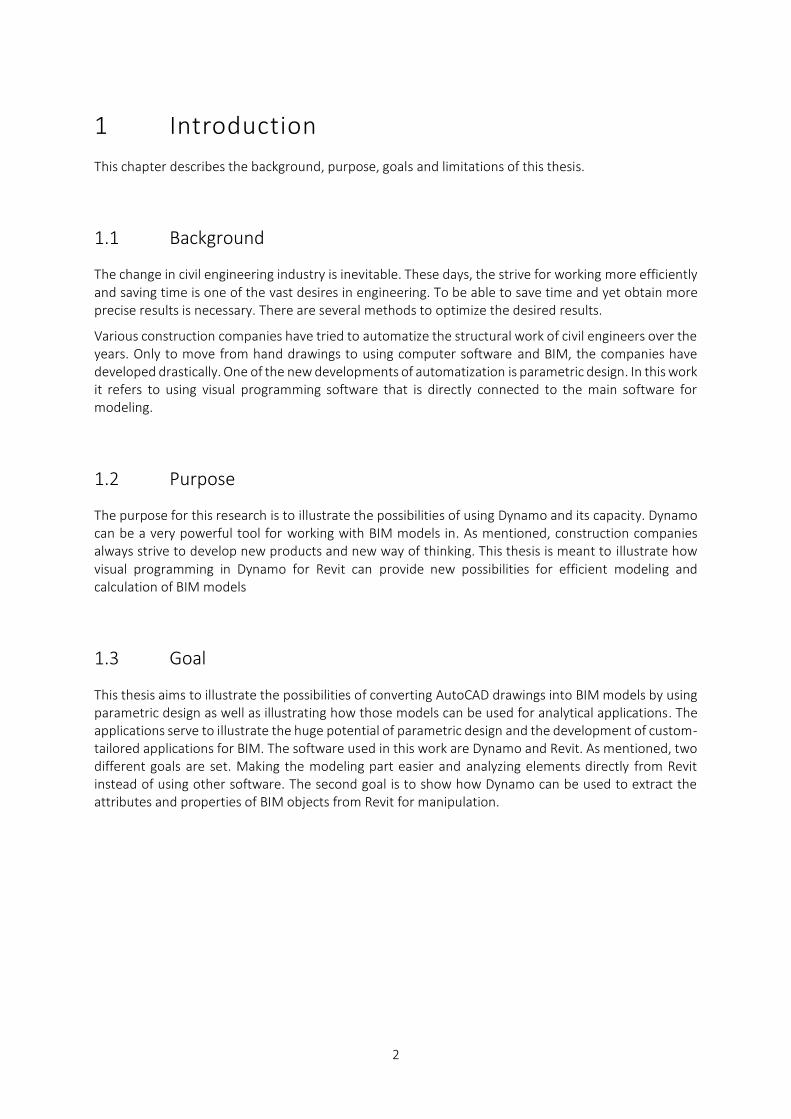
1.2 Purpose
The purpose for this research is to illustrate the possibilities of using Dynamo and its capacity. Dynamo can be a very powerful tool for working with BIM models in. As mentioned, construction companies always strive to develop new products and new way of thinking. This thesis is meant to illustrate how visual programming in Dynamo for Revit can provide new possibilities for efficient modeling and calculation of BIM models
1.3 Goal
This thesis aims to illustrate the possibilities of converting AutoCAD drawings into BIM models by using parametric design as well as illustrating how those models can be used for analytical applications. The applications serve to illustrate the huge potential of parametric design and the development of custom-tailored applications for BIM. The software used in this work are Dynamo and Revit. As mentioned, two different goals are set. Making the modeling part easier and analyzing elements directly from Revit instead of using other software. The second goal is to show how Dynamo can be used to extract the attributes and properties of BIM objects from Revit for manipulation.
3
Several construction companies use different software for each part of the building process. Different softwares are used for modeling, load path and energy calculations. However, if one can obtain the same desired results that are required with the same software, the work would be more straightforward. This research is not meant to reduce the usage of other software completely. However, to simplify Revit usage and obtaining information directly from Revit rather than from other software. Undoubtedly, other softwares have their own functions and are necessary for each part of the structure design.
The analytical applications that are developed in this thesis serve to illustrate the vast possibilities of parametric design. One can get access to Revit’s database through any programming software, however Dynamo is a custom-tailored software only for Revit.
1.4 Limitations
Working with Dynamo will be the main part of this research. Although Dynamo will be tested with different type of software, the thesis aims to limit itself to the Dynamo scripts. The scripts will be limited to the goals mentioned above. With Dynamo, many alterations can be achieved for Revit, however this thesis will involve simplification of placing elements and analysis of Revit elements.

4
2 Theory
In this chapter, the theory behind each part of this thesis is described and explained why they are of importance in this work. The software Dynamo and Revit are also described in order provide the reader with a better understanding of those two softwares.
2.1 BIM
BIM (Building information modelling) is a process that means to create and achieve digital representation of shapes and functional features of buildings. (Autodesk, 2018)
The idea of BIM has been around since 1970s. In the mid-1980s, the term “building model” was published by Simon Ruffle. Later the term “Building Information Model” was published by G.A. van Nederveen and F. P. Tolman in 1992. (Modelling multiple views on buildings, 1992)
A big leap was taken when construction companies changed from hand drawings to AutoCAD digital drawings. AutoCAD’s 2D drawings are the same as hand drawing nonetheless faster. The next step was to introduce BIM. By using different computer software like Revit, Tekla structures and several other types of software, the users can create shapes and models within the software easily. From these 3D models, 2D printed drawings can be obtained.
BIM is used by construction companies to design, plan, construct, operate and maintain different buildings and infrastructures.
The definition of BIM is described by the US National Building Information Model Standard Project Committee as following: (National BIM standard, 2018)
“Building Information Modelling (BIM) is a digital representation of physical and functional characteristics of a facility. A BIM is a shared knowledge resource for information about a facility forming a reliable basis for decisions during its life-cycle; defined as existing from earliest conception to demolition.”
BIM has the capacity to handle a large amount of information, therefore it requires a software to be exact. (Tekla, 2018)
BIM can use different files. One of the most common files is IFC (Industry Foundation Classes). IFC is an open and neutral data file format that can be opened by e.g. Revit. They are a read-only format and not meant to be edited. These files can be manipulated with Dynamo. (Lifewire, 2018)
5
There are four criteria to be fulfilled for the usage of the term BIM (BIM alliance, 2017)
• Information management takes place with one or more object-oriented models.
• Properties are linked to the objects in the models and are used.
• The objects in the models are related to each other
• Various information views can be created from the same model.
2.1.1 Why BIM is important
Buildings are more expensive to design than they should be. Building information models create facility models within a computer. The models are digital, that makes the computer-based models of building more convenient than hand drawings. To build a facility includes the entire lifecycle of the structure from conception, design, construction, functional life, remodeling and disposal. BIM can be useful in all parts of the building’s lifecycle. (National BIM standard, 2018)
2.2 Revit background
Revit is a 3D modeling software that allows the users to model different elements of a building in a way that the engineer can visualize the structure before it is placed in drawings. The user can visualize the entire building before converting different parts or plans into drawings. The contractor can later use the drawings for constructing the building.
Revit is used by architects, landscape architects, structural engineers and MEP engineers. The version of Revit is upgraded each year from Autodesk and the latest versions of Revit are compatible with Dynamo. In this work, the 2019 version of Revit is used. The Revit versions that also can be used with the latest Dynamo version are versions 2017 and 2018.
6
2.2.1 The Revit Hierarchy
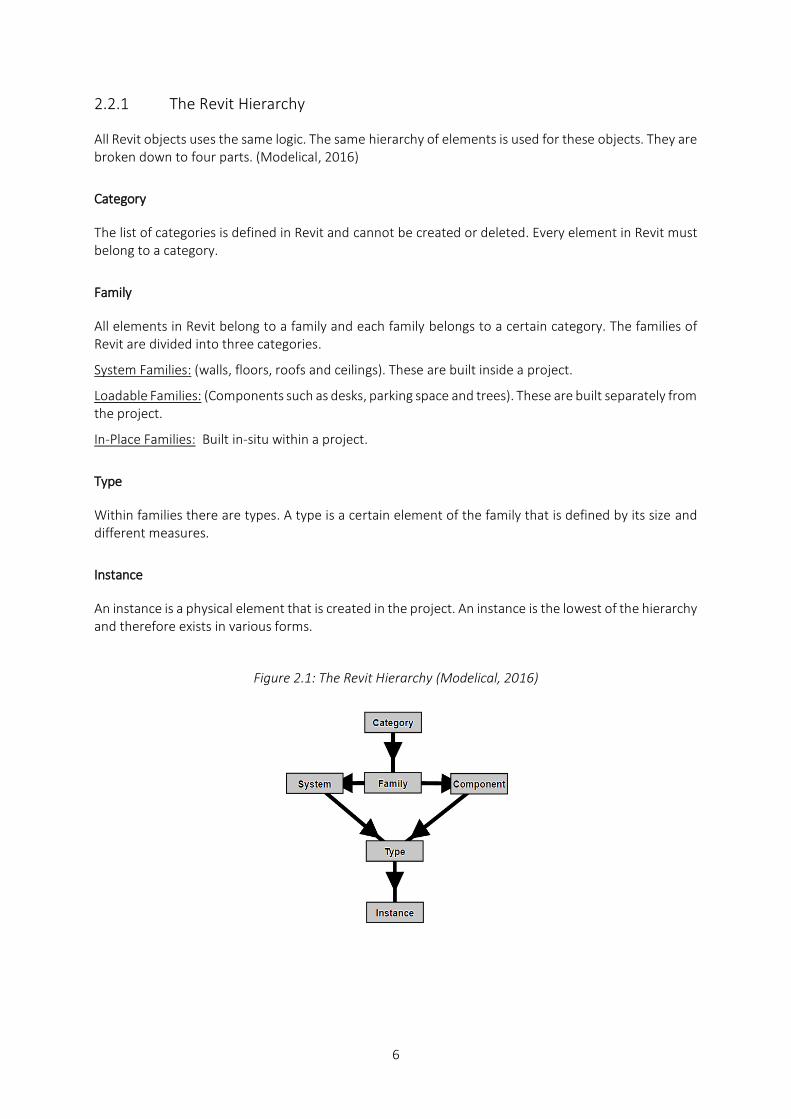
All Revit objects uses the same logic. The same hierarchy of elements is used for these objects. They are broken down to four parts. (Modelical, 2016)
Category
The list of categories is defined in Revit and cannot be created or deleted. Every element in Revit must belong to a category.
Family
All elements in Revit belong to a family and each family belongs to a certain category. The families of Revit are divided into three categories.
System Families: (walls, floors, roofs and ceilings). These are built inside a project.
Loadable Families: (Components such as desks, parking space and trees). These are built separately from the project.
In-Place Families: Built in-situ within a project.
Type
Within families there are types. A type is a certain element of the family that is defined by its size and different measures.
Instance
An instance is a physical element that is created in the project. An instance is the lowest of the hierarchy and therefore exists in various forms.
Figure 2.1: The Revit Hierarchy (Modelical, 2016)
7
2.2.2 Different type of BIM softwares
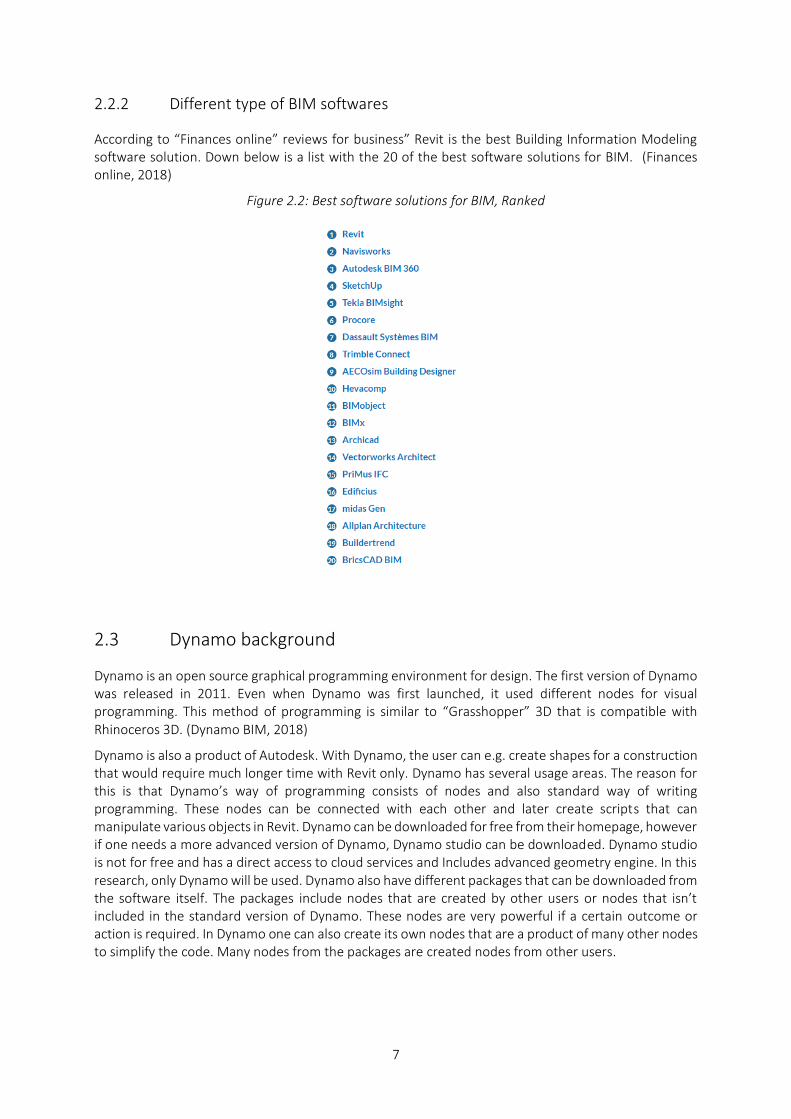
According to “Finances online” reviews for business” Revit is the best Building Information Modeling software solution. Down below is a list with the 20 of the best software solutions for BIM. (Finances online, 2018)
Figure 2.2: Best software solutions for BIM, Ranked
2.3 Dynamo background
Dynamo is an open source graphical programming environment for design. The first version of Dynamo was released in 2011. Even when Dynamo was first launched, it used different nodes for visual programming. This method of programming is similar to “Grasshopper” 3D that is compatible with Rhinoceros 3D. (Dynamo BIM, 2018)
Dynamo is also a product of Autodesk. With Dynamo, the user can e.g. create shapes for a construction that would require much longer time with Revit only. Dynamo has several usage areas. The reason for this is that Dynamo’s way of programming consists of nodes and also standard way of writing programming. These nodes can be connected with each other and later create scripts that can manipulate various objects in Revit. Dynamo can be downloaded for free from their homepage, however if one needs a more advanced version of Dynamo, Dynamo studio can be downloaded. Dynamo studio is not for free and has a direct access to cloud services and Includes advanced geometry engine. In this research, only Dynamo will be used. Dynamo also have different packages that can be downloaded from the software itself. The packages include nodes that are created by other users or nodes that isn’t included in the standard version of Dynamo. These nodes are very powerful if a certain outcome or action is required. In Dynamo one can also create its own nodes that are a product of many other nodes to simplify the code. Many nodes from the packages are created nodes from other users.
8
Dynamo is connected to Revit in a way that if the user changes something in Revit, it changes in Dynamo too and vice versa. E.g. all the elements that exist in Revit, Dynamo can read them directly and would be able to use them.
Every node has their own function and their own programming code within them. The nodes can be numbers, inputs, outputs, strings coordinates etc. and depending on if the user changes something in the nodes, the relating nodes changes too. Every node’s output can be connected to several inputs and vice versa, every input can be connected to several outputs depending on the node. Some nodes only have one input or output that can be connected with. The user can also hover over the nodes for a small explanation.
Dynamo’s own homepage has a very useful forum where Dynamo related questions can be answered by other users. Ideas can be shared with other programmers and Dynamo experts. (Dynamo forum, 2018)
2.4 API
Revit creates a database for every project when started. It is difficult for an average person to gain access to this database without using a programming tool. To be able to program using text-based scripting isn’t accessible to everyone. Using this API (application program interface) to access the Revit database is much more straightforward with Dynamo.
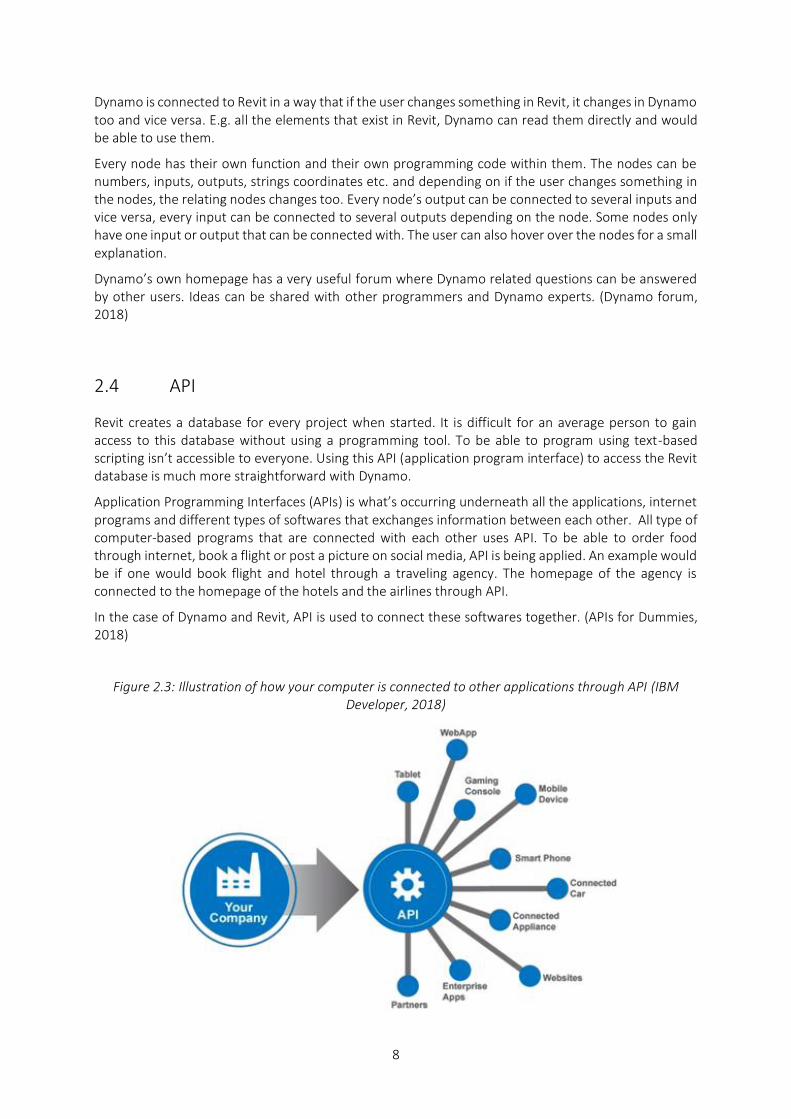
Application Programming Interfaces (APIs) is what’s occurring underneath all the applications, internet programs and different types of softwares that exchanges information between each other. All type of computer-based programs that are connected with each other uses API. To be able to order food through internet, book a flight or post a picture on social media, API is being applied. An example would be if one would book flight and hotel through a traveling agency. The homepage of the agency is connected to the homepage of the hotels and the airlines through API.
In the case of Dynamo and Revit, API is used to connect these softwares together. (APIs for Dummies, 2018)
Figure 2.3: Illustration of how your computer is connected to other applications through API (IBM Developer, 2018)
9
2.5 Object-oriented programming
Object oriented programming is used in Revit. Revit uses different objects with different attributes. There are four principles of object-oriented programming. These are encapsulation, abstraction, inheritance, and polymorphism. (freeCodeCamp, 2018)
Dynamo gets access to Revits elements and manipulates the parameters. These parameters belong to different objects (elements) in a way that it’s difficult to manipulate with Revit only.
Encapsulation
In Revit, different objects such as walls, floors and roofs communicate with each other when connected. Each object keeps its form private inside a class (families). Other objects don’t have a direct access to this form. The form changes with different methods that is given by the user. A wall’s properties can only be changed from the wall itself and not e.g. from a roof.
Abstraction
Abstraction is a way of an extension of encapsulation. In abstraction, complex scripts and codes are simplified. E.g. in Revit, changing a wall height is quite straightforward for the user however the programming script for it can be complex. The user only needs to see the easy way of changing the height of the wall.
Inheritance
Objects in Revit often have the same attributes, e.g. height, area, length. The same main script can be used for all of them however with a slight change for different objects. A hierarchy can be formed like explained earlier from instances, types, families and category. These scrips can be reused for all the objects. The highest in the hierarchy is the parent class and the lower, is the children class of the parents.
Polymorphism
This word means “many shapes” in Greek. Polymorphism is a way to use a class (family in Revit) exactly like its parent and each child class (family) keeps its own methods as they are. For different objects with the same method of obtaining access to its properties, the same method is used.
10
2.6 Parametric design
Parametric design can be compared to a spreadsheet in e.g. excel. One can add as many equations, constant and variables. Changing one parameter can change the results that are connected to a particular parameter. This process can also be achieved with geometry. The method of parametric design is to make the geometry’s parameter in relation with each other.
It’s about the process of creating a hierarchy of geometrical and mathematical relations that can create a model that can be manipulated by changing certain parameters. The benefits of this process are being able to automatize and repeat several tasks with no possibilities of human error. These tasks can be managed various times without going through the entire calculations repeatedly. (Parametric camp, 2018)
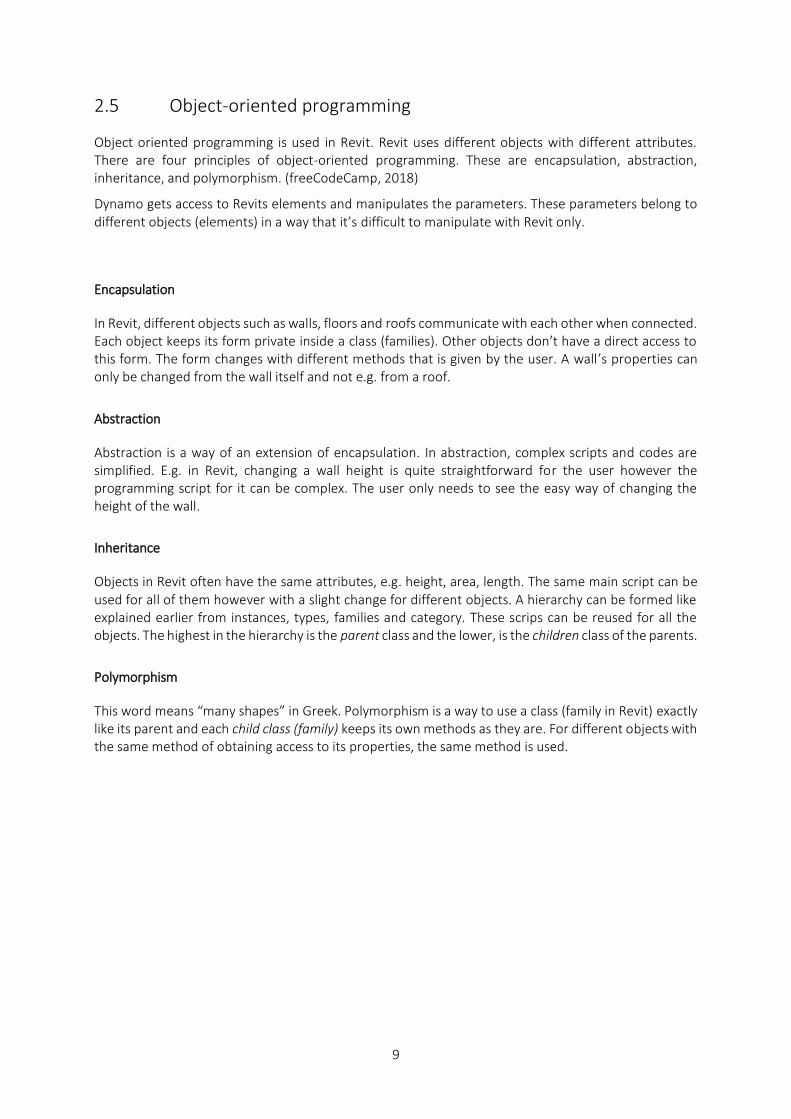
An example of parametric design can be explained in Revit. E.g. if one changes the parameters of the shape of a certain wall in the model, the rest of the variables changes with it. With Dynamo added, these variables can be changed automatically. Dynamo also gains the access to Revits data structure which allows even deeper controlling of the model elements.
Figure 2.4: An example of a Revit wall that would change several variables if a parameter such as the height of the wall would be changed
11
2.7 The basics of Dynamo software
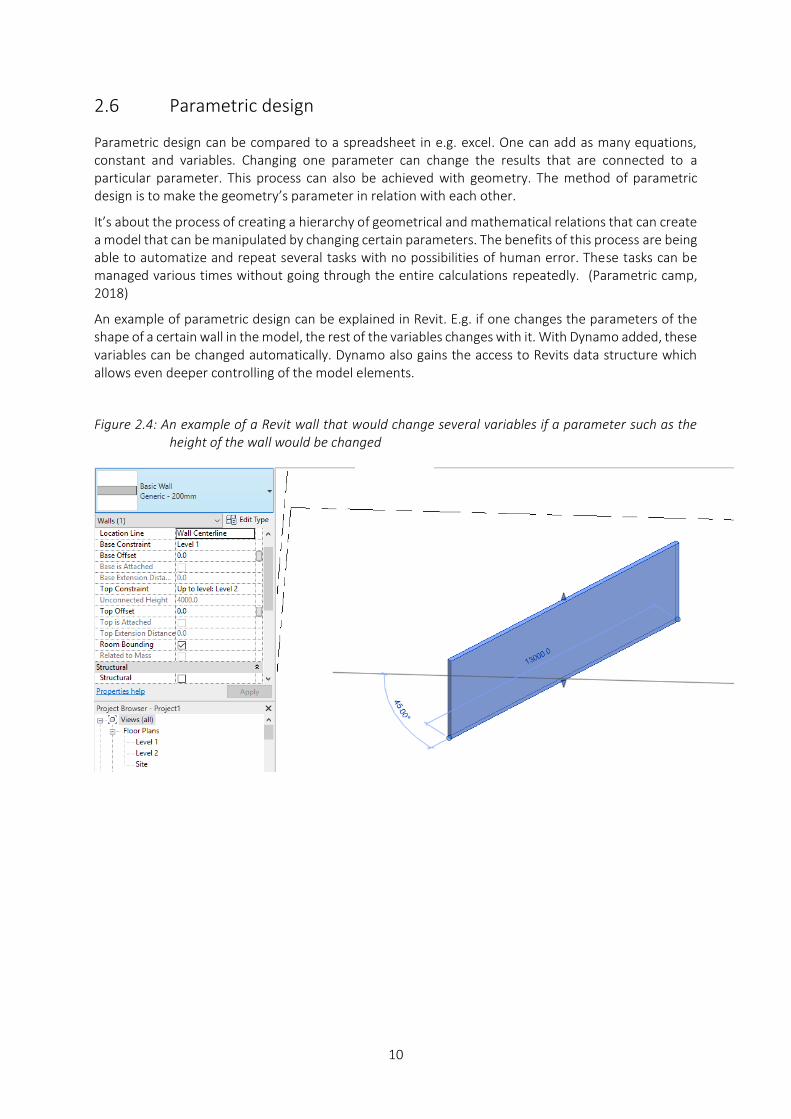
A graph is displayed when Dynamo starts. The graph consists of different tabs where the user can choose the nodes and also a script where all the nodes are displayed. This script can be changed between showing the nodes and the background 3D preview navigator. At the bottom to the left, there is a button that can be selected to run the Dynamo script. This switch should be selected as manual and not automatic for preventing the program from crashing in some codes.
Figure 2.5: Dynamo graph example
12
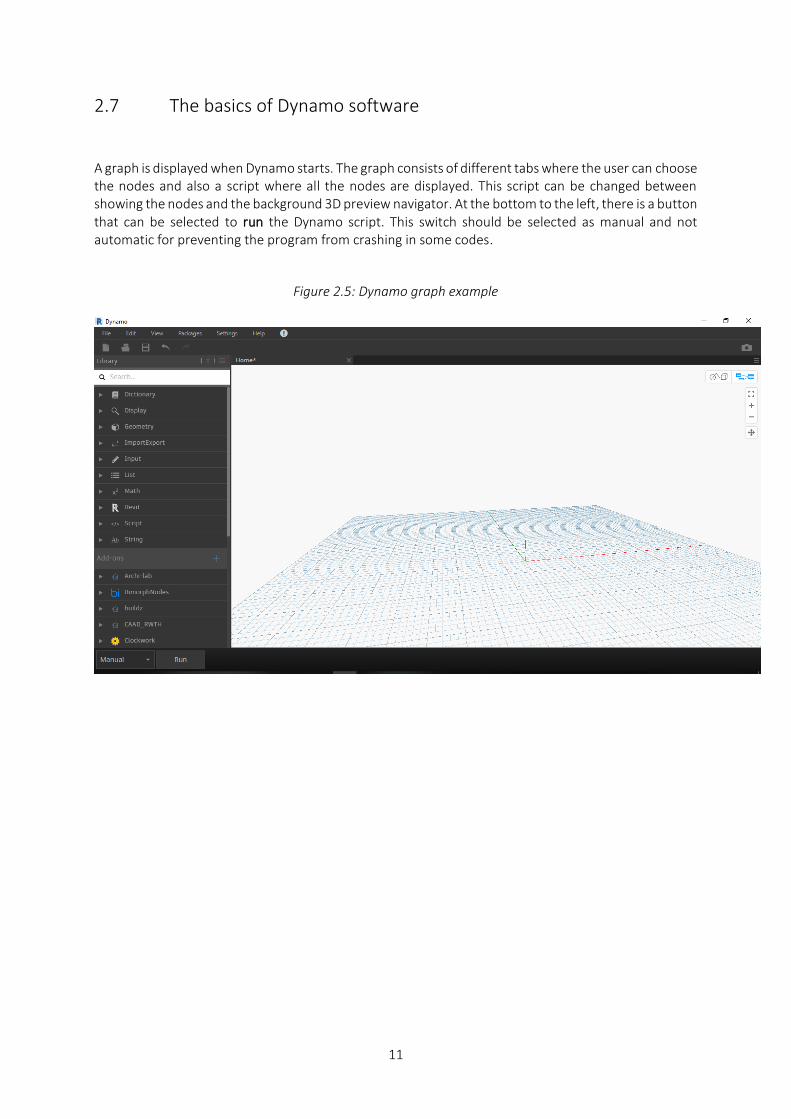
The tabs where all the Dynamo codes can be chosen are shown in the left side of the graph. Here, different tabs for each category can be chosen. E.g. geometry, display and Revit.
Figure 2.6: Example of different tabs in Dynamo
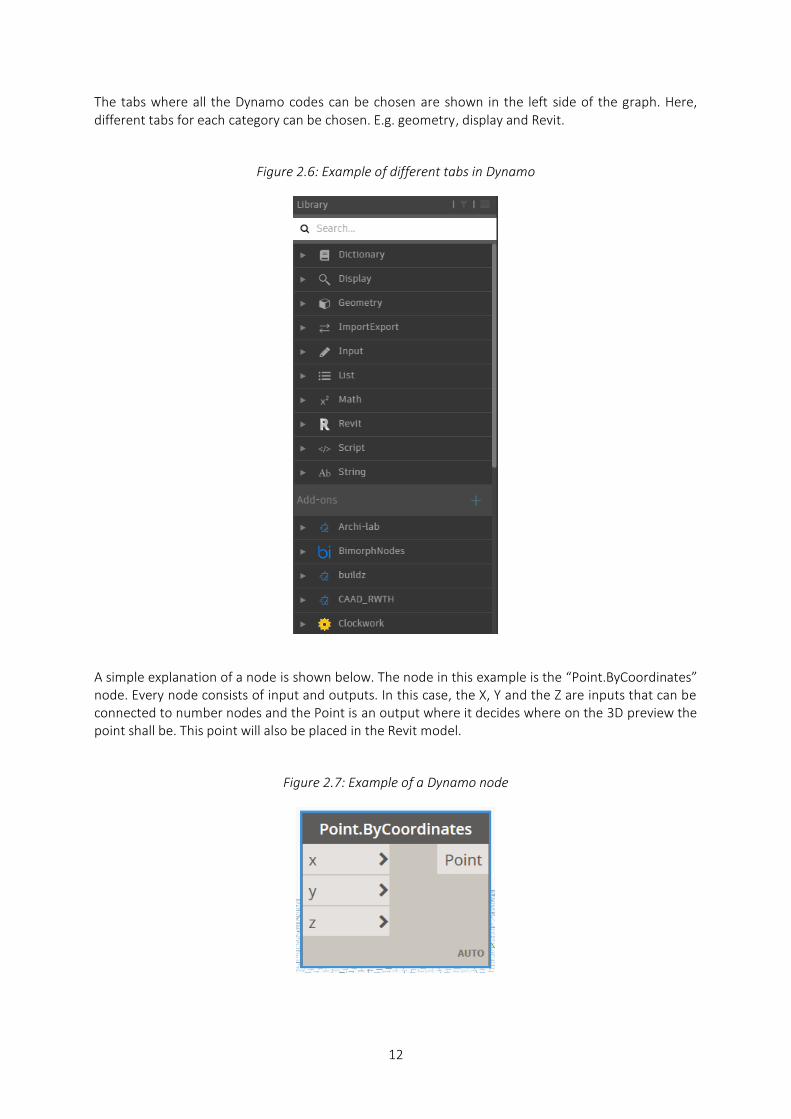
A simple explanation of a node is shown below. The node in this example is the “Point.ByCoordinates” node. Every node consists of input and outputs. In this case, the X, Y and the Z are inputs that can be connected to number nodes and the Point is an output where it decides where on the 3D preview the point shall be. This point will also be placed in the Revit model.
Figure 2.7: Example of a Dynamo node
13
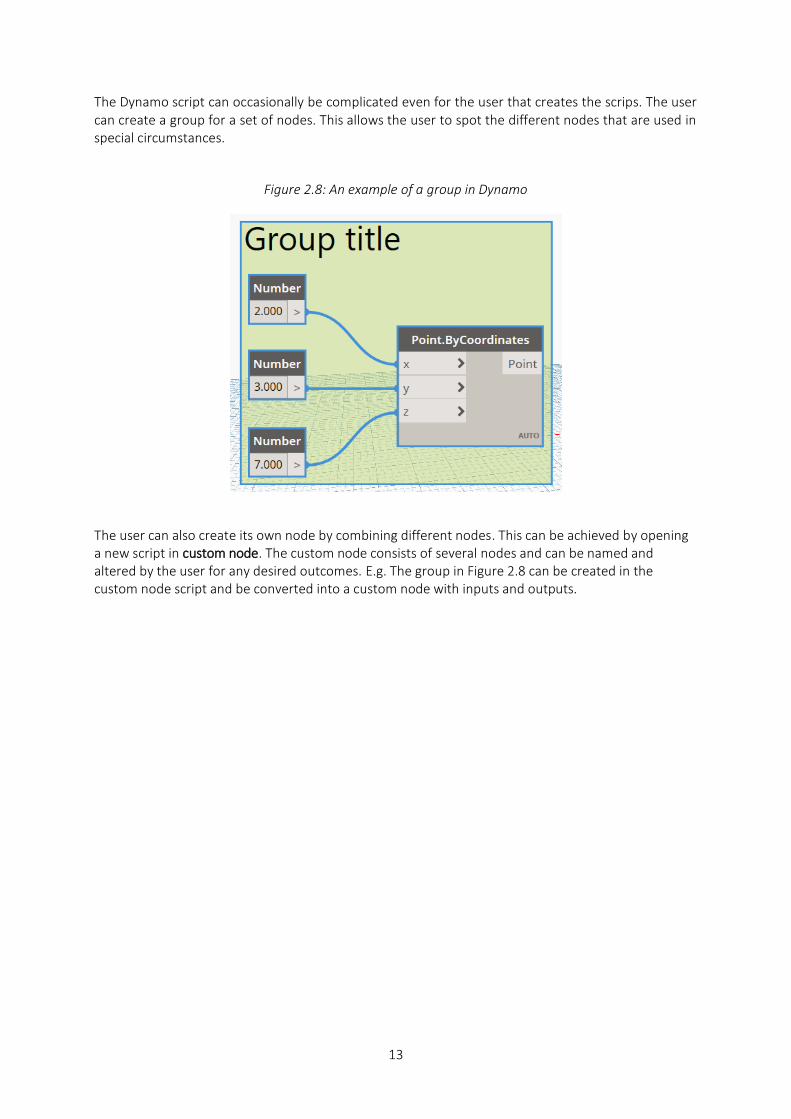
The Dynamo script can occasionally be complicated even for the user that creates the scrips. The user can create a group for a set of nodes. This allows the user to spot the different nodes that are used in special circumstances.
Figure 2.8: An example of a group in Dynamo
The user can also create its own node by combining different nodes. This can be achieved by opening a new script in custom node. The custom node consists of several nodes and can be named and altered by the user for any desired outcomes. E.g. The group in Figure 2.8 can be created in the custom node script and be converted into a custom node with inputs and outputs.
14
2.8 Why Dynamo is necessary
Obtaining different outcomes from Revit with help of other software is common. One can make load path calculations with calculating software like FEM-design and Robot Structural Analysis. Other softwares are also used for thermal transmission losses such as IDA ICE. So why would Dynamo be different from them? From the Dynamo script in this research, one can change the desired outcomes by changing a certain equation to obtain various results for each element.
Below, four reasons for using Dynamo are described. (Arch smarter, 2018)
2.8.1 Automatization and repetitions
Using Revit only, sometimes, there are numerous tasks that need to be repeated. However, using Dynamo in combination with Revit, numerous tasks can be repeated much quicker.
2.8.2 Getting access to Revit’s data structure
Revit like other softwares can be manipulated through programming. Even though Dynamo is not like the typical programming tool, Dynamo can access Revit’s data structure and change or obtain information from it. Dynamo can use code block nodes or Python script nodes to write programming codes that are similar to a writing programming software.
2.8.3 Combination with other software
Dynamo can easily be connected to other softwares through nodes that allows the user to save time when using Revit. Dynamo can e.g. be connected to excel. This connection will be used in this research to show that the outcomes of Dynamo can be inserted into a excel sheet.
2.8.4 Being able to test different tasks quicker
Dynamo can be used to test several tasks in Revit. This goes back to the first reason of repetition and automatization. If the user won’t have to worry about making a mistake in Revit, the repeatability in Dynamo makes it easier for the user to repeat tasks in Revit and optimize them quickly with Dynamo.
15
3 Method
The version of Dynamo that is used in this thesis is 2.0.1. Dynamo is best used with the architectural template in Revit. The reason for that is in the architectural template, all the elements and categories are visible in the model i.e. all the elements that are chosen in Dynamo will be visible in Revit. If other type of templates is used, the visibility for a certain element in Revit should be checked.
The Dynamo script can either run automatically or manually. For best result and less errors, the script should run manually. Dynamo’s preview navigator is set for small objects, however in Revit the objects are measured in millimeter, therefore the geometry scaling of Dynamo must be set to extra-large.
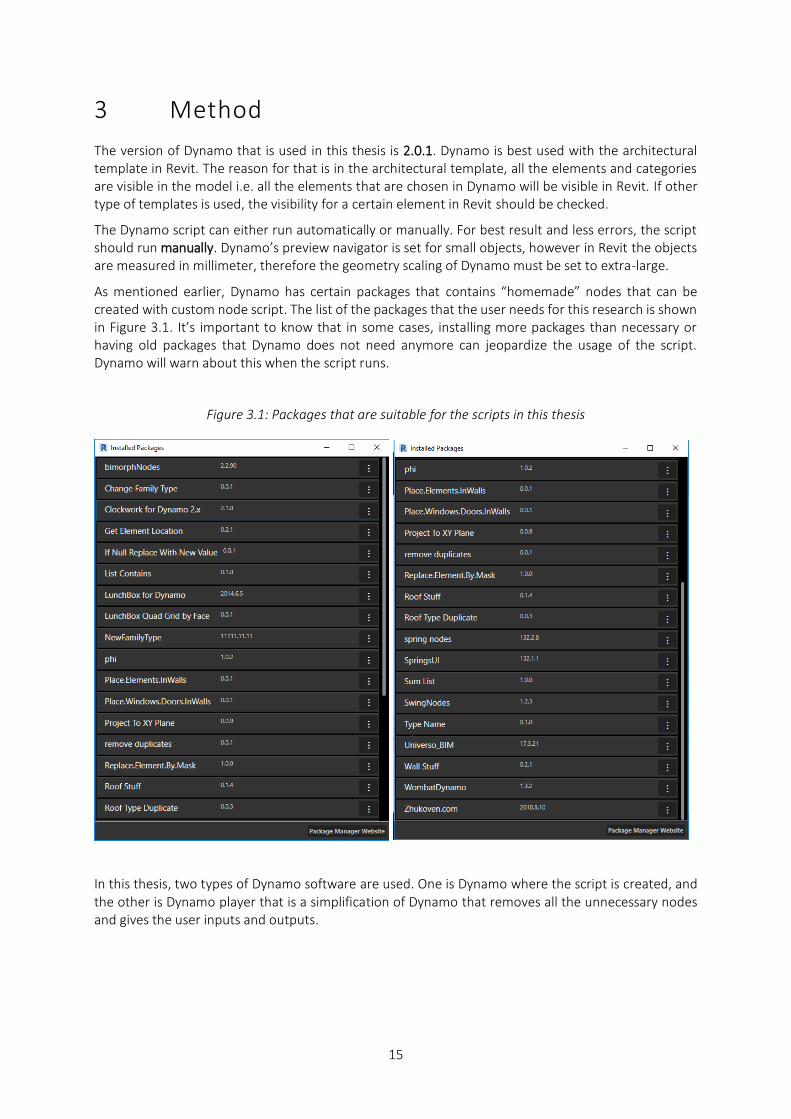
As mentioned earlier, Dynamo has certain packages that contains “homemade” nodes that can be created with custom node script. The list of the packages that the user needs for this research is shown in Figure 3.1. It’s important to know that in some cases, installing more packages than necessary or having old packages that Dynamo does not need anymore can jeopardize the usage of the script. Dynamo will warn about this when the script runs.
Figure 3.1: Packages that are suitable for the scripts in this thesis
In this thesis, two types of Dynamo software are used. One is Dynamo where the script is created, and the other is Dynamo player that is a simplification of Dynamo that removes all the unnecessary nodes and gives the user inputs and outputs.
16
3.1 Explanation of the scripts
Below, an explanation of each script is presented. All different scripts with individual outcomes are saved in distinct files in order that the user can easily work with them. For instance, when placing elements, there is a certain Dynamo file and for Floor cost analyze there is another Dynamo file to be used. The explanations are without figures. All the Figures can easily be seen in the Appendixes for each script. And also, an explanation of each node is made for the scripts that are used in this thesis.
3.1.1 Placing elements
Placing elements in a certain location with Revit only can be performed quickly. However, in this research, it is shown that through Dynamo, automatization can be utilized by connecting nodes to each other. This makes the placing elements faster if working with a large drawing.
The script begins with different Floor, wall and roof groups that allows the user to choose what type of element and what level the element shall be placed. The reason that there are different groups is that in a project, different type of elements can be placed.
Floors
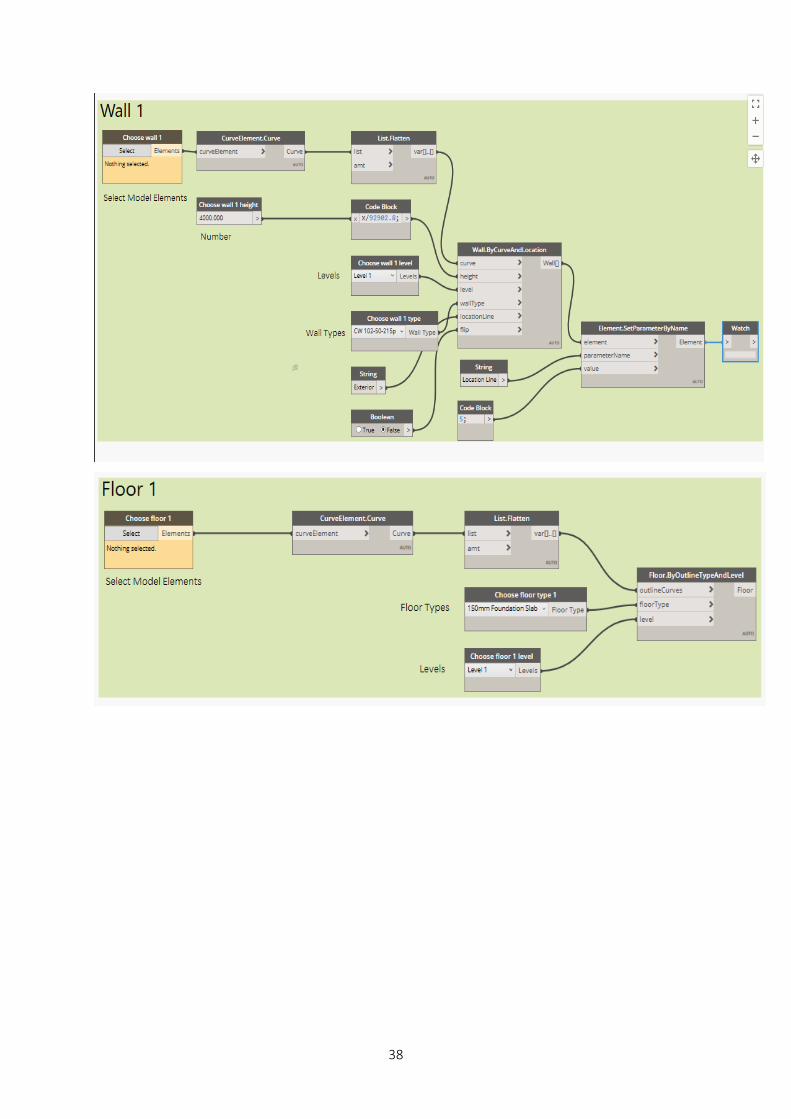
By selecting Choose floor node (Select Model Elements node), the user can click and hold all the desired lines where the floor shall be placed. The node selects the lines and thereafter converts them into outline for the floor that is placed. These are connected to the CurveElement.Curve node and thereafter to the Floor.ByOutlineTypeAndLevel node. The Floor.ByOutlineTypeAndLevel is the node that places the floor. The Floor.ByOutlineTypeAndLevel is also connected to Floor Types and level node in order that the user can choose level and type of floor.
Walls
For placing walls, the same method of choosing lines is applied however, the node Element.SetParameterByName is used in this case that places the wall inwards from the AutoCad lines.
Roofs
Lastly the roof uses the same method however, in this case the inclination of the roof can be chosen. These nodes are all connected to the FootPrintRoof.ByEdgesAndSlopes node that places the roof.
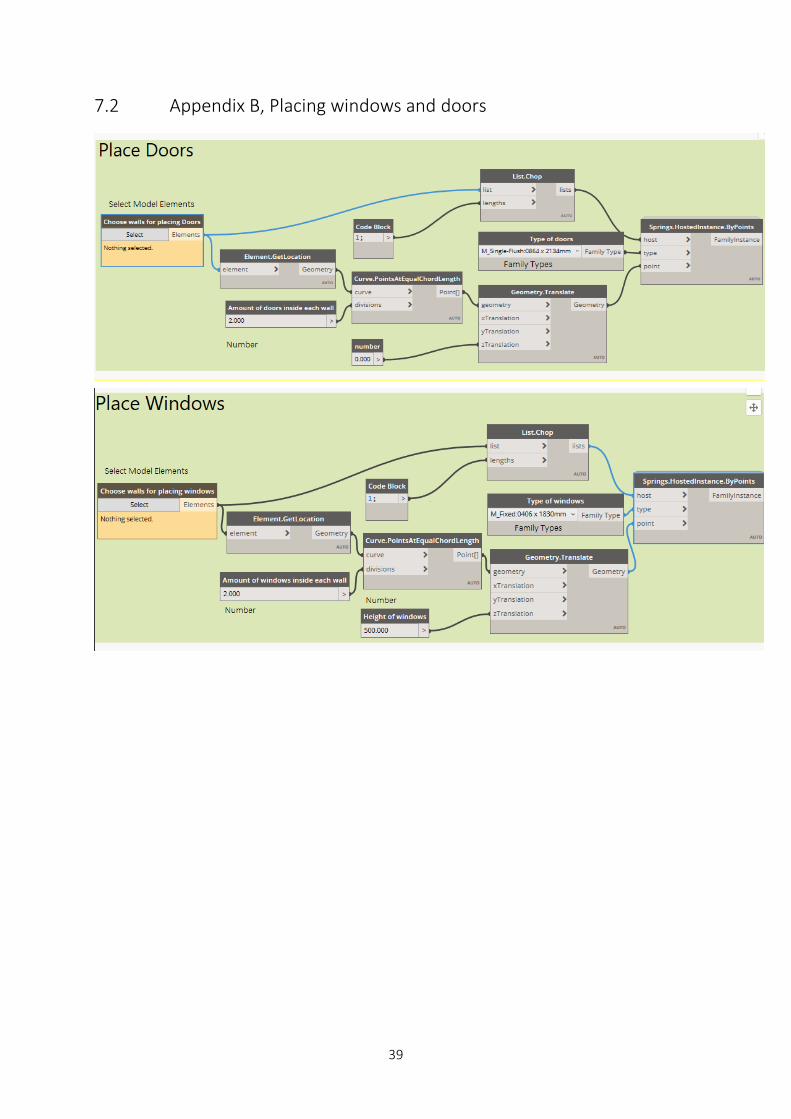
Doors and windows
There are two other files for creating several windows and doors inside a wall simultaneously and they look similar. In order to place doors and windows inside a wall, a host shall be chosen and in this case the host is the wall. The node Springs.HostedInstance.ByPoints allows the user to choose the wall as host and through the node Curve.PointsAtEqualChordLength divide the selected amount of doors and windows inside a wall.
17
3.1.2 Analysis of elements
The analysis for elements consists of three different outcomes for three different types of elements. These are examples that are shown in order to demonstrate that the script can be changed depending on what type of outcome that is desired. The outcomes are element cost, weight and thermal transmission losses. The elements that can be chosen are walls, floor and roofs.
The user can either use Dynamo or Dynamo player. In this example, thermal transmission losses of a wall will be explained since the scripts of all other outcomes and elements are similar, only the main equations are changed.
All the images of this script are shown in the appendixes for analysis.
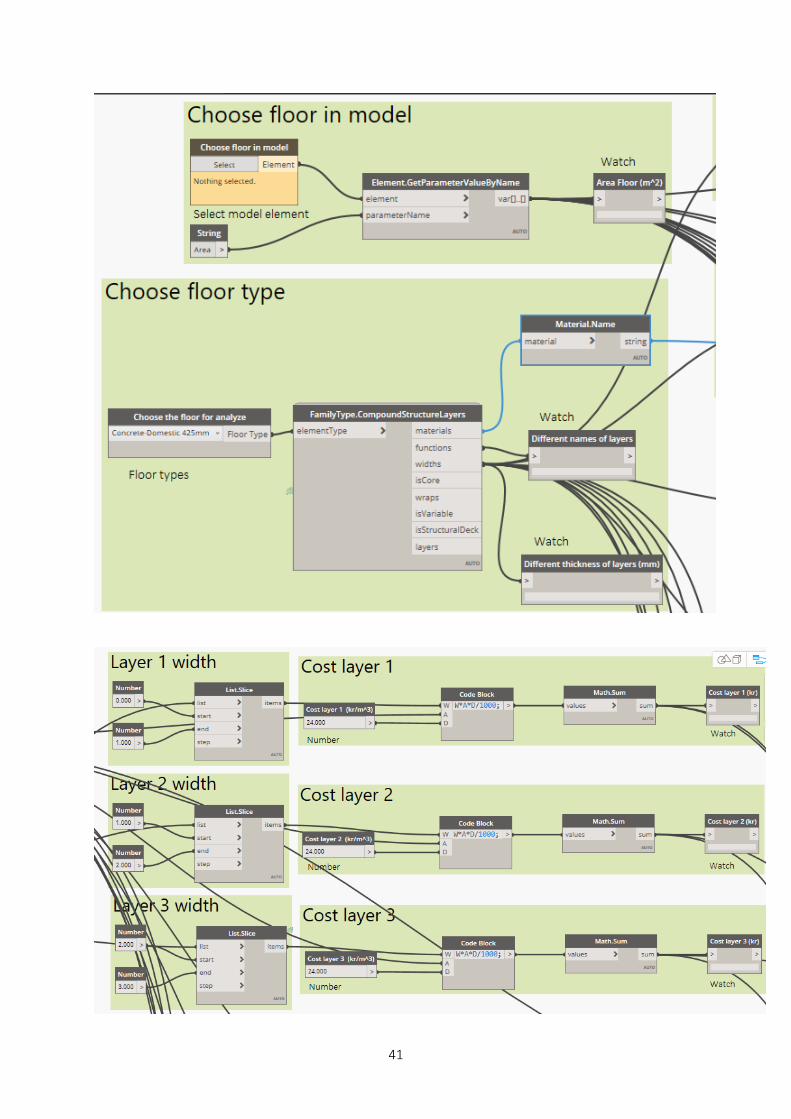
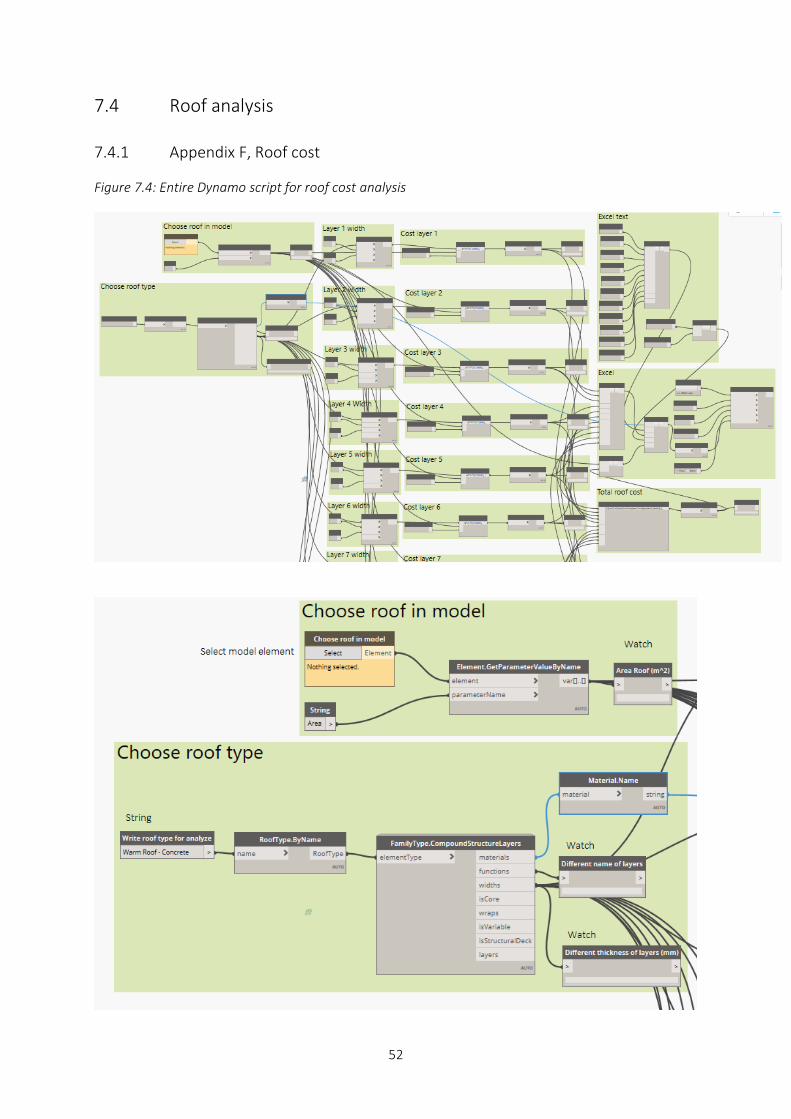
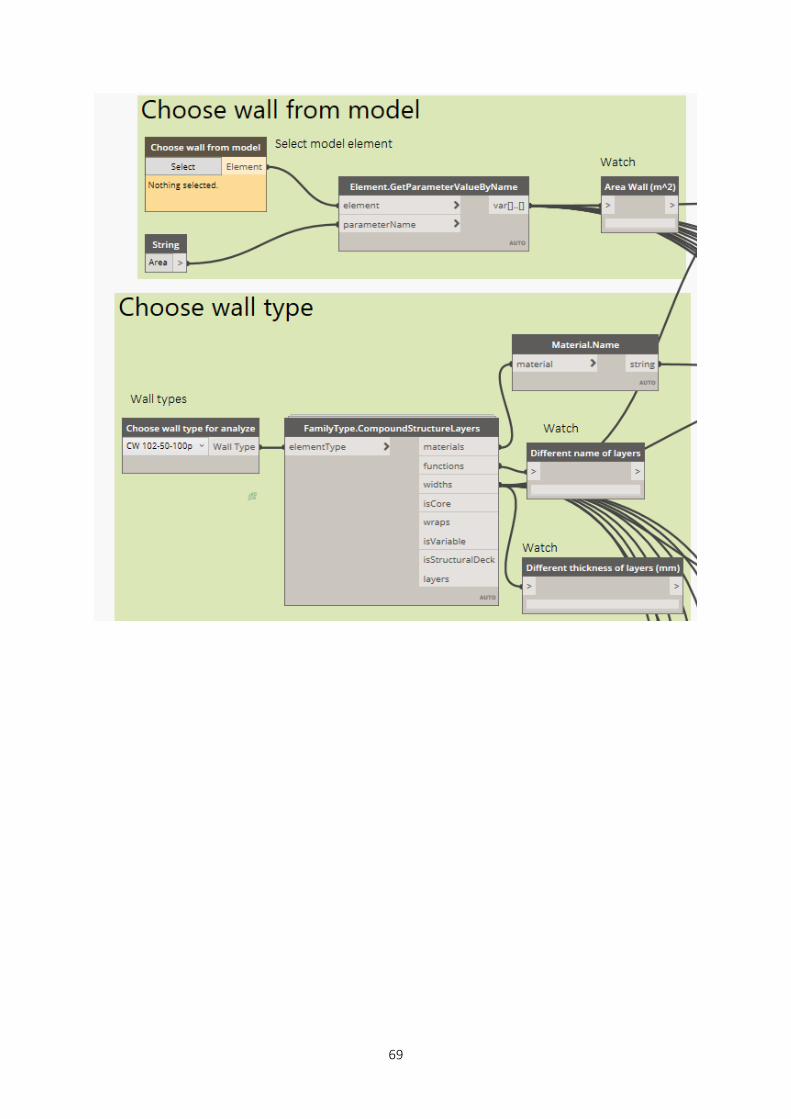
The user can choose an instance of a wall by selecting the wall in the model. The first node is Select Model Element. This node is connected the Element.GetParameterValueByName that extracts the area of the wall by using a string node that is written “Area” on. The FamilyType.CompoundStructureLayers requires a type of wall to be selected by the user. This node is a custom node that extracts all the structure properties of an element.
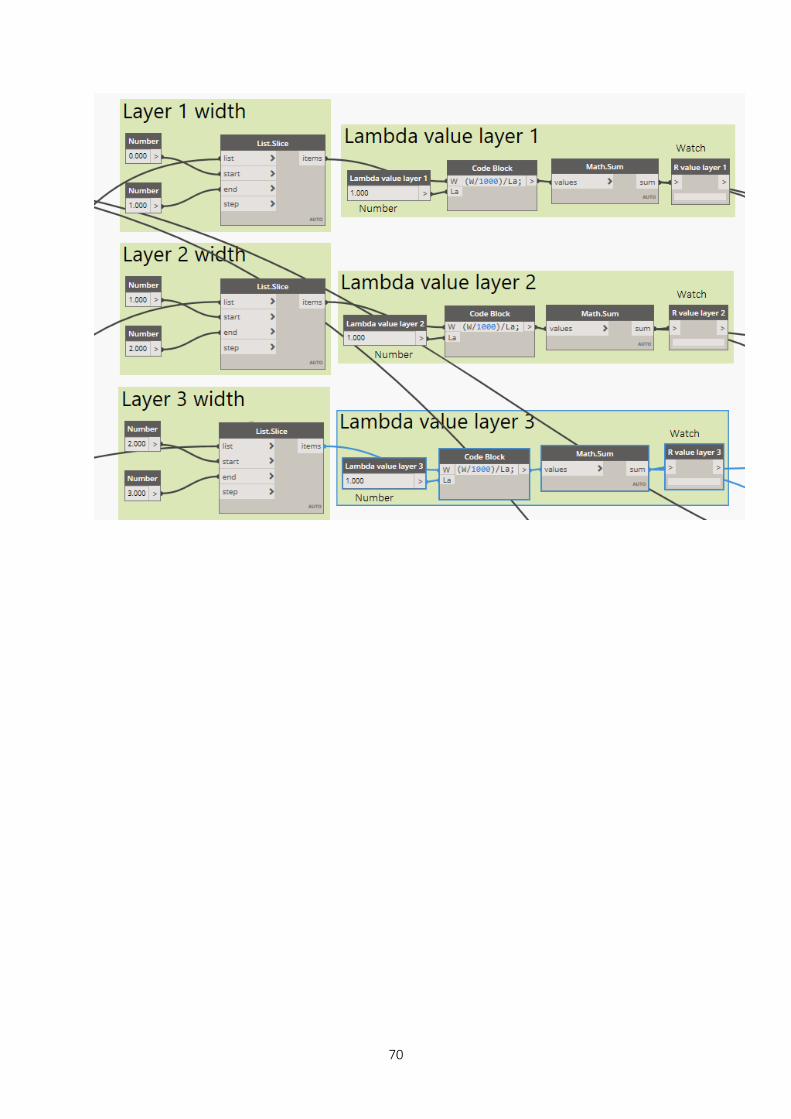
FamilyType.CompoundStructureLayers is then connected to different List.Slice nodes that chooses all the different layer thickness in the element. From this equation a certain lambda value can be chosen by the user. All the layers are connected to an equation that can be changed depending on the desired outcome. This equation is shown in Figure 3.3 for wall cost and shown in the appendixes for each script.
Two groups for the excel file are created that allows the user to choose an excel file to be changed and insert the outcomes of the results of the transmission losses. This excel file has further explanation in chapter 3.2.4 where the different nodes explain what they are used for. And, a visual explanation can be viewed in the appendix for each script.
Lastly, a group is created that allows the user to choose the temperature difference between outside and inside of the wall and another group is created that adds all the R values from the different layers. These groups have their own equation inside a code block. In chapter 3.2.4, an explanation of each node is made, and a visual explanation can be viewed in the Appendix. However, in chapter 3.2.4, the explanation is made for the cost although looks the same for transmission losses.
In order that Dynamo player can be used, the nodes that are inputs shall be marked as inputs. This is shown in Figure 3.5.
For each time a change is made in the parameters of the model elements, Dynamo must by restarted. The reason for this is that Dynamo doesn’t save the information about the model elements when parameters are changed.
18
3.2 Nodes that are used in the scripts
All the nodes that are used in these files shall be explained briefly. Every node has a different function, down below, they are explained for each file. For more information of each node, there are very useful explanations of them within the Dynamo software. Some certain nodes need an extra explanation as they have several types of usages e.g. code blocks.
3.2.1 Code block nodes
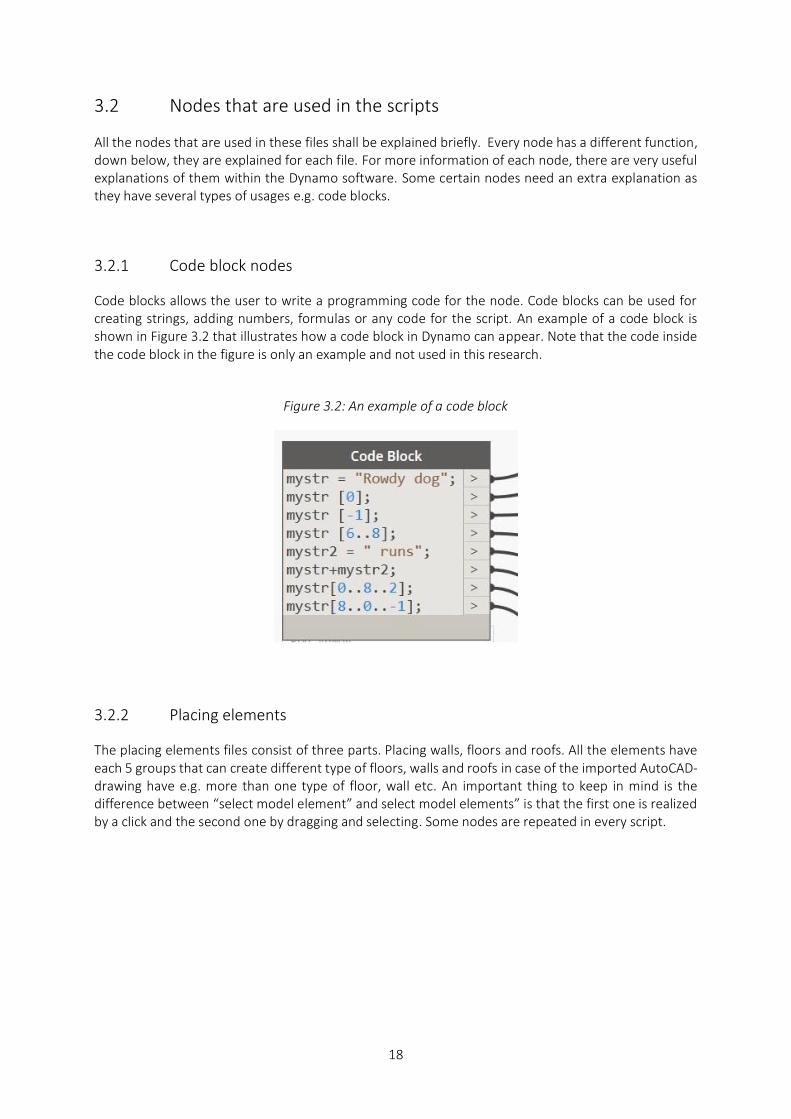
Code blocks allows the user to write a programming code for the node. Code blocks can be used for creating strings, adding numbers, formulas or any code for the script. An example of a code block is shown in Figure 3.2 that illustrates how a code block in Dynamo can appear. Note that the code inside the code block in the figure is only an example and not used in this research.
Figure 3.2: An example of a code block
3.2.2 Placing elements
The placing elements files consist of three parts. Placing walls, floors and roofs. All the elements have each 5 groups that can create different type of floors, walls and roofs in case of the imported AutoCAD-drawing have e.g. more than one type of floor, wall etc. An important thing to keep in mind is the difference between “select model element” and select model elements” is that the first one is realized by a click and the second one by dragging and selecting. Some nodes are repeated in every script.
19
Place Floors
• Select Model Elements: A node that allows the user to select one or several elements in Revit, in this case lines.
• CurveElement.Curve: Obtains a geometry curve, in this case from the AutoCad lines.
• List.Flatten: Flattens a nested list of lists by a certain amount where the default value is -1.
• Floor Types: Allows the user to choose all floor types available in the Revit model.
• Levels: Allows the user to select the levels available in Revit model.
• Floor.ByOutlineTypeAndLevel: Creates a floor in the Revit model depending on three inputs. Outline curves, floor Type and level.
Place Walls
The walls are placed depending on a curve from AutoCad lines. This group creates the wall in a way that the walls are placed inwards from the line. The reason for that is that the lines from the AutoCad drawings are not in the middle of the wall.
• Select Model Elements: A node that allows the user to select one or several elements in Revit, in this case lines.
• CurveElement.Curve: Obtains the geometry curve, in this case from the AutoCad lines.
• List.Flatten: Flattens a nested list of lists by a certain amount where the default value is -1.
• Number: The user can choose a number. In this case, the wall height.
• Code block: The usage for this code block converts mm into inches for the wall height.
• Levels: Allows the user to select the levels available in Revit model.
• Wall Types: Allows the user to choose wall types that are in the Revit model.
• String: Set to Exterior to ensure that the walls is placed inwards.
• Boolean: Ensures that the walls don’t rotate.
• Element.SetParameterByName: The node that changes a walls parameter, the inputs are a code block and a string that changes the location line of the wall to Core Face: Exterior.
• Wall.ByCurveAndLocation: Creates walls with inputs, curve, height, level, wall type, Location line and flip.
Place Roofs
• Select Model Elements: A node that allows the user to select one or several elements in Revit.
• CurveElement.Curve: Obtains the geometry curve, in this case from the AutoCad lines.
• List.Flatten: Flattens a nested list of lists by a certain amount where the default value is -1.
• Number: In this case, there are 6 Number nodes that allows the user to choose the different inclinations of the roof.
• List create: Gathers all the inclinations of the roof into a list.
• String: The user writes the name of the Roof.
• RoofType.ByName: The name of the roof from the string selects a roof type that exist in the Revit model.
• Levels: Allows the user to select the levels available in the Revit model.
• FootPrintRoof.ByEdgesAndSlopes: Creates a roof depending on the edges from the AutoCad lines, slopes of the roof, level and roof type.
20
3.2.3 Placing windows and doors
The nodes that would be explained in this part are only the nodes that are in the script for placing windows. The script for placing doors are similar, however the script for placing windows contains a node that allows the user to decide the sill height of the windows.
• Select Model Elements: Allows the user to select the walls that the windows shall be placed.
• Element.GetLocation: Obtains the location of the elements that are chosen.
• Number: Allows the user to select number of windows inside each wall.
• Number: Another number node that allows the user to choose the sill height of the windows.
• List.Chop: Chops a list into a set of consecutive sublists with the specified lengths. List division begins at the top of the list.
• Code Block: Is the number of the length of consecutive sublist that is created.
• Curve.PointsAtEqualChordLength: Returns points spaced along curve at equal chord length based on the input number of divisions.
• Family Types: Allows the user to choose type of windows.
• Geometry.Translate: Translates any given geometry by the given displacements in the x, y, and z directions.
• Springs.HostedInstance.ByPoints: The node that places the windows inside each wall having the walls as hosts.
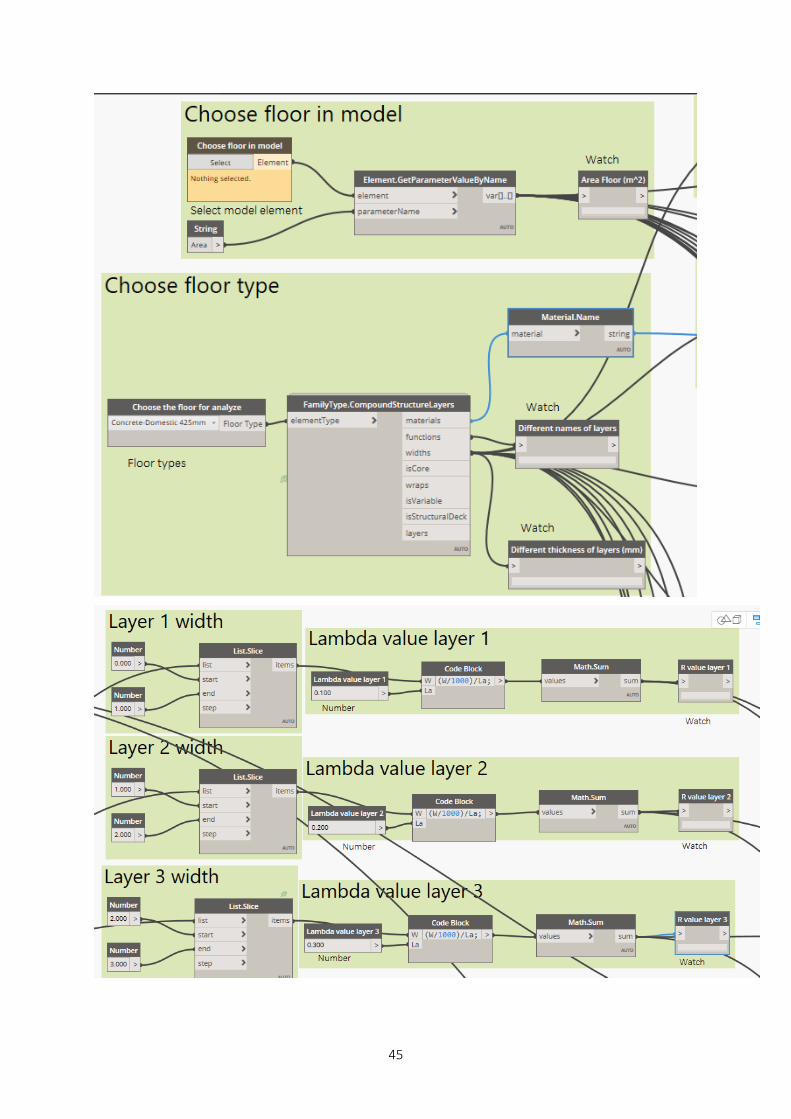
3.2.4 Analysis of elements
The analysis of elements is carried out for three types of elements, floors, walls and roofs. The three different outcomes for each element are cost, weight and thermal transmission losses. Since the script looks similar for each element, only one of them will be explained. The node that changes for each element in the scripts is the node that allows the user to choose different types of element. Also, the equations for each code block node changes depending on the outcome. The focus will therefore only be on the wall cost script. All the nodes are divided into groups that separately will be explained.
Wall cost analysis example
Choose wall from model Group
• Select Model Element: Allows the user to select an element in the Revit model, in this case a wall.
• Element.GetParameterValueByName: The selected elements parameter can be obtained from this node.
• String: This string node contains the name of the parameter that will be obtained, in this case the element Area.
• Watch: The watch node displays the obtained value from the element. In this case the Area.
21
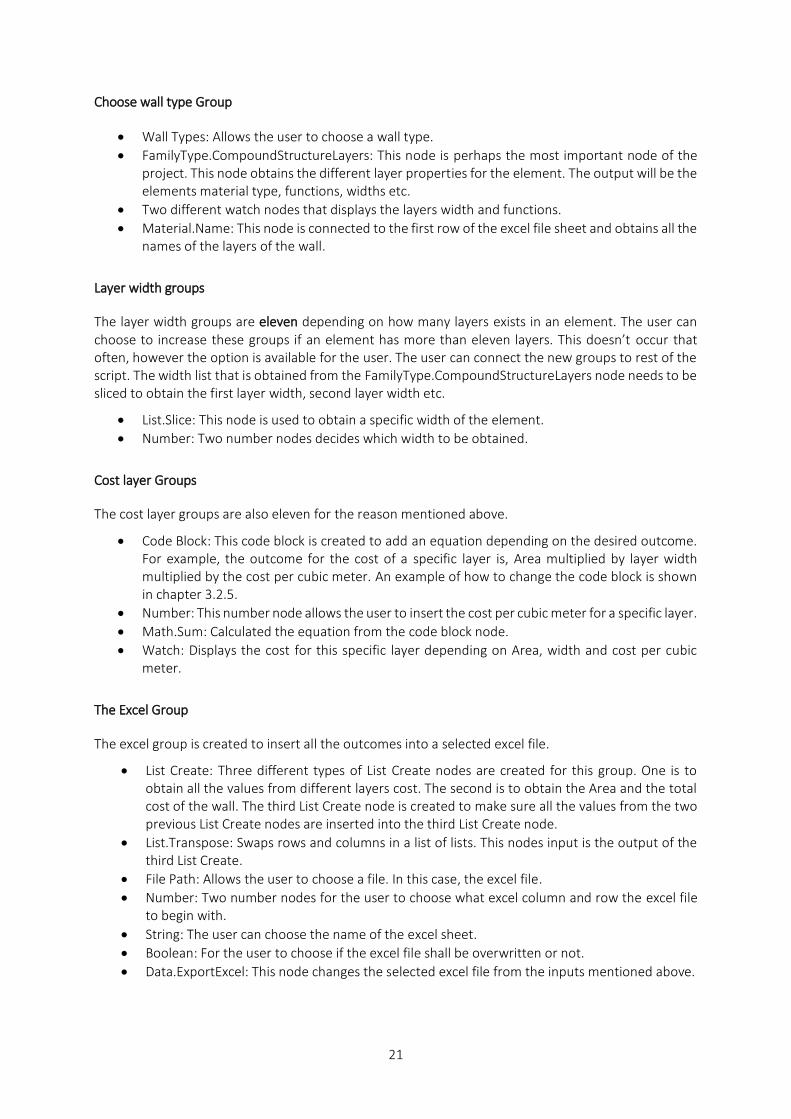
Choose wall type Group
• Wall Types: Allows the user to choose a wall type.
• FamilyType.CompoundStructureLayers: This node is perhaps the most important node of the project. This node obtains the different layer properties for the element. The output will be the elements material type, functions, widths etc.
• Two different watch nodes that displays the layers width and functions.
• Material.Name: This node is connected to the first row of the excel file sheet and obtains all the names of the layers of the wall.
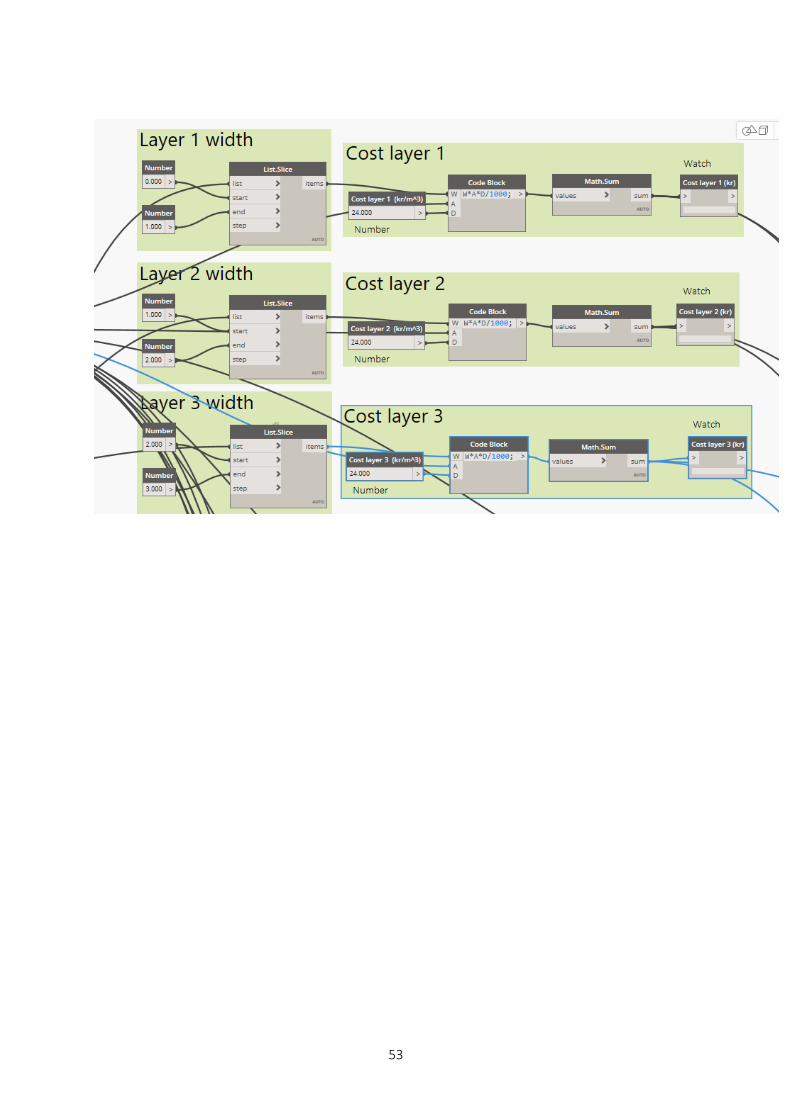
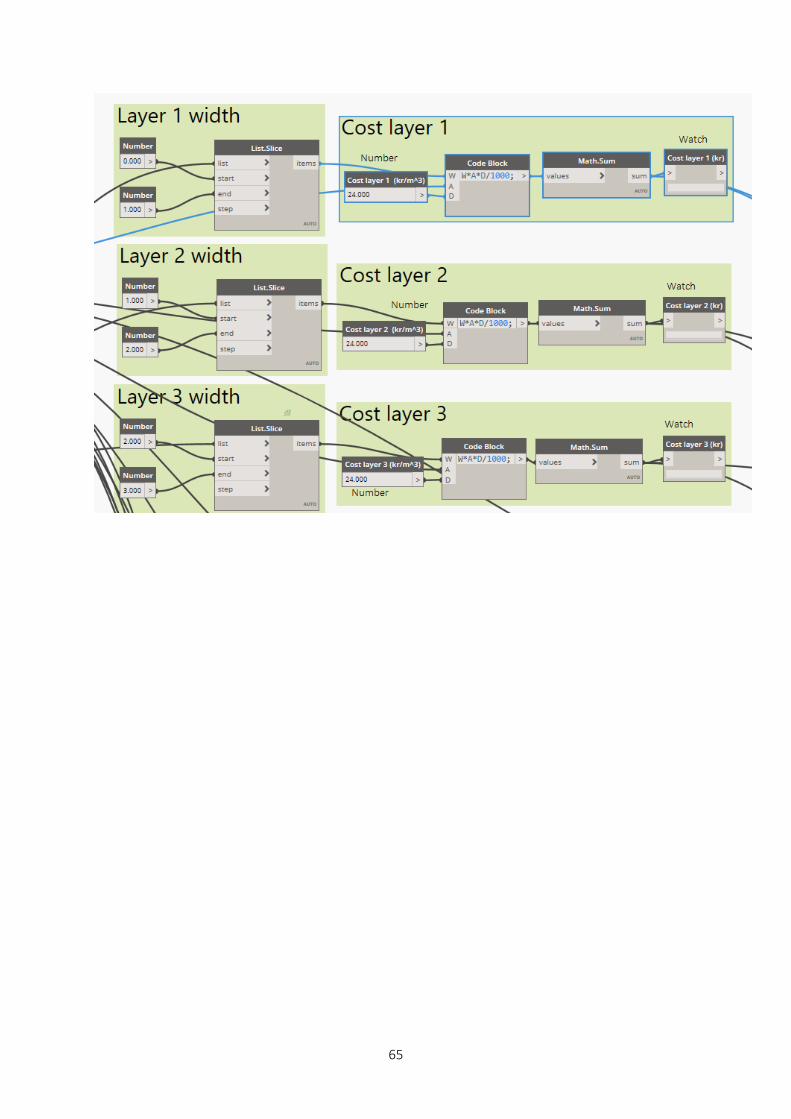
Layer width groups
The layer width groups are eleven depending on how many layers exists in an element. The user can choose to increase these groups if an element has more than eleven layers. This doesn’t occur that often, however the option is available for the user. The user can connect the new groups to rest of the script. The width list that is obtained from the FamilyType.CompoundStructureLayers node needs to be sliced to obtain the first layer width, second layer width etc.
• List.Slice: This node is used to obtain a specific width of the element.
• Number: Two number nodes decides which width to be obtained.
Cost layer Groups
The cost layer groups are also eleven for the reason mentioned above.
• Code Block: This code block is created to add an equation depending on the desired outcome. For example, the outcome for the cost of a specific layer is, Area multiplied by layer width multiplied by the cost per cubic meter. An example of how to change the code block is shown in chapter 3.2.5.
• Number: This number node allows the user to insert the cost per cubic meter for a specific layer.
• Math.Sum: Calculated the equation from the code block node.
• Watch: Displays the cost for this specific layer depending on Area, width and cost per cubic meter.
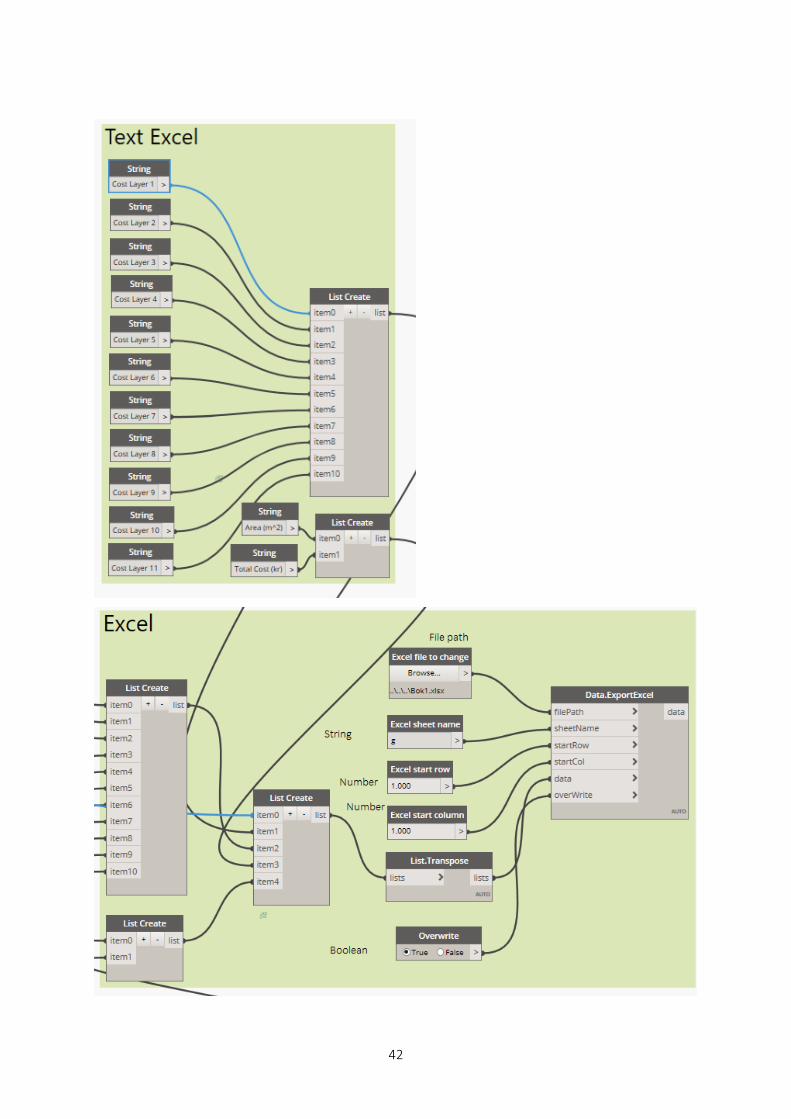
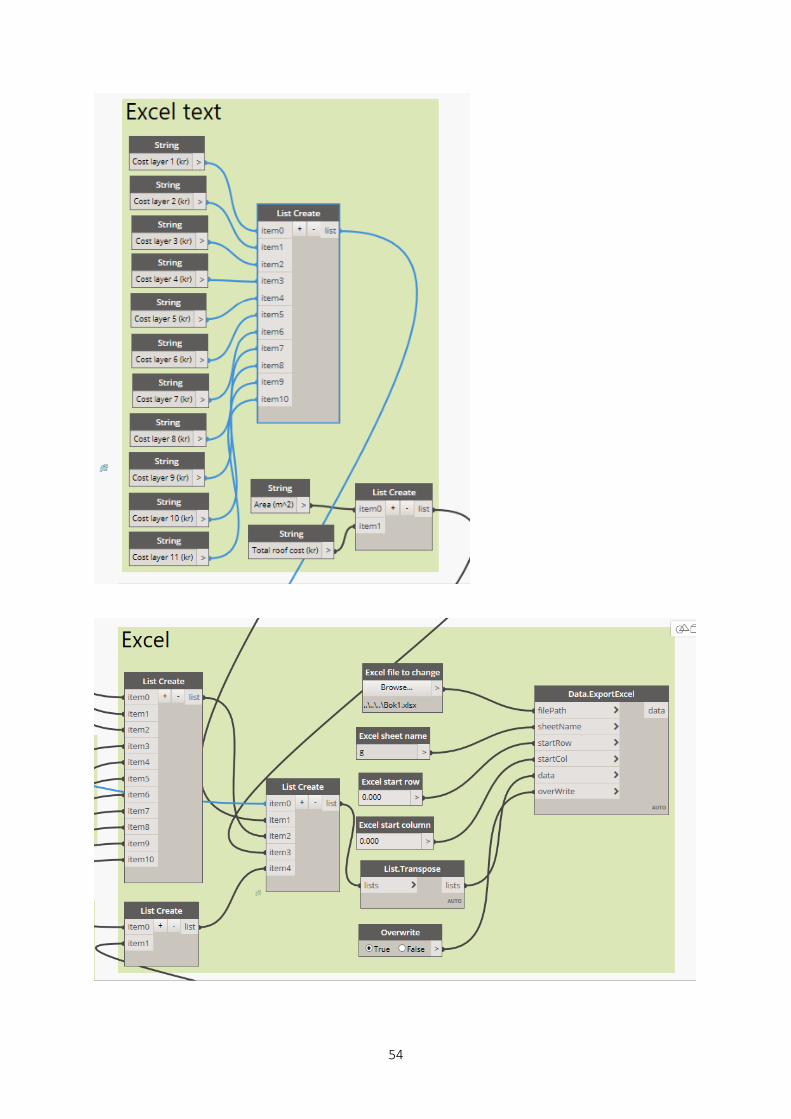
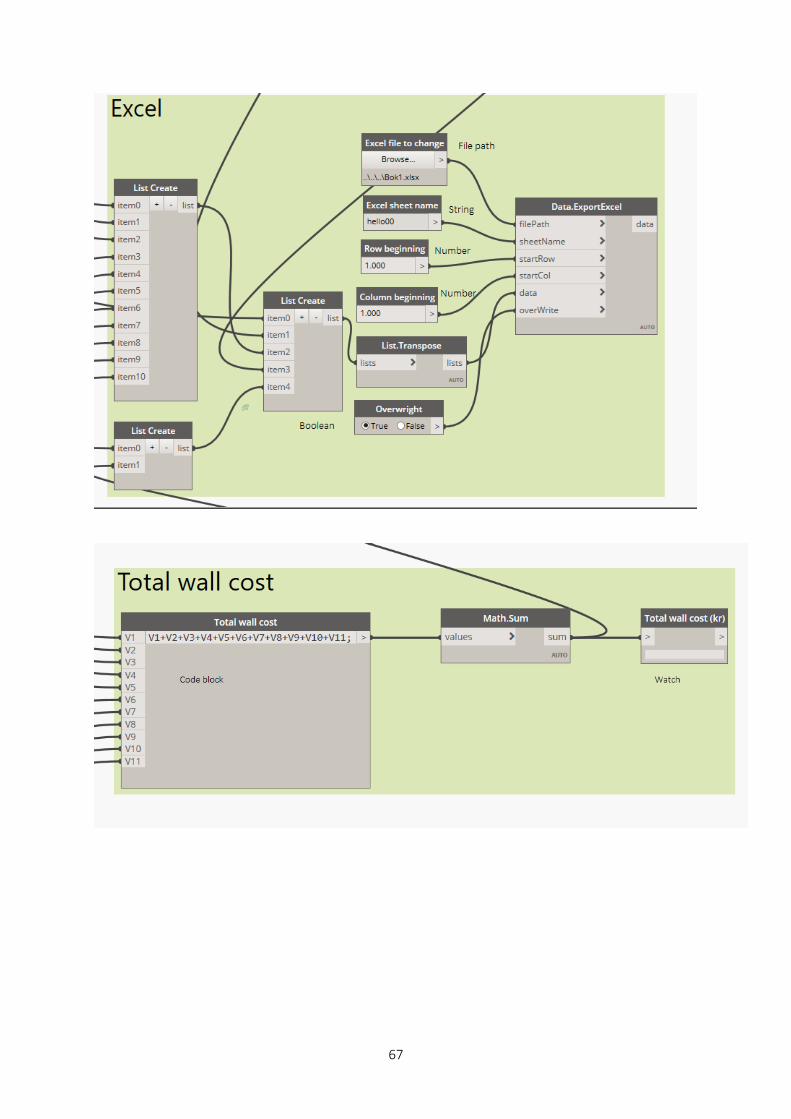
The Excel Group
The excel group is created to insert all the outcomes into a selected excel file.
• List Create: Three different types of List Create nodes are created for this group. One is to obtain all the values from different layers cost. The second is to obtain the Area and the total cost of the wall. The third List Create node is created to make sure all the values from the two previous List Create nodes are inserted into the third List Create node.
• List.Transpose: Swaps rows and columns in a list of lists. This nodes input is the output of the third List Create.
• File Path: Allows the user to choose a file. In this case, the excel file.
• Number: Two number nodes for the user to choose what excel column and row the excel file to begin with.
• String: The user can choose the name of the excel sheet.
• Boolean: For the user to choose if the excel file shall be overwritten or not.
• Data.ExportExcel: This node changes the selected excel file from the inputs mentioned above.
22
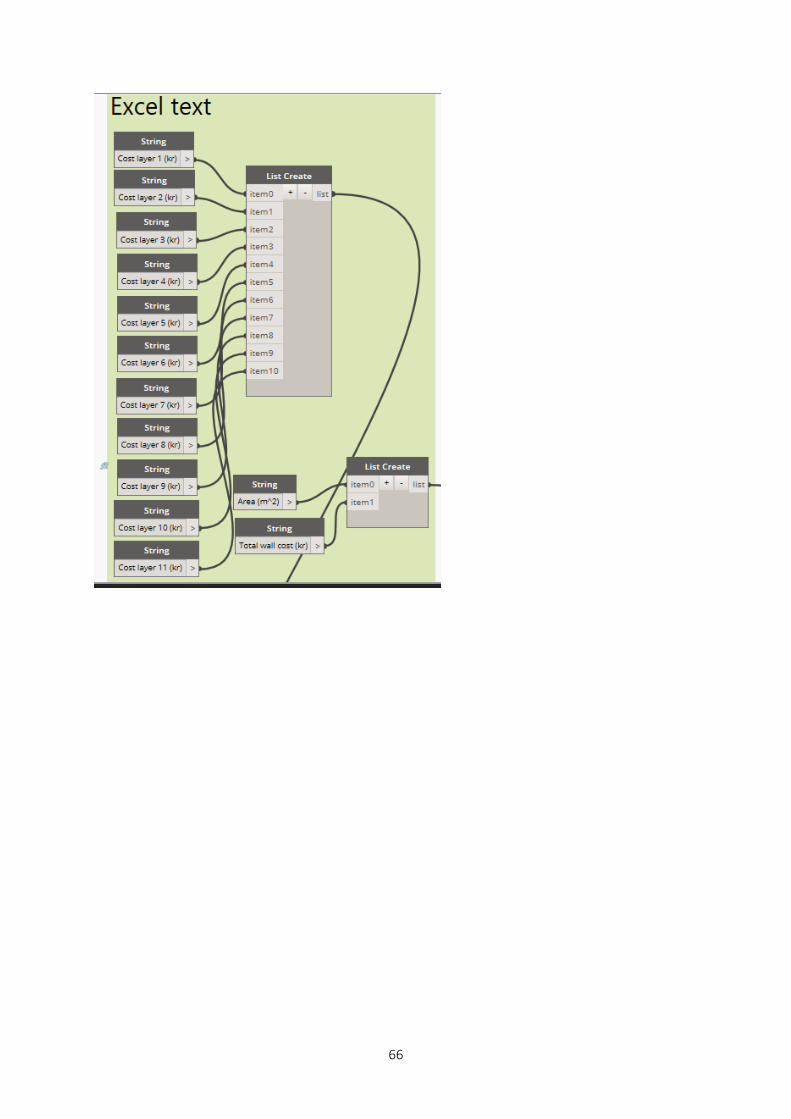
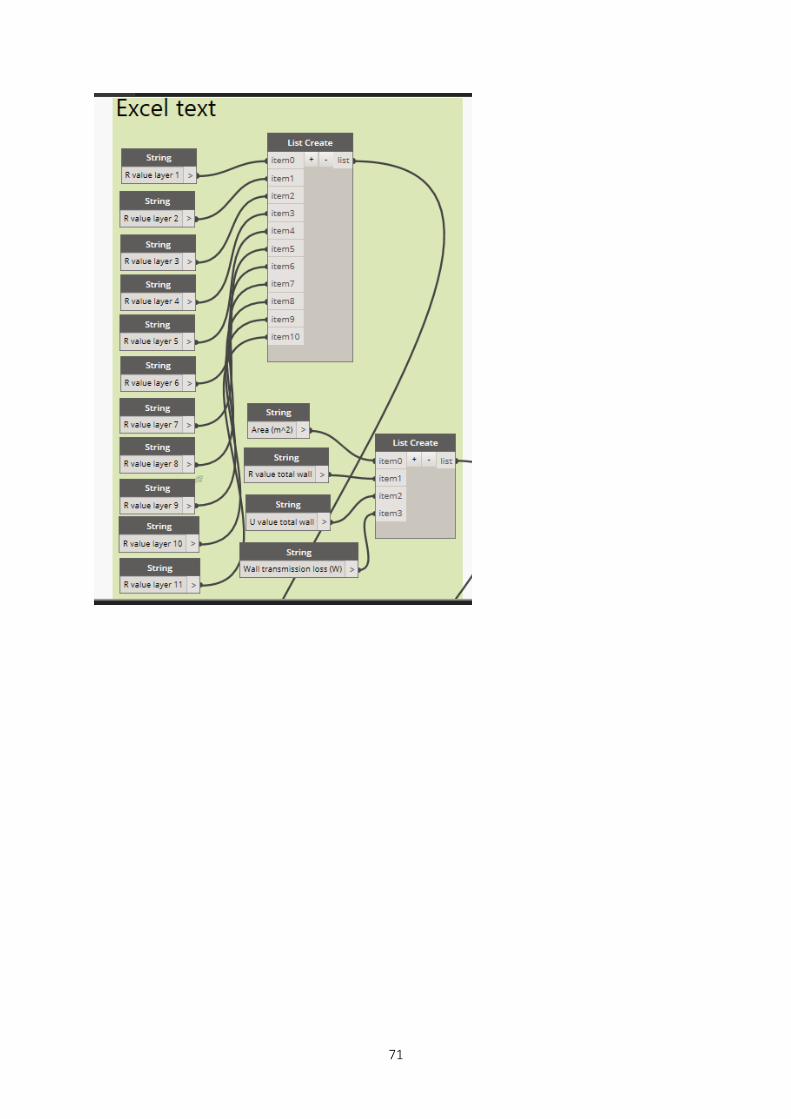
Excel text Group
The excel file is not complete without texts that describes the numbers of the outcomes.
• List Create: This node creates a list with texts that shall be inserted for each row of the cost for each layer.
• String: The inputs for the List Create node are text that describes the name of each layer. For example, “Cost layer 1 (kr)”, “Cost layer 2 (kr)” etc.
• List Create, String: Two similar nodes created for total wall cost and Area.
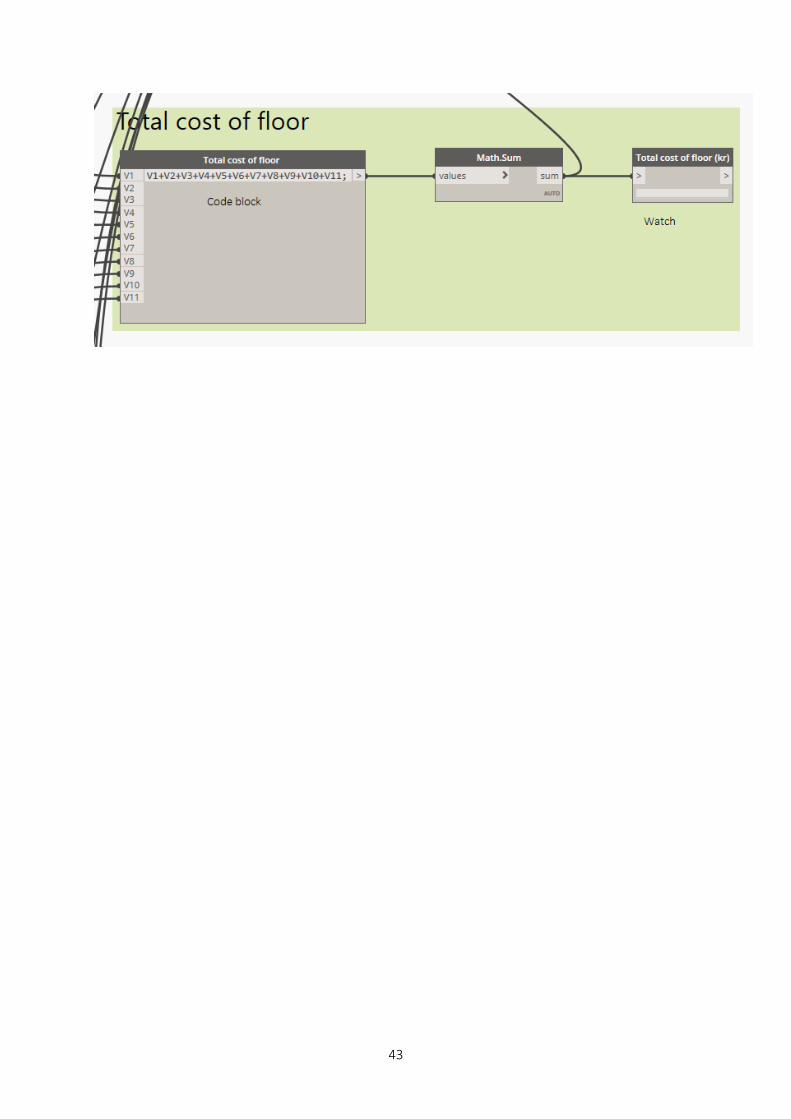
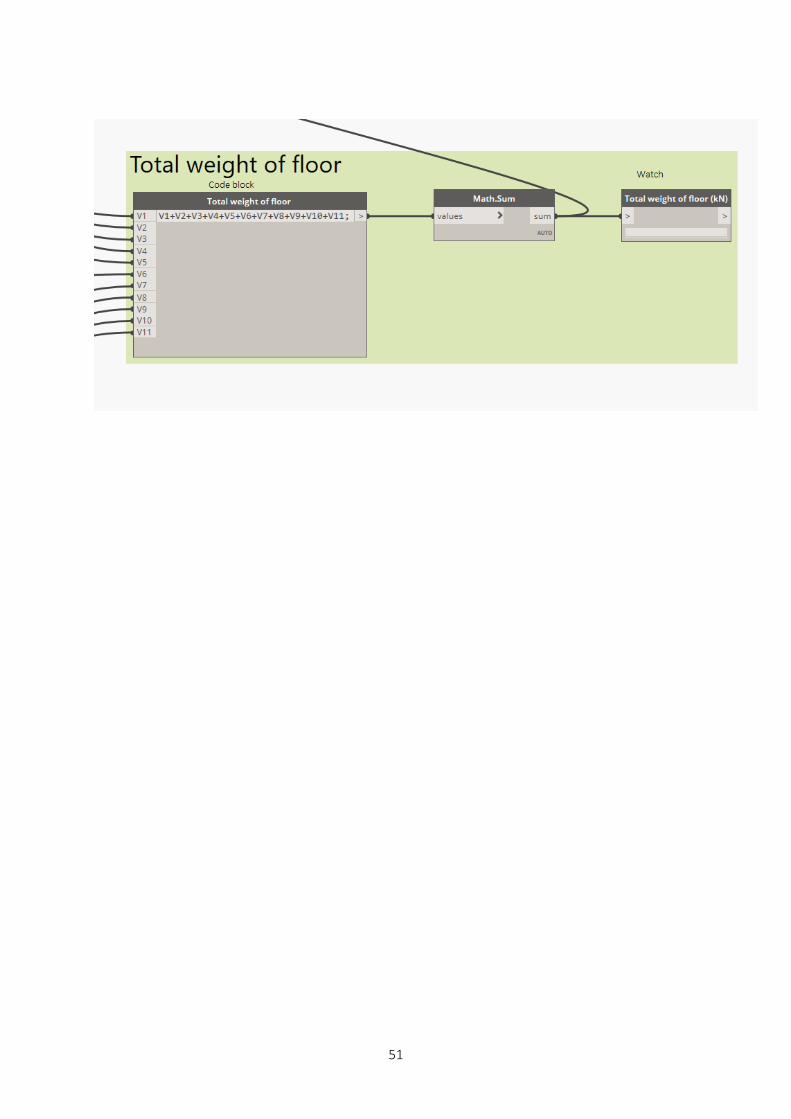
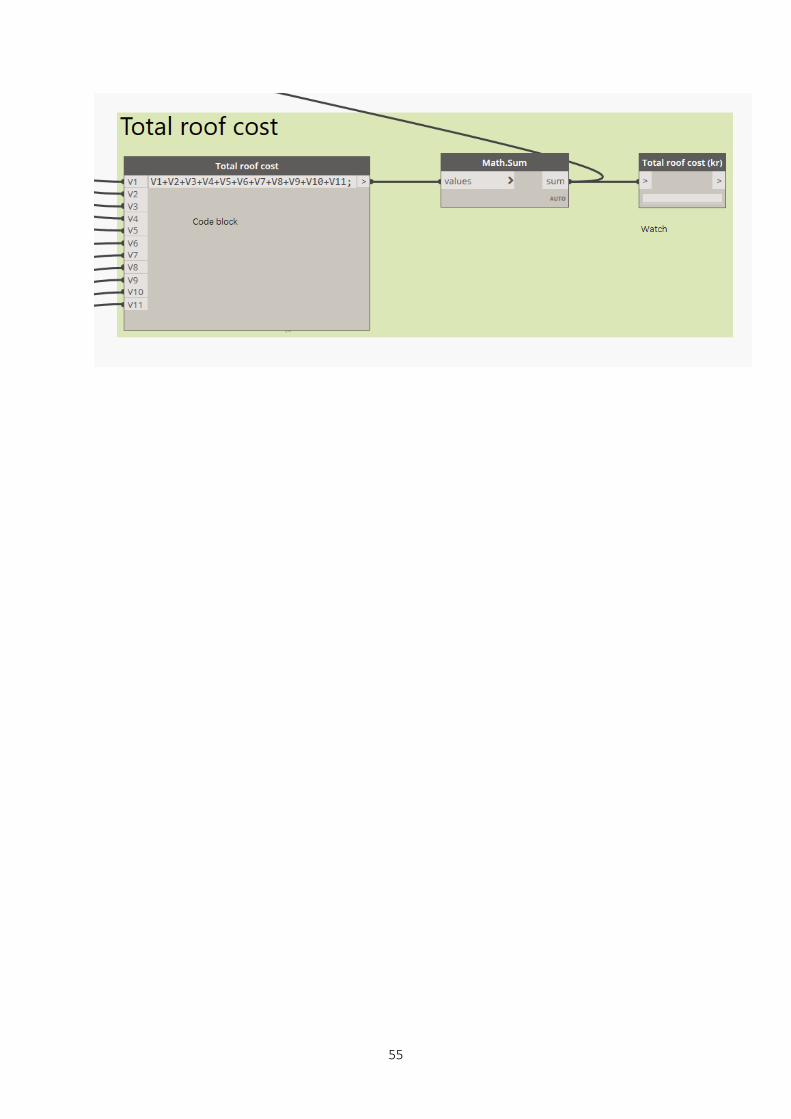
Total wall cost group
The final group is created for the total wall cost. Here the total cost of all layers is added together and displayed.
• Code block: This code block contains the equation for the sum of all the layer costs.
• Math.Sum: Calculates the equation for the code block node.
• Watch: The last node shows the total cost for the entire wall.
3.2.5 Change of analysis outcome
This type of analysis is set for three different outcomes and for three different elements in Revit. The outcomes can be changed. The equations in the code blocks can be changed into any desired outcome. E.g. if one desires to know how much paint the entire building needs, a certain equation can be written in the code blocks that are connected with the total area of the building. Or if one desires to know exactly how much concrete or steel that are needed for the entire building, a node that are connected to the volume of a specific material can be added up to obtain the total volume for that material in the entire building. The contractor then knows exactly how much concrete or steel to purchase before construction. All this can be realized quickly within Dynamo.
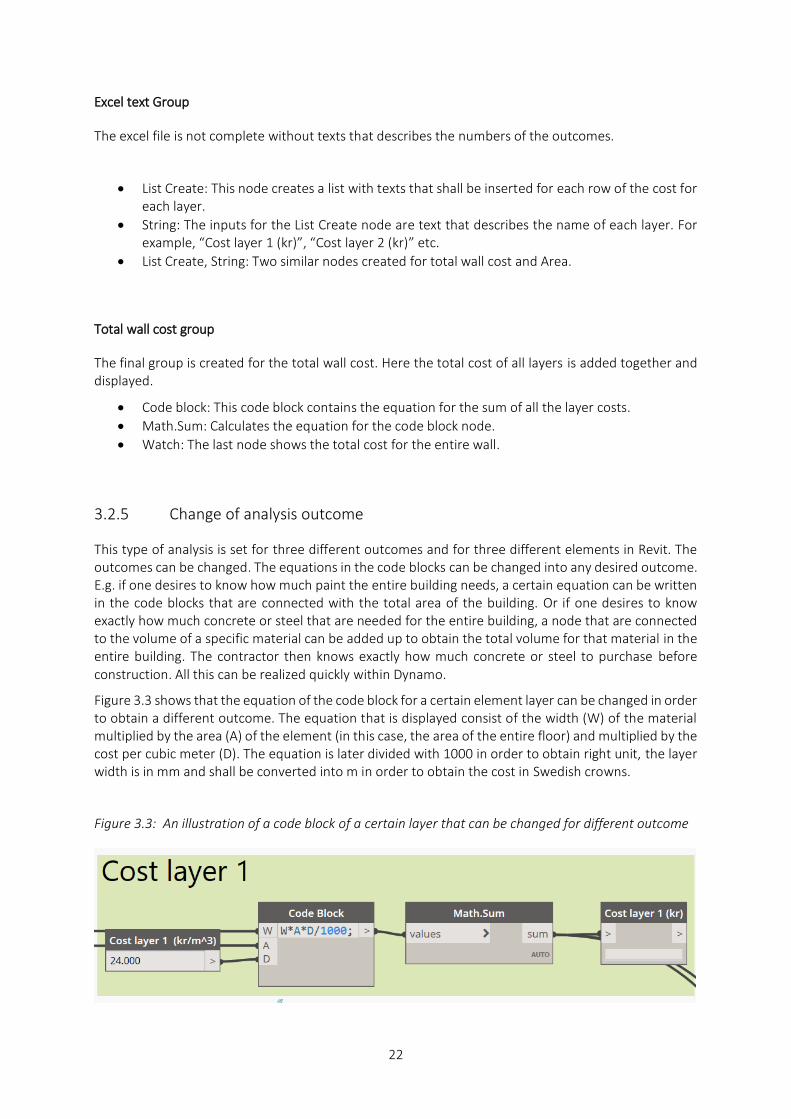
Figure 3.3 shows that the equation of the code block for a certain element layer can be changed in order to obtain a different outcome. The equation that is displayed consist of the width (W) of the material multiplied by the area (A) of the element (in this case, the area of the entire floor) and multiplied by the cost per cubic meter (D). The equation is later divided with 1000 in order to obtain right unit, the layer width is in mm and shall be converted into m in order to obtain the cost in Swedish crowns.
Figure 3.3: An illustration of a code block of a certain layer that can be changed for different outcome
23
3.3 Dynamo player
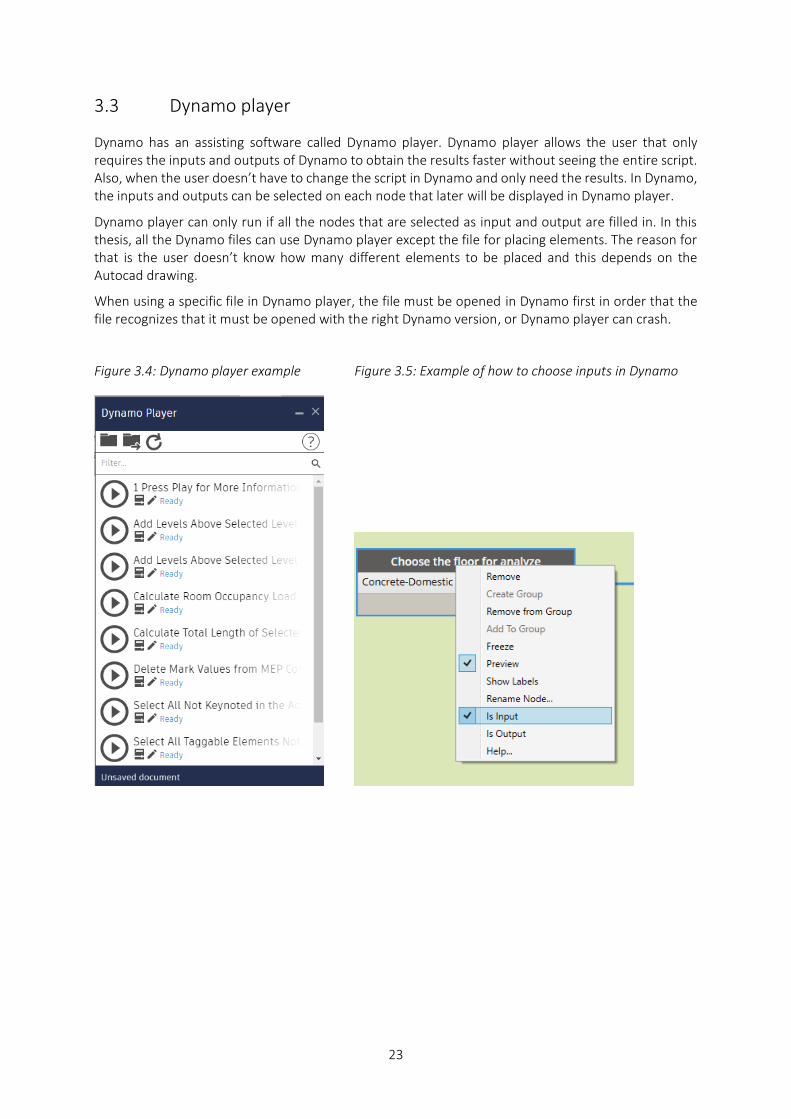
Dynamo has an assisting software called Dynamo player. Dynamo player allows the user that only requires the inputs and outputs of Dynamo to obtain the results faster without seeing the entire script. Also, when the user doesn’t have to change the script in Dynamo and only need the results. In Dynamo, the inputs and outputs can be selected on each node that later will be displayed in Dynamo player.
Dynamo player can only run if all the nodes that are selected as input and output are filled in. In this thesis, all the Dynamo files can use Dynamo player except the file for placing elements. The reason for that is the user doesn’t know how many different elements to be placed and this depends on the Autocad drawing.
When using a specific file in Dynamo player, the file must be opened in Dynamo first in order that the file recognizes that it must be opened with the right Dynamo version, or Dynamo player can crash.
Figure 3.4: Dynamo player example Figure 3.5: Example of how to choose inputs in Dynamo
24
4 Results
The results are best presented in a way that the Dynamo scripts are run in order. Beginning with placing different elements, windows and lastly analyses of the elements. Some scripts are best run with Dynamo player and some with Dynamo. For the analysis part, only the cost analysis of each element is presented, the reason is as mentioned, the analysis for all other outcomes looks similar.
The analysis of the elements can also run without placing the elements script, all the files can work individually, however in this chapter, they will we displayed step by step for the user to have a better understanding of the files.
4.1 Placing elements
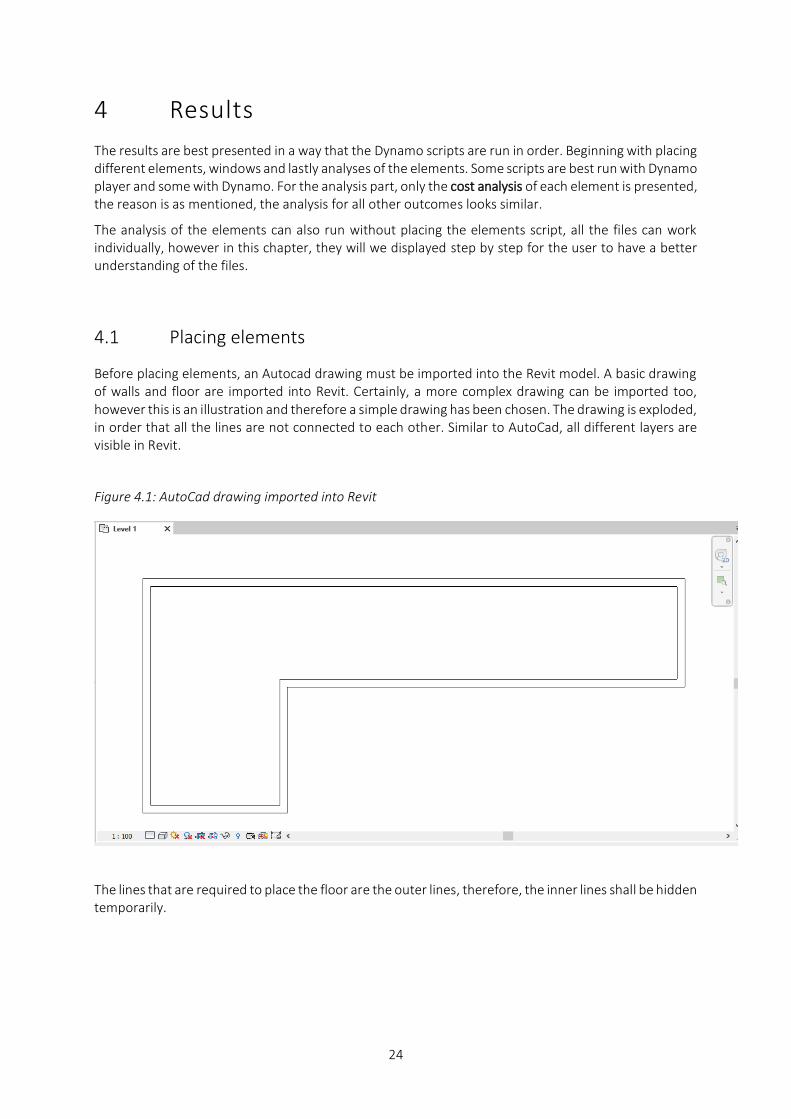
Before placing elements, an Autocad drawing must be imported into the Revit model. A basic drawing of walls and floor are imported into Revit. Certainly, a more complex drawing can be imported too, however this is an illustration and therefore a simple drawing has been chosen. The drawing is exploded, in order that all the lines are not connected to each other. Similar to AutoCad, all different layers are visible in Revit.
Figure 4.1: AutoCad drawing imported into Revit
The lines that are required to place the floor are the outer lines, therefore, the inner lines shall be hidden temporarily.
25
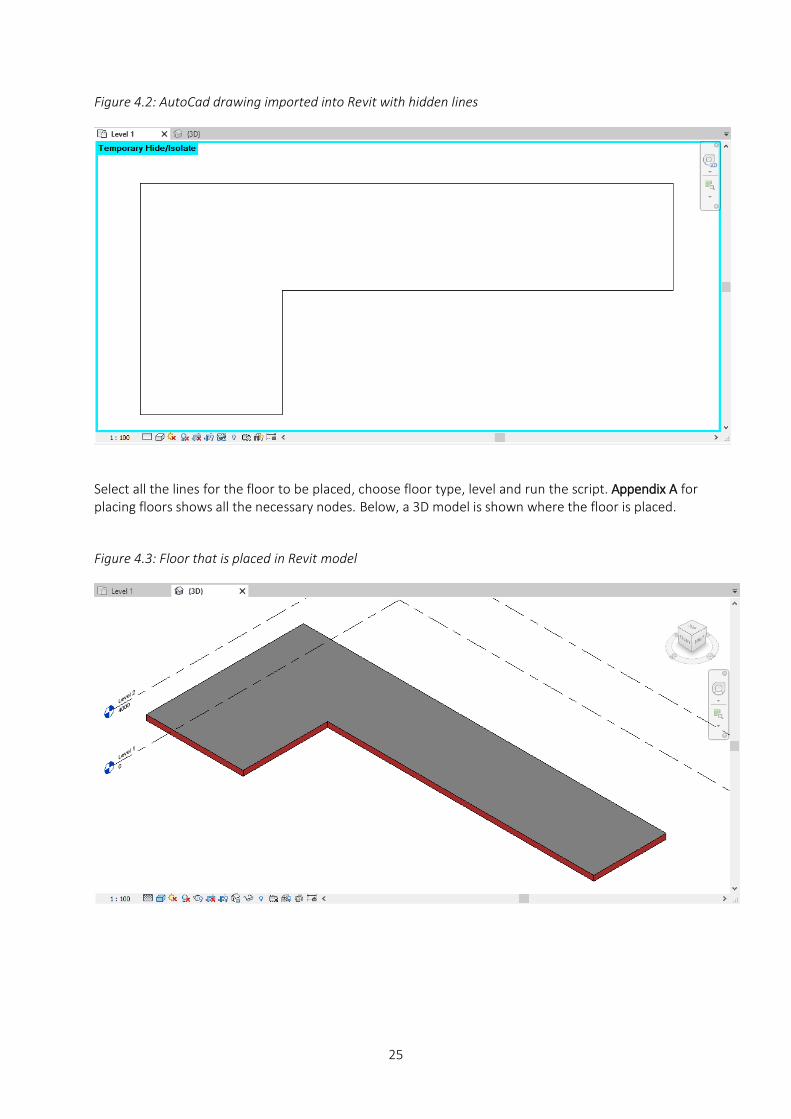
Figure 4.2: AutoCad drawing imported into Revit with hidden lines
Select all the lines for the floor to be placed, choose floor type, level and run the script. Appendix A for placing floors shows all the necessary nodes. Below, a 3D model is shown where the floor is placed.
Figure 4.3: Floor that is placed in Revit model
26
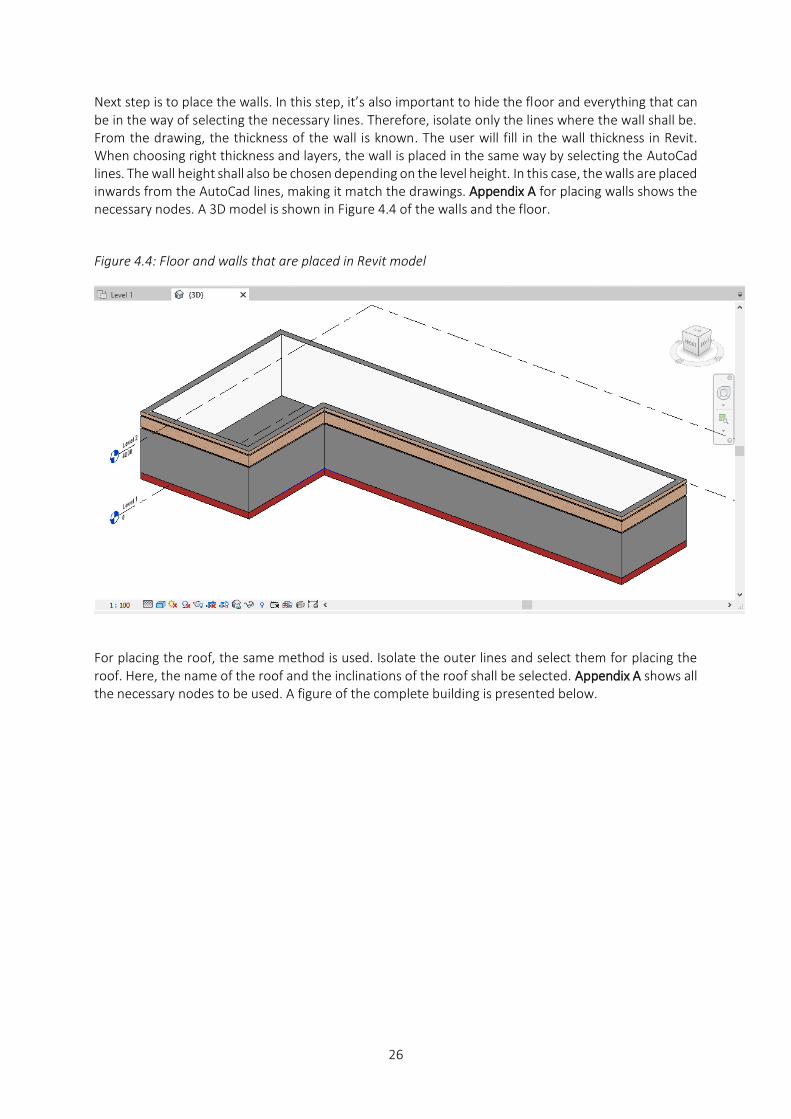
Next step is to place the walls. In this step, it’s also important to hide the floor and everything that can be in the way of selecting the necessary lines. Therefore, isolate only the lines where the wall shall be. From the drawing, the thickness of the wall is known. The user will fill in the wall thickness in Revit. When choosing right thickness and layers, the wall is placed in the same way by selecting the AutoCad lines. The wall height shall also be chosen depending on the level height. In this case, the walls are placed inwards from the AutoCad lines, making it match the drawings. Appendix A for placing walls shows the necessary nodes. A 3D model is shown in Figure 4.4 of the walls and the floor.
Figure 4.4: Floor and walls that are placed in Revit model
For placing the roof, the same method is used. Isolate the outer lines and select them for placing the roof. Here, the name of the roof and the inclinations of the roof shall be selected. Appendix A shows all the necessary nodes to be used. A figure of the complete building is presented below.
27
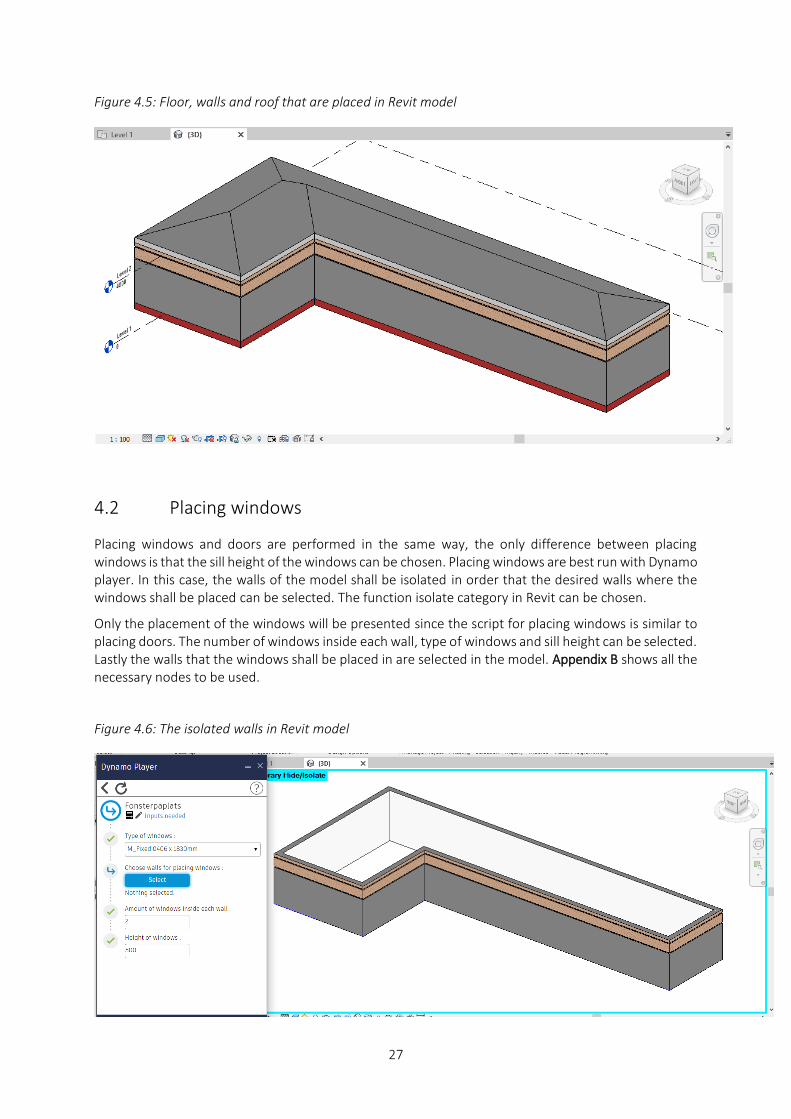
Figure 4.5: Floor, walls and roof that are placed in Revit model
4.2 Placing windows
Placing windows and doors are performed in the same way, the only difference between placing windows is that the sill height of the windows can be chosen. Placing windows are best run with Dynamo player. In this case, the walls of the model shall be isolated in order that the desired walls where the windows shall be placed can be selected. The function isolate category in Revit can be chosen.
Only the placement of the windows will be presented since the script for placing windows is similar to placing doors. The number of windows inside each wall, type of windows and sill height can be selected. Lastly the walls that the windows shall be placed in are selected in the model. Appendix B shows all the necessary nodes to be used.
Figure 4.6: The isolated walls in Revit model
28
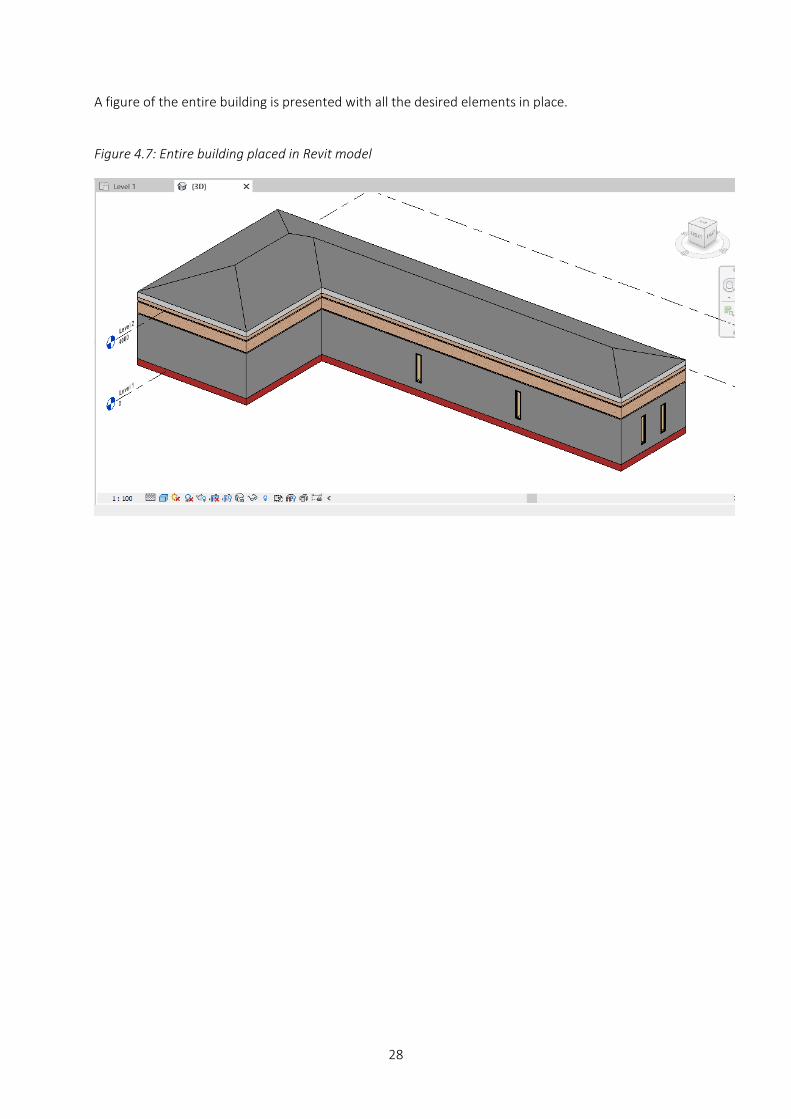
A figure of the entire building is presented with all the desired elements in place.
Figure 4.7: Entire building placed in Revit model
29
4.3 Analysis
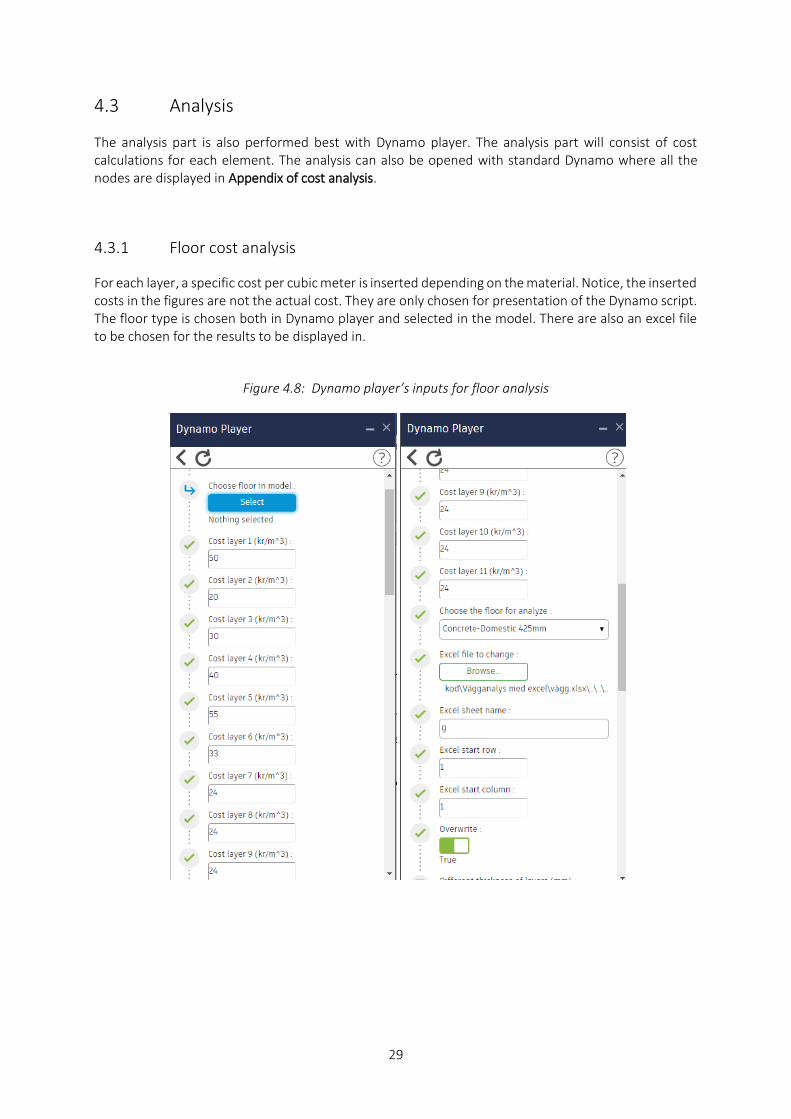
The analysis part is also performed best with Dynamo player. The analysis part will consist of cost calculations for each element. The analysis can also be opened with standard Dynamo where all the nodes are displayed in Appendix of cost analysis.
4.3.1 Floor cost analysis
For each layer, a specific cost per cubic meter is inserted depending on the material. Notice, the inserted costs in the figures are not the actual cost. They are only chosen for presentation of the Dynamo script. The floor type is chosen both in Dynamo player and selected in the model. There are also an excel file to be chosen for the results to be displayed in.
Figure 4.8: Dynamo player’s inputs for floor analysis
30
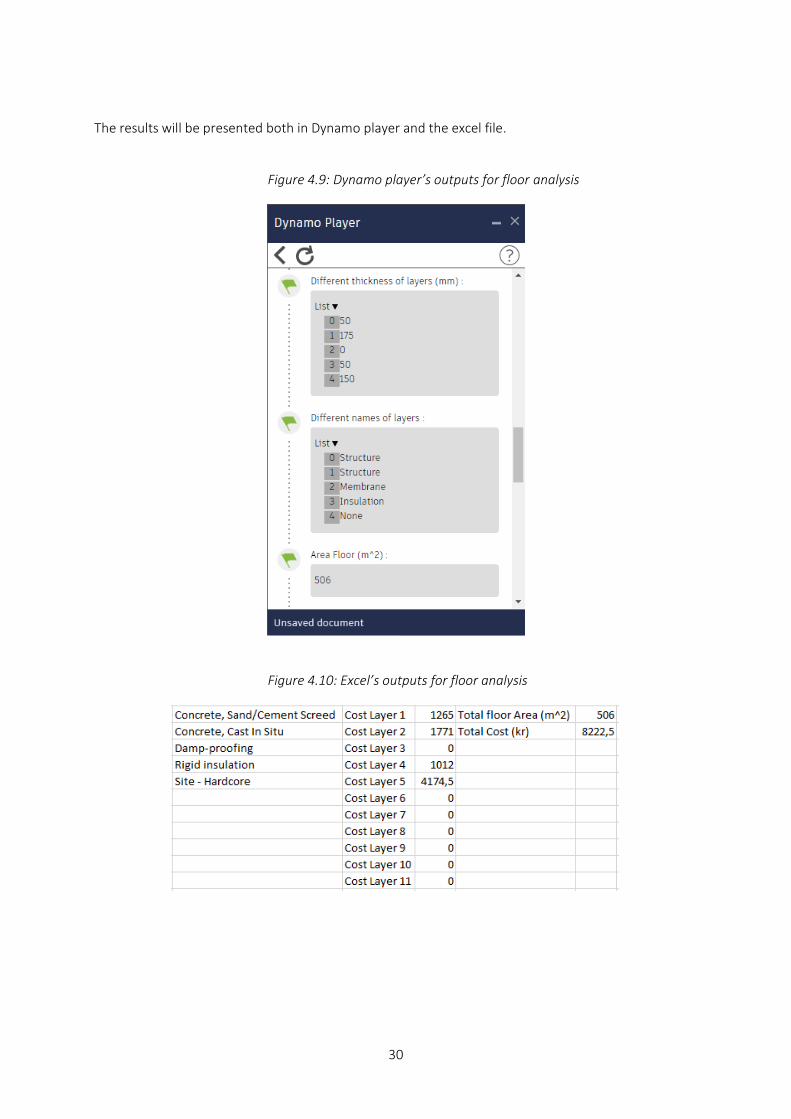
The results will be presented both in Dynamo player and the excel file.
Figure 4.9: Dynamo player’s outputs for floor analysis
Figure 4.10: Excel’s outputs for floor analysis
31
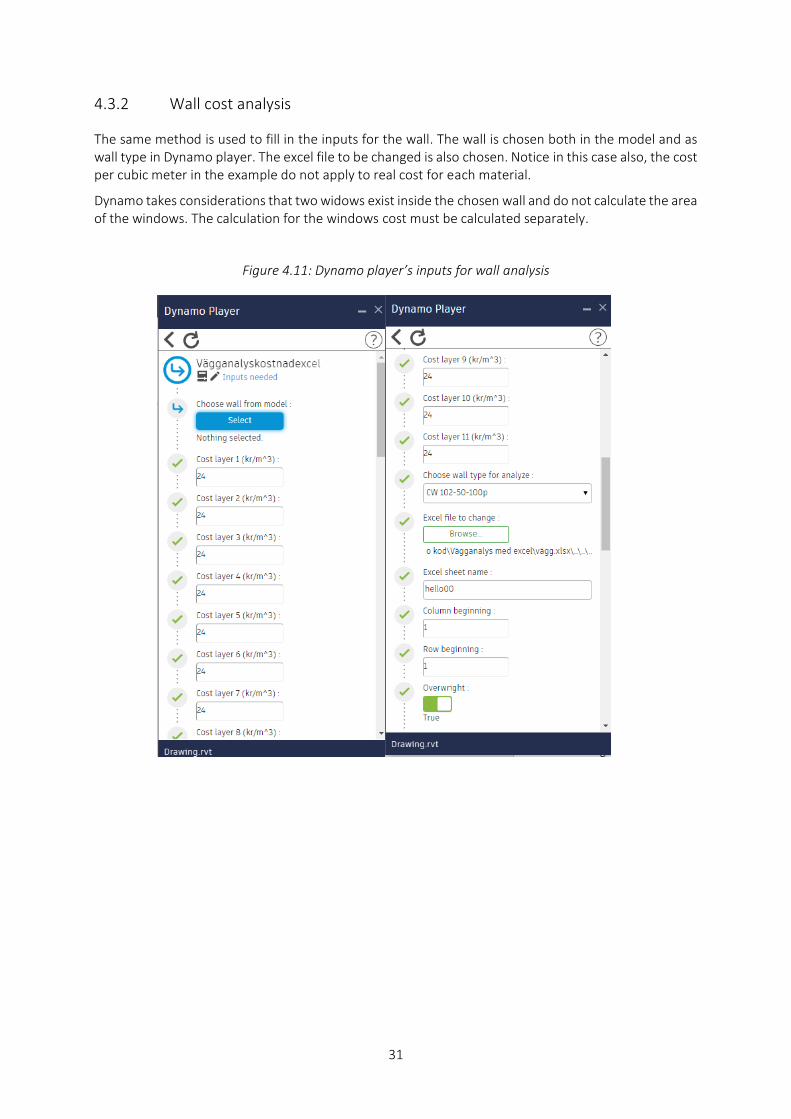
4.3.2 Wall cost analysis
The same method is used to fill in the inputs for the wall. The wall is chosen both in the model and as wall type in Dynamo player. The excel file to be changed is also chosen. Notice in this case also, the cost per cubic meter in the example do not apply to real cost for each material.
Dynamo takes considerations that two widows exist inside the chosen wall and do not calculate the area of the windows. The calculation for the windows cost must be calculated separately.
Figure 4.11: Dynamo player’s inputs for wall analysis
32
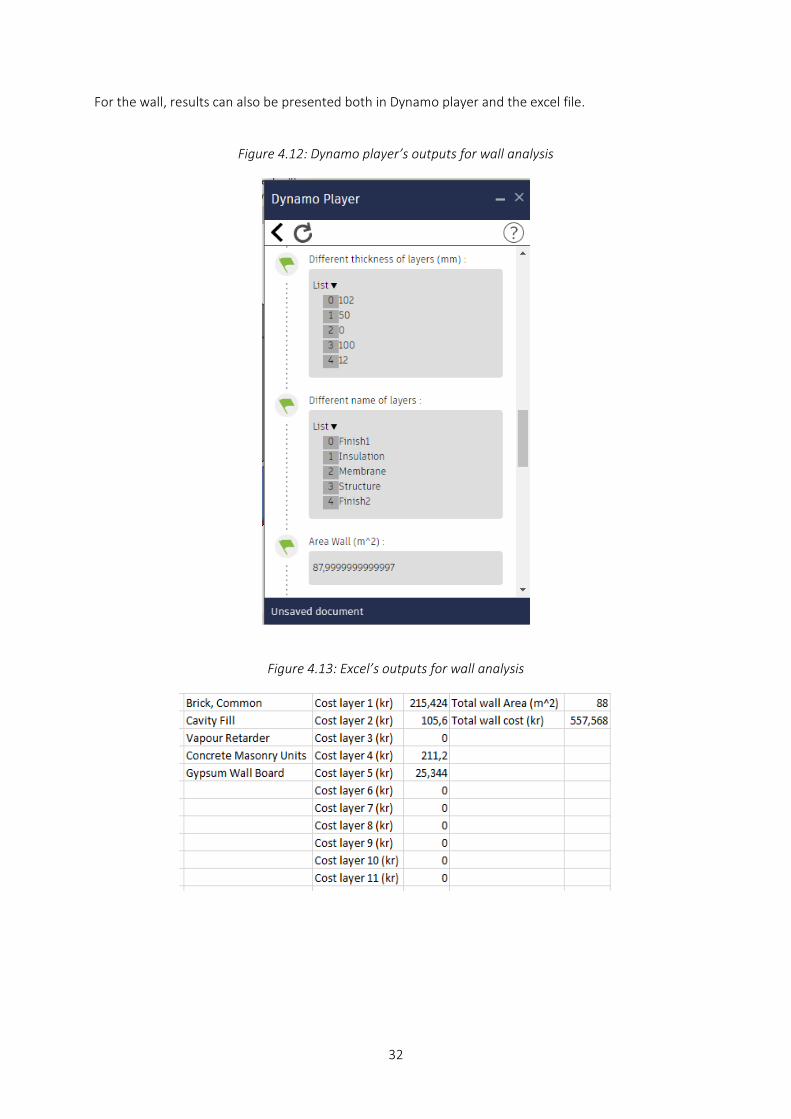
For the wall, results can also be presented both in Dynamo player and the excel file.
Figure 4.12: Dynamo player’s outputs for wall analysis
Figure 4.13: Excel’s outputs for wall analysis
33
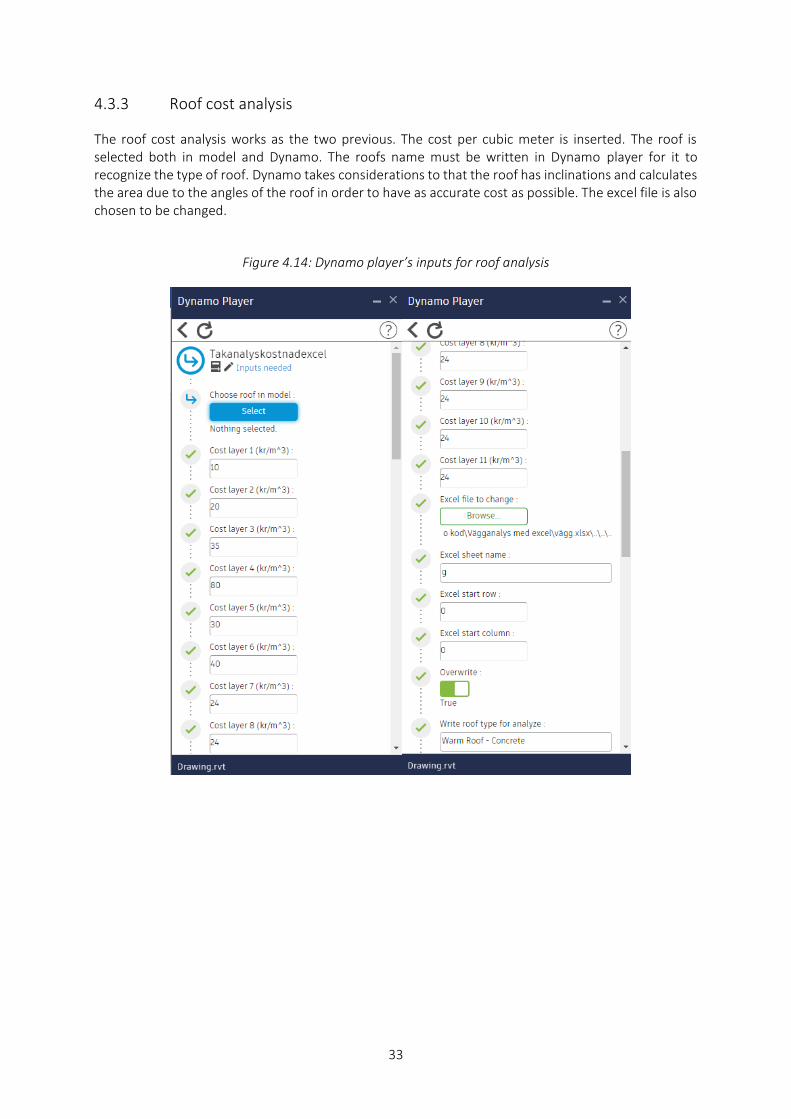
4.3.3 Roof cost analysis
The roof cost analysis works as the two previous. The cost per cubic meter is inserted. The roof is selected both in model and Dynamo. The roofs name must be written in Dynamo player for it to recognize the type of roof. Dynamo takes considerations to that the roof has inclinations and calculates the area due to the angles of the roof in order to have as accurate cost as possible. The excel file is also chosen to be changed.
Figure 4.14: Dynamo player’s inputs for roof analysis
34
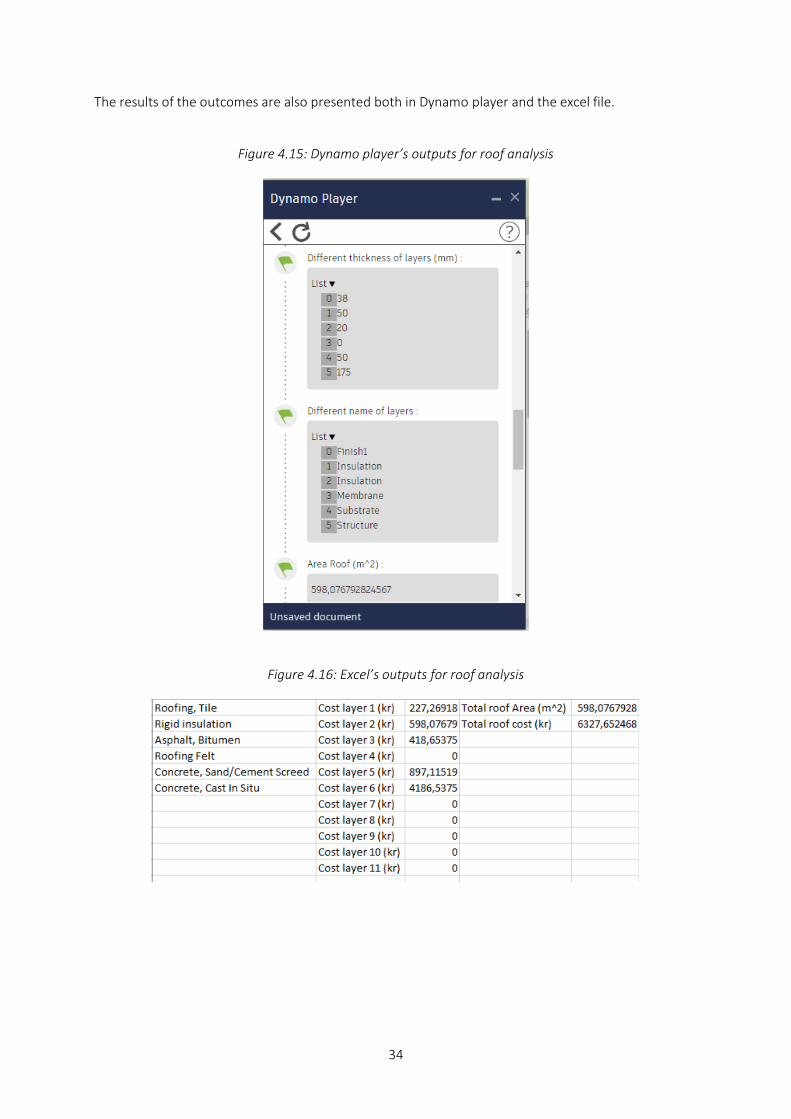
The results of the outcomes are also presented both in Dynamo player and the excel file.
Figure 4.15: Dynamo player’s outputs for roof analysis
Figure 4.16: Excel’s outputs for roof analysis
35
5 Discussion and conclusion
5.1 Conclusion
This thesis regards the usage of Dynamo with Revit and its advantages. The aim for the research has been to get engineers acquainted with Dynamo, to teach the users that elements can easily be placed in Revit with the help of Dynamo and that analysis of elements in Revit can be achieved from Dynamo. The goals of the research were achieved and explained in order that a competent researcher can understand the usage of Dynamo and if necessary, continue with further work of Dynamo. All the results of the analysis have been compared to hand calculations for simple measured elements and they yielded the same results.
5.2 Discussion
With Dynamo one can achieve various tasks depending on the desired outcomes. Even if the goals of this thesis were achieved, another competent researcher can obtain other results and make Dynamo more useful.
One can ask themselves if placing elements in Revit is faster without Dynamo. In some cases, the answer might be yes. For smaller tasks, it’s easier to place elements in Revit only. However, Dynamo is made for automatization and can carry out several tasks at the same time. Also, one can ask themselves about the necessity of isolating and hiding elements before placing elements. If those tasks require more time than just placing the elements in Revit. This is debatable since in some cases, it would be faster with Revit only and some cases with Dynamo. The important goal of this thesis was to make engineers familiar with the usage of Dynamo since there are various other tasks that also can be achieved with Dynamo.
The analysis part can be obtained by other softwares too, however if one can obtain the same results in Revit and Dynamo only without using other softwares, it would simplify several tasks. The equations in the code blocks can be manipulated for almost every desired outcome. In this case, only three outcomes where shown however, another student or engineer could change the equations as desired.
This thesis will hopefully help students or engineer to make the design part easier with all the Dynamo scrips that were created for this research and make other engineers to use Dynamo more for simplification of Revit.
5.3 Further work with Dynamo
Since there are various possibilities with Dynamo, one can continue from this thesis and develop other Dynamo scrips. One of the goals of this thesis was to get engineers acquainted with Dynamo. Now that Dynamo is available in the market and many constructions companies has started to use it, engineers can develop more powerful scrips. This thesis will hopefully benefit more parts of the building sector than just the engineers.

36
6 Sources
Finances online, Best 20 Building Information Modeling (BIM) Software in 2018, https://financesonline.com/building-information-modeling/, 2018
Autodesk, Vad är BIM?, https://www.autodesk.se/solutions/building-information-modeling/overview, 2018
Tekla, Vad är BIM?, https://www.tekla.com/se/om-oss/vad-ar-bim, 2018
National BIM standard, WHAT IS A BIM?, http://www.nationalbimstandard.org/faqs#faq1, 2018
Modelling multiple views on buildings, BIM published, G.A.van Nederveenab, F.P.Tolman, 1992
Dynamo BIM, About Dynamo, http://primer.dynamobim.org/en/index.html, 2018
APIs for Dummies, Dennis Ashby, Claus T.Jensen, Chapter 1: introducing APIs, 2018
Modelical, DATA HIERARCHY CONFIGURATION IN REVIT, https://www.modelical.com/en/gdocs/revit-data-hierarchy/, 2016
BIM alliance, Fyra kriterier ska vara uppfyllda för användning av begreppet BIM, https://www.bimalliance.se/vad-aer-bim/bim-alliance-om-bim/, 2017
Lifewire, How to Open, Edit, & Convert IFC Files, https://www.lifewire.com/ifc-file-2621820, 2018
Arch smarter, What Is Dynamo and 5 Reasons You Should be Using It, https://archsmarter.com/what-is-dynamo-revit/ ,2018
IBM Developer, What is an API? and What is the API Economy?, https://developer.ibm.com/apiconnect/2018/01/04/api-api-economy/, 2018
Dynamo forum, https://forum.dynamobim.com/, 2018
freeCodeCamp, How to explain object-oriented programming concepts to a 6-year-old, https://medium.freecodecamp.org/object-oriented-programming-concepts-21bb035f7260, 2018
Parametric camp, WHAT IS PARAMETRIC DESIGN?, http://www.parametriccamp.com/en/what-is-parametric-design/, 2018
37
7 Appendix
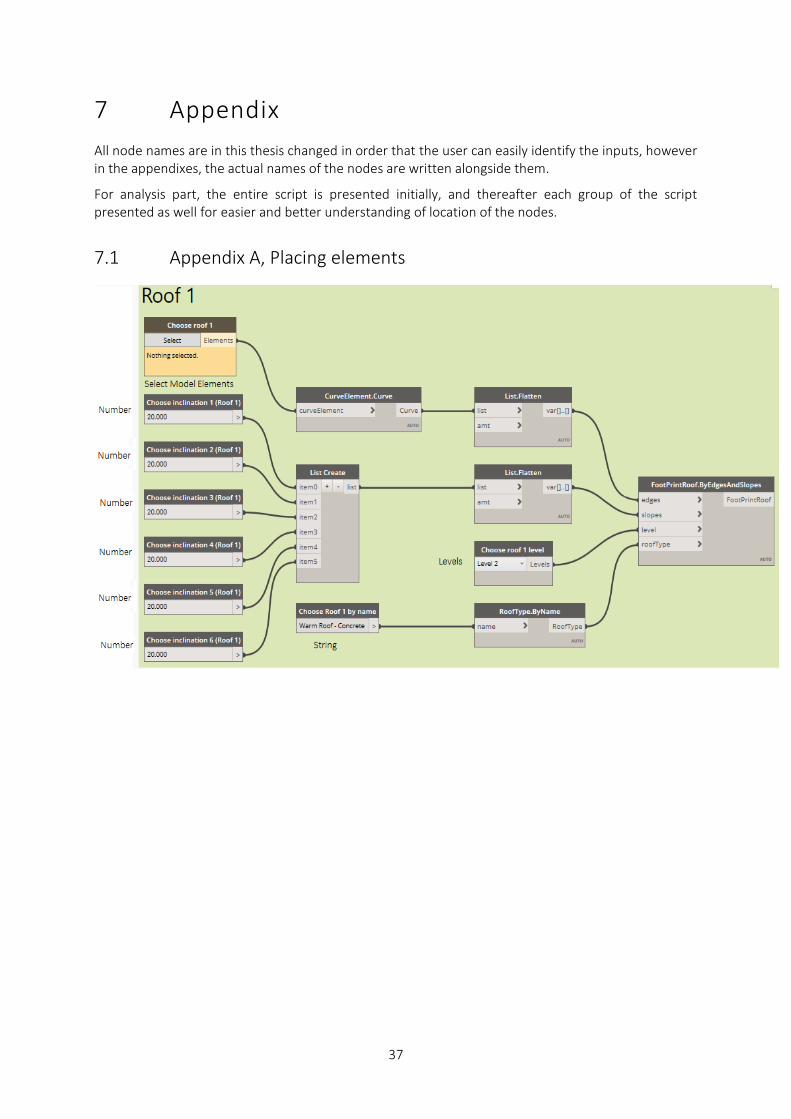
All node names are in this thesis changed in order that the user can easily identify the inputs, however in the appendixes, the actual names of the nodes are written alongside them.
For analysis part, the entire script is presented initially, and thereafter each group of the script presented as well for easier and better understanding of location of the nodes.
7.1 Appendix A, Placing elements
38
39
7.2 Appendix B, Placing windows and doors
40
7.3 Floor analysis
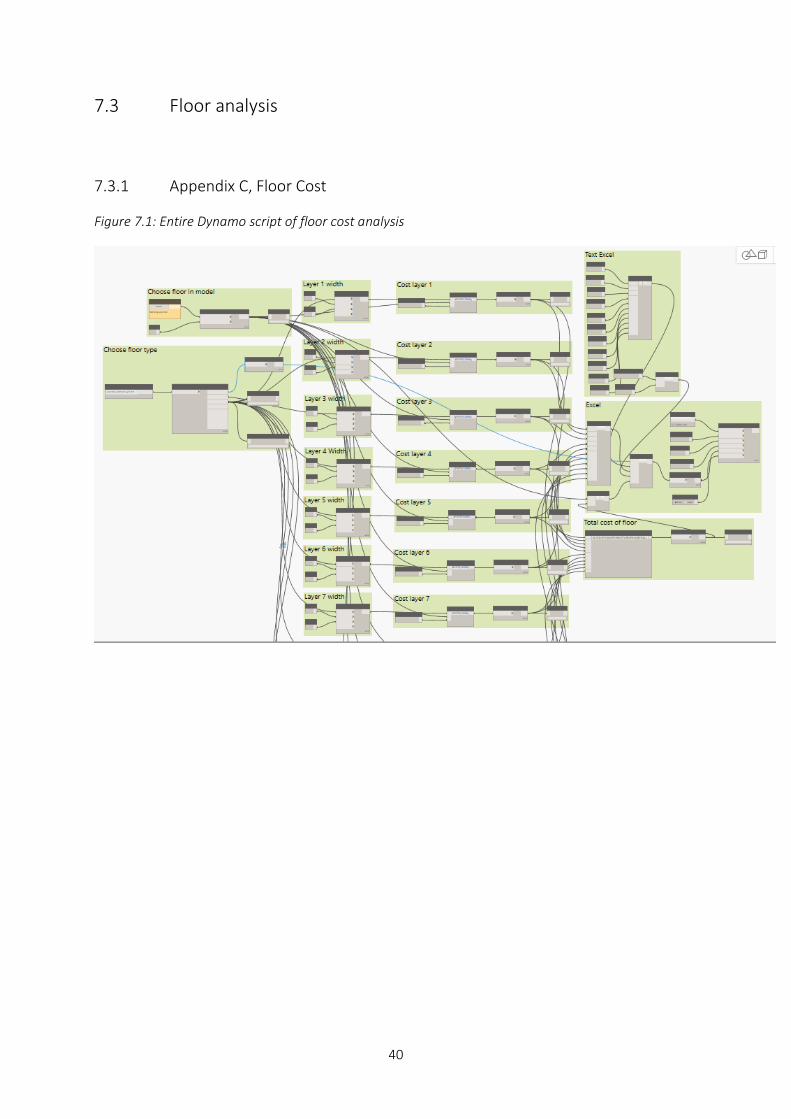
7.3.1 Appendix C, Floor Cost
Figure 7.1: Entire Dynamo script of floor cost analysis
41
42
43
44
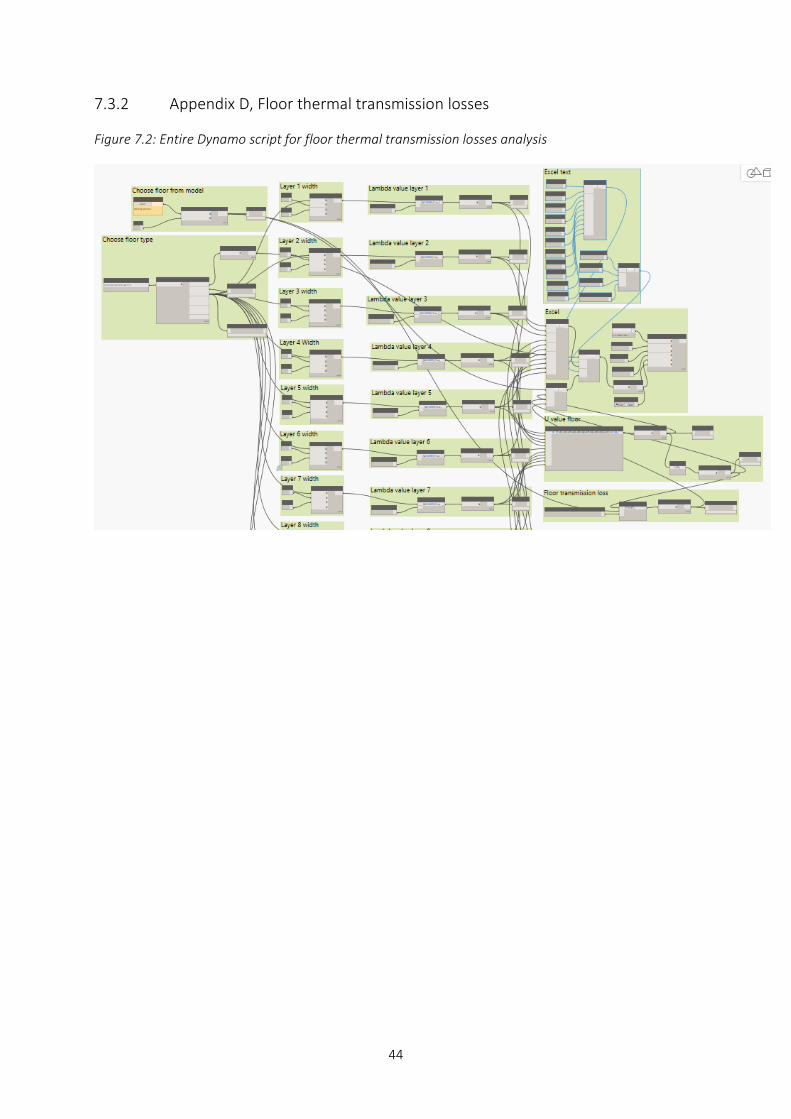
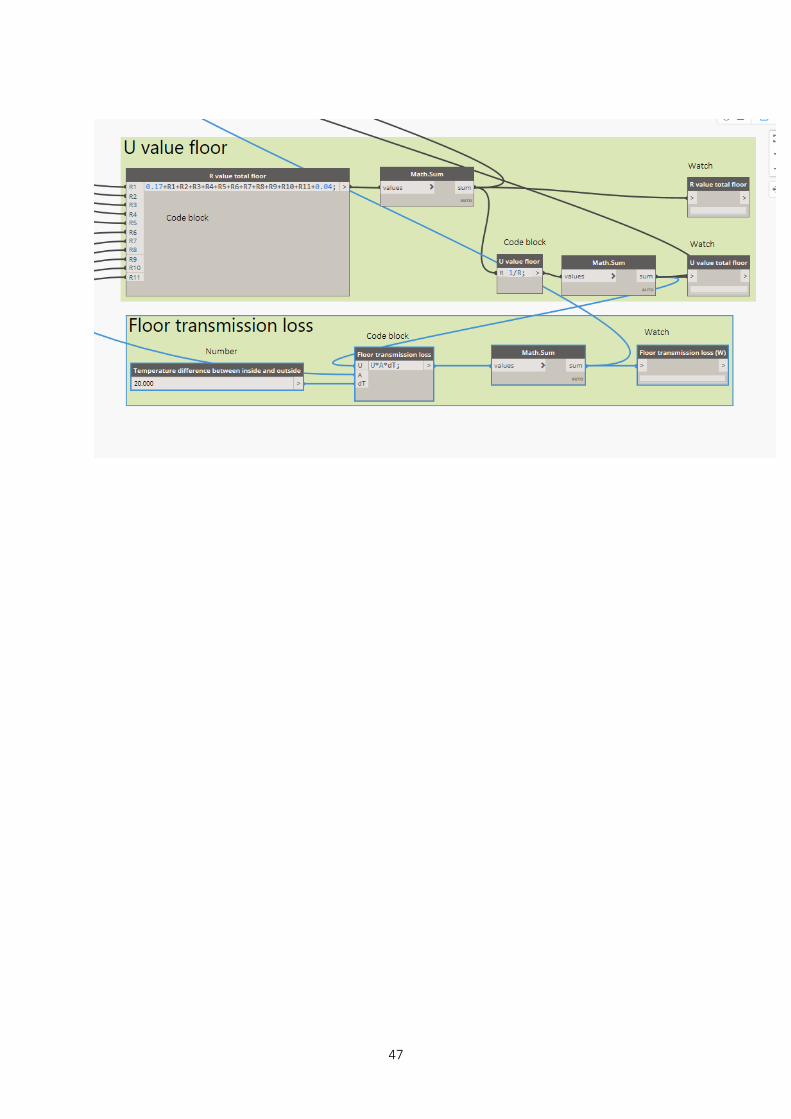
7.3.2 Appendix D, Floor thermal transmission losses
Figure 7.2: Entire Dynamo script for floor thermal transmission losses analysis
45

46
47
48
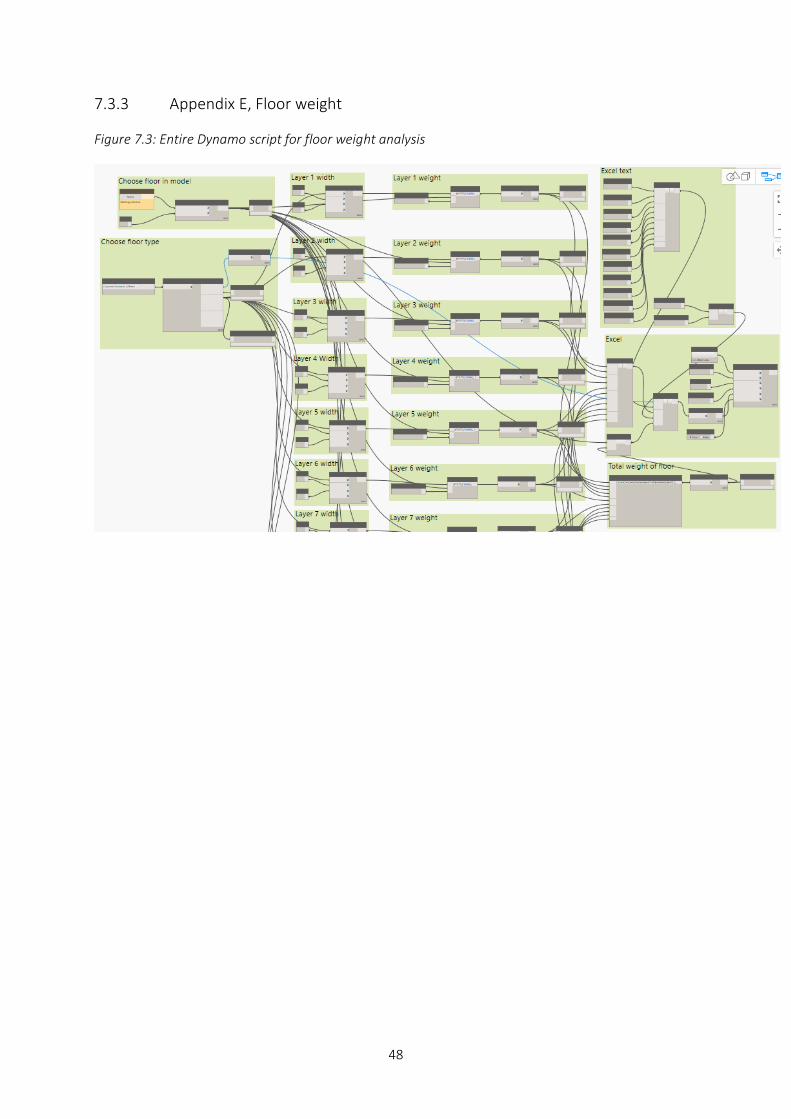
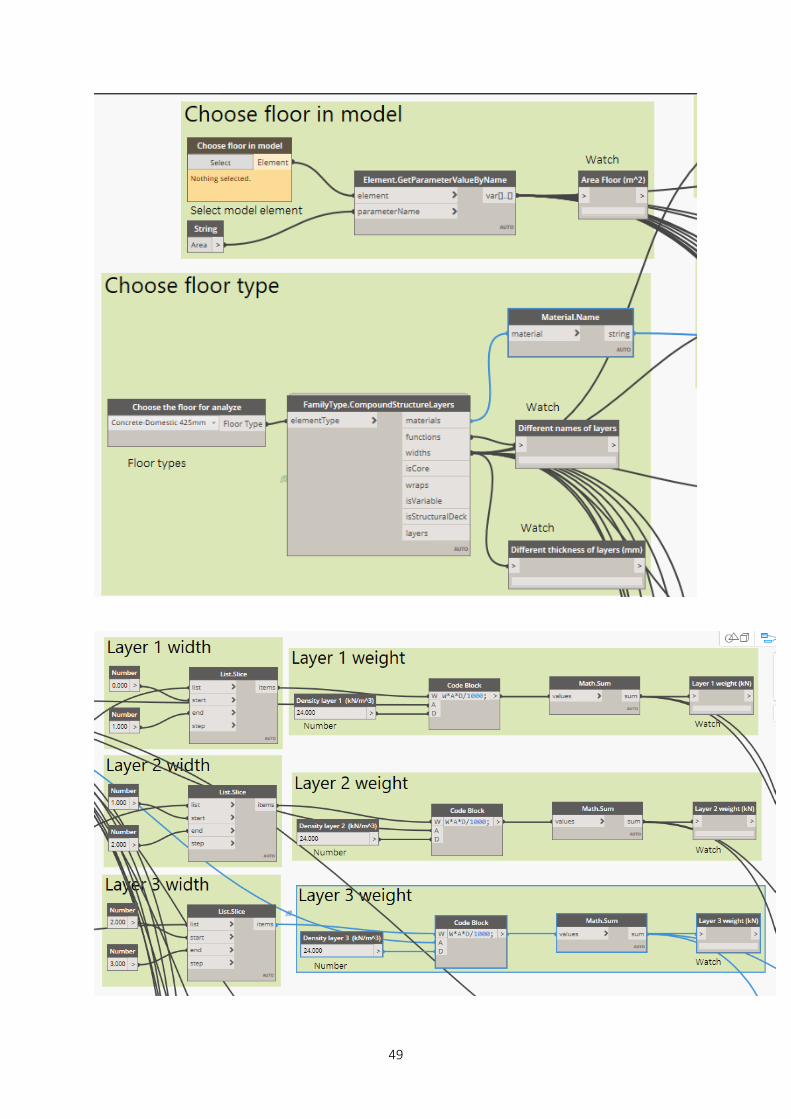
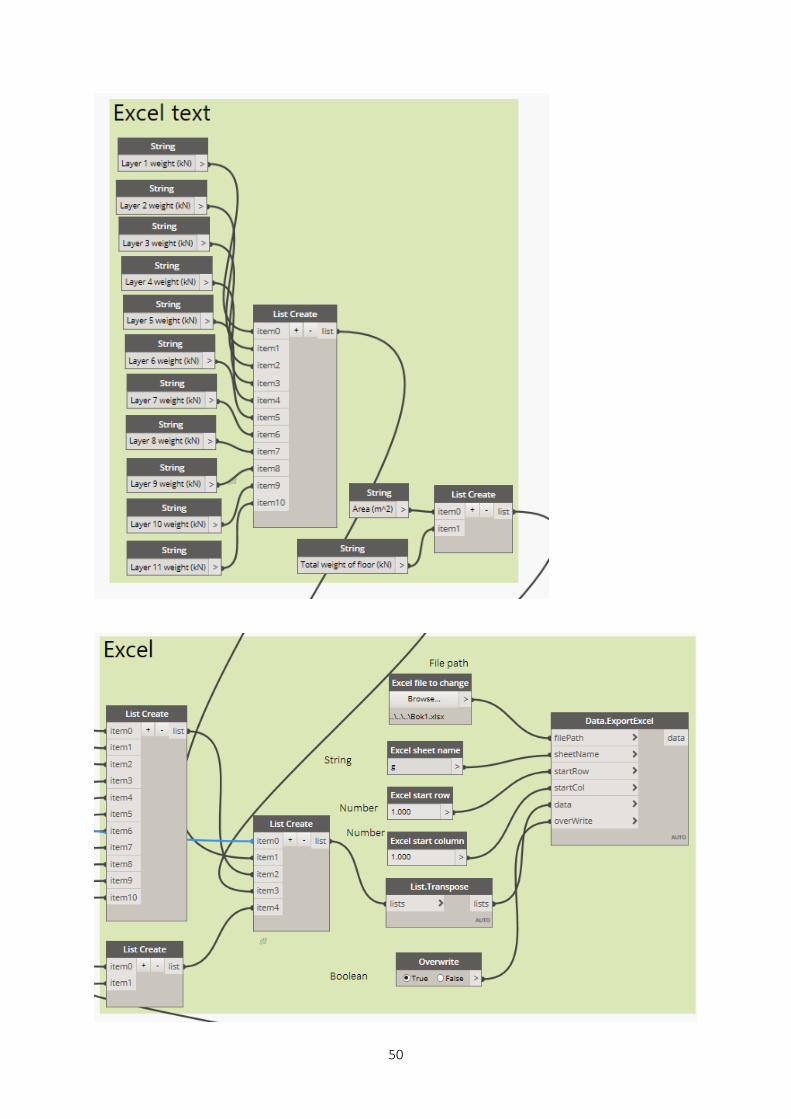
7.3.3 Appendix E, Floor weight
Figure 7.3: Entire Dynamo script for floor weight analysis
49
50
51
52
7.4 Roof analysis
7.4.1 Appendix F, Roof cost
Figure 7.4: Entire Dynamo script for roof cost analysis
53
54
55
56
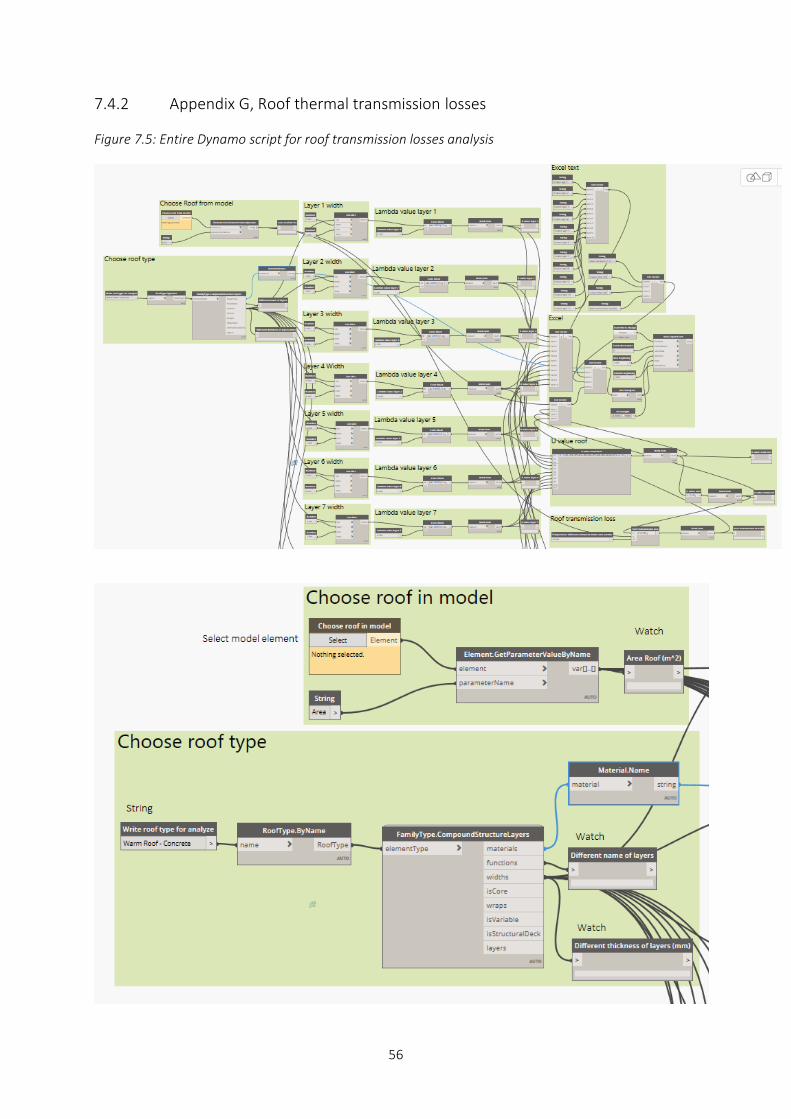
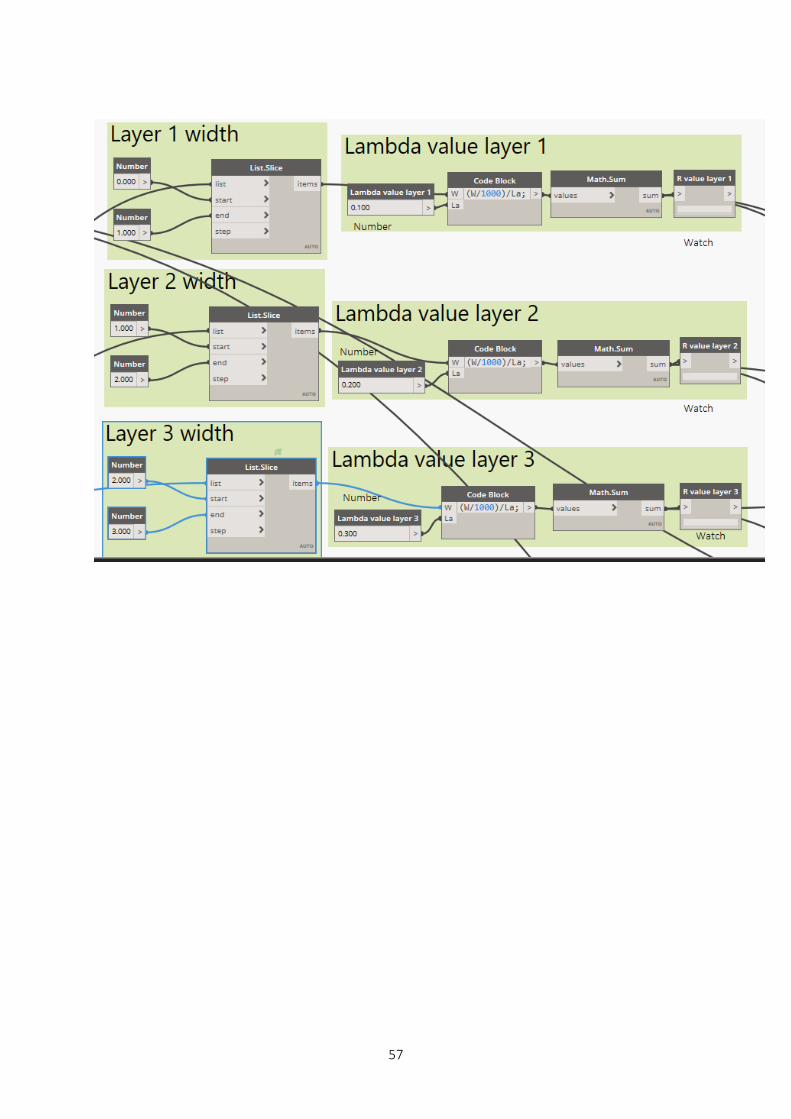
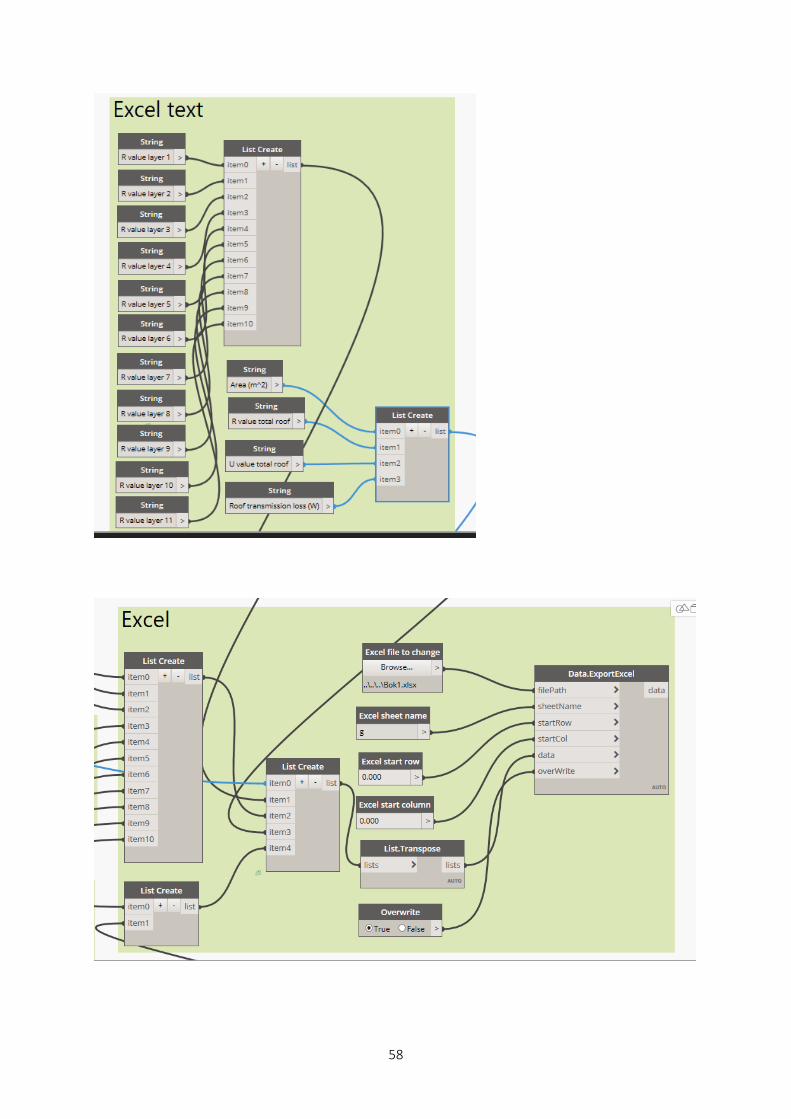
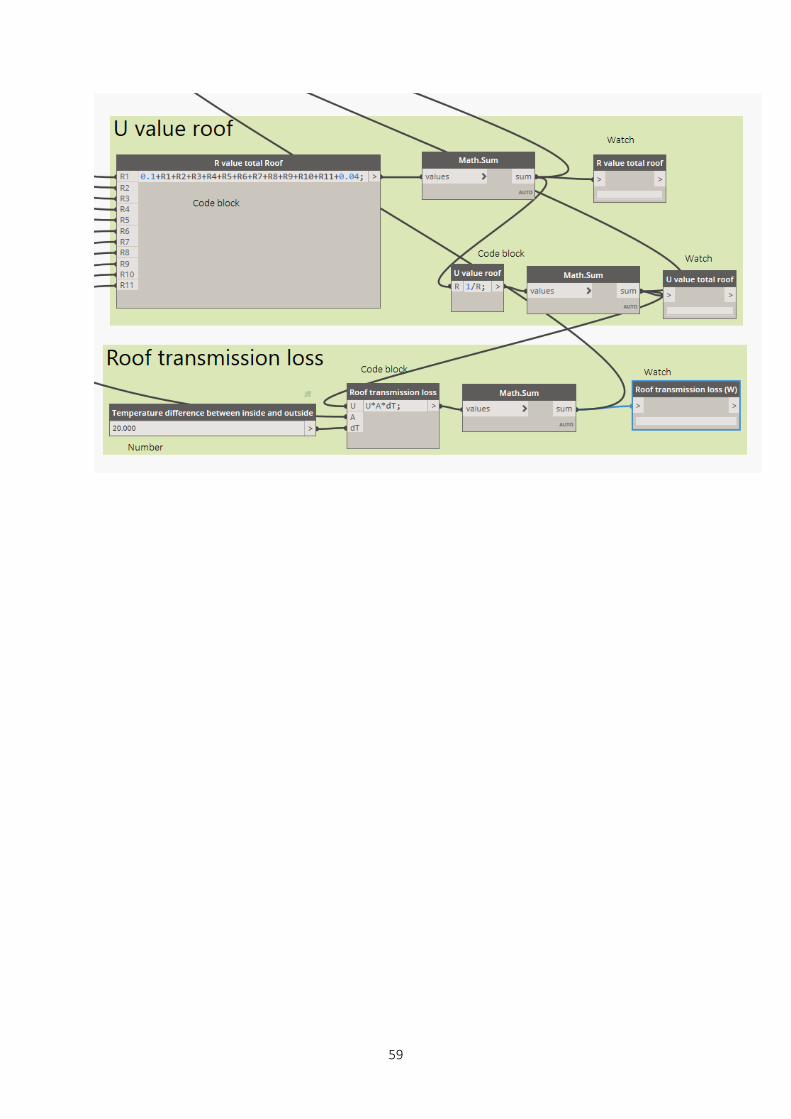
7.4.2 Appendix G, Roof thermal transmission losses
Figure 7.5: Entire Dynamo script for roof transmission losses analysis
57
58
59
60
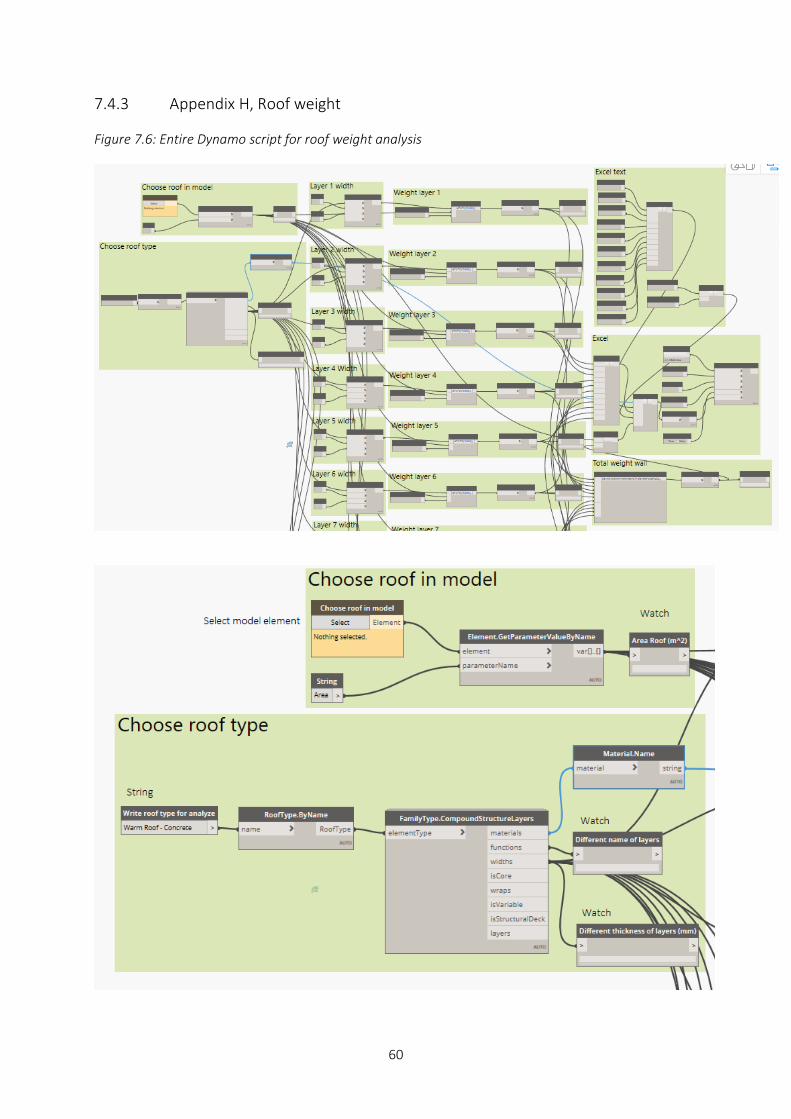
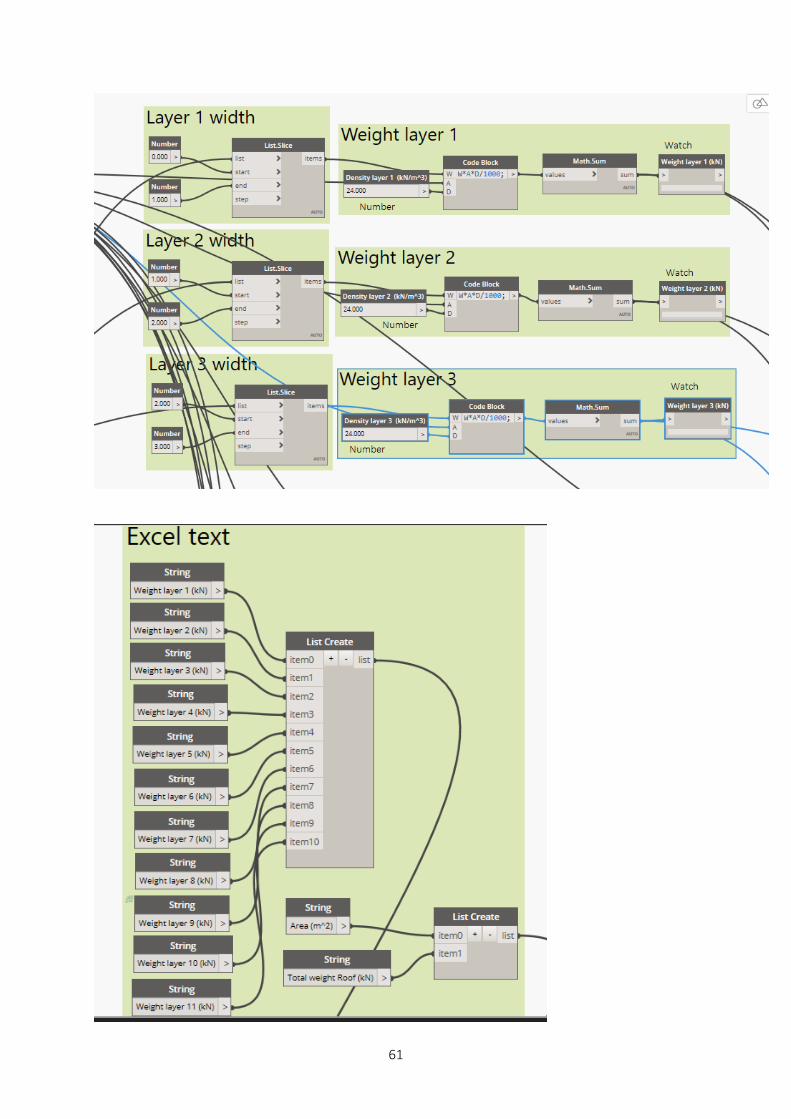
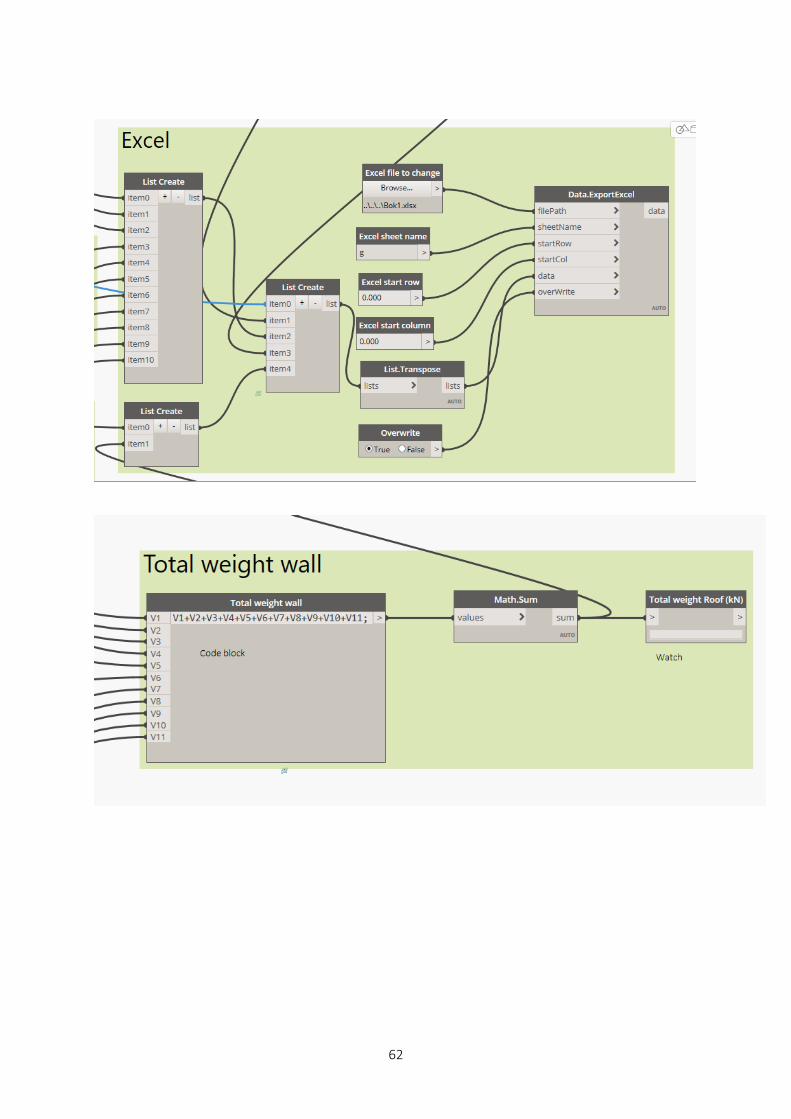
7.4.3 Appendix H, Roof weight
Figure 7.6: Entire Dynamo script for roof weight analysis
61
62
63
7.5 Wall analysis
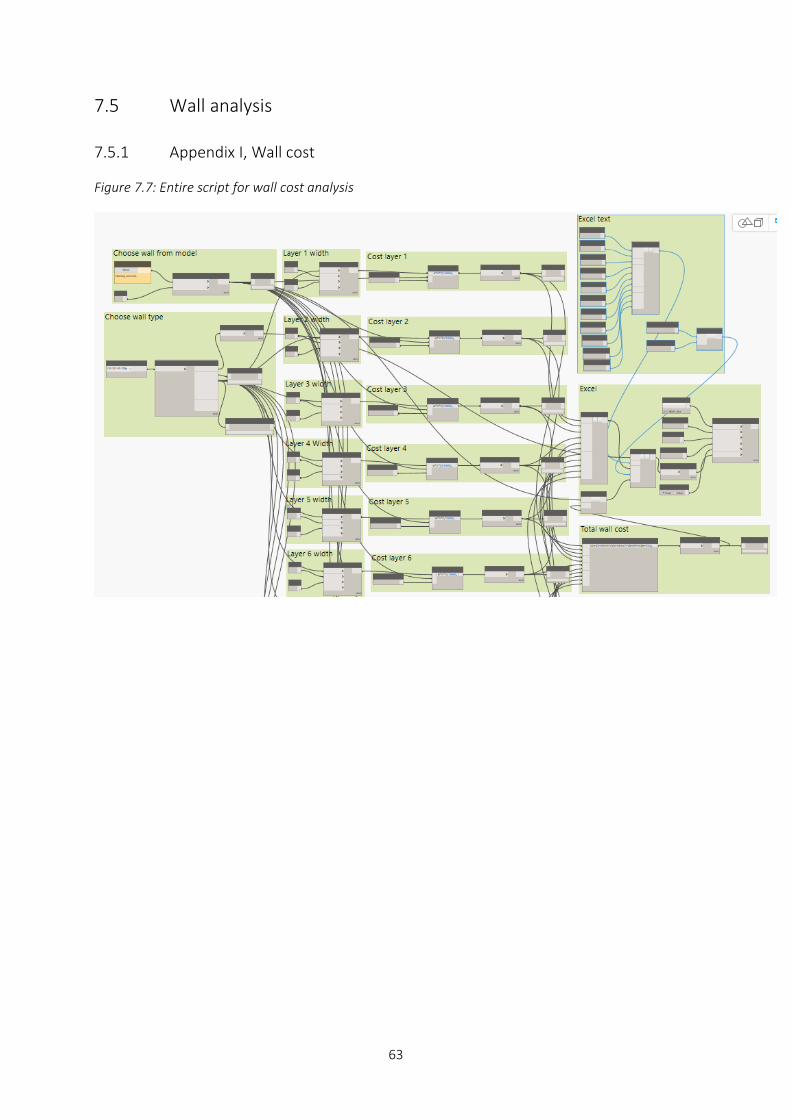
7.5.1 Appendix I, Wall cost
Figure 7.7: Entire script for wall cost analysis

64
65
66
67
68
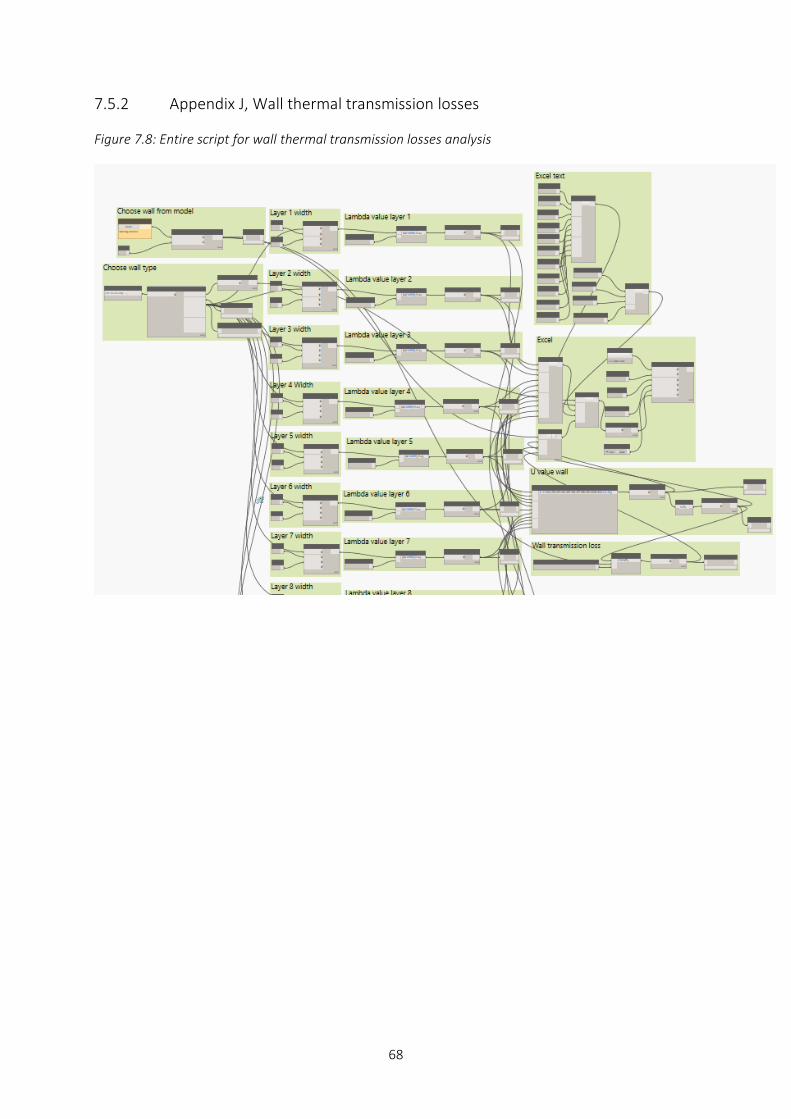
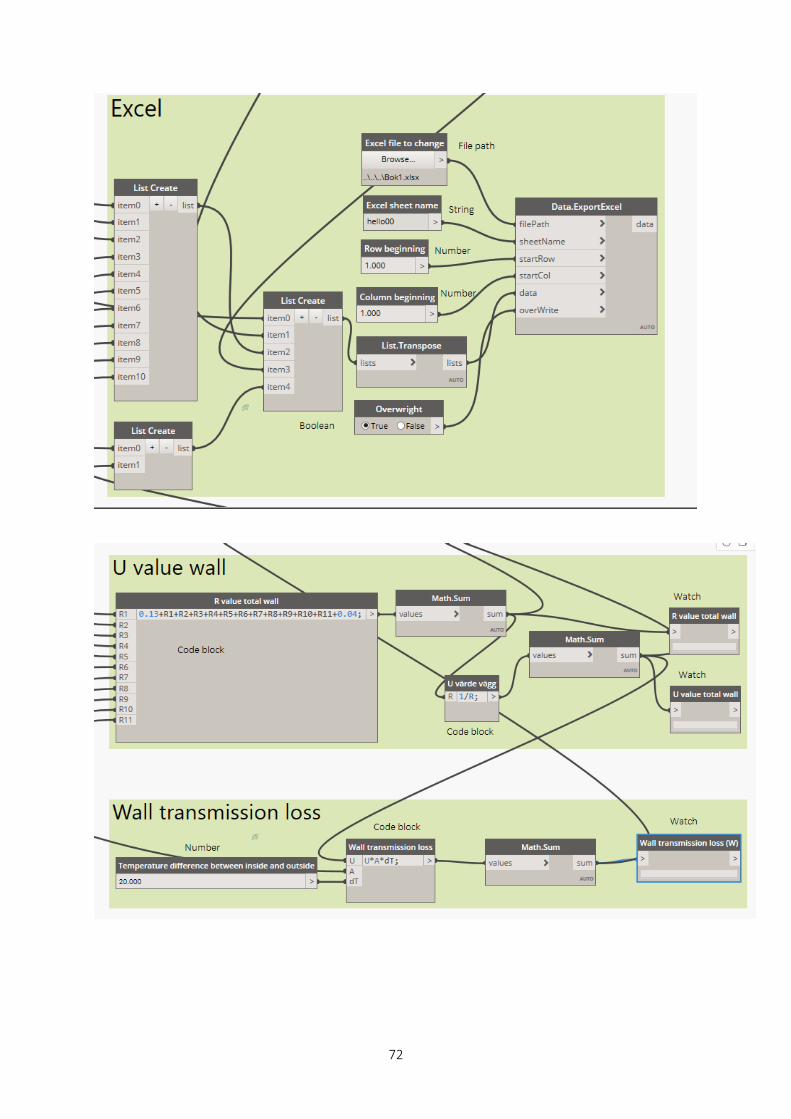
7.5.2 Appendix J, Wall thermal transmission losses
Figure 7.8: Entire script for wall thermal transmission losses analysis
69
70
71
72
73
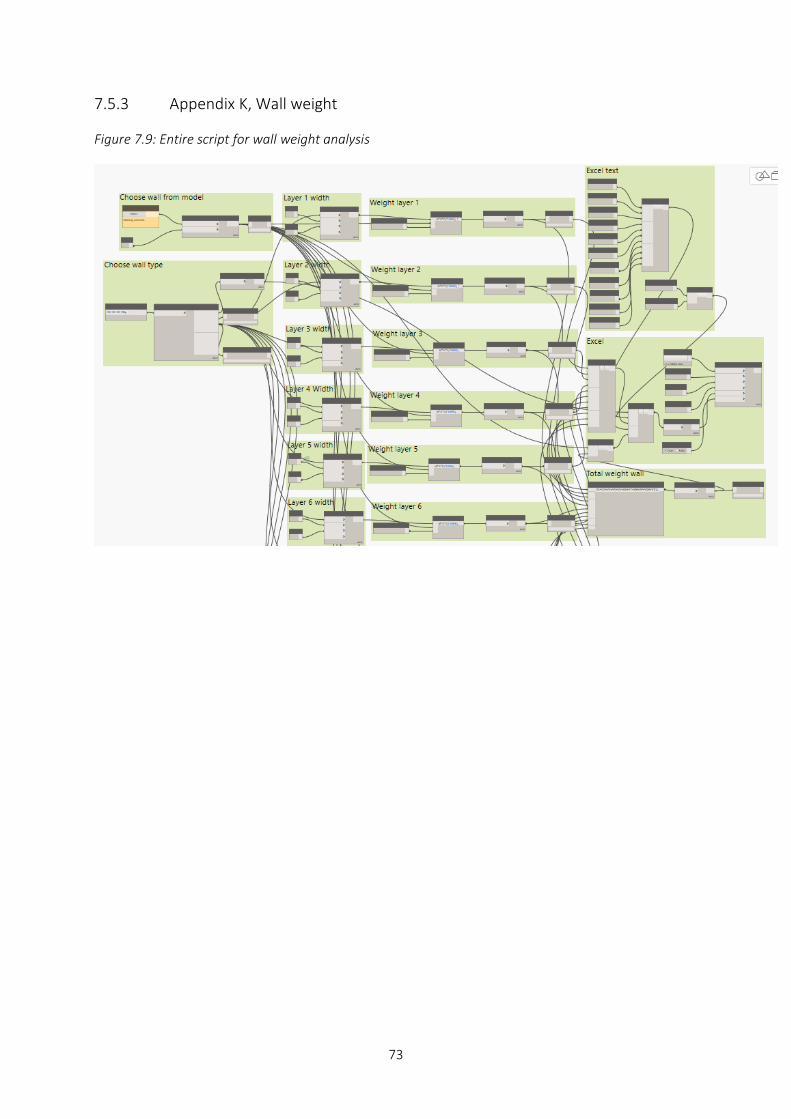
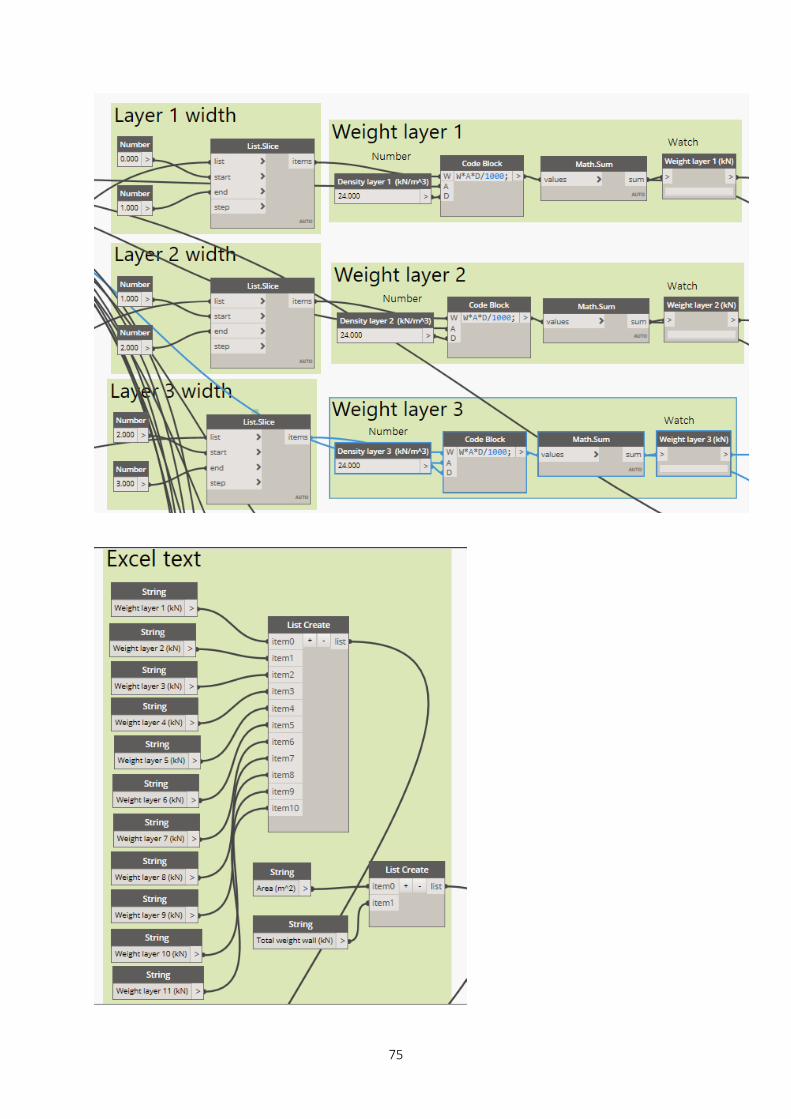
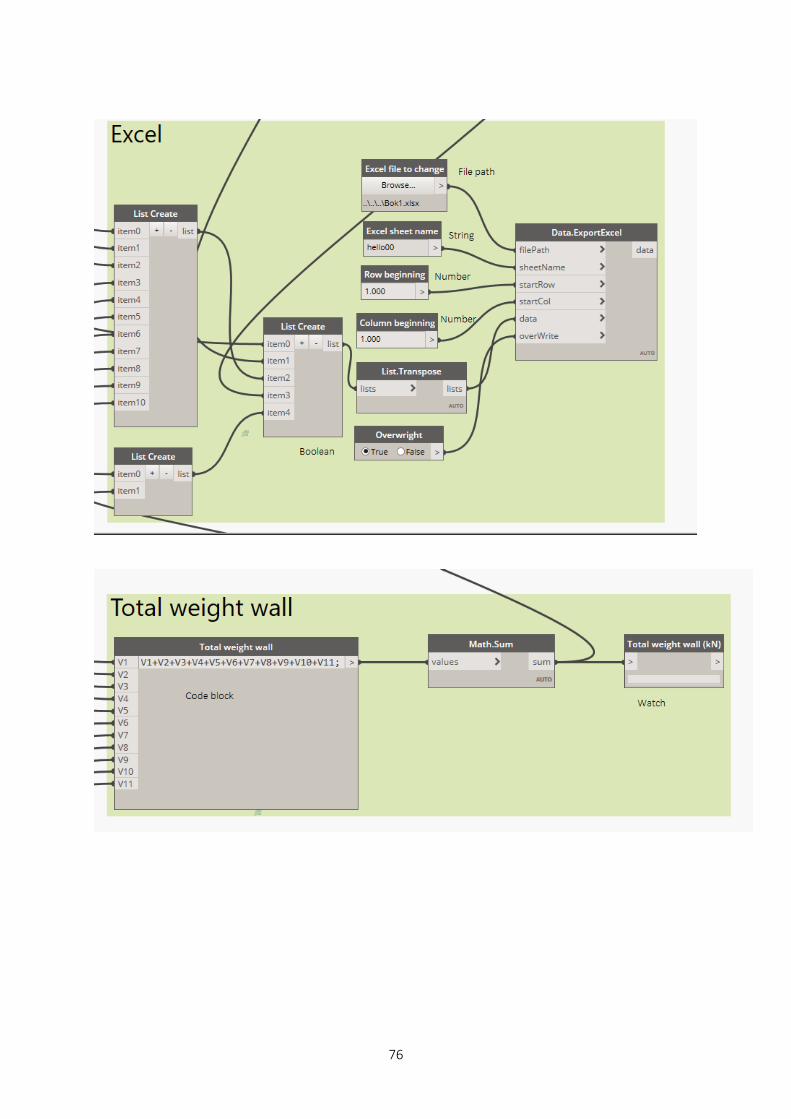
7.5.3 Appendix K, Wall weight
Figure 7.9: Entire script for wall weight analysis

74
75
76