PAPER-8 FINANCIAL MANAGEMENT & ECONOMICS FOR …
249
INTERMEDIATE PAPER-8 FINANCIAL MANAGEMENT & ECONOMICS FOR FINANCE RTPs, MTPs AND PAST PAPERS GROUP-2 Section-A: Financial Management 1. Scope and Objectives of Financial Management ............................................... 1-5 2. Types of Financing ................................................................................................. 6-8 3. Financial Analysis and Planning - Ratio Analysis .................................................... 9-28 4. Cost of Capital ....................................................................................................... 29-44 5. Financing Decisions - Capital Structure ............................................................... 45-61 6. Financing Decisions - Leverages ........................................................................... 62-77 7. Investment Decisions .......................................................................................... 78-104 8. Risk Analysis in Capital Budgeting ......................................................................... 105-115 9. Dividend Decisions .................................................................................................. 116-127 10. Management of Working Capital ......................................................................... 128-146 Section-B: Economics for Finance 1. Determination of National Income ......................................................................... 147-173 2. Public Finance ........................................................................................................ 174-196 3. Money Market ........................................................................................................ 197-223 4. International Trade .................................................................................................. 224-248
Transcript of PAPER-8 FINANCIAL MANAGEMENT & ECONOMICS FOR …

INTERMEDIATE
PAPER-8
FINANCIAL MANAGEMENT & ECONOMICS FOR FINANCE
RTPs, MTPs AND PAST PAPERS
GROUP-2
Section-A: Financial Management
1. Scope and Objectives of Financial Management ............................................... 1-5
2. Types of Financing ................................................................................................. 6-8
3. Financial Analysis and Planning - Ratio Analysis .................................................... 9-28
4. Cost of Capital ....................................................................................................... 29-44
5. Financing Decisions - Capital Structure ............................................................... 45-61
6. Financing Decisions - Leverages ........................................................................... 62-77
7. Investment Decisions .......................................................................................... 78-104
8. Risk Analysis in Capital Budgeting ......................................................................... 105-115
9. Dividend Decisions .................................................................................................. 116-127
10. Management of Working Capital ......................................................................... 128-146
Section-B: Economics for Finance
1. Determination of National Income ......................................................................... 147-173
2. Public Finance ........................................................................................................ 174-196
3. Money Market ........................................................................................................ 197-223
4. International Trade .................................................................................................. 224-248

-1-
CHAPTER-1SCOPE AND OBJECTIVES OF FINANCIAL MANAGEMENT
Q-1 Explain as to how the wealth maximisation objective is superior to the profit maximisation objectiveWhat is the cost of these sources? [MTP-March ‘19, 4 Marks]
Ans. A firm’s financial management may often have the following as their objectives:
(i) The maximisation of firm’s profit
(ii) The maximisation of firm’s value / wealth.
The maximisation of profit is often considered as an implied objective of a firm. To achieve the aforesaidobjective various type of financing decisions may be taken. Options resulting into maximisation ofprofit may be selected by the firm’s decision makers. They even sometime may adopt policies yieldingexorbitant profits in short run which may prove to be unhealthy for the growth, survival and overallinterests of the firm. The profit of the firm in this case is measured in terms of its total accounting profitavailable to its shareholders.
The value/wealth of a firm is defined as the market price of the firm’s stock. The market price of a firm’sstock represents the focal judgment of all market participants as to what the value of the particularfirm is. It takes into account present and prospective future earnings per share, the timing and risk ofthese earnings, the dividend policy of the firm and many other factors that bear upon the market priceof the stock.
The value maximisation objective of a firm is superior to its profit maximisation objective due tofollowing reasons.
1. The value maximisation objective of a firm considers all future cash flows, dividends, earning pershare, risk of a decision etc. whereas profit maximisation objective does not consider the effectof EPS, dividend paid or any other returns to shareholders or the wealth of the shareholder.
2. A firm that wishes to maximise the shareholders wealth may pay regular dividends whereas afirm with the objective of profit maximisation may refrain from dividend payment to itsshareholders.
3. Shareholders would prefer an increase in the firm’s wealth against its generation of increasingflow of profits.
4. The market price of a share reflects the shareholders expected return, considering the longtermprospects of the firm, reflects the differences in timings of the returns, considers risk andrecognizes the importance of distribution of returns.
The maximisation of a firm’s value as reflected in the market price of a share is viewed as a proper goalof a firm. The profit maximisation can be considered as a part of the wealth maximisation strategy.

-2-
Q-2 State : Agency Cost. DISCUSS the ways to reduce the effect of it.
[MTP-Aug ‘18, 4 Marks]
Ans. Agncy Cost: In a sole proprietorship firm, partnership etc., owners participate in management but incorporate, owners are not active in management so, there is a separation between owner/ shareholdersand managers. In theory managers should act in the best interest of shareholders however in reality,managers may try to maximise their individual goal like salary, perks etc., so there is a principal-agentrelationship between managers and owners, which is known as Agency Problem. In a nutshell, AgencyProblem is the chances that managers may place personal goals ahead of the goal of owners. AgencyProblem leads to Agency Cost. Agency cost is the additional cost borne by the shareholders to monitorthe manager and control their behaviour so as to maximise shareholders wealth. Generally, AgencyCosts are of four types (i) monitoring (ii) bonding (iii) opportunity (iv) structuring
However, following efforts can be made to address Agency Cost:
Managerial compensation to be linked to profit of the company to some extent with the long termobjectives of the company.
Employees’ Stock option plan (ESOP) is also designed to address the issue with the underlyingassumption that maximisation of the stock price is the objective of the investors.
Effective monitoring through corporate governance can be done.
Q-3 Discuss the three major decisions taken by a finance manager to maximize the wealth of shareholders.
[MTP-Oct ‘18, Sugg. May ‘18, 4 Marks]
Ans. To achieve wealth maximization, a finance manager has to take careful decision in respect of:
(i) Investment decisions: These decisions relate to the selection of assets in which funds will beinvested by a firm. Funds procured from different sources have to be invested in various kinds ofassets. Long term funds are used in a project for various fixed assets and also for current assets.The investment of funds in a project has to be made after careful assessment of the variousprojects through capital budgeting. A part of long term funds is also to be kept for financing theworking capital requirements. Asset management policies are to be laid down regarding variousitems of current assets. The inventory policy would be determined by the production managerand the finance manager keeping in view the requirement of production and the future priceestimates of raw materials and the availability of funds.
(ii) Financing decisions: These decisions relate to acquiring the optimum finance to meet financialobjectives and seeing that fixed and working capital are effectively managed. The financial managerneeds to possess a good knowledge of the sources of available funds and their respective costsand needs to ensure that the company has a sound capital structure, i.e. a proper balance betweenequity capital and debt. Financing decisions also call for a good knowledge of evaluation of risk,e.g. excessive debt carried high risk for an organization’s equity because of the priority rights ofthe lenders.
(iii) Dividend decisions: These decisions relate to the determination as to how much and howfrequently cash can be paid out of the profits of an organisation as income for its owners/shareholders. The dividend decision thus has two elements – the amount to be paid out and theamount to be retained to support the growth of the organisation, the latter being also a financingdecision; the level and regular growth of dividends represent a significant factor in determininga profit-making company’s market value, i.e. the value placed on its shares by the stock market.
All three types of decisions are interrelated, the first two pertaining to any kind of organisationwhile the third relates only to profit-making organisations, thus it can be seen that financialmanagement is of vital importance at every level of business activity, from a sole trader to thelargest multinational corporation.
-3-
Q-4 Describe the Inter relationship between investment, financing and dividend decisions.[RTP-Nov,May ‘19,MTP-Oct ‘19]
Ans. Inter-relationship between Investment, Financing and Dividend Decisions: The finance functions aredivided into three major decisions, viz., investment, financing and dividend decisions. It is correct tosay that these decisions are inter-related because the underlying objective of these three decisions isthe same, i.e. maximisation of shareholders’ wealth. Since investment, financing and dividend decisionsare all interrelated, one has to consider the joint impact of these decisions n the market price of thecompany’s shares and these decisions should also be solved jointly. The decision to invest in a newproject needs the finance for the investment. The financing decision, in turn, is influenced by andinfluences dividend decision because retained earnings used in internal financing deprive shareholdersof their dividends. An efficient financial management can ensure optimal joint decisions. This is possibleby evaluating each decision in relation to its effect on the shareholders’ wealth.
The above three decisions are briefly examined below in the light of their interrelationship and to seehow they can help in maximising the shareholders’ wealth i.e. market price of the company’s shares.
Investment decision: The investment of long term funds is made after a careful assessment of thevarious projects through capital budgeting and uncertainty analysis. However, only that investmentproposal is to be accepted which is expected to yield at least so much return as is adequate to meet itscost of financing. This have an influence on the profitability of the company and ultimately on itswealth.
Financing decision: Funds can be raised from various sources. Each source of funds involves differentissues. The finance manager has to maintain a proper balance between long-term and short-termfunds. With the total volume of long-term funds, he has to ensure a proper mix of loan funds andowner’s funds. The optimum financing mix will increase return to equity shareholders and thus maximisetheir wealth.
Dividend decision: The finance manager is also concerned with the decision to pay or declare dividend.He assists the top management in deciding as to what portion of the profit should be paid to theshareholders by way of dividends and what portion should be retained in the business. An optimaldividend pay-out ratio maximises shareholders’ wealth.
The above discussion makes it clear that investment, financing and dividend decisions are interrelatedand are to be taken jointly keeping in view their joint effect on the shareholders’ wealth.
Q-5 Write a short note on : Functions of Finance Manager. [RTP-May ‘19]
Ans. Functions of Finance Manager
The Finance Manager’s main objective is to manage funds in such a way so as to ensure their optimumutilisation and their procurement in a manner that the risk, cost and control considerations are properlybalanced in a given situation. To achieve these objectives the Finance Manager performs the followingfunctions:
(i) Estimating the requirement of Funds: Both for long-term purposes i.e.investment in fixed assetsand for short-term i.e. for working capital. Forecasting the requirements of funds involves theuse of techniques of budgetary control and long-range planning.
(ii) Decision regarding Capital Structure: Once the requirement of funds has been estimated, a decisionregarding various sources from which these funds would be raised has to be taken. A properbalance has to be made between the loan funds and own funds. He has to ensure that he raisessufficient long term funds to finance fixed assets and other long term investments and to providefor the needs of working capital.
-4-
(iii) Investment Decision: The investment of funds, in a project has to be made after careful assessmentof various projects through capital budgeting. Assets management policies are to be laid downregarding various items of current assets. For e.g. receivable in coordination with sales manager,inventory in coordination with production manager.
(iv) Dividend decision: The finance manager is concerned with the decision as to how much to retainand what portion to pay as dividend depending on the company’s policy. Trend of earnings, trendof share market prices, requirement of funds for future growth, cash flow situation etc., are to beconsidered.
(v) Evaluating financial performance: A finance manager has to constantly reviewthe financialperformance of the various units of organisation generally in terms of ROI Such a review helps themanagement in seeing how the funds have been utilised in various divisions and what can bedone to improve it.
(vi) Financial negotiation: The finance manager plays a very important role in carrying out negotiationswith the financial institutions, banks and public depositors for raising of funds on favourableterms.
(vii) Cash management: The finance manager lays down the cash management and cash disbursementpolicies with a view to supply adequate funds to all units of organisation and to ensure that thereis no excessive cash.
(viii) Keeping touch with stock exchange: Finance manager is required to analyse major trends in stockmarket and their impact on the price of the company share.
Q-6 “The profit maximization is not an operationally feasible criterion.” Identify. [RTP-Nov & May ‘18]
Ans. The profit maximisation is not an operationally feasible criterion.” This statement is true becauseprofit maximisation can be a short-term objective for any organisation and cannot be its sole objective.Profit maximization fails to serve as an operational criterion for maximizing the owner’s economicwelfare. It fails to provide an operationally feasible measure for ranking alternative courses of actionin terms of their economic efficiency. It suffers from the following limitations:
(i) Vague term: The definition of the term profit is ambiguous. Does it mean shortterm or long termprofit? Does it refer to profit before or after tax? Total profit orprofit per share?
(ii) Timing of Return:The profit maximization objective does not make distinction between returnsreceived in different time periods. It gives no consideration to the time value of money, andvalues benefits received today and benefits received after a period as the same.
(iii) It ignores the risk factor.
(iv) The term maximization is also vague.
Q-7 Write two main objectives of Financial Management. [Sugg.-Nov-’18, 2 Marks]
Ans. Two Main Objective of Financial Management
(i) Profit MaximisationIt has traditionally been argued that the primary objective of a company is to earnprofit; hence the objective of financial management is also profit maximisation.
Wealth / Value Maximization
Wealth / Value Maximization Model. Shareholders wealth are the result of cost benefit analysis adjustedwith their timing and risk i.e. time value of money. This is the real objective of Financial Management.So,Wealth = Present Value of benefits – Present Value of Costs.
-5-
Q-8 What are the roles of Finance Executive in Modem World? [Sugg-May ‘18, 2 Marks]
Ans. Role of Finance Executive in modern World
Today, the role of Financial Executive, is no longer confined to accounting, financial reporting and riskmanagement. Some of the key activities that highlight the changing role of a Finance Executive are asfollows:-
· Budgeting
· Forecasting
· Managing M & As
· Profitability analysis relating to customers or products
· Pricing Analysis
· Decisions about outsourcing
· Overseeing the IT function.
· Overseeing the HR function.
· Strategic planning (sometimes overseeing this function).
· Regulatory compliance.
· Risk management.
-6-
CHAPTER-2TYPES OF FINANCING
Q-1 What is debt securitisation? EXPLAIN the basics of debt securitisation process.[MTP- Oct ‘19, 4 Marks]
Ans. Debt Securitisation: It is a method of recycling of funds. It is especially beneficial to financialintermediaries to support the lending volumes. Assets generating steady cash flows are packagedtogether and against this asset pool, market securities can be issued, e.g. housing finance, auto loans,and credit card receivables.Process of Debt Securitisation(i) The origination function – A borrower seeks a loan from a finance company, bank, HDFC. Thecredit
worthiness of borrower is evaluated and contract is entered into with repaymentschedulestructured over the life of the loan.
(ii) The pooling function – Similar loans on receivables are clubbed together to create anunderlyingpool of assets. The pool is transferred in favour of Special purpose Vehicle (SPV), which acts as atrustee for investors.
(iii) The securitisation function – SPV will structure and issue securities on the basis of asset pool.The securities carry a coupon and expected maturity which can be asset-based/mortgage based.These are generally sold to investors through merchant bankers. Investors are –pension funds, mutual funds, insurance funds.The process of securitization is generally without recourse i.e. investors bear the credit risk andissuer is under an obligation to pay to investors only if the cash flows are received by him from thecollateral. The benefits to the originator are that assets are shifted off the balance sheet, thusgiving the originator recourse to off-balance sheet funding.
Q-2 Discuss in briefly any two long term sources of finance for a partnership firm.[MTP-April ‘18, Sugg. May ‘19, 4 Marks]
Ans. The two sources of long-term finance for a partnership firm are as follows:Loans from Commercial Banks: Commercial banks provide long term loans for the purpose of expansionor setting up of new units. Their repayment is usually scheduled over a long period of time. Theliquidity of such loans is said to depend on the anticipated income of the borrowers.As part of the long term funding for a partnership firm, the banks also fund the long term workingcapital requirement (it is also called WCTL i.e. working capital term loan).Lease financing: Leasing is a general contract between the owner and user of the asset over a specifiedperiod of time. The asset is purchased initially by the lessor (leasing company) and thereafter leased tothe user (lessee firm) which pays a specified rent at periodical intervals.Thus, leasing is an alternative to the purchase of an asset out of own or borrowed funds.
Moreover, lease finance can be arranged much faster as compared to term loans from financialinstitutions.

-7-
Q-3 Explain the importance of trade credit and accruals as source of short-term finance. Discuss the cost ofthese sources? [MTP-Aug ‘18, 4 Marks]
Ans. Trade credit and accruals as source of short-term finance like working capital refers to credit faci litygiven by suppliers of goods during the normal course of trade. It is a short term source of finance.
Micro small and medium enterprises (MSMEs) in particular are heavily dependent on this source forfinancing their working capital needs. The major advantages of trade credit are -easy availability,flexibility and informality.
There can be an argument that trade credit is a cost free source of finance. But it is not. It involvesimplicit cost. The supplier extending trade credit incurs cost in the form of opportunity cost of fundsinvested in trade receivables. Generally, the supplier passes on these costs to the buyer by increasingthe price of the goods or alternatively by not extending cash discount facility.
Q-4 Explain in brief following Financial Instruments:
(i) Euro Bonds
(ii) Floating Rate Notes
(iii) Euro Commercial paper
(iv) Fully Hedged Bond [Sugg. Nov ‘18, 4 Marks]
Ans.
(i) Euro bonds: Euro bonds are debt instruments which are not denominated in thecurrency of the countryin which they are issued. E.g. a Yen note floated in Germany.
(ii) Floating Rate Notes: Floating Rate Notes: are issued up to seven years maturity.Interest rates areadjusted to reflect the prevailing exchange rates. They provide
cheaper money than foreign loans.
(iii) Euro Commercial Paper(ECP): ECPs are short term money market instruments.
They are for maturities less than one year. They are usually designated in US Dollars.
(iv) Fully Hedged Bond: In foreign bonds, the risk of currency fluctuations exists. Fully hedged bondseliminate the risk by selling in forward markets the entire stream of principal and interest payments.
Q-5 What are Masala Bonds? [Sugg. May ‘18, 2 Marks]
Ans. Masala Bond:
Masala (means spice) bond is an Indian name used for Rupee denominated bond that Indian corporateborrowers can sell to investors in overseas markets. These bonds are issued outside India butdenominated in Indian Rupees. NTPC raised `2,000 crore via masala bonds for its capital expenditure inthe year 2016.
Q-6 What are the sources of short term financial requirement of the company?
[Sugg. May ‘18, 4 Marks]
Ans. There are various sources available to meet short-term needs of finance. The different sources arediscussed below:
(i) Trade Credit: It represents credit granted by suppliers of goods, etc., as an incidentof sale. Theusual duration of such credit is 15 to 90 days. It generates automatically in the course of businessand is common to almost all business operations. It can be in the form of an ‘open account’ or‘bills payable’.

-8-
(ii) Accrued Expenses and Deferred Income: Accrued expenses represent liabilities which a companyhas to pay for the services which it has already received like wages, taxes, interest and dividends.
(iii) Advances from Customers: Manufacturers and contractors engaged in producing or constructingcostly goods involving considerable length of manufacturing or construction time usually demandadvance money from their customers at the time of accepting their orders for executing theircontracts or supplying the goods. This is a cost free source of finance and really useful.
(iv) Commercial Paper: A Commercial Paper is an unsecured money market instrument issued in theform of a promissory note.
(v) Treasury Bills: Treasury bills are a class of Central Government Securities.
Treasury bills, commonly referred to as T-Bills are issued by Government of India to meet shortterm borrowing requirements with maturities ranging between 14 to 364 days.
(vi) Certificates of Deposit (CD): A certificate of deposit (CD) is basically a savings certificate with afixed maturity date of not less than 15 days up to a maximum of one year.
(vii) Bank Advances: Banks receive deposits from public for different periods at varying rates of interest.These funds are invested and lent in such a manner that when required, they may be called back.
Q-7 Explain the followings:
(a) Bridge Finance
(b) Floating Rate Bonds
(c) Packing Credit.
[RTP-May ‘18]
Ans.
(a) Bridge Finance: Bridge finance refers, normally, to loans taken by the business, usually from commercialbanks for a short period, pending disbursement of term loans by financial institutions. Normally ittakes time for the financial institution to finalise procedures of creation of security, tie-up participationwith other institutions etc. even though a positive appraisal of the project has been made.
However, once the loans are approved in principle, firms in order not to lose further time in startingtheir projects arrange for bridge finance. Such temporary loan is normally repaid out of the proceeds ofthe principal term loans. It is secured by hypothecation of moveable assets, personal guarantees anddemand promissory notes. Generally rate of interest on bridge finance is higher as compared with thaton term loans.
(b) Floating Rate Bonds: These are the bonds where the interest rate is not fixed and is allowed to floatdepending upon the market conditions. These are ideal instruments which can be resorted to by theissuers to hedge themselves against the volatility in the interest rates. They have become more popularas a money market instrument and have been successfully issued by financial institutions like IDBI,ICICI etc.
(c) Packing Credit: Packing credit is an advance made available by banks to anexporter. Any exporter,having at hand a firm export order placed with him by his foreign buyer on an irrevocable letter ofcredit opened in his favour, can approach a bank for availing of packing credit. An advance so taken byan exporter is required to be liquidated within 180 days from the date of its commencement bynegotiation of export bills or receipt of export proceeds in an approved manner. Thus Packing isessencially a short-term advance.

-9-
CHAPTER-3FINANCIAL ANALYSIS AND PLANNING - RATIO ANALYSIS
Q-1 MT Limited has the following Balance Sheet as on March 31, 2019 and March 31, 2020 :Balance Sheet
` in lakhsMarch 31, 2019 March 31, 2020
Sources of Funds:Shareholders’ Funds 2,500 2,500Loan Funds 3,500 3,000
6,000 5,500Applications of Funds:
Fixed Assets 3,500 3,000Cash and bank 450 400Receivables 1,400 1,100Inventories 2,500 2,000Other Current Assets 1,500 1,000
Less: Current Liabilities (1,850) (2,000)6,000 5,500
The Income Statement of the MT Ltd. for the year ended is as follows: ̀ in lakhs
March 31, 2019 March 31, 2020Sales 22,500 23,800Less: Cost of Goods sold (20,860) (21,100)
Gross Profit 1,640 2,700Less: Selling, General and Administrative expenses (1,100) (1,750)Earnings before Interest and Tax (EBIT) 540 950Less: Interest Expense (350) (300)Earnings before Tax (EBT) 190 650Less: Tax (57) (195)Profits after Tax (PAT) 133 455
Required:CALCULATE for the year 2019-20-(a) Inventory turnover ratio(b) Financial Leverage(c) Return on Capital Employed (ROCE)(d) Return on Equity (ROE)(e) Average Collection period.
[Take 1 year = 365 days] [RTP-May ‘20]

-10-
Ans. Ratios for the year 2019-2020
(a) Inventory turnover ratio
= COGS 21,100
= = 9.42,500 +2,000Average Inventory
2
``
(b) Financial leverage
=EBIT 950
= =1.46EBT 650
` `
(c) ROCE
=
EBIT 1- t 950 1- 0.3 665= = ×100 = 11.56 %
6,000 + 5,500Average Capital Emplyed 5,7502
` `` `
[Here Return on Capital Employed [ ROCE)is calculated after Tax]
(d) ROE
=Profit after tax 445
= ×100 = 18.2%Average shareholder's funds 2,500
``
(e) Average Collection Period
23,800Average Sales per day = = 65.20 lakhs
365`
`
= Average Receivables
Average collection period =Average sales per day
=
1,400 + 1,100 1,250= =19.17days
2 65.265.2
``
`
Q-2 MNP Limited has made plans for the year 2019 -20. It is estimated that the company will employ totalassets of Rs.50,00,000; 30% of assets being financed by debt at an interest cost of 9% p.a.
The direct costs for the year are estimated at Rs. 30,00,000 and all other operating expenses are estimatedat Rs. 4,80,000. The sales revenue are estimated at Rs. 45,00,000. Tax rate is assumed to be 40%.CALCULATE:
(i) Net profit margin (After tax);
(ii) Return on Assets (After tax);
(iii) Asset turnover; and
(iv) Return on Equity.
[MTP-Oct ‘19, 5 Marks]

-11-
Ans. The net profit is calculated as follows :
`
Sales Revenue 45,00,000
Less: Direct Costs 30,00,000
Gross Profits 15,00,000
Less: Operating Expense 4,80,000
Earnings before Interest and tax (EBIT) 10,20,000
Less: Interest on debt (9% × 15,00,000) 1,35,000
Earnings before Tax) (EBT) 8,85,000
Less: Taxes (@ 40%) 3,54,000
Profit after Tax (PAT) 5,31,000
(i) Net Profit Margin (After Tax)
EBIT 1- t Rs.10,20,000× 1- 0.4Net Profit Margin ×100 = =13.6%
Sales Rs.45,00,000
(ii) Return on Assets (ROA) (After tax)
ROA = EBIT 1- t
Total Assets
=Rs.10,20,000 (1 - 0.4) Rs.6,12,000
=Rs.50,00,000 Rs.50,00,000
= 0.1224 = 12.24 %
(iii) Asset Turnover
Asset Turnover =Sales 45,00,000
= = 0.9 Assets Rs.50,00,000
Asset Turnover = 0.9 times
(iv) Return on Equity (ROE)
ROE =PAT Rs.5,31,000
= = 15.17%Equity Rs.35,00,000
ROE = 15.17%
Q-3 Using the following information, PREPARE and complete the Balance Sheet given below:
(i) Total debt to net worth : 1 : 2
(ii) Total assets turnover : 2
(iii) Gross profit on sales : 30%
(iv) Average collection period : 40 days
(Assume 360 days in a year)
(v) Inventory turnover ratio based on cost of goods sold and year-end inventory : 3
(vi) Acid test ratio : 0.75

-12-
Balance Sheet
as on March 31, 20X8
Liabilities Rs. Assets Rs.
Equity Shares Capital 4,00,000 Plant and Machineryand other Fixed Assets -
Reserves and Surplus 6,00,000
Total Debt: Current Assets:
Current Liabilities - Inventory -
Debtors -
- Cash -
[MTP-March ‘19, 5 Marks]
Ans. Net worth = Capital + Reserves and surplus
= 4,00,000 + 6,00,000 = Rs.10,00,000
Total Debt 1=
Networth 2
Total debtt = Rs. 5,00,000
Total Liability side = Rs. 4,00,000 + Rs. 6,00,000 + Rs. 5,00,000
= Rs. 15,00,000
= Total Assets
SalesTotal Assets Turnover =
Total assets
Sales2 =
15,00,000`
Sales = Rs. 30,00,000
Gross Profit on Sales : 30% i.e. Rs. 9,00,000
Cost of Goods Sold (COGS) = Rs. 30,00,000 – Rs. 9,00,000
= Rs. 21,00,000
COGSInventory turnover =
Inventory
21, 00,0003 =
Inventory
`
Inventory = Rs. 7,00,000
Average debtorsAverage collection period =
Sales / day
Debtors40 =
Rs.30, 00,000 / 360

-13-
Debtors = Rs.3,33,333.
Current Assets - Stock (Quick Asset)Acid test ratio =
Current liabilities
Current Assets - Rs.7,00, 0000.75 =
Rs.5, 00, 000
Current Assets = Rs.10,75,000.
Fixed Assets = Total Assets – Current Assetss
= Rs.15,00,000 – Rs.10,75,000 = Rs.4,25,000
Cash and Bank balance = Current Assets – Inventory – Debtors
= Rs.10,75,000 – Rs.7,00,000 – Rs.3,33,333 = Rs.41,667
Balance Sheet as on March 31, 20X8
Liabilities Rs. Assets Rs.
Equity Share Capital 4,00,000 Plant and Machinery and other
Reserves & Surplus 6,00,000 Fixed Assets 4,25,000
Total Debt: Current Assets:
Current liabilities 5,00,000 Inventory 7,00,000
Debtors 3,33,333
________ Cash 41,667
15,00,000 15,00,000
Q-4 Based on the following particulars, PREPARE a balance sheet showing various assets and liabilities of TLtd.Gross profit during the year amounts to ` 8,00,000. There is no long-term loan or overdraft.Reserveand surplus amount to ` 2,00,000. Ending inventory of the year is ` 20,000 above the
beginning inventory. [MTP-March ‘18, 5 Marks]
Ans. (a) G.P. ratio = GrossProfit
= 25%Sales
Gross Profit 8, 00,000Sales = × 100 = × 100 = 32,00, 000
25 25`
(b) Cost of Sales = Sales – Gross profit
= ` 32,00,000 - ` 8,00,000
= ` 24,00,000
(c) Receivable turnover = Sales
= 4Receivables
SalesReceivables ==
4
32,00,000= = 8, 00,000
4
``

-14-
(d) Fixed assets turnover = Cost of Sales
Fixed Assets= 8
Fixed assets = Cost of Sales 24, 00, 000
= = = 3, 00, 0008 8
` `
(e) Inventory turnover =Av
C
er
ost
age
of Sales
Stock= 8
Average Stock = Cost of Sales 24,00, 000
= = 3, 00,00088
``
Average Stock = Opening Stock + Closing Stock
2
Average Stock = Opening Stock + Opening Stock + 20,000
2
Average Stock = Opening Stock + ` 10,000
Opening Stock = Average Stock - ` 10,000
= ` 3,00,000 - `10,000
= ` 2,90,000
Closing Stock = Opening Stock + ` 20,000
= ` 2,90,000 + ` 20,000 = ` 3,10,000
(f) Payable turnover = Purchase
Payables= 6
Purchases = Cost of Sales + Increase in Stock
= ` 24,00,000 + ` 20,000 = `24,20,000
Payables =24,20, 000
= = 4, 03,3336 6
Purchase ` `
(g) Capital turnover =Cost of Sales
Capital Employed= 2
Capital Employed =24, 00, 0Cost of 00
= = 12, 00,0002
Sales
2
` `
= Capital Employed – Reserves & Surplus
(h) Capital = Capital Employed – Reserves & Surplus
= `12,00,000 – `2,00,000 = ` 10,00,000

-15-
Balance Sheet of T Ltd as on……
Liabilities Amount (`) Assets Amount (`)
Capital 10,00,000 Fixed Assets 3,00,000
Reserve & Surplus 2,00,000 Inventories 3,10,000
Payables 4,03,333 Receivables 8,00,000
Other Current Assets 1,93,333
16,03,333 16,03,333
Q-5 Discuss the limitations of financial ratios. [MTP-April ‘18, 4 Marks]
Ans. The limitations of financial ratios are listed below:(i) Diversified product lines: Many businesses operate a large number of divisions in quitedifferent
industries. In such cases ratios calculated on the basis of aggregate data cannotbe used for inter-firm comparisons.
(ii) Financial data are badly distorted by inflation: Historical cost values may be substantially differentfrom true values. Such distortions of financial data are also carried in the financial ratios.
(iii) Seasonal factors may also influence financial data.(iv) To give a good shape to the popularly used financial ratios (like current ratio, debt- equity ratios,
etc.): The business may make some year-end adjustments. Such window dressing can change thecharacter of financial ratios which would be different had there been no such change.
(v) Differences in accounting policies and accounting period: It can make the accountingdata of twofirms non-comparable as also the accounting ratios.
(vi) There is no standard set of ratios against which a firm’s ratios can be compared: Sometimes afirm’s ratios are compared with the industry average. But if a firm desires to be above the average,then industry average becomes a low standard. On the other hand, for a below average firm,industry averages become too high a standard to achieve.
(vii) Financial ratios are inter-related, not independent: Viewed in isolation one ratio may highlightefficiency. But when considered as a set of ratios they may speak differently.
Such interdependence among the ratios can be taken care of through multivariate analysis.
Q-6 From the following information, PREPARE a summarised Balance Sheet as at 31st March, 20X6:
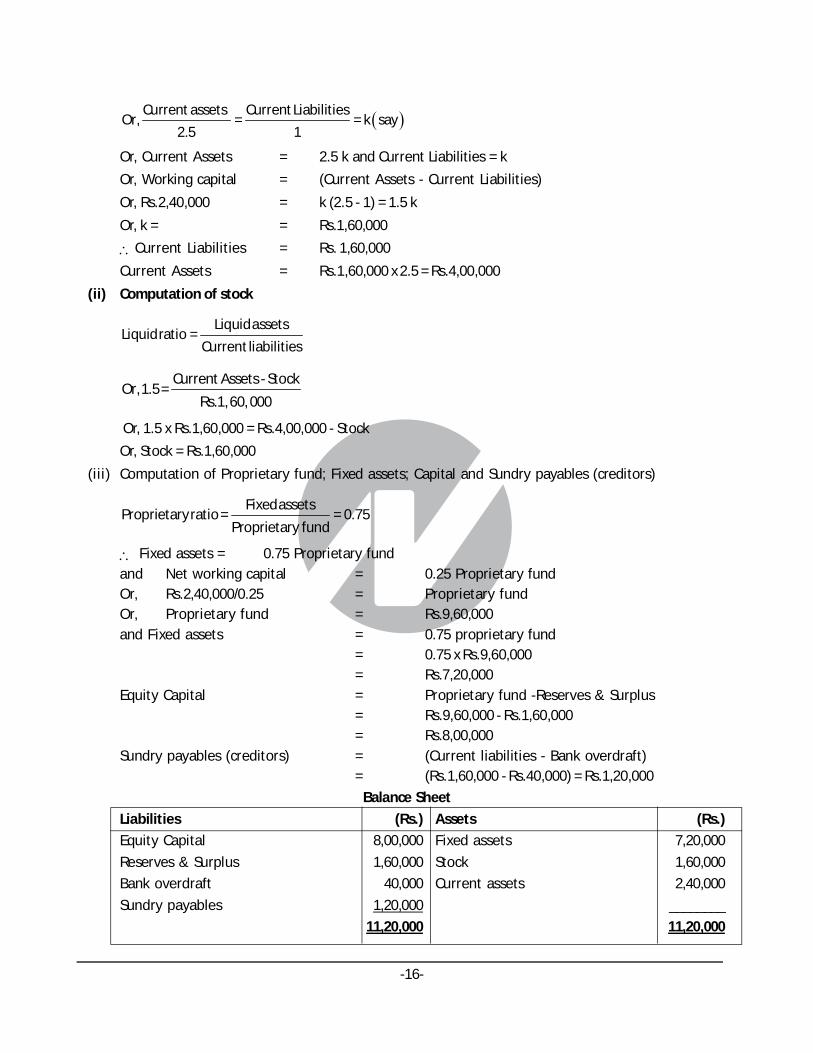
Working Capital Rs.2,40,000
Bank overdraft Rs.40,000
Fixed Assets to Proprietary ratio 0.75
Reserves and Surplus Rs.1,60,000
Current ratio 2.5
Liquid ratio 1.5
[MTP-Aug ‘18, 5 Marks]
Ans. Working notes:
(i) Current assets and Current liabilities computation:
Current l
Current a
iabilities
ssets 2.5=
1
-16-
CurrC eur ntrent Lia assets bilitiesOr, = =
2. 15k say
Or, Current Assets = 2.5 k and Current Liabilities = k
Or, Working capital = (Current Assets - Current Liabilities)
Or, Rs.2,40,000 = k (2.5 - 1) = 1.5 k
Or, k = = Rs.1,60,000
Current Liabilities = Rs. 1,60,000
Current Assets = Rs.1,60,000 x 2.5 = Rs.4,00,000
(ii) Computation of stock
Liquid assetsLiquid ratio =
Current liabilities
Current Assets - StockOr,1.5 =
Rs.1,60, 000
Or, 1.5 x Rs.1,60,000 = Rs.4,00,000 - Stock
Or, Stock = Rs.1,60,000
(iii) Computation of Proprietary fund; Fixed assets; Capital and Sundry payables (creditors)
Fixed assets
ProProprietary rat
prietary funio = =
d0.75
Fixed assets = 0.75 Proprietary fundand Net working capital = 0.25 Proprietary fundOr, Rs.2,40,000/0.25 = Proprietary fundOr, Proprietary fund = Rs.9,60,000and Fixed assets = 0.75 proprietary fund
= 0.75 x Rs.9,60,000= Rs.7,20,000
Equity Capital = Proprietary fund -Reserves & Surplus= Rs.9,60,000 - Rs.1,60,000= Rs.8,00,000
Sundry payables (creditors) = (Current liabilities - Bank overdraft)= (Rs.1,60,000 - Rs.40,000) = Rs.1,20,000
Balance Sheet
Liabilities (Rs.) Assets (Rs.)
Equity Capital 8,00,000 Fixed assets 7,20,000
Reserves & Surplus 1,60,000 Stock 1,60,000
Bank overdraft 40,000 Current assets 2,40,000
Sundry payables 1,20,000 ________
11,20,000 11,20,000
-17-
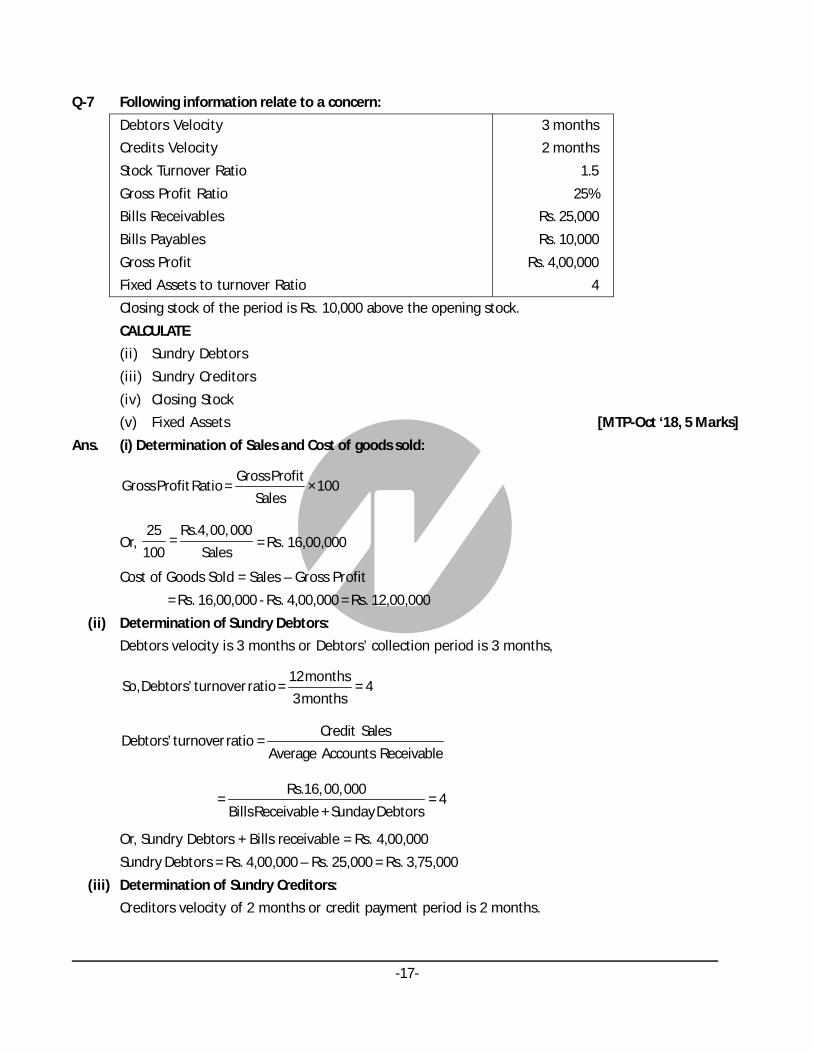
Q-7 Following information relate to a concern:
Debtors Velocity 3 months
Credits Velocity 2 months
Stock Turnover Ratio 1.5
Gross Profit Ratio 25%
Bills Receivables Rs. 25,000
Bills Payables Rs. 10,000
Gross Profit Rs. 4,00,000
Fixed Assets to turnover Ratio 4
Closing stock of the period is Rs. 10,000 above the opening stock.
CALCULATE
(ii) Sundry Debtors
(iii) Sundry Creditors
(iv) Closing Stock
(v) Fixed Assets [MTP-Oct ‘18, 5 Marks]
Ans. (i) Determination of Sales and Cost of goods sold:
Gross ProfitGross Profit Ratio = × 100
Sales
Or, 25 Rs.4,00, 000
=100 Sales
= Rs. 16,00,000
Cost of Goods Sold = Sales – Gross Profit
= Rs. 16,00,000 - Rs. 4,00,000 = Rs. 12,00,000
(ii) Determination of Sundry Debtors:
Debtors velocity is 3 months or Debtors’ collection period is 3 months,
12 monthsSo, Debtors’ turnover ratio = = 4
3 months
Credit SalesDebtors’ turnover ratio =
Average Accounts Receivable
Rs.16, 00,000= = 4
Bills Receivable + Sunday Debtors
Or, Sundry Debtors + Bills receivable = Rs. 4,00,000
Sundry Debtors = Rs. 4,00,000 – Rs. 25,000 = Rs. 3,75,000
(iii) Determination of Sundry Creditors:
Creditors velocity of 2 months or credit payment period is 2 months.

-18-
12 monthsSo, Creditors’ turnover ratio = = 6
2 months
Credit Purchases *Creditors turnover ratio =
Average Accounts Payables
Rs.12,10,000= = 6
Sundry Creditors + Bills Payables
So, Sundry Creditors + Bills Payable = Rs. 2,01,667
Or, Sundry Creditors + Rs. 10,000 = Rs. 2,01,667
Or, Sundry Creditors = Rs. 2,01,667 – Rs. 10,000 = Rs. 1,91,667
(iv) Closing Stock
Cost of Goods Sold Rs.12,00, 000Stock Turnover Ratio = = = 1.5
Average Stock AverageStock
So, Average Stock = Rs. 8,00,000
Opening Stock + Closing StockNow Average Stock =
2
Opening Stock + Opening Stock + Rs.10,000Or = Rs.8, 00,000
2
Or, Opening Stock = Rs. 7,95,000
So, Closing Stock= Rs. 7,95,000 + Rs. 10,000 = Rs. 8,05,000
(v) Calculation of Fixed Assets
Cost of GoodsSoldFixed Assets Turnover Ratio = = 4
FixedAssets
Rs.12,00, 000Or, = 4
Fixed Assets
Or, Fixed Asset = Rs. 3,00,000
Workings:
*Calculation of Credit purchases:
Cost of goods sold = Opening stock + Purchases – Closing stock
Rs. 12,00,000 = Rs. 7,95,000 + Purchases – Rs. 8,05,000
Rs. 12,00,000 + Rs. 10,000 = Purchases
Rs. 12,10,000 = Purchases (credit).
Assumption:(i) All sales are credit sales(ii) All purchases are credit purchase(iii) Stock Turnover Ratio andFixed Asset Turnover Ratio may be calculated eitheron Sales or on Cost of Goods Sold.

-19-
Q-8 Following figures and ratios are related to a company Q Ltd. :
(i) Sales for the year (all credit) ` 30,00,000
(ii) Gross Profit ratio 25 per cent
(iii) Fixed assets turnover (based on cost of goods sold) 1.5
(iv) Stock turnover (based on cost of goods sold) 6
(v) Liquid ratio 1 : 1
(vi) Current ratio 1. 5 : 1
(vii) Receivables (Debtors) collection period 2 months
(viii) Reserves and surplus to share capital 0.6 : 1
(ix) Capital gearing ratio 0.5
(x) Fixed assets to net worth 1.20 : 1
You are required to calculate :
Closing stock, Fixed Assets, Current Assets, Debtors and Net worth.
[Sugg. May ‘19, 5 Marks]
Ans.
(i) Calculation of Closing Stock :
Cost of Goods Sold = Sales – Gross Profit (25% of Sales)
= ` 30,00,000 – ` 7,50,000
= ` 22,50,000
Closing Stock = Cost of Goods Sold / Stock Turnover
= ` 22,50,000/6 = ` 3,75,000
(ii) Calculation of Fixed Assets:
Fixed Assets = Cost of Goods Sold / Fixed Assets Turnover
= ` 22,50,000/1.5
= ` 15,00,000
(iii) Calculation of Current Assets:
Current Ratio = 1.5 and Liquid Ratio = 1
Stock = 1.5 – 1 = 0.5
Current Assets = Amount of Stock × 1.5/0.5
= ` 3,75,000 × 1.5/0.5 = ̀ 11,25,000
(iv) Calculation of Debtors:
Debtors = Sales × Debtors Collection period /12
= ` 30,00,000 × 2 /12
= ` 5,00,000
(v) Calculation of Net Worth:
Net worth = Fixed Assets /1.2
= ` 15,00,000/1.2 = ` 12,50,000

-20-
Q-9 The following is the information of XML Ltd. relate to the year ended 31-03-2018 :
Gross Profit 20% of Sales
Net Profit 10% of Sales
Inventory Holding period 3 months
Receivable collection period 3 months
Non-Current Assets to Sales 1 : 4
Non-Current Assets to Current Assets 1 : 2
Current Ratio 2 : 1
Non-Current Liabilities to Current Liabilities 1 : 1
Share Capital to Reserve and Surplus 4 : 1
Non-current Assets as on 31st March, 2017 Assume that: ` 50,00,000
(i) No change in Non-Current Assets during the year 2017-18
(ii) No depreciation charged on Non-Current Assets during the year 2017-18.
(iii) Ignoring Tax
You are required to Calculate cost of goods sold, Net profit, Inventory, Receivables and Cash for theyear ended on 31st March, 2018.
[Sugg. Nov ‘18, 5 Marks]
Ans. Workings
Non Current Assets 1=
Curent Assets 2
50, 00,000 1Or =
Curent Assets 2
So, Current Assets = ` 1,00,00,000
Now further,
Non CurrentAssets 1=
Sales 4
50, 00, 000 1Or =
Sales 4
So, Sales = ` 2,00,00,000
Calculation of Cost of Goods sold, Net profit, Inventory, Receivables and Cash:
(i) Cost of Goods Sold (COGS):
Cost of Goods Sold = Sales- Gross Profit
= ` 2,00,00,000 – 20% of ` 2,00,00,000
= ̀ 1,60,00,000
(ii) Net Profit = 10% of Sales = 10% of ` 2,00,00,000
= ` 20,00,000

-21-
(iii) Inventory:
12 MonthsInventory Holding Period =
Inventory Turnover Ratio
Inventory Turnover Ratio = 12/ 3 = 4
COGS4 =
Average Inventory
1,60, 00, 0004 =
Average Inventory
Average or Closing Inventory =` 40,00,000
(iv) Receivables :
12MonthsReceivable Collection Period =
Re ceivablesTurnover Ratio
CreditSalesOr Receivables Turnover Ratio = 12 / 3 = 4 =
Average Accounts Receivable
2,00, 00, 000Or 4 =
Average Accounts Receivable
So, Average Accounts Receivable/Receivables = ` 50,00,000/-
(v) Cash :
Cash* = Current Assets* – Inventory- Receivables
Cash = ` 1,00,00,000 - ` 40,00,000 - ` 50,00,000 = ` 10,00,000
(it is assumed that no other current assets are included in the Current Asset)
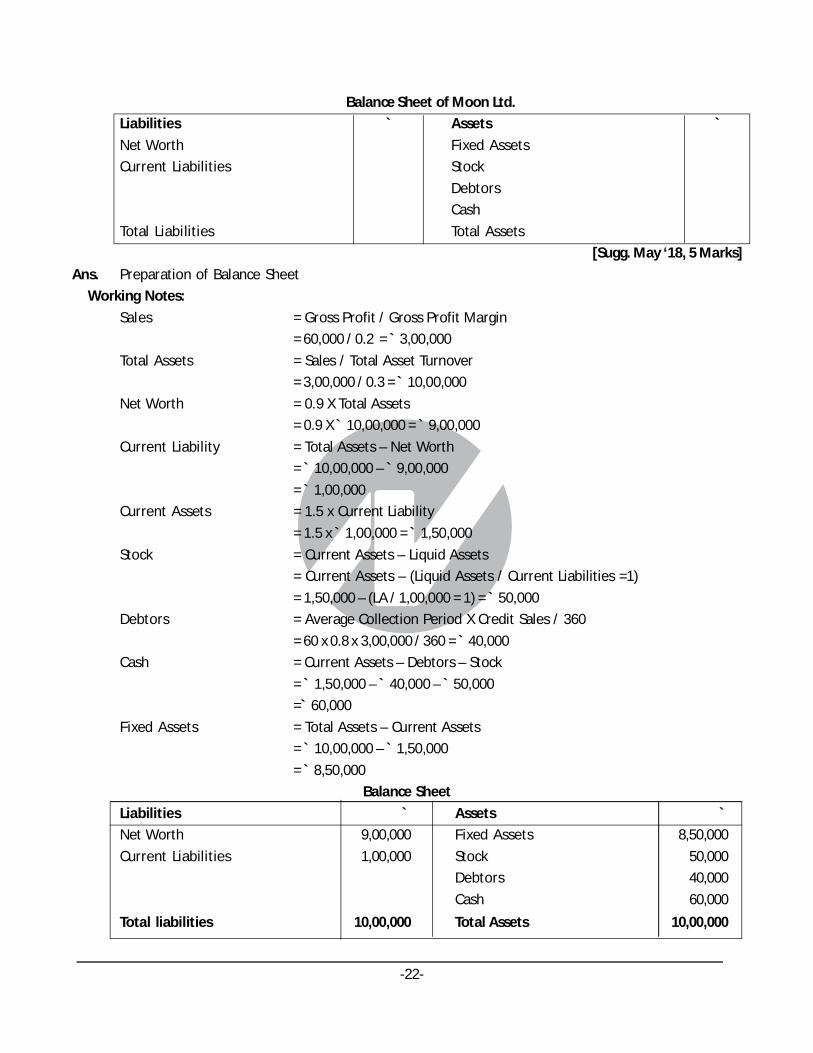
Q-10 The accountant of Moon Ltd. has reported the following data:
Gross profit 60,000
Gross Profit Margin 20 per cent
Total Assets Turnover 0.30:1
Net Worth to Total Assets 0.90:1
Current Ratio 1.5:1
Liquid Assets to Current Liability 1:1
Credit Sales to Total Sales 0.80:1
Average Collection Period 60 days
Assume 360 days in a year
You are required to complete the following:
-22-
Balance Sheet of Moon Ltd.
Liabilities ` Assets `
Net Worth Fixed Assets
Current Liabilities Stock
Debtors
Cash
Total Liabilities Total Assets
[Sugg. May ‘18, 5 Marks]
Ans. Preparation of Balance Sheet
Working Notes:
Sales = Gross Profit / Gross Profit Margin
= 60,000 / 0.2 = ` 3,00,000
Total Assets = Sales / Total Asset Turnover
= 3,00,000 / 0.3 = ̀ 10,00,000
Net Worth = 0.9 X Total Assets
= 0.9 X ` 10,00,000 = ` 9,00,000
Current Liability = Total Assets – Net Worth
= ` 10,00,000 – ` 9,00,000
= ` 1,00,000
Current Assets = 1.5 x Current Liability
= 1.5 x ` 1,00,000 = ` 1,50,000
Stock = Current Assets – Liquid Assets
= Current Assets – (Liquid Assets / Current Liabilities =1)
= 1,50,000 – (LA / 1,00,000 = 1) = ` 50,000
Debtors = Average Collection Period X Credit Sales / 360
= 60 x 0.8 x 3,00,000 / 360 = ̀ 40,000
Cash = Current Assets – Debtors – Stock
= ` 1,50,000 – ` 40,000 – ` 50,000
=` 60,000
Fixed Assets = Total Assets – Current Assets
= ` 10,00,000 – ` 1,50,000
= ` 8,50,000
Balance Sheet
Liabilities ` Assets `
Net Worth 9,00,000 Fixed Assets 8,50,000
Current Liabilities 1,00,000 Stock 50,000
Debtors 40,000
Cash 60,000
Total liabilities 10,00,000 Total Assets 10,00,000

-23-
Q-11 Following figures are available in the books Tirupati Ltd.
Fixed assets turnover ratio 8 times
Capital turnover ratio 2 times
Inventory Turnover 8 times
Receivable turnover 4 times
Payable turnover 6 times
G P Ratio 25%
Gross profit during the year amounts to ` 8,00,000. There is no long-term loan or overdraft.
Reserve and surplus amount to ` 2,00,000. Ending inventory of the year is ` 20,000 above the beginninginventory.
Required:
CALCULATE various assets and liabilities and PREPARE a Balance sheet of Tirupati Ltd. Cost of Capital.
[RTP-May ‘18]
Ans.
(a)Gross Profit
G.P.ratio = = 25%Sales
Gross Profit 8,00,000Sales = × 100 = × 100 = 32,00, 000
25 25
``
(b) Cost of Sales = Sales – Gross profit
= ` 32,00,000 - ` 8,00,000
= ̀ 24,00,000
(c) Receivable turnover =Sales
= 4Receivables
Sales 32, 00,000= Receivables = = = 8,00, 000
4 4
``
(d) Fixed assets turnover = Cost of Sales
= 8Fixed Assets
Fixed assets = Cost of Sales 24, 00, 000
= = 3,00, 0008 8
` `
(e) Inventory turnover =Cost of Sales
= 8Average Stock
Average Stock = Cost of Sales 24,00,000
= = 3, 00, 0008 8
` `

-24-
Average Stock = Opening Stock + Closing Stock
2
Average Stock = Opening Stock + Opening Stock + 20,000
2
Average Stock = Opening Stock + ` 10,000
Opening Stock = Average Stock - ` 10,000
=`3,00,000 - ` 10,000
= ` 2,90,000
Closing Stock = Opening Stock + ` 20,000
= ` 2,90,000 + ` 20,000
= ` 3,10,000
(f) Payable turnover =Purchases
= 6Payables
Purchases = Cost of Sales + Increase in Stock
= ` 24,00,000 + ` 20,000
= ̀ 24,20,000
Payables =Purchase 24,00,000
= = 4,03,3336 6
``
(g) Capital turnover = Cost of Sales
= 2Capital Employed
Capital Employed = Cost of Sales 24,00, 000
= = 12,00,0002 2
``
(h) Share Capital = Capital Employed – Reserves & Surplus
= ` 12,00,000 – ` 2,00,000 = ` 10,00,000
Balance Sheet of Tirupati Ltd as on……………
Liabilities Amount (`) Assets Amount (`)
Share Capital 10,00,000 Fixed Assets 3,00,000
Reserve & Surplus 2,00,000 Closing Inventories 3,10,000
Payables 4,03,333 Receivables 8,00,000
Other Current Assets 1,93,333________ ________
16,03,333 16,03,333
(Fixed Asset turnover, inventory turnover capital turnover is calculated on cost of sales)

-25-
Q-12 From the following table of financial ratios of R. Textiles Limited, comment on various ratios given atthe end:
Ratios 2017 2018 Average of Textile Industry
Liquidity Ratios
Current ratio 2.2 2.5 2.5
Quick ratio 1.5 2 1.5
Receivable turnover ratio 6 6 6
Inventory turnover 9 10 6
Receivables collection period 87 days 86 days 85 days
Operating profitability
Operating income –ROI 25% 22% 15%
Operating profit margin 19% 19% 10%
Financing decisions
Debt ratio 49.00% 48.00% 57%
Return
Return on equity 24% 25% 15%
COMMENT on the following aspect of R. Textiles Limited
(i) Liquidity
(ii) Operating profits
(iii) Financing
(iv) Return to the shareholders [RTP-May ‘19]
Ans. Ratios Comment :
Liquidity Current ratio has improved from last year and matching the industry average. Quick ratioalso improved than last year and above the industry average. This may happen due to reduction inreceivable collection period and quick inventory turnover. However, this also indicates idleness offunds. Overall it is reasonably good. All the liquidity ratios are either better or same in both the yearcompare to the Industry Average.
Operating Profits Operating Income-ROI reduced from last year but Operating Profit Margin has beenmaintained. This may happen due to variability of cost on turnover. However, both the ratio are stillhigher than the industry average.
Financing The company has reduced its debt capital by 1% and saved operating profit for equityshareholders. It also signifies that dependency on debt compared to other industry players (57%) islow.
Return to the share holders R’s ROE is 24 per cent in 2017 and 25 per cent in 2018 compared to anindustry average of 15 per cent. The ROE is stable and improved over the last year.
-26-
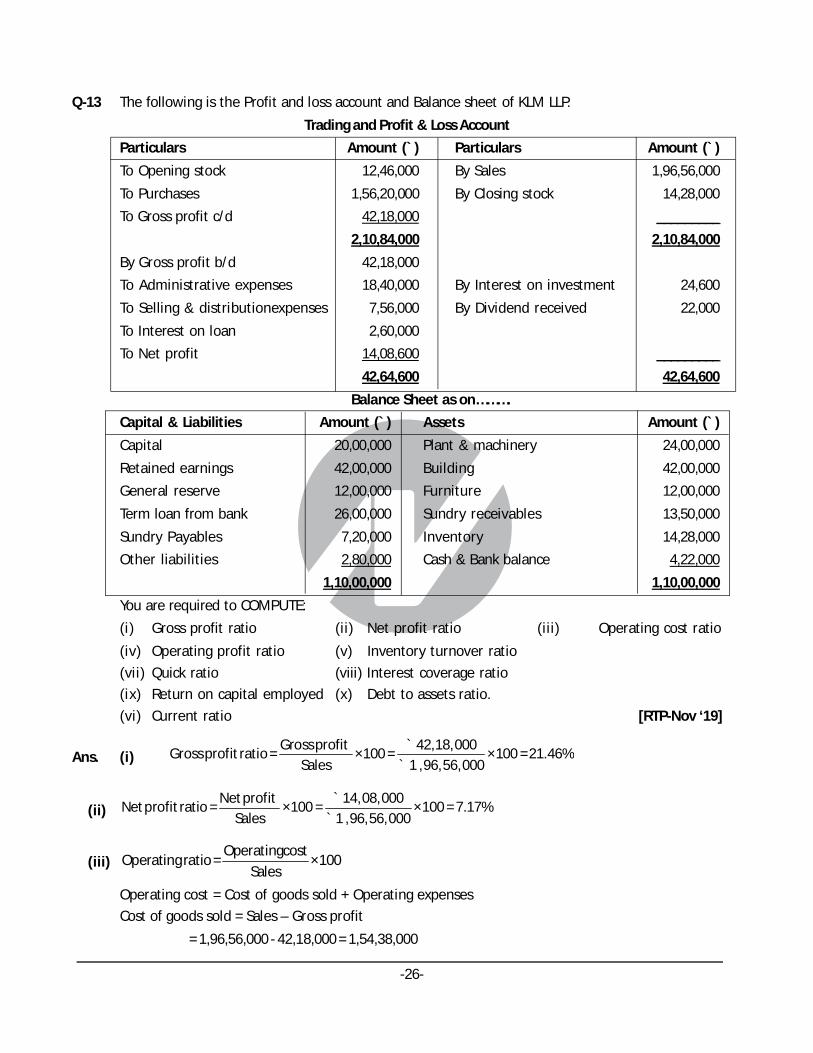
Q-13 The following is the Profit and loss account and Balance sheet of KLM LLP.
Trading and Profit & Loss Account
Particulars Amount (`) Particulars Amount (`)
To Opening stock 12,46,000 By Sales 1,96,56,000
To Purchases 1,56,20,000 By Closing stock 14,28,000
To Gross profit c/d 42,18,000 _________
2,10,84,000 2,10,84,000
By Gross profit b/d 42,18,000
To Administrative expenses 18,40,000 By Interest on investment 24,600
To Selling & distributionexpenses 7,56,000 By Dividend received 22,000
To Interest on loan 2,60,000
To Net profit 14,08,600 _________
42,64,600 42,64,600
Balance Sheet as on……….
Capital & Liabilities Amount (`) Assets Amount (`)
Capital 20,00,000 Plant & machinery 24,00,000
Retained earnings 42,00,000 Building 42,00,000
General reserve 12,00,000 Furniture 12,00,000
Term loan from bank 26,00,000 Sundry receivables 13,50,000
Sundry Payables 7,20,000 Inventory 14,28,000
Other liabilities 2,80,000 Cash & Bank balance 4,22,000
1,10,00,000 1,10,00,000
You are required to COMPUTE:
(i) Gross profit ratio (ii) Net profit ratio (iii) Operating cost ratio
(iv) Operating profit ratio (v) Inventory turnover ratio
(vii) Quick ratio (viii) Interest coverage ratio
(ix) Return on capital employed (x) Debt to assets ratio.
(vi) Current ratio [RTP-Nov ‘19]
Ans. (i)Gross profit 42,18,000
Gross profit ratio = ×100 = ×100 = 21.46%Sales 1 ,96,56,000
``
(ii)Net profit 14,08,000
Net profit ratio = ×100 = ×100 = 7.17%Sales 1 ,96,56,000
``
(iii)Operatingcost
Operating ratio = ×100Sales
Operating cost = Cost of goods sold + Operating expenses
Cost of goods sold = Sales – Gross profit
= 1,96,56,000 - 42,18,000 = 1,54,38,000

-27-
Operating expenses = Administrative expenses + Selling & distribution expenses= 18,40,000 + 7,56,000 = 25,96,000
1,54,38,000 + 25,96,000Therefore, Operating ratio = ×100
1,96,56,000
=1,80,34,000
×100 = 91.75%1,96,56,000
(iv) Operating profit ratio = 100 – Operating cost ratio= 100 – 91.75% = 8.25%
(v)Cost of goods sold
Inventory turnover ratio =Average stock
= 1,54,38,000
14,28,000 + 12,46,000 /2
=1,54,38,000
= 1.55 times13,37,000
(vi)Current assets
Current ratio =Current liablities
Current assets = Sundry receivables + Inventory + Cash & Bank balance= 13,50,000 + 14,28,000 + 4,22,000 = 32,00,000Current liabilities = Sundry Payables + Other liabilities = 7,20,000 + 2,80,000 = 10,00,000
32,00,000Current ratio = = 3.2 times
10,00,000
(vii) Current assets Inventories
Current ratio =Current liablities
= 32,00,000 14,28,000
= 1.77 times10,00,000
(viii)EBIDT Net profit -Interest
Interest coverage ratio = =interest Interest
=14,08,600 + 2,60,000
= 6.42 times2,60,000
(ix)EBIT
Return on capital employed (ROCE) = ×100Capitalemployed
Capital employed = Capital + Retained earnings + General reserve + Term loan
= 20,00,000 + 42,00,000 + 12,00,000 + 26,00,000
= 1,00,00,000

-28-
16,68,600Therefore, ROCE = ×100 = 16.69%
1,00,00,000
(x)Debts 26,00,000
Debt to assets ratio = ×100 = ×100 = 23.64%Total assests 1,10,00,000
Q-14 Assuming the current ratio of a Company is 2, STATE in each of the following cases whether the ratiowill improve or decline or will have no change:
(i) Payment of current liability
(ii) Purchase of fixed assets by cash
(iii) Cash collected from Customers
(iv) Bills receivable dishonoured
(v) Issue of new shares [RTP-Nov ‘18]
Ans.Current Assets (CA)
Current Ratio = = 2i.e. 2 : 1Current Liabilities (CL)
S.No. Situation Improve/Decline/ NoChange Reason
(i) Payment of Current Current Ratio will Let us assume CA is ` 2 lakhs & CL is `
liability improve 1 lakh. If payment of Current Liability= ` 10,000then, CA = 1,
90,000 CL= 90,000.
1, 90, 000Current Ratio =
90, 000
2.11 : 1. When Current Ratio is 2:1 Payment ofCurrent liability will reduce the same amount
in the numerator and denominator.Hence, the ratio willimprove.
(ii) Purchase of Current Ratio Since the cash being a current
Fixed Assets will decline asset converted into fixed asset,
by cash current assetsreduced, thus currentratio will fall.
(iii) Cash collected Current Ratio Cash will increase and Debtors
from Customers will not change willreduce. Hence No Change inCurrent Asset.
(iv) Bills Receivable Current Ratio Bills Receivable will come down
dishonoured will not change and debtors will increase. Hence nochangein Current Assets.
(v) Issue of New Current Ratio As Cash will increase, Current Assets
Shares will improve willincrease and current ratio willincrease.

-29-
CHAPTER-4COST OF CAPITAL
Q-1 PK Ltd. has the following book-value capital structure as on March 31, 2020.(` )
Equity share capital (10,00,000 shares) 2,00,00,00011.5% Preference shares 60,00,00010% Debentures 1,00,00,000
3,60,00,000
The equity shares of the company are sold for ` 200. It is expected that the company will pay next yeara dividend of ` 10 per equity share, which is expected to grow by 5% p.a. forever. Assume a 35%corporate tax rate.
Required:
(i) COMPUTE weighted average cost of capital (WACC) of the company based on the existing capitalstructure.
(ii) COMPUTE the new WACC, if the company raises an additional ̀ 50 lakhs debt by issuing 12% debentures.This would result in increasing the expected equity dividend to `12.40 and leave the growth rateunchanged, but the price of equity share will fall to ` 160 per share. [RTP-May ‘20]
Ans.(i) Computation of Weighted Average Cost of Capital based on existing capital structure
Source of Capital Existing Capital Weights After tax cost of WACC (%)
structure (`) (a) capital (%) (b) (a)x (b)
Equity share capital (W.N.1) 2,00,00,000 0.555 10.00 5.55
11.5% Preference share capital 60,00,000 0.167 11.50 1.92
10% Debentures (W.N.2) 1,00,00,000 0.278 6.50 1.81
3,60,00,000 1.000 9.28
Working Notes (W.N.):
1. Cost of equity capital:
1e
0
Expected Dividend DK = + Growth (g)
Current Market Price per share (P )
10+ 0.05
200``
= 10 %
2. Cost of 10% Debentures:
l 1- t 10,00,000 1- 035= = = 0.065 or 6.5%
NP 1,00,00,000

-30-
(ii) Computation of Weighted Average Cost of Capital based on new capital structure
Source of Capital New Capital Weights After tax cost of WACC (%)
structure (`) (b) capital (%) (a) (a) x (b)
Equity share capital (W.N. 3) 2,00,00,000 0.488 12.75 6.10
Preference share 60,00,000 0.146 11.50 1.68
10% Debentures (W.N. 2) 1,00,00,000 0.244 6.50 1.59
12% Debentures (W.N.4) 50,00,000 0.122 7.80 0.95
4,10,00,000 1.00 10.32
Working Notes (W.N.):
3. Cost of equity capital:
1e
0
Expected Dividend(D )K = + Growth g
Current Market Pr ice per share(P )
= 12.4
+ 0.05 = 0.1275 or 12.75%160
` `
4. Cost of 12% Debentures
= 6,00,000 1- 0.35
= 0.078 or 7.8 %50,00,000
`
`
=
d
2,40,000 1- 0.35K = = 0.078 or 7.8%
20,00,000
`
`
Q-2 ABC Ltd. has the following capital structure which is considered to be optimum as on 31st March, 2019
(Rs.)
14% Debentures 30,00,000
11% Preference shares 10,00,000
Equity Shares (10,000 shares) 1,60,00,000
2,00,00,000
The company share has a market price of Rs. 236. Next year dividend per share is 50% of year 2019 EPS.The following is the trend of EPS for the preceding 10 years which is expected to continue in future.
Year EPS (Rs.) Year EPS (Rs.)
2010 10.00 2015 16.10
2011 11.00 2016 17.70
2012 12.10 2017 19.50
2013 13.30 2018 21.50
2014 14.60 2019 23.60
The company issued new debentures carrying 16% rate of interest and the current market price ofdebenture is Rs. 96.
Preference share Rs. 9.20 (with annual dividend of Rs. 1.1 per share) were also issued. The company isin 50% tax bracket.

-31-
(a) CALCULATE after tax:
(i) Cost of new debt
(ii) Cost of new preference shares
(iii) New equity share (consuming new equity from retained earnings)
(b) CALCULATE marginal cost of capital when no new shares are issued.
(c) COMPUTE the amount that can be spent for capital investment before new ordinary shares must besold. Assuming that retained earnings for next year’s investment are 50 percent of 2019.
(d) COMPUTE marginal cost of capital when the funds exceeds the amount calculated in (C), assuming newequity is issued at Rs. 200 per share?
[MTP-Oct ‘19, 10 Marks]
Ans. (i) Cost of new debt
d
0
l 1 - tK =
P
16 1- 0.5= = 0.0833
96
(ii) Cost of new preference shares
p
PD 1.1K = = = 0.12
P 9.20
(iii) Cost of new equity shares
D1K = + ge P0
11.80= + 0.10 = 0.05+ 0.10 = 0.15
236
Calculation of D1
D1 = 50% of 2019 EPS = 50% of 23.60 = Rs. 11.80
(B) Calculation of marginal cost of capital
Type of Capital Proportion Specific Cost Product
(1) (2) (3) (2) × (3) = (4)
Debenture 0.15 0.0833 0.0125
Preference Share 0.05 0.12 0.0060
Equity Share 0.80 0.15 0.1200
Marginal cost of capital 0.1385
(C) The company can spend the following amount without increasing marginal cost of capital and withoutselling the new shares:
Retained earnings = (0.50) (236 × 10,000) = Rs. 11,80,000
The ordinary equity (Retained earnings in this case) is 80% of total capital
11,80,000 = 80% of Total Capital

-32-
Rs.11,80,000Capital investment before issuing equity = = Rs.14,75,000
0.80
(D) If the company spends in excess of Rs.14,75,000 it will have to issue new shares.
Rs.11.80The cost of new issue will be = + 0.159
200
The marginal cost of capital will be:
Type of Capital Proportion Specific Cost Product
(1) (2) (3) (2) × (3) = (4)
Debentures 0.15 0.0833 0.0125
Preference Shares 0.05 0.1200 0.0060
Equity Shares (New) 0.80 0.1590 0.1272
0.1457
Q-3 DISCUSS the dividend-price approach to estimate cost of equity capital.[MTP-March ‘19, 2 Marks]
Ans. In dividend price approach, cost of equity capital is computed by dividing the expected dividend bymarket price per share. This ratio expresses the cost of equity capital in relation to what yield thecompany should pay to attract investors. It is computed as:
D1K =e P0Where, D1 = Dividend per share in period 1
P0 = Market price per share today.Q-4 G Limited has the following capital structure, which it considers to be optimal:
Capital Structure Weightage (in %)
Debt 25
Preference Shares 15
Equity Shares 60
100
G Limited’s expected net income this year is ` 34,285.72, its established dividend payout ratio is 30 percent, its tax rate is 40 per cent, and investors expect earnings and dividends to grow at a constant rateof 9 per cent in the future. It paid a dividend of ` 3.60 per share last year, and its shares currently sellsat a price of ` 54 per share.
G Limited requires additional funds which it can obtain in the following ways:
• Preference Shares: New preference shares with a dividend of ` 11 can be sold to the public at aprice of `95 per share.
• Debt: Debt can be sold at an interest rate of 12 per cent.
You are required to:
(i) Determine the cost of each capital structure component; and
(ii) Compute the weighted average cost of capital (WACC) of G Limited.
[MTP-March ‘18, 10 Marks]

-33-
Ans. (i) Computation of Costs of Different Components of Capital:(a) Equity Shares:
D 1 + gD 01K + g = + ge P P0 0
3.60 1.09= + 0.09 = 0.0727 + 0.09 = 16.27%
54
`
`
(b) Preference Shares:
Preference Share Dividend 11
= 11.58%P 9p 50
K =`
`
(c) Debt at 12%Kd (1 – t) = 12% (1 – 0.4) = 12% × 0.6 = 7.20%
(ii) Weighted Average Cost of Capital (WACC)WACC = WdKd + WpKp + WeKe
WACC = 0.25 (7.2%) + 0.15 (11.58%) + 0.60 (16.27%)= 1.8 + 1.737 + 9.762 = 13.30%.
Q-5 The capital structure of RV Limited as on 31st March, 20X8 as per its balance sheet is as follows:Particulars Rs.Equity shares of Rs. 10 each 25,00,00010% Preference shares of Rs. 100 each 5,00,000Retained earnings 5,00,00013% debentures of Rs. 100 each 20,00,000The market price of equity shares is Rs. 50 per share. Expected dividend on equity shares is Rs. 3 pershare. The dividend per share is expected to grow at the rate of 8%.Preference shares are redeemable after eight years and the current market price is Rs. 80 per share.Debenture are redeemable after five years and are currently selling at Rs. 90 per debenture.The tax rate applicable to the company is 35%.CALCULATE weighted average cost of capital using:(i) Book value proportions(ii) Market value proportions [MTP-April ‘18, 10 Marks]
Ans. Working Notes(i) Cost of Equity (Ke)
D Rs.31 + g = + 0.08 = 0.14 i.e. 14%P Rs.50
(ii) Cost of preference shares (Kp)
10 + 100 - 80RV -NPD + 12.58n = = = 0.1389 = 13.89%
RV + NP 100 + 80 902 2
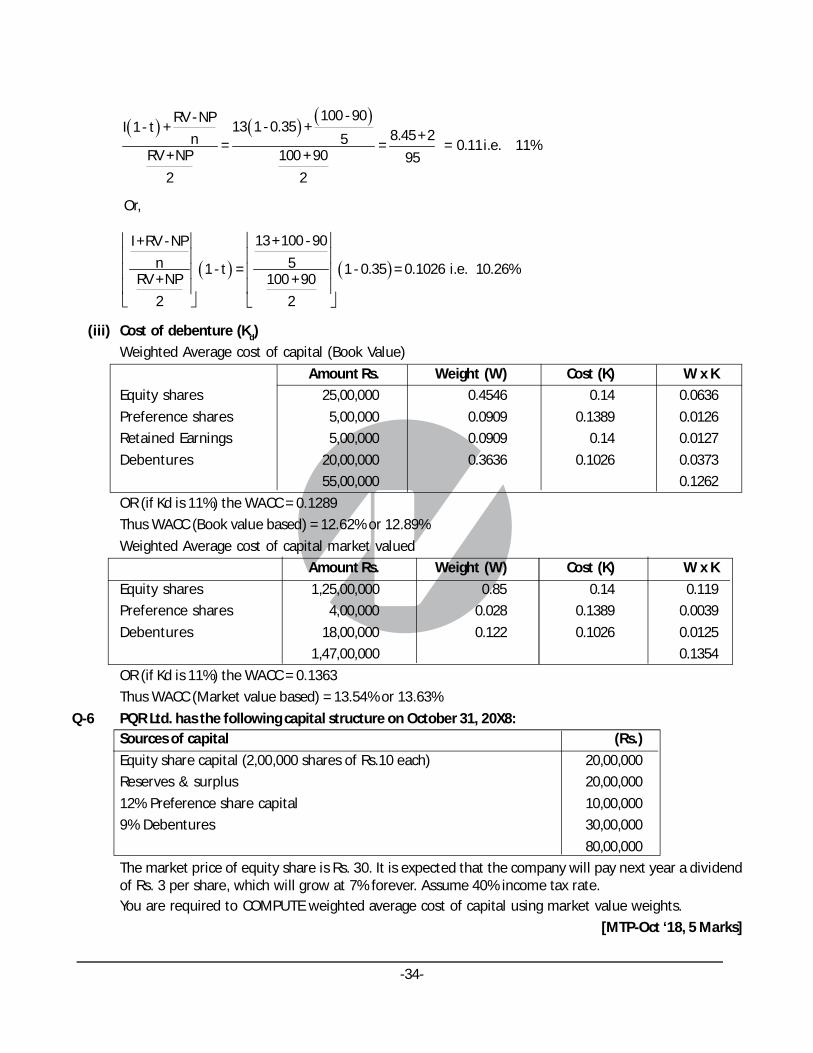
-34-
100 - 90RV - NP13 1 - 0.35 +I 1 - t + 8.45 + 25n = = = 0.11 i.e. 11%
RV + NP 100 + 90 952 2
Or,
13 + 100 - 90I +RV - NP
5n 1 - t = 1 - 0.35 = 0.1026 i.e. 10.26%RV + NP 100 + 90
2 2
(iii) Cost of debenture (Kd)
Weighted Average cost of capital (Book Value)
Amount Rs. Weight (W) Cost (K) W x K
Equity shares 25,00,000 0.4546 0.14 0.0636
Preference shares 5,00,000 0.0909 0.1389 0.0126
Retained Earnings 5,00,000 0.0909 0.14 0.0127
Debentures 20,00,000 0.3636 0.1026 0.0373
55,00,000 0.1262
OR (if Kd is 11%) the WACC = 0.1289
Thus WACC (Book value based) = 12.62% or 12.89%
Weighted Average cost of capital market valued
Amount Rs. Weight (W) Cost (K) W x K
Equity shares 1,25,00,000 0.85 0.14 0.119
Preference shares 4,00,000 0.028 0.1389 0.0039
Debentures 18,00,000 0.122 0.1026 0.0125
1,47,00,000 0.1354
OR (if Kd is 11%) the WACC = 0.1363
Thus WACC (Market value based) = 13.54% or 13.63%
Q-6 PQR Ltd. has the following capital structure on October 31, 20X8:Sources of capital (Rs.)
Equity share capital (2,00,000 shares of Rs.10 each) 20,00,000
Reserves & surplus 20,00,000
12% Preference share capital 10,00,000
9% Debentures 30,00,000
80,00,000
The market price of equity share is Rs. 30. It is expected that the company will pay next year a dividendof Rs. 3 per share, which will grow at 7% forever. Assume 40% income tax rate.You are required to COMPUTE weighted average cost of capital using market value weights.
[MTP-Oct ‘18, 5 Marks]

-35-
Ans. Workings:
(i) Cost of Equity (Ke)=D 31 + g = + 0.07 = 0.1 + 0.07 = 0.17 = 17%P 300
`
`
(ii) Cost of Debentures (Kd) = I (1 - t) = 0.09 (1 - 0.4) = 0.054 or 5.4%
Computation of Weighted Average Cost of Capital (WACC using market value weights)
Source of capital Market Value Weight Cost of capital (%) WACC (%)
of capital (Rs.)
9% Debentures 30,00,000 0.30 5.40 1.62
12% Preference Shares 10,00,000 0.10 12.00 1.20
Equity Share Capital
(Rs. 30 × 2,00,000 shares) 60,00,000 0.60 17.00 10.20
Total 1,00,00,000 1.00 13.02
Q-7 JKL Ltd. has the following book-value capital structure as on March 31, 20X8.
(Rs.)
Equity share capital (2,00,000 shares) 40,00,000
11.5% Preference shares 10,00,000
10% Debentures 30,00,000
80,00,000
The equity shares of the company are sold at Rs. 20. It is expected that the company will pay next yeara dividend of Rs.2 per equity share, which is expected to grow by 5% p.a. forever. Assume a 35%corporate tax rate.
Required:
(i) COMPUTE weighted average cost of capital (WACC) of the company based on the existing capital
structure.
(ii) COMPUTE the new WACC, if the company raises an additional Rs.20 lakhs debt by issuing12%debentures. This would result in increasing the expected equity dividend to Rs.2.40 andleave the growth rate unchanged, but the price of equity share will fall to Rs.16 per share.
[MTP-Oct ‘18,10 Marks]
Ans.(i) Computation of Weighted Average Cost of Capital based on existing capital structure
Source of Capital Existing Capital Weights After tax costof WACC (%)
structure (Rs.) capital (%)
(a) (b) (a) x (b)
Equity share capital (W.N.1) 40,00,000 0.500 15.00 7.500
11.5% Preference share capital(W.N.2) 10,00,000 0.125 11.50 1.437
10% Debentures (W.N.3) 30,00,000 0.375 6.50 2.438
80,00,000 1.000 11.375

-36-
Working Notes (W.N.)
1. Cost of equity capital:
Expected Dividend D1
Current Market P+
r
icGr
e peowth
r Share (g)
P0
Rs.2= + 0.05 = 0.15 or 15%
Rs.20
2. Cost of preference share capital:
Annual preference share PD
Net in issue the of NP
Rs.1,15, 000= = 0.115 or 11.5%
Rs.10, 00,000
3. Cost of 10% Debentures:
I 1 - t Rs.3, 00, 000 1 - 0.35= = = 0.065 or 6.5%
NP Rs.30,00, 000
(ii) Computation of Weighted Average Cost of Capital based on new capital structure
Source of Capital New Capital Weights After tax cost WACC (%)
structure (Rs.) of capital (%)
(b) (a) (a) x (b)
Equity share capital (W.N. 4) 40,00,000 0.40 20.00 8.00
Preference share (W.N. 2) 10,00,000 0.10 11.50 1.15
10% Debentures (W.N. 3) 30,00,000 0.30 6.50 1.95
12% Debentures (W.N.5) 20,00,000 0.20 7.80 1.56
1,00,00,000 1.00 12.66
Working Notes (W.N.):
4. Cost of equity capital:
Expected Dividend D1
Current Market Pr ice
2.40K = + Growth(g) =
per share P+ 5% = 20%e 16 0
`
`
5. Cost of 12% Debentures
2, 40, 000 1 - 0.35K = = 0.078 or 7.8%d 20,00, 000
`
`
-37-
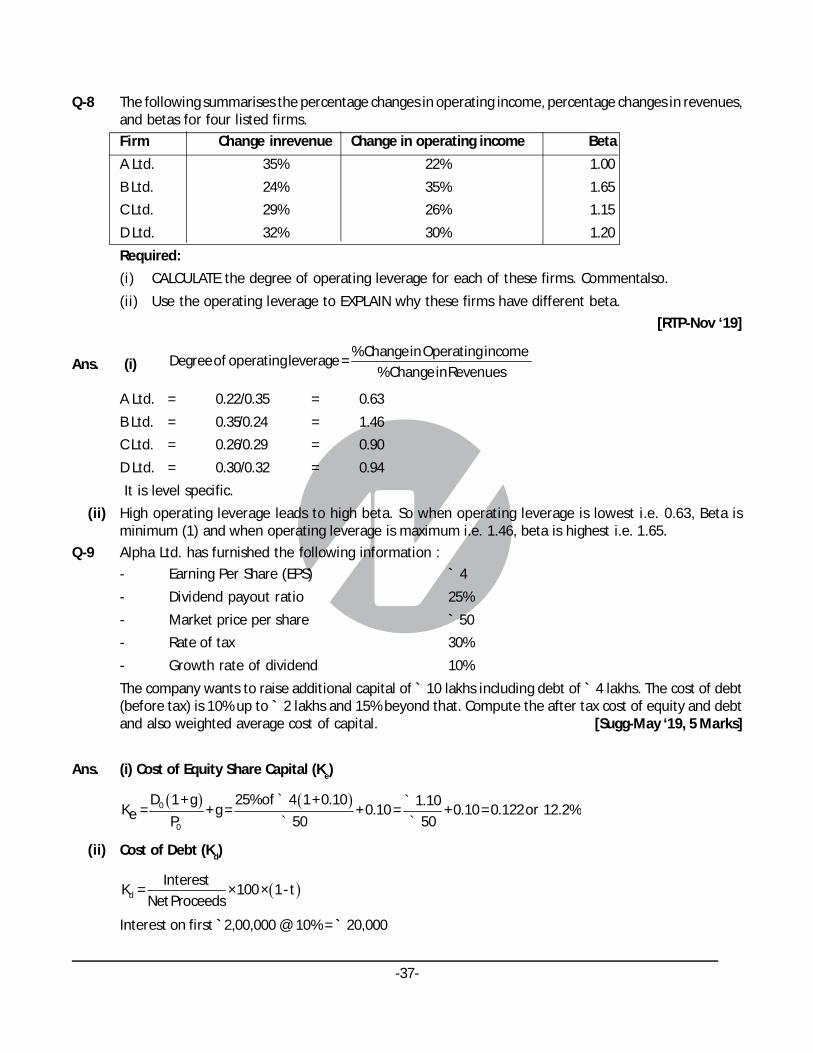
Q-8 The following summarises the percentage changes in operating income, percentage changes in revenues,and betas for four listed firms.
Firm Change inrevenue Change in operating income Beta
A Ltd. 35% 22% 1.00
B Ltd. 24% 35% 1.65
C Ltd. 29% 26% 1.15
D Ltd. 32% 30% 1.20
Required:
(i) CALCULATE the degree of operating leverage for each of these firms. Commentalso.
(ii) Use the operating leverage to EXPLAIN why these firms have different beta.
[RTP-Nov ‘19]
Ans. (i)% Change in Operating income
Degree of operating leverage = % Change in Revenues
A Ltd. = 0.22/0.35 = 0.63
B Ltd. = 0.35/0.24 = 1.46
C Ltd. = 0.26/0.29 = 0.90
D Ltd. = 0.30/0.32 = 0.94
It is level specific.
(ii) High operating leverage leads to high beta. So when operating leverage is lowest i.e. 0.63, Beta isminimum (1) and when operating leverage is maximum i.e. 1.46, beta is highest i.e. 1.65.
Q-9 Alpha Ltd. has furnished the following information :
- Earning Per Share (EPS) ` 4
- Dividend payout ratio 25%
- Market price per share ` 50
- Rate of tax 30%
- Growth rate of dividend 10%
The company wants to raise additional capital of ` 10 lakhs including debt of ` 4 lakhs. The cost of debt(before tax) is 10% up to ` 2 lakhs and 15% beyond that. Compute the after tax cost of equity and debtand also weighted average cost of capital. [Sugg-May ‘19, 5 Marks]
Ans. (i) Cost of Equity Share Capital (Ke)
0
0
D 1+ g 25% of 4 1+ 0.10 1.10K = + g = + 0.10 = + 0.10 = 0.122 or 12.2%e P 50 50
` ` ` `
(ii) Cost of Debt (Kd)
d
InterestK = ×100 × 1- t
Net Proceeds
Interest on first `2,00,000 @ 10% = ` 20,000
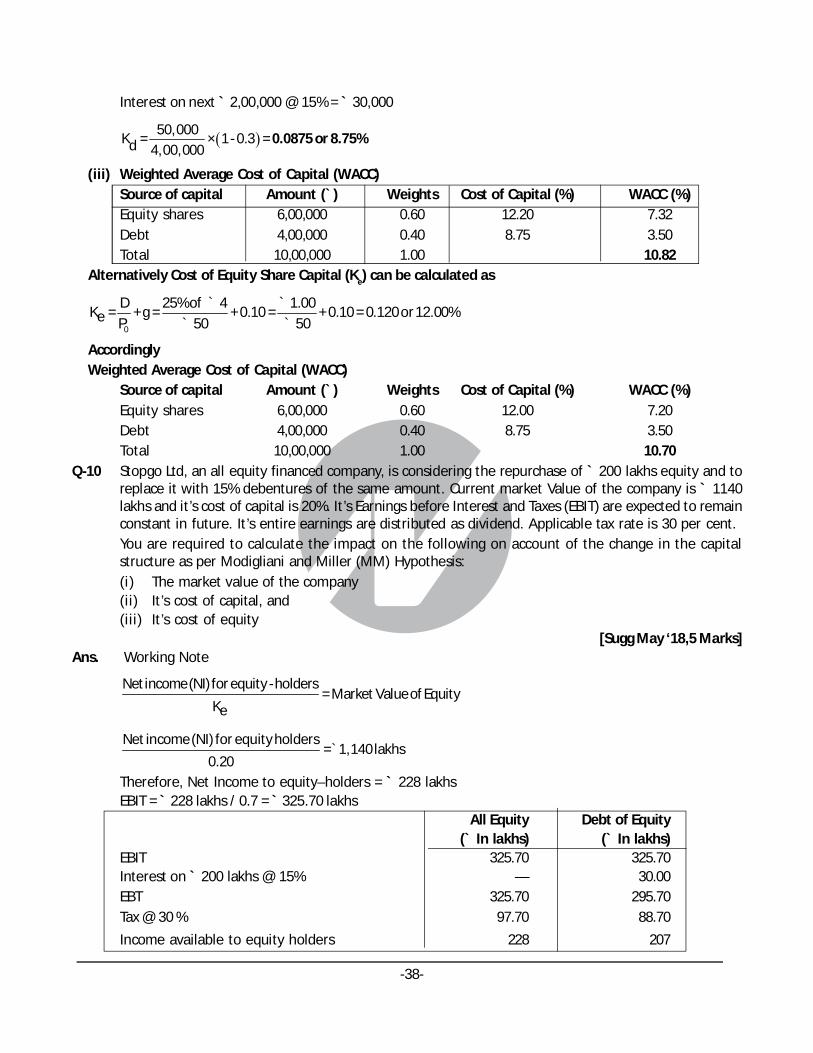
-38-
Interest on next ` 2,00,000 @ 15% = ` 30,000
50,000K = × 1- 0.3 =d 4,00,000
0.0875 or 8.75%
(iii) Weighted Average Cost of Capital (WACC)Source of capital Amount (`) Weights Cost of Capital (%) WACC (%)Equity shares 6,00,000 0.60 12.20 7.32Debt 4,00,000 0.40 8.75 3.50Total 10,00,000 1.00 10.82
Alternatively Cost of Equity Share Capital (Ke) can be calculated as
0
D 25% of 4 1.00K = + g = + 0.10 = + 0.10 = 0.120 or 12.00%e P 50 50
` ` ` `
AccordinglyWeighted Average Cost of Capital (WACC)
Source of capital Amount (`) Weights Cost of Capital (%) WACC (%)Equity shares 6,00,000 0.60 12.00 7.20Debt 4,00,000 0.40 8.75 3.50Total 10,00,000 1.00 10.70
Q-10 Stopgo Ltd, an all equity financed company, is considering the repurchase of ` 200 lakhs equity and toreplace it with 15% debentures of the same amount. Current market Value of the company is ` 1140lakhs and it’s cost of capital is 20%. It’s Earnings before Interest and Taxes (EBIT) are expected to remainconstant in future. It’s entire earnings are distributed as dividend. Applicable tax rate is 30 per cent.You are required to calculate the impact on the following on account of the change in the capitalstructure as per Modigliani and Miller (MM) Hypothesis:(i) The market value of the company(ii) It’s cost of capital, and(iii) It’s cost of equity
[Sugg May ‘18,5 Marks]Ans. Working Note
Net income (NI) for equity - holders= Market Value of Equity
Ke
Net income (NI) for equity holders= 1,140 lakhs
0.20`
Therefore, Net Income to equity–holders = ` 228 lakhsEBIT = ` 228 lakhs / 0.7 = ` 325.70 lakhs
All Equity Debt of Equity(` In lakhs) (` In lakhs)
EBIT 325.70 325.70Interest on ` 200 lakhs @ 15% — 30.00EBT 325.70 295.70Tax @ 30 % 97.70 88.70
Income available to equity holders 228 207

-39-
(i) Market value of levered firm = Value of unlevered firm + Tax Advantage
= ` 1,140 lakhs + (`200 lakhs x 0.3)
= ` 1,200 lakhs
The impact is that the market value of the company has increased by ` 60 lakhs
(`1,200 lakhs – ` 1,140 lakhs)
Calculation of Cost of Equity
Ke = (Net Income to equity holders / Equity Value ) x 100
= (207 lakhs / 1200 lakhs – 200 lakhs ) x 100
= (207/ 1000) x 100
= 20.7 %
(ii) Cost of Capital
Components Amount(` In lakhs) Cost of Capital% Weight WACC %
Equity 1000 20.7 83.33 17.25
Debt 200 (15% X 0.7) =10.5 16.67 1.75
1200 19.00
The impact is that the WACC has fallen by 1% (20% - 19%) due to the benefit of tax relief on debtinterest payment.
(iii) Cost of Equity is 20.7% [As calculated in point (i)]
The impact is that cost of equity has risen by 0.7% i.e. 20.7% - 20% due to the presence of financial risk.
Further, Cost of Capital and Cost of equity can also be calculated with the help of formulas as below,though there will be no change in final answers.
Cost of Capital (Ko) = Keu(1-tL)
Where,
Keu = Cost of equity in an unlevered company
t = Tax rate
L =Debt
Debt Equity
K0 = 200 lakh
0.2 × 1 - × 0.3 1,200 lakh
`
`
So, Cost of capital = 0.19 or 19%
Debt 1 - tCost of Equity (K ) = K + K -Ke eueu d Equity
Where,
Keu = Cost of equity in an unlevered company
Kd = Cost of debt
t = Tax rate

-40-
200 lakh× 0.7K = 0.20 + 0.20 - 0.15 ×e 1,000 lakh
`
`
Ke = 0.20 + 0.007 = 0.207 or 20.7%
So, Cost of Equity = 20.70%
Q-11 KM Ltd. has the following capital structure on September 30, 2019:
Sources of capital (` )
Equity Share Capital (40,00,000 Shares of ` 10 each) 4,00,00,000
Reserves & Surplus 4,00,00,000
12% Preference Shares 2,00,00,000
9% Debentures 6,00,00,000
16,00,00,000
The market price of equity share is ` 60. It is expected that the company will pay next year a dividendof ` 6 per share, which will grow at 10% forever. Assume 40% income tax rate.
You are required to COMPUTE weighted average cost of capital using market value weights.
[RTP-Nov ‘19]Ans. Workings :
(i)1
0
D 6Cost of Equity (K ) = + g = + 0.10 = 0.20 = 20%e P 60
` `
(ii) Cost of Debentures (Kd) = I (1 - t) = 0.09 (1 - 0.4) = 0.054 or 5.4%
Computation of Weighted Average Cost of Capital (WACC using market value weights)
Source of capital Market Value of Weight Cost ofcapital WACC(%)
capital (`) (%)
9% Debentures 6,00,00,000 0.1875 5.40 1.01
12% Preference Shares 2,00,00,000 0.0625 12.00 0.75
Equity Share Capital
(`60 × 40,00,000 shares) 24,00,00,000 0.7500 20.00 15.00
Total 32,00,00,000 1.00 16.76
Q-12 As a financial analyst of a large electronics company, you are required to DETERMINE the weightedaverage cost of capital of the company using (a) book value weights and (b) market value weights. Thefollowing information is available for your perusal.The Company’s present book value capital structure is:
(` )
Debentures (`100 per debenture) 8,00,000
Preference shares (`100 per share) 2,00,000
Equity shares (`10 per share) 10,00,000
20,00,000
All these securities are traded in the capital markets. Recent prices are:
Debentures, `110 per debenture, Preference shares, ` 120 per share, and Equity shares, ` 22 per share
Anticipated external financing opportunities are:

-41-
(i) ` 100 per debenture redeemable at par; 10 year maturity, 11 per cent coupon rate, 4 per centflotation costs, sale price, ` 100
(ii) ` 100 preference share redeemable at par; 10 year maturity, 12 per cent dividendrate, 5 per centflotation costs, sale price, ` 100.
(iii) Equity shares: ` 2 per share flotation costs, sale price = ` 22.
In addition, the dividend expected on the equity share at the end of the year is ` 2 per share, theanticipated growth rate in dividends is 7 per cent and the firm has the practice of paying all its earningsin the form of dividends. The corporate tax rate is 35 per cent. [RTP-May ‘19]
Ans. Determination of specific costs:
(i)
100 - 96RV - NP 11 1 - 0.35 +Interest 1 - t +10yearsNCost Debt (K ) = =d RV + NP 100 + 96
2 2
` ``
` `
7.15 + 0.4= = 0.077 or 7.70%
98
` `
`
(ii)
100 - 95RV - NP 12 +PD +10 yearsNCost of Preference Shares K = =p RV + NP 100 + 95
2 2
` ` `
` `
12 + 0.5= = 0.1282 or 12.82%
97.5
` `
`
(iii) D 21Cost of Equity shares K = + G = + 0.07 = 0.17 or 17%e P 22 - 20
`
` `
I – Interest, t – Tax, RV- Redeemable value, NP- Net proceeds, N- No. of years, PD-Preference dividend,D1- Expected Dividend, P0- Price of share (net)
Using these specific costs we can calculate WACC on the basis of book value and market value weightsas follows:
(a) Weighted Average Cost of Capital (K0) based on Book value weights
Source of capital Book value(`) Weights Specificcost (%) WACC (%)
Debentures 8,00,000 0.40 7.70 3.08
Preferences shares 2,00,000 0.10 12.82 1.28
Equity shares 10,00,000 0.50 17.00 8.50
20,00,000 1.00 12.86

-42-
(b) Weighted Average Cost of Capital (K0) based on market value weights:
Source of capital Market value (`) Weights Specificcost (%) WACC(%)
Debentures
8, 00,000× 110
100
` `
` 8,80,000 0.265 7.70 2.04
Preferences shares
, 00, 000× 120
100
` 2`
` 2,40,000 0.072 12.82 0.92
Equity shares
, 00,000×
10
` 10` 22
` 22,00,000 0.663 17.00 11.27
33,20,000 1.000 14.23
Q-13 M/s. Navya Corporation has a capital structure of 40% debt and 60% equity. The companyis presentlyconsidering several alternative investment proposals costing less than ` 20 lakhs. The corporationalways raises the required funds without disturbing its present debt equity ratio.
The cost of raising the debt and equity are as under:
Project cost Cost of debt Cost of equity
Upto ` 2 lakhs 10% 12%
Above ` 2 lakhs & upto to ` 5 lakhs 11% 13%
Above ` 5 lakhs & upto ` 10 lakhs 12% 14%
Above ` 10 lakhs & upto ` 20 lakhs 13% 14.5%
Assuming the tax rate at 50%, CALCULATE:
(i) Cost of capital of two projects X and Y whose fund requirements are ` 6.5 lakhs and ` 14 lakhsrespectively.
(ii) If a project is expected to give after tax return of 10%, DETERMINE under whatconditions it wouldbe acceptable? [RTP-Nov ‘18]
Ans. (i) Statement of Weighted Average Cost of Capital
Project cost Financing Proportion of After tax cost Weighted
capital Structure (1–Tax 50%) average cost (%)
Upto ` 2 Lakhs Debt 0.4 10% (1 – 0.5) 0.4x5=2.0
= 5%
Equity 0.6 12% 0.45 = 2.00.6 12 = 7.2
9.2%
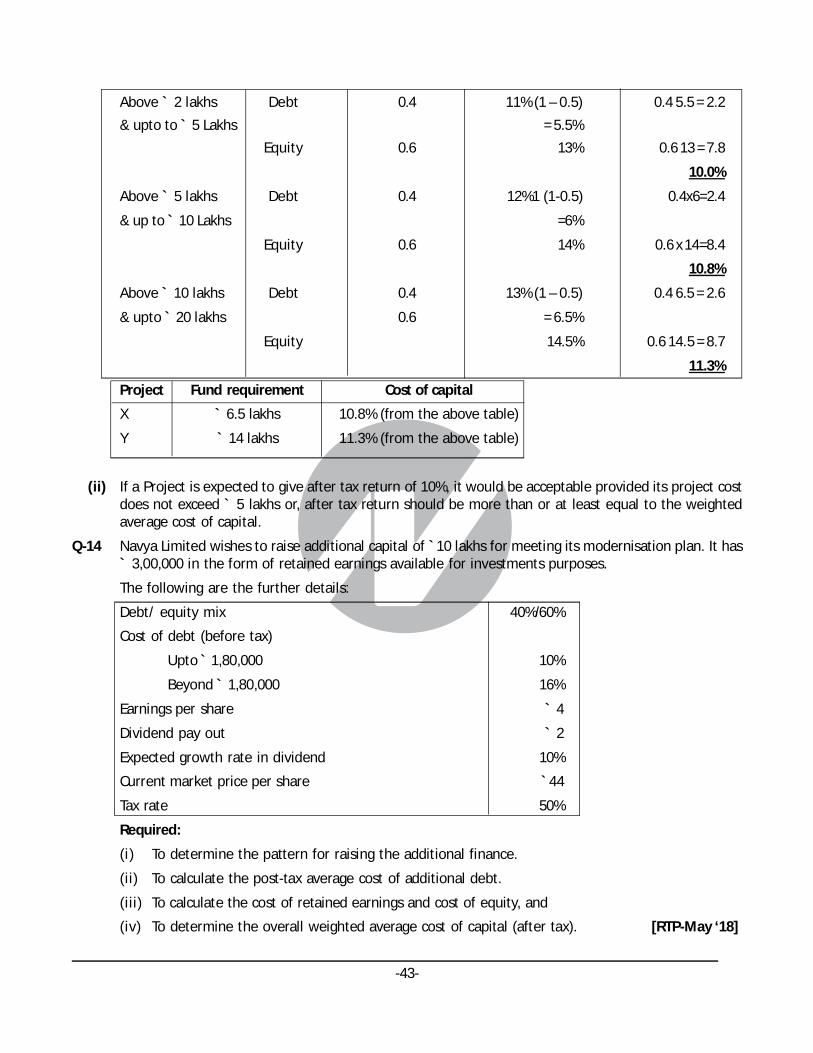
-43-
Above ` 2 lakhs Debt 0.4 11% (1 – 0.5) 0.4 5.5 = 2.2
& upto to ` 5 Lakhs = 5.5%
Equity 0.6 13% 0.6 13 = 7.8
10.0%
Above ` 5 lakhs Debt 0.4 12%1 (1-0.5) 0.4x6=2.4
& up to ` 10 Lakhs =6%
Equity 0.6 14% 0.6 x 14=8.4
10.8%
Above ` 10 lakhs Debt 0.4 13% (1 – 0.5) 0.4 6.5 = 2.6
& upto ` 20 lakhs 0.6 = 6.5%
Equity 14.5% 0.6 14.5 = 8.7
11.3%
Project Fund requirement Cost of capital
X ` 6.5 lakhs 10.8% (from the above table)
Y ` 14 lakhs 11.3% (from the above table)
(ii) If a Project is expected to give after tax return of 10%, it would be acceptable provided its project costdoes not exceed ` 5 lakhs or, after tax return should be more than or at least equal to the weightedaverage cost of capital.
Q-14 Navya Limited wishes to raise additional capital of `10 lakhs for meeting its modernisation plan. It has` 3,00,000 in the form of retained earnings available for investments purposes.
The following are the further details:
Debt/ equity mix 40%/60%
Cost of debt (before tax)
Upto ` 1,80,000 10%
Beyond ` 1,80,000 16%
Earnings per share ` 4
Dividend pay out ` 2
Expected growth rate in dividend 10%
Current market price per share `44
Tax rate 50%
Required:
(i) To determine the pattern for raising the additional finance.
(ii) To calculate the post-tax average cost of additional debt.
(iii) To calculate the cost of retained earnings and cost of equity, and
(iv) To determine the overall weighted average cost of capital (after tax). [RTP-May ‘18]

-44-
Ans. (i) Pattern of Raising Additional Finance
Equity = 10,00,000 × 60/100 = ̀ 6,00,000
Debt = 10,00,000 × 40/100 = ̀ 4,00,000
Capital structure after Raising Additional Finance
Sources of fund Amount (`)
Shareholder’s funds
Equity capital (6,00,000 – 3,00,000) 3,00,000
Retained earnings 3,00,000
Debt at 10% p.a. 1,80,000
Debt at 16% p.a. (4,00,000 -1,80,000) 2,20,000
Total funds 10,00,000
(ii) Post-tax Average Cost of Additional Debt
Kd = I(1 – t), where ‘Kd’ is cost of debt, ‘I’ is interest and ‘t’ is tax rate.
On ` 1,80,000 = 10% (1 - 0.5) = 5% or 0.05
On ` 2,20,000 = 16% (1 – 0.5) = 8% or 0.08
Average Cost of Debt (Post tax) i.e.
1,80, 000 × 0.05 + 2,20,000 × 0.08K = × 100 = 6.65%d 4, 00, 000
(iii) Cost of Retained Earnings and Cost of Equity applying Dividend Growth Model
D 1 + gD 01K = + g or + gd P P0 0
Then, 2 1.1 2.2
K = + 0.10 = + 0.10 = 0.15 or 15%e 44 44
(iv) Overall Weighted Average Cost of Capital (WACC) (After Tax)
Particulars Amount (`) Weights Cost ofCapital WACC
Equity (including retained earnings) 6,00,000 0.60 15% 9.00
Debt 4,00,000 0.40 6.65% 2.66
Total 10,00,000 1.00 11.66

-45-
Q-1 Calculate the level of earnings before interest and tax (EBIT) at which the EPS indifference pointbetween the following financing alternatives will occur.
(i) Equity share capital of ` 60,00,000 and 12% debentures of ` 40,00,000.
Or
(ii) Equity share capital of ̀ 40,00,000, 14% preference share capital of ̀ 20,00,000 and 12% debenturesof ` 40,00,000.
Assume the corporate tax rate is 35% and par value of equity share is ` 100 in each case. [RTP-May ‘20]
Ans. Computation of level of earnings before interest and tax (EBIT)
In case, alternative (i) is accepted, then the EPS of the firm would be:
(EBIT Interest) (1 tax rate) 1- tax rateEPS Alternative (i) =
No. of equity shares
= (EBIT - 0.12 × 40,00,000) (1- 0.35)
60,000 shares`
In case, alternative (ii) is accepted, then the EPS of the firm would be:
(EBIT - 0.12× 40,00,000) (1 - 0.35)- (0.14 × 20,00,000)EPS Alternative (ii)
40,000 shares` `
In order to determine the indifference level of EBIT, the EPS under the two alternative plans should beequated as follows:
(EBIT 0.12 × 40,00,000) (1 - 0.35) (EBIT - 0.12× 40,00, 000) (1 0.35) (0.14 20, 00,000)=
60, 000 shares 40, 000 shares` ` `
0.65 EBIT - 3,12,000 0.65 EBIT - 5,92,000Or =
3 2` `
Or 1.30 EBIT -{ ` 6,24,000 = 1.95 EBIT - { ` 17,76,000
Or (1.95 -{ 1.30) EBIT = ` 17,76,000 -{ ` 6,24,000 = ` 11,52,000
Or EBIT = 11,52,000
0.65`
Or EBIT = ` 17,72,308
CHAPTER-5FINANCING DECISIONS - CAPITAL STRUCTURE
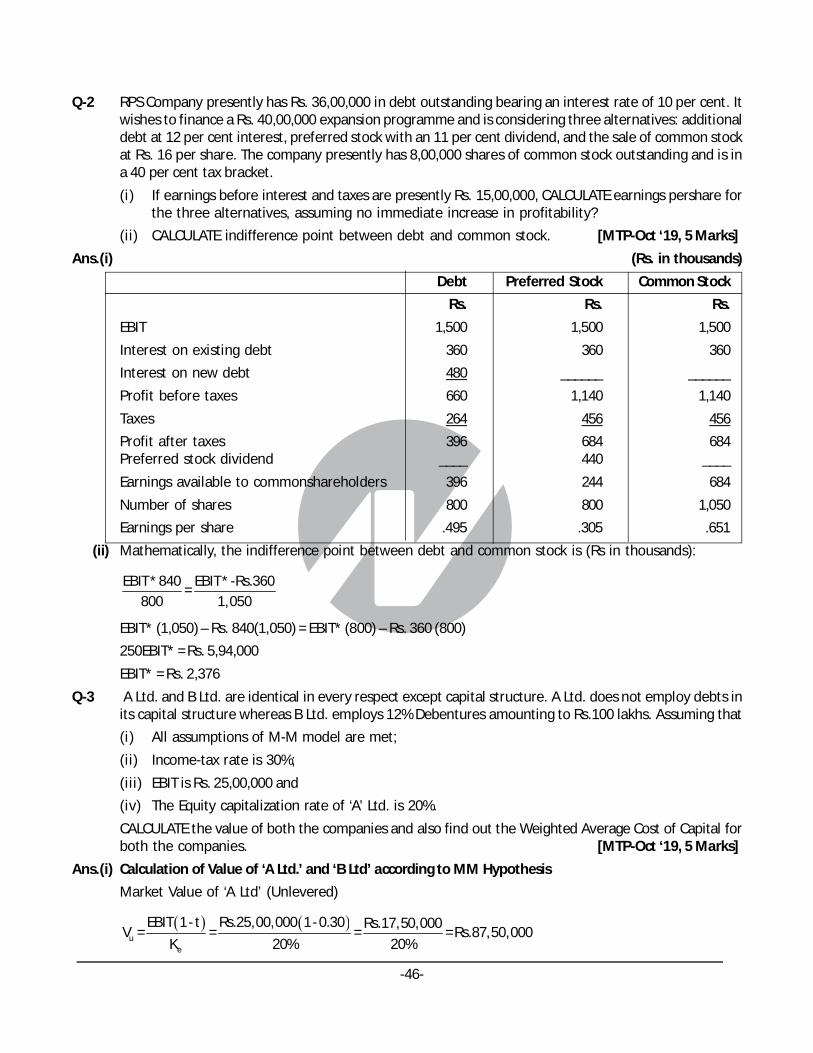
-46-
Q-2 RPS Company presently has Rs. 36,00,000 in debt outstanding bearing an interest rate of 10 per cent. Itwishes to finance a Rs. 40,00,000 expansion programme and is considering three alternatives: additionaldebt at 12 per cent interest, preferred stock with an 11 per cent dividend, and the sale of common stockat Rs. 16 per share. The company presently has 8,00,000 shares of common stock outstanding and is ina 40 per cent tax bracket.
(i) If earnings before interest and taxes are presently Rs. 15,00,000, CALCULATE earnings pershare forthe three alternatives, assuming no immediate increase in profitability?
(ii) CALCULATE indifference point between debt and common stock. [MTP-Oct ‘19, 5 Marks]
Ans.(i) (Rs. in thousands)
Debt Preferred Stock Common Stock
Rs. Rs. Rs.
EBIT 1,500 1,500 1,500
Interest on existing debt 360 360 360
Interest on new debt 480 ______ ______
Profit before taxes 660 1,140 1,140
Taxes 264 456 456
Profit after taxes 396 684 684Preferred stock dividend ____ 440 ____
Earnings available to commonshareholders 396 244 684
Number of shares 800 800 1,050
Earnings per share .495 .305 .651
(ii) Mathematically, the indifference point between debt and common stock is (Rs in thousands):
EBIT * 840 EBIT*-Rs.360=
800 1,050
EBIT* (1,050) – Rs. 840(1,050) = EBIT* (800) – Rs. 360 (800)
250EBIT* = Rs. 5,94,000
EBIT* = Rs. 2,376
Q-3 A Ltd. and B Ltd. are identical in every respect except capital structure. A Ltd. does not employ debts inits capital structure whereas B Ltd. employs 12% Debentures amounting to Rs.100 lakhs. Assuming that
(i) All assumptions of M-M model are met;
(ii) Income-tax rate is 30%;
(iii) EBIT is Rs. 25,00,000 and
(iv) The Equity capitalization rate of ‘A’ Ltd. is 20%.
CALCULATE the value of both the companies and also find out the Weighted Average Cost of Capital forboth the companies. [MTP-Oct ‘19, 5 Marks]
Ans.(i) Calculation of Value of ‘A Ltd.’ and ‘B Ltd’ according to MM Hypothesis
Market Value of ‘A Ltd’ (Unlevered)
u
e
EBIT 1- t Rs.25,00,000 1- 0.30 Rs.17,50,000V = = = =Rs.87,50,000
K 20% 20%
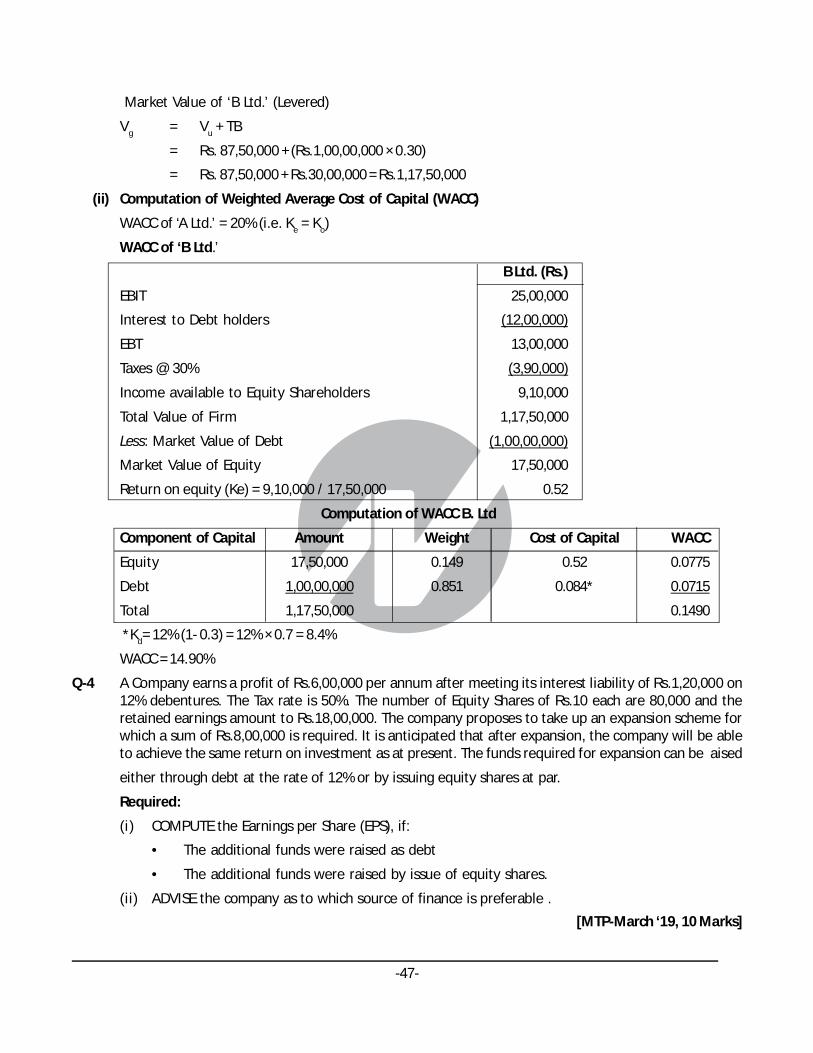
-47-
Market Value of ‘B Ltd.’ (Levered)
Vg = Vu + TB
= Rs. 87,50,000 + (Rs.1,00,00,000 × 0.30)
= Rs. 87,50,000 + Rs.30,00,000 = Rs.1,17,50,000
(ii) Computation of Weighted Average Cost of Capital (WACC)
WACC of ‘A Ltd.’ = 20% (i.e. Ke = Ko)
WACC of ‘B Ltd.’
B Ltd. (Rs.)
EBIT 25,00,000
Interest to Debt holders (12,00,000)
EBT 13,00,000
Taxes @ 30% (3,90,000)
Income available to Equity Shareholders 9,10,000
Total Value of Firm 1,17,50,000
Less: Market Value of Debt (1,00,00,000)
Market Value of Equity 17,50,000
Return on equity (Ke) = 9,10,000 / 17,50,000 0.52
Computation of WACC B. Ltd
Component of Capital Amount Weight Cost of Capital WACC
Equity 17,50,000 0.149 0.52 0.0775
Debt 1,00,00,000 0.851 0.084* 0.0715
Total 1,17,50,000 0.1490
*Kd= 12% (1- 0.3) = 12% × 0.7 = 8.4%
WACC = 14.90%
Q-4 A Company earns a profit of Rs.6,00,000 per annum after meeting its interest liability of Rs.1,20,000 on12% debentures. The Tax rate is 50%. The number of Equity Shares of Rs.10 each are 80,000 and theretained earnings amount to Rs.18,00,000. The company proposes to take up an expansion scheme forwhich a sum of Rs.8,00,000 is required. It is anticipated that after expansion, the company will be ableto achieve the same return on investment as at present. The funds required for expansion can be aised
either through debt at the rate of 12% or by issuing equity shares at par.
Required:
(i) COMPUTE the Earnings per Share (EPS), if:
• The additional funds were raised as debt
• The additional funds were raised by issue of equity shares.
(ii) ADVISE the company as to which source of finance is preferable .
[MTP-March ‘19, 10 Marks]

-48-
Ans. Working Notes:
1. Capital employed before expansion plan:
(Rs.)
Equity shares (Rs.10 × 80,000 shares) 8,00,000
Debentures {(Rs.1,20,000/12) ? 100} 10,00,000
Retained earnings 18,00,000
Total capital employed 36,00,000
2. Earnings before the payment of interest and tax (EBIT):
(Rs.)
Profit (EBT) 6,00,000
Add: Interest 1,20,000
EBIT 7,20,000
3. Return on Capital Employed (ROCE):
EBIT 7,20,000ROCE = ×10 = ×100 = 20%
Capitalemployed 36,00, 000
`
`
4. Earnings before interest and tax (EBIT) after expansion scheme:
After expansion, capital employed = Rs.36,00,000 + Rs.8,00,000
= Rs.44,00,000
Desired EBIT = 20% x Rs.44,00,000 = Rs.8,80,000
(i) Computation of Earnings Per Share (EPS) under the following options:
Present Expansion scheme
situation Additional funds raised as
Debt Equity
(Rs.) (Rs.) (Rs.)
Earnings before Interest andTax (EBIT) 7,20,000 8,80,000 8,80,000
Less: Interest - Old capital 1,20,000 1,20,000 1,20,000
- New capital — 96,000
(Rs.8,00,000 x 12%) —
Earnings before Tax (EBT) 6,00,000 6,64,000 7,60,000
Less: Tax (50% of EBT) 3,00,000 3,32,000 3,80,000
PAT 3,00,000 3,32,000 3,80,000
No. of shares outstanding 80,000 80,000 1,60,000
Earnings per Share (EPS) 3.75 4.15 2.38
Rs.3,00, 000
80, 000
Rs.3,32,000
80,000
Rs.3,80,000
1,60,000
(ii) Advise to the Company: When the expansion scheme is financed by additional debt, the EPS is higher.Hence, the company should finance the expansion scheme by raising debt.

-49-
Q-5 A company needs Rs.31,25,000 for the construction of a new plant. The following three plans are
feasible:
I The company may issue 3,12,500 equity shares at Rs. 10 per share.
II The company may issue 1,56,250 equity shares at Rs. 10 per share and 15,625 debentures of Rs. 100denomination bearing a 8% rate of interest.
ii i The company may issue 1,56,250 equity shares at Rs. 10 per share and 15,625 cumulativepreferenceshares at Rs. 100 per share bearing a 8% rate of dividend.
(i) if the company’s earnings before interest and taxes are Rs. 62,500, Rs. 1,25,000,Rs.2,50,000, Rs.3,75,000 and Rs. 6,25,000, DETERMINE earnings per share under each ofthree financial plans?Assume a corporate income tax rate of 40%.
(ii) IDENTIFY which alternative would you recommend and why?
(iii) DETERMINE the EBIT -EPS indifference points by formulae between Financing Plan I and Plan IIand Plan I and Plan III. [MTP-March ‘19]
Ans. (i) Computation of EPS under three-financial plans.
Plan I: Equity Financing
(Rs.) (Rs.) (Rs.) (Rs.) (Rs.)
EBIT 62,500 1,25,000 2,50,000 3,75,000 6,25,000
Interest 0 0 0 0 0
EBT 62,500 1,25,000 2,50,000 3,75,000 6,25,000
Less: Tax @ 40% 25,000 50,000 1,00,000 1,50,000 2,50,000
PAT 37,500 75,000 1,50,000 2,25,000 3,75,000
No. of equity shares 3,12,500 3,12,500 3,12,500 3,12,500 3,12,500
EPS 0.12 0.24 0.48 0.72 1.20
Plan II: Debt – Equity Mix
(Rs.) (Rs.) (Rs.) (Rs.) (Rs.)
EBIT 62,500 1,25,000 2,50,000 3,75,000 6,25,000
Less: Interest 1,25,000 1,25,000 1,25,000 1,25,000 1,25,000
EBT (62,500) 0 1,25,000 2,50,000 5,00,000
Less: Tax @ 40% 25,000* 0 50,000 1,00,000 2,00,000
PAT (37,500) 0 75,000 1,50,000 3,00,000
No. of equity shares 1,56,250 1,56,250 1,56,250 1,56,250 1,56,250
EPS (Rs. 0.24) 0 0.48 0.96 1.92
* The Company can set off losses against the overall business profit or may carry forward it to nextfinancia l years.

-50-
Plan III: Preference Shares – Equity Mix
(Rs.) (Rs.) (Rs.) (Rs.) (Rs.)
EBIT 62,500 1,25,000 2,50,000 3,75,000 6,25,000
Less: Interest 0 0 0 0 0
EBT 62,500 1,25,000 2,50,000 3,75,000 6,25,000
Less: Tax @ 40% 25,000 50,000 1,00,000 1,50,000 2,50,000
PAT 37,500 75,000 1,50,000 2,25,000 3,75,000
Less: Pref. dividend 1,25,000* 1,25,000* 1,25,000 1,25,000 1,25,000
PAT after Pref. dividend. (87,500) (50,000) 25,000 1,00,000 2,50,000
No. of Equity shares 1,56,250 1,56,250 1,56,250 1,56,250 1,56,250
EPS (0.56) (0.32) 0.16 0.64 1.60
* In case of cumulative preference shares, the company has to pay cumulativ e dividend to preferenceshareholders, when company earns sufficient profits.
(ii) From the above EPS computations tables under the three financial plans we can see that when EBIT isRs. 2,50,000 or more, Plan II: Debt-Equity mix is preferable over the Plan I and Plan III, as rate of EPS ismore under this plan. On the other hand an EBIT of less than Rs.2,50,000, Plan I:Equity Financing has higher EPS than Plan II and Plan III. Plan III Preference share-Equity mix is notacceptable at any level of EBIT, as EPS under this plan is lower.The choice of the financing plan will depend on the performance of the company and othermacroeconomic conditions. If the company is expected to have higher operating profit Plan II: Debt –Equity Mix is preferable. Moreover, debt financing gives more benefit due to availability of tax shield.
(iii) EBIT – EPS Indifference point : Plan I and Plan II
1EBIT inerest × 1 - tEBIT × 1 - t 2=
No.ofequityshares N No.ofequityshares N1 2
EBIT 1 - 0.40 EBIT -Rs.1.25,000 × 1 - 0.40 =
3.12, 500 shares 1, 56, ,250 shares
0.6 EBIT = 1.2 EBIT – Rs.1,50,000
1,50,000EBIT = = 2, 50, 000
0.6
``
Indifference points between Plan I and Plan II is Rs. 2,50,000
EBIT × 1 - t -Pref.dividendEBIT × 1 - t 31 =No.of equity shares N No.of equity shares N1 3
EBIT × 1 - 0.40 - 1,25,000EBIT × 1 - 0.40 31 =3,12, 500 shares 1, 56, ,256 shares
`
Indifference points between Plan I and Plan III is Rs. 4,16,667.
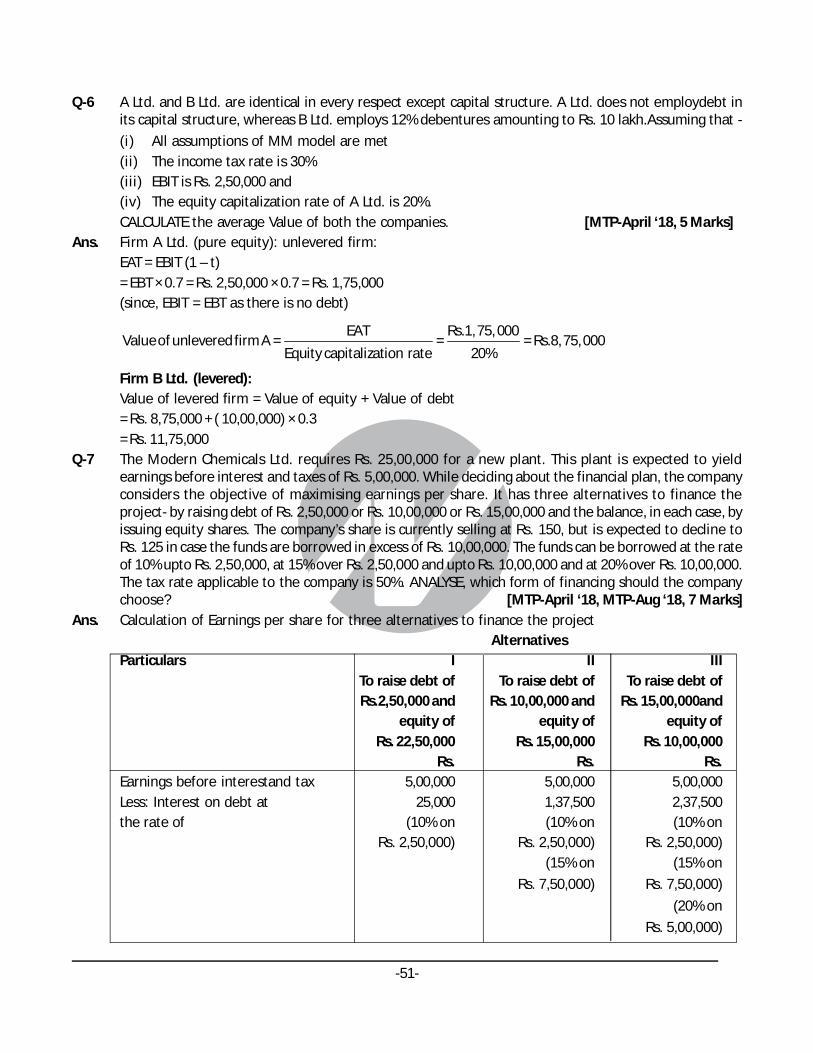
-51-
Q-6 A Ltd. and B Ltd. are identical in every respect except capital structure. A Ltd. does not employdebt inits capital structure, whereas B Ltd. employs 12% debentures amounting to Rs. 10 lakh.Assuming that -
(i) All assumptions of MM model are met(ii) The income tax rate is 30%(iii) EBIT is Rs. 2,50,000 and(iv) The equity capitalization rate of A Ltd. is 20%.CALCULATE the average Value of both the companies. [MTP-April ‘18, 5 Marks]
Ans. Firm A Ltd. (pure equity): unlevered firm:EAT = EBIT (1 – t)= EBT × 0.7 = Rs. 2,50,000 × 0.7 = Rs. 1,75,000(since, EBIT = EBT as there is no debt)
EAT Rs.1,75, 000Value of unlevered firm A = = = Rs.8,75,000
Equity capitalization rate 20%
Firm B Ltd. (levered):Value of levered firm = Value of equity + Value of debt= Rs. 8,75,000 + ( 10,00,000) × 0.3= Rs. 11,75,000
Q-7 The Modern Chemicals Ltd. requires Rs. 25,00,000 for a new plant. This plant is expected to yieldearnings before interest and taxes of Rs. 5,00,000. While deciding about the financial plan, the companyconsiders the objective of maximising earnings per share. It has three alternatives to finance theproject- by raising debt of Rs. 2,50,000 or Rs. 10,00,000 or Rs. 15,00,000 and the balance, in each case, byissuing equity shares. The company’s share is currently selling at Rs. 150, but is expected to decline toRs. 125 in case the funds are borrowed in excess of Rs. 10,00,000. The funds can be borrowed at the rateof 10% upto Rs. 2,50,000, at 15% over Rs. 2,50,000 and upto Rs. 10,00,000 and at 20% over Rs. 10,00,000.The tax rate applicable to the company is 50%. ANALYSE, which form of financing should the companychoose? [MTP-April ‘18, MTP-Aug ‘18, 7 Marks]
Ans. Calculation of Earnings per share for three alternatives to finance the projectAlternatives
Particulars I II IIITo raise debt of To raise debt of To raise debt ofRs.2,50,000 and Rs. 10,00,000 and Rs. 15,00,000and
equity of equity of equity ofRs. 22,50,000 Rs. 15,00,000 Rs. 10,00,000
Rs. Rs. Rs.Earnings before interestand tax 5,00,000 5,00,000 5,00,000Less: Interest on debt at 25,000 1,37,500 2,37,500the rate of (10% on (10% on (10% on
Rs. 2,50,000) Rs. 2,50,000) Rs. 2,50,000)(15% on (15% on
Rs. 7,50,000) Rs. 7,50,000)
(20% on
Rs. 5,00,000)
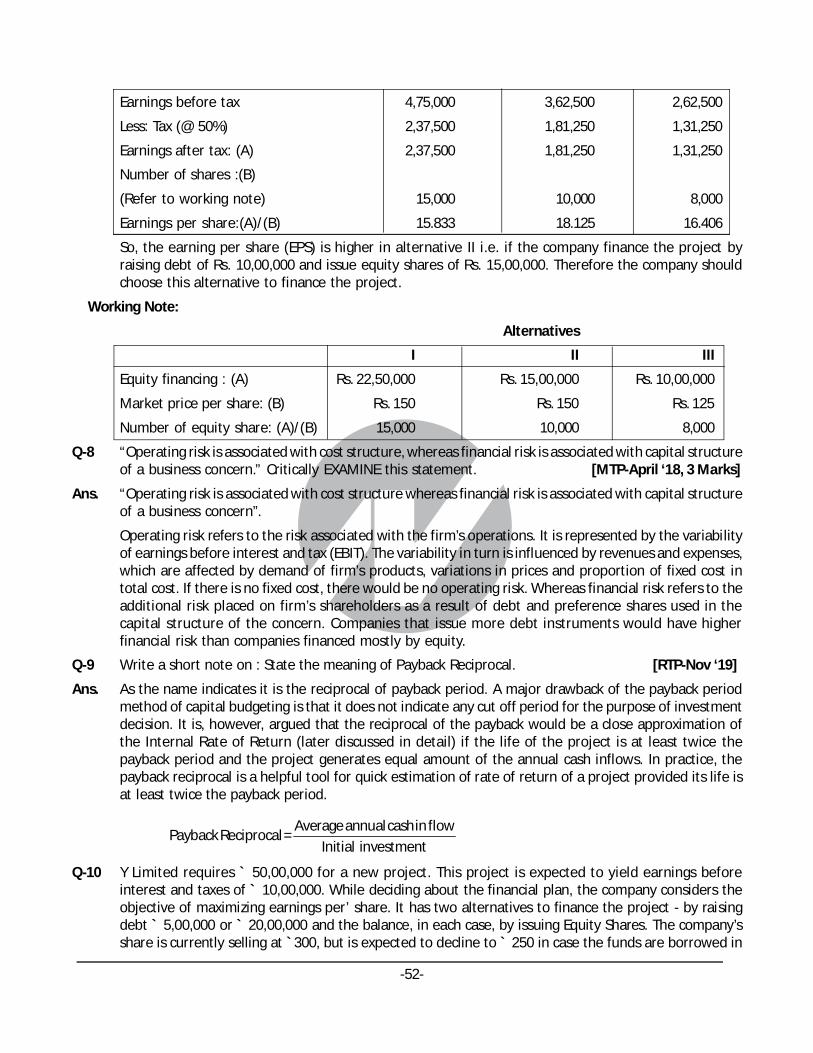
-52-
Earnings before tax 4,75,000 3,62,500 2,62,500
Less: Tax (@ 50%) 2,37,500 1,81,250 1,31,250
Earnings after tax: (A) 2,37,500 1,81,250 1,31,250
Number of shares :(B)
(Refer to working note) 15,000 10,000 8,000
Earnings per share:(A)/(B) 15.833 18.125 16.406
So, the earning per share (EPS) is higher in alternative II i.e. if the company finance the project byraising debt of Rs. 10,00,000 and issue equity shares of Rs. 15,00,000. Therefore the company shouldchoose this alternative to finance the project.
Working Note:
Alternatives
I II III
Equity financing : (A) Rs. 22,50,000 Rs. 15,00,000 Rs. 10,00,000
Market price per share: (B) Rs. 150 Rs. 150 Rs. 125
Number of equity share: (A)/(B) 15,000 10,000 8,000
Q-8 “Operating risk is associated with cost structure, whereas financial risk is associated with capital structureof a business concern.” Critically EXAMINE this statement. [MTP-April ‘18, 3 Marks]
Ans. “Operating risk is associated with cost structure whereas financial risk is associated with capital structureof a business concern”.
Operating risk refers to the risk associated with the firm’s operations. It is represented by the variabilityof earnings before interest and tax (EBIT). The variability in turn is influenced by revenues and expenses,which are affected by demand of firm’s products, variations in prices and proportion of fixed cost intotal cost. If there is no fixed cost, there would be no operating risk. Whereas financial risk refers to theadditional risk placed on firm’s shareholders as a result of debt and preference shares used in thecapital structure of the concern. Companies that issue more debt instruments would have higherfinancial risk than companies financed mostly by equity.
Q-9 Write a short note on : State the meaning of Payback Reciprocal. [RTP-Nov ‘19]
Ans. As the name indicates it is the reciprocal of payback period. A major drawback of the payback periodmethod of capital budgeting is that it does not indicate any cut off period for the purpose of investmentdecision. It is, however, argued that the reciprocal of the payback would be a close approximation ofthe Internal Rate of Return (later discussed in detail) if the life of the project is at least twice thepayback period and the project generates equal amount of the annual cash inflows. In practice, thepayback reciprocal is a helpful tool for quick estimation of rate of return of a project provided its life isat least twice the payback period.
Average annual cash in flowPayback Reciprocal =
Initial investment
Q-10 Y Limited requires ` 50,00,000 for a new project. This project is expected to yield earnings beforeinterest and taxes of ` 10,00,000. While deciding about the financial plan, the company considers theobjective of maximizing earnings per’ share. It has two alternatives to finance the project - by raisingdebt ` 5,00,000 or ` 20,00,000 and the balance, in each case, by issuing Equity Shares. The company’sshare is currently selling at `300, but is expected to decline to ` 250 in case the funds are borrowed in

-53-
excess of ` 20,00,000. The funds can be borrowed at the rate of 12 percent upto ` 5,00,000 and at 10percent over ` 5,00,000. The tax rate applicable to the company is 25 percent.
Which form of financing should the company choose? [Sugg-Nov ‘18]
Ans. Plan I = Raising Debt of Rs 5 lakh + Equity of Rs 45 lakh.
Plan II = Raising Debt of ` 20 lakh + Equity of ` 30 lakh.
Calculation of Earnings per share (EPS)
Particulars Financial Plans
Plan I Plan II
` `
Expected EBIT 10,00,000 10,00,000
Less: Interest (Working Note 1) (60,000) (2,10,000)
Earnings before taxes 9,40,000 7,90,000
Less: Taxes @ 25% (2,35,000) (1,97,500)
Earnings after taxes (EAT) 7,05,000 5,92,500
Number of shares (Working Note 2) 15,000 10,000
Earnings per share (EPS) 47 59.25
Financing Plan II (i.e. Raising debt of ` 20 lakh and issue of equity share capital of ` 30 lakh) is theoption which maximises the earnings per share.
Working Notes:
1. Calculation of interest on Debt.
Plan I (` 5,00,000 x 12%) ` 60,000
Plan II (` 5,00,000 x 12%) ` 60,000 ` 2,10,000
(` 15,00,000 x 10%) ` 1,50,000
2. Number of equity shares to be issued
Rs. 45, 00,000Plan 1 : = 15,000 shares
Rs. 300 (Market Price of share)
Rs. 30, 00,000Plan 2 : = 10, 000 shares
Rs. 300 (Market Price of share)
(*Alternatively, interest on Debt for Plan II can be 20,00,000 X 10% i.e. ` 2,00,000. accordingly, the EPSfor the Plan II will be ` 60)
Q-11 The following data relate to two companies belonging to the same risk class :
Particulars A Ltd. B Ltd
Expected Net Operating Income ` 18,00,000 ` 18,00,000
12% Debt ` 54,00,000 -
Equity Capitalization Rate - 18
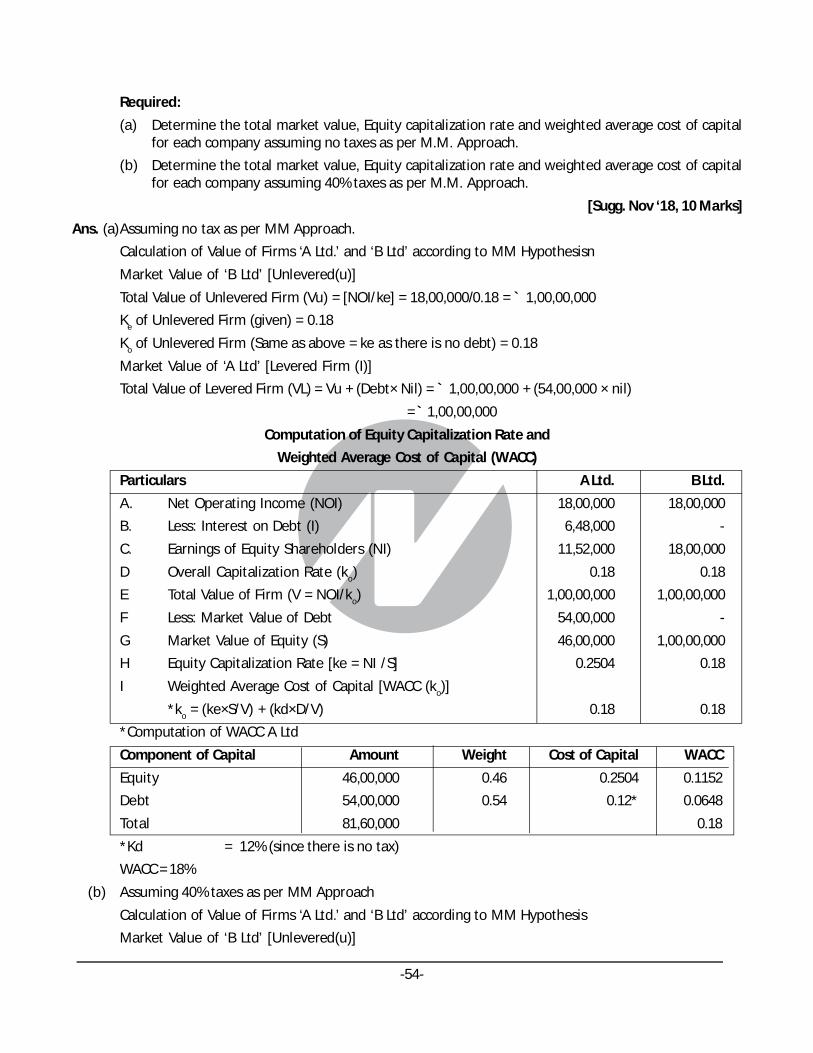
-54-
Required:
(a) Determine the total market value, Equity capitalization rate and weighted average cost of capitalfor each company assuming no taxes as per M.M. Approach.
(b) Determine the total market value, Equity capitalization rate and weighted average cost of capitalfor each company assuming 40% taxes as per M.M. Approach.
[Sugg. Nov ‘18, 10 Marks]
Ans. (a)Assuming no tax as per MM Approach.
Calculation of Value of Firms ‘A Ltd.’ and ‘B Ltd’ according to MM Hypothesisn
Market Value of ‘B Ltd’ [Unlevered(u)]
Total Value of Unlevered Firm (Vu) = [NOI/ke] = 18,00,000/0.18 = ` 1,00,00,000
Ke of Unlevered Firm (given) = 0.18
Ko of Unlevered Firm (Same as above = ke as there is no debt) = 0.18
Market Value of ‘A Ltd’ [Levered Firm (I)]
Total Value of Levered Firm (VL) = Vu + (Debt× Nil) = ` 1,00,00,000 + (54,00,000 × nil)
= ̀ 1,00,00,000
Computation of Equity Capitalization Rate and
Weighted Average Cost of Capital (WACC)
Particulars A Ltd. B Ltd.
A. Net Operating Income (NOI) 18,00,000 18,00,000
B. Less: Interest on Debt (I) 6,48,000 -
C. Earnings of Equity Shareholders (NI) 11,52,000 18,00,000
D Overall Capitalization Rate (ko) 0.18 0.18
E Total Value of Firm (V = NOI/ko) 1,00,00,000 1,00,00,000
F Less: Market Value of Debt 54,00,000 -
G Market Value of Equity (S) 46,00,000 1,00,00,000
H Equity Capitalization Rate [ke = NI /S] 0.2504 0.18
I Weighted Average Cost of Capital [WACC (ko)]
*ko = (ke×S/V) + (kd×D/V) 0.18 0.18
*Computation of WACC A Ltd
Component of Capital Amount Weight Cost of Capital WACC
Equity 46,00,000 0.46 0.2504 0.1152
Debt 54,00,000 0.54 0.12* 0.0648
Total 81,60,000 0.18
*Kd = 12% (since there is no tax)
WACC = 18%
(b) Assuming 40% taxes as per MM Approach
Calculation of Value of Firms ‘A Ltd.’ and ‘B Ltd’ according to MM Hypothesis
Market Value of ‘B Ltd’ [Unlevered(u)]
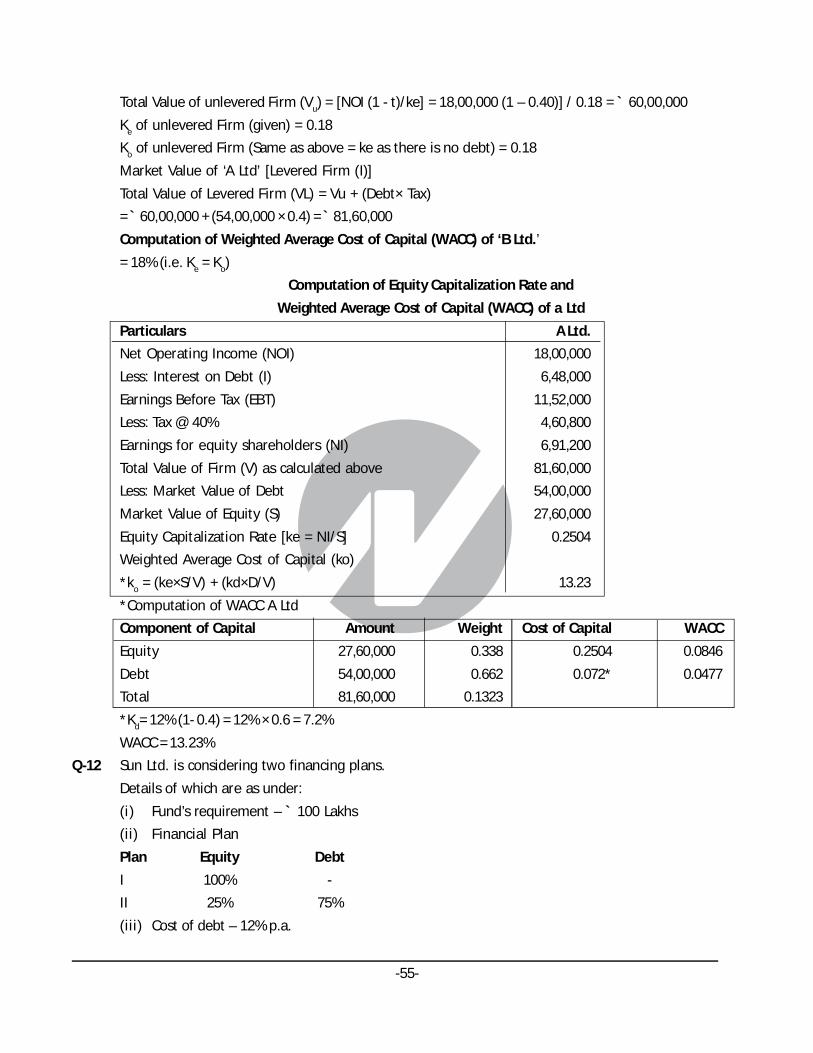
-55-
Total Value of unlevered Firm (Vu) = [NOI (1 - t)/ke] = 18,00,000 (1 – 0.40)] / 0.18 = ` 60,00,000
Ke of unlevered Firm (given) = 0.18
Ko of unlevered Firm (Same as above = ke as there is no debt) = 0.18
Market Value of ‘A Ltd’ [Levered Firm (I)]
Total Value of Levered Firm (VL) = Vu + (Debt× Tax)
= ̀ 60,00,000 + (54,00,000 × 0.4) = ̀ 81,60,000
Computation of Weighted Average Cost of Capital (WACC) of ‘B Ltd.’
= 18% (i.e. Ke = Ko)
Computation of Equity Capitalization Rate and
Weighted Average Cost of Capital (WACC) of a Ltd
Particulars A Ltd.
Net Operating Income (NOI) 18,00,000
Less: Interest on Debt (I) 6,48,000
Earnings Before Tax (EBT) 11,52,000
Less: Tax @ 40% 4,60,800
Earnings for equity shareholders (NI) 6,91,200
Total Value of Firm (V) as calculated above 81,60,000
Less: Market Value of Debt 54,00,000
Market Value of Equity (S) 27,60,000
Equity Capitalization Rate [ke = NI/S] 0.2504
Weighted Average Cost of Capital (ko)
*ko = (ke×S/V) + (kd×D/V) 13.23
*Computation of WACC A Ltd
Component of Capital Amount Weight Cost of Capital WACC
Equity 27,60,000 0.338 0.2504 0.0846
Debt 54,00,000 0.662 0.072* 0.0477
Total 81,60,000 0.1323
*Kd= 12% (1- 0.4) = 12% × 0.6 = 7.2%
WACC = 13.23%
Q-12 Sun Ltd. is considering two financing plans.
Details of which are as under:
(i) Fund’s requirement – ` 100 Lakhs
(ii) Financial Plan
Plan Equity Debt
I 100% -
II 25% 75%
(iii) Cost of debt – 12% p.a.

-56-
(iv) Tax Rate – 30%
(v) Equity Share ` 10 each, issued at a premium of ` 15 per share
(vi) Expected Earnings before Interest and Taxes (EBIT) ` 40 Lakhs
You are required to compute:
(i) EPS in each of the plan
(ii) The Financial Break Even Point
(iii) Indifference point between Plan I and II [Sugg. May ‘18]
Ans. (i) Computation of Earnings Per Share (EPS)
Plans I (`) II (`)
Earnings before interest & tax (EBIT) 40,00,000 40,00,000
Less: Interest charges (12% of `75 lakh) — (9,00,000)
Earnings before tax (EBT) 40,00,000 31,00,000
Less: Tax @ 30% (12,00,000) (9,30,000)
Earnings after tax (EAT) 28,00,000 21,70,000
No. of equity shares (@ 10+`15) 4,00,000 1,00,000
E.P.S (`) 7.00 21.70
(ii) Computation of Financial Break-even Points
Plan ‘I’ = 0 – Under this plan there is no interest payment, hence the financial breakeven point will bezero.
Plan ‘II’ = ` 9,00,000 - Under this plan there is an interest payment of ` 9,00,000,
hence the financial break -even point will be `9 lakhs
(iii) Computation of Indifference Point between Plan I and Plan II:
Indifference point is a point where EBIT of Plan-I and Plan-II are equal. This can be calculated byapplying the following formula:
{(EBIT –I1 ) (1- T)} / E1 = {(EBIT –I2 ) (1- T)} / E2
So EBIT 1 - 0.3 EBIT - 9,00, 000 1 - 0.3
=4,00, 000 shares 1,00, 000 shares
`
Or, 2.8 EBIT – 25,20,000 = 0.7EBIT
Or, 2.1EBIT = 25,20,000
EBIT =12,00,000
Q-13 The management of RT Ltd. wants to raise its funds from market to meet out the financial demands ofits long-term projects. The company has various combinations of proposals to raise its funds. You aregiven the following proposals of the company:
Proposal Equity shares (%) Debts (%) Preference shares (%)
P 100 - -
Q 50 50 -
R 50 - 50

-57-
(i) Cost of debt and preference shares is 12% each.
(ii) Tax rate –40%
(iii) Equity shares of the face value of `10 each will be issued at a premium of `10 per
share.
(iv) Total investment to be raised `8,00,00,000.
(v) Expected earnings before interest and tax `3,60,00,000.
From the above proposals the management wants to take advice from you for appropriate plan aftercomputing the following:
• Earnings per share
• Financial break-even-point
COMPUTE the EBIT range among the plans for indifference.
[RTP-Nov ‘19]
Ans. (i) Computation of Earnings per Share (EPS)
Plans P (`) Q (`) R (`)
Earnings before interest & tax (EBIT) 3,60,00,000 3,60,00,000 3,60,00,000
Less: Interest charges — (48,00,000) —
Earnings before tax (EBT) 3,60,00,000 3,12,00,000 3,60,00,000
Less : Tax @ 40% (1,44,00,000) (1,24,80,000) (1,44,00,000)
Earnings after tax (EAT) 2,16,00,000 1,87,20,000 2,16,00,000
Less : Preference share dividend — — (48,00,000)
Earnings available for equityshareholders 2,16,00,000 1,87,20,000 1,68,00,000
No. of equity shares 40,00,000 20,00,000 20,00,000
E.P.S 5.40 9.36 8.40
(ii) Computation of Financial Break-even Points
Proposal ’P’ = 0
Proposal ‘Q’ = ` 48,00,000 (Interest charges)
Proposal ‘R’ = Earnings required for payment of preference share dividend
i.e. ` 48,00,000 0.6 = ` 80,00,000
(iii) Computation of Indifference Point between the Proposals
Combination of Proposals
(a) Indifference point where EBIT of proposal “P” and proposal ‘Q’ is equal
EBIT - 48,00,000 1- 0.4EBIT(1- 0.4)=
40,00,000 shares 20,00,000 shares
0.6 EBIT = 1.2 EBIT – ` 57,60,000
EBIT = ` 96,00,000

-58-
(b) Indifference point where EBIT of proposal ‘P’ and proposal ‘R’ is equal:
EBIT 1- 0.40 - 48,00,000EBIT(1- 0.40)=
40,00,000 shares 20,00,000shares
`
0.6 EBIT 0.6 EBIT - 48,00,000=
40,00,000 shares 20,00,000 shares`
0.30 EBIT = 0.6 EBIT – ̀ 48,00,000
48,00,000EBIT = = 1,60,00,000
0.30`
`
(c) Indifference point where EBIT of proposal ‘Q’ and proposal ‘R’ are equal
EBIT - 48,00,000 1- 0.4 EBIT 48,00,000=
20,00,000 shares 20,00,000 shares
` `
There is no indifference point between proposal ‘Q’ and proposal ‘R’
Q-14 Akash Limited provides you the following information:
(` )
Profit (EBIT) 2,80,000
Less: Interest on Debenture @ 10% (40,000)
EBT 2,40,000
Less Income Tax @ 50% (1,20,000)
1,20,000
No. of Equity Shares (` 10 each) 30,000
Earnings per share (EPS) 4
Price /EPS (PE) Ratio 10
The company has reserves and surplus of ` 7,00,000 and required ` 4,00,000 further for modernisation.Return on Capital Employed (ROCE) is constant. Debt (Debt/ Debt + Equity) Ratio higher than 40% willbring the P/E Ratio down to 8 and increase the interest rate on additional debts to 12%. You arerequired to ASCERTAIN the probable price of the share.
(i) If the additional capital are raised as debt; and
(ii) If the amount is raised by issuing equity shares at ruling market price. [RTP-May ‘19]
Ans. Ascertainment of probable price of shares of Akash limited
Particulars Plan-I Plan-II
If ` 4,00,000is If ` 4,00,000 is
raised asdebt (`) raised byissuingequity shares(`)
Earnings Before Interest and Tax (EBIT)
{20% of new capital i.e. 20% of (`14,00,000 + `4,00,000)}
(Refer working note1) 3,60,000 3,60,000
Less: Interest on old debentures(10% of `4,00,000) (40,000) (40,000)
Less: Interest on new debt(12% of `4,00,000) (48,000) —

-59-
Earnings Before Tax (EBT) 2,72,000 3,20,000
Less: Tax @ 50% (1,36,000) (1,60,000)
Earnings for equity shareholders (EAT) 1,36,000 1,60,000
No. of Equity Shares (refer working note 2) 30,000 40,000
Earnings per Share (EPS) ` 4.53 ` 4.00
Price/ Earnings (P/E) Ratio (refer working note 3) 8 10
Probable Price Per Share (PE Ratio × EPS) ` 36.24 ` 40
Working Notes:
1. Calculation of existing Return of Capital Employed (ROCE):
(` )
Equity Share capital (30,000 shares × `10) 3,00,000
10010% Debentures 40, 000 ×
10` 4,00,000
Reserves and Surplus 7,00,000
Total Capital Employed 14,00,000
Earnings before interest and tax (EBIT) (given) 2,80,000
2,80,000ROCE = ×100
14,00, 000
`
`20%
2. Number of Equity Shares to be issued in Plan-II:
4, 00, 000= = 10, 00, 000 shares
40
`
`
Thus, after the issue total number of shares = 30,000+ 10,000 = 40,000 shares
3. Debt/Equity Ratio if ` 4,00,000 is raised as debt:
8,00, 000= × 100 = 44.44%
18, 00,000
`
`
As the debt equity ratio is more than 40% the P/E ratio will be brought down to 8 in Plan-I.
Q-15 Rounak Ltd. is an all equity financed company with a market value of ` 25,00,000 and cost of equity (Ke)21%. The company wants to buyback equity shares worth ` 5,00,000 by issuing and raising 15% perpetualdebt of the same amount. Rate of tax may be taken as 30%. After the capital restructuring and applyingMM Model (with taxes), you are required to COMPUTE:
(i) Market value of J Ltd.
(ii) Cost of Equity (Ke)
(iii) Weighted average cost of capital (using market weights) and comment on it.
[RTP-Nov ‘18]

-60-
Ans. Value of a company (V) = Value of equity (S) + Value of debt (D)
` 25,00,000 =Net Income(NI)
Ke+ ` 5,00,000
Or, Net Income (NI) = 0.21 (` 25,00,000 – ` 5,00,000)
Market Value of Equity = ` 25,00,000
Ke =21%
Net income (NI) for equity holders
Ke= Market Value of Equity
Net income (NI) for equity holders
0.21= ̀ 25,00,000
Net income for equity holders = ` 5,25,000
EBIT = 5,25,000/0.7 = ̀ 7,50,000
All Equity Debt and Equity
` `
EBIT 7,50,000 7,50,000
Interest to debt-holders - (75,000)
EBT 7,50,000 6,75,000
Taxes (30%) (2,25,000) (2,02,500)
Income available to equity shareholders 5,25,000 4,72,500
Income to debt holders plus income available toshareholders 5,25,000 5,47,500
Present value of tax-shield benefits = ` 5,00,000 × 0.30 = ` 1,50,000
(i) Value of Restructured firm = ` 25,00,000 + ` 1,50,000 = ̀ 26,50,000
(ii) Cost of Equity (Ke)
Total Value = ̀ 26,50,000
Less: Value of Debt = ̀ 5,00,000
Value of Equity = ̀ 21,50,000
4,72, 500K = = 0.219 = 21.98%e
21,50, 000
(iii) WACC (on market value weight)
Cost of Debt (after tax) = 15% (1- 0.3) = 0.15 (0.70) = 0.105 = 10.5%
Components of Costs Amount(`) Cost of Capital(%) Weight WACC(%)
Equity 21,50,000 21.98 0.81 17.80
Debt 5,00,000 10.50 0.19 2.00
26,50,000 19.80
Comment: At present the company is all equity financed. So, Ke = Ko i.e. 21%. However, afterrestructuring, the Ko would be reduced to 19.80% and Ke would increase from 21% to 21.98%.

-61-
Q-16 Company P and Q are identical in all respects including risk factors except for debt/equity, company Phaving issued 10% debentures of `18 lakhs while company Q is unlevered.Both the companies earn20% before interest and taxes on their total assets of ` 30 lakhs.
Assuming a tax rate of 50% and capitalization rate of 15% from an all-equity company.
Required:
CALCULATE the value of companies’ P and Q using
(i) Net Income Approach and
(ii) Net Operating Income Approach. [RTP-May ‘18]
Ans. (i) Valuation under Net Income Approach
Particulars P Q
Amount (`) Amount (`)
Earnings before Interest & Tax (EBIT)(20% of ` 30,00,000) 6,00,000 6,00,000
Less: Interest (10% of ` 18,00,000) 1,80,000
Earnings before Tax (EBT) 4,20,000 6,00,000
Less: Tax @ 50% 2,10,000 3,00,000
Earnings after Tax (EAT)(available to equity holders) 2,10,000 3,00,000
Value of equity (capitalized @ 15%) 14,00,000 20,00,000
(2,10,000 × 100/15) (3,00,000 × 100/15)
Add: Total Value of debt 18,00,000 Nil
Total Value of Company 32,00,000 20,00,000
(ii) Valuation of Companies under Net Operating Income Approach
Particulars P Q
Amount (`) Amount (`)
Capitalisation of earnings at 15%
6, 00, 000 1.0.5
0.15
`20,00,000 20,00,000
Less: Value of debt{18,00,000 (1 – 0.5)} 9,00,000 Nil
Value of equity 11,00,000 20,00,000
Add: Total Value of debt 18,00,000 Nil
Total Value of Company 29,00,000 20,00,000

-62-
CHAPTER-6FINANCING DECISIONS - LEVERAGES
Q-1 The following information is related to YZ Company Ltd. for the year ended 31st March, 2020:
Equity share capital (of ` 10 each) ` 50 lakhs
12% Bonds of ` 1,000 each ` 37 lakhs
Sales ` 84 lakhs
Fixed cost (excluding interest) ` 6.96 lakhs
Financial leverage 1.49
Profit-volume Ratio 27.55%
Income Tax Applicable 40%
You are required to CALCULATE:
(i) Operating Leverage;
(ii) Combined leverage; and
(iii) Earnings per share.
Show calculations up-to two decimal points. [RTP-May-20]
Ans. Computation of Profits after Tax (PAT)
Particulars Amount (`)
Sales 84,00,000
Contribution (Sales × P/V ratio) 23,14,200
Less: Fixed cost (excluding Interest) (6,96,000)
EBIT (Earnings before interest and tax) 16,18,200
Less: Interest on debentures (12% x ` 37 lakhs) (4,44,000)
Less: Other fixed Interest (balancing figure) (88,160)
EBT (Earnings before tax) 10,86,040*
Less: Tax @ 40% 4,34,416
PAT (Profit after tax) 6,51,624
(i) Operating Leverage:
Contribution 23,14,200= = 1.43
EBIT 16,18,200` `
(ii) Combined Leverage:
= Operating Leverage × Financial Leverage
= 1.43 x 1.49 = 2.13

-63-
Or,
Combined Leverage = Contribution EBIT
×EBIT EBT
Combined Leverage = Contribution 23,14,200
= = 2.13EBT 10,86,040
` `
*Financial Leverage = EBIT 16,18,200
= =1.49EBT EBT
`
So, EBT 16,18,200
= = 10,86,0401.49
` `
Accordingly, other fixed interest
= ` 16,18,200 - ` 10,86,040 - ` 4,44,000 = ` 88,160
(iii) Earnings per share (EPS):
PAT 6,51,624= = = 1.30
No.of shares outstanding 5,00,000 equity shares`
`
Q-2 B LLP. has the following balance sheet and Income statement information:Balance Sheet as on March 31st 2019
Liabilities (Rs.) Assets (Rs.)
Partners’ Capital 80,00,000 Net Fixed Assets 1,00,00,000
Term Loan 60,00,000 Inventories 45,00,000
Retained Earnings 35,00,000 Trade Receivables 40,50,000
Trade Payables 15,00,000 Cash & Bank 4,50,000
1,90,00,000 1,90,00,000
Income Statement for the year ending March 31st 2019
(Rs.)
Sales 34,00,000
Operating expenses (including Rs. 6,00,000 depreciation) 12,00,000
EBIT 22,00,000
Less: Interest 6,00,000
Earnings before tax 16,00,000
Less: Taxes 5,60,000
Net Earnings (EAT) 10,40,000
COMPUTE the degree of operating, financial and combined leverages at the current sales level, if alloperating expenses, other than depreciation, are variable costs.
[3 Marks][MTP-Oct ‘19]
Ans. Computation of Degree of Operating (DOL), Financial (DFL) and Combined leverages (DCL)
Rs.34,00,000 -Rs.6,00,000DOL = = 1.27
Rs.22,00,000
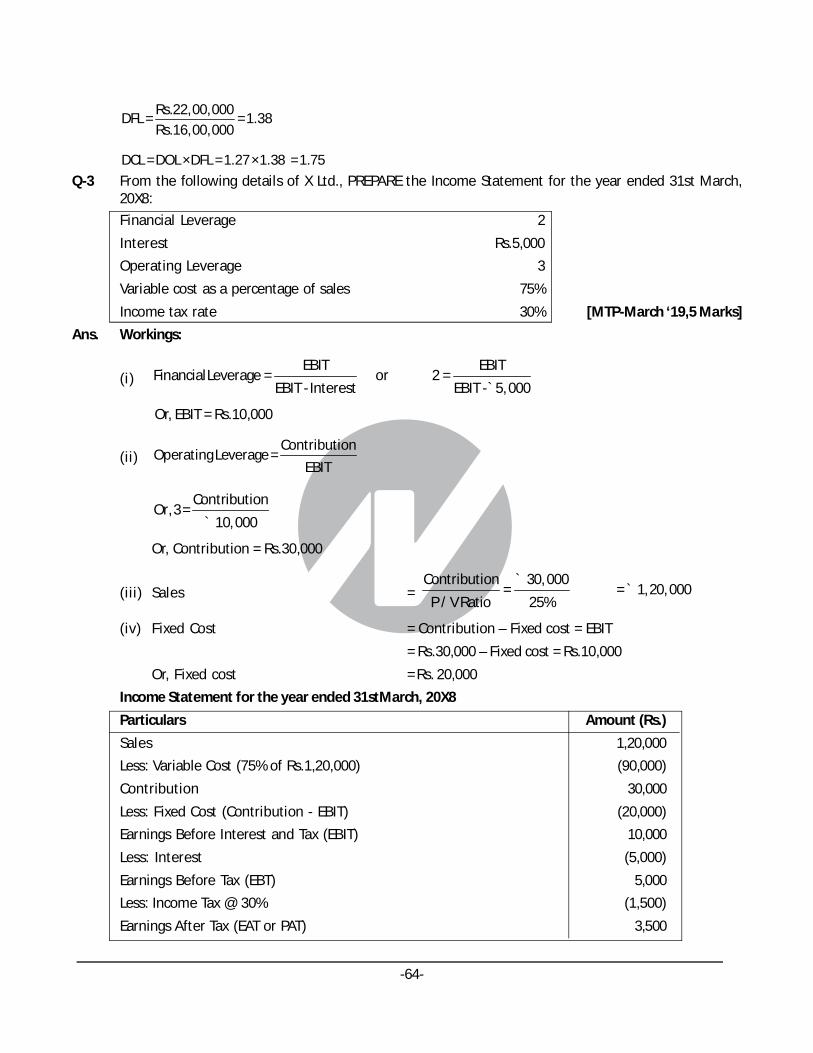
-64-
Rs.22,00,000DFL = = 1.38
Rs.16,00,000
DCL = DOL ×DFL = 1.27 ×1.38 = 1.75
Q-3 From the following details of X Ltd., PREPARE the Income Statement for the year ended 31st March,20X8:
Financial Leverage 2
Interest Rs.5,000
Operating Leverage 3
Variable cost as a percentage of sales 75%
Income tax rate 30% [MTP-March ‘19,5 Marks]
Ans. Workings:
(i)EBIT EBIT
Financial Leverage = or 2 =EBIT - Interest EBIT - 5, 000`
Or, EBIT = Rs.10,000
(ii)Contribution
Operating Leverage = EBIT
ContributionOr, 3 =
10, 000`
Or, Contribution = Rs.30,000
(iii) Sales = Contribution 30, 000
= = 1,20, 000P / V Ratio 25%
` `
(iv) Fixed Cost = Contribution – Fixed cost = EBIT
= Rs.30,000 – Fixed cost = Rs.10,000
Or, Fixed cost = Rs. 20,000
Income Statement for the year ended 31stMarch, 20X8
Particulars Amount (Rs.)
Sales 1,20,000
Less: Variable Cost (75% of Rs.1,20,000) (90,000)
Contribution 30,000
Less: Fixed Cost (Contribution - EBIT) (20,000)
Earnings Before Interest and Tax (EBIT) 10,000
Less: Interest (5,000)
Earnings Before Tax (EBT) 5,000
Less: Income Tax @ 30% (1,500)
Earnings After Tax (EAT or PAT) 3,500
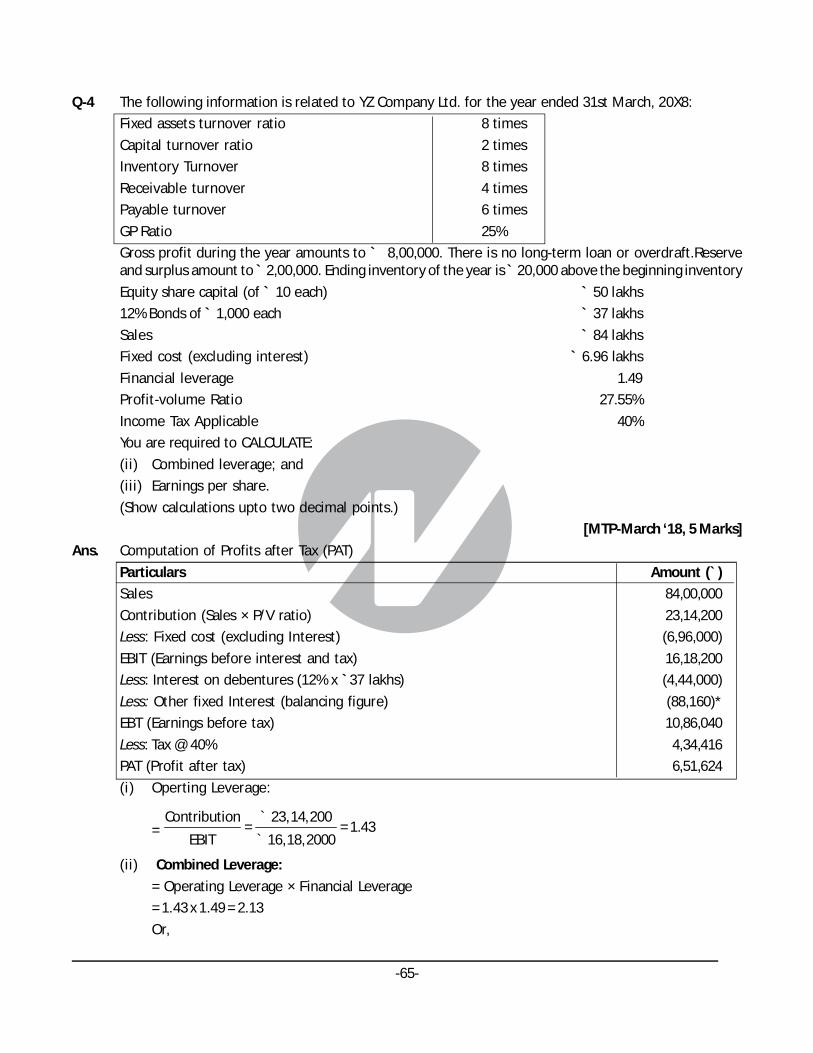
-65-
Q-4 The following information is related to YZ Company Ltd. for the year ended 31st March, 20X8:
Fixed assets turnover ratio 8 times
Capital turnover ratio 2 times
Inventory Turnover 8 times
Receivable turnover 4 times
Payable turnover 6 times
GP Ratio 25%
Gross profit during the year amounts to ` 8,00,000. There is no long-term loan or overdraft.Reserveand surplus amount to ` 2,00,000. Ending inventory of the year is ̀ 20,000 above the beginning inventory
Equity share capital (of ` 10 each) ` 50 lakhs
12% Bonds of ` 1,000 each ` 37 lakhs
Sales ` 84 lakhs
Fixed cost (excluding interest) ` 6.96 lakhs
Financial leverage 1.49
Profit-volume Ratio 27.55%
Income Tax Applicable 40%
You are required to CALCULATE:
(ii) Combined leverage; and
(iii) Earnings per share.
(Show calculations upto two decimal points.)
[MTP-March ‘18, 5 Marks]
Ans. Computation of Profits after Tax (PAT)
Particulars Amount (`)
Sales 84,00,000
Contribution (Sales × P/V ratio) 23,14,200
Less: Fixed cost (excluding Interest) (6,96,000)
EBIT (Earnings before interest and tax) 16,18,200
Less: Interest on debentures (12% x `37 lakhs) (4,44,000)
Less: Other fixed Interest (balancing figure) (88,160)*
EBT (Earnings before tax) 10,86,040
Less: Tax @ 40% 4,34,416
PAT (Profit after tax) 6,51,624
(i) Operting Leverage:
= 23,14,20Contribu 0
= = 1.43EBIT 16,18,2000
tion `
`
(ii) Combined Leverage:
= Operating Leverage × Financial Leverage
= 1.43 x 1.49 = 2.13
Or,

-66-
Combined Leverage: EBIT
EBIT
Contribution
EBT
Or, Combined Leverage =23,14,20Contribu 0
= = 2.13EBT 10,86, 0
ti n
40
o `
`
Or, Combined Leverage =EBIT 16,18,200
= = 1.49EBT EBT
`
So, = 16,18,200
EBT = = 10, 86, 0401.49
``
Accordingly,other fixed interest
= ` 16,18,200 - ` 10,86,040 - ` 4,44,000 = ` 88,160
(iii) Earnings per share (EPS):
PAT 6,51,
No.of shares outstanding 5, 00, 000 equity shares
624= = 1.30
` `
Q-5 NSG Ltd. has sales of Rs. 75,00,000 variable cost of Rs. 42,00,000, and fixed cost of Rs. 6,00,000.ThePresent capital structure of NSG is as follows:
Equity Shares Rs. 55,00,000
Debt (12%) Rs. 45,00,000
Total Rs. 1,00,00,000
(i) DETERMINE the ROCE of NSG Ltd.
(ii) Does NSG have a favourable financial leverage? ANALYSE.
(iii) If the industry average of asset turnover is 3, does it have a high or low asset leverage?
DETERMINE
(iv) COMPUTE the leverages of NSG?
(v) DETERMINE, at what level of sales, will the EBT be zero? [MTP-April ‘18, Oct.‘18, 5 Marks]
Ans. (i) EBIT Rs.27, 00, 000
ROCE = = ×100 = 27%Capital Employed Rs.1, 00,00, 000
Workings:(I) Calculation of EBT: Rs.
Sales 75,00,000Less: Variable costs 42,00,000Contribution 33,00,000Less: Fixed costs 6,00,000EBIT 27,00,000Less: Interest (12 % of Rs. 45,00,000) 5,40,000
21,60,000

-67-
(II) Capital employed = Debt + Equity Shares = Rs. 1,00,00,000.
(ii) Since ROCE (27%) is higher than the interest payable on debt (12%). NSG has a favourable financialleverage.
(iii) Capital employed = Total assets = Rs. 1,00,00,000
Net sales = Rs. 75,00,000
Therefore, turnover ratio =Rs.75,00, 000
= 0.75Rs.1, 00,00, 000
The industry average is 3 against NSG’s ratio of 0.75. Hence NSG Ltd. has very low asset leverage.
(iv) Operating leverage = Rs. 33,00, 000
Rs
Contribution= = 1.22
EBI . 27, 00,000T
Financial Leverage = Rs. 27, 00,000
Rs. 21,60, 0
EBIT= = 1.25
EB 00T
Combined leverage = Rs. 33,00, 000
Rs
Contribution= = 1.53
EBI . 21,60, 000TOr
DCL = DOL × DFL = 1.22 × 1.25 = 1.53(v) For EBT to become zero, a 100% reduction in the EBT is required. As the combinedleverage is 1.53, sales
have to drop approx. by 100/1.53 = 65.36%. Hence, the new sales will be:Rs. 75,00,000 × (100 – 65.36%) = Rs. 25,98,000
Q-6 From the following, PREPARE Income Statement of Company A and B.
Company A B
Financial leverage 3:1 4:1
Interest Rs.20,000 Rs.30,000
Operating leverage 4:1 5:1
Variable Cost as a Percentage to Sales2
66 %3
75%
Income tax Rate 45% 45%
[MTP-Aug ‘18, 10 Marks]
Ans. Working Notes:
Company A
EBIT 3Financial leverage = = = Or,EBIT = 3 × EBT
EBT 1(1)
Again EBIT – Interest = EBT
Or, EBIT- 20,000 = EBT (2)
Taking (1) and (2) we get
3 EBT- 20,000 = EBT
Or, 2 EBT = 20,000 or EBT = Rs.10,000
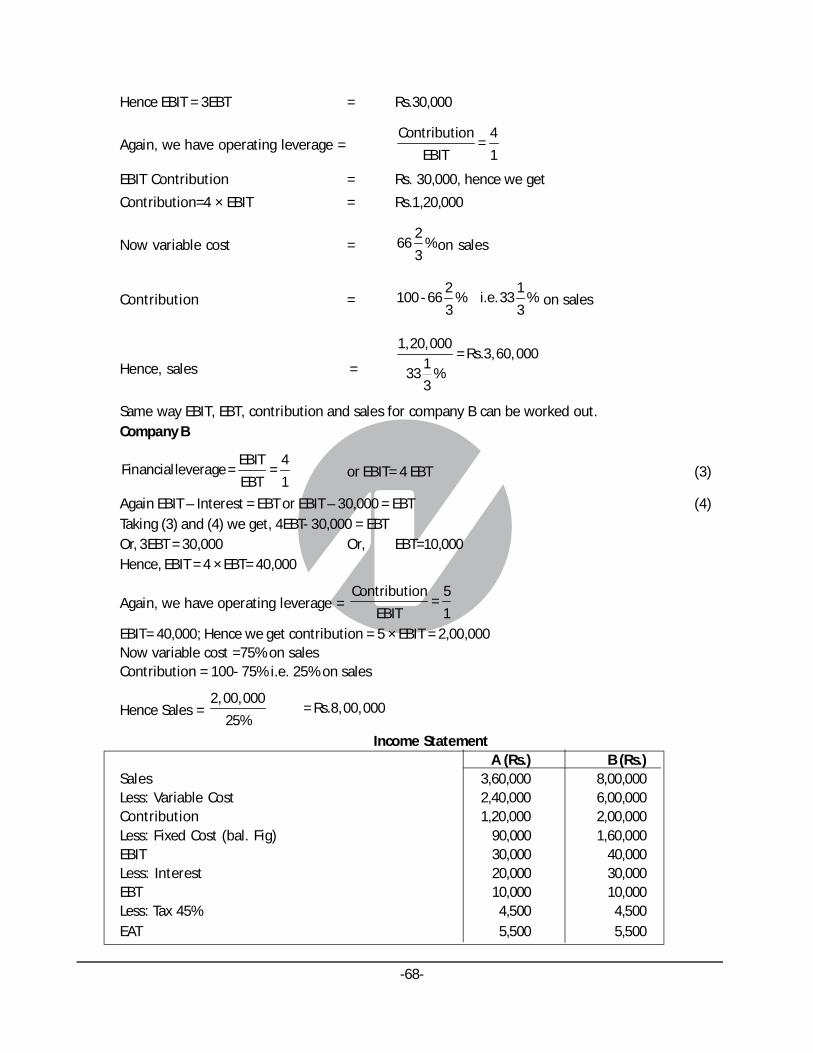
-68-
Hence EBIT = 3EBT = Rs.30,000
Again, we have operating leverage =Contribution 4
=EBIT 1
EBIT Contribution = Rs. 30,000, hence we get
Contribution=4 × EBIT = Rs.1,20,000
Now variable cost =2
66 %3
on sales
Contribution =2 1
100 - 66 % i.e. 33 %3 3
on sales
Hence, sales =
1,20,000= Rs.3,60, 000
133 %
3
Same way EBIT, EBT, contribution and sales for company B can be worked out.Company B
EBIT 4Financial leverage = =
EBT 1or EBIT= 4 EBT (3)
Again EBIT – Interest = EBT or EBIT – 30,000 = EBT (4)Taking (3) and (4) we get, 4EBT- 30,000 = EBTOr, 3EBT = 30,000 Or, EBT=10,000Hence, EBIT = 4 × EBT= 40,000
Again, we have operating leverage = Contribution 5
=EBIT 1
EBIT= 40,000; Hence we get contribution = 5 × EBIT = 2,00,000Now variable cost =75% on salesContribution = 100- 75% i.e. 25% on sales
Hence Sales = 2, 00,000
= Rs.8,00,00025%
Income StatementA (Rs.) B (Rs.)
Sales 3,60,000 8,00,000Less: Variable Cost 2,40,000 6,00,000Contribution 1,20,000 2,00,000Less: Fixed Cost (bal. Fig) 90,000 1,60,000EBIT 30,000 40,000Less: Interest 20,000 30,000EBT 10,000 10,000Less: Tax 45% 4,500 4,500EAT 5,500 5,500
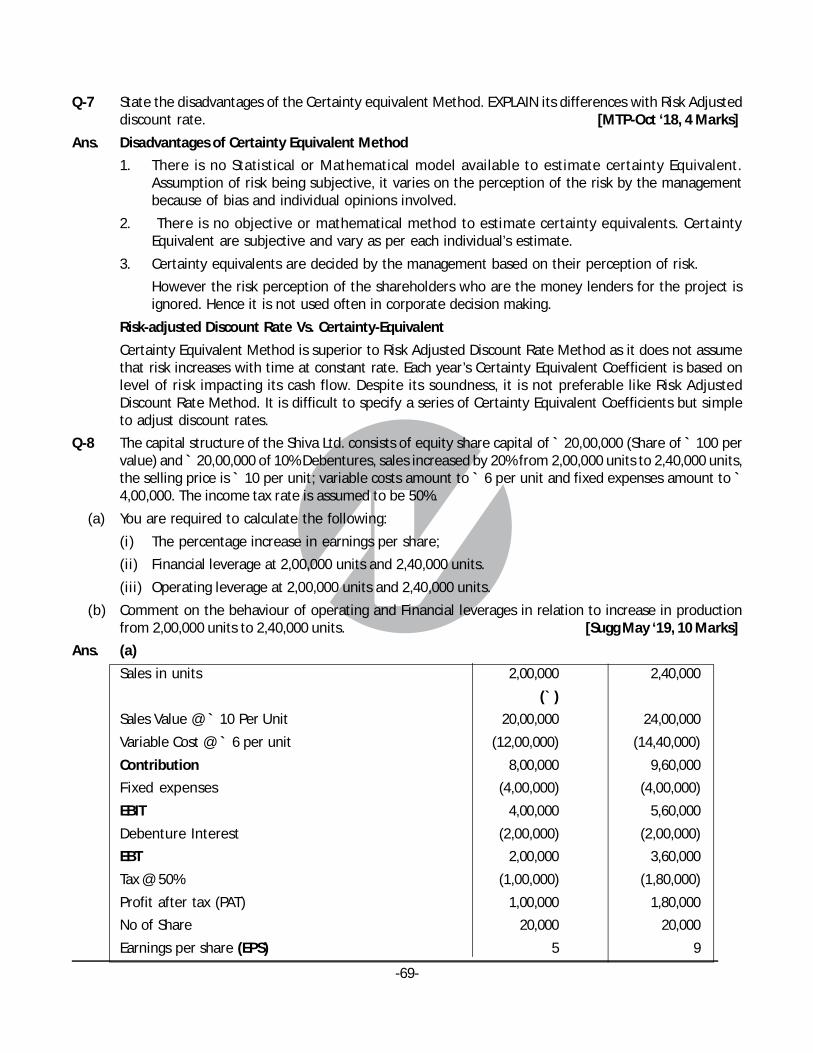
-69-
Q-7 State the disadvantages of the Certainty equivalent Method. EXPLAIN its differences with Risk Adjusteddiscount rate. [MTP-Oct ‘18, 4 Marks]
Ans. Disadvantages of Certainty Equivalent Method
1. There is no Statistical or Mathematical model available to estimate certainty Equivalent.Assumption of risk being subjective, it varies on the perception of the risk by the managementbecause of bias and individual opinions involved.
2. There is no objective or mathematical method to estimate certainty equivalents. CertaintyEquivalent are subjective and vary as per each individual’s estimate.
3. Certainty equivalents are decided by the management based on their perception of risk.
However the risk perception of the shareholders who are the money lenders for the project isignored. Hence it is not used often in corporate decision making.
Risk-adjusted Discount Rate Vs. Certainty-Equivalent
Certainty Equivalent Method is superior to Risk Adjusted Discount Rate Method as it does not assumethat risk increases with time at constant rate. Each year’s Certainty Equivalent Coefficient is based onlevel of risk impacting its cash flow. Despite its soundness, it is not preferable like Risk AdjustedDiscount Rate Method. It is difficult to specify a series of Certainty Equivalent Coefficients but simpleto adjust discount rates.
Q-8 The capital structure of the Shiva Ltd. consists of equity share capital of ` 20,00,000 (Share of ` 100 pervalue) and ` 20,00,000 of 10% Debentures, sales increased by 20% from 2,00,000 units to 2,40,000 units,the selling price is ` 10 per unit; variable costs amount to ` 6 per unit and fixed expenses amount to `4,00,000. The income tax rate is assumed to be 50%.
(a) You are required to calculate the following:
(i) The percentage increase in earnings per share;
(ii) Financial leverage at 2,00,000 units and 2,40,000 units.
(iii) Operating leverage at 2,00,000 units and 2,40,000 units.
(b) Comment on the behaviour of operating and Financial leverages in relation to increase in productionfrom 2,00,000 units to 2,40,000 units. [Sugg May ‘19, 10 Marks]
Ans. (a)
Sales in units 2,00,000 2,40,000
(` )
Sales Value @ ` 10 Per Unit 20,00,000 24,00,000
Variable Cost @ ` 6 per unit (12,00,000) (14,40,000)
Contribution 8,00,000 9,60,000
Fixed expenses (4,00,000) (4,00,000)
EBIT 4,00,000 5,60,000
Debenture Interest (2,00,000) (2,00,000)
EBT 2,00,000 3,60,000
Tax @ 50% (1,00,000) (1,80,000)
Profit after tax (PAT) 1,00,000 1,80,000
No of Share 20,000 20,000
Earnings per share (EPS) 5 9

-70-
(i) The percentage Increase in EPS4
×100 = 80%5
(ii) Financial Leverage = EBTEBT
4,00,000= 2
2,00,000` `
5,60,000= 1.56
3,60,000` `
(iii) Operating leverage= Contribution
EBIT
8,00,000= 2
4,00,000` `
9,60,000= 1.71
5,60,000` `
(b) When production is increased from 2,00,000 units to 2,40,000 units both financial leverage and operatingleverages reduced from 2 to 1.56 and 1.71 respectively. Reduction in financial leverage and operatingleverages signifies reduction in business risk and financial risk.
Q-9 Following is the Balance Sheet of Soni Ltd. as on 31st March, 2018 :
Liabilities Amount in `
Shareholder’s Fund
Equity Share Capital (` 10 each) 25,00,000
Reserve and Surplus 5,00,000
Non-Current Liabilities (12 Debentures) 50,00,000
Current Liabilities 20,00,000
Total 1,00,00,000
Assets Amount in `
Non-Current Assets 60,00,000
Current Assets 40,00,000
Total 1,00,00,000
Additional Information:
(i) Variable Cost is 60% of Sales.
(ii) Fixed Cost p.a. excluding interest ` 20,00,000.
(iii) Total Asset Turnover Ratio is 5 times.
(iv) Income Tax Rate 25%
You are required to:
(1) Prepare Income Statement
(2) Calculate the following and comment:
(a) Operating Leverage
(b) Financial Leverage
(c) Combined Leverage
[Sugg-Nov ‘18, 10 Marks]
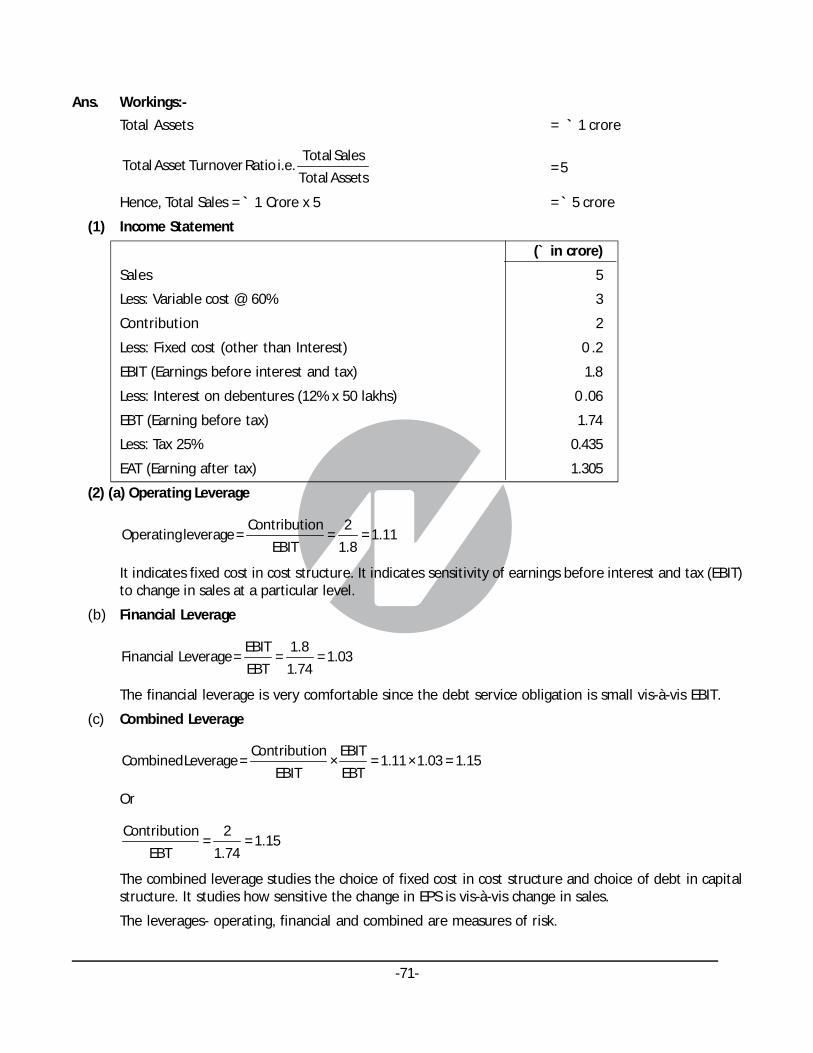
-71-
Ans. Workings:-
Total Assets = ` 1 crore
Total SalesTotal Asset Turnover Ratio i.e.
Total Assets= 5
Hence, Total Sales = ` 1 Crore x 5 = ` 5 crore
(1) Income Statement
(` in crore)
Sales 5
Less: Variable cost @ 60% 3
Contribution 2
Less: Fixed cost (other than Interest) 0 .2
EBIT (Earnings before interest and tax) 1.8
Less: Interest on debentures (12% x 50 lakhs) 0 .06
EBT (Earning before tax) 1.74
Less: Tax 25% 0.435
EAT (Earning after tax) 1.305
(2) (a) Operating Leverage
Contribution 2Operating leverage = = = 1.11
EBIT 1.8
It indicates fixed cost in cost structure. It indicates sensitivity of earnings before interest and tax (EBIT)to change in sales at a particular level.
(b) Financial Leverage
EBIT 1.8Financial Leverage = = = 1.03
EBT 1.74
The financial leverage is very comfortable since the debt service obligation is small vis-à-vis EBIT.
(c) Combined Leverage
Contribution EBITCombined Leverage = × = 1.11 × 1.03 = 1.15
EBIT EBT
Or
Contribution 2= = 1.15
EBT 1.74
The combined leverage studies the choice of fixed cost in cost structure and choice of debt in capitalstructure. It studies how sensitive the change in EPS is vis-à-vis change in sales.
The leverages- operating, financial and combined are measures of risk.

-72-
Q-10 The following data have been extracted from the books of LM Ltd:Sales - ` 100 lakhsInterest Payableper annum - ` 10 lakhs
Operating leverage - 1.2
Combined leverage - 2.16
You are required to calculate:
(i) The financial leverage,
(ii) Fixed cost and
(iii) P/V ratio
[Sugg. May ‘18, 5 Marks]
Ans.(i) Calculation of Financial Leverage:
Combined Leverage (CL) = Operating Leverage (OL) x Financial Leverage (FL)
2.16 = 1.2 x FL
FL = 1.8
(ii) Calculation of Fixed cost:
1066.94IRR = 20% + 10% × = 28.23%
1296.82
EBIT1.8 =
EBIT - 10,00, 000
1.8 (EBIT – 10,00,000) = EBIT
1.8 (EBIT – 18,00,000) = EBIT
18, 00,000EBIT = = 22, 50,000
0.8`
Further, Operating Leverage = Contribution
ContributionFurther, Operating Leverage =
EBIT
Contribution1.2 =
22,50, 000`
Contribution = ` 27,00,000
Fixed Cost =Contribution-EBIT
= ` 27,00,000- ` 22,50,00
Fixed Cost= ` 4,50,000
(iii) Calculation of P/V ratio:
Contribution(C) 27, 00, 000P / V ratio = ×100 = ×100 = 27%
Sales(S) 100, 00, 000
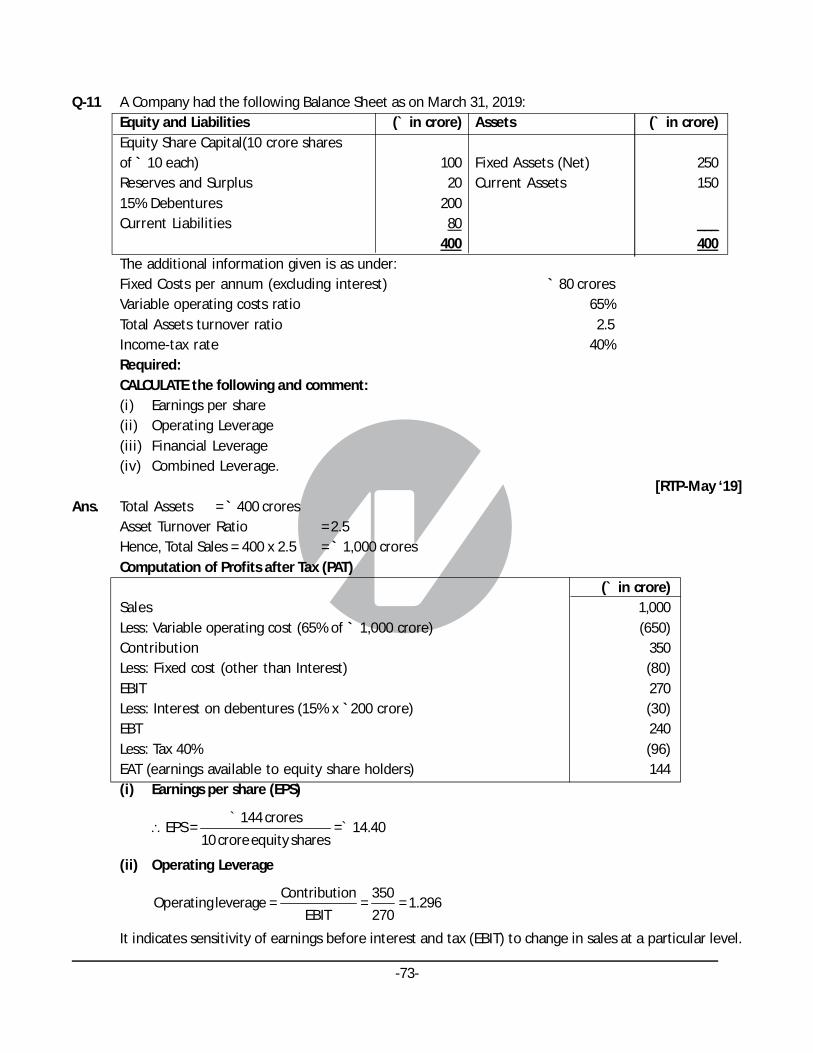
-73-
Q-11 A Company had the following Balance Sheet as on March 31, 2019:Equity and Liabilities (` in crore) Assets (` in crore)Equity Share Capital(10 crore sharesof ` 10 each) 100 Fixed Assets (Net) 250Reserves and Surplus 20 Current Assets 15015% Debentures 200Current Liabilities 80 ___
400 400The additional information given is as under:Fixed Costs per annum (excluding interest) ` 80 croresVariable operating costs ratio 65%Total Assets turnover ratio 2.5Income-tax rate 40%Required:CALCULATE the following and comment:(i) Earnings per share(ii) Operating Leverage(iii) Financial Leverage(iv) Combined Leverage.
[RTP-May ‘19]Ans. Total Assets = ` 400 crores
Asset Turnover Ratio = 2.5Hence, Total Sales = 400 x 2.5 = ` 1,000 croresComputation of Profits after Tax (PAT)
(` in crore)Sales 1,000Less: Variable operating cost (65% of ` 1,000 crore) (650)Contribution 350Less: Fixed cost (other than Interest) (80)EBIT 270Less: Interest on debentures (15% x `200 crore) (30)EBT 240Less: Tax 40% (96)EAT (earnings available to equity share holders) 144(i) Earnings per share (EPS)
144 crores
EPS = = 14.4010 crore equity shares
` `
(ii) Operating Leverage
Contribution 350Operating leverage = = = 1.296
EBIT 270
It indicates sensitivity of earnings before interest and tax (EBIT) to change in sales at a particular level.

-74-
(iii) Financial Leverage
EBIT 270Financial Leverage = = = 1.125
EBT 240
The financial leverage is very comfortable since the debt service obligation is small vis-à-vis EBIT.
(iv) Combined Leverage
Contribution EBITCombined Leverage = ×
EBIT EBT
Or, Operating Leverage × Financial Leverage = 1.296 x 1.125 = 1.458
The combined leverage studies the choice of fixed cost in cost structure and choice of debt incapital structure. It studies how sensitive the change in EPS is vis-à-vis change in sales.
Q-12 A firm has sales of ̀ 75,00,000 variable cost is 56% and fixed cost is ̀ 6,00,000. It has adebt of ̀ 45,00,000at 9% and equity of ` 55,00,000. You are required to INTERPRET:
(i) The firm’s ROI?
(ii) Does it have favourable financial leverage?
(iii) If the firm belongs to an industry whose capital turnover is 3, does it have a high or low capitalturnover?
(iv) The operating, financial and combined leverages of the firm?
(v) If the sales is increased by 10% by what percentage EBIT will increase?
(vi) At what level of sales the EBT of the firm will be equal to zero?
(vii) If EBIT increases by 20%, by what percentage EBT will increase? [RTP-Nov ‘18]
Ans. Income StatementParticulars Amount (`)Sales 75,00,000Less: Variable cost (56% of 75,00,000) (42,00,000)
Contribution 33,00,000
Less: Fixed costs (6,00,000)
Earnings before interest and tax (EBIT) 27,00,000
Less: Interest on debt (@ 9% on ` 45 lakhs) (4,05,000)
Earnings before tax (EBT) 22,95,000
(i)EBIT EBIT
ROI = ×100 = ×100Capital employed Equity +Debt
27,00, 000= ×100 = 27%
55, 00, 000 + 45,00,000
(ROI is calculated on Capital Employed)
(ii) ROI = 27% and Interest on debt is 9%, hence, it has a favourable financial leverage.

-75-
(iii)Net Sales
Capital Turnover = Capital
Net Sales 75,00,000Or = = = 0.75
Capital 1, 00,00, 000
`
`
Which is very low as compared to industry average of 3.
(iv) Calculation of Operating, Financial and Combined leverages
(a) Operating Leverage =Contribution
EBIT= 33,00, 000
= 1.22 approx27, 00,000
`
`
(b) Financial Leverage =EBIT
EBT= 27,00, 000
= 1.8 approx22,95,000
`
`
(c) Combined Leverage =Contribution
EBT= 33,00, 000
= 1.44 approx22,95, 000
`
`Or = Operating Leverage × Financial Leverage = 1.22 × 1.18 = 1.44 (approx)
(v) Operating leverage is 1.22. So if sales is increased by 10%. EBIT will be increased by 1.22 × 10 i.e. 12.20%(approx)
(vi) Since the combined Leverage is 1.44, sales have to drop by 100/1.44 i.e. 69.44% to bring EBT to Zero
Accordingly, New Sales = ` 75,00,000 × (1-0.6944)
= ̀ 75,00,000 × 0.3056
= ` 22,92,000 (approx)
Hence at `22,92,000 sales level EBT of the firm will be equal to Zero.
(vii) Financial leverage is 1.18. So, if EBIT increases by 20% then EBT will increase by 1.18 × 20 = 23.6%(approx)
Q-13 Calculate the operating leverage, financial leverage and combined leverage from the following dataunder Situation I and II and Financial Plan A and B:Installed Capacity 4,000 units
Actual Production and Sales 75% of the Capacity
Selling Price ` 30 per unit
Variable Cost ` 15 per unit
Fixed Cost:
Under Situation I ` 15,000
Under Situation-II ` 20,000
Capital Structure:
Financial Plan
A (`) B (`)
Equity 10,000 15,000
Debt (Rate of Interest at 20%) 10,000 5,000
20,000 20,000 [RTP-May ‘18]

-76-
Ans.(i) Operating leverages:
Particulars Situation-I (`) Situation-II (`)
Sales (S)(3,000 units @ ` 30/- per unit) 90,000 90,000
Less: Variable Cost (VC) @ ` 15 per unit (45,000) (45,000)
Contribution (C) 45,000 45,000
Less: Fixed Cost (FC) 15,000 20,000
EBIT 30,000 25,000
Operating Leverage
C
EBIT
45, 000
30,000
45, 000
25, 000
= 1.5 = 1.8
(ii) Financial Leverages:
A (`) B (`)
Situation I:
EBIT 30,000 30,000
Less: Interest on debt EBT (2,000) (1,000)
28,000 29,000
Financial Leverage
EBIT
EBIT
30,000
28, 000
30,000
29, 000
= 1.07 = 1.03
Situation-II:
EBIT 25,000 25,000
Less: Interest on debt (2,000) (1,000)
EBT 23,000 24,000
Financial Leverage
EBIT
EBIT
25,000
23,000
25,000
24,000
= 1.09 = 1.04
(iii) Combined Leverages:
A (`) B (`)
(a) Situation I 1.5 × 1.07 = 1.61 1.5 × 1.03 = 1.55
(b) Situation II 1.8 × 1.09 = 1.96 1.8 × 1.04 = 1.87

-77-
Q-14 “Financial Leverage is a double-edged sword” Discuss.
[RTP-May ‘18]
Ans. On one hand when cost of `fixed cost fund’ is less than the return on investment financial leverage willhelp to increase return on equity and EPS. The firm will also benefit from the saving of tax on intereston debts etc. However, when cost of debt will be more than the return it will affect return of equity andEPS unfavourably and as a result firm can be under financial distress. This is why financial leverage isknown as “double edged sword”.
Effect on EPS and ROE:
When, ROI > Interest – Favourable – Advantage
When, ROI < Interest – Unfavourable – Disadvantage
When, ROI = Interest – Neutral – Neither advantage nor disadvantage.

-78-
Q-1 A company is considering the proposal of taking up a new project which requires an investment of `800lakhs on machinery and other assets. The project is expected to yield the following earnings (beforedepreciation and taxes) over the next five years:
Year Earnings (` in lakhs)
1 320
2 320
3 360
4 360
5 300
The cost of raising the additional capital is 12% and assets have to be depreciated at 20% on writtendown value basis. The scrap value at the end of the five year period may be taken as zero. Income-taxapplicable to the company is 40%.
You are required to CALCULATE the net present value of the project and advise the management to takeappropriate decision. Also CALCULATE the Internal Rate of Return of the Project.
Note: Present values of Re. 1 at different rates of interest are as follows:
Year 10% 12% 14% 16% 20%
1 0.91 0.89 0.88 0.86 0.83
2 0.83 0.80 0.77 0.74 0.69
3 0.75 0.71 0.67 0.64 0.58
4 0.68 0.64 0.59 0.55 0.48
5 0.62 0.57 0.52 0.48 0.40 [RTP-May ‘20]
Ans.(i) Calculation of Net Cash Flow
(` in lakhs)
Year Profit before Depreciation PBT PAT Net cash flow
dep. and tax (20% on WDV)
(1) (2) (3) (4) (5) (3) + (5)
1 320 800 . 20% = 160 160 96 256
2 320 (800 - 160). 20% = 128 192 115.20 243.20
3 360 (640 - 128). 20% = 102.4 257.6 154.56 256.96
4 360 (512 - 102.4). 20% = 81.92 278.08 166.85 248.77
5 300 (409.6 - 81.92) = 327.68* 27.68 16.61 311.07
*this is treated as a short term capital loss.
CHAPTER-7INVESTMENT DECISIONS

-79-
(ii) Calculation of Net Present Value (NPV)
(` in lakhs)
Year Net Cash Flow 12% 16% 20%
D.F P.V D.F P.V D.F P.V
1 256 0.89 227.84 0.86 220.16 0.83 212.48
2 243.20 0.80 194.56 0.74 179.97 0.69 167.81
3 256.96 0.71 182.44 0.64 164.45 0.58 149.03
4 248.77 0.64 159.21 0.55 136.82 0.48 119.41
5 311.07 0.57 177.31 0.48 149.31 0.40 124.43
941.36 850.71 773.16
Less: Initial Investment 800.00 800.00 800.00
NPV 141.36 50.71 -26.84
(iii) Advise: Since Net Present Value of the project at 12% = 141.36 lakhs, therefore the project should beimplemented.
(iv) Calculation of Internal Rate of Return (IRR)
IRR 16% + 50.71× 4
50.71- -26.84
= 16% + 2.03
77.55=16%+ 2.62% = 18.62%.
Q-2 H Ltd. is considering a new product line to supplement its range of products. It is anticipated that thenew product line will involve cash investments of Rs.70,00,000 at time 0 and Rs.1,00,00,000 in year 1.After-tax cash inflows of Rs. 25,00,000 are expected in year 2, Rs.30,00,000 in year 3, Rs.35,00,000 in year4 and Rs.40,00,000 each year thereafter through year 10. Although the product line might be viableafter year 10, the company prefers to be conservative and end all calculations at that time.
(i) If the required rate of return is 15 per cent, FIND OUT the net present value of the project? Isit acceptable?
(ii) COMPUTE NPV if the required rate of return were 10 per cent?(iii) COMPUTE the internal rate of return?
[MTP-Oct ‘19, 7 Marks]Ans. (i)
Year Cash flow Discount Factor(15%) Present value(Rs.) (Rs.) (Rs.)
0 (70,00,000) 1.000 (70,00,000)1 (1,00,00,000) 0.870 (87,00,000)2 25,00,000 0.756 18,90,0003 30,00,000 0.658 19,74,0004 35,00,000 0.572 20,02,0005-10 40,00,000 2.163 86,52,000
Net Present Value (11,82,000)As the net present value is negative, the project is unacceptable.

-80-
(ii) Similarly, NPV at 10% discount rate can be computed as follows:
Year Cash flow Discount Factor(10%) Present value
(Rs.) (Rs.)
0 (70,00,000) 1.000 (70,00,000)
1 (1,00,00,000) 0.909 (90,90,000)
2 25,00,000 0.826 20,65,000
3 30,00,000 0.751 22,53,000
4 35,00,000 0.683 23,90,500
5-10 40,00,000 2.974 1,18,96,000
Net Present Value 25,14,500
Since NPV = Rs.25,14,500 is positive, hence the project would be acceptable.
(iii) IRR NPV at LR=LR + × HR -LR
NPV at LR - NPV at HR
Rs.25,14,500
=10% + × 15% -10%Rs.25,14,500 - - 11,82,000
= 10% + 3.4012 or 13.40%
Q-3 X Ltd. is considering to select a machine out of two mutually exclusive machines. The company’s cost ofcapital is 15 per cent and corporate tax rate is 30 per cent. Other information relating to both machinesis as follows:
Machine – I Machine – II
Cost of Machine Rs. 30,00,000 Rs. 40,00,000
Expected Life Annual Income 10 years. 10 years.
(Before Tax and Depreciation) Rs. 12,50,000 Rs. 17,50,000
Depreciation is to be charged on straight line basis:
You are required to CALCULATE:
(i) Discounted Pay Back Period
(ii) Net Present Value
(iii) Profitability Index
The present value factors of Re.1 @ 15% are as follows:
Year 01 02 03 04 05
PV factor @ 15% 0.870 0.756 0.658 0.572 0.497
[MTP-March ‘19, 10 Marks]
Ans. Working Notes:
30, 00, 000Depreciation on Machine -1 = = 3,00, 000
10`
40,00,000Depreciation on Machine - 2 = = ,00,000
10`4

-81-
Particulars Machine-I (Rs.) Machine – II (Rs.)
Annual Income (before Tax and Depreciation) 12,50,000 17,50,000
Less: Depreciation 3,00,000 4,00,000
Annual Income (before Tax) 9,50,000 13,50,000
Less: Tax @ 30% (2,85,000) (4,05,000)
Annual Income (after Tax) 6,65,000 9,45,000
Add: Depreciation 3,00,000 4,00,000
Annual Cash Inflows 9,65,000 13,45,000
Machine – I Machine - II
Year PV of Re Cash PV Cumulative Cash flow PV Cumulative
1 @ 15% flow PV PV
1 0.870 9,65,000 8,39,550 8,39,550 13,45,000 11,70,150 11,70,150
2 0.756 9,65,000 7,29,540 15,69,090 13,45,000 10,16,820 21,86,970
3 0.658 9,65,000 6,34,970 22,04,060 13,45,000 8,85,010 30,71,980
4 0.572 9,65,000 5,51,980 27,56,040 13,45,000 7,69,340 38,41,320
5 0.497 9,65,000 4,79,605 32,35,645 13,45,000 6,68,465 45,09,785
(i) Discounted Payback Period
Machine – I
30,00, 000 - 27,56, 040Discounted Payback Period = 4 +
4,79,605
2,43,960= 4 + = 4 + 0.5087 = 4,5087 years or 4 years 6.10 months
4,79,605
Machine – II
40, 00, 000 - 38,41,320Discounted Payback Period = 4 +
6,68, 465
1,58,680= 4 + = 4 + 0.2374 = 4,2374 years or 4 years 2.85 months
6,68,465
(ii) Net Present Value (NPV)
Machine – I
NPV = 32,35,645 – 30,00,000 = Rs. 2,35,645
Machine – II
NPV = 45,09,785 – 40,00,000 = Rs. 5,09,785
(iii) Profitability Index
Machine – I
Profitability Index = 32,35,645
= 1.0830,00, 000

-82-
Machine – II
Profitability Index = 45,09,785
= 1.1340,00,000
Conclusion:
Method Machine - I Machine - II Rank
Discounted Payback Period 4.51 years 4.24 years II
Net Present Value Rs. .2,35,645 Rs. 5,09,785 II
Profitability Index 1.08 1.13 II
Q-4 Sundaram Ltd. discounts its cash flows at 16% and is in the tax bracket of 35%. For the acquisition of amachinery worth `10,00,000, it has two options – either to acquire the asset by taking a bank loan @ 15%p.a. repayable in 5 yearly instalments of ` 2,00,000 each plus interest or to lease the asset at yearlyrentals of ` 3,34,000 for five (5) years. In both the cases, the instalment is payable at the end of the year.Depreciation is to be applied at the rate of 15% using ‘written down value’ (WDV) method. You arerequired to STATE with reason which of the financing options is to be exercised.
Year 1 2 3 4 5
P.V factor @16% 0.862 0.743 0.641 0.552 0.476
[MTP-March ‘18, 5 Marks]
Ans. Alternative I: Acquiring the asset by taking bank loan:
Years 1 2 3 4 5
(a) Interest (@15% p.a. onopening balance) 1,50,000 1,20,000 90,000 60,000 30,000
Depreciation (@15%WDV) 1,50,000 1,27,500 1,08,375 92,119 78,301
3,00,000 2,47,500 1,98,375 1,52,119 1,08,301
(b) Tax shield (@35%) 1,05,000 86,625 69,431 53,242 37,905
Interest less Tax shield (a)-(b) 45,000 33,375 20,569 6,758 (7,905)
Principal Repayment 2,00,000 2,00,000 2,00,000 2,00,000 2,00,000
Total cash outflow 2,45,000 2,33,375 2,20,569 2,06,758 1,92,095
Discounting Factor @ 16% 0.862 0.743 0.641 0.552 0.476
Present Value 2,11,190 1,73,398 1,41,385 1,14,130 91,437
Total P.V of cash outflow = ` 7,31,540
Alternative II: Acquire the asset on lease basis
Year Lease Rentals Tax Shield Net Cash Discount Present
(` ) @35% Outflow Factor Value
1 3,34,000 1,16,900 2,17,100 0.862 1,87,140
2 3,34,000 1,16,900 2,17,100 0.743 1,61,305
3 3,34,000 1,16,900 2,17,100 0.641 1,39,161
4 3,34,000 1,16,900 2,17,100 0.552 1,19,839
5 3,34,000 1,16,900 2,17,100 0.476 1,03,340
Present value of Total Cash out flow 7,10,785
By making analysis of both the alternatives, it is observed that the present value of the cash outflow islower in alternative II by ` 20,755 (i.e. ` 731,540 – ` 7,10,785) Hence, it is suggested to acquire the asseton lease basis.
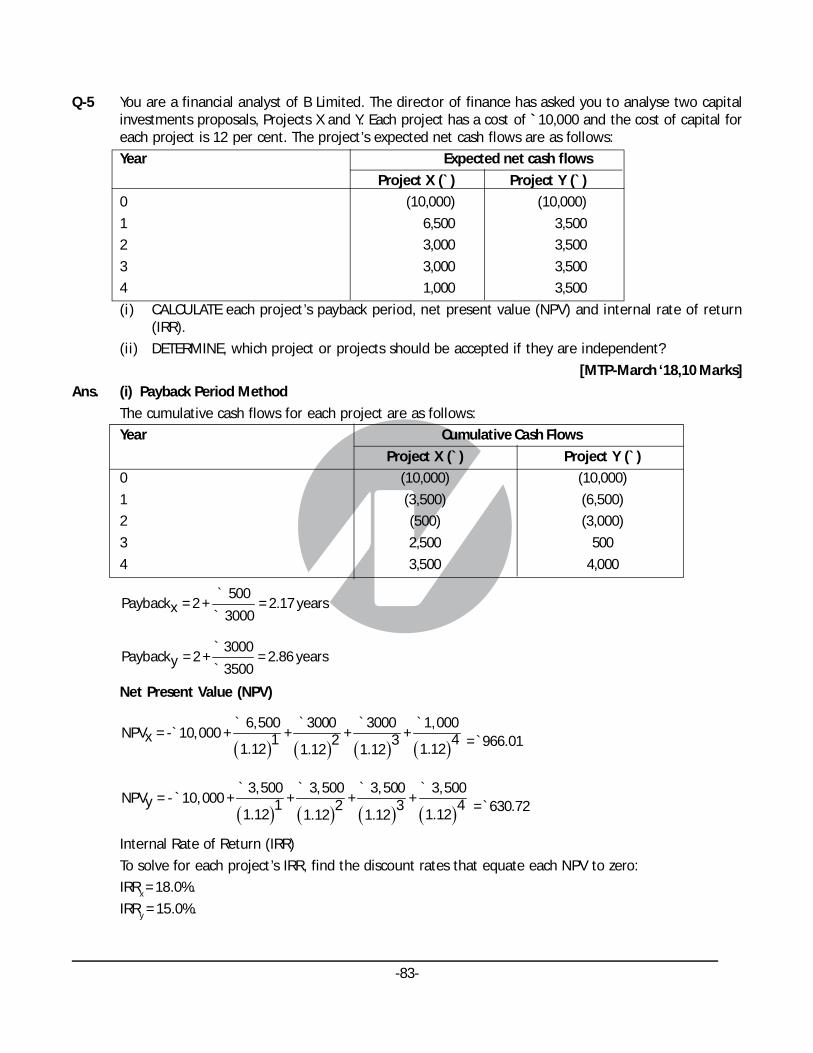
-83-
Q-5 You are a financial analyst of B Limited. The director of finance has asked you to analyse two capitalinvestments proposals, Projects X and Y. Each project has a cost of `10,000 and the cost of capital foreach project is 12 per cent. The project’s expected net cash flows are as follows:
Year Expected net cash flows
Project X (`) Project Y (`)
0 (10,000) (10,000)
1 6,500 3,500
2 3,000 3,500
3 3,000 3,500
4 1,000 3,500
(i) CALCULATE each project’s payback period, net present value (NPV) and internal rate of return(IRR).
(ii) DETERMINE, which project or projects should be accepted if they are independent?
[MTP-March ‘18,10 Marks]
Ans. (i) Payback Period Method
The cumulative cash flows for each project are as follows:
Year Cumulative Cash Flows
Project X (`) Project Y (`)
0 (10,000) (10,000)
1 (3,500) (6,500)
2 (500) (3,000)
3 2,500 500
4 3,500 4,000
500Payback = 2 + = 2.17 yearsx 3000
`
`
3000Payback = 2 + = 2.86 yearsy 3500
`
`
Net Present Value (NPV)
6,500 3000 3000 1,000
NPV = - 10,000 + + + +x 1 42 31.12 1.121.12 1.12
` ` ` `` = ̀ 966.01
3,500 3, 500 3, 500 3,500
NPV = - 10, 000 + + + +y 1 42 31.12 1.121.12 1.12
` ` ` ` ` = ̀ 630.72
Internal Rate of Return (IRR)
To solve for each project’s IRR, find the discount rates that equate each NPV to zero:
IRRx = 18.0%.
IRRy = 15.0%.
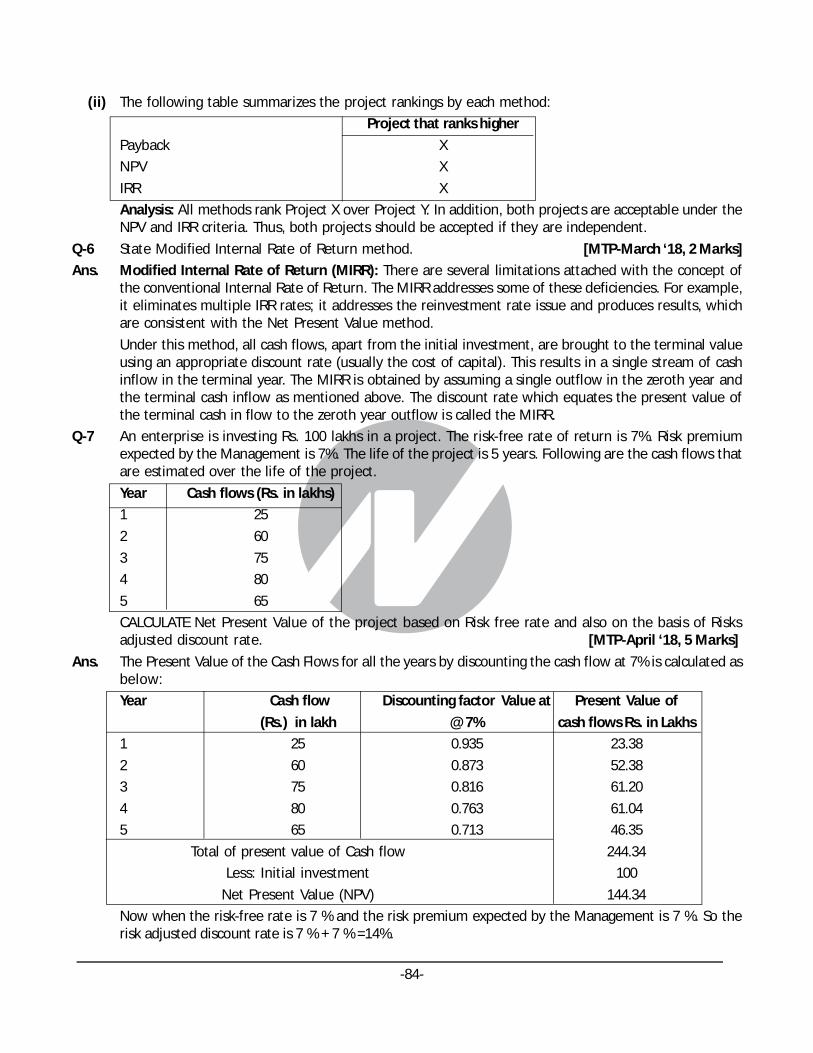
-84-
(ii) The following table summarizes the project rankings by each method:
Project that ranks higher
Payback X
NPV X
IRR X
Analysis: All methods rank Project X over Project Y. In addition, both projects are acceptable under theNPV and IRR criteria. Thus, both projects should be accepted if they are independent.
Q-6 State Modified Internal Rate of Return method. [MTP-March ‘18, 2 Marks]
Ans. Modified Internal Rate of Return (MIRR): There are several limitations attached with the concept ofthe conventional Internal Rate of Return. The MIRR addresses some of these deficiencies. For example,it eliminates multiple IRR rates; it addresses the reinvestment rate issue and produces results, whichare consistent with the Net Present Value method.
Under this method, all cash flows, apart from the initial investment, are brought to the terminal valueusing an appropriate discount rate (usually the cost of capital). This results in a single stream of cashinflow in the terminal year. The MIRR is obtained by assuming a single outflow in the zeroth year andthe terminal cash inflow as mentioned above. The discount rate which equates the present value ofthe terminal cash in flow to the zeroth year outflow is called the MIRR.
Q-7 An enterprise is investing Rs. 100 lakhs in a project. The risk-free rate of return is 7%. Risk premiumexpected by the Management is 7%. The life of the project is 5 years. Following are the cash flows thatare estimated over the life of the project.
Year Cash flows (Rs. in lakhs)
1 25
2 60
3 75
4 80
5 65
CALCULATE Net Present Value of the project based on Risk free rate and also on the basis of Risksadjusted discount rate. [MTP-April ‘18, 5 Marks]
Ans. The Present Value of the Cash Flows for all the years by discounting the cash flow at 7% is calculated asbelow:
Year Cash flow Discounting factor Value at Present Value of
(Rs.) in lakh @ 7% cash flows Rs. in Lakhs
1 25 0.935 23.38
2 60 0.873 52.38
3 75 0.816 61.20
4 80 0.763 61.04
5 65 0.713 46.35
Total of present value of Cash flow 244.34
Less: Initial investment 100
Net Present Value (NPV) 144.34
Now when the risk-free rate is 7 % and the risk premium expected by the Management is 7 %. So therisk adjusted discount rate is 7 % + 7 % =14%.

-85-
Discounting the above cash flows using the Risk Adjusted Discount Rate would be as below:Year Cash flow Discounting factor Value at Present Value of
(Rs.) in lakh @ 14% cash flows Rs. in Lakhs1 25 0.877 21.932 60 0.769 46.143 75 0.675 50.634 80 0.592 47.365 65 0.519 33.74
Total of present value of Cash flow 199.80Initial investment 100
Net present value (NPV) 99.80Q-8 Domestic services (P) Ltd. is in the business of providing cleaning sewerage line services at homes.
There is a proposal before the company to purchase a mechanized sewerage cleaning system for a sumof Rs. 20 lakhs. The present system of the company is to use manual labour for the job. You are providedwith the following information:Proposed Mechanized System:Cost of the machine Rs. 20 lakhsLife of the machine 10 yearsDepreciation (on straight line basis) 10%Operating cost of mechanized system Rs. 5 lakhs per annumPresent system (Manual):Manual labour 200 personsCost of manual labour Rs. 10,000 per person per annumThe company has an after tax cost of fund at 10% per annum.The applicable tax rate is 30%.PV factor for 10 years at 10% are as follows:
Years 1 2 3 4 5 6 7 8 9 10P.V. factor 0.909 0.826 0.751 0.683 0.621 0.564 0.513 0.467 0.424 0.386
You are required to DETERMINE whether it is advisable to purchase the machine. Give yourrecommendations with workings. [MTP-April ‘18, 10 Marks]
Ans. Rs.Cost of Manual Operation (Rs. 10,000 x 200) 20,00,000Cost of Mechanised Operation:(i) Operating Cost Rs. 5,00,000(ii) Depreciation Rs. 2,00,000 7,00,000Saving per annum 13,00,000Tax on savings (30%) 3,90,000Saving after tax 9,10,000Add: Depreciation 2,00,000Cash flow per annum 11,10,000Cumulative PV Factor for 10 years 6.144Present value of cash flow for 10 years 68,19,840
Less: Cost of the Machine 20,00,000
NPV 48,19,840
The Sewerage cleaning machine should be purchased as NPV is positive by Rs. 48,19,840.

-86-
Q-9 Explain the term ‘Payback reciprocal’. [MTP-April ‘18, 2 Marks]
Ans. Financial ratios provide clues but not conclusions. These are tools only in the hands of experts becausethere is no standard ready-made interpretation of financial ratios As the name indicates it is thereciprocal of payback period. A major drawback of the payback period method of capital budgeting isthat it does not indicate any cut off period for the purpose of investment decision. It is, however,argued that the reciprocal of the payback would be a close approximation of the Internal Rate of Return(later discussed in detail) if the life of the project is at least twice the payback period and the projectgenerates equal amount of the annual cash inflows. In practice, the payback reciprocal is a helpful toolfor quickly estimating the rate of return of a project provided its life is at least twice the paybackperiod.
The payback reciprocal can be calculated as follows:
Average annual cash in flowPayback Re
Initial ci
inp
vro
escal =
tment
Q-10 A company has to make a choice between two projects namely A and B. The initial capital outlay of twoProjects are Rs.1,35,00,000 and Rs.2,40,00,000 respectively for A and B. There will be no scrap value atthe end of the life of both the projects. The opportunity cost of capital of the company is 16%. Theannual incomes are as under:
Year Project A Project B Discounting
factor @ 16%
1 — 60,00,000 0.862
2 30,00,000 84,00,000 0.743
3 1,32,00,000 96,00,000 0.641
4 84,00,000 1,02,00,000 0.552
5 84,00,000 90,00,000 0.476
You are required to CALCULATE for each project:
(i) Discounted payback period
(ii) Profitability index
(iii) Net present value [MTP-Aug ‘18,10 Marks]
Ans. (1) Computation of Net Present Values of Projects (Amount in Rs. ‘000)
Year Cash flows Discount Discounted Cash flow
factor @ 16 %
Project A(Rs.) Project B(Rs.) Project A(Rs.) Project B(Rs.)
(1) (2) (3) (3) x (1) (3) x (2)
0 (13,500) (24,000) 1.000 (13,500) (24,000)
1 — 6,000 0.862 — 5,172
2 3,000 8,400 0.743 2,229 6,241.2
3 13,200 9,600 0.641 8,461.2 6,153.6
4 8,400 10,200 0.552 4,636.8 5,630.4
5 8,400 9,000 0.476 3,998.4 4,284
Net present value 5,825.4 3,481.2

-87-
(2) Computation of Cumulative Present Values of Projects Cash inflows
(Amount in Rs. ‘000)
Year Project A Project B
PV of Cumulative PV of Cumulative
cash inflows (Rs.) PV (Rs.) cash inflows (Rs.) PV (Rs.)
1 — — 5,172 51,72
2 2,229 22,29 6,241.2 11,413.2
3 8,461.2 10,690.2 6,153.6 17,566.8
4 4,636.8 15,327 5,630.4 23,197.2
5 3,998.4 19,325.4 4,284 27,481.2
(i) Discounted payback period: (Refer to Working note 2)
Cost of Project A = Rs.1,35,00,000
Cost of Project B = Rs.2,40,00,000
Cumulative PV of cash inflows of Project A after 4 years = Rs.1,53,27,000
Cumulative PV of cash inflows of Project B after 5 years = Rs.2,74,81,200
A comparison of projects cost with their cumulative PV clearly shows that the project A’s cost will berecovered in less than 4 years and that of project B in less than 5 years. The exact duration of discountedpayback period can be computed as follows:
Project A Project B
Excess PV of cash 18,27,000 34,81,200
inflows over the project cost (Rs.1,53,27,000 - Rs.1,35,00,000) (Rs. 2,74,81,200 ? Rs.2,40,00,000)
(Rs.)
Computation of period 0.39 year 0.81 years
required to recoverexcess (Rs. 18,27,000 ÷ Rs.46,36,800) (Rs.34,81,200 ÷ Rs. 42,84,000)
amount ofcumulative PV over
project cost (Refer toWorking
note 2)
Discounted paybackperiod 3.61 year(4 - 0.39) years 4.19 years(5 - 0.81) years
(ii) Profitability Index: = Sum of discounted cash inflows
Initian cash outlay
Profitability Index (for Project A) = Rs.1,93,25,400
= = 1.43Rs.1,35, 00, 000
Profitability Index (for Project B) = Rs.2,74,81,200
= = 1.15Rs.2,40, 00,000
(iii) Net present value (for Project A) = Rs.58,25,400 (Refer to Working note 1)
Net present value (for Project B) = Rs.34,81,200

-88-
Q-11 X Limited is considering to purchase of new plant worth Rs. 80,00,000. The expected net cash flowsafter taxes and before depreciation are as follows:
Year Net Cash Flows (Rs.)
1 14,00,000
2 14,00,000
3 14,00,000
4 14,00,000
5 14,00,000
6 16,00,000
7 20,00,000
8 30,00,000
9 20,00,000
10 8,00,000
The rate of cost of capital is 10%.
You are required to Calculate :
(i) Pay-back period
(ii) Net present value at 10 discount factor
(iii) Profitability index at 10 discount factor
(iv) Internal rate of return with the help of 10% and 15% discount factor
The following present value table is given for you:
Year Present value of Rs. 1 at Present value of Rs. 1 at
10% discount rate 15% discount rate
1 .909 .870
2 .826 .756
3 .751 .658
4 .683 .572
5 .621 .497
6 .564 .432
7 .513 .376
8 .467 .327
9 .424 .284
10 .386 .247
[MTP-Oct ‘18,10 Marks]
Ans.(i) Calculation of Pay-back Period
Cash Outlay of the Project = Rs. 80,00,000
Total Cash Inflow for the first five years = Rs. 70,00,000
Balance of cash outlay left to be paid back in the 6th year Rs. 10,00,000
Cash inflow for 6th year = 16,00,000
So the payback period is between 5th and 6th years, i.e.,

-89-
Rs.10, 00, 0005 years + = 5.625 years or 5 years 7.5 months
Rs.6,00,000
(ii) Calculation of Net Present Value (NPV) @10% discount rate:Year Net Cash Inflow(Rs.) Present Value at Present Value(Rs.)
Discount Rate of 10%(a) (b) (c) = (a) × (b)
1 14,00,000 0.909 12,72,6002 14,00,000 0.826 11,56,4003 14,00,000 0.751 10,51,4004 14,00,000 0.683 9,56,2005 14,00,000 0.621 8,69,4006 16,00,000 0.564 9,02,4007 20,00,000 0.513 10,26,0008 30,00,000 0.467 14,01,0009 20,00,000 0.424 8,48,00010 8,00,000 0.386 3,08,800
97,92,200Net Present Value (NPV) = Cash Outflow – Present Value of Cash Inflows= Rs. 80,00,000 – Rs. 97,92,200 = 17,92,200
(iii) Calculation of Profitability Index @ 10% discount rate:
Present Value of Cash inflowsProfitability Index =
Cost of the investment
Rs.97,92,200= = 1.224
Rs.80, 00, 000
(iv) Calculation of Internal Rate of Return:Net present value @ 10% interest rate factor has already been calculated in (ii) above, we will calculateNet present value @15% rate factor.Year Net Cash Inflow Present Value at Present Value
(Rs.) DiscountRate of 15% (Rs.)(a) (b) (c) = (a)× (b)
1 14,00,000 0.870 12,18,0002 14,00,000 0.756 10,58,4003 14,00,000 0.658 9,21,2004 14,00,000 0.572 8,00,8005 14,00,000 0.497 6,95,8006 16,00,000 0.432 6,91,2007 20,00,000 0.376 7,52,0008 30,00,000 0.327 9,81,0009 20,00,000 0.284 5,68,000
10 8,00,000 0.247 1,97,600
78,84,000
Net Present Value at 15% = Rs. 78,84,000 – Rs. 80,00,000 = Rs. -1,16,000

-90-
As the net present value @ 15% discount rate is negative, hence internal rate of return falls in between10% and 15%. The correct internal rate of return can be calculated as follows:
NPVLIRR = L + H -L
NPV - NPVL H
Rs.17,92,200= 10% + 15% -10%
Rs.17,92,200 - -Rs.1,16, 000
Rs.17,92,200= 10% + × 5% = 14.7%
Rs.19, 08,200
Q-12 AT Limited is considering three projects A, B and C. The cash flows associated with the projects aregiven below:
Cash flows associated with the Three Projects (`)
Project C0 C1 C2 C3 C4
A (10,000) 2,000 2,000 6,000 0
B (2,000) 0 2,000 4,000 6,000
C (10,000) 2,000 2,000 6,000 10,000
You are required to :
(a) Calculate the payback period of each of the three projects.
(b) If the cut-off period is two years, then which projects should be accepted?
(c) Projects with positive NPVs if the opportunity cost of capital is 10 percent.
(d) “Payback gives too much weight to cash flows that occur after the cut-off date”. True or false?
(e) “If a firm used a single cut-off period for all projects, it is likely to accept too many short livedprojects.” True or false?
P.V. Factor @ 10 %
Year 0 1 2 3 4 5
P.V. 1.000 0.909 0.826 0.751 0.683 0.621
[Sugg. May ‘19, 10 Marks]
Ans. (a) Payback Period of Projects
Projects C0(`) C1(`) C2(`) C3(`) Payback
A (10,000) 2000 2000 6,000 2,000+2,000+6,000 =10,000 i.e 3 years
B (2,000) 0 2,000 NA 0+2,000 = 2,000 i.e 2 years
C (10,000) 2000 2000 6,000 2,000+2,000+6,000 = 10,000 i.e 3 years
(b) If standard payback period is 2 years, Project B is the only acceptable project.
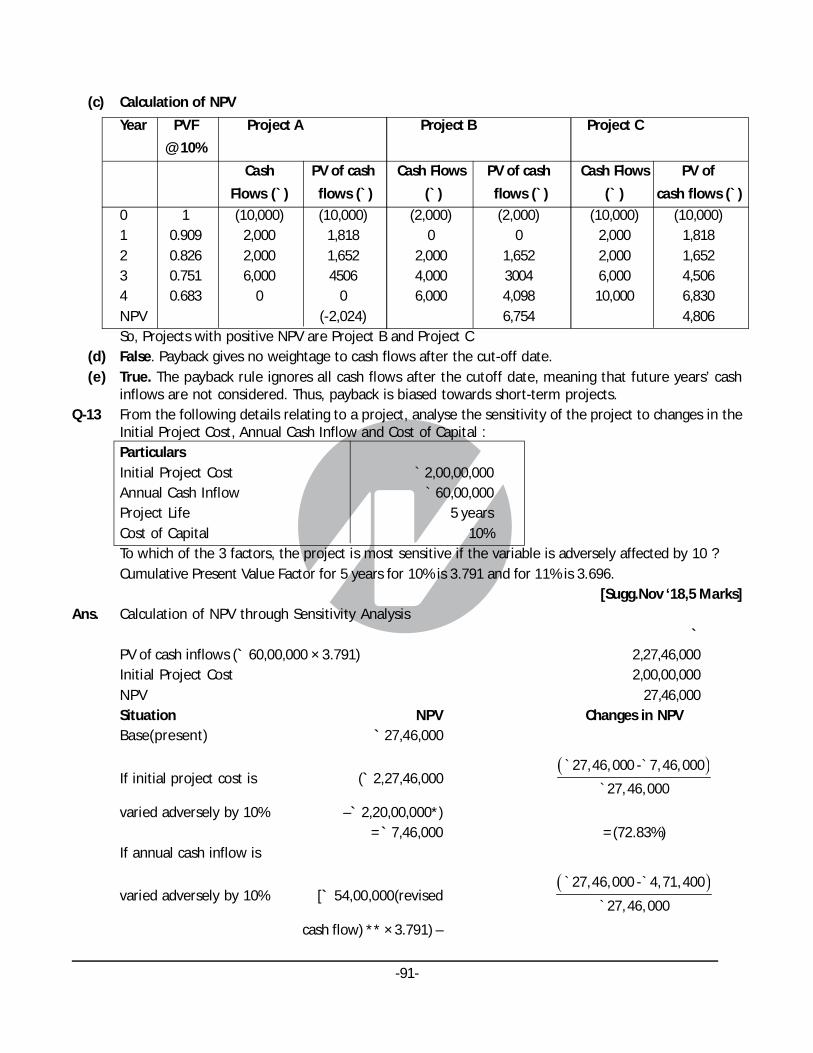
-91-
(c) Calculation of NPV
Year PVF Project A Project B Project C
@ 10%
Cash PV of cash Cash Flows PV of cash Cash Flows PV of
Flows (`) flows (`) (`) flows (`) (` ) cash flows (`)
0 1 (10,000) (10,000) (2,000) (2,000) (10,000) (10,000)1 0.909 2,000 1,818 0 0 2,000 1,8182 0.826 2,000 1,652 2,000 1,652 2,000 1,6523 0.751 6,000 4506 4,000 3004 6,000 4,5064 0.683 0 0 6,000 4,098 10,000 6,830NPV (-2,024) 6,754 4,806So, Projects with positive NPV are Project B and Project C
(d) False. Payback gives no weightage to cash flows after the cut-off date.(e) True. The payback rule ignores all cash flows after the cutoff date, meaning that future years’ cash
inflows are not considered. Thus, payback is biased towards short-term projects.Q-13 From the following details relating to a project, analyse the sensitivity of the project to changes in the
Initial Project Cost, Annual Cash Inflow and Cost of Capital :ParticularsInitial Project Cost ` 2,00,00,000Annual Cash Inflow ` 60,00,000Project Life 5 yearsCost of Capital 10%To which of the 3 factors, the project is most sensitive if the variable is adversely affected by 10 ?Cumulative Present Value Factor for 5 years for 10% is 3.791 and for 11% is 3.696.
[Sugg.Nov ‘18,5 Marks]Ans. Calculation of NPV through Sensitivity Analysis
`PV of cash inflows (` 60,00,000 × 3.791) 2,27,46,000Initial Project Cost 2,00,00,000NPV 27,46,000Situation NPV Changes in NPVBase(present) ` 27,46,000
If initial project cost is (` 2,27,46,000 ` `
`
27,46, 000 - 7, 46, 000
27, 46,000
varied adversely by 10% –` 2,20,00,000*)= ` 7,46,000 = (72.83%)
If annual cash inflow is
varied adversely by 10% [` 54,00,000(revised ` `
`
27,46,000 - 4,71, 400
27, 46, 000
cash flow) ** × 3.791) –

-92-
(` 2,00,00,000)]= ` 4,71,400 = 82.83%
If cost of capital is varied (` 60,00,000 × 3.696)– ` `
`
27, 46, 000 - 21,76, 400
27, 46, 000
adversely by 10% i.e. ` 2,00,00,000
itbecomes 11% = ̀ 21,76,000 = 20.76%
*Revised initial project Cost = 2,00,00,000 × 110% = 2,20,00,000
**Revised Cash Flow = ` 60,00,000 x (100 – 10) % = ` 54,00,000
Conclusion: Project is most sensitive to ‘annual cash inflow’
Q-14 PD Ltd. an existing company, is planning to introduce a new product with projected life of 8 years.Project cost will be ` 2,40,00,000. At the end of 8 years no residual value will be realized. Workingcapital of ` 30,00,000 will be needed. The 100% capacity of the project is 2,00,000 units p.a. but theProduction and Sales Volume is expected are as under :
Year Number of Units
1 60,000 units
2. 80,000 units
3-5 1,40,000 units
6-8 1,20,000 units
Other Information:
(i) Selling price per unit ` 200
(ii) Variable cost is 40 of sales.
(iii) Fixed cost p.a. ` 30,00,000.
(iv) In addition to these advertisement expenditure will have to be incurred as under:
Year 1 2 3-5 6-8
Expenditure (`) 50,00,000 25,00,000 10,00,000 5,00,000
(v) Income Tax is 25%.
(vi) Straight line method of depreciation is permissible for tax purpose.
(vii) Cost of capital is 10%.
(viii) Assume that loss cannot be carried forward.
Present Value Table
Year 1 2 3 4 5 6 7 8
PVF@ 10 0.909 0.826 0.751 0.683 0.621 0.564 0.513 0.467
Advise about the project acceptability. [Sugg. Nov ‘18, 10 Marks]
Ans. Computation of initial cash outlay(COF)
(` in lakhs)
Project Cost 240
Working Capital 30
270

-93-
Calculation of Cash Inflows(CIF):
Years 1 2 3-5 6-8
Sales in units 60,000 80,000 1,40,000 1,20,000
` ` ` `
Contribution
(` 200 x 60% x No. ofUnit) 72,00,000 96,00,000 1,68,00,000 1,44,00,000
Less: Fixed cost 30,00,000 30,00,000 30,00,000 30,00,000
Less: Advertisement 50,00,000 25,00,000 10,00,000 5,00,000
Less: Depreciation (24000000/8)
= 30,00,000 30,00,000 30,00,000 30,00,000 30,00,000
Profit /(loss) (38,00,000) 11,00,000 98,00,000 79,00,000
Less: Tax @ 25% NIL 2,75,000 24,50,000 19,75,000
Profit/(Loss) after tax (38,00,000) 8,25,000 73,50,000 59,25,000
Add: Depreciation 30,00,000 30,00,000 30,00,000 30,00,000
Cash inflow (8,00,000) 38,25,000 1,03,50,000 89,25,000
(Note: Since variable cost is 40%, Contribution shall be 60% of sales)
Computation of PV of CIF
Year CIF PV Factor `
` @ 10%
1 (8,00,000) 0.909 (7,27,200)
2 38,25,000 0.826 31,59,450
3 1,03,50,000 0.751 77,72,850
4 1,03,50,000 0.683 70,69,050
5 1,03,50,000 0.621 64,27,350
6 89,25,000 0.564 50,33,700
7 89,25,000 0.513 45,78,525
8 89,25,000 0.467 55,68,975
Working Capital 30,00,000
3,88,82,700
PV of COF 2,70,00,000
NPV 1,18,82,700
Recommendation:Accept the project in view of positive NPV.
Q-15 A company is evaluating a project that requires initial investment of ` 60 lakhs in fixed assets and ` 12lakhs towards additional working capital.
The project is expected to increase annual real cash inflow before taxes by ` 24,00,000 during its life.The fixed assets would have zero residual value at the end of life of 5 years.
The company follows straight line method of depreciation which is expected for tax purposes also.Inflation is expected to be 6% per year. For evaluating similar projects, the company uses discountingrate of 12% in real terms. Company’s tax rate is 30%.
Advise whether the company should accept the project, by calculating NPV in real terms.

-94-
PVIF (12%, 5 years) PVIF (12%, 5 years)
Year 1 0.893 Year 1 0.943
Year 2 0.797 Year 2 0.890
Year 3 0.712 Year 3 0.840
Year 4 0.636 Year 4 0.792
Year 5 0.567 Year 5 0.747
[Sugg.May ‘18, 10 Marks]
Ans.(i) Equipment’s initial cost = ` 60,00,000 + ` 12,00,000
= ̀ 72,00,000
(ii) Annual straight line depreciation = ` 60,00,000/5
= ̀ 12,00,000.
(iii) Net Annual cash flows can be calculated as follows:
= Before Tax CFs × (1 – Tc) + Tc × Depreciation (Tc = Corporate tax i.e. 30%)
= ` 24,00,000 × (1 – 0.3) + (0.3 x ` 12,00,000)
= ` 16,80,000 + ` 3,60,000 = ` 20,40,000
So, Total Present Value = PV of inflow + PV of working capital released
= (` 20,40,000 × PVIF 12%, 5 years) + (` 12,00,000 × 0.567)
= (` 20,40,000 × 3.605) + ` 6,80,400
= ` 73,54,200 + ` 6,80,400
= ̀ 80,34,600
So NPV = PV of Inflows – Initial Cost
= ` 80,34,600 – ` 72,00,000
= ` 8,34,600
Advice: Company should accept the project as the NPV is Positive
Q-16 An enterprise is investing ` 100 lakhs in a project. The risk-free rate of return is 7%. Risk premiumexpected by the Management is 7%. The life of the project is 5 years. Following are the cash flows thatare estimated over the life of the project.
Year Cash flows (` In lakhs)
1 25
2 60
3 75
4 80
5 65
CALCULATE Net Present Value of the project based on Risk free rate and also on the basis of Risksadjusted discount rate. [RTP-May ‘19]
Ans. The Present Value of the Cash Flows for all the years by discounting the cash flow at 7% is calculated asbelow:

-95-
Year Cash flows ` In lakhs Discounting Factor @ 7% Present value of Cash
Flows ` In Lakhs
1 25 0.935 23.38
2 60 0.873 52.383 75 0.816 61.204 80 0.763 61.045 65 0.713 46.35
Total of present value of Cash flow 244.34Less: Initial investment (100.00)
Net Present Value (NPV) 144.34
Now when the risk-free rate is 7 % and the risk premium expected by the Management is 7 %. So therisk adjusted discount rate is 7 % + 7 % =14%.
Discounting the above cash flows using the Risk Adjusted Discount Rate would be as below:
Year Cash flows ` in Lakhs DiscountingFactor @ 14% Present Value of
Cash Flows ` in lakhs
1 25 0.877 21.93
2 60 0.769 46.14
3 75 0.675 50.63
4 80 0.592 47.36
5 65 0.519 33.74
Total of present value of Cash flow 199.79
Initial investment (100.00)
Net present value (NPV) 99.79
Q-17 Shiv Limited is thinking of replacing its existing machine by a new machine which would cost ` 60 lakhs.The company’s current production is 80,000 units, and is expected to increase to 1,00,000 units, if thenew machine is bought. The selling price of the product would remain unchanged at ` 200 per unit. Thefollowing is the cost of producing one unit of product using both the existing and new machine:
Unit cost (`)
Existing Machine New Machine Difference
(80,000 units) (1,00,000 units)
Materials 75.0 63.75 (11.25)
Wages & Salaries 51.25 37.50 (13.75)
Supervision 20.0 25.0 5.0
Repairs and Maintenance 11.25 7.50 (3.75)
Power and Fuel 15.50 14.25 (1.25)
Depreciation 0.25 5.0 4.75
Allocated Corporate Overheads 10.0 12.50 2.50
183.25 165.50 (17.75)
The existing machine has an accounting book value of ` 1,00,000, and it has been fully depreciated fortax purpose. It is estimated that machine will be useful for 5 years. The supplier of the new machinehas offered to accept the old machine for ` 2,50,000.
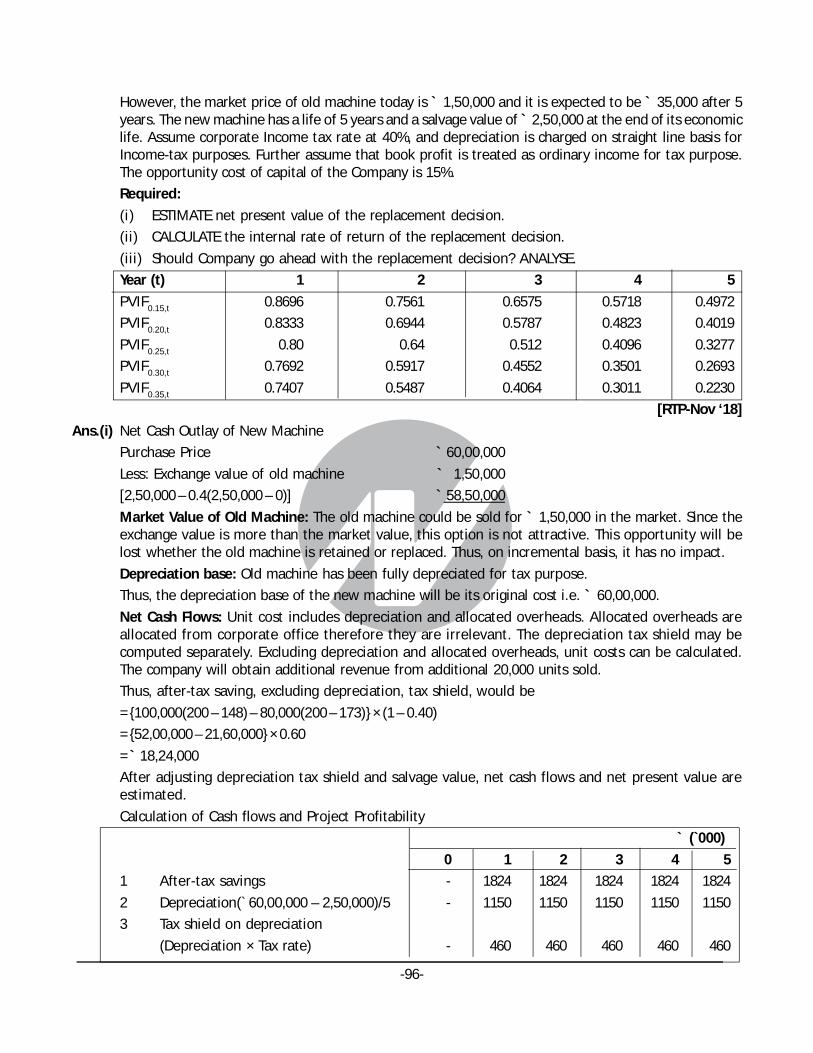
-96-
However, the market price of old machine today is ` 1,50,000 and it is expected to be ` 35,000 after 5years. The new machine has a life of 5 years and a salvage value of ` 2,50,000 at the end of its economiclife. Assume corporate Income tax rate at 40%, and depreciation is charged on straight line basis forIncome-tax purposes. Further assume that book profit is treated as ordinary income for tax purpose.The opportunity cost of capital of the Company is 15%.
Required:
(i) ESTIMATE net present value of the replacement decision.
(ii) CALCULATE the internal rate of return of the replacement decision.
(iii) Should Company go ahead with the replacement decision? ANALYSE.
Year (t) 1 2 3 4 5
PVIF0.15,t 0.8696 0.7561 0.6575 0.5718 0.4972
PVIF0.20,t 0.8333 0.6944 0.5787 0.4823 0.4019
PVIF0.25,t 0.80 0.64 0.512 0.4096 0.3277
PVIF0.30,t 0.7692 0.5917 0.4552 0.3501 0.2693
PVIF0.35,t 0.7407 0.5487 0.4064 0.3011 0.2230
[RTP-Nov ‘18]
Ans.(i) Net Cash Outlay of New Machine
Purchase Price ` 60,00,000
Less: Exchange value of old machine ` 1,50,000
[2,50,000 – 0.4(2,50,000 – 0)] ` 58,50,000
Market Value of Old Machine: The old machine could be sold for ` 1,50,000 in the market. Since theexchange value is more than the market value, this option is not attractive. This opportunity will belost whether the old machine is retained or replaced. Thus, on incremental basis, it has no impact.
Depreciation base: Old machine has been fully depreciated for tax purpose.
Thus, the depreciation base of the new machine will be its original cost i.e. ` 60,00,000.
Net Cash Flows: Unit cost includes depreciation and allocated overheads. Allocated overheads areallocated from corporate office therefore they are irrelevant. The depreciation tax shield may becomputed separately. Excluding depreciation and allocated overheads, unit costs can be calculated.The company will obtain additional revenue from additional 20,000 units sold.
Thus, after-tax saving, excluding depreciation, tax shield, would be
= {100,000(200 – 148) – 80,000(200 – 173)} × (1 – 0.40)
= {52,00,000 – 21,60,000} × 0.60
= ̀ 18,24,000
After adjusting depreciation tax shield and salvage value, net cash flows and net present value areestimated.
Calculation of Cash flows and Project Profitability
` (`000)
0 1 2 3 4 5
1 After-tax savings - 1824 1824 1824 1824 1824
2 Depreciation(` 60,00,000 – 2,50,000)/5 - 1150 1150 1150 1150 1150
3 Tax shield on depreciation
(Depreciation × Tax rate) - 460 460 460 460 460
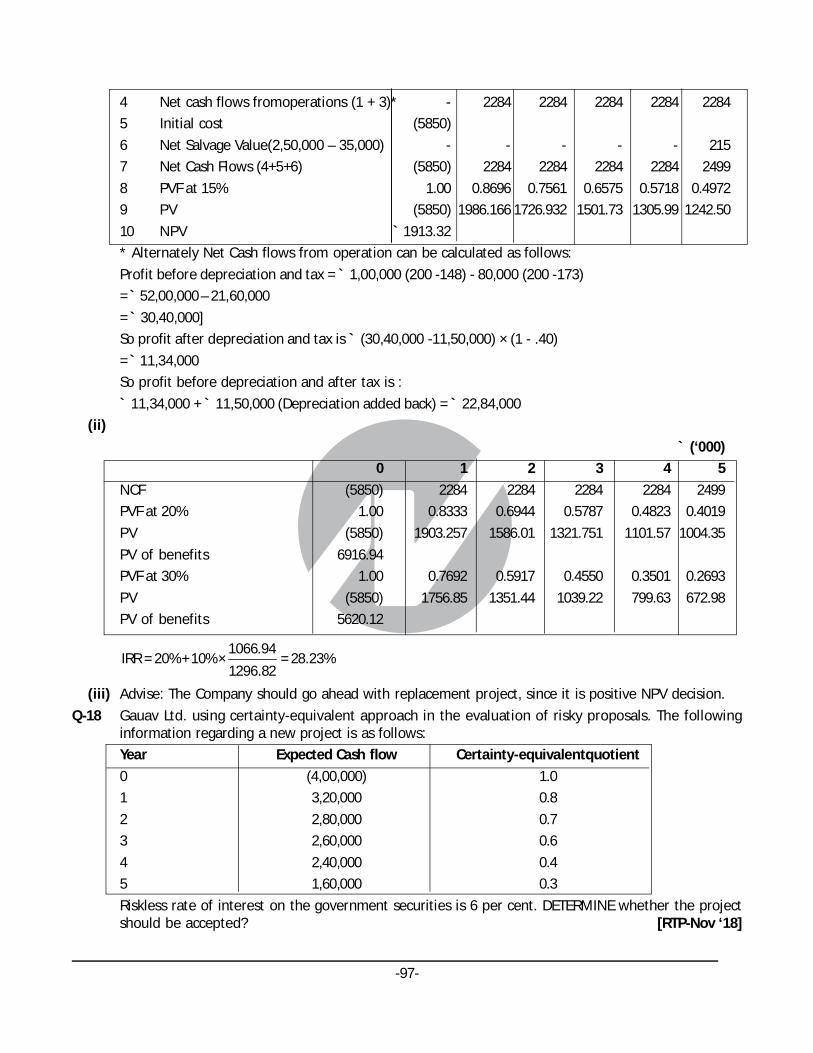
-97-
4 Net cash flows fromoperations (1 + 3)* - 2284 2284 2284 2284 2284
5 Initial cost (5850)
6 Net Salvage Value(2,50,000 – 35,000) - - - - - 215
7 Net Cash Flows (4+5+6) (5850) 2284 2284 2284 2284 2499
8 PVF at 15% 1.00 0.8696 0.7561 0.6575 0.5718 0.4972
9 PV (5850) 1986.166 1726.932 1501.73 1305.99 1242.50
10 NPV ` 1913.32
* Alternately Net Cash flows from operation can be calculated as follows:
Profit before depreciation and tax = ` 1,00,000 (200 -148) - 80,000 (200 -173)
= ̀ 52,00,000 – 21,60,000
= ` 30,40,000]
So profit after depreciation and tax is ` (30,40,000 -11,50,000) × (1 - .40)
= ̀ 11,34,000
So profit before depreciation and after tax is :
` 11,34,000 + ` 11,50,000 (Depreciation added back) = ` 22,84,000
(ii)
` (‘000)
0 1 2 3 4 5
NCF (5850) 2284 2284 2284 2284 2499
PVF at 20% 1.00 0.8333 0.6944 0.5787 0.4823 0.4019
PV (5850) 1903.257 1586.01 1321.751 1101.57 1004.35
PV of benefits 6916.94
PVF at 30% 1.00 0.7692 0.5917 0.4550 0.3501 0.2693
PV (5850) 1756.85 1351.44 1039.22 799.63 672.98
PV of benefits 5620.12
1066.94IRR = 20% + 10% × = 28.23%
1296.82
(iii) Advise: The Company should go ahead with replacement project, since it is positive NPV decision.
Q-18 Gauav Ltd. using certainty-equivalent approach in the evaluation of risky proposals. The followinginformation regarding a new project is as follows:
Year Expected Cash flow Certainty-equivalentquotient
0 (4,00,000) 1.0
1 3,20,000 0.8
2 2,80,000 0.7
3 2,60,000 0.6
4 2,40,000 0.4
5 1,60,000 0.3
Riskless rate of interest on the government securities is 6 per cent. DETERMINE whether the projectshould be accepted? [RTP-Nov ‘18]
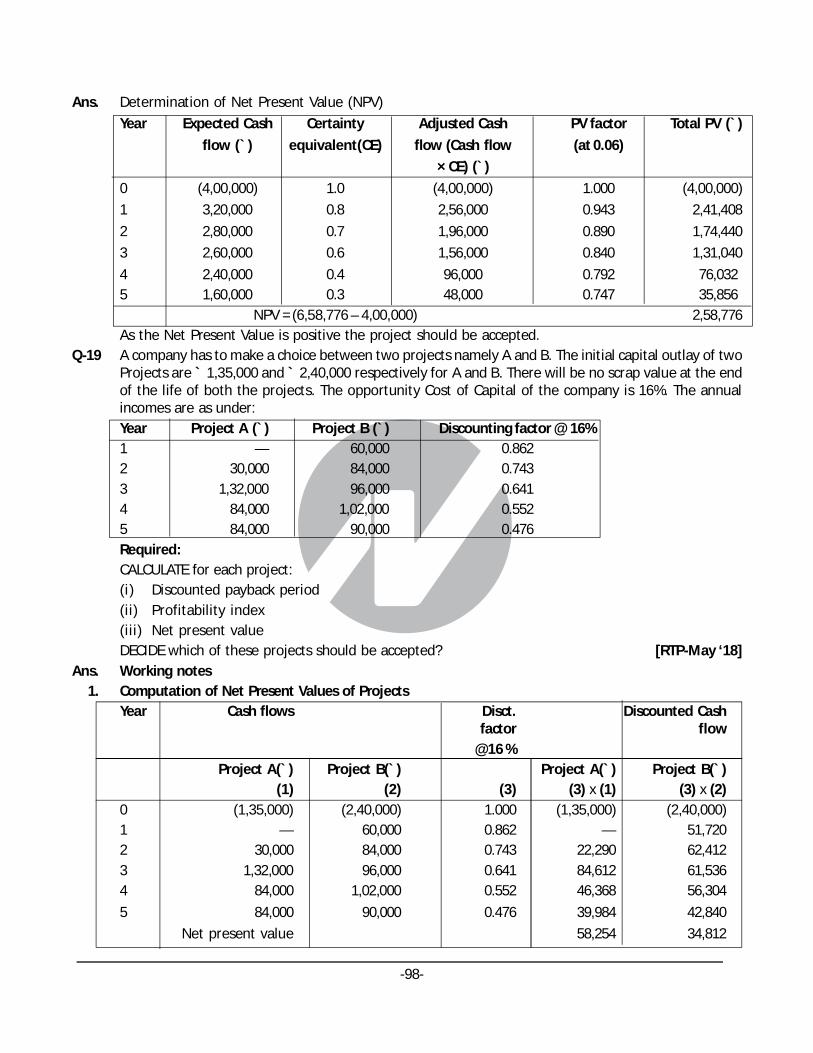
-98-
Ans. Determination of Net Present Value (NPV)
Year Expected Cash Certainty Adjusted Cash PV factor Total PV (`)
flow (`) equivalent(CE) flow (Cash flow (at 0.06)
× CE) (`)
0 (4,00,000) 1.0 (4,00,000) 1.000 (4,00,000)
1 3,20,000 0.8 2,56,000 0.943 2,41,408
2 2,80,000 0.7 1,96,000 0.890 1,74,440
3 2,60,000 0.6 1,56,000 0.840 1,31,040
4 2,40,000 0.4 96,000 0.792 76,0325 1,60,000 0.3 48,000 0.747 35,856
NPV = (6,58,776 – 4,00,000) 2,58,776As the Net Present Value is positive the project should be accepted.
Q-19 A company has to make a choice between two projects namely A and B. The initial capital outlay of twoProjects are ` 1,35,000 and ` 2,40,000 respectively for A and B. There will be no scrap value at the endof the life of both the projects. The opportunity Cost of Capital of the company is 16%. The annualincomes are as under:Year Project A (`) Project B (`) Discounting factor @ 16%1 — 60,000 0.8622 30,000 84,000 0.7433 1,32,000 96,000 0.6414 84,000 1,02,000 0.5525 84,000 90,000 0.476Required:CALCULATE for each project:(i) Discounted payback period(ii) Profitability index(iii) Net present valueDECIDE which of these projects should be accepted? [RTP-May ‘18]
Ans. Working notes1. Computation of Net Present Values of Projects
Year Cash flows Disct. Discounted Cashfactor flow
@16 %Project A(`) Project B(`) Project A(`) Project B(`)
(1) (2) (3) (3) x (1) (3) x (2)0 (1,35,000) (2,40,000) 1.000 (1,35,000) (2,40,000)1 — 60,000 0.862 — 51,7202 30,000 84,000 0.743 22,290 62,4123 1,32,000 96,000 0.641 84,612 61,5364 84,000 1,02,000 0.552 46,368 56,304
5 84,000 90,000 0.476 39,984 42,840
Net present value 58,254 34,812

-99-
2. Computation of Cumulative Present Values of Projects Cash inflowsYear Project A Project B
PV of Cumulative PV of Cumulativecash inflows (`) PV (`) cash inflows (`) PV (`)
1 — — 51,720 51,7202 22,290 22,290 62,412 1,14,1323 84,612 1,06,902 61,536 1,75,6684 46,368 1,53,270 56,304 2,31,9725 39,984 1,93,254 42,840 2,74,812(i) Discounted payback period: (Refer to Working note 2)
Cost of Project A = ` 1,35,000Cost of Project B = ` 2,40,000Cumulative PV of cash inflows of Project A after 4 years = ` 1,53,270Cumulative PV of cash inflows of Project B after 5 years = ` 2,74,812A comparison of projects cost with their cumulative PV clearly shows that the project A’s cost willbe recovered in less than 4 years and that of project B in less than 5 years. The exact duration ofdiscounted payback period can be computed as follows:
Project A Project BExcess PV of cash inflows 18,270 34,812over theproject cost (`) (` 1,53,270 - ` 1,35,000) (` 2,74,812 - ` 2,40,000)Computation of 0.39 year 0.81 yearsperiod required to (` 18,270 ÷ ` 46,368) (` 34,812 ÷ ` 42,840)recover excessamount of cumulativePV over project cost(Refer to Workingnote 2)Discounted pay back 3.61 year 4.19 yearsperiod (4 - 0.39) years (5 - 0.81) years
(ii) Profitability Index(PI): =Sum of discounted cash in flows
Initian cash outlay
Profitability Index (for Project A) =1,93,254
= 1.431,35, 000
`
`
Profitability Index (for Project B) = 2,74,812
= 1.15 2, 40, 000
`
`
(iii) Net present value(NPV) (for Project A) = ` 58,254Net present value(NPV) (for Project B) = ` 34,812(Refer to Working note 1)
Conclusion: As the NPV, PI of Project A is higher and Discounted Pay back is lower, therefore Project ashould be accepted.

-100-
Q-20 From the following details relating to a project, analyse the sensitivity of the project tochanges ininitial project cost, annual cash inflow and cost of capital:
Initial Project Cost (`) 1,20,000
Annual Cash Inflow (`) 45,000
Project Life (Years) 4
Cost of Capital 10%
Required:
EXAMINE which of the three factors, the project is most sensitive? (Use annuity factors:
for 10% 3.169 and 11% 3.103). [RTP-May ‘18]
Ans. CALCULATION OF NET PRESENT VALUE
(` )
PV of Annual cash inflows (` 45,000 × 3.169) 1,42,605
Initial Project Cost 1,20,000
NPV (PV of Cash flow – Initial Cost) 22,605
If initial project cost is varied adversely by 10%*
Initial Project Cost (1,20,000 × 110%) ` 1,32,000
NPV (Revised) (` 1,42,605 - ` 1,32,000 ) ` 10,605
Change in NPV (` 22,605 – ` 10,605)/ ` 22,605 i.e 53.08%
If annual cash inflow is varied adversely by 10%*
Revised annual inflow (` 45,000 × 90%) ` 40,500
NPV (Revised) (` 40,500 × 3.169) – (` 1,20,000) (+) ` 8,345
Change in NPV (` 22,605 – ` 8,345) / ` 22,605 63.08%
If cost of capital is varied adversely by 10%*
NPV (Revised) (` 45,000 × 3.103) – ` 1,20,000 (+) ` 19,635
Change in NPV (` 22,605 – ` 19,635) / ` 22,605 13.14 %
Conclusion: Project is most sensitive to ‘annual cash inflows’
(*It is assumed that adverse variation is 10%)
Q-21 MTR Limited is considering buying a new machine which would have a useful economic life of fiveyears, at a cost of `25,00,000 and a scrap value of `3,00,000, with 80 per cent of the cost being payableat the start of the project and 20 per cent at the end of the first year. The machine would produce 75,000units per annum of a new product with an estimated selling price of ` 300 per unit. Direct costs wouldbe ` 285 per unit and annual fixed costs, including depreciation calculated on a straight- line basis,would be `8,40,000 per annum.
In the first year and the second year, special sales promotion expenditure, not included in the abovecosts, would be incurred, amounting to ` 1,00,000 and `1,50,000 respectively.
EVALUATE the project using the NPV method of investment appraisal, assuming the company’s cost ofcapital to be 15 percent.
[RTP-Nov ‘19]
Ans. Calculation of Net Cash flows
Contribution = (300 – 285) x 75,000 = `11,25,000

-101-
Fixed costs = 8,40,000 – [(25,00,000 – 3,00,000)/5] = ` 4,00,000
Year Capital (`) Contribution(`) Fixed costs(`) Adverts(`) Net cashflow (`)
0 (20,00,000) (20,00,000)
1 (5,00,000) 11,25,000 (4,00,000) (1,00,000) 1,25,000
2 11,25,000 (4,00,000) (1,50,000) 5,75,0003 11,25,000 (4,00,000) 7,25,000
4 11,25,000 (4,00,000) 7,25,000
5 3,00,000 11,25,000 (4,00,000) 10,25,000
Calculation of Net Present Value
Year Net cash flow (`) 12% discount factor Present value(`)
0 (20,00,000) 1.000 (20,00,000)
1 1,25,000 0.892 1,11,500
2 5,75,000 0.797 4,58,275
3 7,25,000 0.711 5,15,475
4 7,25,000 0.635 4,60,375
5 10,25,000 0.567 5,81,175
1,26,800
The net present value of the project is `1,26,800.
Q-22 SL Ltd. has invested `1,000 lakhs in a project. The risk-free rate of return is 5%. Risk premium expectedby the Management is 10%. The life of the project is 5 years. Following are the cash flows that areestimated over the life of the project.
Year Cash flows (` in lakhs)
1 125
2 300
3 375
4 400
5 325
CALCULATE Net Present Value of the project based on Risk free rate and also on the basis of Risksadjusted discount rate. [RTP-Nov ‘19]
Ans. The Present Value of the Cash Flows for all the years by discounting the cash flow at 5% is calculated asbelow:
Year Cash flows` in lakhs Discounting Present value of Cash
Factor@5% Flows ` In Lakhs
1 125 0.952 119.00
2 300 0.907 272.10
3 375 0.863 323.62
4 400 0.822 328.80
5 325 0.783 254.47
Total of present value of Cash flow 1,297.99
Less: Initial investment 1,000.00
Net Present Value (NPV) 297.99
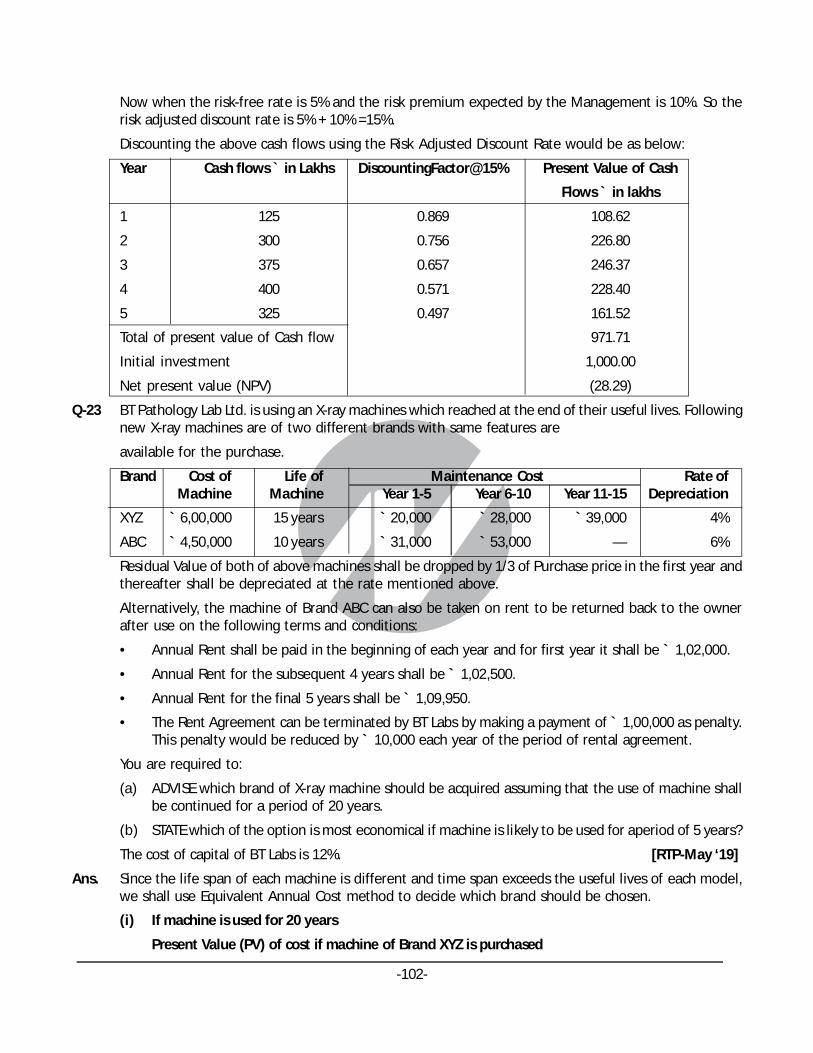
-102-
Now when the risk-free rate is 5% and the risk premium expected by the Management is 10%. So therisk adjusted discount rate is 5% + 10% =15%.
Discounting the above cash flows using the Risk Adjusted Discount Rate would be as below:
Year Cash flows ` in Lakhs DiscountingFactor@15% Present Value of Cash
Flows ` in lakhs
1 125 0.869 108.62
2 300 0.756 226.80
3 375 0.657 246.37
4 400 0.571 228.40
5 325 0.497 161.52
Total of present value of Cash flow 971.71
Initial investment 1,000.00
Net present value (NPV) (28.29)
Q-23 BT Pathology Lab Ltd. is using an X-ray machines which reached at the end of their useful lives. Followingnew X-ray machines are of two different brands with same features are
available for the purchase.
Brand Cost of Life of Maintenance Cost Rate ofMachine Machine Year 1-5 Year 6-10 Year 11-15 Depreciation
XYZ ` 6,00,000 15 years ` 20,000 ` 28,000 ` 39,000 4%
ABC ` 4,50,000 10 years ` 31,000 ` 53,000 — 6%
Residual Value of both of above machines shall be dropped by 1/3 of Purchase price in the first year andthereafter shall be depreciated at the rate mentioned above.
Alternatively, the machine of Brand ABC can also be taken on rent to be returned back to the ownerafter use on the following terms and conditions:
• Annual Rent shall be paid in the beginning of each year and for first year it shall be ` 1,02,000.
• Annual Rent for the subsequent 4 years shall be ` 1,02,500.
• Annual Rent for the final 5 years shall be ` 1,09,950.
• The Rent Agreement can be terminated by BT Labs by making a payment of ` 1,00,000 as penalty.This penalty would be reduced by ` 10,000 each year of the period of rental agreement.
You are required to:
(a) ADVISE which brand of X-ray machine should be acquired assuming that the use of machine shallbe continued for a period of 20 years.
(b) STATE which of the option is most economical if machine is likely to be used for aperiod of 5 years?
The cost of capital of BT Labs is 12%. [RTP-May ‘19]
Ans. Since the life span of each machine is different and time span exceeds the useful lives of each model,we shall use Equivalent Annual Cost method to decide which brand should be chosen.
(i) If machine is used for 20 years
Present Value (PV) of cost if machine of Brand XYZ is purchased
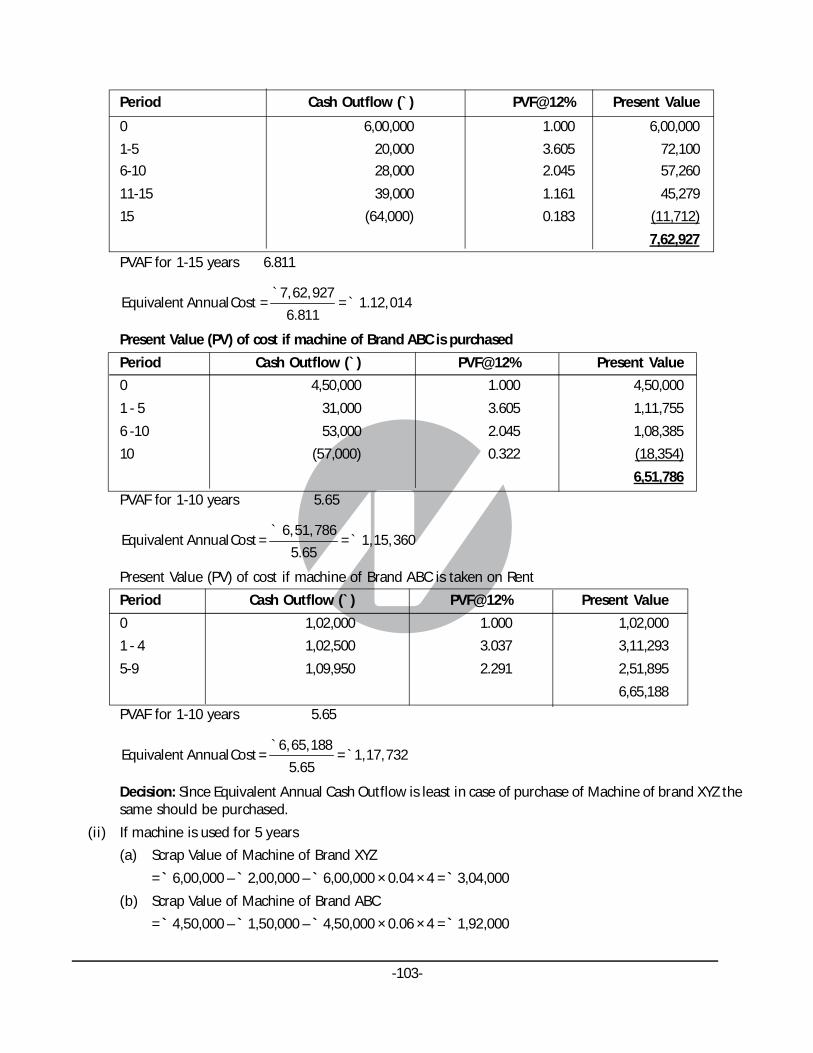
-103-
Period Cash Outflow (`) PVF@12% Present Value
0 6,00,000 1.000 6,00,000
1-5 20,000 3.605 72,100
6-10 28,000 2.045 57,260
11-15 39,000 1.161 45,279
15 (64,000) 0.183 (11,712)
7,62,927
PVAF for 1-15 years 6.811
7,62,927Equivalent Annual Cost = = 1.12,014
6.811
``
Present Value (PV) of cost if machine of Brand ABC is purchased
Period Cash Outflow (`) PVF@12% Present Value
0 4,50,000 1.000 4,50,000
1 - 5 31,000 3.605 1,11,755
6 -10 53,000 2.045 1,08,385
10 (57,000) 0.322 (18,354)
6,51,786
PVAF for 1-10 years 5.65
6,51,786Equivalent Annual Cost = = 1,15,360
5.65
` `
Present Value (PV) of cost if machine of Brand ABC is taken on Rent
Period Cash Outflow (`) PVF@12% Present Value
0 1,02,000 1.000 1,02,000
1 - 4 1,02,500 3.037 3,11,293
5-9 1,09,950 2.291 2,51,895
6,65,188
PVAF for 1-10 years 5.65
6,65,188Equivalent Annual Cost = = 1,17,732
5.65
``
Decision: Since Equivalent Annual Cash Outflow is least in case of purchase of Machine of brand XYZ thesame should be purchased.
(ii) If machine is used for 5 years
(a) Scrap Value of Machine of Brand XYZ
= ` 6,00,000 – ` 2,00,000 – ` 6,00,000 × 0.04 × 4 = ` 3,04,000
(b) Scrap Value of Machine of Brand ABC
= ` 4,50,000 – ` 1,50,000 – ` 4,50,000 × 0.06 × 4 = ` 1,92,000
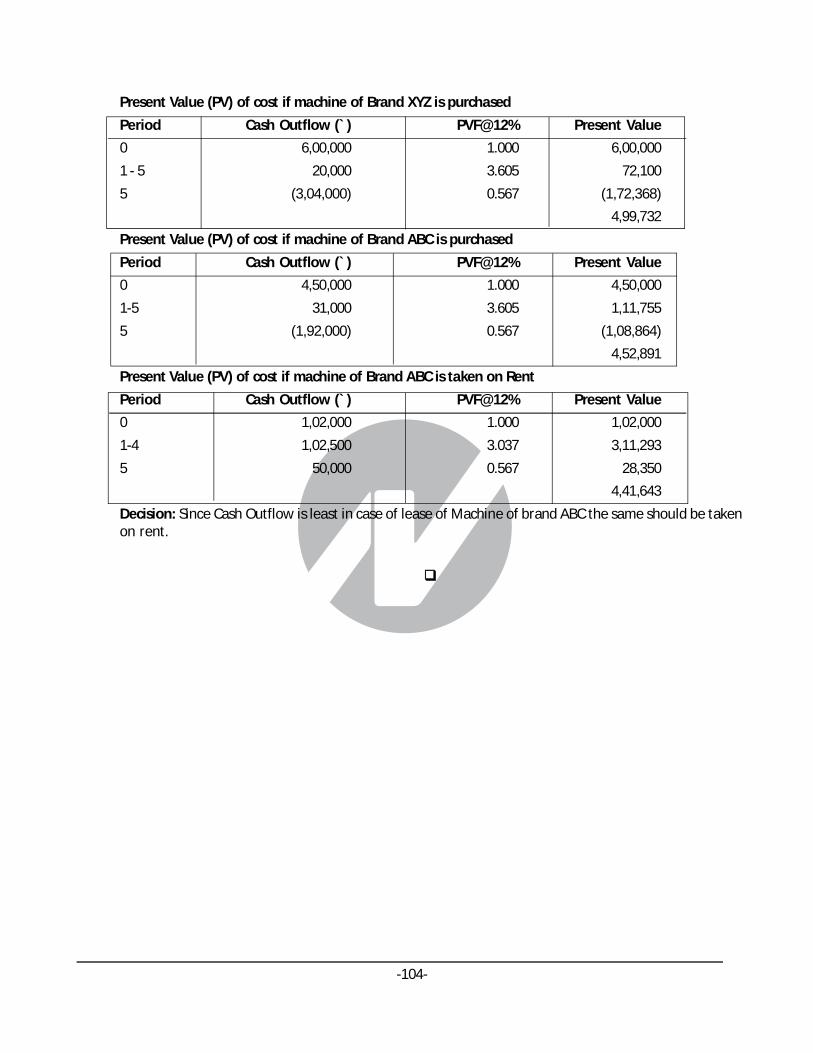
-104-
Present Value (PV) of cost if machine of Brand XYZ is purchased
Period Cash Outflow (`) PVF@12% Present Value
0 6,00,000 1.000 6,00,000
1 - 5 20,000 3.605 72,100
5 (3,04,000) 0.567 (1,72,368)
4,99,732
Present Value (PV) of cost if machine of Brand ABC is purchased
Period Cash Outflow (`) PVF@12% Present Value
0 4,50,000 1.000 4,50,000
1-5 31,000 3.605 1,11,755
5 (1,92,000) 0.567 (1,08,864)
4,52,891
Present Value (PV) of cost if machine of Brand ABC is taken on Rent
Period Cash Outflow (`) PVF@12% Present Value
0 1,02,000 1.000 1,02,000
1-4 1,02,500 3.037 3,11,293
5 50,000 0.567 28,350
4,41,643
Decision: Since Cash Outflow is least in case of lease of Machine of brand ABC the same should be takenon rent.
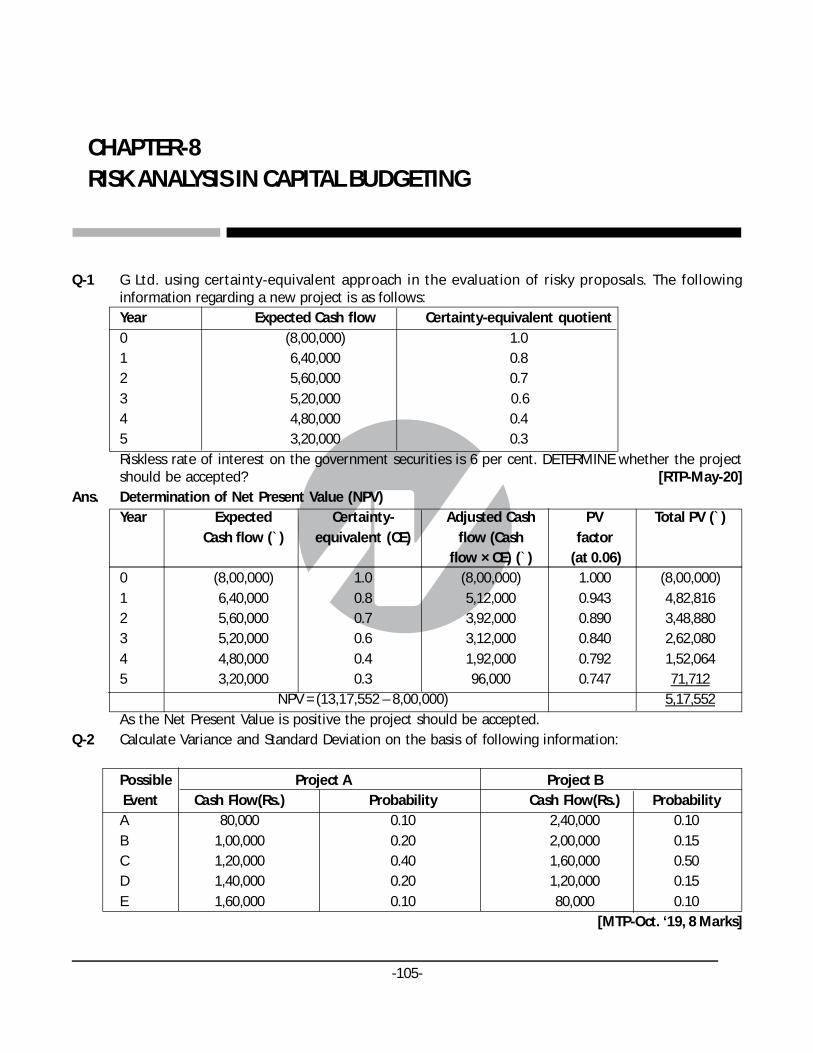
-105-
Q-1 G Ltd. using certainty-equivalent approach in the evaluation of risky proposals. The followinginformation regarding a new project is as follows:Year Expected Cash flow Certainty-equivalent quotient0 (8,00,000) 1.01 6,40,000 0.82 5,60,000 0.73 5,20,000 0.64 4,80,000 0.45 3,20,000 0.3Riskless rate of interest on the government securities is 6 per cent. DETERMINE whether the projectshould be accepted? [RTP-May-20]
Ans. Determination of Net Present Value (NPV)Year Expected Certainty- Adjusted Cash PV Total PV (`)
Cash flow (`) equivalent (CE) flow (Cash factorflow × CE) (`) (at 0.06)
0 (8,00,000) 1.0 (8,00,000) 1.000 (8,00,000)1 6,40,000 0.8 5,12,000 0.943 4,82,8162 5,60,000 0.7 3,92,000 0.890 3,48,8803 5,20,000 0.6 3,12,000 0.840 2,62,0804 4,80,000 0.4 1,92,000 0.792 1,52,0645 3,20,000 0.3 96,000 0.747 71,712
NPV = (13,17,552 – 8,00,000) 5,17,552As the Net Present Value is positive the project should be accepted.
Q-2 Calculate Variance and Standard Deviation on the basis of following information:
Possible Project A Project B Event Cash Flow(Rs.) Probability Cash Flow(Rs.) ProbabilityA 80,000 0.10 2,40,000 0.10B 1,00,000 0.20 2,00,000 0.15C 1,20,000 0.40 1,60,000 0.50D 1,40,000 0.20 1,20,000 0.15E 1,60,000 0.10 80,000 0.10
[MTP-Oct. ‘19, 8 Marks]
CHAPTER-8RISK ANALYSIS IN CAPITAL BUDGETING

-106-
Ans. Calculation of Expected Value for Project A and Project B
Project A Project B
Possible Net Cash Probability Expected Cash Probability Expected
Event Flow (Rs.) Value(Rs.) Flow (Rs.) Value(Rs.)
A 80,000 0.10 8,000 2,40,000 0.10 24,000
B 1,00,000 0.20 20,000 2,00,000 0.15 30,000
C 1,20,000 0.40 48,000 1,60,000 0.50 80,000
D 1,40,000 0.20 28,000 1,20,000 0.15 18,000
E 1,60,000 0.10 16,000 80,000 0.10 8,000
ENCF 1,20,000 1,60,000
Project A
�Variance ( 2) = (80,000 – 1,20,000)2 × (0.1) + (1,00,000 -1,20,000)2 × (0.2) + (1,20,000 – 1,20,000)2 × (0.4) +(1,40,000 – 1,20,000)2 × (0.2) + (1,60,000 – 1,20,000)2 × (0.1)
= 16,00,00,000 + 8,00,00,000 + 0 + 8,00,00,000 + 16,00,00,000
= 48,00,00,000
2Standard Deviation σ Variance σ = 48,00,00,000 =21,908.90
Project B:
�Variance( 2) = (2,40,000 – 1,60,000)2 × (0.1) + (2,00,000 – 1,60,000)2 × (0.15) + (1,60,000 –
1,60,000)2 ×(0.5) + (1,20,000 – 1,60,000)2 × (0.15) + (80,000 – 1,60,000)2 × (0.1)
= 64,00,00,000 + 24,00,00,000 + 0 + 24,00,00,000 + 64,00,00,000
= 1,76,00,00,000
Standard Deviation σ = 1,76,00,00,000 = 41,952.35
Q-3 Explain the concept of discounted payback period. [MTP-Oct ‘19, 2 Marks]
Ans. Concept of Discounted Payback Period
Payback period is time taken to recover the original investment from project cash flows. It is alsotermed as break even period. The focus of the analysis is on liquidity aspect and it suffers from thelimitation of ignoring time value of money and profitability. Discounted payback period consi derspresent value of cash flows, discounted at company’s cost of capital to estimate breakeven period i.e.it is that period in which future discounted cash flows equal the initial outflow. The shorter the period,better it is. It also ignores post discounted payback period cash flows.
Q-4 Determine the risk adjusted net present value of the following projects:
X Y Z
Net cash outlays (Rs.) 2,10,000 1,20,000 1,00,000
Project life 5 years 5 years 5 years
Annual Cash inflow (Rs.) 70,000 42,000 30,000
Coefficient of variation 1.2 0.8 0.4
The Company selects the risk-adjusted rate of discount on the basis of the coefficient of variation:

-107-
Coefficient of
Variation Risk-Adjusted Rate P.V. Factor 1 to 5 years At risk
of Return adjusted rate of discount
0.0 10% 3.791
0.4 12% 3.605
0.8 14% 3.433
1.2 16% 3.274
1.6 18% 3.127
2.0 22% 2.864
More than 2.0 25% 2.689
[MTP-March ‘19,5 Marks]
Ans. Statement showing the determination of the risk adjusted net present value
Projects Net Coefficient Risk Annual PV factor Discounted Net present
cash of adjusted cash 1-5 years cash inflow value
out variation discount inflow
lays rate
(Rs.) (Rs.) (Rs.) (Rs.)
(i) (ii) (iii) (iv) (v) (vi) (vii) = (v) x (vi)(viii) = (vii) x (ii)
X 2,10,000 1.20 16% 70,000 3.274 2,29,180 19,180
Y 1,20,000 0.80 14% 42,000 3.433 1,44,186 24,186
Z 1,00,000 0.40 12% 30,000 3.605 1,08,150 8,150
Q-5 An enterprise is investing Rs.100 lakhs in a project. The risk-free rate of return is 7%. Risk premiumexpected by the management is 7%. The life of the project is 5 years. Following are the cash flows thatare estimated over the life of the project.
Year Cash flows (Rs.)
1 25,00,000
2 60,00,000
3 75,00,000
4 80,00,000
5 65,00,000
CALCULATE Net Present Value of the project based on Risk free rate and also on the basis of Risksadjusted discount rate. [MTP-Aug. ‘18, 5 Marks]
Ans. The Present Value of the Cash Flows for all the years by discounting the cash flow at 7% is calculated asbelow:
Year Cash flows Rs. in lakhs Discounting factor @7% Present value of cash
flows Rs. in lakhs
1 25,00,000 0.935 23,37,500
2 60,00,000 0.873 52,38,000
3 75,00,000 0.816 61,20,000

-108-
4 80,00,000 0.763 61,04,000
5 65,00,000 0.713 46,34,500
Total of present value of Cash flow 2,44,34,000
Less: Initial investment 1,00,00,000
Net Present Value (NPV) 1,44,34,000
When the risk-free rate is 7% and the risk premium expected by the management is 7 %. So the riskadjusted discount rate is 7% + 7% =14%.
Discounting the above cash flows using the Risk Adjusted Discount Rate would be as below:
Year Cash flowsRs. in lakhs Discounting factor @14% Present Value of cash
flowsRs. in lakhs
1 25,00,000 0.877 21,92,500
2 60,00,000 0.769 46,14,000
3 75,00,000 0.675 50,62,500
4 80,00,000 0.592 47,36,000
5 65,00,000 0.519 33,73,500
Total of present value of Cash flow 1,99,78,500
Initial investment 1,00,00,000
Net present value (NPV) 99,78,500
Q-6 Following are cost information of KG Ltd., which has commenced a new project for anannual productionof 24,000 units which is the full capacity:
Costs per unit (`)
Materials 80.00
Direct labour and variable expenses 40.00
Fixed manufacturing expenses 12.00
Depreciation 20.00
Fixed administration expenses 8.00
160.00
The selling price per unit is expected to be `192 and the selling expenses `10 per unit, 80% of which isvariable.
In the first two years of operations, production and sales are expected to be as follows:
Year Production (No. of units) Sales (No. of units)
1 12,000 10,000
2 18,000 17,000
To assess the working capital requirements, the following additional information is available:
(a) Stock of materials 2 months’ average consumption
(b) Work-in-process Nil
(c) Debtors 2 month’s average sales.
(d) Cash balance ` 1,00,000
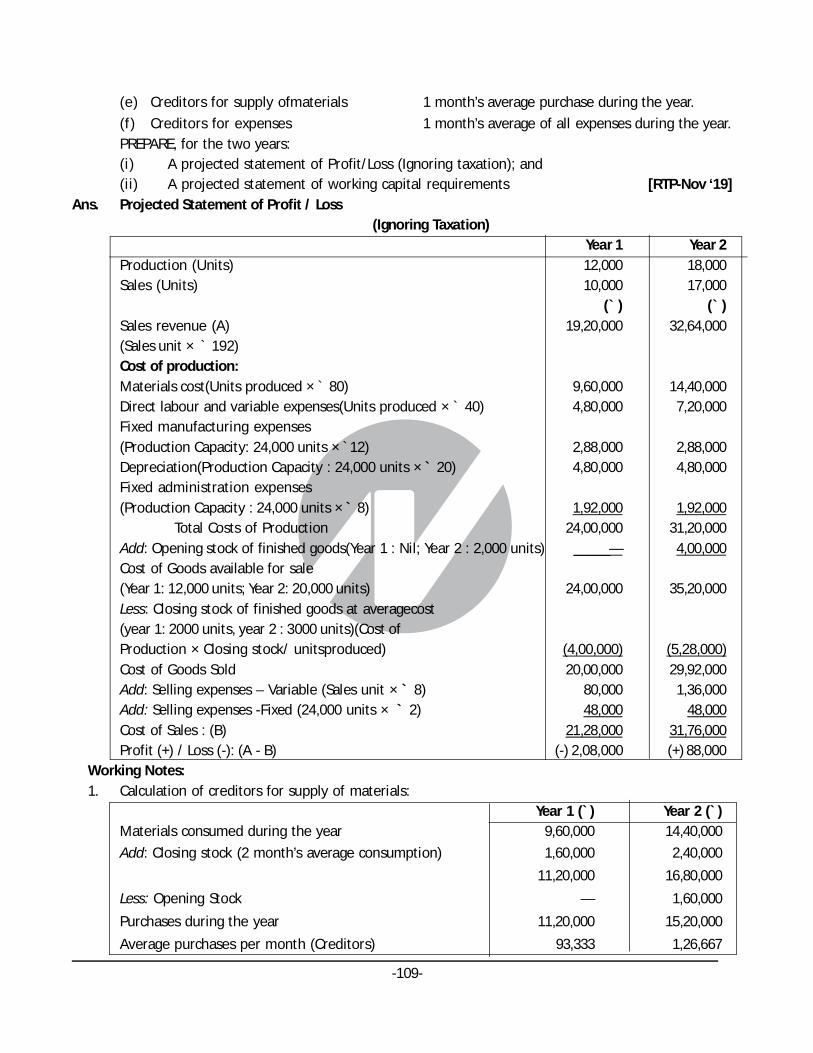
-109-
(e) Creditors for supply ofmaterials 1 month’s average purchase during the year.
(f) Creditors for expenses 1 month’s average of all expenses during the year.PREPARE, for the two years:(i) A projected statement of Profit/Loss (Ignoring taxation); and(ii) A projected statement of working capital requirements [RTP-Nov ‘19]
Ans. Projected Statement of Profit / Loss(Ignoring Taxation)
Year 1 Year 2Production (Units) 12,000 18,000Sales (Units) 10,000 17,000
(` ) (` )Sales revenue (A) 19,20,000 32,64,000(Sales unit × ` 192)Cost of production:Materials cost(Units produced × ` 80) 9,60,000 14,40,000Direct labour and variable expenses(Units produced × ` 40) 4,80,000 7,20,000Fixed manufacturing expenses(Production Capacity: 24,000 units × `12) 2,88,000 2,88,000Depreciation(Production Capacity : 24,000 units × ` 20) 4,80,000 4,80,000Fixed administration expenses(Production Capacity : 24,000 units × ` 8) 1,92,000 1,92,000
Total Costs of Production 24,00,000 31,20,000Add: Opening stock of finished goods(Year 1 : Nil; Year 2 : 2,000 units) _____— 4,00,000Cost of Goods available for sale(Year 1: 12,000 units; Year 2: 20,000 units) 24,00,000 35,20,000Less: Closing stock of finished goods at averagecost(year 1: 2000 units, year 2 : 3000 units)(Cost ofProduction × Closing stock/ unitsproduced) (4,00,000) (5,28,000)Cost of Goods Sold 20,00,000 29,92,000Add: Selling expenses – Variable (Sales unit × ` 8) 80,000 1,36,000Add: Selling expenses -Fixed (24,000 units × ` 2) 48,000 48,000Cost of Sales : (B) 21,28,000 31,76,000Profit (+) / Loss (-): (A - B) (-) 2,08,000 (+) 88,000
Working Notes:1. Calculation of creditors for supply of materials:
Year 1 (`) Year 2 (`)Materials consumed during the year 9,60,000 14,40,000
Add: Closing stock (2 month’s average consumption) 1,60,000 2,40,000
11,20,000 16,80,000
Less: Opening Stock — 1,60,000
Purchases during the year 11,20,000 15,20,000
Average purchases per month (Creditors) 93,333 1,26,667
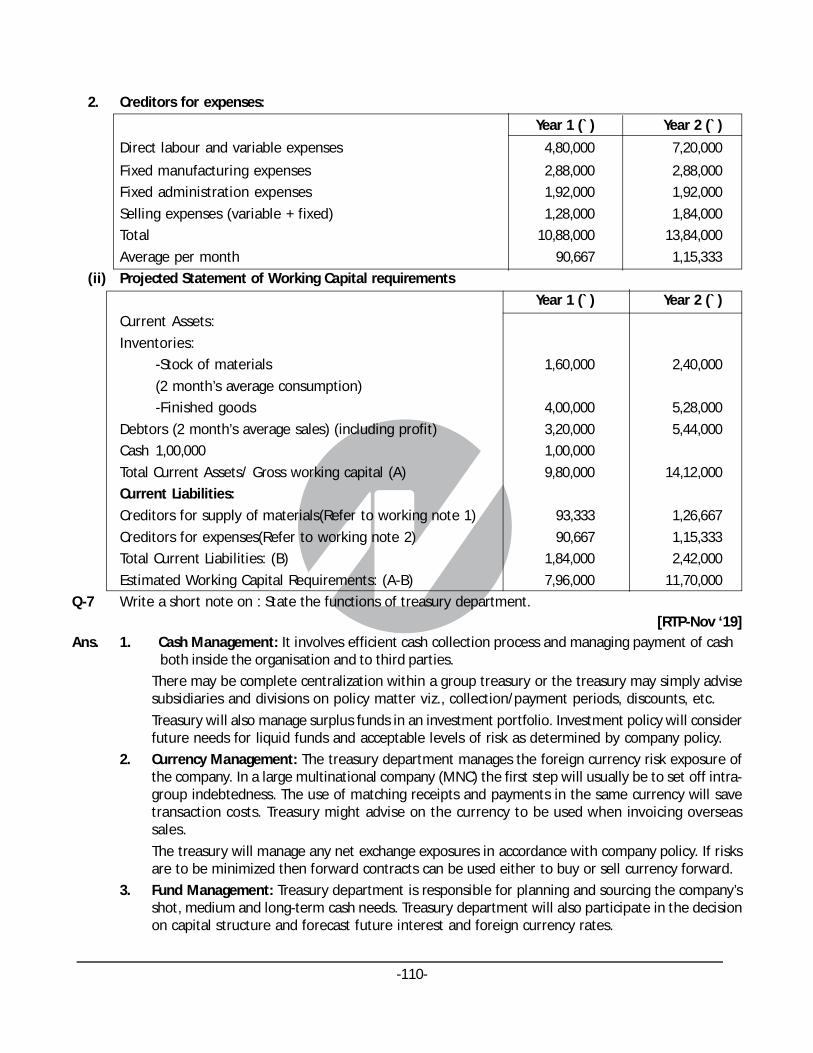
-110-
2. Creditors for expenses:
Year 1 (`) Year 2 (`)
Direct labour and variable expenses 4,80,000 7,20,000
Fixed manufacturing expenses 2,88,000 2,88,000
Fixed administration expenses 1,92,000 1,92,000
Selling expenses (variable + fixed) 1,28,000 1,84,000
Total 10,88,000 13,84,000
Average per month 90,667 1,15,333
(ii) Projected Statement of Working Capital requirements
Year 1 (`) Year 2 (`)
Current Assets:
Inventories:
-Stock of materials 1,60,000 2,40,000
(2 month’s average consumption)
-Finished goods 4,00,000 5,28,000
Debtors (2 month’s average sales) (including profit) 3,20,000 5,44,000
Cash 1,00,000 1,00,000
Total Current Assets/ Gross working capital (A) 9,80,000 14,12,000
Current Liabilities:
Creditors for supply of materials(Refer to working note 1) 93,333 1,26,667
Creditors for expenses(Refer to working note 2) 90,667 1,15,333
Total Current Liabilities: (B) 1,84,000 2,42,000
Estimated Working Capital Requirements: (A-B) 7,96,000 11,70,000
Q-7 Write a short note on : State the functions of treasury department.[RTP-Nov ‘19]
Ans. 1. Cash Management: It involves efficient cash collection process and managing payment of cash both inside the organisation and to third parties.
There may be complete centralization within a group treasury or the treasury may simply advisesubsidiaries and divisions on policy matter viz., collection/payment periods, discounts, etc.
Treasury will also manage surplus funds in an investment portfolio. Investment policy will considerfuture needs for liquid funds and acceptable levels of risk as determined by company policy.
2. Currency Management: The treasury department manages the foreign currency risk exposure ofthe company. In a large multinational company (MNC) the first step will usually be to set off intra-group indebtedness. The use of matching receipts and payments in the same currency will savetransaction costs. Treasury might advise on the currency to be used when invoicing overseassales.
The treasury will manage any net exchange exposures in accordance with company policy. If risksare to be minimized then forward contracts can be used either to buy or sell currency forward.
3. Fund Management: Treasury department is responsible for planning and sourcing the company’sshot, medium and long-term cash needs. Treasury department will also participate in the decisionon capital structure and forecast future interest and foreign currency rates.

-111-
4. Banking: It is important that a company maintains a good relationship with its bankers. Treasurydepartment carry out negotiations with bankers and act as the initial point of contact with them.Short-term finance can come in the form of bank loans or through the sale of commercial paper inthe money market.
5. Corporate Finance: Treasury department is involved with both acquisition and divestmentactivities within the group. In addition, it will often have responsibility for investor relations. Thelatter activity has assumed increased importance in markets where share-price performance isregarded as crucial and may affect the company’s ability to undertake acquisition activity or, if theprice falls drastically, render it vulnerable to a hostile bid.
Q-8 A proforma cost sheet of a company provides the following particulars:
Amount per unit (`)
Raw materials cost 100.00
Direct labour cost 37.50
Overheads cost 75.00
Total cost 212.50
Profit 37.50
Selling Price 250.00
The Company keeps raw material in stock, on an average for one month; work-in-progress, on anaverage for one week; and finished goods in stock, on an average for two weeks.
The credit allowed by suppliers is three weeks and company allows four weeks credit to its debtors.
The lag in payment of wages is one week and lag in payment of overhead expenses is two weeks.
The Company sells one-fifth of the output against cash and maintains cash-in-hand and at bank puttogether at `37,500.
Required:
PREPARE a statement showing estimate of Working Capital needed to finance an activity level of1,30,000 units of production. Assume that production is carried on evenly throughout the year, andwages and overheads accrue similarly. Work-in-progress stock is 80% complete in all respects.
[RTP-May ‘19, MTP-March ‘19]
Ans. Statement showing Estimate of Working Capital Needs(Amount in `) (Amount in `)
A. Current Assets(i) Inventories:
Raw material (1 month or 4 weeks)
1,30, 000units × 100× 4weeks
52weeks
`10,00,000
WIP Inventory (1 week)× 0.8
1,30, 000 units × 212.50× 1 week × 0.8
52 weeks
` ` 4,25,000
Finished goods inventory (2 weeks)

-112-
1,30, 000 units × 212.50× 2 week
52 weeks
` ` 10,62,500 24,87,500
(ii) Receivables (Debtors) (4 weeks)
1,30,000 units × 212.50 4× 4 week
52 weeks 5th
` ` 17,00,000
(iii) Cash and bank balance 37,500
Total Current Assets 42,25,000B. Current Liabilities:(i) Payables (Creditors) for materials (3 weeks) 7,50,000
1,30, 000 units × 100× 3 week
52 weeks
` `
(ii) Outstanding wages (1 week)
1,30,000 units × 37.50×1 week
52 weeks
` `93,750
(iii) Outstanding overheads (2 weeks) 3,75,000
1,30,000 units × 75× 2 week
52 weeks
` `
Total Current Liabilities 12,18,750
Net Working Capital Needs (A – B) 30,06,250
Q-9 A Ltd. is in the manufacturing business and it acquires raw material from X Ltd. on a regular basis. As perthe terms of agreement the payment must be made within 40 days of purchase. However, A Ltd. has achoice of paying ` 98.50 per ` 100 it owes to X Ltd. on or before 10th day of purchase.
Required:
EXAMINE whether A Ltd. should accept the offer of discount assuming average billing of A Ltd. with XLtd. is ` 10,00,000 and an alternative investment yield a return of 15% and company pays the invoice.
[RTP-May ‘18]
Ans. Annual Benefit of accepting the Discount
1.5 365 days× = 18.53%
100 - 1.50 40 -10 days
`
` `
Annual Cost = Opportunity Cost of foregoing interest on investment = 15%
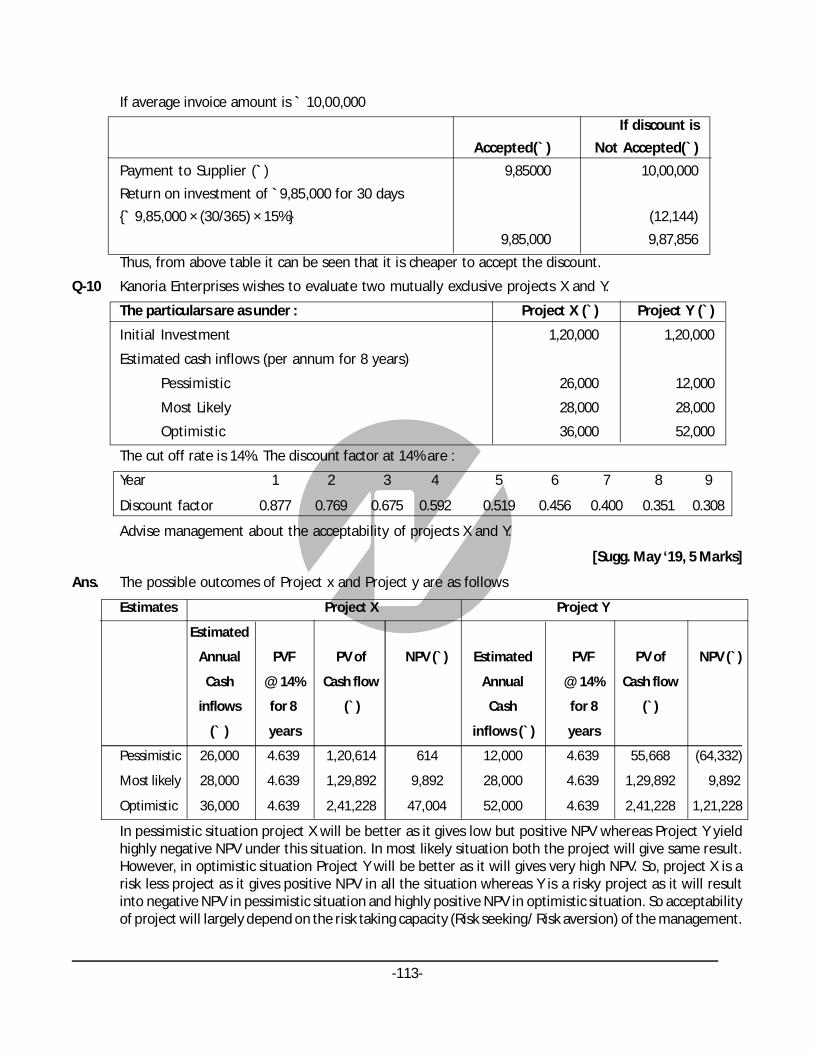
-113-
If average invoice amount is ` 10,00,000
If discount is
Accepted(`) Not Accepted(`)
Payment to Supplier (`) 9,85000 10,00,000
Return on investment of `9,85,000 for 30 days
{` 9,85,000 × (30/365) × 15%} (12,144)
9,85,000 9,87,856
Thus, from above table it can be seen that it is cheaper to accept the discount.
Q-10 Kanoria Enterprises wishes to evaluate two mutually exclusive projects X and Y.
The particulars are as under : Project X (`) Project Y (`)
Initial Investment 1,20,000 1,20,000
Estimated cash inflows (per annum for 8 years)
Pessimistic 26,000 12,000
Most Likely 28,000 28,000
Optimistic 36,000 52,000
The cut off rate is 14%. The discount factor at 14% are :
Year 1 2 3 4 5 6 7 8 9
Discount factor 0.877 0.769 0.675 0.592 0.519 0.456 0.400 0.351 0.308
Advise management about the acceptability of projects X and Y.
[Sugg. May ‘19, 5 Marks]
Ans. The possible outcomes of Project x and Project y are as follows
Estimates Project X Project Y
Estimated
Annual PVF PV of NPV (`) Estimated PVF PV of NPV (`)
Cash @ 14% Cash flow Annual @ 14% Cash flow
inflows for 8 (`) Cash for 8 (`)
(` ) years inflows (`) years
Pessimistic 26,000 4.639 1,20,614 614 12,000 4.639 55,668 (64,332)
Most likely 28,000 4.639 1,29,892 9,892 28,000 4.639 1,29,892 9,892
Optimistic 36,000 4.639 2,41,228 47,004 52,000 4.639 2,41,228 1,21,228
In pessimistic situation project X will be better as it gives low but positive NPV whereas Project Y yieldhighly negative NPV under this situation. In most likely situation both the project will give same result.However, in optimistic situation Project Y will be better as it will gives very high NPV. So, project X is arisk less project as it gives positive NPV in all the situation whereas Y is a risky project as it will resultinto negative NPV in pessimistic situation and highly positive NPV in optimistic situation. So acceptabilityof project will largely depend on the risk taking capacity (Risk seeking/ Risk aversion) of the management.

-114-
Q-11 Explain the steps of Sensi tivi ty Analysis. [Sugg.May ‘19, 4 Marks]
Ans. Steps involved in Sensitivity Analysis
Sensitivity Analysis is conducted by following the steps as below:
1. Finding variables, which have an influence on the NPV (or IRR) of the project
2. Establishing mathematical relationship between the variables.
3. Analysis the effect of the change in each of the variables on the NPV (or IRR) of the project.
Q-12 Write two main reasons for considering risk in Capital Budgeting decisions .
[Sugg.May ‘19, 2 Marks]
Ans. Main reasons for considering risk in capital budgeting decisions:
Main reasons for considering risk in capital budgeting decisions are as follows
1. There is an opportunity cost involved while investing in a project for the level of risk.
Adjustment of risk is necessary to help make the decision as to whether the returns out of theproject are proportionate with the risks borne and whether it is worth investing in the projectover the other investment options available.
2. Risk adjustment is required to know the real value of the Cash Inflows.
Q-13 XYZ Ltd. is presently all equity financed. The directors of the company have been evaluating investmentin a project which will require ` 270 lakhs capital expenditure on new machinery. They expect thecapital investment to provide annual cash flows of ` 42 lakhs indefinitely which is net of all taxadjustments. The discount rate which it applies to such investment decisions is 14% net.
The directors of the company believe that the current capital structure fails to take advantage of taxbenefits of debt, and propose to finance the new project with undated perpetual debt secured on thecompany’s assets. The company intends to issue sufficient debt to cover the cost of capital expenditureand the after tax cost of issue.
The current annual gross rate of interest required by the market on corporate undated debt of similarrisk is 10%. The after tax costs of issue are expected to be ` 10 lakhs.
Company’s tax rate is 30%.
You are required to calculate:
(i) The adjusted present value of the investment,
(ii) The adjusted discount rate and
(iii) Explain the circumstances under which this adjusted discount rate may be used to evaluate futureinvestments. [Sugg. May ‘18, 8 Marks]
Ans.(i) Calculation of Adjusted Present Value of Investment (APV)
Adjusted PV = Base Case PV + PV of financing decisions associated with the project
Base Case NPV for the project:(-) ` 270 lakhs + (` 42 lakhs / 0.14) = (-) ` 270 lakhs + ` 300 lakhs
= ` 30
Issue costs = ` 10 lakhs
Thus, the amount to be raised = ` 270 lakhs + ` 10 lakhs
= ` 280 lakhs
Annual tax relief on interest payment = ` 280 X 0.1 X 0.3
= ` 8.4 lakhs in perpetuity

-115-
The value of tax relief in perpetuity = ` 8.4 lakhs / 0.1= ` 84 lakhs
Therefore, APV = Base case PV – Issue Costs + PV of Tax Relief on debt interest
= ` 30 lakhs – ` 10 lakhs + 84 lakhs = ` 104 lakhs
(ii) Calculation of Adjusted Discount Rate (ADR)
Annual Income / Savings required to allow an NPV to zero
Let the annual income be x.
(-) `280 lakhs X (Annual Income / 0.14) = (-) `104 lakhs
Annual Income / 0.14 = (-) ` 104 + ` 280 lakhs
Therefore, Annual income = ` 176 X 0.14 = ` 24.64 lakhs
Adjusted discount rate = (` 24.64 lakhs / ` 280 lakhs) X 100
= 8.8%
(iii) Useable circumstances
This ADR may be used to evaluate future investments only if the business risk of the new venture isidentical to the one being evaluated here and the project is to be financed by the same method on thesame terms. The effect on the company’s cost of capital of introducing debt into the capital structurecannot be ignored.
Q-14 What is certainty Equivalent? [Sugg.May ‘18,4 Marks]
Ans. Certainty Equivalent (CE)
It is a coefficient used to deal with risk in a capital budgeting context. It expresses risky future cashflows in terms of the certain cash flows which would be considered by the decision maker, as theirequivalent. That is the decision maker would be indifferent between the risky amount and the (Lower)riskless amount considered to be its equivalent.
It is a guaranteed return that the management would accept rather than accepting a higher but uncertainreturn. Calculation of this equivalent involves the following three steps:
Step 1: Remove risks by substituting equivalent certain cash flows in the place of risky cash flows. Thiscan be done by multiplying each risky cash flow by the appropriate CE Coefficient.
Step 2: Obtain discounted value of cash flow by applying riskless rate of interest.
Step 3: Apply normal capital budgeting method to calculate NPV by using the firm’s required rate ofreturn.
nα NCFt 1NPV = Σ - lt1 + Kt = 0 f
Where,
NCFt = the forecasts of net cash flow without risk-adjustment
α t = the risk-adjustment factor or the certainly equivalent coefficient.
Kf = risk-free rate assumed to be constant for all periods.
Certainty Coefficient lies between 0 and 1.

-116-
Q-1 Following information relating to Jee Ltd. is given :
Particulars
Profit after tax `10,00,000
Dividend pay-out ratio 50%
Number of Equity Shares 50,000
Cost of Equity 10%
Rate of Return on Investment 12%
(i) CALCULATE market value per share as per Walter’s Model?
(ii) What is the optimum dividend pay-out ratio according to Walter’s Model and Market value ofequity share at that pay-out ratio? [RTP-May ‘20]
Ans.(i) Walter’s model is given by –
e
e
D + E -D r/KP =
K
Where,
P = Market price per share,
E = Earnings per share = ` 10,00,000 ÷ 50,000 = ` 20
D = Dividend per share = 50% of 20 = ` 10
r = Return earned on investment = 12%
Ke = Cost of equity capital = 10%
0.1210 + 20 -10 × 220.10P = = = 220
0.10 0.10 `
(ii) According to Walter’s model when the return on investment is more than the cost of equity capital, theprice per share increases as the dividend pay-out ratio decreases. Hence, the optimum dividend pay-out ratio in this case is Nil. So, at a pay-out ratio of zero, the market value of the company’s share willbe:
0.120 + 20 - 0 × 240.10 = = 240
0.10 0.10`
CHAPTER-9
DIVIDEND DECISIONS

-117-
Q-2 The following figures are collected from the annual report of XYZ Ltd.:
Net Profit Rs.60 lakhs
Outstanding 10% preference shares Rs.100 lakhs
No. of equity shares 5 lakhs
Return on Investment 20%
Cost of capital i.e. (Ke) 14%
CALCULATE price per share using Gordon’s Model when dividend pay-out is (i) 25%; (ii) 50% and (iii)100%. [MTP-Oct ‘19, 5 Marks]
Ans. Rs. in lakhs
Net Profit 60
Less: Preference dividend 10
Earning for equity shareholders 50
Therefore earning per share 50/5 = Rs.10.00
Price per share according to Gordon’s Model is calculated as follows:
10
e
E 1-bP =
K -br
Here, E1 = 10, Ke = 14%, r = 20%
(i) When dividend pay-out is 25%
10 ×0.25 2.5
P = = = -2500 0.14 - 0.75× 0.2 0.14 - 0.15
As per the Gordon’s Dividend relevance model, the Cost of equity (Ke) should be greater than thegrowth rate i.e. br. In this case Ke is 14% and br = 15%, hence, the equity investors would prefer capitalappreciation than dividend.
(ii) When dividend pay-out is 50%
10× 0.5 2.5
P = = =1250 0.14 - 0.5×0.2 0.14 - 0.15
(iii) When dividend pay-out is 100%
10 ×1 10
P = = = 71.1.430 0.14 - 0 ×0.2 0.14
Q-3 With the help of following figures CALCULATE the market price of a share of a company by using:(i) Walter’s formula
(ii) Dividend growth model (Gordon’s formula)
Earnings per share (EPS) Rs. 10
Dividend per share (DPS) Rs. 6
Cost of capital (k) 20%
Internal rate of return on investment 25%
Retention Ratio 60%
[MTP-March ‘19, 5 Marks]
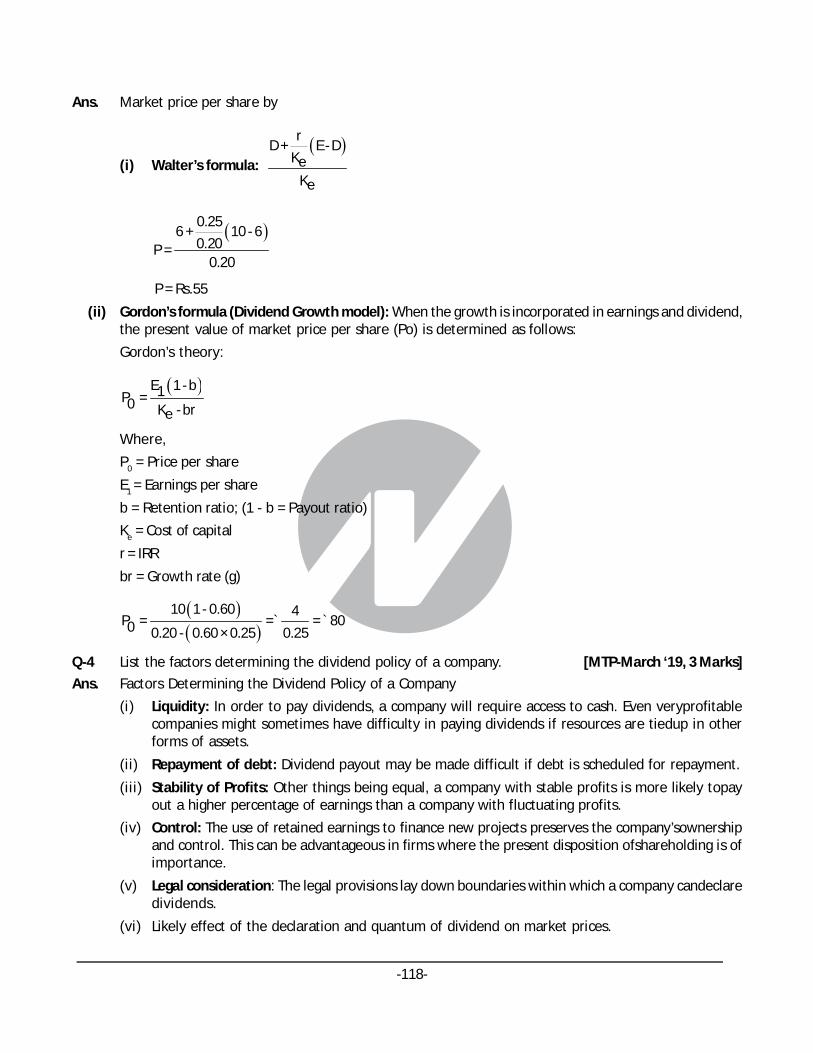
-118-
Ans. Market price per share by
(i) Walter’s formula: r
D + E - DKe
Ke
0.256 + 10 - 6
0.20P =0.20
P = Rs.55
(ii) Gordon’s formula (Dividend Growth model): When the growth is incorporated in earnings and dividend,the present value of market price per share (Po) is determined as follows:
Gordon’s theory:
E 1 - b1P =0 K - bre
Where,
P0 = Price per share
E1 = Earnings per share
b = Retention ratio; (1 - b = Payout ratio)
Ke = Cost of capital
r = IRR
br = Growth rate (g)
10 1 - 0.60 4P = = = 800 0.20 - 0.60 × 0.25 0.25
` `
Q-4 List the factors determining the dividend policy of a company. [MTP-March ‘19, 3 Marks]
Ans. Factors Determining the Dividend Policy of a Company
(i) Liquidity: In order to pay dividends, a company will require access to cash. Even veryprofitablecompanies might sometimes have difficulty in paying dividends if resources are tiedup in otherforms of assets.
(ii) Repayment of debt: Dividend payout may be made difficult if debt is scheduled for repayment.
(iii) Stability of Profits: Other things being equal, a company with stable profits is more likely topayout a higher percentage of earnings than a company with fluctuating profits.
(iv) Control: The use of retained earnings to finance new projects preserves the company’sownershipand control. This can be advantageous in firms where the present disposition ofshareholding is ofimportance.
(v) Legal consideration: The legal provisions lay down boundaries within which a company candeclaredividends.
(vi) Likely effect of the declaration and quantum of dividend on market prices.

-119-
(vii) Tax considerations and
(viii) Others such as dividend policies adopted by units similarly placed in the industry, managementattitude on dilution of existing control over the shares, fear of being branded as incompetent orinefficient, conservative policy Vs non-aggressive one.
(ix) Inflation: Inflation must be taken into account when a firm establishes its dividend policy.
Q-5 A company had paid dividend of `2 per share last year. The estimated growth of the dividends from thecompany is estimated to be 5% p.a. DETERMINE the estimated market price of the equity share if theestimated growth rate of dividends (i) rises to 8%, and (ii) falls to 3%. Also COMPUTE the presentmarket price of the share, given that the required rate of return of the equity investors is 15.5%.
[MTP-March ‘18, 5 Marks]
Ans. In this case the company has paid dividend of ` 2 per share during the last year. The growth rate (g) is5%. Then, the current year dividend (D1) with the expected growth rate of 5% will be ` 2.10
The share price is = Po = D1
K - ge
=2.10
0.155 - 0.05
`
= ` 20
(i) In case the growth rate rises to 8% then the dividend for the current year (D1) would be ` 2.16 andmarket price would be-
=2.16
0.155 - 0.08
`
= ` 28.80
(ii) In case growth rate falls to 3% then the dividend for the current year (D1) would be ` 2.06 and marketprice would be-
=2.06
0.155 - 0.03
`
= ̀ 16.48
So, the market price of the share is expected to vary in response to change in expected growth rate isdividends.
Q-6 In December, 20X7 AB Co.’s share was sold for Rs. 146 per share. A long term earnings growth rate of7.5% is anticipated. AB Co. is expected to pay dividend of Rs. 3.36 per share.
(i) DETERMINE rate of return an investor can expect to earn assuming that dividends areexpected togrow along with earnings at 7.5% per year in perpetuity?
(ii) It is expected that AB Co. will earn about 10% on book Equity and shall retain 60% of earnings.Inthis case,whether, there would be any change in growth rate and cost of Equity?ANALYSE.
[MTP-April ‘18, 5 Marks]
Ans.(i) According to Dividend Discount Model approach the firm’s expected or required return on equity iscomputed as follows:

-120-
D1= + gP0
Where,Ke = Cost of equity share capitalD1 = Expected dividend at the end of year 1P0 = Current market price of the share.g = Expected growth rate of dividend.
3.36Therefore K = + 7.5%e 146
= 0.0230 +0.075 = 0.098
Or, Ke = 9.80%(ii) With rate of return on retained earnings (r) 10% and retention ratio (b) 60%, new growth rate will be as
follows:g= br i.e.= 0.10 X 0.60 = 0.06Accordingly dividend will also get changed and to calculate this, first we shall calculate previous retentionratio (b1) and then EPS assuming that rate of return on retained earnings (r) is same. With previousGrowth Rate of 7.5% and r =10% the retention ratio comes out to be:0.075 =b1 X 0.10b1 = 0.75 and payout ratio = 0.25With 0.25 payout ratio the EPS will be as follows:
3.36= 13.44
0.25
With new 0.40 (1 – 0.60) payout ratio the new dividend will beD1 =13.44 X 0.40 = 5.376Accordingly new Ke will be
5.376K = + 6.0%e 146
or, Ke = 9.68%
Q-7 M Ltd. belongs to a risk class for which the capitalization rate is 10%. It has 25,000 outstanding sharesand the current market price is Rs. 100. It expects a net profit of Rs. 2,50,000 for the year and the Boardis considering dividend of Rs. 5 per share.
M Ltd. requires to raise Rs. 5,00,000 for an approved investment expenditure. ANALYSE, how the MMapproach affects the value of M Ltd. if dividends are paid or not paid.
[MTP-Aug. ‘18, 5 Marks]
Ans. A When dividend is paid
(a) Price per share at the end of year 1
1100 = 5 + P11.10
`
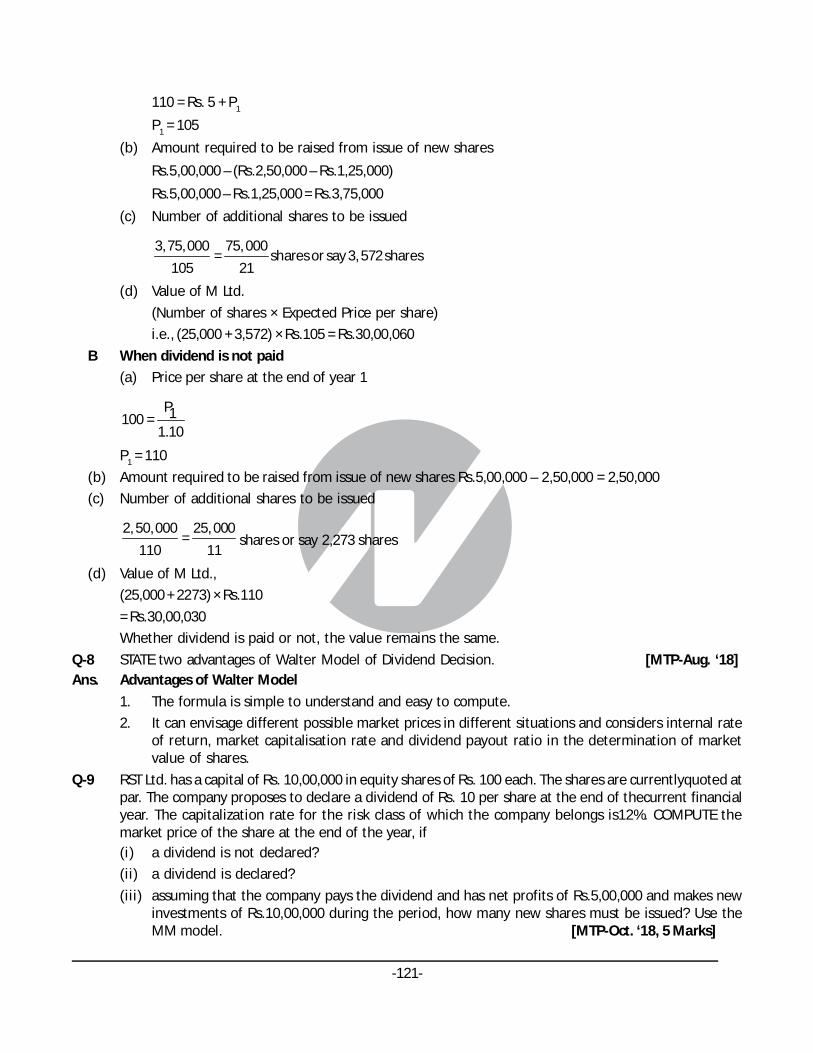
-121-
110 = Rs. 5 + P1
P1 = 105
(b) Amount required to be raised from issue of new shares
Rs.5,00,000 – (Rs.2,50,000 – Rs.1,25,000)
Rs.5,00,000 – Rs.1,25,000 = Rs.3,75,000
(c) Number of additional shares to be issued
3,75,000 75, 000= shares or say 3, 572 shares
105 21
(d) Value of M Ltd.
(Number of shares × Expected Price per share)
i.e., (25,000 + 3,572) × Rs.105 = Rs.30,00,060
B When dividend is not paid
(a) Price per share at the end of year 1
P1100 =1.10
P1 = 110
(b) Amount required to be raised from issue of new shares Rs.5,00,000 – 2,50,000 = 2,50,000
(c) Number of additional shares to be issued
2, 50,000 25, 000=
110 11shares or say 2,273 shares
(d) Value of M Ltd.,
(25,000 + 2273) × Rs.110
= Rs.30,00,030
Whether dividend is paid or not, the value remains the same.
Q-8 STATE two advantages of Walter Model of Dividend Decision. [MTP-Aug. ‘18]Ans. Advantages of Walter Model
1. The formula is simple to understand and easy to compute.
2. It can envisage different possible market prices in different situations and considers internal rateof return, market capitalisation rate and dividend payout ratio in the determination of marketvalue of shares.
Q-9 RST Ltd. has a capital of Rs. 10,00,000 in equity shares of Rs. 100 each. The shares are currentlyquoted atpar. The company proposes to declare a dividend of Rs. 10 per share at the end of thecurrent financialyear. The capitalization rate for the risk class of which the company belongs is12%. COMPUTE themarket price of the share at the end of the year, if(i) a dividend is not declared?
(ii) a dividend is declared?
(iii) assuming that the company pays the dividend and has net profits of Rs.5,00,000 and makes newinvestments of Rs.10,00,000 during the period, how many new shares must be issued? Use theMM model. [MTP-Oct. ‘18, 5 Marks]
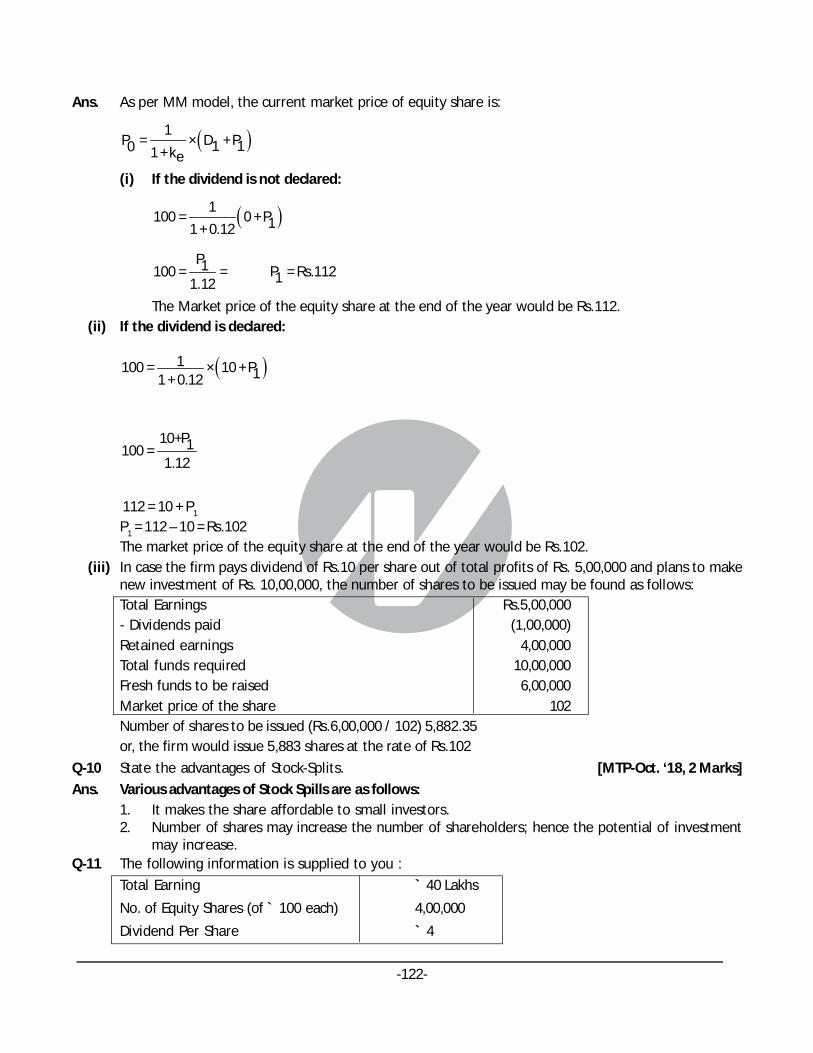
-122-
Ans. As per MM model, the current market price of equity share is:
1P = × D + P1 10 1 + ke
(i) If the dividend is not declared:
1100 = 0 + P11 + 0.12
P1100 = = P = Rs.11211.12
The Market price of the equity share at the end of the year would be Rs.112.(ii) If the dividend is declared:
1100 = × 10 + P 11 + 0.12
10+P1100 = 1.12
112 = 10 + P1
P1 = 112 – 10 = Rs.102The market price of the equity share at the end of the year would be Rs.102.
(iii) In case the firm pays dividend of Rs.10 per share out of total profits of Rs. 5,00,000 and plans to makenew investment of Rs. 10,00,000, the number of shares to be issued may be found as follows:Total Earnings Rs.5,00,000- Dividends paid (1,00,000)Retained earnings 4,00,000Total funds required 10,00,000Fresh funds to be raised 6,00,000Market price of the share 102Number of shares to be issued (Rs.6,00,000 / 102) 5,882.35or, the firm would issue 5,883 shares at the rate of Rs.102
Q-10 State the advantages of Stock-Splits. [MTP-Oct. ‘18, 2 Marks]
Ans. Various advantages of Stock Spills are as follows:1. It makes the share affordable to small investors.2. Number of shares may increase the number of shareholders; hence the potential of investment
may increase.Q-11 The following information is supplied to you :
Total Earning ` 40 Lakhs
No. of Equity Shares (of ` 100 each) 4,00,000
Dividend Per Share ` 4
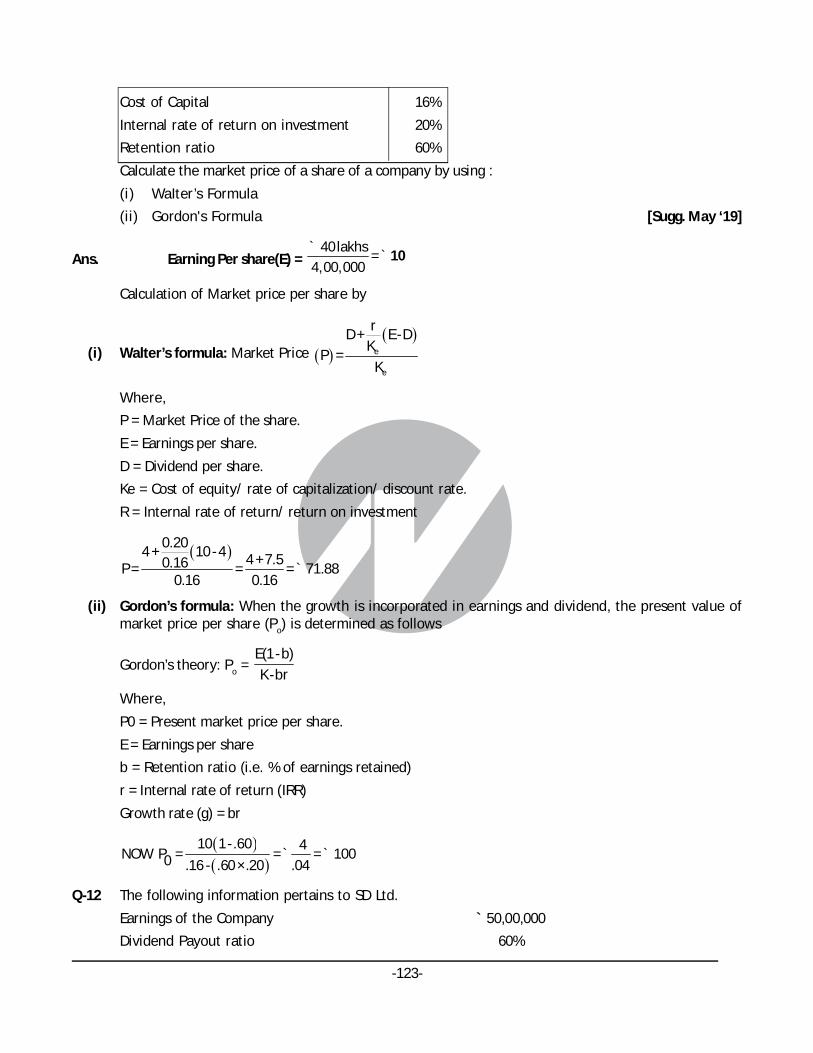
-123-
Cost of Capital 16%
Internal rate of return on investment 20%
Retention ratio 60%
Calculate the market price of a share of a company by using :
(i) WaIter’s Formula
(ii) Gordon's Formula [Sugg. May ‘19]
Ans. Earning Per share(E) = 40 lakhs
= 4,00,000
10`
`
Calculation of Market price per share by
(i) Walter’s formula: Market Price
e
e
rD + E -D
KP =
K
Where,
P = Market Price of the share.
E = Earnings per share.
D = Dividend per share.
Ke = Cost of equity/ rate of capitalization/ discount rate.
R = Internal rate of return/ return on investment
0.204 + 10 - 4 4 + 7.50.16P = = = 71.88
0.16 0.16`
(ii) Gordon’s formula: When the growth is incorporated in earnings and dividend, the present value ofmarket price per share (Po) is determined as follows
Gordon’s theory: Po = E(1 - b)K -br
Where,
P0 = Present market price per share.
E = Earnings per share
b = Retention ratio (i.e. % of earnings retained)
r = Internal rate of return (IRR)
Growth rate (g) = br
10 1-.60 4NOW P = = = 1000 .16 - .60 ×.20 .04
` `
Q-12 The following information pertains to SD Ltd.
Earnings of the Company ` 50,00,000
Dividend Payout ratio 60%

-124-
No. of shares outstanding 10,00,000
Equity capitalization rate 12%
Rate of return on investment 15%
(i) COMPUTE the market value per share as per Walter’s model?
(ii) COMPUTE the optimum dividend payout ratio according to Walter’s model and themarket valueof Company’s share at that payout ratio? [RTP-Nov. ‘19]
Ans. (i) Walter’s model is given by
e
e
rD + E -D
KP =
K
Where
P = Market price per share.
E = Earnings per share = ` 5
D = Dividend per share = ` 3
R = Return earned on investment = 15%
Ke = Cost of equity capital = 12%
0.153+ 5- 3
0.12P = = 45.830.12
`
(ii) According to Walter’s model when the return on investment is more than the cost of equity capital, theprice per share increases as the dividend pay-out ratio decreases.Hence, the optimum dividend pay-out ratio in this case is nil.So, at a pay-out ratio of zero, the market value of the company’s share will be:
0.150 + 5- 0
0.12P = = 52.080.12
`
Q-13 The following figures are collected from the annual report of XYZ Ltd.:Net Profit `30 lakhsOutstanding 12% preference shares ` 100 lakhsNo. of equity shares 3 lakhsReturn on Investment 20%Cost of capital i.e. (Ke) 16%CALCULATE price per share using Gordon’s Model when dividend pay-out is (i) 25%;
(ii) 50% and (iii) 100%. [RTP-May ‘19]Ans. ` in lakhs
Net Profit 30Less: Preference dividend 12Earning for equity shareholders 18Therefore earning per share 18/3 = ̀ 6.00

-125-
Price per share according to Gordon’s Model is calculated as follows:
E 1 - b1P =0 K - bre
Here, E1 = 6, Ke = 16%(i) When dividend pay-out is 25%
1.56 × 0.25
P = = = 1500 0.16 - 0.75× 0.2 0.16 - 0.15
(ii) When dividend pay-out is 50%
6 × 0.5 3
P = = = 500 0.16 - 0.5 × 0.2 0.16 - 0.10
(iii) When dividend pay-out is 100%
6 ×1 6
P = = = 37.500 0.16 - 0 × 0.2 0.16
Q-14 The earnings per share of a company is ` 10 and the rate of capitalisation applicable to it is 10 per cent.The company has three options of paying dividend i.e. (i) 50%, (ii) 75% and (iii) 100%.CALCULATE the market price of the share as per Walter’s model if it can earn a return of
(a) 15, (b) 10 and
(c) 5 per cent on its retained earnings. [RTP-Nov-‘18]
Ans. Market Price (P) per share as per Walter’s Model is:
rD + E -D
KeP =Ke
Where,
P = Price of Share
r = Return on investment or rate of earning
Ke = Rate of Capitalisation or Cost of Equity
Calculation of Market Price (P) under the following dividend payout ratio and earning rates:
(i) (ii) (iii)
Rate of Earning (r) DP ratio 50% DP ratio 75% DP ratio 100%
(a) 15%
0.155+ 10 - 5
0.10
0.157.5 + 10 - 7.5
0.10
0.1510 + 10 - 10
0.10
12.5= = 125
0.10`
11.25= = 112.5
0.10`
10= = 100
0.10`
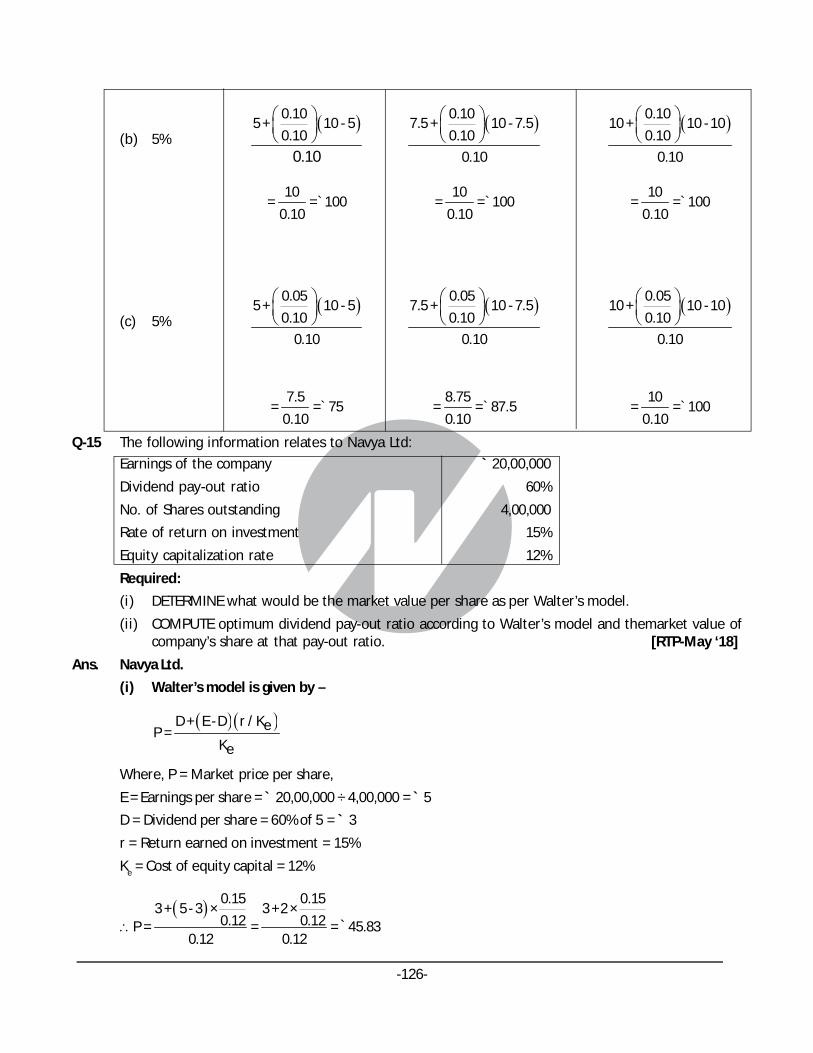
-126-
(b) 5%
0.105 + 10 - 5
0.10
0.10
0.107.5 + 10 - 7.5
0.10
0.10
0.1010 + 10 - 10
0.10
0.10
10= = 100
0.10`
10= = 100
0.10`
10= = 100
0.10`
(c) 5%
0.055 + 10 - 5
0.10
0.10
0.057.5 + 10 - 7.5
0.10
0.10
0.0510 + 10 - 10
0.10
0.10
7.5= = 75
0.10`
8.75= = 87.5
0.10`
10= = 100
0.10`
Q-15 The following information relates to Navya Ltd:
Earnings of the company ` 20,00,000
Dividend pay-out ratio 60%
No. of Shares outstanding 4,00,000
Rate of return on investment 15%
Equity capitalization rate 12%
Required:
(i) DETERMINE what would be the market value per share as per Walter’s model.
(ii) COMPUTE optimum dividend pay-out ratio according to Walter’s model and themarket value ofcompany’s share at that pay-out ratio. [RTP-May ‘18]
Ans. Navya Ltd.
(i) Walter’s model is given by –
D + E -D r / KeP =Ke
Where, P = Market price per share,
E = Earnings per share = ` 20,00,000 ÷ 4,00,000 = ` 5
D = Dividend per share = 60% of 5 = ` 3
r = Return earned on investment = 15%
Ke = Cost of equity capital = 12%
0.15 0.153 + 5- 3 × 3 + 2 ×
0.12 0.12P = = = 45.830.12 0.12
`

-127-
(ii) According to Walter’s model when the return on investment is more than the cost of equity capital, theprice per share increases as the dividend pay-out ratio decreases. Hence, the optimum dividend pay-out ratio in this case is Nil. So, at a payout ratio of zero, the market value of the company’s share willbe:-
0.150 + 5 - 0 ×
0.12 = 52.080.12
`
Q-16 Following information relating to Jee Ltd. are given :Particulars
Profit after tax ` 10,00,000
Dividend payout ratio 50%
Number of Equity Shares 50,000
Cost of Equity 10%
Rate of Return on Investment 12%
(i) What would be the market value per share as per Walter’s Model?
(ii) What is the optimum dividend payout ratio according to Walter’s Model and Market value ofequity share at that payout ratio? [Sugg. Nov ‘18, 5 Marks]
Ans. (i) Walter’s model is given by –
D + E -D r / KeP =Ke
Where,
P = Market price per share,
E = Earnings per share = ` 10,00,000 ÷ 50,000 = ` 20
D = Dividend per share = 50% of 20 = ` 10
r = Return earned on investment = 12%
Ke = Cost of equity capital = 10%
0.1210 + 20 -10 × 220.10P = = = 220
0.10 0.10`
(ii) According to Walter’s model when the return on investment is more than the cost of equity capital, theprice per share increases as the dividend pay-out ratio decreases. Hence, the optimum dividend pay-out ratio in this case is Nil. So, at a payout ratio of zero, the market value of the company’s share willbe:-
0.1220 - 0 × 240.10p = = = 240
0.10 0.10`
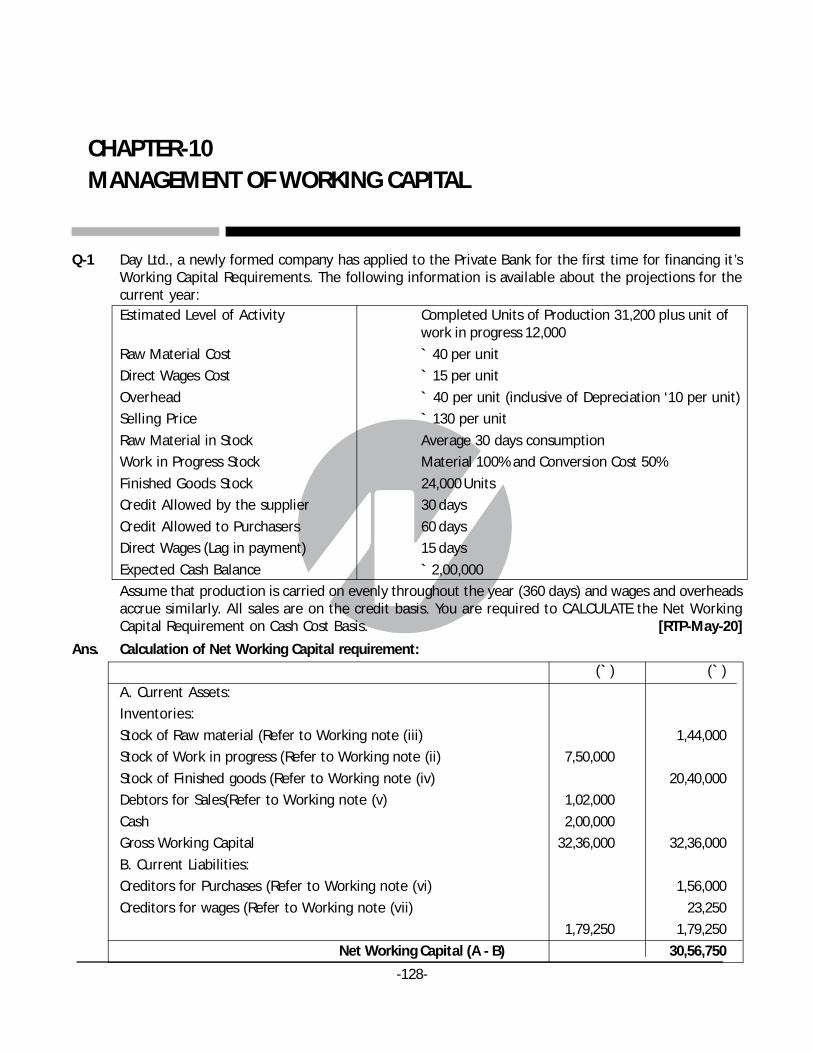
-128-
CHAPTER-10MANAGEMENT OF WORKING CAPITAL
Q-1 Day Ltd., a newly formed company has applied to the Private Bank for the first time for financing it’sWorking Capital Requirements. The following information is available about the projections for thecurrent year:Estimated Level of Activity Completed Units of Production 31,200 plus unit of
work in progress 12,000
Raw Material Cost ` 40 per unit
Direct Wages Cost ` 15 per unit
Overhead ` 40 per unit (inclusive of Depreciation ‘10 per unit)
Selling Price ` 130 per unit
Raw Material in Stock Average 30 days consumption
Work in Progress Stock Material 100% and Conversion Cost 50%
Finished Goods Stock 24,000 Units
Credit Allowed by the supplier 30 days
Credit Allowed to Purchasers 60 days
Direct Wages (Lag in payment) 15 days
Expected Cash Balance ` 2,00,000
Assume that production is carried on evenly throughout the year (360 days) and wages and overheadsaccrue similarly. All sales are on the credit basis. You are required to CALCULATE the Net WorkingCapital Requirement on Cash Cost Basis. [RTP-May-20]
Ans. Calculation of Net Working Capital requirement:
(` ) (` )
A. Current Assets:
Inventories:
Stock of Raw material (Refer to Working note (iii) 1,44,000
Stock of Work in progress (Refer to Working note (ii) 7,50,000
Stock of Finished goods (Refer to Working note (iv) 20,40,000
Debtors for Sales(Refer to Working note (v) 1,02,000
Cash 2,00,000
Gross Working Capital 32,36,000 32,36,000
B. Current Liabilities:
Creditors for Purchases (Refer to Working note (vi) 1,56,000
Creditors for wages (Refer to Working note (vii) 23,250
1,79,250 1,79,250
Net Working Capital (A - B) 30,56,750

-129-
Working Notes:
(i) Annual cost of production
(` )
Raw material requirements {(31,200 ×` 40) + (12,000 x ` 40)} 17,28,000
Direct wages {(31,200 × ` 15) +(12,000 X ` 15 x 0.5)} 5,58,000
Overheads (exclusive of depreciation) {(31,200 × ` 30) + (12,000 x ` 30 x 0.5)} 11,16,000
Gross Factory Cost 34,02,000
Less: Closing W.I.P [12,000 (` 40 + ` 7.5 + `15)] (7,50,000)
Cost of Goods Produced 26,52,000
Less: Closing Stock of Finished Goods (` 26,52,000 × 24,000/31,200) (20,40,000)
Total Cash Cost of Sales* 6,12,000
[*Note: Alternatively, Total Cash Cost of Sales = (31,200 units – 24,000 units) x (` 40 + ` 15 + ` 30) = `6,12,000]
(ii) Work in progress stock
(` )
Raw material requirements (12,000 units × ` 40) 4,80,000
Direct wages (50% × 12,000 units × ` 15) 90,000
Overheads (50% × 12,000 units × ` 30) 1,80,000
7,50,000
(iii) Raw material stock
It is given that raw material in stock is average 30 days consumption. Since, the company is newlyformed; the raw material requirement for production and work in progress will be issued and consumedduring the year. Hence, the raw material consumption for the year (360 days) is as follows:
(` )
For Finished goods (31,200 × ` 40) 12,48,000
For Work in progress (12,000 × ` 40) 4,80,000
17,28,000
Raw material stock = 17,28,000
30days = 1,44,000360days
`
`
(iv) Finished goods stock:
24,000 units @ ` (40+15+30) per unit = ` 20,40,000
(v) Debtors for sale: 60 days
6,12,000 × = 1,02,000360 days
` `
(vi) Creditors for raw material Purchases [Working Note (iii)]:
Annual Material Consumed (`12,48,000 + ` 4,80,000) ` 17,28,000
Add: Closing stock of raw material [(`17,28,000 x 30 days) / 360 days] ` 1,44,000
` 18,72,000

-130-
18,72,000Credit allowed by suppliers = × 30days = 1,56,000
360 days`
`
(vii) Creditors for wages:
Outstanding wage payment = [(31,200 units x ` 15) + (12,000 units x ` 15 x .50)] x 15 days / 360 days
5,58,000×15days = 23,250
360days`
`
Q-2 You are given the following information:
(i) Estimated monthly Sales are as follows:
Rs. Rs.
January 1,00,000 June 80,000
February 1,20,000 July 1,00,000
March 1,40,000 August 80,000
April 80,000 September 60,000
May 60,000 October 1,00,000
(ii) Wages and Salaries are estimated to be payable as follows:
Rs. Rs.
April 9,000 July 10,000
May 8,000 August 9,000
June 10,000 September 9,000
(iii) Of the sales, 80% is on credit and 20% for cash. 75% of the credit sales are collected within one monthand the balance in two months. There are no bad debt losses.
(iv) Purchases amount to 80% of sales and are made and paid for in the month preceding the sales.
(v) The firm has taken a loan of Rs.1,20,000. Interest @ 10% p.a. has to be paid quarterly in January,Apriland so on.
(vi) `The firm is to make payment of tax of Rs. 5,000 in July, 2019.
(vii) The firm had a cash balance of Rs. 20,000 on 1St April, 2019 which is the minimum desired level of cashbalance. Any cash surplus/deficit above/below this level is made up by temporary investments/liquidation of temporary investments or temporary borrowings at the end of each month (interest onthese to be ignored).
Required
PREPARE monthly cash budgets for six months beginning from April, 2019 on the basis of the aboveinformation.
[MTP-Oct. ‘19, 10 Marks]
Ans. Computation – Collections from Debtors
Particulars Feb Mar Apr May Jun Jul Aug Sep
(Rs.) (Rs.) (Rs.) (Rs.) (Rs.) (Rs.) (Rs.) (Rs.)
Total Sales 1,20,000 1,40,000 80,000 60,000 80,000 1,00,000 80,000 60,000
Credit Sales
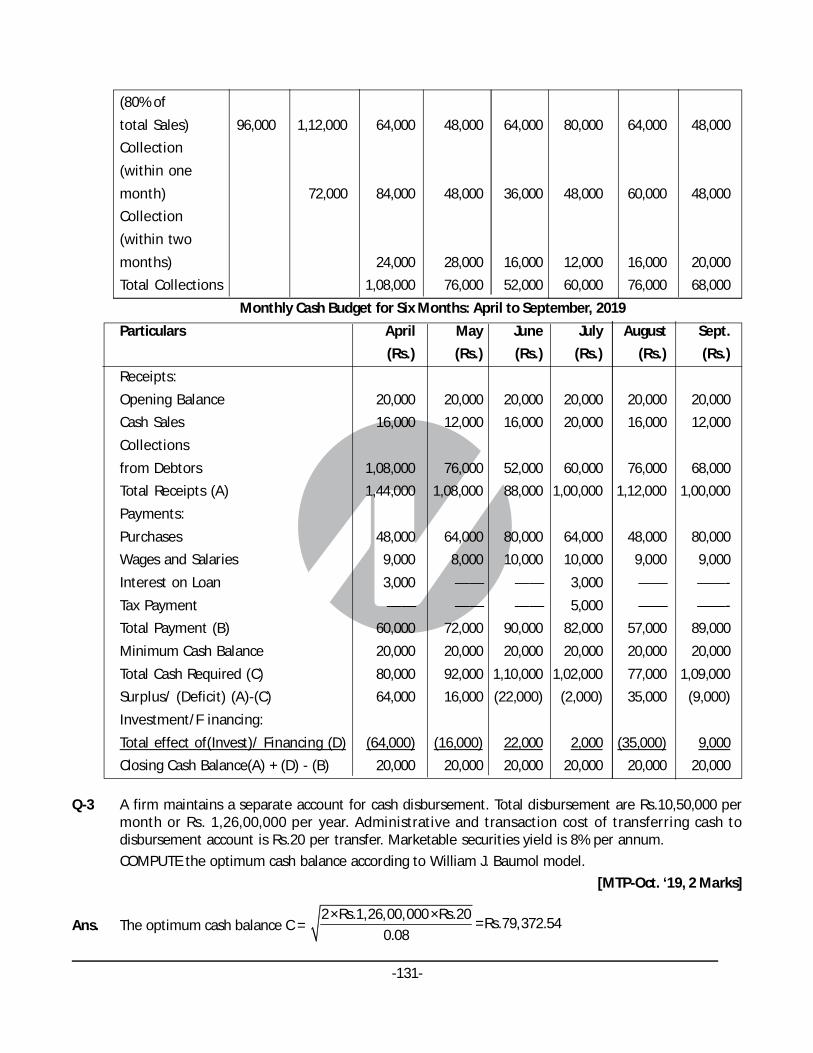
-131-
(80% of
total Sales) 96,000 1,12,000 64,000 48,000 64,000 80,000 64,000 48,000
Collection
(within one
month) 72,000 84,000 48,000 36,000 48,000 60,000 48,000
Collection
(within two
months) 24,000 28,000 16,000 12,000 16,000 20,000
Total Collections 1,08,000 76,000 52,000 60,000 76,000 68,000
Monthly Cash Budget for Six Months: April to September, 2019
Particulars April May June July August Sept.
(Rs.) (Rs.) (Rs.) (Rs.) (Rs.) (Rs.)
Receipts:
Opening Balance 20,000 20,000 20,000 20,000 20,000 20,000
Cash Sales 16,000 12,000 16,000 20,000 16,000 12,000
Collections
from Debtors 1,08,000 76,000 52,000 60,000 76,000 68,000
Total Receipts (A) 1,44,000 1,08,000 88,000 1,00,000 1,12,000 1,00,000
Payments:
Purchases 48,000 64,000 80,000 64,000 48,000 80,000
Wages and Salaries 9,000 8,000 10,000 10,000 9,000 9,000
Interest on Loan 3,000 —— —— 3,000 —— ——-
Tax Payment —— —— —— 5,000 —— ——-
Total Payment (B) 60,000 72,000 90,000 82,000 57,000 89,000
Minimum Cash Balance 20,000 20,000 20,000 20,000 20,000 20,000
Total Cash Required (C) 80,000 92,000 1,10,000 1,02,000 77,000 1,09,000
Surplus/ (Deficit) (A)-(C) 64,000 16,000 (22,000) (2,000) 35,000 (9,000)
Investment/F inancing:
Total effect of(Invest)/ Financing (D) (64,000) (16,000) 22,000 2,000 (35,000) 9,000
Closing Cash Balance(A) + (D) - (B) 20,000 20,000 20,000 20,000 20,000 20,000
Q-3 A firm maintains a separate account for cash disbursement. Total disbursement are Rs.10,50,000 permonth or Rs. 1,26,00,000 per year. Administrative and transaction cost of transferring cash todisbursement account is Rs.20 per transfer. Marketable securities yield is 8% per annum.
COMPUTE the optimum cash balance according to William J. Baumol model.
[MTP-Oct. ‘19, 2 Marks]
Ans. The optimum cash balance C = 2×Rs.1,26,00,000 ×Rs.20
=Rs.79,372.540.08

-132-
Q-4 A bank is analysing the receivables of J Ltd. in order to identify acceptable collateral for a shorttermloan. The company’s credit policy is 2/10 net 30. The bank lends 80 percent on accounts where customersare not currently overdue and where the average payment period does not exceed 10 days past the netperiod. A schedule of J Ltd.’s receivables has been prepared.
ANALYSE, how much will the bank lend on pledge of receivables, if the bank uses a 10 per centmallowance for cash discount and returns?
Account Amount Rs. Days Outstanding Average Payment
in days Period historically
74 25,000 15 20
91 9,000 45 60
107 11,500 22 24
108 2,300 9 10
114 18,000 50 45
116 29,000 16 10
123 14,000 27 48
1,08,800 [MTP-March ‘19, 7 Marks]
Ans. Analysis of the receivables of J Ltd. by the bank in order to identify acceptable collateral for a shorttermloan:
(i) The J Ltd.’s credit poli0cy is 2/10 net 30.
The bank lends 80 per cent on accounts where customers are not currently overdue and where theaverage payment period does not exceed 10 days past the net period i.e. thirty days. From theschedule of receivables of J Ltd. Account No. 91 and Account No. 114 are currently overdue and forAccount No. 123 the average payment period exceeds 40 days.
Hence Account Nos. 91, 114 and 123 are eliminated. Therefore, the selected Accounts are AccountNos. 74, 107, 108 and 116.
(ii) Statement showing the calculation of the amount which the bank will lend on a pledgeofreceivables if the bank uses a 10 per cent allowances for cash discount and returns
Account No. Amount(Rs.) 90 per cent of amount(Rs.) 80% of amount(Rs.)
(a) (b) = 90% of (a) (c) = 80% of (b)
74 25,000 22,500 18,000
107 11,500 10,350 8280
108 2,300 2,070 1,656
116 29,000 26,100 20,880
Total loan amount 48,816
Q-5 A newly formed company has applied to the commercial bank for the first time for financing its workingcapital requirements. The following information is available about the projections for the currentyear:
Estimated level of activity: 1,04,000 completed units of production plus 4,000 units of work-in progress.Based on the above activity, estimated cost per unit is:
Raw material Rs. 80 per unit
Direct wages Rs. 30 per unit

-133-
Overheads (exclusive of depreciation) Rs. 60 per unit
Total cost Rs. 170 per unit
Selling price Rs. 200 per unit
Raw materials in stock: Average 4 weeks consumption, work-in-progress (assume 50% completionstage in respect of conversion cost) (materials issued at the start of the processing).
Finished goods in stock 8,000 units
Credit allowed by suppliers Average 4 weeks
Credit allowed to debtors/receivables Average 8 weeks
Lag in payment of wages1
Average 1 weeks2
Cash at banks (for smooth operation) is expected to be Rs.25,000
Assume that production is carried on evenly throughout the year (52 weeks) and wages and overheadsaccrue similarly. All sales are on credit basis only.
CALCULATE
(i) Net Working Capital required;
(ii) Maximum Permissible Bank finance under first and second methods of financing as per Tandon
Committee Norms.
[MTP-Aug. ‘18, MTP-March ‘18,10 Marks]
Ans. (i) Estimate of the Requirement of Working Capital
(Rs.) (Rs.)
A. Current Assets:
Raw material stock 6,64,615
(Refer to Working note 3)
Work in progress stock 5,00,000
(Refer to Working note 2)
Finished goods stock 13,60,000
(Refer to Working note 4)
Debtors/ Receivables 29,53,846
(Refer to Working note 5)Cash and Bank balance 25,000 55,03,461
B. Current Liabilities:Creditors for raw materials 7,15,740(Refer to Working note 6)Creditors for wages 91,731 (8,07,471)(Refer to Working note 7) ________Net Working Capital (A-B) 46,95,990
(ii) The maximum permissible bank finance as per Tandon Committee NormsFirst Method:75% of the net working capital financed by bank i.e. 75% of Rs.46,95,990

-134-
(Refer to (i) above)= Rs. 35,21,993Second Method:(75% of Current Assets) - Current liabilities= 75% of Rs. 55,03,461 - Rs. 8,07,471(Refer to (i) above)= Rs. 41,27,596 – Rs. 8,07,471= Rs. 33,20,125
Working Notes:1. Annual cost of production
Rs.Raw material requirements (1,04,000 units x Rs. 80) 83,20,000Direct wages (1,04,000 units x Rs. 30) 31,20,000Overheads (exclusive of depreciation) (1,04,000 x Rs. 60) 62,40,000
1,76,80,0002. Work in progress stock
Rs.Raw material requirements (4,000 units x Rs. 80) 3,20,000Direct wages (50% x 4,000 units x Rs. 30) 60,000Overheads (50% x 4,000 units x Rs.60) 1,20,000
5,00,0003. Raw material stock
It is given that raw material in stock is average 4 weeks consumption. Since, the company is newlyformed, the raw material requirement for production and work in progress will be issued and consumedduring the year.Hence, the raw material consumption for the year (52 weeks) is as follows:
Rs.For Finished goods 83,20,000For Work in progress 3,20,000
86,40,000
Raw material stock86, 40,000
× 4 weeks i.e. 6,64,61552weeks
` `
4. Finished goods stock
8,000 units @ Rs. 170 per unit = Rs. 13,60,000
5. Debtors for sale
Credit allowed to debtors Average 8 weeks
Credit sales for year (52 weeks) i.e. (1,04,000 units-8,000 units) 96,000 units
Selling price per unit Rs.200
Credit sales for the year (96,000 units x Rs. 200) Rs. 1,92,00,000
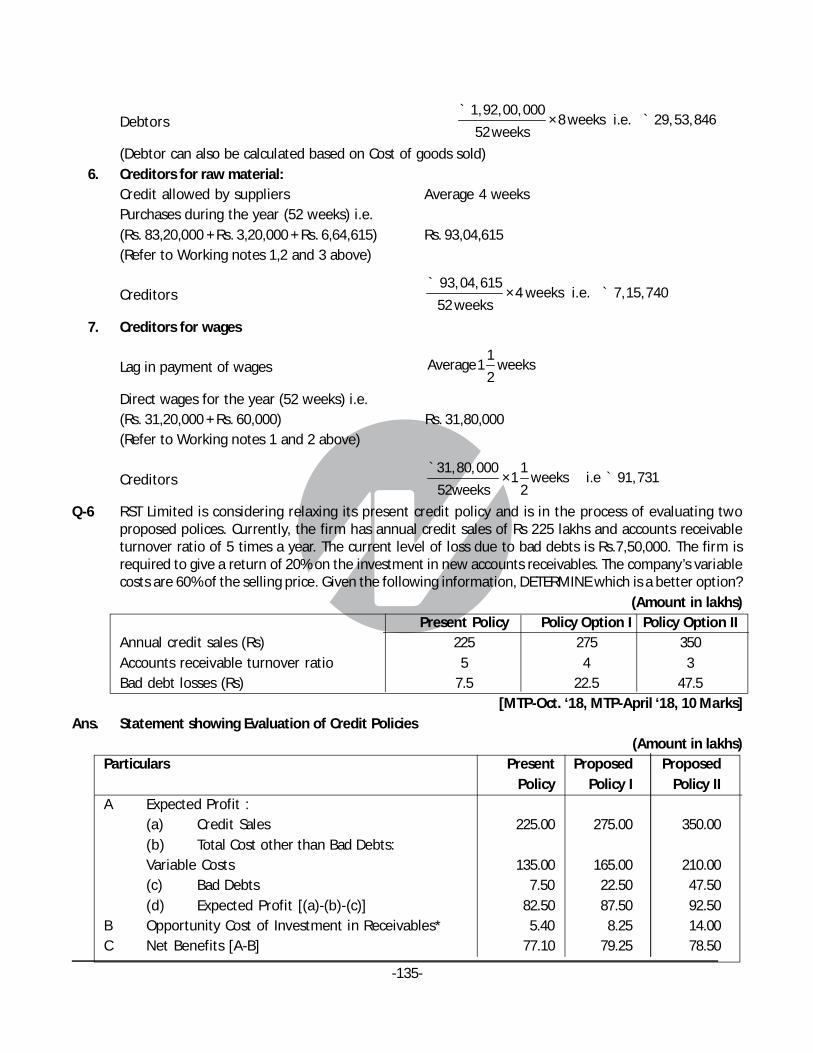
-135-
Debtors1,92,00, 000
× 8 weeks i.e. 29, 53,84652 weeks
` `
(Debtor can also be calculated based on Cost of goods sold)6. Creditors for raw material:
Credit allowed by suppliers Average 4 weeksPurchases during the year (52 weeks) i.e.(Rs. 83,20,000 + Rs. 3,20,000 + Rs. 6,64,615) Rs. 93,04,615(Refer to Working notes 1,2 and 3 above)
Creditors93, 04, 615
× 4 weeks i.e. 7,15,74052 weeks
` `
7. Creditors for wages
Lag in payment of wages1
Average 1 weeks2
Direct wages for the year (52 weeks) i.e.(Rs. 31,20,000 + Rs. 60,000) Rs. 31,80,000(Refer to Working notes 1 and 2 above)
Creditors31,80, 000 1
× 1 weeks i.e 91,73152weeks 2
``
Q-6 RST Limited is considering relaxing its present credit policy and is in the process of evaluating twoproposed polices. Currently, the firm has annual credit sales of Rs 225 lakhs and accounts receivableturnover ratio of 5 times a year. The current level of loss due to bad debts is Rs.7,50,000. The firm isrequired to give a return of 20% on the investment in new accounts receivables. The company’s variablecosts are 60% of the selling price. Given the following information, DETERMINE which is a better option?
(Amount in lakhs)Present Policy Policy Option I Policy Option II
Annual credit sales (Rs) 225 275 350Accounts receivable turnover ratio 5 4 3Bad debt losses (Rs) 7.5 22.5 47.5
[MTP-Oct. ‘18, MTP-April ‘18, 10 Marks]Ans. Statement showing Evaluation of Credit Policies
(Amount in lakhs)Particulars Present Proposed Proposed
Policy Policy I Policy IIA Expected Profit :
(a) Credit Sales 225.00 275.00 350.00(b) Total Cost other than Bad Debts:Variable Costs 135.00 165.00 210.00(c) Bad Debts 7.50 22.50 47.50(d) Expected Profit [(a)-(b)-(c)] 82.50 87.50 92.50
B Opportunity Cost of Investment in Receivables* 5.40 8.25 14.00C Net Benefits [A-B] 77.10 79.25 78.50
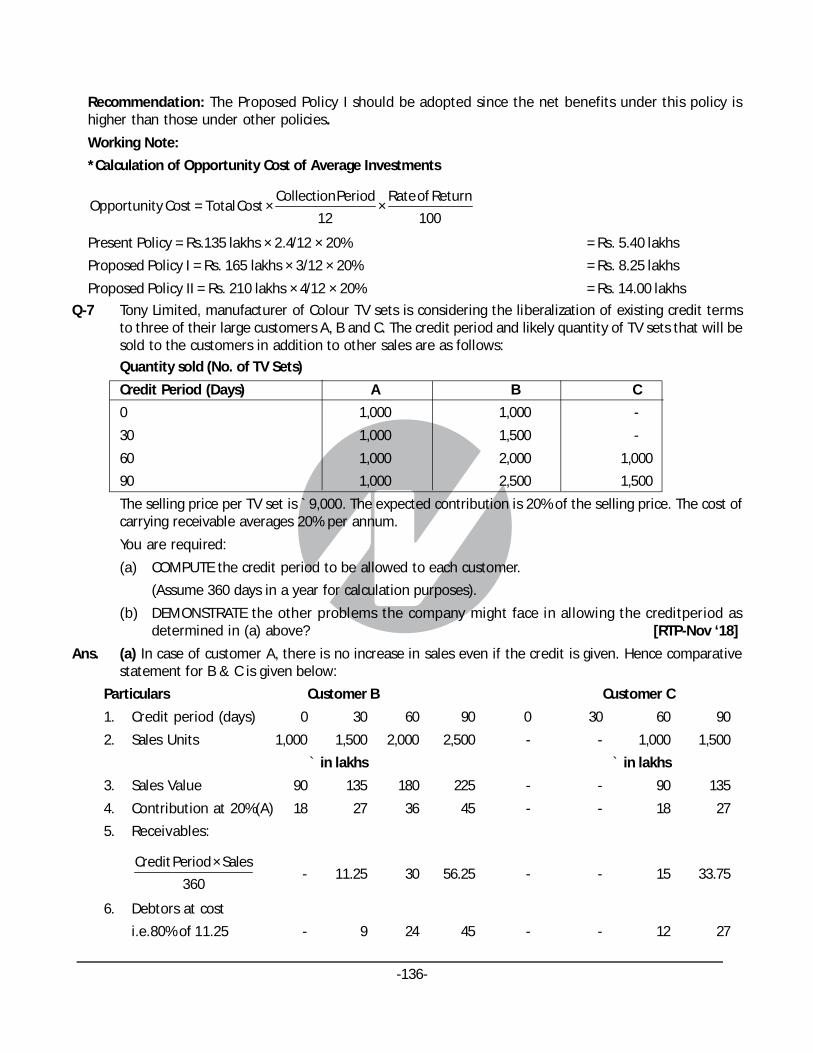
-136-
Recommendation: The Proposed Policy I should be adopted since the net benefits under this policy ishigher than those under other policies.
Working Note:
*Calculation of Opportunity Cost of Average Investments
Collection Period Rate of ReturnOpportunity Cost = Total Cost × ×
12 100
Present Policy = Rs.135 lakhs × 2.4/12 × 20% = Rs. 5.40 lakhs
Proposed Policy I = Rs. 165 lakhs × 3/12 × 20% = Rs. 8.25 lakhs
Proposed Policy II = Rs. 210 lakhs × 4/12 × 20% = Rs. 14.00 lakhs
Q-7 Tony Limited, manufacturer of Colour TV sets is considering the liberalization of existing credit termsto three of their large customers A, B and C. The credit period and likely quantity of TV sets that will besold to the customers in addition to other sales are as follows:
Quantity sold (No. of TV Sets)
Credit Period (Days) A B C
0 1,000 1,000 -
30 1,000 1,500 -
60 1,000 2,000 1,000
90 1,000 2,500 1,500
The selling price per TV set is ` 9,000. The expected contribution is 20% of the selling price. The cost ofcarrying receivable averages 20% per annum.
You are required:
(a) COMPUTE the credit period to be allowed to each customer.
(Assume 360 days in a year for calculation purposes).
(b) DEMONSTRATE the other problems the company might face in allowing the creditperiod asdetermined in (a) above? [RTP-Nov ‘18]
Ans. (a) In case of customer A, there is no increase in sales even if the credit is given. Hence comparativestatement for B & C is given below:
Particulars Customer B Customer C
1. Credit period (days) 0 30 60 90 0 30 60 90
2. Sales Units 1,000 1,500 2,000 2,500 - - 1,000 1,500
` in lakhs ` in lakhs
3. Sales Value 90 135 180 225 - - 90 135
4. Contribution at 20%(A) 18 27 36 45 - - 18 27
5. Receivables:
Credit Period × Sales
360- 11.25 30 56.25 - - 15 33.75
6. Debtors at cost
i.e.80% of 11.25 - 9 24 45 - - 12 27

-137-
7. Cost of carryingdebtors
at 20% (B) - 1.8 4.8 9 - - 2.4 5.4
8. Excess ofcontributions
overcost of carrying
debtors (A – B) 18 25.2 31.2 36 - - 15.6 21.6
The excess of contribution over cost of carrying Debtors is highest in case of credit period of 90 days inrespect of both the customers B and C. Hence, credit period of 90 days should be allowed to B and C.
(B) Problem:
(i) Customer A is taking 1000 TV sets whether credit is given or not. Customer Cis taking 1000 TV setsat credit for 60 days. Hence A also may demand creditfor 60 days compulsorily.
(ii) B will take 2500 TV sets at credit for 90 days whereas C would lift 1500 sets only. In such case B willdemand further relaxation in credit period i.e. B may ask for 120 days credit.
Q-8 Bita Limited manufactures used in the steel industry. The following information regarding the companyis given for your consideration:
(i) Expected level of production 9000 units per annum.
(ii) Raw materials are expected to remain in store for an average of two months before issue toproduction.
(iii) Work-in-progress (50 percent complete as to conversion cost) will approximate to 1/2 month’sproduction.
(iv) Finished goods remain in warehouse on an average for one month.
(v) Credit allowed by suppliers is one month.·
(vi) Two month’s credit is normally allowed to debtors.
(vii) A minimum cash balance of ` 67,500 is expected to be maintained.
(viii) Cash sales are 75 percent less than the credit sales.
(ix) Safety margin of 20 percent to cover unforeseen contingencies.
(x) The production pattern is assumed to be even during the year.
(xi) The cost structure for Bita Limited’s product is as follows:
`
Raw Materials 80 per unit
Direct Labour 20 per unit
Overheads (including depreciation ` 20) 80 per unit
Total Cost 180 per unit
Profit 20 per unit
Selling Price 200 per unit
You are required to estimate the working capi tal requirement of Bita limited.
[Sugg.May ‘19, 10 Marks]
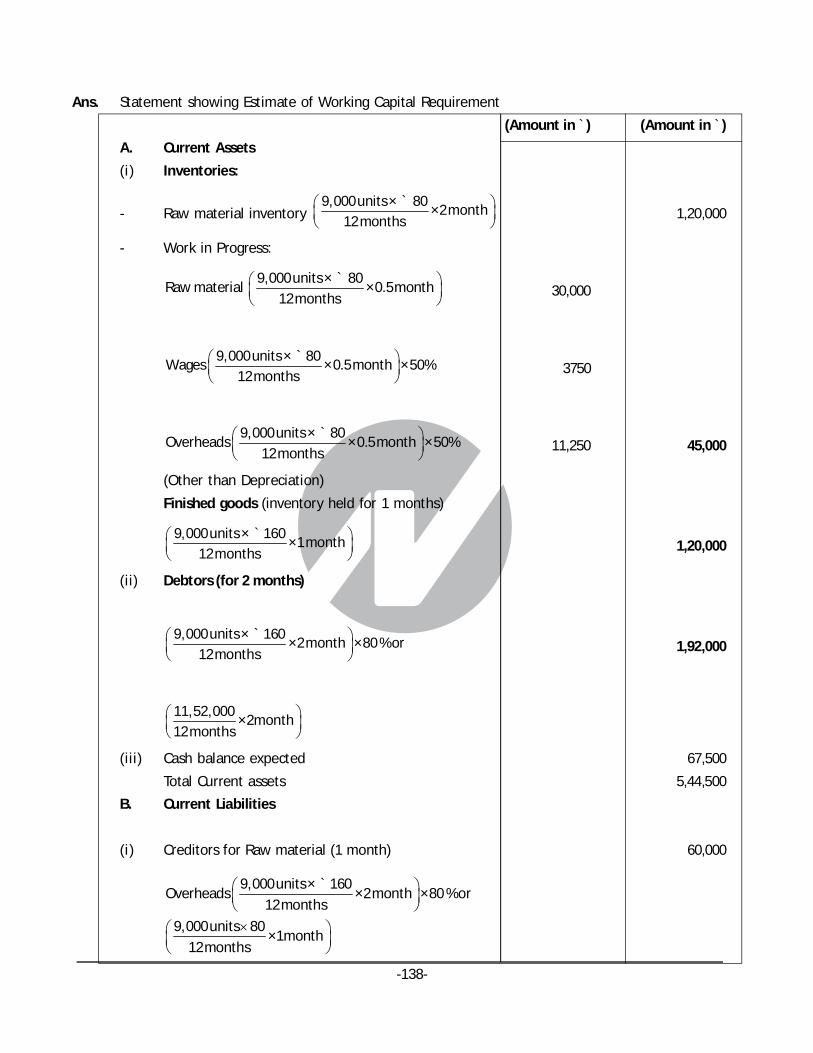
-138-
Ans. Statement showing Estimate of Working Capital Requirement
(Amount in `) (Amount in `)
A. Current Assets
(i) Inventories:
- Raw material inventory 9,000 units × 80
×2 month12 months
` 1,20,000
- Work in Progress:
9,000 units× 80Raw material × 0.5 month
12 months
` 30,000
9,000 units × 80Wages × 0.5 month × 50%
12 months
`3750
9,000 units × 80Overheads × 0.5 month × 50%
12 months
`11,250 45,000
(Other than Depreciation)
Finished goods (inventory held for 1 months)
9,000 units × 160×1 month
12 months
`1,20,000
(ii) Debtors (for 2 months)
9,000 units × 160×2 month × 80 % or
12 months
`1,92,000
11,52,000×2month
12 months
(iii) Cash balance expected 67,500
Total Current assets 5,44,500
B. Current Liabilities
(i) Creditors for Raw material (1 month) 60,000
9,000 units× 160Overheads ×2 month ×80 % or
12 months
9,000 units 80×1month
12 months
`
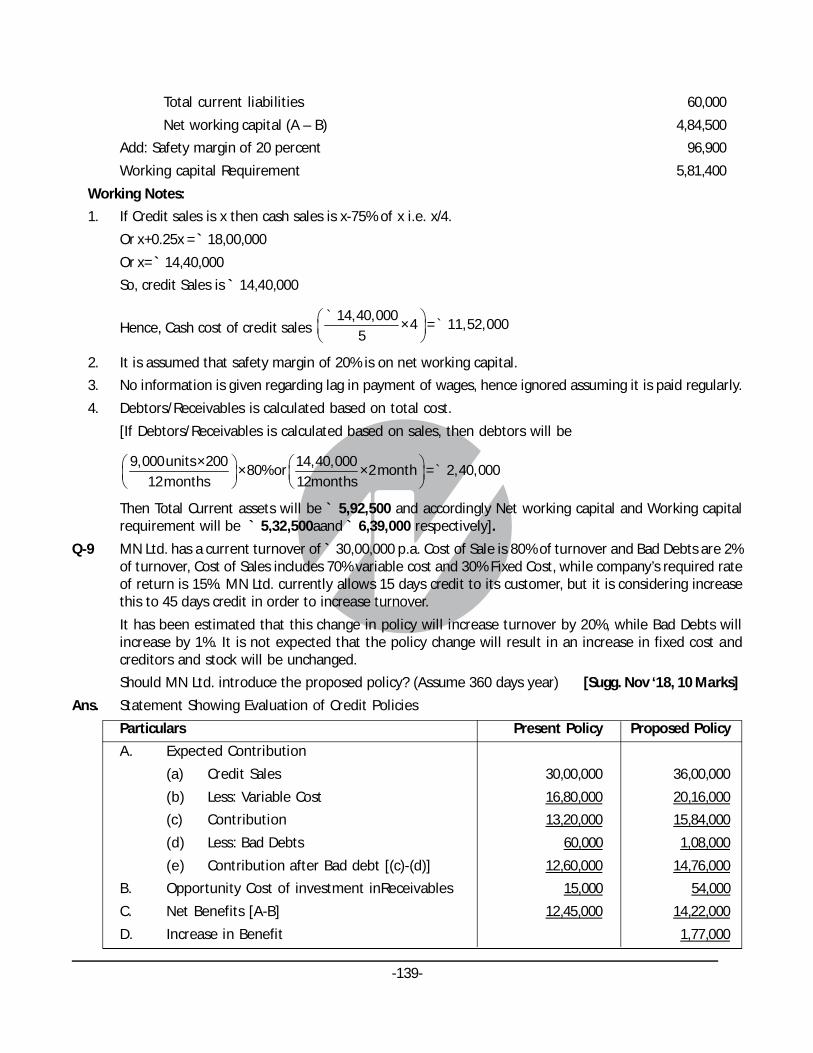
-139-
Total current liabilities 60,000
Net working capital (A – B) 4,84,500
Add: Safety margin of 20 percent 96,900
Working capital Requirement 5,81,400
Working Notes:
1. If Credit sales is x then cash sales is x-75% of x i.e. x/4.
Or x+0.25x = ` 18,00,000
Or x= ` 14,40,000
So, credit Sales is ` 14,40,000
Hence, Cash cost of credit sales 14,40,000
× 4 = 11,52,0005
` `
2. It is assumed that safety margin of 20% is on net working capital.
3. No information is given regarding lag in payment of wages, hence ignored assuming it is paid regularly.
4. Debtors/Receivables is calculated based on total cost.
[If Debtors/Receivables is calculated based on sales, then debtors will be
9,000 units ×200 14,40,000× 80% or ×2 month = 2,40,000
12 months 12months
`
Then Total Current assets will be ` 5,92,500 and accordingly Net working capital and Working capitalrequirement will be ` 5,32,500aand ` 6,39,000 respectively].
Q-9 MN Ltd. has a current turnover of ` 30,00,000 p.a. Cost of Sale is 80% of turnover and Bad Debts are 2%of turnover, Cost of Sales includes 70% variable cost and 30% Fixed Cost, while company’s required rateof return is 15%. MN Ltd. currently allows 15 days credit to its customer, but it is considering increasethis to 45 days credit in order to increase turnover.
It has been estimated that this change in policy will increase turnover by 20%, while Bad Debts willincrease by 1%. It is not expected that the policy change will result in an increase in fixed cost andcreditors and stock will be unchanged.
Should MN Ltd. introduce the proposed policy? (Assume 360 days year) [Sugg. Nov ‘18, 10 Marks]
Ans. Statement Showing Evaluation of Credit Policies
Particulars Present Policy Proposed Policy
A. Expected Contribution
(a) Credit Sales 30,00,000 36,00,000
(b) Less: Variable Cost 16,80,000 20,16,000
(c) Contribution 13,20,000 15,84,000
(d) Less: Bad Debts 60,000 1,08,000
(e) Contribution after Bad debt [(c)-(d)] 12,60,000 14,76,000
B. Opportunity Cost of investment inReceivables 15,000 54,000
C. Net Benefits [A-B] 12,45,000 14,22,000
D. Increase in Benefit 1,77,000

-140-
Recommendation: Proposed Policy i.e credit from 15 days to 45 days should be implemented by NMLtd since the net benefit under this policy are higher than those under present policy.
Working Note: (1)
Present Policy(`) Propose Policy(`)
Sales 30,00,000 36,00,000
Cost of Sales (80% of sales) 24,00,000 28,80,000
Variable cost (70% of cost of sales) 16,80,000 20,16,000
2. Opportunity Costs of Average Investments
Collection Period= Variable Cost = × Rate of Return
360
45Present Policy = 24,00, 000 × × 15% = 54,000
360` `
15Proposed Policy = 28,80, 000 × × 15% = 18, 000
360` `
Q-10 Day Ltd., a newly formed company has applied to the Private Bank for the first time for financing it’sWorking Capital Requirements. The following informations are available about the projections for thecurrent year:
Estimated Level of Activity Completed Units of Production 31200 plus unit of workinprogress 12000
Raw Material Cost ` 40 per unit
Direct Wages Cost ` 15 per unit
Overhead ` 40 per unit (inclusive of Depreciation ` 10 per unit)
Selling Price ` 130 per unit
Raw Material in Stock Average 30 days consumption
Work in Progress Stock Material 100% and Conversion Cost 50%
Finished Goods Stock 24000 Units
Credit Allowed by the supplier 30 days
Credit Allowed to Purchasers 60 days
Direct Wages (Lag in payment) 15 days
Expected Cash Balance ` 2,00,000
Assume that production is carried on evenly throughout the year (360 days) and wages and overheadsaccrue similarly. All sales are on the credit basis. You are required to calculate the Net Working CapitalRequirement on Cash Cost Basis. [Sugg. May ‘18, 10 Marks]
Ans. Calculation of Net Working Capital requirement:
(` ) (` )
A. Current Assets:
Inventories:
Stock of Raw material(Refer to Working note (iii) 1,44,000
Stock of Work in progress(Refer to Working note (ii) 7,50,000

-141-
Stock of Finished goods(Refer to Working note (iv) 20,40,000Debtors for Sales(Refer to Working note (v) 1,02,000Cash 2,00,000Gross Working Capital 32,36,000 32,36,000B. Current Liabilities:Creditors for Purchases 1,56,000(Refer to Working note (vi)Creditors for wages(Refer to Working note (vii) 23,250
1,79,250 1,79,250 Net Working Capital (A - B) 30,56,750
Working Notes:(i) Annual cost of production
(` )Raw material requirements{(31,200 × ` 40) + (12,000 x ` 40)} 17,28,000Direct wages {(31,200 × ` 15) +(12,000 x ` 15 x 0.5)} 5,58,000Overheads (exclusive of depreciation){(31,200 × ` 30) + (12,000 x ` 30 x 0.5)} 11,16,000Gross Factory Cost 34,02,000Less: Closing W.I.P [12,000 (` 40 + ` 7.5 + ` 15)] (7,50,000)Cost of Goods Produced 26,52,000Less: Closing Stock of Finished Goods(` 26,52,000 × 24,000/31,200) (20,40,000)Total Cash Cost of Sales 6,12,000
(ii) Work in progress stock(` )
Raw material requirements (12,000 units × `40) 4,80,000Direct wages (50% × 12,000 units × ` 15) 90,000Overheads (50% × 12,000 units × ` 30) 1,80,000
7,50,000(iii) Raw material stock
It is given that raw material in stock is average 30 days consumption. Since, the company is newlyformed; the raw material requirement for production and work in progress will be issued and consumedduring the year. Hence, the raw material consumption for the year (360 days) is as follows:
(` )For Finished goods (31,200 × ` 40) 12,48,000For Work in progress (12,000 × ` 40) 4,80,000
17,28,000
17,28, 000Raw material stock = × 30 days = 1,44, 000
360 days
``
(iv) Finished goods stock:
24,000 units @ ` (40+15+30) per unit = ` 20,40,000

-142-
(v) Debtors for sale: 60 days
6,12,000 × = 1, 02, 000360 days
` `
(vi) Creditors for raw material Purchases [Working Note (iii)]:
Annual Material Consumed (` 12,48,000 + ` 4,80,000) `17,28,000
Add: Closing stock of raw material ` 1,44,000
` 18,72,000
18,72, 000Credit allowed by suppliers = × 30 days = 1, 56,000
360 days
``
(vii) Creditors for wages:
5, 58,000Outstanding wage payment = × 30days = 23,250
360days
``
Q-11 A company is considering its working capital investment and financial policies for the next year.Estimated fixed assets and current liabilities for the next year are ` 2.60 crores and ` 2.34 croresrespectively. Estimated Sales and EBIT depend on current assets investment, particularly inventoriesand book-debts. The financial controller of the company is examining the following alternative WorkingCapital Policies:
(` Crores)
Working Capital Policy Investment in CurrentAssets Estimated Sales EBIT
onservative 4.50 12.30 1.23
Moderate 3.90 11.50 1.15
Aggressive 2.60 10.00 1.00
After evaluating the working capital policy, the Financial Controller has advised the adoption of themoderate working capital policy. The company is now examining the use of long-term and short-termborrowings for financing its assets. The company will use ` 2.50 crores of the equity funds. The corporatetax rate is 35%. The company is considering the following debt alternatives.
(` Crores)
Financing Policy Short-term Debt Long-term Debt
Conservative 0.54 1.12
Moderate 1.00 0.66
Aggressive 1.50 0.16
Interest rate-Average 12% 16%
You are required to CALCULATE the following:
(i) Working Capital Investment for each policy:
(a) Net Working Capital position
(b) Rate of Return
(c) Current ratio

-143-
(ii) Financing for each policy:
(a) Net Working Capital position
(b) Rate of Return on Shareholders’ equity.
(c) Current ratio.
[RTP-Nov ‘18]
Ans. (i) Statement showing Working Capital for each policy
(` in crores)
Working Capital Policy
Conservative Moderate Aggressive
Current Assets: (i) 4.50 3.90 2.60
Fixed Assets: (ii) 2.60 2.60 2.60
Total Assets: (iii) 7.10 6.50 5.20
Current liabilities: (iv) 2.34 2.34 2.34
Net Worth: (v)=(iii)-(iv) 4.76 4.16 2.86
Total liabilities: (iv)+(v) 7.10 6.50 5.20
Estimated Sales: (vi) 12.30 11.50 10.00
EBIT: (vii) 1.23 1.15 1.00
(a) Net working capital position: (i)-(iv) 2.16 1.56 0.26
(b) Rate of return: (vii)/(iii) 17.3% 17.7% 19.2%
(c) Current ratio: (i)/(iv) 1.92 1.67 1.11
(ii) tatement Showing Effect of Alternative Financing Policy
(` in crores)
Financing Policy Conservative Moderate Aggressive
Current Assets: (i) 3.90 3.90 3.90
Fixed Assets: (ii) 2.60 2.60 2.60
Total Assets: (iii) 6.50 6.50 6.50
Current Liabilities: (iv) 2.34 2.34 2.34
Short term Debt: (v) 0.54 1.00 1.50
Long term Debt: (vi) 1.12 0.66 0.16
Equity Capital (vii) 2.50 2.50 2.50
Total liabilities 6.50 6.50 6.50
Forecasted Sales 11.50 11.50 11.50
EBIT: (viii) 1.15 1.15 1.15
Less: Interest short-term debt:(ix) 0.06 0.12 0.18
(12% of ` 0.54) (12% of ` 1.00) (12% of ` 1.50)
Long term debt: (x) 0.18 0.11 0.03
(16% of ` 1.12) (16% of ` 0.66) (16% of ` 0.16)
Earning before tax:(xi) - (ix + x) 0.91 0.92 0.94
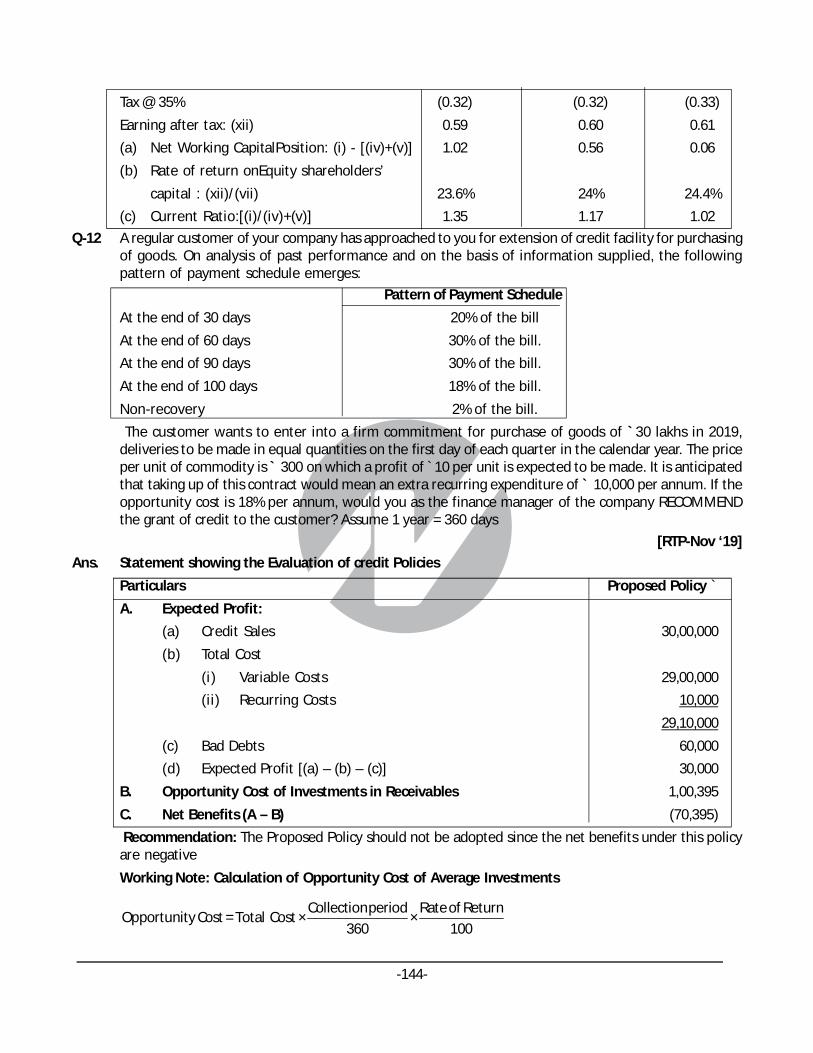
-144-
Tax @ 35% (0.32) (0.32) (0.33)
Earning after tax: (xii) 0.59 0.60 0.61
(a) Net Working CapitalPosition: (i) - [(iv)+(v)] 1.02 0.56 0.06
(b) Rate of return onEquity shareholders’
capital : (xii)/(vii) 23.6% 24% 24.4%
(c) Current Ratio:[(i)/(iv)+(v)] 1.35 1.17 1.02
Q-12 A regular customer of your company has approached to you for extension of credit facility for purchasingof goods. On analysis of past performance and on the basis of information supplied, the followingpattern of payment schedule emerges:
Pattern of Payment Schedule
At the end of 30 days 20% of the bill
At the end of 60 days 30% of the bill.
At the end of 90 days 30% of the bill.
At the end of 100 days 18% of the bill.
Non-recovery 2% of the bill.
The customer wants to enter into a firm commitment for purchase of goods of `30 lakhs in 2019,deliveries to be made in equal quantities on the first day of each quarter in the calendar year. The priceper unit of commodity is ` 300 on which a profit of `10 per unit is expected to be made. It is anticipatedthat taking up of this contract would mean an extra recurring expenditure of ` 10,000 per annum. If theopportunity cost is 18% per annum, would you as the finance manager of the company RECOMMENDthe grant of credit to the customer? Assume 1 year = 360 days
[RTP-Nov ‘19]
Ans. Statement showing the Evaluation of credit Policies
Particulars Proposed Policy `
A. Expected Profit:
(a) Credit Sales 30,00,000
(b) Total Cost
(i) Variable Costs 29,00,000
(ii) Recurring Costs 10,000
29,10,000
(c) Bad Debts 60,000
(d) Expected Profit [(a) – (b) – (c)] 30,000
B. Opportunity Cost of Investments in Receivables 1,00,395
C. Net Benefits (A – B) (70,395)
Recommendation: The Proposed Policy should not be adopted since the net benefits under this policyare negative
Working Note: Calculation of Opportunity Cost of Average Investments
Collection period Rate of ReturnOpportunity Cost = Total Cost × ×
360 100

-145-
Particulars 20% 30% 30% 18% Total
A. Total Cost 5,82,000 8,73,000 8,73,000 5,23,800 28,51,800
B. Collection period 30/360 60/360 90/360 100/360
C. Required Rate of Return 18% 18% 18% 18%
D. Opportunity Cost]
(A × B × C) 8,730 26,190 39,285 26,190 1,00,395
Q-13 A company is considering its working capital investment and financial policies for the next year.Estimated fixed assets and current liabilities for the next year are ` 2.60 crores and ` 2.34 croresrespectively. Estimated Sales and EBIT depend on current assets investment, particularly inventoriesand book-debts. The Financial Controller of the company is examining the following alternative WorkingCapital Policies:
(` in crore)
Working Capital Policy Investment inCurrent Assets Estimated Sales EBIT
Conservative 4.50 12.30 1.23
Moderate 3.90 11.50 1.15
Aggressive 2.60 10.00 1.00
After evaluating the working capital policy, the Financial Controller has advised the adoption of themoderate working capital policy. The company is now examining the use of long-term and short-termborrowings for financing its assets. The company will use ` 2.50 crores of the equity funds. The corporatetax rate is 35%. The company is considering the following debt alternatives.
(` in crore)
Financing Policy Short-term Debt Long-term Debt
Conservative 0.54 1.12
Moderate 1.00 0.66
Aggressive 1.50 0.16
Interest rate-Average 12% 16%
You are required to CALCULATE the following:
(i) Working Capital Investment for each policy:
(a) Net Working Capital position
(b) Rate of Return
(c) Current ratio
(ii) Financing for each policy:
(a) Net Working Capital position.
(b) Rate of Return on Shareholders’ equity.
(c) Current ratio. [RTP-May ‘19, May ‘18]

-146-
Ans.(i) Statement showing Working Capital Investment for each policy(` in crore)
Working Capital PolicyConservative Moderate Aggressive
Current Assets: (i) 4.50 3.90 2.60Fixed Assets: (ii) 2.60 2.60 2.60Total Assets: (iii) 7.10 6.50 5.20Current liabilities: (iv) 2.34 2.34 2.34Net Worth: (v) = (iii) - (iv) 4.76 4.16 2.86Total liabilities: (iv) + (v) 7.10 6.50 5.20Estimated Sales: (vi) 12.30 11.50 10.00EBIT: (vii) 1.23 1.15 1.00(a) Net working capital position: (i) - (iv) 2.16 1.56 0.26(b) Rate of return: (vii) /(iii) 17.32% 17.69% 19.23%(c) Current ratio: (i)/ (iv) 1.92 1.67 1.11
(ii) Statement Showing Effect of Alternative Financing Policy(` in crore)
Financing Policy Conservative Moderate AggressiveCurrentAssets (i) 3.90 3.90 3.90Fixed Assets (ii) 2.60 2.60 2.60Total Assets (iii) 6.50 6.50 6.50Current Liabilities (iv) 2.34 2.34 2.34Short term Debt (v) 0.54 1.00 1.50Total current liabilities 2.88 3.34 3.84(vi) = (iv) + (v)Long term Debt (vii) 1.12 0.66 0.16Equity Capital (viii) 2.50 2.50 2.50Total liabilities (ix) = (vi)+(vii)+(viii) 6.50 6.50 6.50Forecasted Sales 11.50 11.50 11.50EBIT (x) 1.15 1.15 1.15Less: Interest on short-term debt 0.06 0.12 0.18
(12% of ` 0.54) (12% of ` 1) (12% of ` 1.5)interest on long term debt 0.18 0.11 0.03
(16% of ` 1.12) (16% of `0.66) (16% of `0.16)Earnings before tax (EBT) (xi) 0.91 0.92 0.94Taxes @ 35% (xii) 0.32 0.32 0.33Earnings after tax: (xiii) = (xi) – (xii) 0.59 0.60 0.61(a) Net Working CapitalPosition: (i) - [(iv) + (v)] 1.02 0.56 0.06(b) Rate of return onshareholders Equity capital:
(xiii)/ (viii) 23.6% 24.0% 24.4%(c) Current Ratio (i) / (vi) 1.35 1.17 1.02

147
Q-1 Calculate National Income by Value Added Method with the help of following data-
Particulars Rs. (in crore)
Sales 700
Opening stock 500
Intermediate Consumption 350
Closing Stock 400
Net Factor Income from Abroad 30
Depreciation 150
Excise Tax 110Subsidies 50
[MTP- Oct’19,3 Marks]
Ans. NI = GDP (MP) –Depreciation +NFIA- Net Indirect Tax
Where GDP (MP) = Value of output- intermediate consumption
Value of Output = Sales+ change in stock
= 700+ (400-500)=
= 600
GDP (MP) = 600-350 = 250
Therefore NI= 250-150 +30-(110-50)
= 70 Crore
Q-2 Is country like India unable to estimate their National Income wholly by one method? Give comments
[MTP-March’19,2 Marks]
Ans. Yes, Countries like India are unable to estimate their national income wholly by one method. There arevarious sectors in an economy and national income generated by these sectors is estimated by usingdifferent methods. For example, in agricultural sector, net value added is estimated by the productionmethod, in small scale sector net value added is estimated by the income method and in the constructionsector net value added is estimated by the expenditure method.
Q-3 Suppose MPC is 0.8 and it is planned to increase National Income by Rs. 3000 Crore then how muchincrease in investment is required to fulfill this target? [MTP-March’19,2 Marks]
Ans. Given, MPC = 0.8 Planned to increase National Income by= Rs. 3000 Crore
1K =
1-MPC
CHAPTER-1DETERMINATION OF NATIONAL INCOME

148
1= 5
1- 0.8
We also know K = Yl
3000So 5 =
ll = 600 Crore
Q-4 Define ‘Net Factor Income from Abroad’ [MTP-March’19,3 Marks]Ans. The difference between the aggregate amount that a country’s citizens and companies earn abroad,
and the aggregate amount that foreign citizens and overseas companies earn in that country.Q-5 Determine the government spending multiplier when there is an increase of Rs.100 crore in government
spending and MPC is 0.75 ? And also find out the net effect of Rs. 100 crore spending?[MTP-March’19,2 Marks]
Ans. Government spending multiplier = 1
1-MPC
1 1= = 4
1- 0.75 0.25
Net effect of Rs 100 crore spending is Rs. 100 crore* 4 = Rs. 400 croreQ-6 What do you understand by the term ‘final good”? [MTP-March’19,2 Marks]Ans. Final good is a good sold to final purchasers and is consumed by the end user in its present state. It does
not require any further processing and therefore will not undergo any further transformation at thehands of producer. Once a final good has been sold, it passes out of the active economic flow. The valueof the final goods already includes the value of the intermediate goods that have entered into theirproduction as inputs.
Q-7 The equilibrium level of income of an economy is Rs.2,000crores. The autonomous consumptionexpenditure is equal to Rs.100 crores and investment expenditure is Rs.500 crores. Calculate.(i)Consumption expenditure level of National Income.(ii) Marginal propensity to save and Marginal propensity to consume(iii) Break-even level of Income. [MTP-March’19,5 Marks]
Ans.(i) Consumption expenditure at equilibrium level of National IncomeY = C + I [ AD = C + I]Putting the value of Investment Expenditure (I) = Rs.500 Crores and Income (Y) = Rs. 2000 crores, we getC = 2,000 – 500
C= Rs.1500 Crores(ii) Marginal Propensity to Save (MPS)Consumption function is given by
C = a + bY1500 = 100 + 2000 b2000 b = 1400 MPC = 0.7MPS = 1-MPC = 1-0.7 = 0.3
(iii) Break-even level of Income attained at break-even point = C = YPutting Y = C
Y = 100 + 0.7 Y
149
0.3Y = 100Y = 333.33
Q-8 Define aggregate demand. How do you derive the Keynesian aggregate demand schedule?[MTP-March’19,3 Marks]
Ans. Aggregate demand is the total quantity of finished goods and services that all sectors (consumers,firms, government and the rest of the world) together wish to buy under different conditions. Thecomponents of aggregate demand are consumption demand, investment demand, governmentspending and net exports at each level of income. While consumption demand is a function of thelevel of disposable income, the demand for investment, government spending and net exports areautonomous, i.e. these are determined outside the model and are specifically assumed to beindependent of income.The Keynesian aggregate demand schedule is obtained by vertically adding the demand forconsumption, investment demand, government spending and net exports at each level of income.
Q-9 Distinguish between Personal Income and Disposable Income.[MTP-March’19,2 Marks]
Ans. Personal income is a measure of actual current income receipts of persons from all sources which mayor may not be earned from productive activities during a given period of time. It is the income ‘actuallypaid out’ to the household sector, but not necessarily earned. Some people obtain income for whichno goods and services are provided in return. Examples of this include transfer payments such as socialsecurity benefits, unemployment compensation, welfare payments etc. Individuals also earn incomewhich they do not actually receive; for example, undistributed corporate profits and the contributionof employers to social security. Personal income forms the basis for consumption expenditures and isderived from national income as follows:PI = NI + income received but not earned - income earned but not received.Disposable personal income is a measure of amount of the money in the hands of the individuals thatis available for their consumption or savings. Disposable personal income is derived from personalincome by subtracting the direct taxes paid by individuals and other compulsory payments made to thegovernment.DI = PI - Personal Income Taxes
Q-10 Find GDPMP and GNPMP from the following data (in Crores of `) using Income method. Showthat it isthe same as that obtained by Expenditure method.Personal Consumption 7314Depreciation 800Wages 6508Indirect Business Taxes 1000Interest 1060Domestic Investment 1442Government Expenditures 2196Rental Income 34Corporate Profits 682Exports 1346Net Factor Income from Abroad 40Mixed Income 806Imports 1408
[MTP-March’18,3 Marks]

150
Ans. Income MethodGDPMP = Employee compensation (wages and salaries + employers’ contribution towards social securityschemes) + profits + rent + interest + mixed income + depreciation + net indirect taxes (Indirect taxes- subsidies)GDPMP = 6,508+ 34 + 1060 + 806+ 682 + 1,000 + 800 = 10,890GNPMP = GDPMP + NFIA =10,890+ 40 = 10,930Expenditure MethodY = C + I + G + (X – M)Y = 7314 + 1442 + 2196+ (1346 –1408)Y = (7314 + 1442 + 2196) – 62Y = 10890GNPMP = GDPMP + NFIA =10,890+ 40 =10,930
Q-11 Suppose that the consumption function is C = 200 + 0.6Y and the income level is 2000 billion.Calculate what consumers intend to consume and save at this income level.
[MTP-March’18,2 Marks]
Ans. (i) C = 200 + .6Y; Y= 2000 billion.C= 200+.6(2000) = 1400 billion.S = Y-C = 2000-14000= 600 billion.Consumers intend to consume 1,400 billion and save 600 billion.
Q-12 An increase of investment by ` 600 Crores resulted in an increase in national income by 2400 Crores.Find MPC and MPS. [MTP-March’18,2 Marks]
Ans. The ratio of Y to I is called the investment multiplier, k.
Change inIncome
Change in Invest
Yk = =
ment I
2400 1 1Here = 4 4 = =
600 1 -MPC MPS 4 – 4MPC = 14 MPC = 4-1 = 3
3MPS = = 0.75
4 MPS= 1-MPC = 0.25
Q-13 Distinguish between Nominal and Real GDP . [MTP-April’18,2 Marks]
Ans. GDP is essentially a quantity measure and therefore when value of output is measured in terms ofmarket prices, it is sensitive to changes in the average price level. The same physical output willcorrespond to a different GDP level if the average level of market prices changes. That is, if prices rise,GDP measured at market prices will also rise without any real increase in physical output.
This is misleading because it does not reflect the changes in the actual volume of output. To correct thisi.e. to eliminate the effect of prices, in addition to computing GDP in terms of current market prices,termed ‘nominal GDP’ or ‘GDP at current prices’, the national income accountants also calculate ‘realGDP ’or ‘GDP at constant prices’ which is the value of domestic product in terms of constant prices of achosen base year. Real GDP changes only when production changes. As a rule, when prices are changingdrastically, nominal GDP and real GDP diverge substantially. The converse is true when prices are moreor less constant.

151
Q-14 How are the following transactions treated in national income calculation? What is the rationale ineach case?
(i) Electricity sold to a steel plant.
(ii) Electric power sold to a consumer household.
(iii) A set of four tyres produced by MRF in 2017 and sold to Suzuki to be put on a 2017 car.
[MTP-April’18,3 Marks]
Ans.(i) Being an intermediate good, electricity sold to a steel plant will not be included in national incomecalculation. The underlying principle is that only finished goods and services which are directly sold tothe consumer for final consumption would be included. The value of the final output, namely steel,includes the value of electricity used up in the production process. Counting electricity sold to a steelplant separately will lead to the error of double counting and exaggerate the value of steel production.
(ii) Electric power sold to a consumer household would be included in the calculation of GDPsince it is afinal good consumed by the end user. Electric power sold to a consumer does not require any furtherprocessing and does not undergo any further transformation before use.
Once a final good has been sold, it passes out of the active economic flow.
(iii) The value of parts and components procured from the market by a car manufacturer will not be includedin national income calculation because these are intermediate goods used in car production. Value isadded to the parts and components through the process of production and the same is resold. Thevalue of the final output, namely car, includes the value of the parts and components. Counting partsand components separately will lead to the error of double counting and exaggerate the value of carproduction. A set of four tyres produced by MRF in 2017 and sold to Suzuki to be put on a 2017 car willnot be included in the national income of 2017.
Q-15 Define Marginal Propensity to Consume (MPC). [MTP-April’18,2 Marks]
Ans. The concept of MPC describes the relationship between change in consumption (“C) and the change inincome (“Y). The marginal propensity to consume (MPC) is the increase in consumption per unit increasein disposable income. In other words, the value of the increment to consumer expenditure per unit ofincrement to income is termed the Marginal Propensity to Consume (MPC).
It is the slope of the consumption function.
CMPC = = b
Y
MPC is larger than zero (when income rises, consumption spending will rise), but less than one (therise in consumption will be smaller than the rise in disposable income).
0 < MPC < 1
Q-16 The equilibrium level of real GDP is Rs 1,000 billion, the full employment level of real GDP is Rs 1,250billion, and the marginal propensity to consume (MPC) is 0.60. How much government spending (“G)would be needed to raise income to full-employment level? [MTP-April’18,3 Marks]
Ans. k. I = Y; k = 1/0.4
= (1250 -1000) .0.4
= 100 billion
Q-17 The citizens of Country X undertake numerous non-market transactions. What impact do thesetransactions have on GDP?
[MTP-April’18,2 Marks]

152
Ans. Non market transactions are not included in GDP since no monetary transaction is involved.
Therefore, GDP will be understated and may not reflect the actual productive activity or true welfareof the country.
Q-18 The equilibrium level of real GDP is Rs 1,000 billion, the full employment level of real GDP is Rs 1,250billion, and the marginal propensity to consume (MPC) is 0.60. How much government spending (G)would be needed to raise income to full-employment level? [MTP-Aug’18,3 Marks]
Ans. k. I = Y; k = 1/0.4
= (1250 -1000) .0.4
= 100 billion
Q-19 You are given the following data on an economy
(Rs. in Cores):
Investment expenditure (I): 250
Government expenditure on goods and services (G): 800
Exports (X): 600
All tax revenues are derived from a uniform rate of income tax of 30% of income.
Consumption expenditure is given by: C = 0.75 Yd; Where: Yd is disposable national income (i.e. incomeless taxes) and C is consumption expenditure Import expenditure is given by: M = 0.15 Y Where: Y isnational income and M is import expenditure
(i) Calculate the equilibrium value of National Income.
(ii) Calculate the Current Account Balance at the equilibrium value of National Income.
(ii) Calculate the Fiscal Surplus (+) or Deficit (-) at the equilibrium value of National Income.
[MTP-Aug’18,5 Marks]
Ans.(i) Y=C + I+ G+ (X-M)
Y= 0.75 ×{(1-0.30)*Y} + 250 + 800 + 600 - 0. 15×Y
Y= 0.375Y+1650
0.625Y= 1650
1650Y =
0.625
Hence Y = Rs.2640 Crores
(ii) Exports (X) = Rs.600 CroresImports = 0.15(2640) = Rs.396 Cores
Hence current account is in surplus of Rs. 204 Crores
(iii) Tax revenue = 0. 3 (2640) = Rs.792 Crores
Government expenditure = Rs.800 Crores
Hence budget is in deficit of Rs. 8 crores i.e. –8
Q-20 Estimate national Income by (a) Expenditure Method (b) Income Method From Following data
Rs. in Crores
Private Final Consumption Expenditure 210
Govt. Final Consumption Expenditure 50
Net domestic capital Formation 40

153
Net Exports (-) 5
Wages and Salaries 170
Employers Contribution 10
Profit 45
Interest 20
Indirect Taxes 30
Subsidies 05
Rent 10
Factor Income from abroad 03
Consumption of Fixed capital 25
Royalty 15
[MTP-March’18,3 Marks]
Ans. National Income (NNPFC)
Expenditure Method:= Private Final Consumption Expenditure + Govt. Final Consumption Expenditure+Net domestic capital Formation + Net Exports = 210+50+40+(-5) = 295
NNP (FC) = NDP MP + Factor Income from abroad – Net Indirect Tax (Indirect Tax – Subsidy)= 295 + 3 - (30-5)
= 295 + 3 - 25 = 273
= 298 - 25 = 273
NNP FC = 273 Crores
Income Method: Wages and Salaries+ Employers Contribution+ Profit + Interest + Rent + Royalty
= 170 + 10 + 45 + 20 + 10 + 15 = 270 (NDPFC)
NNPFC = NDPFC + FIFA
270+3 = 273 Crores
Q-21 Calculate (a) GDPMP and (b) NNPFC from the following data:Particulars (Rs.) In CroreNet indirect tax 208Consumption of fixed capital 42Net factor income from abroad -40Rent 311Profits 892Interest 81Royalty 6Wages and salary 489
Employer’s contribution to Social Security Scheme 50
[MTP-Oct’18,3 Marks]
Ans. NDPFC = Compensation of Employees + Operating Surplus + Mixed Income= (viii) + (ix) + (iv) + (v) + (vi)+ (vii) = 489 + 50+ 311 + 892 + 81 + 6 = 1829 Crores
GDPMP = NDPFC + Depreciation + Net Indirect Tax
154
= NDPFC + (ii) + (i) = 1829 + 42 + 208 = 2079 Crores
NNP FC= NDPFC + Net Factor Income from Abroad
= NDPFC + (iii) = 2079+ (-40) = 2039 Crores
Q-22 An increase of investment by Rs. 600 Crores resulted in an increase in national income by 2400 Crores.Find MPC and MPS? [MTP-Oct’18,2 Marks]
Ans. The ratio of Y to I is called the investment multiplier, k.
Change in Income Yk =
Change in Investment I
2400 1 1Here = 4; 4 = =
600 1 -MPC MPS
4 – 4MPC = 14 MPC = 4-1 = 3
3MPC = = 0.75
4MPS= 1-MPC = 0.25
Q-23 Explain the leakages and injections in the circular flow of income [MTP-Oct;18,2 Marks]
Ans. Leakages: A leakage is an outflow or withdrawal of income from the circular flow. Leakages are moneyleaving the circular flow and therefore, not available for spending on currently produced goods andservices. Leakages reduce the flow of income.
Injections: An injection is a non-consumption expenditure. It is an expenditure on goods and servicesproduced within the domestic territory but not used by the domestic household for consumptionpurposes. Injections are exogenous additions to the circular flow and add to the total volume of thebasic circular flow. In the two-sector model with households and firms, household saving is the onlyleakage and investment is the only injection. In the three -sector model which includes the government,saving and taxes are the two leakages and investment and government purchases are the two injections.In the four-sector model which includes foreign sector also, saving, taxes, and imports are the threeleakages; investment, government purchases, and exports are the three injections.
The state of equilibrium occurs when the total leakages are equal to the total injections that occur inthe economy. Savings + Taxes + Imports = Investment + Government Spending + Exports
Q-24 Suppose an economy:Consumption Function (C) = 200+ 0.6 Yd, where Yd = Y-TAutonomous Investment (I) = Rs. 600 croresGovernment Expenditure G = Rs. 900 crores
Taxes (T) = Rs.100 croresExports (X) = Rs.200 crores
Import Function (M) = 50 + 0.3 YWhere Y and Yd National Income and Personal Disposable Income respectively. All the figures are inRupees.Find Out:(i) Equilibrium level of GDP

155
(ii) Disposable Income(iii) Net Exports at Equilibrium GDP
[MTP-Oct’18,5 Marks]
Ans. Given C = 200+0.6YdI = Rs. 600 CroresG = Rs.900 croresT = Rs. 100 Crores
Exports, X = 200 CroresImport function = M = 50+0.3Y
(i) Equilibrium level of GDP
Y = C + I + G+ (X-M)
= 200 + 0.6Yd+600+900+[200-(50+0.3Y)]
Y = 200 + 0.6Y- 60 + 1500 +150 - 0.3Y [Yd = Y – 100]
Y = 1790 + 0.3Y
Y-0.3Y = 1790
Y = 2557.14
(ii) Disposable Income
Yd = Y-T = 2557.14 - 100 = 2457.14
[Yd = Y – 100]
(iii) Net Exports at GDP level
X-M = 200-(50+0.3 Y)
= 200-(50+0.3(2557.14)]
= 150-767.14
=- 617.14 crore
Q-25 Explain few important points which one needs to bear in mind while calculating National Income.
[RTP -Nov’19]
Ans. Few important points which one needs to bear in mind while calculating National Income are -
(i) The value of only final goods and services or only the value added by theproduction processwould be included in GDP. By `value added’ we mean thedifference between value of output andpurchase of intermediate goods.
(ii) Intermediate consumption consists of the value of the goods and services consumed as inputs bya process of production, excluding fixed assets whose consumption is recorded as consumptionof fixed capital. Intermediate goods used to produce other goods rather than being sold to finalpurchasers are not counted as it would involve double counting.
(iii) Gross Domestic Product (GDP) is a measure of production activity which covers all productionactivities recognized by SNA called the `production boundary’.
(iv) Economic activities include all human activities which create goods and services that are exchangedin a market and valued at market price. On the other hand,Non-economic activities are thosewhich produce goods and services, but since these are not exchanged in a market transaction theydo not command any market value; for e.g. hobbies, housekeeping and child rearing services ofhome makers and services of family members that are done out of love and affection.
156
(v) National income is a ‘flow’ measure of output per time period—for example, per year—andincludes only those goods and services produced in the current period i.e. produced during thetime interval under consideration. The value of market transactions such as exchange of goodswhich already exist or are previously produced, do not enter into the calculation of nationalincome.
Therefore, the value of assets such as stocks and bonds which are exchanged during the pertinentperiod are not included in national income as these do not directly involve current production ofgoods and services.
(vi) Two types of goods used in the production process are counted in GDP namely, capital goods(business plant and equipment purchases) and inventory investment—the net change ininventories of final goods awaiting sale or of materials used in the production which may bepositive or negative.
Q-26 Calculate Net Domestic Product at Factor Cost from the following data:
Particulars In Crore
Wages 7142
Mixed income 450
Rent 541
Salaries 8912
Interest 1013
Profit 714
[RTP-Nov’19]
Ans. Net Domestic Product at Factor Cost = Compensation of Employees (wages and salaries) + operatingsurplus (rent, interest and profit) + mixed income
= 7142+8912+541+1013+714+450
= 18772 crores.
Q-27 Calculate Personal Income from the following data:
Particulars In Crore
Undistributed profits of corporation 50
Net domestic product accruing to private sector 700
Corporation tax 65
Net factor income from abroad 10
Net current transfer from rest of the world 20
Net current transfer from the government 25
Interest on national debt 40
[RTP- Nov’19]
Ans. Personal Income = Net domestic product accruing to private sector + Net factor
income from abroad + Net current transfers from government + Net current transfers from rest of theworld + interest on National debt – Corporation tax – Undistributed profits of corporations
= 700+10+25+20+40-65-50
= 680 Crores

157
Q-28 Explain the concept of circular flow in two sector economy model? [RTP-Nov’19]
Ans The two sector economy model assumes that there are only two sectors in the economy viz.,households and firms, with only consumption and investment outlays.
Households own all factors of production and they sell their factor services to earn factor incomeswhich are entirely spent to consume all final goods and services produced by business firms. Thebusiness firms are assumed to hire factors of production from the households; they produce and sellgoods and services to the households and they do not save. There are no corporations, corporatesavings or retained earnings. The total income produced, Y, accrues to the households and equals theirdisposable personal income Yd i.e., Y = Yd. All prices (including factor prices), supply of capital andtechnology remain constant. The government sector does not exist and therefore, there are no taxes,government expenditure or transfer payments. The economy is a closed economy, i.e., foreign tradedoes not exist; there are no exports and imports and external inflows and outflows. All investmentoutlay is autonomous (not determined either by the level of income or the rate of interest);
all investment is net and, therefore, national income equals the net national product.
The circular flow of income and expenditure which presents the working of the twosector economyshould be illustrated diagrammatically. There are no injections into or leakages from the system. Sincethe whole of household income is spent on goods and services produced by firms, householdexpenditures equal the total receipts of firms which equal value of output.
Q-29 i. Find out the MPC, when in an economy total income increases by ` 7500 croredue to increase ininvestment by ` 2500 crore?
ii Assume that the consumption function in an economy is specified by theequation C = 200 + 0.9Y
With the help of an example show that in this economy as income increases MPC remains constant.
[RTP -Nov’19]
Ans.
i. Given,
Increase in income= ` 7500 crore
Increase in investment= 2500 crore
Therefore,
Investment multiplier (k)= Y l or
Y l =1/1-mpc
7500/2500=1/1-mpc
mpc= 0.66
ii. Suppose assume that income is 1000, 2000 and 3000
Then consumption is C= 200+0.9(1000) =1100
C= 200+0.9(2000) = 2000
C= 200+0.9(3000) = 2900
Thus:
Y C MPC ( C Y )
1000 1100 -
2000 2000 900/1000=0.9

158
3000 2900 900/1000=0.9
So we see as income increases from ` 1000 to ` 2000 and from ` 2000 to ` 3000, marginal propensity toconsume remains constant i.e., 0.9.
Q-30 Differentiate between ‘taxes on production’ and ‘product taxes’ [RTP -May’19]Ans. Product taxes like excise duties, customs, sales tax, service tax etc., are levied by the government on
goods and services and are generally related to the quantum of production.Taxes on production, such as, factory license fee, taxes to be paid to the local authorities, pollution taxetc., on the other hand, are unrelated to the quantum of production.
Q-31 Distinguish between non-economic activities and economic activities? [RTP -May’19]
Ans. Economic activities as distinguished from non-economic activities, include allhuman activities whichcreate goods and services that can be valued at market price. Non-economic activities are those whichproduce goods and service, but are not exchanged in a market transaction so that do not command anymarket value.
Q-32 Using the information given in the following table calculate,
(i) Value added by firm A and firm B
(ii) Gross Domestic Product at Market Price
(iii) Net Domestic Product at Factor Cost.
Particulars ` crore
(i) Sales by firm B to general government 300
(ii) Sales by firm A 1500
(iii) Sales by firm B to households 1350
(iv) Change in stock of firm A 200
(v) Closing stock of firm B 140
(vi) Opening stock of firm B 130
(vii) Purchases by firm A 270
(viii) Indirect taxes paid by both the firms 375
(ix) Consumption of fixed capital 720
(x) Sales by firm A to B 300
[RTP -May’19]
Ans.
(i) Value added by Firm A and Firm BGross Value Added (GVAMP) of Firm A = Gross value of output (GVOMP) of Firm A
- Intermediate consumption of firm A= (Sales by firm A + Change in stock offirm A) - (Purchases by firm A)= [(ii) + (iv)] – (vii) = (1500 + 200) - 270= 1430 Crores
Gross Value Added (GVAMP) of Firm B = Gross value of output (GVOMP) of firm B-Intermediate consumption of firm B= [Sales by firm B to generalgovernment + Sales by firm B tohouseholds + (Closing stock of

159
firm B - Opening stock of firm B)] -Purchases by firm B= [(300 + 1350) + (140 - 130)] - 300
= 1650 + 10 - 300 = ̀ 1360 Crores
(ii) Gross Domestic product at Market Price:
= Value added by firm A + Value added by firm B = 1430 + 1360 = ` 2790 Crores
(iii) Net Domestic Price at Factor Cost:
NDP FC = Gross Domestic product at market price - Consumption of fixed capital
– Indirect taxes paid by both the firms
= 2790 - (ix) - (viii) = 2790 - 720 – (375 -0) = ` 1695 Crores
Q-33 How do imports affects investment multiplier? [RTP -May’19]
Ans. The greater will be propensity to import, the lower will be autonomous expenditure multiplier.
Q-34 An increase of investment by ` 600 Crores resulted in an increase in national income by 2400 Crores.Find MPC and MPS. [RTP -May’19]
Ans. The ratio of Y to I is called the investment multiplier, k.
Change inIncome Yk = =
Change in Investment I
Here 2400
= 4600
1 14 = =
1 - MPC MPS
4 – 4MPC = 14 MPC = 4-1 = 3
3MPC = = 0.75
4
MPS= 1-MPC = 0.25
Q-35 Calculate Gross National Disposable income from the following data (in ` Crores)
NDP at factor cost 6000
Net factor income to abroad - 300
Consumption of fixed capital 400
Current transfers from government 200
Net current transfers from rest of the world 500
Indirect taxes 700
Subsidies 600
[RTP -Nov’18]
Ans. Gross National Disposable Income (GNDI)= GNPMP + Net current transfer received from rest of theworld. Net current transfer received from rest of the world is the difference between the current

160
transfer received from rest of the world and current transfers paid to rest of the world. Current transfersfrom government are not included as they are simply transfers within the economy.
Gross National Disposable Income = (National Consumption Expenditure) + (Gross National Saving)
= (Government final consumption expenditure+ expenditure) + (Gross National Saving.)
Calculation: -
= NDP at factor cost + Consumption of fixed capital =GDP at factor cost
GDP at factor cost + Net factor income to abroad = GNP at factor cost
GNP at factor cost + (indirect taxes – subsidies) = GNP at market prices
GNP at market prices + Net current transfers from rest of the world
= Gross National Disposable income
= (6000+400) + (- 300) + (700-600) + 500
= 6400 - 300 + 100 + 500 = 6700 Crores
Q-36 What would happen if aggregate expenditures were to exceed the country’s economy’s productioncapacity?
[RTP -Nov’18]
Ans. Aggregate demand (AD) is the sum of all planned expenditures for the entire economy. When aggregateexpenditures exceed an economy’s production capacity at full employment level; the resulting strainon resources creates “demand-pull” inflation or higher price level. Nominal output will increase, but itmerely reflects higher prices, rather than additional real output.
Q-37 What effects do income leakages have on multiplier? [RTP -Nov’18]
Ans. The multiplier is the ratio of the change in real GDP to the initial change in spending.
Causes responsible for the decline in income are called leakages. Income that is not spent on currentlyproduced consumption goods and services may be regarded as having leaked out of income stream. Ifthe increased income goes out of the cycle of consumption expenditure, there is a leakage fromincome stream which reduces the effect of multiplier. The more powerful these leakages are, thesmaller will be the value of multiplier.
Q-38 An Economy is characterised by the following equations:
Consumption (C) = 100+0.9 Yd
Investment (I) = 100
Government Expenditure (G) = 120
Tax (T) = 50
X (Exports) = 200
M (Imports) = 100+ 0.15 Y
(i) What is the equilibrium Income?
(ii) Calculate trade balance.
(iii) What is the value of Foreign Trade Multiplier? [RTP -Nov’18]
Ans. (i) National Income: Y = C+I+G+(X-M)
= (100+0.9Yd) +100+120+200-(100+0.15Y)
= 100+0.9(Y-T) +100+120+200-100-0.15Y
= 100+0.9(Y-50) +100+120+200-100-0.15Y
161
Y= 375+0.75Y
Y-0.75Y= 375
0.25Y= 375
100Y = 375 × = 1500.00
25
(ii) Trade balance = X- M
= 200- (100+0.15Y)
Substituting the value of Y We have
Trade Balance = 200-100-225= -125
Trade balance is in deficit of 125.
(iii) Value of foreign trade Multiplier = 1
1 - b + m
Where b marginal propensity to consume, and m is marginal propensity to import. (Here MPC = 0.9 andmarginal propensity to Import (m) = 0.15
1 1 1 100Foreign trade Multiplier = = = = = 4
1 - 0.9 + 0.15 1.15 - 0.9 0.25 25
Q-39 Define National Income. Draw the basis of distinction between GDP at current and constant prices.
[RTP -May’18]
Ans. National Income is defined as the net value of all economic goods and services produced within thedomestic territory of a country in an accounting year plus the net factor income from abroad. Accordingto the Central Statistical Organization (CSO)
‘National income is the sum total of factor incomes generated by the normal residents of a country inthe form of wages, rent, interest and profit in an accounting year’.
National income may be measured at current prices or at constant prices. If goods and services producedin a year are valued at current prices, i.e., market prices prevailing in the year in which goods andservices are produced, we get national income at current prices or nominal national income. If goodsand services produced in a year are valued at ‘fixed’ prices, i.e., prices that prevailed during a previousyear chosen as base year, we get national income at constant prices or real national income. Thus GDPat constant prices is the value of domestic product in terms of constant prices of a chosen base year. Abase year is a carefully chosen year which is a normal year free from price fluctuations.
The GDP market prices is sensitive to changes in average price level. The same physical output willcorrespond to a different GDP level if the average level of market prices changes. That is, if prices rise,GDP measured at market prices will also rise without any real increase in physical output. This ismisleading because it does not reflect changes in the actual volume of output. GDP at current pricesmakes no adjustment for inflation or deflation. GDP at constant prices is inflation /deflation correctedand can be used to measure true growth of GDP. For example, the GDP of 2015-16 may be expressedeither at prices of that year or at prices that prevailed in 2011-12. In the former case, GDP will beaffected by price changes, but in the latter case GDP will change only when there has been a change inphysical output. Since real national income accurately reflects the real change in physical output of acountry, it can be used to make a year to year comparison of changes in the volume of output of goodsand services.
162
Q-40 You are given the following data on an economy in millions:
Consumer Expenditure (inclusive of indirect taxes) 110 m
Investment 20 m
Government Expenditure (inclusive of transfer payments) 70 m
Exports 20 m
Imports 50 m
Net Property Income from abroad 10 m
Transfer payments 20 m
Indirect taxes 30 m
Population 0.5 m
(i) Calculate the Gross Domestic Product at market prices.
(ii) Calculate the Gross National Income at market prices.
(iii) Calculate the Gross Domestic Product at factor cost.
(iv) Calculate the per capita Gross National Income at factor cost. [RTP -May’18]
Ans. (i) GDPMP= C + I + G + (X – Z)
110 + 20 + (70 – 20) + (20 – 50) = 150 million
(ii) GNPMP= GDP at market prices + net property income from abroad
150 + 10 = 160 million
(iii) GDP at factor cost = GDP market prices – indirect taxes
150 – 30 = 120 million
(iv) Per Capita Income = GNP at Factor Cost= 160 m - 30 m / 0.5 milion
Population
= 130 / 0.5 = 260
Q-41 Define consumption function? Examine what would happen if aggregate expenditures were to exceedthe economy’s production capacity? [RTP -May’18]
Ans. Consumption function is the functional relationship between aggregate consumption expenditureand aggregate disposable income, expressed as C = f (Y); shows the level of consumption (C)corresponding to each level of disposable income (Y) Aggregate expenditures in excess of output leadto a higher price level once the economy reaches full employment. Nominal output will increase, butit merely reflects higher prices, rather than additional real output.
Q-42 For an Economy with the following specifications
Consumption, C = 50+0.75 Yd
Investment, I = 100
Government Expenditure, G = 200
Transfer Payments, R= 110
Income Tax = 0.2Y
(i) Find out the equilibrium of income and the value of expenditure multiplier.
(ii) If autonomous taxes worth ` 25 Crores are added. Find out equilibrium level of Income.

163
(iii) If the economy is opened up with exports X = 25 and imports M = 5+0.25Y
Calculate the new level of Income and balance of Trade (Assume that there are no autonomous Taxes.)
[RTP -May’18]
Ans.(i) Level of Disposable income Yd is given by
Yd = Y-Tax + Transfer Payments, Where, Transfer Payment = 110
= Y -0.2 Y +110 = 0.8Y +110, and C = 50+0.75 Yd
= 50+0.75(0.8Y +110)(where Yd = 0.8Y +110)
=50+(0.75×0.8Y) + (0.75X110) =132.50+0.6Y
C = 132.50+0.6 Y
Now Y = C+I+G, Where C = 132.50+0.6Y, I = 100, G = 200(Given)
Y= (132.50+0.6Y)+100+200
= 432.50+0.6Y
Y-0.6Y= 0.4Y = 432.50
or Y = 432.50/0.4 = ̀ 1,081.25 Crores
Expenditure Multiplier =
1Multiplier in closed economy
1 1= = 2.5
1 - b 1 - =
1 -b0.6
CHereb = MPC =
Y
(ii) If autonomous taxes worth of ` 25 Crores added, this will reduce disposable income by ` 25 crores
Level of Disposable income Yd is given by
Yd = Y – Tax + Transfer payments
Thus Yd = Y-0.2Y +(110-25)= 0.8Y +85 ( Income Tax Given = 0.2Y , Transfer Payments = 110)
C= 50+0.75(0.8Y +85) (Given C = 50+0.75 Yd)
C= 50+(0.75×0.8Y)+(0.75×85)
= 50+0.6Y+63.75 = 113.75+0.6Y
Y = C+I+G
= (113.75+0.6Y) +100+200= 413.75+0.6Y(C= 113.75+0.6Y , I = 100, G = 200)
Y-0.6Y = 413.75
0.4Y = 413.75
413.75Y = = 1034.375 Crores
0.4`
(iii) Y = C+I + G+ (X-M), Where Consumption, (C) = 132.50+0.6 Y, Investment(I)
= 100, Government Expenditure (G) = 200
Since X = 25, M = 5+0.25 Y
Y = (132.50+0.6Y) +100+200+ {25-(5+0.25Y)} (Given X = 25 crores and M
= 5+0.25Y)
164
Y = (132.50+0.6Y) +100+200+ (25-5-0.25Y)
= (1-0.6+0.25) Y = 452.50
Y = = 696.15 Crores452.50
0.65`
Imports = 5+0.25Y = 5+ (0.25×696.15) = ̀ 179.04 Crores
Balance of trade = Exports – Imports
Balance of Trade = 25- M = 25-179.04= -`154.04 crores.
Thus, there is adverse balance in Trade of ` 154.04 crores
Q-43 Given Consumption function C = 300 + O.75Y;
Investment = ` 800; Net Imports = ` 100
Calculate equilibrium level of output.
[Sugg.-May’19,3 Marks]
Ans. Y = C+I+G+(X-M)
Y = (300+0.75Y) +800+ 0+ (-100)
Y = 300+0.75Y +800 -100 = 0.25 Y =1000
Y= ` 4000
Q-44 Compute GNP at factor cost and NDP at market price using expenditure method from the followingdata:
(` in Crores)
Personal Consumption expenditure 2900
Imports 300
Gross public Investment 500
Consumption of fixed capital 60
Exports 200
Inventory Investment 170
Government purchases of goods & services 1100
Gross Residential construction Investment 450
Net factor Income from abroad (-)30Gross business fixed Investment 410
Subsidies 80
[Sugg.-May’19,5 Marks]
Ans. GDPMP = Personal consumption expenditure + Government purchase of goods andservices + grosspublic investment + inventory investment +gross residential construction investment + Gross businessfixed investment + [export – import]
= 2900 + 1100 + 500 + 170+450 + 410 + (200-300)
= ` 5430 Crores
GNPFC = GDPMP + Net Factor Income from Abroad - Net Indirect Taxes
= ` 5430 + (-30) +80 = 5480 Crores

165
NDPMP = GDPMP - Consumption of fixed capital = 5430- 60 = ` 5370 Crores
Q-45 What are the conceptual difficulties in the measurement of national income?
[Sugg.-May’19, 2 Marks]
Ans. There are many conceptual difficulties related to measurement which are difficult to resolve. A fewexamples are:
(a) lack of an agreed definition of national income,
(b) accurate distinction between final goods and intermediate goods,
(c) issue of transfer payments,
(d) services of durable goods,
(e) difficulty of incorporating distribution of income
(f) valuation of a new good at constant prices, and
(g) valuation of government services
(h) valuation of services rendered without remuneration
Q-46 When investment in an economy increases from ` 10,000 crores to ` 14,000 croresand as a result of thisnational income rises from ` 80,000 crores to ` 92,000 crores, compute investment multiplier.
[Sugg.-May’19,2 Marks]
Ans. Investment Multiplier K = Y/ l = 12,000/ 4,000 = 3
Q-47 Explain the Concept of Gross National Product at market price (GNP mp). [Sugg.-Nov’18,2 Marks]
Ans. Gross National Product (GNP) is a measure of the market value of all final economic goods and services,gross of depreciation, produced within the domestic territory of a country by normal residents duringan accounting year plus net factor incomes from abroad. Thus, GNP includes earnings of Indiancorporations overseas and Indian residents working overseas.
GNPMP = GDPMP + Net Factor Income from Abroad
Net factor income from abroad is the difference between the income received from abroad for renderingfactor services by the normal residents of the country to the rest of the world and income paid for thefactor services rendered by non- residents in the domestic territory of a country.
Q-48 In a two sector model Economy, the business sector produces 7500 units at an average price of ` 7.
(i) What is the money value of output?
(ii) What is the money income of Households?
(iii) If households spend 75 of their Income, what is the total consumer expenditure?
(iv) What is the total money revenue received by the business sector?
(v) What should happen to the level of output?
[Sugg.-Nov’18,5 Marks]
Ans.(i) The money value of output equals total output times the average price per unit. The
money value of output is (75000×7) = ` 52,500
(ii) In a two sector economy, households receive an amount equal to the money valueof output. Therefore,the money income of households is the same as the money value of output i.e. ` 52,500
(iii) Total spending by households (` 52,500 × .75) i.e. ` 39,375

166
(iv) The total money revenues received by the business sector is equal to aggregate spending by householdsie. ` 39,375
(v) The circular flow will be balanced and therefore in equilibrium when the injections are equal to theleakages. The saving by the household sector would imply leakage or withdrawal of money (equal tosaving) from the circular flow of income. If at any time intended saving is greater than intendedinvestment, (not given; assumed = zero) this would mean that people are spending lesser volum e ofmoney on consumption. Here, the business sector makes payments of ` 52,500 to produce output,whereas the households purchase only output worth ` 39,375 of what is produced. Therefore, thebusiness sector has unsold inventories valued at ` 13,125. Consequently, the firms would decreasetheir production which would lead to a fall in output and income of the household.
Q-49 Calculate the Average Propensity to Consume (APC) and Average Propensity to Save (APS) from thefollowing data:
Income ` 4,000
Consumption ` 3,000
[Sugg.-Nov’18,2 Marks]
Ans. The average propensity to consume (APC) is the ratio of consumption expenditures
(C) to disposable income (DI), or APC =C / DI.
The average propensity to save (APS) is the ratio of savings to disposable income or APS =S / DI
APC= 3000/4000= 0.75.
APS= 1000/4000= 0.25.
Q-50 Calculate the Marginal Propensity to Consume (MPC) and Marginal Propensity to Save(MPS) from thefollowing data:
Income (Y) Consumption (C) Level
` 8,000 ` 6,000 Initial level
` 12,000 ` 9,000 Changed level
[Sugg.-May’18,2 Marks]
Ans.
CMarginal Propensity to Consume (MPC) =
Y
Where C is change in consumption and Y is change in income
C = (9,000 – 6,000); Y = (12,000 – 8,000)
C 3000 = = 0.75
Y 4000
S CMarginal Propensity to Save (MPS) = 1 - = 1 - O.75 = 0.25
Y Y
OR
S = Y-C
SMarginal Propensity to Save (MPS) =
Y

167
(12000 -9000)- (8000- 6000)
12,000-8000
1000= = 0.25
4000
Q-51 Suppose in an economy:
Consumption Function C = 150 + 0.75 Yd
Investment spending I = 100
Government spending G= 115
Tax Tx = 20 + 0.20 Y
Transfer Payments Tr = 40
Exports X = 35
Imports M = 15 + 0.1 Y
Where, Y and Yd are National Income and Personal Disposable Income respectively. All figures are inrupees.
Find:
(i) The equilibrium level of National Income
(ii) Consumption at equilibrium level
(iii) Net Exports at equilibrium level [Sugg.-May’18,5 Marks]
Ans. The consumption function is
C = 150 + 0.75Yd
Level of Disposable income Yd is given by
Yd = Y-Tax + Transfer Payments, Where, Transfer Payment = Tr = 40
= Y – (20+ 0.20 Y) + 40 = Y – 20 – 0.20Y +40
= Y – 0.2Y - 20+40
Yd = 20 + 0.8 Y and C = 150+0.75 Yd
C = 150 + .75 (20 +0.8 Y) where Yd = (20+0.8Y)
C = 150 +15+ 0.6Y
C = 165 + 0.6Y
(i) The equilibrium level of national income
Y = C + I + G + (X-M)
Y = 165 + 0.6Y +100+115+ [35 – (15+0.1Y)]
= 165 +0.6 Y +100+115+ [35 -15 – 0.1Y]
= 165+0.6Y +215+ 35 – 15 - 0.1Y
Y = 400+ 0.5Y
Y-0.5Y = 400; 0.5 Y = 400
Y = 400 / 0.5 = 800
The equilibrium level of national income is ` 800
168
(ii) Consumption at equilibrium level of national income of ` 800
C = 165 + 0.6Y
C = 165 + 0.6(800)
C = 165+480 = 645
Consumption at equilibrium level = ` 645
(iii) Net Exports at equilibrium level of national income 800
Net exports = Value total exports - Value of total imports
Given, exports X = 35; and imports M = 15+0.1Y
Net exports = [35 - (15+0.1Y)]
= 35 -15 – 0.1Y
= 35 -15 – (0.1X 800) = 35 – 15 – 80 = - 60
Net exports = `` (-)60
There is an adverse balance of trade
Q-52 From the following data, compute the Gross National Product at Market Price(GNPMP) using valueadded method:
(` In crores)
Value of output in Secondary Sector 1000
Intermediate consumption in Primary Sector 300
Value of output in Tertiary Sector 3000
Intermediate consumption in Secondary Sector 400
Net factor income from abroad (-) 100
Value of output in Primary Sector 800
Intermediate consumption in Tertiary Sector 900
[Sugg.-May’18,3 Marks]
Ans. Computation of Gross National Product at Market Price (GNPMP)
GNPMP = (Value of output in primary sector – Intermediate consumption of primary sector) + (Value ofoutput in secondary sector – Intermediate consumption of secondary sector) + (Value of output intertiary sector – Intermediate consumption of tertiary sector) + Net Factor Income from Abroad
GNPMP = [(800- 300) + (1000 – 400) + (3000 – 900)] + (-100)
= 500+ 600+ 2100 - 100
= 3200 -100 = ̀ 3100 Crores
Q-53 How the autonomous expenditure multiplier is stated in four sector model?
[MTP-March’19,2 Marks]
Ans. The autonomous expenditure multiplier in a four sector model includes the effects of foreign
transactions and is stated as 1
1-b + v where v is the propensity to import which is greater than zero. The
greater the value of v, the lower will be the autonomous expenditure multiplier.
Q-54 If an economy has a flat aggregate expenditure function, what would be the nature of the multiplier?

169
[MTP-Aug’2018,2 Marks]
Ans. The marginal propensity to consume (MPC) is the determinant of the value of the multiplier and thatthere exists a direct relationship between MPC and the value of multiplier. Higher the MPC, more willbe the value of the multiplier and vice-versa. A flat aggregate expenditure function implies lower MPCand higher MPS for all levels of income. Therefore, the value of multiplier will be small.
Q-55 Define multiplier. What is the range of values it can take? [RTP-May’19]
Ans. Multiplier expresses the relationship between an initial increment in investment and the resultingincrease in aggregate income i.e how many times the aggregate income increases as a result of anincrease in investment. The ratio of Y to I is called the investment multiplier, k. For example, if achange in investment of ` 2000 million causes a change in national income of ` 6000 million, then themultiplier is 6000/2000 = 3. Thus multiplier indicates the change in national income for each rupeechange in the desired investment. The value 3 in the above example tells us that for every Re. 1increase in desired investment expenditure, there will be ` 3 increase in equilibrium national income.The ratio of Y to I is called the investment multiplier, k.
Change in Income Yk =
Change in Investment I
The size of the multiplier effect is given by Y = k I.
The increase in income per rupee increase in investment is:
Y 1 1
= =I 1 - MPC MPS
From the above, we find that the marginal propensity to consume (MPC) is the determinant of thevalue of the multiplier and that there exists a direct relationship between MPC and the value ofmultiplier. Higher the MPC, more will be the value of the multiplier, and vice-versa. On the contrary,higher the MPS, lower will be the value of multiplier and vice-versa.
Since, 0<MPC<1; therefore,
if MPC is zero then K = 1 and if MPC = 1, then K=The maximum value of multiplier is infinity when the value of MPC is 1 i.e. the economy decides toconsume the whole of its additional income.
Q-56 (a) Calculate the Operating Surplus with the help of following data-
Particulars ` (In Crore)
Sales 4,000
Compensation to employees 800
Intermediate consumption 600
Rent 400
Interest 300
Net indirect taxes 500
Consumption of fixed capital 200
Mixed income 400
(b) Why do pensions and other security payments get excluded while calculating National Income?
[RTP-May’2020]

170
Ans.(a) GVAMP = Gross Value OutputMP – Intermediate consumption
= (Sales + change in stock) – Intermediate consumption
= 4000-600 = 3400 crore
GDPMP = GVAMP = 3400 crore
NDPMP = GDPMP – consumption of fixed capital
= 3400 – 200
= 3200 crore
NDPFC = NDPMP – NIT
= 3200 – 500
= 2700 crore
NDPFC = Compensation of employees + Operating surplus + Mixed income
2700 = 800 + Operating Surplus + 400
Operating surplus = 1500 crore
(b) GDP measures what is produced or created over the current time period and excludes all non-productiontransactions. Only incomes earned by owners of primary factors of production for services rendered inproduction are included in national income. Transfer payments, both private and government, aremade without goods or services being received in return. These payments do not correspond to returnfor contribution to production because they do not directly absorb resources or create output. Therefore,transfer incomes such as pensions and other social security payments are excluded from nationalincome.
Q-57 (a) Suppose you are given following information-
Consumption function C = 10 + 0.8Yd
Tax T = 50
Investment spending I = 135
Government Spending G = 60
Exports X = 35
Imports M = 0.05 Y
Where Y and Yd are income and personal disposable income respectively.
Find the equilibrium level of income and net exports. [RTP-May’2020]
(b) How are the following transactions treated in national income calculation? What is the rationale ineach case?
i. Electricity sold to a steel plant.
ii. Electric power sold to a consumer household.
iii. A car manufacturer procuring parts and components from the market.
iv. A computer producer buys a robot produced in the same country and uses it in production ofcomputers.
[RTP-May’2020]

171
Ans. Here,
C = 10 + 0.8Yd
= 10+0.8 (Y- 50)
Y = C+ I + G + (X - M)
= 10 + 0.8(Y- 50) + 135 + 60 + (35 – 0.05Y)
Y - 0.8Y + 0.05Y = 10 - 40 + 135 + 60 + 35
0.25Y = 200
Y = 800
Net Exports = (X- M) = 35 - 0.05Y
35 - 0.05 800 = - 5 .
Thus, Trade is in deficit.
(b) i Being an intermediate good, electricity sold to a steel plant will not be included in national incomecalculation. The underlying principle is that only finished goods and services which are directly sold tothe consumer for final consumption would be included.
ii. Electric power sold to a consumer household would be included in the calculation of GDP since it is afinal good consumed by the end user.
iii. The value of parts and components procured from the market by a car manufacturer will not be includedin national income calculation because these are intermediate goods used in car production.
iv. The value of the robot bought by a computer producer for use in the production of computers would beincluded in national income calculation because the computer producer is the “final consumer” of therobot and the robot is not resold in the market after value addition.
Q-58 Compute the amount of subsidies from the following data:
GDP at market price (` in crores) 7,79,567
Indirect Taxes (` in crores) 4,54,367
GDP at factor cost (` in crores) 3,60,815 [Sugg.-Nov’19,3 Marks]
Ans. Gross Domestic Product at Market Price (GDPMP) = Gross Domestic Product at Factor Cost (GDPFC) +(Indirect Taxes – Subsidies)
Subsidies = GDPFC + Indirect tax - GDPMP
= 360815 + 454367 – 779567
= ` 35,615 Crores
Q-59 The price index for exports of Bangladesh in the year 2018-19 (based on 2010-11) was 233.73 and theprice index for imports of it was 220.50 (based on 2010-11)
What do these figures mean ? [Sugg.-Nov’19,2 Marks]
Ans. The figures represent foreign trade price indices which are compiled using prices of specified group ofcommodities exported from and imported by Bangladesh in the year 2018-19. Both indices have a baseyear of 2010 -11 (=100) and the price changes are measured in relation to that figure. In the current year,the import price index of 220.50 indicates that there has been a 120.50 percent increase in price since2010-11 and export price index shows that there is 133.73 percent increase in export prices. Theseindices track the changes in the price which firms and countries receive / pay for products they export/import and can be used for assessing the impact of international trade on the domestic economy.

172
Q-60 Explain the circular flow of income in an economy. [Sugg.-Nov’19,3 Marks]
Ans. Circular flow of income refers to the continuous circulation of production, income generation andexpenditure involving different sectors of the economy. There are three different interlinked phasesin a circular flow of income, namely: production, distribution and disposition as can be seen from thefollowing figure”.
Circular Flow of Income
(i) In the production phase, firms produce goods and services with the help of factor services.
(ii) In the income or distribution phase, there is a flow of factor incomes in the form of rent, wages,interest and profits from firms to the households.
(iii) In the expenditure or disposition phase, the income received by different factors of production isspent on consumption goods and services and investment goods. This expenditure leads to furtherproduction of goods and services and sustains the circular flow.
It is clear from the figure that income is first generated in production unit, then it is distributed tohouseholds in the form of wages, rent, interest and profit. This increases the demand for goods andservices and as a result there is increase in consumption expenditure. This leads to further productionof goods and services and thus make the circular flow complete. These processes of production,distribution and disposition keep going on simultaneously.
Q-61 Compute NNP at factor cost or national income from the following data using income method
(` in crores)
Compensation of employees 3,000
Mixed income of self-employed 1,050
Indirect taxes 480
Subsidies 630
Depreciation 428

173
Rent 1,020
Interest 2,010
Profit 980
Net factor income from abroad 370
[Sugg.-Nov’19,3 Marks]
Ans. NNPFC or NI = Compensation of employees + Operating Surplus (rent + interest+ profit) + Mixed Incomeof Self- employed + Net Factor Income from Abroad
= 3,000+ (1,020+2,010+980) +1,050+370 = ̀ 8,430 Crores
174
CHAPTER-2PUBLIC FINANCE
Q-1 Define Social Good? What is the similarity and dissimilarity between Social Goods and Common
Pool Resources? [MTP- Oct’19,2 Marks]
Ans. A Social Good is defined as one which all enjoy in common in the sense that each individual’s consumptionof such a good leads to no subtraction from any other individuals consumption of that good. Similaritybetween Social Goods and Common Pool Resources is that both are nonexcludable whereas dissimilarityis seen in their nature that is Social Goods are non-rival which means that the use of these goods doesnot reduce the availability for others, while Common Pool Resources are rival in nature which meansthat the use of these resources reduce the availability for others.
Q-2 How does the government intervene to minimize market power? [MTP-March’19,5 Marks]
Ans. Market power is an important factor that contributes to inefficiency because it results in higher pricesthan competitive prices. In addition, market power also tends to restrict output and leads to deadweightloss. Because of the social costs imposed by monopoly, governments intervene by establishing rulesand regulations designed to promote competition and prohibit actions that are likely to restraincompetition. These legislations differ from country to country. For example, in India, we have theCompetition Act, 2002(as amended by the Competition (Amendment) Act, 2007) to promote and sustaincompetition in markets. Such legislations generally aim at prohibiting contracts, combinations andcollusions among producers or traders which are in restraint of trade and other anticompetitive actionssuch as predatory pricing. On the contrary, some of the regulatory responses of government to incentivefailure tend to create and protect monopoly positions of firms that have developed unique innovations.For example, patent and copyright laws grant exclusive rights of products or processes to provideincentives for invention and innovation. Policy options for limiting market power also include priceregulation in the form of setting maximum prices that firms can charge. Price regulation is most oftenused for natural monopolies that c an produce the entire output of the market at a cost that is lowerthan what it would be if there were several firms.
If a firm is a natural monopoly, it is more efficient to permit it serve the entire market rather than haveseveral firms who compete each other. Examples of such natural monopoly are electricity, gas andwater supplies. In some cases, the government‘s regulatory agency determines an acceptable price, soas to ensure a competitive or fair rate of return. This practice is called rate-ofreturn regulation. Anotherapproach to regulation is setting price-caps based on the firm’s variable costs, past prices, and possibleinflation and productivity growth.
Q-3 What is non- discretionary fiscal policy and how it occurs? [MTP-March’19,3 Marks]
Ans. Non-discretionary fiscal policy or automatic stabilizers are part of the structure of the economy and are‘built-in’ fiscal mechanisms that operate automatically to reduce the expansions and contractions ofthe business cycle. It occurs through automatic adjustments in government expenditures and taxeswithout any deliberate governmental action i.e. by limiting the increase in disposable income duringan expansionary phase and limiting the decrease in disposable income during the contraction phase ofthe business cycle.

175
Q-4 Describe rationale for the stabilisation function of government policy. [MTP-March’19,3 Marks]
Ans. Stabilization function is one of the key functions of fiscal policy and aims at eliminating macroeconomicfluctuations arising from suboptimal allocation. The stabilization function is concerned with theperformance of the aggregate economy in terms of labour employment and capital utilization, overalloutput and income, general price levels, economic growth and balance of international payments.Government’s stabilization intervention may be through monetary policy as well as fiscal policy.Monetary policy has a singular objective of controlling the size of money supply and interest rate in theeconomy, while fiscal policy aims at changing aggregate demand by suitable changes in governmentspending and taxes.
Q-5(i) What is the crux of Heckscher-Ohlin theory of International Trade
(ii) Define common resources? Why are they over used? [MTP-March’19,5Marks]
Ans. (i) The Heckscher-Ohlin theory of trade, also referred to as Factor-Endowment Theory of Trade orModern Theory of Trade, states that comparative advantage in cost of production is explained exclusivelyby the differences in factor endowments.
A country tends to specialize in the export of a commodity whose production requires intensive use ofits abundant resources and imports a commodity whose production requires intensive use of its scarceresources.
Accordingly, a capital abundant country will produce and export capital intensive goods relativelymore cheaply and a labour-abundant country will produce and export labour intensive goods relativelymore cheaply than another country.
(ii) Common access resources or common pool resources are a special class of impure public goodswhich are non-excludable as people cannot be excluded from using them. These are rival in nature andtheir consumption lessens the benefits available for others. This rival nature of common resources iswhat distinguishes them from pure public goods, which exhibit both non-excludability and non-rivalryin consumption. They are generally available free of charge.
Some important natural resources fall into this category.
Examples of common access resources are fisheries, common pastures, rivers, sea, backwatersbiodiversity etc. The earth’s atmosphere is perhaps the best example. Emissions of carbon dioxide andother greenhouse gases have led to the depletion of the ozone layer endangering environmentalsustainability. Although nations are aware of the fact that reduced global warming would benefiteveryone, they have an incentive to free ride, with the result that nothing positive is likely to be doneto correct the problem.
Q-6 Explain the term Contractionary Fiscal Policy. What are the measures under taken in a contractionaryfiscal policy? [MTP-March’19,3 Marks]
Ans. When aggregate demand rises beyond what the economy can potentially produce by fully employingits given resources; it gives rise to inflationary pressures in the economy. The aggregate demand mayrise due to large increase in consumption demand by households or investment expenditure byentrepreneurs, or government expenditure. In these circumstances inflationary gap occurs which tendsto bring about rise in prices. Under such circumstances, a contractionary fiscal policy will have to beused.
Contractionary fiscal policy refers to the deliberate policy of government applied to curtail aggregatedemand and consequently the level of economic activity. In other words, it is fiscal policy aimed ateliminating an inflationary gap. This is achieved by adopting policy measures that would result in theaggregate demand curve (AD) shift the to the left so the equilibrium may be established at the fullemployment level of real GDP.

176
This can be achieved either by:
• Decrease in government spending.
• Increase in personal income taxes and/or business taxes.
• A combination of decrease in government spending and increase in personal income taxes and/or business taxes.
Q-7 Explain why government imposes price ceilings [MTP-March’19,3 Marks]
Ans. When prices of certain essential commodities rise excessively, government may resort to controls inthe form of price ceilings (also called maximum price) for making a resource or commodity available toall at reasonable prices. For example: maximum prices of food grains and essential items are set bygovernment during times of scarcity. A price ceiling which is set below the prevailing market clearingprice will generate excess demand over supply.
With the objective of ensuring stability in prices and distribution, governments often intervene ingrain markets through building and maintenance of buffer stocks. It involves purchases from the marketduring good harvest and releasing stocks during periods when production is below average.
Q-8 Explain the term on market failure. [MTP-March’19,2 Marks]
Ans. Market failure is a situation in which the free market fails to allocate resources efficiently in the sensethat there is either overproduction or underproduction of particular goods and services leading to lessthan optimal market outcomes.
Q-9 Define Externalities? Given example of each type of externalities. [MTP-March’19,3 Marks]
Ans. Externalities, also referred to as ‘spillover effects’, ‘neighbourhood effects’ ‘third -party effects’ or‘side-effects’, occur when the actions of either consumers or producers result in costs or benefits thatdo not reflect as part of the market price. Externalities cause market inefficiencies because they hinderthe ability of market prices to convey accurate information about how much to produce and how muchto buy. Since externalities are not reflected in market prices, they can be a source of economicinefficiency. Externalities can be positive or negative. Negative externalities occur when the action ofone party imposes costs on another party. Positive externalities occur when the action of one partyconfers benefits on another party. The four possible types of externalities are negative externalityinitiated in production which imposes an external cost on others, positive production externality,example A firm which offers training to its employees for increasing their skills. The firm generatespositive benefits on other firms when they hire such workers as they change their jobs. Anotherexample is the case of a beekeeper who locates beehives in an orange growing area enhancing thechances of greater production of oranges through increased pollinati on less commonly seen, initiatedin production that confers external benefits on others. Negative Production Externality example whena factory which produces aluminum discharges untreated waste water into a nearby river and pollutesthe water causing health hazards for people who use the water for drinking and bathing. Pollution ofriver also affects fish output as there will be less catch for fishermen due to loss of fish resources.Negative consumption externalities initiated in consumption which produce external costs on othersfor example Smoking cigarettes in public place causing passive smoking by others, creating litter anddiminishing the aesthetic value of the room and playing the radio loudly obstructing one from enjoyinga concert. Positive consumption externality initiated in consumption that confers external benefits onothers for example, consumption of the services of a health club by the employees of a firm wouldresult in an external benefit to the firm in the form of increased efficiency and productivity.
Q-10 You are the Finance Minister of India. You find that the country is passing through recession. As FinanceMinister what suggestions will you make to the Government of India to bring the country out of recession.Justify your answer. [MTP-March’19,5 Marks]
177
Ans. A recession is said to occur when overall economic activity declines or in other words, when theeconomy contracts. As a Finance Minister it is my responsibility to frame / suggest fiscal policy for thecountry at the time of recession or inflation so as to take the country out of it.
Fiscal policy involves the use of government spending, taxation and borrowing to infl uence both thepattern of economic activity and level of growth of aggregate demand, output and employment.
Fiscal measures could be discretionary and non-discretionary.
During recession, the government has to use discretionary fiscal policies. Discretionary fiscal policyrefers to deliberate policy actions on the part of the government to change the levels of expenditureand taxes to influence the level of national output, employment and prices. Since GDP = C + I + G + NX,governments can influence economic activity (GDP), by controlling G (Government Expenditure) directlyand influencing C(Private Consumption), I(Private Investment), and NX (Net Exports) indirectly, throughchanges in taxes, transfer payments and expenditure.During a recession as a part of government I may initiate a fresh wave of public works. These willinvolve employment of labour as well as purchase of multitude of goods and services. Theseexpenditures directly generate incomes to labour and suppliers of material and services. Apart fromthis, there is also indirect effect in the form of working of multiplier.Besides this, as a finance minister, I may reduce corporate and personal income tax to overcomecontractionarily tendencies in the economy. A tax cut increases disposable income of households.Their inclination to spend a portion of additional disposable income determined by their marginalpropensity to consumer and multiplier effect of spending would set out a chain reaction of spending,increased income and consequent increases output. Moreover, these can provide firms and householdsincentives to engage in investment.
Q-11 Define ‘moral hazard’. [MTP-March’18,2 Marks]Ans. Moral hazard is associated with information failure and refers to a situation that increases the probability
of occurrence of a loss or a larger than normal loss, because of a change in the unobservable or hard toobserve behaviour of one of the parties in the transaction after the transaction has been made. Moralhazard is opportunism characterized by an informed person’s taking advantage of a less-informedperson through an unobserved action. It arises from lack of information about someone’s futurebehaviour. Moral hazard occurs due to asymmetric information i.e., an individual knows more abouthis or her own actions than other people do. This leads to a distortion of incentives to take care or toexert effort when someone else bears the costs of the lack of care or effort. For example, in theinsurance market, the expected loss from an adverse event increases as insurance coverage increases.
Q-12 Suppose a fertilizer plant dumps effluents into a river, why is it called an externality?
[MTP-April’18,3 Marks]
Ans: When a fertilizer plant dumps effluents into a river, there is negative externality because it adverselyaffects the quality of water and reduces the welfare of the people who use it. The users of pollutedwater are third parties and are not in any way connected with the economic transactions that takeplace within the fertilizer factory. The fertilizer producer does not bear the true cost of wastewater tothe society and the fertilizer prices do not include the costs borne by these third parties. Therefore,the fertilizer producer will have an incentive to produce too much effluents. The price of fertilizerwhich is equal to the marginal cost of production will be lower than what it would be if the cost ofproduction reflected the effluent cost also.
Q-13 Suggest reasons why education and health care might be considered as merit goods to be provided bygovernment? [MTP-April’18,5 Marks]
Ans: The positive externality argument provides justification for government participation in educationand healthcare provision. Positive externalities arise when an external benefit is generated by the

178
producer of a good or service, but the producer cannot get compensated for producing this extrabenefit because of the absence of a market for the externality. The market price of the good or servicewill not reflect its accurate worth and markets will produce less than optimal quantity.
Healthcare and education, especially in developing countries, are very important considering theirability to improve the quality of human capital. An educated workforce is an asset to the society.Education increases not only the productivity of the person being educated but also the productivity ofhis co-workers. Education increases community engagement and contributes to the formation of astable and democratic society. Similarly, there are productivity spillovers from health.These are meritgoods which are considered socially desirable and beneficial to society irrespective of the preferencesof consumers and therefore government deems that their consumption should be encouraged. Incontrast to pure public goods, merit goods are rival, excludable, limited in supply,rejectable by thoseunwilling to pay, and involve positive marginal cost for supplying to extra users. Scarcity of resources indeveloping countries and lack of information and awareness regarding the positive benefits of theseservices may discourage people from making investment decisions to incur costs today for benefitsreceived in the future. Consequently, sufficient market demand for these services may not beforthcoming at a market determined price.
Substantial positive externalities are involved in the consumption of merit goods such as educationand healthcare. The greater reliance on private delivery of health infrastructure and health servicestherefore means that overall these will be socially underprovided by private agents. Adequate accessmay also be denied to the poor who lack ability to pay. This in turn has undesirable outcomes not onlyfor the affected population but for society as a whole. It adversely affects current social welfare andlabour productivity, and of course harms future growth and development prospects.
Healthcare and education can be provided through market, but these are likely to be under - producedand under-consumed through the market mechanism so that social welfare will not be maximized. Leftto market, only private benefits and private costs would be reflected in the price paid by consumers.This means, compared to what is socially desirable, people would consume inadequate quantities. Thefollowing diagram will show the market outcome for merit goods.
Market Outcome for Merit Goods
In the absence of government intervention, the output of the healthcare and education would bewhere the marginal private cost (MPC) is equal to marginal private benefit (MPB). The welfare loss tothe society due to under production and under consumption is the shaded area (ABC). On account of

179
considerable positive externalities, the optimal output is Q* at which marginal social (MSC) cost isequal to marginal social benefit (MSB). These arguments support a strong case for governmentintervention in the case healthcare and education.
The additional reasons for government provision of these merit goods are:
• Information failure is widely prevalent with merit goods and therefore individuals may not act intheir best interest because of imperfect information.
• Equity considerations demand that merit goods such as health and education should be providedfree on the basis of need rather than on the basis of individual’s ability to pay.
• There is a lot of uncertainty as to the need for merit goods E.g. health care. Due to uncertaintyabout the nature and timing of healthcare required in future, individuals may be unable to plantheir expenditure and save for their future medical requirements. The market is unlikely toprovide the optimal quantity of health care when consumers actually need it, because they maybe short of the necessary finances to pay the market price.
The possible government responses to under-provision of merit goods are regulation, subsidies,direct government provision and a combination of government provision and market provision.Regulation determines how a private activity may be conducted. For example, the way in whicheducation is to be imparted is government regulated. Governments can set standards and issuemandates making others oblige. Compulsory immunization may be insisted upon as it helps notonly the individual but also the society at large. Government could also use legislation to enforceconsumption of a good which generates positive externalities. The Right of Children to Free andCompulsory Education Act, 2009 which mandates free and compulsory education for every childof the age of six to fourteen years is another example. A variety of regulatory mechanisms mayalso be set up by government to enhance consumption of merit goods and to ensure their quality.
When governments provide these merit goods, apart from generating substantial positiveexternalities it may give rise to large economies of scale and productive efficiency.
When merit goods are directly provided free of cost by government, there will be substantial demandfor the same. As can be seen from the following diagram, when people are required to pay the freemarket price, people would consume only OQ quantity of healthcare. If provided free at zero prices orat prices lower than market determined prices, the demand OD far exceeds supply.
Q-14 Why is it difficult for the government to determine the optimal quantity of a public good?
[MTP-April’18,2 Marks]
Ans. It is difficult for the government to determine the optimal quantity of a public good becauseconsumerpreferences for these goods are not revealed in the market and a price cannot be charged since theyare nonrival and non-excludable in consumption and are characterized by indivisibility.

180
Q-15 What is the rationale for government intervention in allocation of resources?
[MTP-April’18,3 Marks]
Ans. The allocation responsibility of the governments involves suitable corrective action when privatemarkets fail to provide the right and desirable combination of goods and services to ensure socialwelfare. In the absence of appropriate government intervention, market failures may occur and theresources are likely to be misallocated by too much production of certain goods or too little productionof certain other goods. Thus, market failures provide the rationale for gover nment’s allocative function.
Q-16 Classify each of the following goods based on their characteristics. Mention the rationale.
(i) Open-access Wi-Fi networks
(ii) Roads with toll booths
(iii) Parks [MTP-Aug’18,3 Marks]
Ans. All the goods mentioned above can be classified as impure public good. There are many hybrid goodsthat possess some features of both public and private goods. These goods are called impure publicgoods and are partially rivalrous or congestible. Because of the possibility of congestion, the benefitthat an individual gets from an impure public good depends on the number of use rs.
Consumption of these goods by another person reduces, but does not eliminate, the benefits thatother people receive from their consumption of the same good. Impure public goods also differ frompure public goods in that they are often excludable.
Since free riding can be eliminated, the impure public good may be provided either by the market or bythe government at a price or fee. If the consumption of a good can be excluded, then the market wouldprovide a price mechanism for it. The provider of an impure public good may be able to control thedegree of congestion either by regulating the number of people who may use it, or the frequency withwhich it may be used or both.
Q-17 Distinguish between ‘pump priming’ and ‘compensatory spending’ [MTP-Aug’18,3 Marks]
Ans. A distinction is made between the two concepts of public spending during depression, namely, theconcept of ‘pump priming’ and the concept of ‘compensatory spending’. Pump priming involves a one-shot injection of government expenditure into a depressed economy with the aim of boosting businessconfidence and encouraging larger private investment. It is a temporary fiscal stimulus in order to setoff the multiplier process. The argument is that with a temporary injection of purchasing power intothe economy through a rise in government spending financed by borrowing rather than taxes, it ispossible for government to bring about permanent recovery from a slump. Pump priming was widelyused by governments in the post-war era in order to maintain full employment; however, it becamediscredited later when it failed to halt rising unemployment and was held responsible for inflation.Compensatory spending is said to be resorted to when the government spending is deliberately carriedout with the obvious intention to compensate for the deficiency in private investment.
Q-18 Define information failure [MTP-Oct’18,3 Marks]
Ans. Perfect information which implies that both buyers and sellers have complete information aboutanything that may influence their decision making is an important element of an efficient competitivemarket. Information failure occurs when lack of information can result in consumers and producersmaking decisions that do not maximize welfare. Information failure is widespread in numerous marketexchanges due to complex nature of goods and services that are transacted, inaccurate and incompletedata, and non-availability of correct information.
Q-19 Explain the concept of adverse selection. What are the possible consequences of adverse selection?
[MTP-Oct’18,3 Marks]
181
Ans. Adverse selection is a situation in which asymmetric information about quality eliminates highqualitygoods from a market. It a form of market failure which occurs when buyers have better informationthan sellers due to hidden information, and this can distort the usual market process. For example, inthe insurance market adverse selection is the tendency for people with higher risk to obtain insurancecoverage to a greater extent than persons with lesser risk because compared to insurance buyers,insurers know less about the health conditions of buyers and are therefore unable to differentiatebetween high-risk and low-risk persons. If the insurance company charges an average price, and onlyhigh-risk consumers buy insurance it will make losses. It is therefore possible that there will be higheroverall premium as firms insure themselves against high-risk customers buying insurance. Then thelow-risk customers may not want to buy insurance because it is quite expensive. Economic agents endup either selecting a sub-standard product or leaving the market altogether leading to a condition of‘missing market’. If the sellers wish to do business profitably, they may have to incur considerablecosts in terms of time and money for identifying the extent of risk for different buyers.
Q-20 How can the government influence the resource allocation in an economy? [RTP- Nov’19]
Ans A variety of allocation instruments are available by which governments can influence resource allocationin the economy. They are -
i. government may directly produce the economic good (for example, electricity andpublictransportation services)
ii government may influence private allocation through incentives and disincentives (forexample,tax concessions and subsidies may be given for the production of goods that promote socialwelfare and higher taxes may be imposed on goods such as cigarettes and alcohol)
iii. government may influence allocation through its competition policies, merger policiesetc. whichwill affect the structure of industry and commerce (for example, theCompetition Act in Indiapromotes competition and prevents anti-competitiveactivities).
vi. governments’ regulatory activities such as licensing, controls, minimum wages, anddirectives onlocation of industry influence resource allocation.
v. government sets legal and administrative frameworks, and
vi. any of a mixture of intermediate techniques may be adopted by governments
Q-21 When price of certain essential goods rises excessively, how does the government intervene to controlthe price? Explain with the help of an example and with suitable diagram. [RTP- Nov’19]
Ans When prices of certain essential commodities rise excessively, government may resort to control inthe form of price ceilings (also called maximum price) for making a resource or commodity available toall at reasonable prices. For example: maximum prices of food grains and essential items are set bygovernment during times of scarcity. A price ceiling which is set below the prevailing market clearingprice will generate excess demand over supply. (The students should draw the diagram in support oftheir answers)
With the objective of ensuring stability in prices and distribution, governments often intervene ingrain markets through building and maintenance of buffer stocks. It involves purchases from the marketduring good harvest and releasing stocks during periods when production is below average.
Q-22 Is cable television an example of impure public good? Verify your answer. [RTP- Nov’19]
Ans Yes, cable television is an example of impure public good. Impure public goods only partially satisfytwo characteristics of public goods namely, non-rivalry in consumption and non-excludability. Cabletelevision is non-rivalrous because the use of cable television by other individuals will in no wayreduce your enjoyment of it. The good is excludable since the cable TV service providers can refuseconnection if you do not pay for set top box and recharge it regularly.
182
Q-23 Is production of steel a demerit good? Give reason. [RTP- Nov’19]
Ans Demerits goods are those goods which are believed to be socially undesirable. The consumption ofthese goods imposes significant negative externalities on the society as a whole.
No. The production of steel is not essentially a demerit good. Though it causes pollution and havenegative externalities, it is not a socially undesirable good.
Q-24 What is the major determinant of the economic functions of a government? [RTP-May’19]
Ans. The nature of the economic system determines the size and scope of the economic functions of thegovernment. In a centrally planned socialistic economy, the state owns all productive resources andmakes all important economic decisions. On the contrary, in a market economy, all important economicdecisions are made by individuals and firms who want to maximise self interest and there is onlylimited role for the government. In a mixed economic system, both markets and government contributetowards resource allocation decisions.
Q-25 Distinguish between private cost and social cost. [RTP-May’19]
Ans. Private cost is the cost faced by the producer or consumer directly involved in a transaction. If we takethe case of a producer, his private cost includes direct cost of labour, materials, energy and otherindirect overheads. These are usually added up to determine market price. The actions of consumersor producers result in costs or benefits to others and the relevant costs and benefits are not reflectedas part of market prices. In other words, market prices do not incorporate externalities. Social costsrefer to the total costs to the society on account of a production or consumption activity. Social costsare private costs borne by individuals directly involved in a transaction together with the externalcosts borne by third parties not directly involved in the transaction. Social costs represent the trueburdens carried by society in monetary and non-monetary terms.
Q-26 Describe the term ‘Tragedy of commons’.
Ans. Common access resources such as oceans tend to be over-consumed in an unregulated market becausethey are rivalrous and non-excludable in consumption.
`Tragedy of the commons’ is a term to describe the problem which occurs when rivalrous but non-excludable goods are overused by individual users acting independently and rationally according totheir own self-interest. In doing so, they behave contrary to the common good of all users by depletinga shared common resource to the disadvantage of the entire universe.
Q-27 Why do you consider national defence as a public good? [RTP- May’19]
Ans. National defence has all characteristics of a public good. It yields utility to people; its consumption isessentially nonrival, non-excludable and collective in nature and is characterized by indivisibility.National defence is available for all individuals whether they pay taxes or not and it is impossible toexclude anyone within the country from consuming and benefiting from it. No direct payment by theconsumer is involved in the case of defence. Once it is provided, the additional resource cost ofanother person consuming it is zero. Defence also has the unique feature of public good i.e. it does notconform to the settings of market exchange. Though defence is extremely valuable for the wellbeingof the society, left to market, it will not be produced at all or will be under produced.
Q-28 Define information failure. [RTP- May’19]
Ans. Perfect information which implies that both buyers and sellers have complete information aboutanything that may influence their decision making is an important element of an efficient competitivemarket. Information failure occurs when lack of information can result in consumers and producersmaking decisions that do not maximize welfare. Information failure is widespread in numerous marketexchanges due to complex nature of goods and services that are transacted, inaccurate and incompletedata, and non-availability of correct information

183
Q-29 What should be the public revenue and expenditure policy during recession? [RTP-Nov’18]
Ans. Government’s fiscal policy for stabilization purposes attempts to direct the actions of individuals andorganizations by means of its expenditure and taxation decisions.
During recession, an expansionary fiscal policy is resorted to by government through increased aggregatespending to compensate for the deficiency in effective demand.
Increased government expenditure (for example on building infrastructure) injects more money intothe economy, initiate a series of productive activities, stimulates overall economic activities,employment and demand.
Production decisions, investments, savings etc can be influenced by government’s tax policies. Duringrecession, the government’s tax policy is framed to encourage private consumption and investment. Ageneral reduction in income taxes leaves higher disposable incomes with people inducing higherconsumption. Low corporate taxes increase the prospects of profits for business and promote furtherinvestment.
Q-30 Explain the different types of externalities? How do externalities lead to welfare lossof markets?
[RTP-Nov’18]
Ans. Externalities, also referred to as ‘spillover effects’, ‘neighbourhood effects’ ‘third-party effects’ or‘side-effects’, occur when the actions of either consumers or producers result in costs or benefits thatdo not reflect as part of the market price. Externalities cause market inefficiencies because they hinderthe ability of market prices to convey accurate information about how much to produce and how muchto buy. Since externalities are not reflected in market prices, they can be a source of economicinefficiency. Externalities are initiated and experienced, not through the operation of the price system,but outside the market and therefore are external to the market.Externalities may be positive or negative or may be unidirectional or reciprocal.Negative externalities occur when the action of one party imposes costs on another party. Positiveexternalities occur when the action of one party confers benefits on another party. The four possibletypes of externalities are(i) negative externality initiated in production which imposes an external cost on others.(ii) positive production externality, less commonly seen, initiated in production thatconfers external
benefits on others,(iii) negative consumption externalities initiated in consumption which produce external costs on
others.(iv) positive consumption externality initiated in consumption that confers external benefits on others.
Each of the above may be received by another in consumption or in production. The firm or theconsumer as the case may be, however, has no incentive to account for the external costs that itimposes on consumers.
How negative externalities lead to welfare loss of markets may be explained with the help of thefollowing diagram
Q-31 Fiscal policy plays a significant role in reducing inequality and achieving equity and social justice. Doyou agree? Substantiate your answer with examples. [RTP-Nov’18]
Ans. Many developed and developing economies are facing the challenge of rising inequality in incomesand opportunities. Fiscal policy is a chief instrument available to governments to influence incomedistribution and plays a significant role in reducing inequality and achieving equity and social justice.The distribution of income in the society is influenced by fiscal policy both directly and indirectly.While current disposable incomes of individuals and corporates are dependent on direct taxes, thepotential for future earnings is indirectly influenced by the nation’s fiscal policy choices.
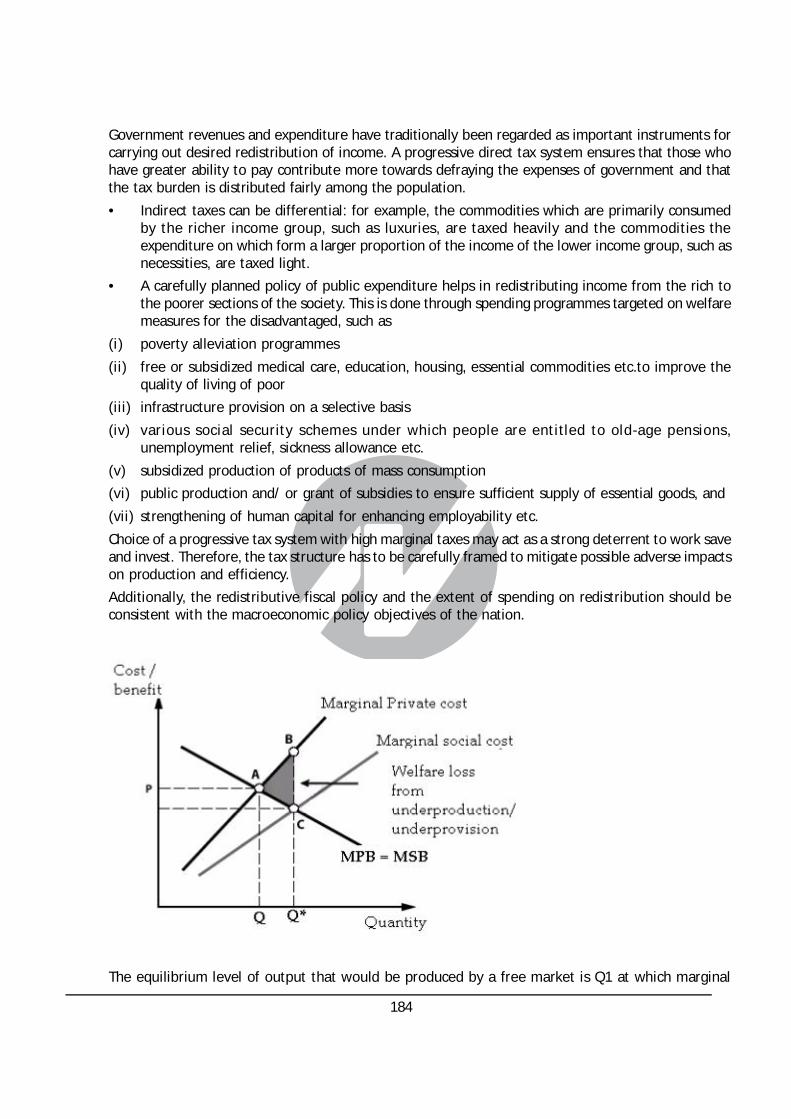
184
Government revenues and expenditure have traditionally been regarded as important instruments forcarrying out desired redistribution of income. A progressive direct tax system ensures that those whohave greater ability to pay contribute more towards defraying the expenses of government and thatthe tax burden is distributed fairly among the population.
• Indirect taxes can be differential: for example, the commodities which are primarily consumedby the richer income group, such as luxuries, are taxed heavily and the commodities theexpenditure on which form a larger proportion of the income of the lower income group, such asnecessities, are taxed light.
• A carefully planned policy of public expenditure helps in redistributing income from the rich tothe poorer sections of the society. This is done through spending programmes targeted on welfaremeasures for the disadvantaged, such as
(i) poverty alleviation programmes
(ii) free or subsidized medical care, education, housing, essential commodities etc.to improve thequality of living of poor
(iii) infrastructure provision on a selective basis
(iv) various social security schemes under which people are entitled to old-age pensions,unemployment relief, sickness allowance etc.
(v) subsidized production of products of mass consumption
(vi) public production and/ or grant of subsidies to ensure sufficient supply of essential goods, and
(vii) strengthening of human capital for enhancing employability etc.
Choice of a progressive tax system with high marginal taxes may act as a strong deterrent to work saveand invest. Therefore, the tax structure has to be carefully framed to mitigate possible adverse impactson production and efficiency.
Additionally, the redistributive fiscal policy and the extent of spending on redistribution should beconsistent with the macroeconomic policy objectives of the nation.
The equilibrium level of output that would be produced by a free market is Q1 at which marginal

185
private benefit (MPB) is equal to marginal private cost (MPC). Marginal social cost (MSC) representsthe full or true cost to the society of producing another unit of a good. It includes marginal private cost(MPC) and marginal social cost (MSC). Assuming that there are no externalities arising from consumption,we can see that marginal social cost (Q1S) is higher than marginal private cost (Q1E). Social efficiencyoccurs at Q2 level of output where marginal social cost is equal to marginal social benefit. Output Q1 issocially inefficient because at Q1, the marginal social cost is greater than the marginal social benefitand represents over production. The shaded triangle represents the area of dead weight welfare loss.It indicates the area of overconsumption. Thus, we conclude that when there is negative externality, acompetitive market will produce too much output relative to the social optimum. This is a clear case ofmarket failure where prices fail to provide the correct signals.
When there is a positive externality, the actual output is lower than the optimal one at which marginalsocial (MSC) cost is equal to marginal social benefit (MSB). There is a welfare loss to the society due tounder production and under consumption. This is a strong case for government intervention in thecase of such goods.
Q-32 Define the concept of market failure. Describe the different sources of market failure. [RTP -May’18]
Ans. Market failure is a situation in which the free market fails to allocate resources efficiently in the sensethat there is either overproduction or underproduction of particular goods and services leading to lessthan optimal market outcomes. The reason for market failure lies in the fact that though perfectlycompetitive markets work efficiently, most often the prerequisites of competition are unlikely to bepresent in an economy. There are two aspects of market failures namely, demand-side market failuresand supply side market failures. Demand-side market failures are said to occur when the demandcurves do not take into account the full willingness of consumers to pay for a product. Supply-sidemarket failures happen when supply curves do not incorporate the full cost of producing the product.
There are four major reasons for market failure. They are: market power, externalities, public goods,and incomplete information.
(1) Excess market power or monopoly power causes the single producer or small number of producersto produce and sell less output than would be produced in a competitive market and to chargehigher prices that give them positive economic profits.
(2) Externalities, also referred to as ‘spillover effects’, ‘neighbourhood effects’ ‘thirdparty effects’or ‘side-effects’, occur when the actions of either consumers or producers result in costs or benefitsthat do not reflect as part of the market price. Externalities cause market inefficiencies becausethey hinder the ability of market prices to convey accurate information about how much to produceand how much to buy.
(3) Public goods (also referred to as a collective consumption good or a social good) are indivisiblegoods which all individuals enjoy in common and are non excludable and non rival in consumption.Each individual’s consumption of such a good leads to no subtraction from any other individual’sconsumption and consumers cannot (at least at less than prohibitive cost) be excluded fromconsumption benefits of that good. Public goods do not conform to the settings of market exchangeand left to the market, they will not be produced at all or will be under produced.
(4) Incomplete information: The assumption of complete information which is a feature of competitivemarkets is not fully satisfied in real markets due to highly complex nature of products and services,inability of consumers to quickly /cheaply find sufficient information, inaccurate or incompletedata, ignorance,lack of alertness and uncertainty about true costs and benefits. Misallocation ofscarce resources occurs due to information failure and equilibrium price and quantity is notestablished through price mechanism. Asymmetric information also referred to as the `lemonsproblem’ which occurs when there is an imbalance in information between buyer and seller i.e.

186
when the buyer knows more than the seller or the seller knows more than the buyer also distortchoices and cause market failure. Adverse selection, another source of market failure, is a situationin which asymmetric information about quality eliminates highquality goods from a market. Moralhazard i.e. opportunism characterized by an informed person’s taking advantage of a less-informedperson through an unobserved action arises from lack of information about someone’s futurebehavior also causes market failure. In short, asymmetric information, adverse selection andmoral hazard affect the ability of markets to efficiently allocate resources and therefore lead tomarket failure because the party with better information has a competitive advantage.
Q-33 Identify the market outcomes for each of the following situationsi. A few youngsters play loud music at night. Neighbours may not be able to sleep.ii. Ram buys a large SUV which is very heavyiii. X smokes in a public place.iv. Rural school students are given vaccination against measles.v. Traffic congestion making travel very uncomfortable. [RTP -May’18]
Ans. The market outcomes of different situations are given below;
(i) Negative consumption externality; social cost not accounted for; market failure;overproduction
(ii) Negative consumption externality; environmental externality; wear and tear ofroads; increasedfuel consumption; added insecurity imposed on others; social cost not accounted for;overproduction.
(iii) Negative consumption externality; overproduction.
(iv) Public good, merit good; positive consumption externality; under production; scope forgovernment intervention.
(v) Negative externality; social cost not accounted for; overproduction.
Q-34 Examine what types of fiscal policy measures are useful for redistribution of income in an economy? [RTP -May’18]
Ans. Many developed and developing economies are facing the challenge of rising inequality in incomesand opportunities. Redistribution of income to ensure distributive justice is essentially a fiscal function.Fiscal policy is a chief instrument available for governments to influence income distribution and playsa significant role in reducing inequality and achieving equity and social justice. The distribution ofincome in the society is influenced by fiscal policy both directly and indirectly. While current disposableincomes of individuals and corporates are dependent on direct taxes, the potential for future earningsis indirectly influenced by the nation’s fiscal policy choices.
Government revenues and expenditure have traditionally been regarded as important instruments forcarrying out desired redistribution of income. Each of these can be manipulated to achieve desireddistributional effects.
• A progressive direct tax system appropriately designed to protect incentives ensures that thosewho have greater ability to pay contribute more towards defraying the expenses of governmentand that the tax burden is distributed fairly among the population.
• Indirect taxes can be differential: for example, the commodities which are primarily consumedby the richer income group, such as luxuries, are taxed heavily and the commodities theexpenditure on which form a larger proportion of the income of the lower income group, such asnecessities, are taxed light. Property taxes act both as a source of revenue and as an efficientredistributive instrument.
• A carefully planned policy of public expenditure helps in redistributing income fromthe rich to
187
the poorer sections of the society. This is done through spendingprogrammes targeted on welfaremeasures for the disadvantaged, such as :
(i) poverty alleviation programmes
(ii) free or subsidized medical care, education, housing, essential commodities etc.to improve thequality of living of poor
(iii) infrastructure provision on a selective basis
(iv) various social security schemes and more efficient social transfers under which people are entitledto noncontributory, means-tested social pensions, conditional cash transfer programs,unemployment relief, sickness allowance etc.
(v) subsidized production of products of mass consumption
(vi) public production and/ or grant of subsidies to ensure sufficient supply of essential goods, and
(vii) strengthening of human capital for enhancing employability etc.
The design of redistribution policies should justify both redistributive and efficiency objectives.Choice of a progressive tax system with high marginal taxes may act as a strong deterrent to work,save and invest. Therefore, the tax structure has to be carefully framed to mitigate possibleadverse impacts on production and efficiency. Additionally, the redistributive fiscal policy andthe extent of spending on redistribution should be consistent with the macroeconomic policyobjectives, especially macroeconomic stability of the nation.
Q-35 Analyse what should be the tax policy during recession and depression? [RTP -May’18]
Ans. A recession is said to occur when overall economic activity declines, or in other words, when theeconomy ‘contracts’. A recession sets in with a period of declining real income, as measured by realGDP, simultaneously with a situation of rising unemployment. If an economy experiences a fall inaggregate demand during a recession, it is said to be in a demand-deficient recession. Economicdepression is a condition of the economy resulting from an extended period of negative economicactivity as measured by GDP. It is an extremely severe form of recession that leads to extendedunemployment, increased credit defaults, extensive decline in output and income and a deflationaryeconomy.
Taxation, though less effective compared to public expenditure, is a powerful instrument of fiscalpolicy in the hands of governments to combat recession and depression. Reduction in corporate andpersonal income taxation is a useful measure to overcome contractionary tendencies in the economy.A tax cut increases disposable incomes of households. Their inclination to spend a portion of theadditional disposable income determined by their marginal propensity to consume and the multipliereffect of spending would set out a chain reaction of spending, increased incomes, and consequentincreased output. Reduction in the rates of commodity taxes like excise duties, sales tax and importduty promote consumption and ultimately boost investments. Moreover, tax measures can provideincentives, or reduce disincentives, for firms and households to engage in investment and consumerspending.
Q-36 Explain the term quasi-public goods. [RTP -May’18]
Ans. Quasi-public goods or services, also called a near public good (for e.g. education, health services)possess nearly all the qualities of private goods and some of the benefits of public good. These goodsare, in some measure excludable for example, it is possible to exclude non paying consumers from theuse of a highway by incurring the cost of building and maintaining a toll booth. Similarly beaches, parksand wifi networks become partially rival and partially diminishable at times of peak demand.
These are rejectable to some extent. It is possible to keep people away from them by charging a price

188
or fee. However, it is undesirable to keep people away from such goods because the society would bebetter off if more people consume them. This particular characteristic namely, the combination ofvirtually infinite benefits and the ability to charge a price results in some quasi-public goods being soldthrough markets and others being provided by government. As such, people argue that these shouldnot be left to the market alone. Markets for the quasi-public goods are considered to be incompletemarkets and their lack of provision by free markets would be considered as inefficiency and marketfailure.
Q-37 Define ‘Market power’. What is its disadvantage? [Sugg.-May’19,2 Marks]
Ans. Market power is the ability of a price making firm to profitably raise the market price of a good orservice over its marginal cost and thus earn supernormal profits or positive economic profits.
Market power is an important cause of market failure. Market failure occurs when the free marketoutcomes do not maximize net benefits of an economic activity and therefore there is deadweightlosses and inefficient allocation of resources. Excess market power causes a single producer or a smallnumber of producers to strategically reduce their supply and charge higher prices compared tocompetitive market. Market power can cause markets to be inefficient because it keeps price andoutput away from the equilibrium of supply and demand. Market power thus results in suboptimaloutcomes such as deadweight loss, underproduction of goods and services, higher prices and loss ofconsumer surplus.
Q-38 Why is there a need for the government to resort to resource allocation ? [Sugg.-May’19,3 Marks]
Ans. Market failures provide the rationale for government’s allocative function. Market failures are situationsin which a particular market, left to itself, is inefficient and leads to misallocation of society’s scarceresources. In the absence of appropriate government intervention in resource allocation, the resourcesare likely to be misallocated with too much production of certain goods or too little production ofcertain other goods. The allocation responsibility of the governments involves suitable correctiveaction when private markets fail to provide the right and desirable combination of goods and servicesto ensure optimal outcomes in terms of social welfare.
Q-39 What is meant by expansionary fiscal policy? Under what circumstances do government pursueexpansionary policy? [Ssgg.-May’19,3 Marks]
Ans. An expansionary fiscal policy is designed to stimulate the economy during the contractionary phase ofa business cycle or when there is an anticipation of a business cycle contraction. This is accomplishedby increasing aggregate expenditure and aggregate demand through an increase in all types ofgovernment spending and / or a decrease in taxes.
The objectives of expansionary fiscal policy are reduction in cyclical unemployment, increase in consumerdemand and prevention of recession and possible depression. In other words, it aims to close a‘recessionary gap’ or a contractionary gap wherein the aggregate demand is not sufficient to createconditions of full employment. This is accomplished by increasing aggregate expenditure and aggregatedemand through an increase in all types of government spending and / or a decrease in taxes.Government uses subsidies, transfer payments, welfare programmes, corporate and personal incometax cuts and increased spending on public works such as on infrastructure development to put moremoney into consumers’ hands to give them more purchasing power.
Q-40 How the Government intervenes to ensure stability in price level? [Sugg.-Nov’18,2 Marks]
Ans. Government intervenes to ensure price stability and thus regulate aggregate demandwith two policyinstruments namely, monetary (credit) policy and fiscal (budgetary) policy.Monetary policy attemptsto stabilise aggregate demand in the economy by influencingthe availability and cost of money, i.e.,the rate of interest. Fiscal policy, on the other hand, aims at influencing aggregate demand by alteringtax, public expenditure and public debt of the government. When total spending is too low, the

189
government may increase its spending and/or lower taxes to reduce unemployment and the centralbank may lower interest rates. When total spending is excessive, the government may cut its spendingand/or raise taxes to foster price stability and the central bank may raise interest rates. In addition, thegovernment may initiate regulatory measures such as price ceiling and price floors.
Q-41 What is allocation function of Fiscal-Policy? [Sugg.-Nov’18,2 Marks]
Ans. Allocation function of fiscal policy is concerned with the process by which the total resources of theeconomy are divided among various uses as well as for provision of an optimum mix of various socialgoods (both public goods and merit goods). The allocation function also involves the reallocation ofsociety’s resources from private use to public use.
The resource allocation role of government’s fiscal policy focuses on the potential for the governmentto improve economic performance and welfare through its expenditure and tax policies. It alsodetermines who and what will be taxed as well as how and on what the government revenue will bespent.
Q-42 Define the market failure. Why do markets fail? [Sugg.-Nov’18,3 Marks]
Ans. Market failure is a situation in which the free market with an unrestricted price system determined byforces of supply and demand leads to misallocation of society’s scarce resources in the sense that thereis either overproduction or underproduction of particular goods and services leading to a less thanoptimal outcome. The major reasons for market failure and economic inefficiency include:
(i) Though perfectly competitive markets work efficiently, most often theprerequisites ofcompetition are unlikely to be present in an economy.
(ii) Market power of firms enables them to act as price makers and keep the levelof prices and outputthat give them positive economic profits.
(iii) Externalities hinder the ability of market prices to convey accurate information about how muchto produce and how much to buy
(iv) Public goods are not produced at all or produced less than optimal quantities due to its specialcharacteristics such as indivisibility, non - excludability and non-rivalry.
(v) Free rider problem causing overuse, degradation and depletion of common resources
(vi) Information failure manifest in asymmetric information, adverse selection and moral hazard.
Q-43 How do Governments correct market failure resulting from demerit Goods? [Sugg.-Nov’18,3 Marks]
Ans. Demerit goods are deemed socially undesirable and their consumption imposes considerable negativeexternalities on the society as a whole. Examples of demerit goods are cigarettes, alcohol etc. Sincedemerit goods are clear cases of market failure, the government intervenes in the marketplace todiscourage their production and consumption mainly by the following methods:
(i) At the extreme, the government may enforce complete ban on a demerit good; e.g.intoxicatingdrugs. In such cases, the possession, trading or consumption of thegood is made illegal.
(ii) Impose unusually high taxes on producing or purchasing the demerit goods making them verycostly and unaffordable to many.
(iii) Through persuasion which is mainly intended to be achieved by negative advertising campaignswhich emphasize the dangers associated with consumption of demerit goods and granting ofsubsidies for such advertisements.
(iv) Through legislations that prohibit the advertising or promotion of demerit goods in whatsoevermanner.
(v) Strict regulations of the market for the good may be put in place so as to limit access to the good,

190
especially by vulnerable groups such as children and adolescents. Restrictions in terms of aminimum age may be stipulated at which young people are permitted to buy cigarettes andalcohol.
(vi) Regulatory controls in the form of spatial restrictions e.g. smoking in public places, sale of tobaccoto be away from schools, and time restrictions under which sale at particular times during the dayis banned.
Q-44 Explain the concept of Social Costs. [Sugg.-Nov’18,2 Marks]
Ans. Social costs refer to the total costs to the society on account of a production or consumption activity.Social costs are private costs borne by individuals directly involved in a transaction together with theexternal costs borne by third parties not directly involved in the transaction. Social costs represent thetrue burdens carried by society in monetary and non-monetary terms.
Q-45 Explain the role of Government in a market economy as stated by Richard Musgrave.
[Sugg.-May’18,3 Marks]
Ans. Richard Musgrave, in his classic treatise ‘The Theory of Public Finance’ (1959), introduced the threebranch taxonomy of the role of government in a market economy. The objective of the economicsystem and the role of government is to improve the wellbeing of individuals or households. Accordingto ‘Musgrave Three-Function Framework’, the functions of government are to be separated into three,namely,resource allocation, (efficiency), income redistribution (fairness) and macroeconomicstabilization. The allocation and distribution functions are primarily microeconomic functions, whilestabilization is a macroeconomic function. The allocation function aims to correct the sources ofinefficiency in the economic system while the distribution role ensures that the distribution of wealthand income is fair. The stabilization branch is to ensure achievement of macroeconomic stability,maintenance of high levels of employment and price stability.
Q-46 Describe the meaning and mechanism of `crowding out’ effect of public expenditure
[Sugg.-May’18,3 Marks]
Ans. Crowding Out:
Meaning
‘Crowding out’ effect is the negative effect fiscal policy may generate when spending by governmentin an economy substitutes private spending. For example,if government provides free computers tostudents, the demand from students for computers may not be forthcoming.
Mechanism
The interest rates in an economy increase when:
• Government increases its spending by borrowing from the loanable funds from market and thusthe demand for loans increases.
• Government increases the budget deficit by selling bonds or treasury bills and the amount ofmoney with the private sector decreases.Due to high interest, private investments, especially the ones which are interest – sensitive, willbe reduced. Fiscal policy becomes ineffective as the decline in private spending partially orcompletely offset the expansion in demand resulting from an increase in government expenditure.
Q-47 Describe features of public goods. [Sugg.-May’18,2 Marks]Ans. Features of public goods
• Public goods yield utility and their consumption is essentially collective in nature.• Public goods are non rival in consumption i.e. consumption of a public good by one individual

191
does not reduce the quality or quantity available for all other individuals · Public goods are non-excludable i.e. consumers cannot (at least at less than prohibitive cost) be excluded fromconsumption benefits
• Public goods are characterized by indivisibility, each individual may consume all of the good i.e.the total amount consumed is the same for each individual.
• Once a public good is provided, the additional resource cost of another person consuming thegood is zero. No direct payment by the consumer is involved in the case of pure public goods andthese goods are generally more vulnerable to issues such as externalities, inadequate propertyrights, and free rider problems
• Competitive private markets will fail to generate economically efficient outputs of public goods.E.g. national defence.
Q-48 Explain the objectives of Fiscal Policy. [Sugg.-May’18,3 Marks]Ans. Objectives of Fiscal Policy
Fiscal Policy refers to the policy of government related to public revenue and public expenditure. Theobjectives of fiscal policy are derived from the aspirations and goals of the society and vary fromcountry to country. The most common objectives of fiscal policy are:• Achievement and maintenance of full employment,• Maintenance of price stability,• Acceleration of the rate of economic development,• Equitable distribution of income and wealth,• Eradication of poverty, and• Removal of regional imbalances in different parts of the country.
The importance as well as order of priority of these objectives may vary from country to countryand from time to time. For instance, while stability and equality may be the priorities of developednations, economic growth, employment and equity may get higher priority in developing countries.Also, these objectives are not always compatible; for instance the objective of achieving equitabledistribution of income may conflict with the objective of economic growth and efficiency.
Q-49 Define public good. Why do you consider national defence as a public good?
[MTP-March’18,3 Marks]
Ans. A public good (also referred to as a collective consumption good or a social good) is defined as onewhich all individuals enjoy in common in the sense that each individual’s consumption of such a goodleads to no subtraction from any other individual’s consumption of that good.National defence has all characteristics of a public good. It yields utility to people; its consumption isessentially non-rival, non-excludable and collective in nature and is characterized by indivisibility.National defence is available for all individuals whether they pay taxes or not and it is impossible toexclude anyone within the country from consuming and benefiting from it. No direct payment by theconsumer is involved in the case of defence. Once it is provided, the additional resource cost ofanother person consuming it is zero. Defence also has the unique feature of public good i.e. it does notconform to the settings of market exchange. Though defence is extremely valuable for the well beingof the society, left to market, it will not be produced at all or will be under produced.
Q-50 (a) Government’s stabilization intervention may be through monetary policy as well as fiscal policy. How?
(b) How do government correct market failure resulting from demerits goods? [RTP-May’2020]

192
Ans.(a) Government’s stabilization intervention may be through monetary policy as well as through fiscalpolicy. Monetary policy has a singular objective of controlling the size of money supply and interestrate in the economy which in turn would affect consumption, investment and prices. On the otherhand, Fiscal policy for stabilization purposes attempts to direct the actions of individuals andorganizations by means of its expenditure and taxation decisions. On the expenditure side, Governmentcan choose to spend in such a way that it stimulates other economic activities. For example, governmentexpenditure on building infrastructure may initiate a series of productive activities. Productiondecisions, investments, savings etc can be influenced by its tax policies.
(b) Demerit goods are goods which impose significant negative externalities on the society as a whole andare believed to be socially undesirable. The production and consumption of demerit goods are likelyto be more than optimal under free markets. The government should therefore intervene in themarketplace to discourage their production and consumption. The Governments correct market failureresulting from demerit goods in the following way-
• At the extreme, government may enforce complete ban on a demerit good. e.g. Intoxicatingdrugs. In such cases, the possession, trading or consumption of the good is made illegal.
• Through persuasion which is mainly intended to be achieved by negative advertising campaignswhich emphasize the dangers associated with consumption of demerit goods.
• Through legislations that prohibit the advertising or promotion of demerit goods in whatsoevermanner.
• Strict regulations of the market for the good may be put in place so as to limit access to the good,especially by vulnerable groups such as children and adolescents.
• Regulatory controls in the form of spatial restrictions e.g. smoking in public places, sale of tobaccoto be away from schools, and time restrictions under which sale at particular times during the dayis banned.
Q-51 (a) Reflect on the externalities presents in each of the following. Also examine their market implications-
i. A decision to stop smoking
ii Switching from conventional farming to organic farming
iii Started to drive a car and increased road congestion
iv Water polluted by industries
v Building Lighthouse
(b) Suppose country X is passing through recession, what type of tax policy should be framed during thisperiod? [RTP-May’2020]
Ans.(a) (i) A decision to stop smoking – positive consumption externalities – as it causes benefits to otherpeople in society who have been suffering from passive smoking.
(ii) Switching from conventional farming to organic farming- positive production externalities -as it helpsthe environment as there are fewer chemicals in the environment.
(iii) Started to drive a car and increased road congestion– negative consumption externalities – as individualconsume road space they reduce available road space and deny this space to others.
(iv) Water polluted by industries- negative production externalities –as it adds effluent which harms plants,animals and humans.
(v) Building Lighthouse – free rider problem- as all sailors will benefit from its illumination – even if theydon’t pay towards its upkeep.

193
(b) `During recession the tax policy is framed to encourage private consumption and investment. A generalreduction in income taxes leaves higher disposable incomes with people inducing higher consumption.Low corporate taxes increase the prospects of profits for business and promote further investment.The extent of tax reduction required depends on the size of the recessionary gap and the magnitude ofthe multiplier.
Q-52 What do you mean by ‘Global Public goods’. Explain in brief. [Sugg.-Nov’19,2 Marks]
Ans. Global Public Goods are those public goods with benefits /costs that potentially extend to everyone inthe world. These goods have widespread impact on different countries and regions, population groupsand generations throughout the entire globe. Global Public Goods may be:
• final public goods which are ‘outcomes’ such as ozone layer preservation or climate changeprevention, or
• intermediate public goods, which contribute to the provision of final public goods. e.g.International health regulations
The distinctive characteristic of global public goods is that there is no mechanism (either marketor government) to ensure an efficient outcome.
The World Bank identifies five areas of global public goods which it seeks to address: namely, theenvironmental commons (including the prevention of climate change and biodiversity),communicable diseases (including HIV/AIDS, tuberculosis, malaria, and avian influenza),international trade, international financial architecture, and global knowledge for development.
Q-53 Describe the problems in administering an efficient pollution tax. [Sugg.-Nov’19,3 Marks]
Ans. Pollution tax is imposed on the polluting firms in proportion to their pollution output to ensureinternalization of externalities. Following are the problems in administering an efficient pollution tax:
1. Pollution taxes are complex to determine and administer because it is difficult to discover theright level of taxation that would ensure that the private cost plus taxes will exactly equate withthe social cost.
2. If the demand for the good on which pollution tax is imposed is inelastic, the tax may only have aninsignificant effect in reducing demand. The producers will be able to easily shift the tax burdenin the form of higher product prices. This will have an inflationary effect and may reduce consumerwelfare.
3. Imposition of pollution tax involves the use of complex and costly administrative procedures formonitoring the polluters.
4. Pollution tax does not provide any genuine solutions to the problem. It only establishes anincentive system for use of methods which are less polluting.
5. Pollution taxes also have potential negative consequences on employment and investmentsbecause high pollution taxes in one country may encourage producers to shift their productionfacilities to those countries with lower pollution taxes.
Q-54 Distinguish between ‘pump priming’ and ‘compensatory spending’. [Sugg.-Nov’19,2 Marks]
Ans. A distinction may be made between the two concepts of public spending during depression, namely,the concept of ‘pump priming’ and the concept of ‘compensatory spending’. Pump priming involves aone-shot injection of government expenditure into a depressed economy with the aim of boostingbusiness confidence and encouraging larger private investment. It is a temporary fiscal stimulus inorder to set off the multiplier process. The argument is that with a temporary injection of purchasingpower into the economy through a rise in government spending financed by borrowing rather thantaxes, it is possible for government to bring about permanent recovery from a slump. Compensatory
194
spending is said to be resorted to when the government spending is deliberately carried out with theobvious intention to compensate for the deficiency in private investment.
Q-55 Distinguish between positive and negative externalities. [Sugg.-Nov’19,2 Marks]
Ans. An externality is defined as the uncompensated impact of one person’s production and/or consumptionactions on the well-being of another who is not involved in the activity and such effects are notreflected directly in market prices. If the impact on the third parties’ is adverse, it is called a negativeexternality. If it is beneficial, it is called a positive externality.
When negative externalities are present, the social cost of production or consumption is greater thanthe private cost. The benefit of a negative externality goes to the agent producing it, while the costsare invariably borne by the society at large.
When a positive externality exists, the benefit to the individual or firm is less than the benefit to thesociety i.e. the social value of the good exceeds the private value. In both cases, the outcome is marketfailure and inefficient allocation of resources.
Q-56 How does a discretionary fiscal policy help in correcting instabilities in the economy ?
[Sugg.-Nov’19,3 Marks]
Ans. Discretionary fiscal policy for stabilization refers to the deliberate policy actions on the part of agovernment to change the levels of expenditure, taxes and borrowing to influence the level of nationaloutput, employment and prices. Governments aim to correct the instabilities in the economy bychanging:
(i) the level and types of taxes,
(ii) the extent and composition of spending, and
(iii) the quantity and form of borrowing.
During inflation, or during the expansionary phase of the business cycle when there is excessiveaggregate spending and excessive level of utilization of resources, contractionary fiscal policy is adoptedto close the inflationary gap. This measure involves:
(i) decrease in government spending,
(ii) increase in personal and business taxes, and introduction of new taxes
(iii) a combination of decrease in government spending and increase in personal income taxes and/orbusiness taxes
(iv) a smaller government budget deficit or a larger budget surplus
(v) a reduction in transfer payments
(vi) increase in government debt from the domestic economy
During deflation or during a recessionary/contractionary phase of the business cycle, with sluggisheconomic activity when the rate of utilization of resources is less, expansionary fiscal policy aims tocompensate the deficiency in effective demand by boosting aggregate demand. The recessionary gapis set right by:
(i) increased government spending,
(ii) decrease in personal and business taxes,
(iii) a combination of increase in government spending and decrease in personal income taxes and/orbusiness taxes
(iv) a larger government budget deficit or a lower budget surplus
195
(v) an increase in transfer payments
(vi) repayment of public debt to people
Q-57 What is ‘Recessionary Gap’ ? [Sugg.-Nov’19,2 Marks]
OR
What is meant by ‘Bound tariff ? [Sugg.-Nov’19,2 Marks]
Ans. The Neo classical Approach or the cash balance approach put forth by Cambridge economists holds thatmoney increases utility in the following two ways:
1. for transaction motive, i.e. for enabling the possibility of split-up of sale and purchase to twodifferent points of time rather than being simultaneous
2. as a temporary store of wealth i.e. for a hedge against uncertainty
Since demand for money also involves a precautionary motive in this approach and money gives utilityin its store of wealth and precautionary modes, money is demanded for itself. How much money willbe demanded depends:
(i) partly on income which points to transactions demand, such that higher the income, the greaterthe quantity of purchases and as a consequence greater will be the need for money as a temporaryabode of value to overcome transactions costs, and
(ii) partly on other factors of which important ones are wealth and interest rates.
The Cambridge equation is stated as:
Md = k PY
Where
Md = is the demand for money
Y = real national income
P = average price level of currently produced goods and services
PY = nominal income
k = proportion of nominal income (PY) that people want to hold as cash balances
The term ‘k’ in the above equation is called ‘Cambridge k’. The equation above explains that thedemand for money (M) equals k proportion of the total money income. The neoclassical theory changedthe focus of the quantity theory of money to money demand and hypothesized that demand for moneyis a function of money income.
(ii) A recessionary gap, also known as a contractionary gap, is said to exist if the existing levels of aggregateproduction is less than what would be produced with full employment of resources. It is a measure ofoutput that is lost when actual national income falls short of potential income, and represents thedifference between the actual aggregate demand and the aggregate demand which is required toestablish the equilibrium at full employment level of income. This gap occurs during the contractionaryphase of business-cycle and results in higher rates of unemployment. In other words, a recessionarygap occurs when the aggregate demand is not sufficient to create conditions of full employment.
OR
A bound tariff is a tariff which a WTO member binds itself with a legal commitment not to raise it abovea certain level. By binding a tariff, often during negotiations, the members agree to limit their right toset tariff levels beyond a certain level. The bound rates are specific to individual products and representthe maximum level of import duty that can be levied on a product imported by that member. A member

196
is always free to impose a tariff that is lower than the bound level. Once bound, a tariff rate becomespermanent and a member can only increase its level after negotiating with its trading partners andcompensating them for possible losses of trade. A bound tariff ensures transparency and predictabilityin trade.
197
Q-1 Why Marginal Standing Facility (MSF) would be the last resort for banks? [MTP- Oct’19,3 Marks]
Ans. The Marginal Standing Facility (MSF) refers to the facility under which scheduled commercial banks canborrow additional amount of overnight money from the central bank over and above what is availableto them through the LAF window by dipping into their Statutory Liquidity Ratio (SLR) portfolio up to alimit .The scheme has been introduced by RBI with the main aim of reducing volatility in the overnightlending rates in the inter-bank market and to enable smooth monetary transmission in the financialsystem. Banks can borrow through MSF on all working days except Saturdays, between 7.00 pm and7.30 pm, in Mumbai. The minimum amount which can be accessed through MSF is ` 1 crore and morewill be available in multiples of ` 1 crore. The MSF would be the last resort for banks once they exhaustall borrowing options including the liquidity adjustment facility on which the rates are lower comparedto the MSF.
Q-2 Suppose M3 = Rs. 450000 Crore
Currency with Public = Rs 3000 Crore
Demand Deposits of Banks = Rs. 100000 Crore
Other deposits with RBI= Rs. 100000 Crore
Saving Deposits with Post Office Saving Banks = Rs. 150000 Crore
Total deposits with the Post Office Savings Organization (excluding National Saving Certificate) = Rs.20000 Crore
National Saving Certificate = Rs. 250 Crore
Calculate Net Time Deposits and M4 wi th the banking system? [MTP-March’19,3 Marks]
Ans. M3 = M1+ net time deposits with the banking system M1= Currency notes and coins with the public+demand deposits of banks+ other deposits with RBI Therefore, Net time deposits with the bankingsystem = M3 - M1
450000- 3000-100000-100000
= Rs. 247000 Crore
M4 = M3 + total deposits with the post office savings organization (excluding National savings Certificate)
M4 = 450000 + 20000
M4 = 470000 Crore.
Q-3 Compare transaction demand for money according to Keynes and Baumol & Tobin?
[MTP-March’19,2 Marks]
Ans. The transaction demand for money according to Keynes is interest-inelastic; whereas Baumol andTobin show that money held for transaction purposes is interest elastic.
CHAPTER-3MONEY MARKET

198
Q-4 Define the deposit expansion multiplier? How it is calculated? [MTP-March’19,3 Marks]
Ans. The deposit expansion multiplier describes the amount of additional money created by c ommercialbank through the process of lending the available money it has in excess of the central bank’s reserverequirements. The deposit expansion multiplier is, thus inextricably tied to the bank’s reserverequirement. This measure tells us how much new money will be created by the banking system for agiven increase in the high powered money. It reflects a bank’s ability to increase the money supply. Thedeposit expansion multiplier is the reciprocal of the required reserve ratio.
If reserve ratio is 20%, then credit multiplier = 1/0.20 = 5.
The deposit expansion multiplier = 1/ Required Reserve Ratio
Q-5 How the autonomous expenditure multiplier is stated in four sector model? [MTP-March’19,2 Marks]
Ans. The autonomous expenditure multiplier in a four sector model includes the effects of foreign
transactions and is stated as 1
1-b + v where v is the propensity to import which is greater than zero. The
greater the value of v, the lower will be the autonomous expenditure multiplier.
Q-6 Explain the concept of demand for money? ` [MTP-March’19,2 Marks]
Ans. The demand for money is a decision about how much of one’s given stock of wealth should be held inthe form of money rather than as other assets such as bonds. Demand for money is actually demand forliquidity and a demand to store value.
Q-7 How would each of the following affect money multiplier and money supply?
(i)Fearing shortage of money in ATMs, people decides to hoard money.
(ii) Banks open large number of ATMs all over country.
(iii) During the festival season, people decide to use ATMs very often. [MTP-March’19,3 Marks]
Ans. (i) When people hold more money, it increases the currency-deposit ratio; reduces moneymultiplier;money supply declines.
(ii) ATMs let people to withdraw cash from the bank as and when needed, reduces cost of conversionof deposits to cash and makes deposits relatively more convenient. People hold less cash and moredeposits, thus reducing the currency-deposit ratio; increasing the money multiplier causing the moneysupply to increase.
(iii) If people, for any reason, are expected to withdraw money from ATMs with more frequency,
then banks will want to keep more reserves. This will raise the reserve ratio, and lower the moneymultiplier. As a result, money supply will decline.
Q-8 What is the nature of relationship between investment and income according to Keynes?
[MTP-March’19,2 Marks]
Ans. Keynes argued that, in the short run, investment is best viewed as an autonomous expenditure, that is,it is independent of people’s income. The Keynesian model assumes that the planned level ofinvestment expenditure is constant with respect to current income. Investment is determined byfactors other than income such as business expectations and economic policy.
Q-9 Explain the functioning of SLR? [MTP-March’19,2 Marks]
Ans. Changes in SLR chiefly influence the availability of resources in the banking system for lending. A rise

199
in SLR -during periods of high liquidity - to lock up a rising fraction of a bank’s assets in the form ofeligible instruments – reduces the credit creation capacity of banks. A reduction in SLR during periodsof economic downturn has the opposite effect.
Q-10 (i)Outline different components of monetary policy framework for India?
(ii)Write a note on two major components of Reserve Money [MTP-March’19,5 Marks]
Ans.(i) The central bank in its execution of monetary policy, functions within an articulated monetary policyframework which comprises of:
• the objectives of monetary policy, such as maintenance of price stability (or controlling inflation)and achievement of economic growth
• the analytics of monetary policywhich focus on the transmission mechanisms, or the ways inwhich monetary policy actions get transmitted to the real economy and
• the operating procedure which relates to all aspects of implementation of monetary policy namely,choosing the operating target, choosing the intermediate target, and choosing the policyinstruments.
(ii) Reserve money has two major components – currency in circulation and reserves. Currency in circulationcomprises currency with the public and cash in hand with banks. Reserves are bank deposits with thecentral bank.
Q-11 What will be the total credit created by the commercial banking system for an initial deposit of` 1000for required reserve ratio 0.02, 0.05 and 0.10 per cent respectively? Compute creditmultiplier.
[MTP-March’19,2 Marks]
Ans. Credit Multiplier = 1/ Required Reserve Ratio
1000×1/ 0.02 = 50,000
1000 ×1/ 0.05 = 20,000
1000 ×1/ 0.10= 10,000
Q-12 What would be the effect of automatic stabilizers on multiplier? [MTP-March’19,2 Marks]
Ans. An automatic stabilizer is any feature of an economy that automatically reduces the changes in spendingduring the multiplier process, making the multiplier smaller. As GDP increases, an automatic stabilizerwould reduce the increases in spending in each round of the multiplier making the final increase inGDP less than what would otherwise be. Therefore, automatic stabilizers reduce the size of themultiplier, and consequently reduce fluctuations in GDP and employment, making the economy morestable in the short run. Briefly put, automatic stabilizers diminish the impact of spending changes onreal GDP.
Q-13 (i) Define Money multiplier? What is the nature of relationship between money multiplier and moneysupply?(ii) How do changes in Statutory Liquidity Ratio impact the economy? [MTP-March’19,5Marks]
Ans.(i) Money multiplier m is defined as a ratio that relates the change in the money supply to a given changein the monetary base.
Money supplyMoney multiplier m =
Monetary base
The multiplier indicates what multiple of the monetary base is transformed into money supply.The link from reserve money to money supply is through the money multiplier. The multiplier processoperates as long as banks have excess reserves. If some portion of the increase in high-poweredmoney finds its way into currency, this portion does not undergo multiple deposit expansion.
200
(ii) Changes in SLR chiefly influence the availability of resources in the banking system for lending. A risein SLR -during periods of high liquidity - to lock up a rising fraction of a bank’s assets in the form ofeligible instruments - reduces the credit creation capacity of banks. A reduction in SLR during periodsof economic downturn has the opposite effect.
Q-14 (i) Account for cash reserve ratio as a monetary policy instrument
(ii) Explain how higher of interest rate affect the demand for money. [MTP-March’19,5 Marks]
Ans.(i) Cash Reserve Ratio (CRR) refers to the fraction of the total net demand and time liabilities (NDTL) of ascheduled commercial bank in India which it should maintain as cash deposit with the Reserve Bank.CRR has, in recent years, assumed significance as one of the important quantitative tools aiding inliquidity management. The RBI may set the ratio in keeping with the broad objective of maintainingmonetary stability in the economy.Higher the CRR with the RBI, lower will be the liquidity in the system and vice versa. During deflation,the RBI reduces the CRR in order to enable the banks to expand credit and increase the supply ofmoney available in the economy. During periods of inflation, the RBI increases the CRR in order tocontain credit expansion.
(ii) The demand for money is a decision about how much of one’s given stock of wealth should be held inthe form of money rather than as other assets such as bonds. Demand for money is actually demand forliquidity and a demand to store value.Demand for money is in the nature of derived demand; it is demanded for it purchasing power.
Basically people demand money because they wish to have command over real goods and serviceswith the use of money.
Demand for money has an important role in the determination of interest, prices and income in aneconomy. Higher the interest rate, higher would be opportunity cost of holding cash and lower thedemand for money. Similarly, lower the interest rate, lower will be the opportunity cost of holdingcash and higher the demand for money.
Q-15 If commercial banks in India decide to hold more excess reserves, how would it affect the moneymultiplier and money supply? [MTP-April’18,2 Marks]
Ans. Excess reserves are those reserves that the commercial banks hold with the central bank in addition to themandatory reserve requirements. Excess reserves result in an increase in reserve - deposit ratio of banks;less money for lending reduces money multiplier; money supply declines.
Q-16 What would be the effect on money multiplier if banks hold excess reserves?[MTP-April’18,2 Marks]
Ans. The additional units of high-powered money that goes into ‘excess reserves’ of the commercial banksdo not lead to any additional loans, and therefore, these excess reserves do not lead to creation ofdeposits. In other words, excess reserves may be considered as an idle component of reserves andtherefore has no effect on money multiplier.
Q-17 What’s the distinction between direct and indirect instruments of Monetary Policy?
[MTP-April’18,3 Marks]
Ans. Direct instruments presuppose one-to-one correspondence between the instrument (such as a creditceiling) and the policy objective (such as a specific amount of domestic credit outstanding), whileindirect instruments act through the market by adjusting the underlying demand for, and supply of,bank reserves
Q-18 Define money supply. Describe the different components of money supply. [MTP-April’18,2 Marks]
Ans. The measures of money supply vary from country to country, from time to time and from purpose topurpose.
The high-powered money and the credit money broadly constitute the most common measure of

201
money supply, or the total money stock of a country. High powered money is the source of all otherforms of money. The second major source of money supply is the banking system of the country.Money created by the commercial banks is called ‘credit money’. Measurement of money supply isessential from a monetary policy perspective because it enables a framework to evaluate whether thestock of money in the economy is consistent with the standards for price stability, to understand thenature of deviations from this standard and to study the causes of money growth. The stock of moneyalways refers to the total amount of money at any particular point of time i.e. it is the stock of moneyavailable to the ‘public’ as a means of payments and store of value and does not include inter-bankdeposits.
The monetary aggregates are:
M1 = Currency and coins with the people + demand deposits of banks
(Current and Saving accounts) + other deposits of the RBI;
M2 = M1 + savings deposits with post office savings banks,
M3 = M1 + net time deposits of banks and
M4 = M3 + total deposits with the Post Office Savings Organization
(excluding National Savings Certificates)
Q-19 List the general characteristics that money should possess? [MTP-April’18,2 Marks]
Ans. Money should be generally acceptable, durable, difficult to counterfeit, relatively scarce, uniform,easily transported, divisible without losing value, elastic in supply and effortlessly recognizable.
Q-20 Explain how Reserve Bank of India acts as a ‘lender of last resort ‘to commercial banks? Or Explain
the operation of Marginal Standing Facility? [MTP-Aug’18,3 Marks]
Ans. The Marginal Standing Facility (MSF) is the last resort for banks to obtain funds once they exhaust allborrowing options including the liquidity adjustment facility on which the rates are lower compared tothe MSF. Under this facility, the scheduled commercial banks can borrow additional amount of overnightmoney from the central bank over and above what is available to them through the LAF window bydipping into their Statutory Liquidity Ratio (SLR) portfolio up to a limit ( a fixed per cent of their netdemand and time liabilities deposits (NDTL) liable to change ) at a penal rate of interest. The schemehas been introduced by RBI with the main aim of reducing volatility in the overnight lending rates inthe inter-bank market and to enable smooth monetary transmission in the financial system. Thisprovides a safety valve against unexpected liquidity shocks to the banking system.
Q-21 Explain the Cambridge Version of Cash Balance Approach Md = k P Y [MTP-Aug’18,3 Marks]
Ans. In the early 1900s, Cambridge Economists Alfred Marshall, A.C. Pigou, D.H. Robertson andJohn MaynardKeynes (then associated with Cambridge) put forward a fundamentally different approach to quantitytheory, known neoclassical theory or cash balance approach. The Cambridge version holds that moneyincreases utility in the following two ways:
1. enabling the possibility of split-up of sale and purchase to two different points of time ratherthan being simultaneous, and
2. being a hedge against uncertainty.
While the first above represents transaction motive, just as Fisher envisaged, the second points tomoney’s role as a temporary store of wealth. Since sale and purchase of commodities by individuals donot take place simultaneously, they need a ‘temporary abode’ of purchasing power as a hedge againstuncertainty. As such, demand for money also involves a precautionary motive in Cambridge approach.Since money gives utility in its store of wealth and precautionary modes, one can say that money isdemanded for itself.

202
Now, the question is how much money will be demanded? The answer is: it depends partly on incomeand partly on other factors of which important ones are wealth and interest rates.
The former determinant of demand i.e. income, points to transactions demand such that higher theincome, the greater the quantity of purchases and as a consequence greater will be the need formoney as a temporary abode of value to overcome transactions costs. The Cambridge equation isstated as:
Md = k PY, Where Md = is the demand for money
Y = real national income
P = average price level of currently produced goods and services
PY = nominal income
k = proportion of nominal income (PY) that people want to hold as cash balances
The term ‘k’ in the above equation is called ‘Cambridge k’. The equation above explains that thedemand for money (M) equals k proportion of the total money income.
Thus we see that the neoclassical theory changed the focus of the quantity theory of money to moneydemand and hypothesized that demand for money is a function of money income.
Both these versions are chiefly concerned with money as a means of transactions or exchange, andtherefore, they present models of the transaction demand for money.
Q-22 What is meant by Liquidity Adjustment Facility (LAF)? How does it help commercial banks?
[MTP-Aug’18,3 Marks]
Ans. The Liquidity Adjustment Facility(LAF) is a facility extended by the Reserve Bank of India to the scheduledcommercial banks (excluding RRBs) and primary dealers to avail of liquidity in case of requirement (orpark excess funds with the RBI in case of excess liquidity) on an overnight basis against the collateral ofgovernment securities including state government securities. The objective is to provide liquidity tocommercial banks to adjust their day to day mismatches in liquidity. Under this facility, financialaccommodation is provided through repos/reverse repos.
Q-23 What is meant by ‘monetary policy instruments’ [MTP-Aug’18,3 Marks]
Ans. The monetary policy instruments are the various direct and indirect instruments or tools thata centralbank can use to influence money market and credit conditions and pursue itsmonetary policy objectives.In general, the direct instruments comprise of:
(a) the required cash reserve ratios and liquidity reserve ratios prescribed from time to time
(b) directed credit which takes the form of prescribed targets for allocation of credit topreferredsectors (for e.g. Credit to priority sectors), and
(c) administered interest rates wherein the deposit and lending rates are prescribed by thecentralbank.
The indirect instruments mainly consist of:
(a) Repos
(b) Open market operations
(c) Standing facilities, and
(d) Market-based discount window.

203
Q-24 Define Money Multiplier [MTP-Aug’18,2 Marks]
Ans. Money SupplyMoney Multiplier m =
Monetary Base
Money multiplier m is defined as a ratio that relates the change in the money supply to a given changein the monetary base. It denotes by how much the money supply will change for a given change in high-powered money. The multiplier indicates what multiple of the monetary base is transformed intomoney supply.
Q-25 Explain the effects of monetary policy through the exchange rate channel? [MTP-Aug’18,3 Marks]
Ans. The exchange rate channel works through expenditure switching between domestic and foreign goods.A reduction in policy rate lowers interest rates and reduces the relative returns and investors shifttheir funds into foreign assets and leads to depreciation in the exchange rate. Higher competitivenessof domestic producers increase export volumes and higher prices of imports discourage imports (orhigher net exports) and increase demand for domestically produced goods and services. Consequently,domestic output and employment increases. High policy rates normally lead to an appreciation of thecurrency, as foreign investors seek higher returns and increase their demand for the currency.Appreciation of the domestic currency make domestically produced goods more expensive comparedto foreignproduced goods. This causes net exports to fall; correspondingly domestic output andemployment also fall.
Q-26 Define CRR. How is CRR used as a policy instrument. [MTP-Oct’18,3 Marks]
Ans. Cash Reserve Ratio (CRR) refers to the fraction of the total net demand and time liabilities (NDTL ieaggregate savings account, current account and fixed deposit balances) of a scheduled commercialbank in India which it should maintain as cash deposit with the Reserve Bank. This requirement appliesuniformly to all scheduled banks in the country irrespective of its size or financial position. Non-BankFinancial Corporations (NBFCs) are outside the purview of this reserve requirement.
Higher the CRR with the RBI, lower will be the liquidity in the system and availability of lendablesurpluses with the commercial banks and vice versa. During deflation, the RBI reduces the CRR in orderto enable the banks to expand credit and increase the supply of money available in the economy. Inorder to contain credit expansion during periods of inflation, the RBI increases the CRR.
Q-27 Explain the function of money as a unit of account? [MTP-March’19,3 Marks]
Ans. A unit of account is a common unit for measuring how much something is worth. The monetary unit (fore.g. Rupee, Dollar) serves as a numeraire or common measure value in terms of which the value of allgoods, services, assets, liabilities, income, expenditure etc are measured and expressed. This helps inmeasuring and fixing the exchange values in terms of a common unit and avoids the problem ofrecording and expressing the value of each commodity in terms of quantities of other goods. Use ofmoney as a unit of account thus• reduces the number of exchange ratios between goods and services• makes it possible to keep business accounts• allows meaningful interpretation of prices, costs, and profits, and• facilitates a system of trade through orderly pricing, comparison of value and rational economic
choices.
Q-28 Explain how Reserve Bank of India acts as a ‘lender of last resort ‘to commercial banks?
[MTP-Oct’18,3 Marks]
Ans. The Marginal Standing Facility (MSF) is the last resort for banks to obtain funds once they exhaust allborrowing options including the liquidity adjustment facility on which the rates are lower compared to
204
the MSF. Under this facility, the scheduled commercial banks can borrow additional amount of overnightmoney from the central bank over and above what is available to them through the LAF window bydipping into their Statutory Liquidity Ratio (SLR) portfolio up to a limit (a fixed per cent of their netdemand and time liabilities deposits (NDTL) liable to change) at a penal rate of interest. The schemehas been introduced by RBI with the main aim of reducing volatility in the overnight lending rates inthe inter-bank market and to enable smooth monetary transmission in the financial system. Thisprovides a safety valve against unexpected liquidity shocks to the banking system.
Q-29 What is the role of Liquidity Adjustment Facility? [MTP-Oct’18,2 Marks]
Ans. The Liquidity Adjustment Facility(LAF) is a facility extended by the Reserve Bank of India to the scheduledcommercial banks (excluding RRBs) and primary dealers to avail of liquidity in case of requirement (orpark excess funds with the RBI in case of excess liquidity) on an overnight basis against the collateral ofgovernment securities including state government securities.
Q-30 Explain the classical version of quantity theory of demand for money. [RTP-Nov’19]
Ans. According to Fisher, quantity theory of money demonstrate that there is strong relationship betweenmoney and price level and the quantity of money is the main determinant of the price level or thevalue of money. In other words, changes in the general level of commodity prices or changes in thevalue or purchasing power of mney are determined first and foremost by changes in the quantity ofmoney in circulation. Fisher’s version, also termed as ‘equation of exchange’ or ‘transaction approach’is formally stated as follows:
MV = PT
Where, M= the total amount of money in circulation (on an average) in an economy
V = transactions velocity of circulation i.e. the average number of times across all transactions a unit ofmoney (say Rupee) is spent in purchasing goods and services P = average price level (P= MV/T) T = thetotal number of transactions.
Later, Fisher extended the equation of exchange to include demand (bank) deposits
(M’) and their velocity (V) in the total supply of money. Thus, the expanded form of the equation ofexchange becomes:
MV + M’V’ = PT
Where M’ = the total quantity of credit money V’ = velocity of circulation of credit money The totalsupply of money in the community consists of the quantity of actual money (M) and its velocity ofcirculation (V). Velocity of money in circulation (V) and the velocity of credit money (V) remain constant.T is a function of national income.
Since full employment prevails, the volume of transactions T is fixed in the short run.
Briefly put, the total volume of transactions (T) multiplied by the price level (P) represents the demandfor money. The demand for money (PT) is equal to the supply of money (MV + M’V)’. In any givenperiod, the total value of transactions made is equal to PT and the value of money flow is equal to MV+M’V’.
Fisher did not specifically mention anything about the demand for money; but the same is embeddedin his theory as dependent on the total value of transactions undertaken in the economy. Thus, thereis an aggregate demand for money for transactions purpose and more the number of transactionspeople want, greater will be the demand for money. The total volume of transactions multiplied by theprice level (PT) represents the demand for money.

205
Q-31 Why empirical analysis of money supply is important? [RTP-Nov’19]
Ans Empirical analysis of money supply is important for two reasons:
1. It facilitates analysis of monetary developments in order to provide a deeper understanding ofthe causes of money growth.
2. It is essential from a monetary policy perspective as it provides a framework to evaluate whetherthe stock of money in the economy is consistent with the standards for price stability and tounderstand the nature of deviations from this standard. The central banks all over the worldadopt monetary policy to stabilise price level and GDP growth by directly controlling the supply ofmoney. This is achieved mainly by managing the quantity of monetary base. The succ ess ofmonetary policy depends to a large extent on the controllability of money supply and the monetarybase.
Q-32 Calculate the narrow money from the following information.
Components in Million (`)
Currency with the public 15473.2
Demand deposits of banks 6943.1
Saving deposits with post office saving banks 978.1
Other deposits of the RBI 501.2 [RTP-Nov’19]
Ans. M1= Currency with the public+ demand deposits of banks+ other deposits of the RBI = 15473.2 + 6943.1+501.2 = 22917.5 million
Q-33 What is high powered money? Calculate it from the following data:
Components in Million (`)
Net RBI Credit to the Government 41561.2
RBI credit to the Commercial sector 18459.3
RBI’s net non-monetary liabilities 24981.2
RBI’s claims on banks 31456.2
RBI’s Net foreign assets 10456.1
Government’s currency liabilities to the public 21417.1 [RTP-Nov’19]
Ans. High powered money is also known as reserve money which determines the level of liquidity and pricelevel in the economy.
Reserve Money = Net RBI Credit to the Government + RBI credit to the Commercial sector+ RBI’s claimson banks+ RBI’s Net foreign assets+ Government’s currency liabilities to the public- RBI’s net non-monetary liabilities
= 41561.2 + 18459.3 + 31456.2 + 10456.1 + 21417.1 - 24981.2 = 98368.7 million
Q-34 Explain the function of money as a unit of account? [RTP-May’19]
Ans. A unit of account is a common unit for measuring how much something is worth. The monetary unit (fore.g. Rupee, Dollar) serves as a numeraire or common measure value in terms of which the value of allgoods, services, assets, liabilities, income, expenditure etc are measured and expressed. This helps inmeasuring and fixing the exchange values in terms of a common unit and avoids the problem ofrecording and expressing the value of each commodity in terms of quantities of other goods.
Use of money as a unit of account thus
• reduces the number of exchange ratios between goods and services
• makes it possible to keep business accounts

206
• allows meaningful interpretation of prices, costs, and profits, and• facilitates a system of trade through orderly pricing, comparison of value and rational economic
choices.Q-35 Examine the different variables on demand for money according to inventory theoretic approach.
[RTP-May’19]Ans. Inventory Theoretic Approach (by Baumol and Tobin), assume that there are two media for storing
value: money and an interest-bearing alternative asset. There is a fixed cost of making transfers betweenmoney and the alternative assets e.g. broker charges. While relatively liquid financial assets otherthan money (such as, bank deposits) offer a positive return, the above said transaction costs of goingbetween money and these assets justifies holding money.Baumol used business inventory approach to analyze the behaviour of individuals.Just as businesses keep money to facilitate their business transactions, people also hold cash balancewhich involves an opportunity cost in terms of lost interest.Therefore, they hold an optimum combination of bonds and cash balance, i.e., an amount that minimizesthe opportunity cost.Baumol’s propositions in his theory of transaction demand for money hold that receipt of income, sayY takes place once per unit of time but expenditure is spread at a constant rate over the entire periodof time. Excess cash over and above what is required for transactions during the period underconsideration will be invested in bonds or put in an interest-bearing account. Money holdings on anaverage will be lower if people hold bonds or other interest yielding assets.The higher the income, the higher is the average level or inventory of money holdings.The level of inventory holding also depends also upon the carrying cost, which is the interest forgoneby holding money and not bonds, net of the cost to the individual of making a transfer between moneyand bonds, say for example brokerage fee. The individual will choose the number of times the transferbetween money and bonds takes place in such a way that the net profits from bond transactions aremaximized.The average transaction balance (money) holding is a function of the number of times the transferbetween money and bonds takes place. The more the number of times the bond transaction is made,the lesser will be the average transaction balance holdings. In other words, the choice of the numberof times the bond transaction is made determines the split of money and bond holdings for a givenincome.The inventory-theoretic approach also suggests that the demand for money and bonds depend on thecost of making a transfer between money and bonds e.g. the brokerage fee. An increase the brokeragefee raises the marginal cost of bond market transactions and consequently lowers the number of suchtransactions. The increase in the brokerage fee raises the transactions demand for money and lowersthe average bond holding over the period. This result follows because an increase in the brokerage feemakes it more costly to switch funds temporarily into bond holdings.An individual combines his asset portfolio of cash and bond in such proportions that his cost is minimized
Q-36 Define Reserve Money? Compute the Reserve Money from the following dataPublished by RBI.Components (In billions of `)
As on 7th July 2018Currency in circulation 15428.40
Bankers Deposits with RBI 4596.18
Other Deposits with RBI 183.30
[RTP-May’19]
207
Ans. Reserve Money = Currency in circulation + Bankers’ deposits with the RBI +Other depositswith the RBI
= 15428.40 + 4596.18 + 183.30
= 20207.88
Q-37 Which of the functions of money do the following items satisfy?
(i) A credit card.
(ii) A token of specified amount of money which can be used for shopping [RTP-May’19]
Ans. (i) A credit card is a medium of exchange
(ii) A token of specified amount of money which can be used for shopping satisfies all 3 functions ofmoney, which are store of value, unit of account, and medium of exchange.
Q-38 What role does Market Stabilization Scheme (MSS) play in our economy? [RTP-May’19]
Ans. Market Stabilization Scheme for monetary management was introduced in 2004 following a MoUbetween the Reserve Bank of India (RBI) and the Government of India (GoI) with the primary aim ofaiding the sterilization operations of the RBI. (Sterilization is the process by which the monetary authoritysterilizes the effects of significant foreign capital inflows on domestic liquidity by off-loading parts ofthe stock of government securities held by it). Under this scheme, the Government of India borrowsfrom the RBI (such borrowing being additional to its normal borrowing requirements) and issuestreasury-bills/dated securities for absorbing excess liquidity from the market arising from large capitalinflows.
Q-39 Explain the operational procedure of the monetary policy of India? [RTP-May’19]
Ans. Operating procedures are the variety of rules, traditions and practices used in the actual implementationof monetary policy. It encompasses, basically, a set of tactics such as choice of the operating target andpolicy instruments, the nature and frequency of use of policy instruments, market interventions, thewidth of corridor for market interest rates and the manner of policy signals to effect desired changes inthe intermediate target. In other words, the operating procedure in monetary policy refers to itsimplementation in very short run, including the day-to-day operations.
Q-40 Critically examine the post Keynesian theories of demand for money? [RTP-Nov’18]
Ans. The post-Keynesian economists developed a number of models to provide alternative explanations toconfirm the formulation relating real money balances with real income and interest rates. Most post-Keynesian theories of demand for money emphasize the store-of-value or the asset function of money.
Inventory Approach to Transaction Balances : Baumol (1952) and Tobin (1956) developed a deterministictheory of transaction demand for money, known as Inventory Theoretic Approach, in which money or`real cash balance’ was essentially viewed as an inventory held for transaction purposes.
People hold an optimum combination of bonds and cash balance, i.e., an amount that minimizes theopportunity cost. The optimal average money holding is: a positive function of income Y, a positivefunction of the price level P, a positive function of transactions costs c, and a negative function of thenominal interest rate i.
Friedman’s Restatement of the Quantity Theory : Milton Friedman (1956) extending Keynes’ speculativemoney demand within the framework of asset price theory holds that demand for money is affected bythe same factors as demand for any other asset, namely, permanent income and relative returns onassets. The nominal demand for money is positively related to the price level, P; rises if bonds and
stock returns, rb and r
e, respectively decline and vice versa; is influenced by inflation; and is a function
of total wealth. The Demand for Money as Behaviour toward as ‘aversion to risk’ propounded by Tobin

208
states that money is a safe asset but an investor will be willing to exercise a trade-off and sacrifice tosome extent the higher return from bonds for a reduction in risk.The Demand for Money as Behaviour towards RiskAccording to Tobin, rational behaviour explained induces individuals to hold an optimally structuredwealth portfolio which is comprised of both bonds and money and the demand for money as a store ofwealth depends negatively on the interest rate. These theories establish a positive relation of demandfor money to real income and an inverse relation to the rate of return on earning assets, i.e. theinterest rate.
Q-41 In Keynesian analysis of speculative demand for money, how will demand for money be affected ifpeople feel that the level of interest is very high? What is the rationale behind their choice?
[RTP-Nov’18]
Ans. If wealth-holders consider that the current rate of interest is high compared to the ‘normal or criticalrate of interest’, they expect a fall in the interest rate (rise in bond prices). At the high current rate ofinterest, people are discouraged from holding money and hence they will convert their cash balancesinto bonds because there is high opportunity cost of holding cash in terms of interest forgone; as theycan earn high rate of return on bonds. Also, there is less chance of interest rates to rise further resultingin a fall in prices of bonds and consequent capital losses. They expect fall in the market rate of interestin future and capital gains resulting from a rise in bond prices. Anticipating such capital gains fromrising bond prices, people will convert their cash into bonds.
The inference from the above is that the speculative demand for money and interest are inverselyrelated. At higher rates of interest, the speculative demand for money would be less. The individualwould then hold as little money as possible, only for covering the transactions and precautionarymotives
The individual’s demand for money, as a function of the interest rate, would then be a step function,depicting a discontinuous portfolio decision as shown in figure below;
Individual’s Speculative Demand for Money

209
When the current rate of interest r n is higher than the critical rate of interest rc, the entire wealth isheld by the individual wealth-holder in the form of bonds. If the rate of interest falls below the criticalrate of interest rc, the individual will hold his entire wealth in the form of speculative cash balances.
Q-42 Do you think money is a unique store of value? [RTP-Nov’18]
Ans. The effectiveness of an asset as a store of value depends on the degree and certainty with which theasset maintains its value over time. Money is undeniably a good store of value; but it is not unique asa store of value. Financial assets other than money are also performing the function of store of valuejust as money has the financial assets have fixed nominal value over time and represent generalisedpurchasing power. Any asset, such as equities, bonds, land, buildings, precious metals, antiques andworks of art can all act as store of value.
Q-43 Explain how each of the following may affect money multiplier and money supply?
(i) Fearing shortage of money in ATM’s, people decide to hoard money?
(ii) During festival season, people decide to withdraw money through ATMs very often
[RTP-Nov’18]
Ans.(i) The money multiplier is a function of the currency ratio set by depositors which depends on thebehaviour of the public in respect of holding money. The public by their decisions in respect of the sizeof the nominal currency in hand (designated as the currency ratio) is in a position to influence theamount of the nominal demand deposits of the commercial banks. When people decide to hoard tomoney fearing shortage of money in ATM’s, there is an increase in c because depositors are convertingsome of their demand deposits into currency. Demand deposits undergo multiple expansions whilecurrency does not. Hence when demand deposits are being converted into currency, there is a switchfrom a component of the money supply that undergoes multiple expansions to one that does not. Theoverall level of multiple expansion declines, and therefore, money multiplier also falls.
(ii) Demand deposits held by people are highly liquid as they can be easily withdrawn and converted tocash. If people, for any reason, withdraw money from ATMs with greater frequency, then banks willhave to keep more cash reserves to meet the obligations. This will raise the reserve ratio, and lowerthe money multiplier. As a result money supply will decline.
Q-44 Explain the money multiplier approach to money supply [RTP-Nov’18]
Ans. The money multiplier approach to money supply propounded by Milton Friedman and Anna Schwartz,(1963) considers three factors as immediate determinants of money supply, namely:
(a) the stock of high-powered money (H)
(b) the ratio of deposit to reserve, e = {ER/D} and
(c) the ratio of deposit to currency, c ={C/D}
These three represent the behaviour of the central bank, behaviour of the commercial banks and thebehaviour of the general public respectively.
(a) The Behaviour of the Central Bank: The behaviour of the central bank which controls the issue ofcurrency is reflected in the supply of the nominal highpowered money. Money stock is determinedby the money multiplier and the monetary base is controlled by the monetary authority. Giventhe behaviour of the public and the commercial banks, the total supply of nominal money in theeconomy will vary directly with the supply of the nominal high-powered money issued by thecentral bank.
(b) The Behaviour of Commercial Banks: By creating credit, the commercial banks determine thetotal amount of nominal demand deposits. The behaviour of the commercial banks in the economyis reflected in the ratio of their cash reserves to deposits known as the ‘reserve ratio’. If the
210
required reserve ratio on demand deposits increases while all the other variables remain thesame, more reserves would be needed. This implies that banks must contract their loans, causinga decline in deposits and hence in the money supply. If the required reserve ratio falls, there willbe greater multiple expansions of demand deposits because the same level of reserves can nowsupport more demand deposits and the money supply will increase. The additional units of high-powered money that goes into ‘excess reserves’ of the commercial banks do not lead to anyadditional loans, and therefore, these excess reserves do not lead to the creation of deposits.When the required reserve ratio falls, there will be greater multiple expansions for demanddeposits. Excess reserves ratio e is negatively related to the market interest rate i. If interest rateincreases, the opportunity cost of holding excess reserves rises, and the desired ratio of excessreserves to deposits falls.
The Behaviour of the Public: The public, by their decisions in respect of the amount of nominal currencyin hand (how much money they wish to hold as cash) is in a position to influence the amount of thenominal demand deposits of the commercial banks. The behaviour of the public influences bank creditthrough the decision on ratio of currency to the money supply designated as the ‘currency ratio’.
The time deposit-demand deposit ratio i.e. how much money is kept as time deposits compared todemand deposits, also has an important implication for the money multiplier and hence for the moneystock in the economy. An increase in TD/DD ratio means that greater availability of free reserves andconsequent enlargement of volume of multiple deposit expansion and monetary expansion.
Thus the money multiplier approach, the size of the money multiplier is determined by the requiredreserve ratio (r) at the central bank, the excess reserve ratio (e) of commercial banks and the currencyratio (c) of the public.
The lower these ratios are, the larger the money multiplier is. In other words, the money supply isdetermined by high powered money (H) and the money multiplier (m) and varies directly with changesin the monetary base, and inversely with the currency and reserve ratios. Although these three variablesdo not completely explain changes in the nominal money supply, nevertheless they serve as usefuldevices for analysing such changes. Consequently, these variables are designated as the `proximatedeterminants’ of the nominal money supply in the economy.
Q-45 Explain the function of SLR? What are the eligible securities of SLR? [RTP-Nov’18]
Ans. The Statutory Liquidity ratio (SLR) is an instrument of monetary policy and aims to control liquidity inthe domestic market by means of manipulating bank credit. Changes in the SLR chiefly influence theavailability of resources in the banking system for lending. A rise in the SLR which is resorted to duringperiods of high liquidity, tends to lock up a rising fraction of a bank’s assets in the form of eligibleinstruments, and this reduces the credit creation capacity of banks. A reduction in the SLR duringperiods of economic downturn has the opposite effect. The SLR requirement also facilitates a captivemarket for government securities.
Following are the eligible securities of SLR;(i) Cash(ii) Gold valued at a price not exceeding the current market price,
or(iii) Investments in un-encumbered Instruments that include:
(a) Treasury-bills of the Government of India.(b) Dated securities including those issued by the Government of India fromtime to time under
the market borrowings programme and the Market Stabilization Scheme (MSS).(c) State Development Loans (SDLs) issued by State Governments under their market borrowings

211
programme.(d) Other instruments as notified by the RBI.
Q-46 Explain the effect of currency devaluation? Do you think a weak currency isadvantageous to a country?
[RTP-Nov’18]
Ans. Devaluation is a deliberate downward adjustment in the value of a country’s currency relative toanother currency, group of currencies or standard. It is a policy tool used by countries that have a fixedexchange rate or nearly fixed exchange rate regime and involves a discrete official reduction in theotherwise fixed par value of a currency. The monetary authority formally sets a new fixed rate withrespect to a foreign reference currency or currency basket.
Devaluation is primarily an expenditure switching policy. Ceteris paribus, the weakening of currencycan have positive effects on an economy’s trade balance.
Devaluation increases the price of foreign goods relative to goods produced in the home country anddiverts spending from foreign goods to domestic goods.
Devaluation implies that foreigners pay less for the devalued currency and that the residents of thedevaluing country pay more for foreign currencies. By lowering export prices, devaluation helps increasethe international competitiveness of domestic industries and increases the volume of exports.Devaluation lowers the relative price of a country’s exports, raises the relative price of its imports,increases demand both for domestic import-competing goods and for exports, leads to outputexpansion, encourages economic activity, increases the international competitiveness of domesticindustries, increases the volume of exports and promotes trade balance.
Q-47 Explain how speculative motive for holding cash is related to market interest rate [RTP-May’18]
Ans. According to Keynes’ theory of liquidity preference, speculative motive for holding cash is related tomarket interest. The market value of bonds and the market rate of interest are inversely related. A risein the market rate of interest leads to a decrease in the market value of the bond, and vice versa.Investors have a relatively fixed conception of the ’normal’ or ‘critical’ interest rate and compare thecurrent rate of interest with such ‘normal’ or ‘critical’ rate of interest.
If wealth-holders consider that the current rate of interest is high compared to the ‘normal or criticalrate of interest’, they expect a fall in the interest rate (rise in bond prices). At the high current rate ofinterest, they will convert their cash balances into bonds because:
(i) they can earn high rate of return on bonds
(ii) zthey expect capital gains resulting from a rise in bond prices consequent uponan expected fall inthe market rate of interest in future.
Conversely, if the wealth-holders consider the current interest rate as low, compared to the’normalor critical rate of interest’, i.e., if they expect the rate of interest to rise in future (fall in bondprices), they would have an incentive to hold their wealth in the form of liquid cash rather thanbonds because:
(i) the loss suffered by way of interest income forgone is small,
(ii) they can avoid the capital losses that would result from the anticipated increasein interest rates,and
(iii) the return on money balances will be greater than the return on alternative assets
(iv) If the interest rate does increase in future, the bond prices will fall and the idle cash balances heldcan be used to buy bonds at lower price and can thereby make a capital-gain.

212
Summing up, so long as the current rate of interest is higher than the critical rate of interest, atypical wealth-holder would hold in his asset portfolio only government bonds while if the currentrate of interest is lower than the critical rate of interest, his asset portfolio would consist whollyof cash. When the current rate of interest is equal to the critical rate of interest, a wealth-holderis indifferent to holding either cash or bonds. The inference from the above is that the speculativedemand for money and interest are inversely related.
Q-48 Describe the treatment of transactions demand for money as per Baumol and Tobin’s model.
[RTP-May’18]
Ans. Baumol (1952) and Tobin (1956) developed a deterministic theory of transaction demand for money,known as Inventory Theoretic Approach, in which money was essentially viewed as an inventory heldfor transaction purposes.
Inventory models assume that there are two media for storing value: money and an interest-bearingalternative asset. Baumol’s propositions in his theory of transaction demand for money hold thatreceipt of income, say Y takes place once per unit of time but expenditure is spread at a constant rateover the entire period of time. There is an opportunity cost of holding money: the interest forgone onan interest -bearing asset such as a bond. In order to maximize interest earnings, a person would liketo hold as much of his wealth as possible in the form of bonds, while still being able to finance the flowof monetary expenditures. If there is no cost to doing so, he would keep all of his wealth in the form of“bond” and hold zero money balances. However, making these transfers generally incurs some kind ofcost, either explicitly through a transaction fee or implicitly through the time and inconvenience ofmaking the transfer.
The level of inventory holding depends upon the carrying cost, which is the interest forgone by holdingmoney and not bonds, net of the cost to the individual of making a transfer between money and bonds,say for example brokerage fee. If an individual, say X, decided to invest in bonds. If r is the return onbond holding; c is the cost of each transaction in the bond market; (i.e. for converting it to liquid cash)and n is the number of bond transactions, then the net profit for the individual would be
R- (n c)
where R is the interest earning on the average bond holding which is equal to r times average bondholdings and nc the transaction costs which equal the cost of each transaction multiplied by the numberof bond transactions.
Therefore, for a given income, the choice of the split of total money into money and bond holdings isdetermined by the choice of n. The individual will choose n in such a way that the net profits from bondtransactions are maximized. The Baumol-Tobin model derives the optimal frequency of bond-moneytransactions that minimizes the sum of the two components of cost: the forgone interest cost (whichrises as average money balances increase) and the transaction cost (which falls as fewer transactionsare made or more money is held).
The individual will apply the marginalist principle and will increase the number of transactions in thebond market until the point at which the marginal interest earnings from one additional transactionjust equals the constant marginal cost, which will be equal to the brokerage fee etc. Beyond this point,the marginal gain in interest earned from increasing the number of bond market transactions is notsufficient to cover the brokerage cost of the transaction. To sum up, the choice of n determines thesplit of money and bond holdings for a given income.
The optimal average money holding is:
(i) a positive function of income Y,
(ii) a positive function of the price level P,

213
(iii) a positive function of transactions costs c, and
(iv) a negative function of the nominal interest rate i
Q-49 Describe the different determinants of money supply in a country. [RTP -May’18]
Ans. There are two alternate theories in respect of determination of money supply. According to the firstview, money supply is determined exogenously by the central bank. The second view holds that themoney supply is determined endogenously by changes in the economic activities which affect people’sdesire to hold currency relative to deposits, rate of interest, etc. The current practice is to explain thedeterminants of money supply based on `money multiplier approach’ which focuses on the relationbetween the money stock and money supply in terms of the monetary base or high-powered money.This approach holds that total supply of nominal money in the economy is determined by the jointbehaviour of the central bank, the commercial banks and the public.
The money supply is defined as
M= m X MB
Where M is the money supply, m is money multiplier and MB is the monetary base or high poweredmoney.
Money SupplyMoney Multiplier m =
Monetary Base
Money multiplier m is defined as a ratio that relates the change in the money supply to a given changein the monetary base. It denotes by how much the money supply will change for a given change in high-powered money. The multiplier indicates what multiple of the monetary base is transformed intomoney supply.
If some portion of the increase in high-powered money finds its way into currency, this portion doesnot undergo multiple deposit expansion. In other words, as a rule,an increase in the monetary basethat goes into currency is not multiplied, whereas an increase in monetary base that goes into supportingdeposits is multiplied.
Q-50 What role does Market Stabilization Scheme (MSS) play in our economy? [RTP -May’18]
Ans. Market Stabilization scheme (MSS), introduced in April 2004, is a monetary policy intervention by theRBI to withdraw excess liquidity (or money supply) by selling government securities in the economy.Under the Market Stabilisation Scheme (MSS) the Government of India borrows from the RBI (suchborrowing being additional to its normal borrowing requirements) and issues treasury-bills/datedsecurities that are utilized for absorbing from the market excess liquidity of a more enduring naturearising from large capital inflows. The bills/bonds issued under MSS would have all the attributes ofthe existing treasury bills and dated securities. The bills and securities will be issued by way of auctionsto be conducted by the Reserve Bank. These bonds are issued by RBI on the behalf of Government inorder to mop out excess liquidity from the market (Banks) and not for raising capital for government.
Q-51 Examine what would be the effect on money multiplier if banks hold excess reserves?[RTP -May’18]
Ans. The money multiplier approach to money supply considers the ratio of deposit to reserve, e = {ER/D)which represent the behaviour of commercial banks as one of the determinants of money supply. Thecommercial banks are required to keep only a part or fraction of their total deposits in the form of cashreserves. For the commercial banking system as a whole, the actual reserves ratio may be greater thanthe required reserve ratio since the banks keep with them a higher than the statutorily requiredpercentage of their deposits in the form of cash reserves. The additional units of highpowered moneythat goes into ‘excess reserves’ of the commercial banks do not lead to any additional loans, andtherefore, these excess reserves do not lead to creation of money. Therefore, if the central bank

214
injects money into the banking system and these are held as excess reserves by the banking system,there will be no effect on deposits or currency and hence no effect on money multiplier and thereforeon money supply.
Q-52 Write a note on Cash Reserve Ratio (CRR). Explain the operation of CRR. [RTP -May’18]
Ans. Cash Reserve Ratio (CRR) refers to the fraction of the total net demand and time liabilities (NDTL) of ascheduled commercial bank in India which it should maintain as cash deposit with the Reserve Bank.The RBI may set the ratio in keeping with the broad objective of maintaining monetary stability in theeconomy. The credit creation capacity of commercial banks is inversely related the cash reserve ratio.Higher the CRR, lower will be the credit creation and vice versa.
CRR has, in recent years, assumed significance as one of the important quantitative tools aiding inliquidity management. Higher the CRR with the RBI, lower will be the liquidity in the system and viceversa. During deflation, the RBI reduces the CRR in order to enable the banks to expand credit andincrease the supply of money available in the economy. In order to contain credit expansion duringperiods of inflation, the RBI increases the CRR.
Q-53 Compute M1 supply of money from the data given below:
Currency with public 2,13,279.8 Crores
Time deposits with bank 3,45,000.7 Crores
Demand deposits with bank 1,62,374.5 Crores
Post office savings deposit 382.9 Crores
Other deposits of RBI 765.1 Crores [Sugg.May’19,3 Marks]
Ans. Calculation of M1
M1 = Currency and coins with the people + demand deposits of banks (current and savingaccounts) + other deposits of the RBI.
M1 = 2,13,279.8 + 1,62,374.5 + 765.1
= 3,76,419.4 Crores
Q-54 Why is the central bank referred to as a “banker’s bank” ? [Sugg.-May’19,2 Marks]
Ans. A central bank of a country is called a ‘bankers’ bank because it acts as a banker to the community ofcommercial banks and provides them with financial services to facilitate their efficient functioning.
• The central bank acts as a custodian of cash reserves of commercial banks in the country.
• The central bank provides efficient means of funds transfer for all banks. All commercial banksmaintain accounts with the central bank and it enables smooth and swift clearing and settlementsof inter-bank transactions and interbank payments.
• The central bank acts as a lender of last resort. It provides liquidity to banks when the latter faceshortage of liquidity. The scheduled commercial banks can borrow from the discount windowagainst the collateral of securities like commercial bills, government securities, treasury bills, orother eligible papers.
Q-55 What will be the total credit created by the commercial banking system for an initial deposit of ` 3000at a Required Reserve Ratio (RRR) of 0.05 and 0.08
respectively? Also compute credit multiplier. [Sugg.-May’19,2 Marks]
Ans. The credit multiplier is the reciprocal of the required reserve ratio.

215
1Credit Multiplier =
Required Reserve Ratio
For RRR = 0.05 Credit Multiplier = 1/ 0.05 = 20
For RRR = 0.08 Credit Multiplier = 1/ 0.08 = 12.5
Credit Creation = Initial Deposit x 1/RRR
For RRR = 0.05, Credit creation will be 3000x 1/0.05 = 60,000/
For RRR = 0.08, Credit creation will be 3000x 1/0.08 = 37,500/
Q-56 “Money has four functions: a medium, a measure, a standard and a store.” Elucidate.
[Sugg.-May’19,2 Marks]
Ans. Money performs many important functions in an economy.
(i) Money is a convenient medium of exchange or it is an instrument that facilitates easy exchange ofgoods and services. Money, though not having any inherent power to directly satisfy humanwants, by acting as a medium of exchange, it commands purchasing power and its possessionenables us to purchase goods and services to satisfy our wants. By acting as an intermediary,money increases the ease of trade and reduces the inefficiency and transaction costs involved ina barter exchange. By decomposing the single barter transaction into two separate transactions ofsale and purchase, money eliminates the need for double coincidence of wants. Money alsofacilitates separation of transactions both in time and place and this in turn enables us to economizeon time and efforts involved in transactions.
(ii) Money is a ‘common measure of value’. The monetary unit is the unit of measurement in terms ofwhich the value of all goods and services is measured and expressed. It is convenient to trade allcommodities in exchange for a single commodity. So also, it is convenient to measure the pricesof all commodities in terms of a single unit, rather than rec ord the relative price of every good interms of every other good. A common unit of account facilitates a system of orderly pricing whichis crucial for rational economic choices. Goods and services which are otherwise not comparableare made comparable through expressing the worth of each in terms of money.
(iii) Money serves as a unit or standard of deferred payment i.e money facilitates recording of deferredpromises to pay. Money is the unit in terms of which future payments are contracted or stated.However, variations in the purchasing power of money due to inflation or deflation, reduces theefficacy of money in this function.
(iv) Like nearly all other assets, money is a store of value. People prefer to hold it as an asset, that is,as part of their stock of wealth. The splitting of purchases and sale into two transactions involvesa separation in both time and space.
This separation is possible because money can be used as a store of value or store of means ofpayment during the intervening time. Again, rather than spending one’s money at present, onecan store it for use at some future time.
Thus, money functions as a temporary abode of purchasing power in order to efficiently perform itsmedium of exchange function. Money also functions as a permanent store of value. Money is the onlyasset which has perfect liquidity.
Q-57 Describe the determinants of demand for money as identified by Milton Friedman in his re-statementof Quantity Theory of demand for money. [Sugg.-May’19,3 Marks]
Ans. According to Milton Friedman, Demand for money is affected by the same factors as demand for anyother asset, namely
216
1. Permanent income.
2. Relative returns on assets. (which incorporate risk)
Friedman maintains that it is permanent income – and not current income as in the Keynesian theory –that determines the demand for money. Permanent income which is Friedman’s measure of wealth isthe present expected value of all future income. To Friedman, money is a good as any other durableconsumption good and its demand is a function of a great number of factors.
Friedman identified the following four determinants of the demand for money. The nominal demandfor money:
• is a function of total wealth, which is represented by permanent income divided by the discountrate, defined as the average return on the five asset classes in the monetarist theory world,namely money, bonds, equity, physical capital and human capital.
• is positively related to the price level, P. If the price level rises the demand for money increasesand vice versa.
• rises, if the opportunity costs of money holdings (i.e. returns on bonds and stock) decline and viceversa.
• is influenced by inflation, a positive inflation rate reduces the real value of money balances,thereby increasing the opportunity costs of money holdings.
Q-58 The RBI Published the following data as on 31st March, 2018. You are required tocompute M 4:
(` in crores)
Currency with the public 1,12,206.6
Demand Deposits with Banks 1,93,300.4
Net Time Deposits with Banks 2,67,310.2
Other Deposits of RBI 614.8
Post Office Savings Deposits 277.5
Post Office National Savings Certificates (NSCs) 110.5
[Sugg.-Nov’18,3 Marks]
Ans. M 4 = Currency and coins with the people + demand deposits with the banks (Current and Savingaccounts) + other deposits with the RBI + Net time deposits with the banking system + Total depositswith the Post Office Savings (excluding National Savings Certificates).
Components ` in Crores
Currency with the public 1,12,206.6
Demand deposits with banks 1,93,300.4
Other deposits with the RBI 614.8
Net time deposits with the banking system. 2,67,310.2
Post Office Savings deposits 277.5
Total 5,73,709.5
Q-59 Mention the general characteristics of Money.
[Sugg.-Nov’18,2 Marks]
Ans. There are some general characteristics that money should possess in order to make it serve its functionsas money. Money should be:
• Generally acceptable
217
• Durable or long-lasting
• Effortlessly recognizable
• Difficult to counterfeit i.e. not easily reproducible by people
• Relatively scarce, but has elasticity of supply
• Portable or easily transported
• Possessing uniformity; and
• Divisible into smaller parts in usable quantities or fractions without losing value.
Q-60 Explain the different mechanism of monetary policy which influences the price-level and nationalincome. [Sugg.-Nov’18,3 Marks]
Ans. The process or channels through which the evolution of monetary aggregates affects the level ofproduct and prices is known as ‘monetary transmission mechanism’. There are mainly four differentmechanisms, namely, the interest rate channel, the exchange rate channel, the quantum channel, andthe asset price channel.
The interest rate channel: A contractionary monetary policyinduced increase in interest rates increasesthe cost of capital and the real cost of borrowing for firms and households with the result that they cutback on their investment expenditures and durable goods consumption expenditures respectively. Adecline in aggregate demand results in a fall in aggregate output and employment. Conversely, anexpansionary monetary policy induced decrease in interest rates will have the opposite effect throughdecreases in cost of capital for firms and cost of borrowing for households.
The exchange rate channel: The exchange rate channel works through expenditure switching betweendomestic and foreign goods. Appreciation of the domestic currency makes domestically producedgoods more expensive compared to foreign produced goods. This causes net exports to fall;correspondingly domestic output and employment also fall.
The quantum channel (e.g., relating to money supply and credit) Two distinct credit channels: the banklending channel and the balance sheet channel- also allow the effects of monetary policy actions topropagate through the real economy. Credit channel operates by altering access of firms and householdsto bank credit.
A direct effect of monetary policy on the firm’s balance sheet comes about when an increase in interestrates works to increase the payments that the firm must make to service its floating rate debts. Anindirect effect sets in, when the same increase in interest rates works to reduce the capitalized valueof the firm’s longlived assets.
The asset price channel: Asset prices respond to monetary policy changes and consequently impactoutput, employment and inflation. A policy induced increase in the shortterm nominal interest ratesmakes debt instruments more attractive than equities in the eyes of investors leading to a fall in equityprices, erosion in household financial wealth, fall in consumption, output, and employment.
Q-61 Explain the Monetary Policy Framework Agreement. [Sugg.-Nov’18,2 Marks]
Ans. The Reserve Bank of India (RBI) Act, 1934 was amended in 2016, for giving a statutory backing to theMonetary Policy Framework Agreement. It is an agreement reached between the Government of Indiaand the RBI on the maximum tolerable inflation rate that the RBI should target to achieve price stability.The amended RBI Act (2016) provides for a statutory basis for the implementation of the ‘flexibleinflation targeting framework’ by abandoning the ‘multiple indicator’ approach. T he inflation target isto be set by the Government of India, in consultation with the Reserve Bank, once in every five years.Accordingly,
• the Central Government has notified 4 per cent Consumer Price Index (CPI) inflation as the target

218
for the period from August 5, 2016 to March 31, 2021 with the upper tolerance limit of 6 per centand the lower tolerance limit of 2 per cent.
• The RBI is mandated to publish a Monetary Policy Report every six months, explaining the sourcesof inflation and the forecasts of inflation for the coming period of six to eighteen months.
Q-62 What would be the impact of each of the following on credit multiplier and money supply?
(i) If Commercial Banks keep 100 percent reserves.
(ii) If Commercial Banks do not keep reserves.
(iii) If Commercial Banks keep excess reserves. [Sugg.-May’18,3 Marks]
Ans.1
Credit Multiplier =Required Reserve Ratio
(i) If commercial banks keep 100% reserves, the reserve deposit ratio is one and thevalue of moneymultiplier is one. Deposits simply substitute for the currency that isheld by banks as reserves andtherefore, no new money is created by banks.
(ii) If commercial banks do not keep reserves and lends the entire deposits, it is a case of zerorequired reserve ratio and credit multiplier will be infinite and therefore money creation willalso be infinite.
(iii) Excess reserves are reserves over and above what banks are legally required to hold againstdeposits. The additional units of money that goes into ‘excess reserves’ of the commercial banksdo not lead to any additional loans, and therefore, these excess reserves do not lead to creationof money. The increase in banks’ excess reserves reduces the credit multiplier, causing the moneysupply to decline.
Q-63 Explain the following modified equation of exchange as given by Irving Fisher:
MV + M’V’=PT [Sugg.-May’18,3 Marks]
Ans. Modified Equation of Exchange
MV + M’ V’ = PT
MV + M’ V’ = PT is an extended form of the original equation of exchange which Fisher gave to includedemand deposits (M’) and their velocity (V’) in the total supply of money. The equation can also berewritten as P = (MV + M’ V’) / T
From the above equation, it is evident that the price level is determined by the following factors: (i)Quantity of money in circulation (M), (ii) the velocity of circulation of money (V), (iii) the volume ofcredit money (M’), the velocity of circulation of credit money (V’) and the volume of trade (T).
The equation of exchange further shows that the price level (P) is directly related to M, V, M’ and V’. Itis, however, inversely related to T. Velocity of money in circulation (V) and the velocity of credit money(V’) remain constant. Since full employment prevails and since T is function of national income thevolume of transactions T is fixed in the short run.
The total volume of transactions (T) multiplied by the price level (P) represents the demand for money.The demand for money (PT) is equal to the supply of money (MV + M’V’). In any given period, the totalvalue of transactions made is equal to PT and the value of money flow is equal to MV+ M’V’.
Q-64 Explain why people hold money according to Liquidity Preference Theory. [Sugg.-May’18,3 Marks]
Ans. Reasons for holding money as per Liquidity Preference Theory:
According to Keynes’ Liquidity Preference Theory’, people hold money (M) in cash for three motives:

219
i. The transactions motive: People hold cash for current transactions forpersonal and businessexchanges i.e. to bridge the time gap between receipt ofincome and planned expenditures.
ii. The precautionary motive: People hold cash to make unanticipated expenditures that may occurdue to unforeseen and unpredictable contingencies.
iii The speculative motive: This motive reflects people’s desire to hold cash in order to be equippedto exploit any attractive investment opportunity requiring cash expenditure. According to Keynes,people demand to hold money balances to take advantage of the future changes in the rate ofinterest, which is the same as future changes in bond prices.
Q-65 Explain the difference between Liquidity Adjustment Facility (LAP) and Marginal Standing
Facility (MSF). [Sugg.-May’18,3 Marks]
Ans. Difference between Liquidity Adjustment Facility (LAF) and Marginal Standing Facility (MSF).
Liquidity Adjustment Facility (LAF) which was introduced by RBI in June, 2000, is a facility extended tothe scheduled commercial banks and primary dealers to avail of liquidity in case of requirement on anovernight basis against the collateral of government securities including state government securities.Its objective is to assist banks to adjust their day to day mismatches in liquidity. Currently, the RBIprovides financial accommodation to the commercial banks through repos / reverse repos under LAF.
Marginal Standing Facility (MSF) which was introduced by RBI in its monetary policy statements 2011 -12, refers to the facility under which scheduled commercial banks can borrow additional amount ofovernight money from the central bank over and above what is available to them through the LAFwindow by dipping into their Statutory Liquidity Ratio (SLR) portfolio up to a limit at a penal rate ofinterest. This provides a safety valve against unexpected liquidity shocks to the banking system.
The MSF would be the last resort for banks once they exhaust all borrowing options including theliquidity adjustment facility.
Q-66 How do changes in Cash Reserve Ratio (CRR) impact the economy? [Sugg.-May’18,2 Marks]
Ans. Impact of changes in Cash Reserve Ratio (CRR):
Change in Cash Reserve Ratio is one of the important quantitative tools aiding in liquidity management.Higher the CRR with the central bank, lower will be the liquidity in the system and vice versa. In orderto control credit expansion during periods of inflation, the central bank increases the CRR. With higherCRR, banks have to keep more reserves and the banks’ lendable resources get depleted leading todecrease in the volume of bank lending and contraction in credit and money supply in the economy.
During deflation, the central bank reduces the CRR in order to enable the banks to expand credit andincrease the supply of money available in the economy. With more credit available in the market,economic activities get accelerated bringing the economy back to stability and economic growth.
Q-67 Explain the role of Monetary Policy Committee (MPC) in India. [Sugg.-Nov’18,3 Marks]
Ans. Monetary Policy Committee (MPC) constituted by the Central Government is an empowered six-member committee with RBI Governor as the chairperson. Under the Monetary Policy FrameworkAgreement, the RBI will be responsible for price stability and for containing inflation targets at 4%(with a standard deviation of 2%) in the medium term. The committee is answerable to the Governmentof India if the inflation exceeds the range prescribed for three consecutive months. MPC has completecontrol over monetary policy decisions to ensure economic growth and price stability. The MPC decidesthe changes to be made to the policy rate (repo rate) so as to contain inflation within the target levelspecified to it by the central government. Fixing of the benchmark policy interest rate (repo rate) ismade in a more consultative and participative manner and on the basis of m ajority vote by this panelof experts. This has added lot of value and transparency to monetary policy decisions.
220
Q-68 How does the monetary policy influence the price level and the national income? [RTP-May’2020]
Ans. The process or channels through which the change of monetary aggregates affects the level of productand prices is known as ‘monetary transmission mechanism’. There are mainly four different mechanismsthrough which monetary policy influences the price level and the national income. These are: (a) theinterest rate channel, (b) the exchange rate channel, (c) the quantum channel (e.g., relating to moneysupply and credit), and (d) the asset price channel i.e. via equity and real estate prices.
Under the interest rate channel, changes in monetary policy are eventually reflected in the real long-term interest rates which influence aggregate demand by altering business investment and durableconsumption decisions. This, in turn, gets reflected in aggregate output and prices.
The exchange rate channel works through expenditure switching between domestic and foreign goods.Appreciation of the domestic currency makes domestically produced goods more expensive comparedto foreign- produced goods. This causes net exports to fall; correspondingly domestic output andemployment also fall.
The Quantum channel operates by altering access of firms and households to bank credit. Mostbusinesses and people mostly depend on bank for borrowing money. “An open market operation” thatleads first to a contraction in the supply of bank reserves and then to a contraction in bank creditrequires banks to cut back on their lending. This, in turn makes the firms that are especially dependenton banks loans to cut back on their investment spending. Thus, there is decline in the aggregate outputand employment following a monetary contraction.
The asset price channel suggests that asset prices respond to monetary policy changes and consequentlyaffect output, employment and inflation.
Q-69 (a) Answer the following question using Keynesian framework of demand for money.
An investment consultant suggests holding of cash instead of bonds. What could be the reason toencourage holding of money balances? Explain
(b) Calculate liquidity aggregate L2 when the following information is given-
Particulars ` in crore
Term deposits with term lending institutions 750
Term borrowing by refinancing institutions 450
All deposits with post office savings banks 1320
Term deposits with refinancing institutions 590
Certificate of deposits issued by FIs 290
Public deposits of non-banking financial companies 450
NM3 2650
National saving certificates 240
[RTP-May’2020]
Ans.(a) The market value of bonds and the market rate of interest are inversely related. The investmentconsultant considers the current interest rate as low, compared to the ‘normal or critical rate of interest’,i.e., he expects the rate of interest to rise in future (fall in bond prices), and therefore it is advantageousto hold wealth in the form of liquid cash rather than bonds because:
(i) when interest is low, the loss suffered by way of interest income forgone is small,
(ii) one can avoid the capital losses that would result from the anticipated increase in interest rates,and

221
(iii) the return on money balances will be greater than the return on alternative assets
(iv) if the interest rate does increase in future, the bond prices will fall and the idle cash balances heldcan be used to buy bonds at lower price and can thereby make a capital-gain.
(b) L2 = L1 + Term deposits with term lending institutions + Term deposits with refinancing institutions +Term borrowing by refinancing institutions + Certificate of deposits issued by FIs
Where L1 = NM3 + All deposits with post office savings banks
= 2650 + 1320
= 3970 crore
Therefore L2 = 3970 + 750 +590 + 450 + 290
= 6050 crore
Q-70 Explain the role of Liquidity Adjustment Facility (LAF). [RTP-May’2020]
Ans. RBI has introduced Liquidity Adjustment Facility (LAF) in 2000. The Liquidity Adjustment Facility(LAF) isa facility extended by the Reserve Bank of India to the scheduled commercial banks (excluding RRBs)and primary dealers to avail of liquidity in case of requirement (or park excess funds with the RBI incase of excess liquidity) on an overnight basis against the collateral of government securities includingstate government securities. The introduction of LAF is an important landmark since it triggered a rapidtransformation in the monetary policy operating environment in India. As a key element in the operatingframework of the RBI, its objective is to assist banks to adjust their day to day mismatches in liquidity.Currently, the RBI provides financial accommodation to the commercial banks through repos/reverserepos under the Liquidity Adjustment Facility (LAF).
Q-71 Compute reserve money from the following data published by RBI:
(` in crores)
Net RBI credit to the government 8,51,651
RBI Credit to the commercial sector 2,62,115
RBI’s claim on Banks 4,10,315
Government’s Currency liabilities to the public 1,85,060
RBI’s net foreign assets 72,133
RBI’s net non-monetary liabilities 68,032
[Sugg.-Nov’19,3 Marks]
Ans. Reserve Money = Net RBI credit to the Government + RBI credit to the Commercial sector + RBI’s Claimson banks + RBI’s net Foreign assets + Government’s Currency liabilities to the public – RBI’s net non -monetary Liabilities.
= 851651 + 262115 + 410315 + 72133 + 185060 -68032
= 1713242 crores
Q-72 Explain the open market operations conducted by RBI. [Sugg.-Nov’19,2 Marks]
Ans. Open Market Operations (OMO) is a general term used for monetary policy involving market operationsconducted by the Reserve Bank of India by way of sale/ purchase of government securities to/ from themarket with an objective to adjust the rupee liquidity conditions in the market on a durable basis.
When the Reserve Bank of India feels that there is excess rupee liquidity in the market, it resorts tosale of government securities for absorption of the excess liquidity. Similarly, when the liquidityconditions are tight, the RBI will buy securities from the market, thereby injecting liquidity into themarket.

222
Q-73 Explain ‘Reverse Repo Rate’. [Sugg.-Nov’19,2 Marks]
Ans. ‘Reverse repo operation’ is a monetary policy instrument and in effect it absorbs the liquidity from thesystem. This operation takes place when the RBI borrows money from commercial banks by sellingthem securities (which RBI permits) with an agreement to repurchase the securities on a mutuallyagreed future date at an agreed price which includes interest for the funds borrowed. The interest ratepaid by the RBI for such borrowings is called the “Reverse Repo Rate”. Thus, reverse repo rate is therate of interest paid by the RBI on its borrowings from commercial banks.
Q-74 Compute credit multiplier if the Required Reserve Ratio is 10% and 12.5% for every ` 1,00,000 depositedin the banking system.
What will be the total credit money created by the banking system in each case ?
[Sugg.-Nov’19,2 Marks]
Ans. The credit multiplier is the reciprocal of the required reserve ratio.
1CreditMultiplier =
Required Reserve Ratio
For RRR = 0.10 i.e. 10% the Credit Multiplier = 1/ 0.10 = 10
For RRR = 0.125 i.e. 12.5% Credit Multiplier = 1/ 0.125 = 8
Credit Creation = Initial Deposit x 1/RRR
For RRR = 0.10, Credit creation will be 1, 00,000 x 1/0.10 = ` 10, 00,000
For RRR = 0. 125, Credit creation will be 1, 00,000 x 1/0. 125 = ` 8, 00,000
Q-75 Explain the neo-classical approach to demand for money. [Sugg.-Nov’19,3 Marks]
Ans. The Neo classical Approach or the cash balance approach put forth by Cambridge economists holds thatmoney increases utility in the following two ways:
1. for transaction motive, i.e. for enabling the possibility of split-up of sale and purchase to twodifferent points of time rather than being simultaneous
2. as a temporary store of wealth i.e. for a hedge against uncertainty
Since demand for money also involves a precautionary motive in this approach and money gives utilityin its store of wealth and precautionary modes, money is demanded for itself. How much money willbe demanded depends:
(i) partly on income which points to transactions demand, such that higher the income, the greaterthe quantity of purchases and as a consequence greater will be the need for money as a temporaryabode of value to overcome transactions costs, and
(ii) partly on other factors of which important ones are wealth and interest rates.
The Cambridge equation is stated as:
Md = k PY
Where
Md = is the demand for money
Y = real national income
P = average price level of currently produced goods and services
PY = nominal income

223
k = proportion of nominal income (PY) that people want to hold as cash balances
The term ‘k’ in the above equation is called ‘Cambridge k’. The equation above explains that thedemand for money (M) equals k proportion of the total money income. The neoclassical theory changedthe focus of the quantity theory of money to money demand and hypothesized that demand for moneyis a function of money income.

224
CHAPTER-4MONEY MARKET
Q-1 Assume that 15% specific tariff is levied by the government on every sunglass which is imported intoIndia, and if 2000 sunglasses are imported and price of each sunglass is Rs.1000/- , then find out theamount of total tariff revenue collected by the government? [MTP- Oct’19,2 Marks]
Ans. Specific tariff is an import duty which levied as a fixed charge per unit of the good imported. Thereforeamount in total tariff revenue = 2000*15% = Rs. 300/- In this case, total Rs. 300/- is collected, whetherthe price of a sunglass is of Rs. 1000 or Rs. 2000 for different brand.
Q-2 How does trade increase economic efficiency and which view argued that trade is a zero- sum gameand how? [MTP-March’19,3 Marks]
Ans. Economic efficiency increases due to quantitative and qualitative benefits of extended division oflabour, economies of large scale production, betterment of manufacturing capabilities, increasedcompetitiveness and profitability by adoption of cost reducing technology and business practices anddecrease in the likelihood of domestic monopolies. Efficient deployment of productive resources -natural, human, industrial and financial resources ensures productivity gains.
Mercantilist argued that trade is a zero sum game. Mercantilism advocated maximizing exports inorder to bring in more precious metals and minimizing imports through the state imposing very hightariffs on foreign goods. This view argues that trade is a ‘zero-sum game’, with winners who win doesso only at the expense of losers and one country’s gain is equal to another country’s loss, so that the netchange in wealth or benefits among the participants is zero.
Q-3 What is meant by foreign exchange market? What are the roles played by the participants in theforeign exchange market? [MTP-March’19,5 Marks]
Ans. The wide-reaching collection of markets and institutions that handle the exchange of foreign currenciesis known as the foreign exchange market. Being an over-the-counter market, it is not a physical place;rather, it is an electronically linked network of big banks, dealers and foreign exchange brokers whobring buyers and sellers together.
The major participants in the exchange market are central banks, commercial banks, governments,foreign exchanged dealers, multinational corporations that engage in international trade andinvestments, non-bank financial institutions such as asset management firms, insurance companies,brokers, arbitrageurs and speculators. The central banks participate in the foreign exchange markets,not to make profit, but essentially to contain the volatility of exchange rate to avoid sudden andlargeappreciation or depreciation of domestic currency and to maintain stability in exchange rate inkeeping with the requirements of national economy. If the domestic currency fluctuates excessively, itcauses panic and uncertainty in the business world. Commercial banks participate in the foreignexchange market either on their own account or for their clients. When they trade on their own account,banks may operate either as speculators or arbitrageurs/or both.
The bulk of currency transactions occur in the inter-bank market in which the banks trade with eachother. Foreign exchange brokers participate in the market as intermediaries between different dealersor banks. Arbitrageurs profit by discovering price differences between pairs of currencies with different

225
dealers or banks. Speculators, who are bulls or bears, are deliberate risk-takers who participate in themarket to make gains which result from unanticipated changes in exchange rates.
Other participants in the exchange market are individuals who form only a very insignificant fraction interms of volume and value of transactions.
Q-4 What are the main advantages of fixed rate regime in an open economy? [MTP-March’19,3 Marks]
Ans. In an open economy, the main advantages of a fixed rate regime are, firstly, a fixed exchange rateavoids currency fluctuations and eliminates exchange rate risks and transaction costs that can impedeinternational flow of trade and investments. A fixed exchange rate can thus greatly enhanceinternational trade and investment. Secondly, a fixed exchange rate system imposes discipline on acountry’s monetary authority and therefore is more likely to generate lower levels of inflation. Thirdly,the government can encourage greater trade and investment as stability encourages investment.Fourthly, exchange rate peg c an also enhance the credibility of the country’s monetary policy. Andlastly, in the fixed or managed floating (where the market forces are allowed to determine the exchangerate within a band) exchange rate regimes, the central bank is required to stand ready to intervene inthe foreign exchange market and, also to maintain an adequate amount of foreign exchange reservesfor this purpose.
Q-5 Define the term Regional Trade Agreement (RTAs)? [MTP-March’19,2 Marks]
Ans. Regional Trade Agreements (RTAs) are defined as grouping of countries, which are formed under theobjective of reducing barriers to trade between member countries; not necessarily belonging to thesame geographical region.
Q-6 The table below shows the number of labour hours required to produce wheat and cloth in two countriesX and Y.
Commodity Country X Country Y
1 unit of cloth 4 1.0
1 unit of wheat 2 2.5
(i) Compare the productivity of labour in both countries in respect of both commodities
(ii) Which country has absolute advantage in the production of wheat?
(iii) Which country has absolute advantage in the production of cloth? What is meant by Crowdingout? [MTP-March’19,3 Marks]
Ans. (i) Productivity of labour (output per labour hour = the volume of output produced per unit oflabourinput)
= output / input of labour hours
Output of commodity Units in Units in
Country X Country Y
Cloth 0.25 1.0
Wheat 0.50 0.4
(ii) A country has an absolute advantage in producing a good over another country if it requires fewerresources to produce that good. Since one hour of labour time produces 0.5 units of wheat in country Xagainst 0.4 units in country Y. Therefore, Country X has absolute advantage in production of wheat.
(iii) Since one hour of labour time produces 1.0 units of rice in country Y against 0.25 units in country X.Therefore, Country Y has absolute advantage in production of cloth.

226
Q-7 Define Foreign Direct Investment (FDI). Mention two arguments made in favor of FDI to developingeconomies like India? [MTP-March’19,3 Marks]
Ans. Foreign direct investment is defined as a process whereby the resident of one country (i.e. homecountry) acquires ownership of an asset in another country (i.e. the host country) and such movementof capital involves ownership, control as well as management of the asset in the host country. Directinvestments are real investments in factories, assets, land, inventories etc. and have three components,viz., equity capital, reinvested earnings and other direct capital in the form of intra-company loans.Foreign direct investment also includes all subsequent investment transactions between the investorand the enterprise and among affiliated enterprises, both incorporated and unincorporated. FDI involveslong term relationship and reflects a lasting interest and control. According to the IMF and OECDdefinitions, the acquisition of at least ten percent of the ordinary shares or voting power in a public orprivate enterprise by non-resident investors makes it eligible to be categorized as FDI. FDI maybecategorized as horizontal, vertical, conglomerate and two- way direct foreign investments whichare reciprocal investments.
Benefits of Foreign Direct Investment
Following are the benefits ascribed to foreign investments:
(i) Entry of foreign enterprises usually fosters competition and generates a competitiveenvironmentin the host country.
(ii)International capital allows countries to finance more investment than can be supported bydomesticsavings resulting in higher productivity and enhanced output.
Q-8 What is Arbitrage? What is the outcome of Arbitrage [MTP-March’19,2 Marks]
Ans. Arbitrage refers to the practice of making risk-less profits by intelligently exploiting price differencesof an asset at different dealing places. On account of arbitrage, regardless of physical location, at anygiven moment, all markets tend to have the same exchange rate for a given currency.
Q-9 What is mean by Anti-dumping duties? [MTP-March’19,2 Marks]Ans. Anti-dumping measures consist of imposition of additional import duties to offset the effects of
dumping. These measures are initiated as safeguards to offset the foreign firm’s unfair price advantage.This is justified only if the domestic industry is seriously injured by import competition, and protectionis in the national interest (that is, the associated costs to consumers would be less than the benefitsthat would accrue to producers).
Q-10(i) What’s meant by Foreign Portfolio investment?
(ii) Explain the Real Exchange Rate. [MTP-March’19,5 Marks]
Ans. (i) Foreign Portfolio Investment: Foreign portfolio investment is the flow of ‘financial capital’ ratherthan ‘real capital’ and does not involve ownership or control on the part of the investor.Examples of foreign portfolio investment are the deposit of funds in an Indian or a British bank by anItalian company or the purchase of a bond (a certificate of indebtedness) of a Swiss company or of theSwiss government by a citizen or company based in France. Unlike FDI, portfolio capital, in general,moves to investment in financial stocks, bonds and other financial instruments and is effected largelyby individuals and institutions through the mechanism of capital market. These flows of financialcapital have their immediate effects on balance of payments or exchange rates rather than on productionor income generation.
(ii) Real Exchange Rate: The’real exchange rate’ describes ‘how many’ of a good or service in one countrycan be traded for ‘one’ of that good or service in a foreign country. It is calculated as :
Domestic price IndexReal exchange rate = Nominal exchange rate X
Foreign price Index

227
Real Exchange Rate (RER) incorporates changes in prices.Q-11 Enumerate six important effects of depreciation in exchange rate on domestic economy?
[MTP-March’19,5 Marks]Ans. Fluctuations in the exchange rate affect the economy by changing the relative prices of domestically-
produced and foreign-produced goods and services. Following are the major effects of depreciation ofdomestic currency.(1) All else equal, depreciation lowers the relative price of a country’s exports and raises the relative
price of its imports. When a country’s currency depreciates, foreigners find that its exports arecheaper and domestic residents find that imports from abroad are more expensive. Exporters willbe benefitted as goods exported abroad will fetch forex which can now be converted to morerupees. By lowering export prices, currency depreciation helps increase the internationalcompetitiveness of domestic industries, increases the volume of exports and promotes tradebalance. When a country’s currency depreciates, production for exports and of import substitutesbecome more profitable. Therefore, factors of production will be induced to move into the tradablegoods sectors and out of the non tradable goods sectors. Such resource movements involveeconomic wastes.
(2) Depreciation increases the price of foreign goods relative to goods produced i n the home countryand help divert spending from foreign goods to domestic goods. Increased demand, both fordomestic import-competing goods and for exports encourages economic activity and createsoutput expansion.
(3) For an economy where exports are significantly high, a depreciated currency would mean a lot ofgain. In addition, if exports originate from labour-intensive industries, increased export priceswill have spiraling effects on wages, employment and income.
(4) In an under developed or semi industrialized country, where inputs and components formanufacturing are mostly imported and cannot be domestically produced, increased import priceswill increase firms’ cost of production, push domestic prices up and decrease real output.
(5) Depreciation is also likely to fuel consumer price inflation, directly through its effect on prices ofimported consumer goods and also due to increased demand for domestic goods. The impact willbe greater if the composition of domestic consumption baskets consists more of imported goods.Indirectly, cost push inflation may result through possible escalation in the cost of importedcomponents and intermediaries used in production.
(6) The fiscal health of a country whose currency depreciates is likely to be affected with risingimport payments and consequent rising current account deficit (CAD). In case of foreign currencydenominated government debts, currency depreciation will increase the interest burden andcause strain to the exchequer for repaying and servicing foreign debt.
Q-12 Please refer to the table below.
(i) Which of the three exporters engage on anticompetitive act in the international market whilepricing its export of goods X to Country D?
(ii) What would be effect of such pricing on domestic producers of Good X? Advise remedy availablefor country D?
Good X Country A(In $ ) Good X(In $) Country A(In $ )
Average Cost 30.5 29.4 30.9
Price per unit for domestic sales 31.2 31.1 30.9
Price Charged in Country D 31.9 30.6 30.6
[MTP-April’18,3 Marks]
228
Ans. (i) Dumping by Country B and Country C. B because it sells at a lower price than that in domestic market;Country C because it is selling at a price which is less than the average cost of production.
(ii)Adverse effects on domestic industry as they will lose competitiveness in their markets due tounfair practice of dumping. Country D may prove damage to domestic industries and charge anti-dumping duties on goods imported from Country B and Country C so as to raise the price and makeit at par which similar goods produced by domestic firms.
Q-13 Enumerate the bases of distinction between FDI and FPI. [MTP-April’18,5 Marks]
Ans. Foreign direct investment is defined as a process whereby the resident of one country (i.e. homecountry) acquires ownership of an asset in another country (i.e. the host country) and such movementof capital involves ownership, control as well as management of the asset in the host country. Foreignportfolio investment is the flow of what economists call ‘financial capital’ rather than ‘real capital’ anddoes not involve ownership or control on the part of the investor.
Foreign direct investment (FDI) VS Foreign portfolio investment (FPI)
FDI FPI
Direct investments are real investments in Portfolio capital, in general, moves to investment
factories, assets, land, inventories etc. and in financial stocks, bonds and other financial
involve foreign ownership of production instruments and is effected largely by individuals
facilities and typically occurs through and institutions through the mechanism of capital
acquisition of more than 10 percent of the market.
shares of the target asset.
Not inclined to be speculative and has a Speculative in nature and has only short term
long term interest and therefore, relatively interest and therefore, relatively easy to withdraw
difficult to withdraw
Often accompanied by technology transfer Not accompanied by technology transfer
Direct impact on employment of labour and No direct impact on employment of labour andwages wages
Since there is enduring interest in Since there is no abiding interest in management
management and control, securities are and control, securities are held purely as financial
held with significant degree of influence by investment and no significant degree of influence
the investor on the management of the on the management of the enterprise
enterprise
Q-14 Define quantitative restrictions? Are QRs allowed under the WTO? What are the exceptions?[MTP-April’18,5 Marks]
Ans. Quantitative restrictions are limits or quotas imposed by importing / exporting countries on the amountor value of particular products that can be imported or exported from one country to another during agiven period. For example, an import quota. Article XI of GATT 1994 prohibits the use of QRs (thoughthere are certain exceptions) to this rule.
In certain circumstances, however, quotas, export or import licenses or other similar measures areallowed, e.g.:
I. QRs temporarily imposed for prevention or relief of critical food shortages

229
II. QRs necessary to the application of standards or regulations for goods, classification, gradingormaking of commodities in international trade.
iii. Import restrictions on any agricultural or fisheries products necessary to enforcementofgovernmental measures which operate to achieve specified purposes.
Q-15 What are the principles governing application of sanitary and phytosanitary measures?
[MTP-April’18,3 Marks]
Ans.(i) The principles governing application of SPS measures are :
• The sanitary and phytosanitary measures are to be based on scientific principles andshould notbe inconsistent with the provisions of the SPS agreement.
• Measures should not arbitrarily or unjustifiably discriminate between/among members whereidentical or similar conditions exist.
• Measures should not be applied in a way which would constitute a disguised restrictiontointernational trade.
Q-16 Define Real Effective Exchange Rate (REER) [MTP-April’18,3 Marks]
Ans. Real Effective Exchange Rate (REER) is the nominal effective exchange rate a measure ofthe value of acurrency against a weighted average of various foreign currencies) divided bya price deflator or indexof costs.
Q-17 What do you understand by the term ‘Most-Favored-Nation’ (MFN)? [MTP-Aug’18,2 Marks]
Ans. When a country enjoys the best trade terms given by its trading partner it is said to enjoy the MostFavoured Nation (MFN) status. Originally formulated as Article 1 of GATT, this principle of non-discrimination states that any advantage, favour, privilege or immunity granted by any contractingparty to any product originating in or destined for any other country shall be extended immediatelyand unconditionally to the like product originating or destined for the territories of all other contractingparties. Under the WTO agreements, countries cannot normally discriminate between their tradingpartners. If a country improves the benefits that it gives to one trading partner, (such as a lower a tradebarrier, or opens up a market), it has to give the same best treatment to all the other WTO members tooin respect of the same goods or services so that they all remain ‘most-favoured’. As per the WTOagreements, each member treats all the other members equally as “most-favoured” trading partners.
Q-18 What’s meant by free trade area? [MTP-Aug’18,2 Marks]
Ans. Free trade policy is based on the principle of non-interference by government in foreign trade.The distinction between domestic trade and international trade disappears and goods and services arefreely imported from and exported to the rest of the world. Buyers and sellers from separate economiesvoluntarily trade without the domestic government helping or hindering movements of goods andservices between countries by applying tariffs, quotas, subsidies or prohibitions on their goods andservices. The theoretical case for free trade is based on Adam Smith’s argument that the division oflabour among countries leads to specialization, greater efficiency, and higher aggregate production.
Q-19 What is the rationale behind resource seeking foreign direct investments [MTP-Aug’18,3 Marks]
Ans. The foreign-based multinational companies invest abroad to gain access to resources, that are eitherunobtainable or available only at a much higher cost in the home country. The firm may find it cheaperto produce in a foreign facility due to the availability of superior or less costly access to the inputs ofproduction than at home. The resources generally sought for are:
(i) physical resources such as oil, minerals, raw materials, or agricultural products.
(ii) human resources such as ski lled labor and low-cost unski lled labour, organizationalskills,management, consultancy or marketing expertise,

230
(iii) technological resources such as innovative, and other created assets (e.g., brand names)
(iv) physical infrastructure
(v) financial infrastructure such as safe efficient and integrated financial market, set of marketinstitutions, networks and financial intermediaries
Q-20 What is meant by ‘safeguard measures’ under WTO? [MTP-Aug’18,2 Marks]
Ans. A safeguard measures is an action taken to protect a specific domestic industry from an unexpectedbuild-up of imports. Safeguard measures are initiated by countries to restrict imports of a producttemporarily if its domestic industry is injured or threatened with serious injury caused by a surge inimports.
Q-21 What’ s meant by devaluation? [MTP-Oct’18,2 Marks]
Ans. Devaluation is a deliberate downward adjustment in the value of a country’s currency relative toanother currency, group of currencies or standard.
Q-22 What are the different routes for securing FDI? [MTP-Oct’18,2 Marks]
Ans. The main forms of direct investments are: the opening of overseas companies, includingtheestablishment of subsidiaries or branches, creation of joint ventures on a contract basis, jointdevelopment of natural resources and purchase or annexation of companies in the country receivingforeign capital.
Q-23 What is meant by ‘Voluntary Export Restraints’? [MTP-Oct’18,2 Marks]
Ans. Voluntary Export Restraints (VERs) refer to a type of informal quota administered by an exportingcountry voluntarily restraining the quantity of goods that can be exported out of a country during aspecified period of time.
Q-24 What is meant by free trade policy? [MTP-Oct’18,3 Marks]
Ans. Free trade policy is based on the principle of non-interference by government in foreign trade.
The distinction between domestic trade and international trade disappears and goods and services arefreely imported from and exported to the rest of the world. Buyers and sellers from separate economiesvoluntarily trade without the domestic government helping or hindering movements of goods andservices between countries by applying tariffs, quotas, subsidies or prohibitions on their goods andservices. The theoretical case for free trade is based on Adam Smith’s argument that the division oflabour among countries leads to specialization, greater efficiency, and higher aggregate production.
Q-25 What is meant by ‘safeguard measures’ under WTO? [MTP-Oct’18,2 Marks]
Ans. A safeguard measures is an action taken to protect a specific domestic industry from an unexpectedbuild-up of imports. Safeguard measures are initiated by countries to restrict imports of a producttemporarily if its domestic industry is injured or threatened with serious injury caused by a surge inimports.
Q-26 Mention the types of Transactions in the forex market? [MTP-Oct’18,2 Marks]
Ans. There are two types of transactions in a forex market; current transactions which are carried out in thespot market and contracts to buy or sell currencies for future delivery which are carried out in forwardand futures markets.
Q-27 The table below shows the output of Wheat and Rice by using one hour of labour time
in country A and country B -
Goods Country A Country B
Wheat (Quintal /hour) 10 5
Rice (Quintal/hour) 5 10
231
Which country has an absolute advantage over other country in production of wheatand rice and whichgood they obtain through international trade? [RTP-Nov’19]
Ans. As can be seen from the table, one hour of labour time produces 10 quintal and 5 quintal of wheatrespectively in country A and country B. On the other hand, one hour of labour time produces 5 quintalof rice in country A and 10 quintal of rice in country B. Country A is more efficient than country B, or hasan absolute advantage over country B in production of wheat. Similarly, country B is more efficientthan country A, or has an absolute advantage over country A in the production of rice. If both nationscan engage in trade with each other, each nation will specialize in the production of the good it has anabsolute advantage in and obtain the other commodity through international trade. Therefore, countryA would specialise completely in production of wheat and country B in rice.
Q-28 Define custom duties? What are their main goals? [RTP-Nov’19]
Ans. Customs duties are basically taxes or duties imposed on goods and services which are imported orexported. It is defined as a financial charge in the form of a tax, imposed at the border on goods goingfrom one customs territory to another. They are the most visible and universally used trade measuresthat determine market access for goods. Import duties being pervasive than export duties, customduties are often identified with import duties. Custom duties are aimed at altering the relative pricesof goods and services imported, so as to contract the domestic demand and thus regulate the volumeof their imports. Custom duties leave the world market price of the goods unaffected; while raisingtheir prices in the domestic market. The main goals of custom duties are to raise revenue for thegovernment, and more importantly to protect the domestic import-competing industries.
Q-29 Is prohibition of import of poultry from countries affected by avian flu, m eat and poultryprocessingstandards to reduce pathogens, residue limits for pesticides in foods etc.an example of Sanitary andPhytosanitary (SPS) measure? How? [RTP-Nov’19]
Ans. Yes, prohibition of import of poultry from countries affected by avian flu, meat and poultry processingstandards to reduce pathogens, residue limits for pesticides in foods etc. are the examples of Sanitaryand Phytosanitary (SPS) measures. These measures are applied to protect human, animal or plant lifefrom risks arising from additives, pests, contaminants, toxins or disease-causing organisms and toprotect biodiversity. These include ban or prohibition of import of certain goods, all measures governingquality and hygienic requirements, production processes, and associated compliance assessments.
Q-30 Food Laws, Quality Standards and Industrial Standards are examples of which type of non-tariffmeasures? Give Comments. [RTP-Nov’19]
Ans. Food laws, quality standards, industrial standards are some of the examples of Technical Barriers toTrade (TBT), which cover both food and non-food traded products.
Technical Barriers to Trade refer to mandatory `Standards and Technical Regulations’ that define thespecific characteristics that a product should have, such as its size, shape, design, labelling/marking/packaging, functionality or performance and production methods, excluding measures covered by theSPS Agreement.
Q-31 Distinguish between horizontal and vertical Foreign Direct Investment [RTP-Nov’19]
Ans. A horizontal direct investment is one under which the investor establishes the same type of businessoperation in a foreign country as it operates in its home country, for example, a cell phone serviceprovider based in the United States moving to India to provide the same service. On the other hand,vertical investment is one under which the investor establishes or acquires a business activity in aforeign country which is different from the investor’s main business activity yet in some waysupplements its major activity. For example; an automobile manufacturing company may acquire aninterest in a foreign company that supplies parts or raw materials required for the company.

232
Q-32 Assume that ` 70 is needed to buy one US dollar in foreign exchange market (i.e. the nominal exchangerate is ` 70/ US $). Suppose that a price index of standardized basket of goods and services is ` 200 inIndia and US $ 100 in United States, find out the real exchange rate? (Treat India as a domestic countryand United States as a foreign country) [RTP-Nov’19]
Ans. Real Exchange Rate = Nominal exchange rate*Domestic price index/ Foreign price index
= 70*200/100
=140
Q-33 How do foreign direct investments affect human capital in recipient countries? [RTP-May’19]
Ans. Since FDI involves setting up of production base (in terms of factories, power plants, etc.) it generatesdirect employment in the recipient country. Subsequent FDI as well as domestic investments propelledin the downstream and upstream projects that come up in multitude of other services generatemultiplier effects on employment and income. FDI not only creates direct employment opportunitiesbut also, through backward and forward linkages, it is able to generate indirect employmentopportunities as well. It is also argued that more indirect employment will be generated to persons inthe lower-end services sector occupations thereby catering to an extent even to the less educated andunskilled engaged in those units. This impact is particularly important if the recipient country is adeveloping country with an excess supply of labour caused by population pressure.
Foreign direct investments also promote relatively higher wages for skilled jobs. However, jobs thatrequire expertise and entrepreneurial skills for creative decision making may generally be retained inthe home country and therefore the host country is left with routine management jobs that demandonly lower levels of skills and ability. This may result in ‘crowding in’ of people in jobs requiring lowskills, perpetuation of low labour standards and differential treatment.
FDIs are likely use labor-saving technology and capital-intensive methods in a labourabundant countryand cause labour displacement. Such technology is inappropriate for a labour-abundant country as itdoes not support generation of jobs which is a crucial requirement to address poverty andunemployment which are the two fundamental areas of concern for the less developed countries. Notonly that foreign entities fail to support employment generation, but they may also drive out domesticfirms from the industry resulting in serious problems of displacement of labour.
Q-34 What is local content requirement? How will it affect trade? [RTP-May’19]
Ans. Local content requirements (LCRs) are conditions imposed by a host country government that requireinvesting firms to purchase and use domestically manufactured goods or domestically supplied servicesin order to operate in an economy. The fraction of a final good to be procured locally may be specifiedeither in value terms (e.g. 25% of the value of a product must be locally produced), by requiring thatsome minimum share of the value of a good represent home value added, or in physical units ( eg. 50%of component parts for a product must be locally produced). From the viewpoint of domestic producersof inputs, local content requirement provides greater demand which is not necessarily associated totheir competitiveness and for components/ parts manufacturers gives protection in the same way thatan import quota would. Local content requirement benefits producers and not consumers becausesuch requirements may raise the prices.
Q-35 How is exchange rate determined under floating exchange rate regime? [RTP-May’19]
Ans. Under floating exchange rate regime the equilibrium value of the exchange rate of a country’s currencyis market determined i.e. the demand for and supply of currency relative to other currencies determinesthe exchange rate.
Q-36 What is meant by trade distortion?
Ans. Trade is distorted if quantities of commodities produced, bought, and sold and their prices are higher

233
or lower than levels that would usually exist in a competitive market. For example, barriers to importssuch as tariffs, domestic subsidies and quantitative restrictions can make agricultural products morecostly in a market of a country. The higher prices will result in higher production of crop. Then exportsubsidies are needed to sell the surplus output in the world markets, where prices are low. Thus, thesubsidising countries can be producing and exporting considerably more than what they normallywould.
Q-37 Explain how ‘technical barriers to trade’ (TBT) may operate as a protectionist measure?
[RTP-Nov’18]
Ans. The non tariff measure ‘technical barriers to trade’ (TBT) which cover both food and non-food tradedproducts refers to mandatory standards and technical regulations that define specific characteristicsthat a product should have, such as its size, shape, design, labelling/marking/packaging, productionmethods, functionality or performance. The specific procedures used to check whether a product isreally conforming to these requirements (conformity assessment procedures e.g. testing, inspectionand certification) are also covered in TBT. This involves compulsory quality, quantity and price controlof goods before shipment from the exporting country. TBT measures are standards-based measuresthat countries use to protect their consumers and preserve natural resources, but these can also beused effectively as obstacles to imports or to discriminate against imports and protect domesticproducts. In actual practice, technical measures create trade barriers for existing and potential exportersfor the following reasons:
(a) Altering products and production processes to comply with the diverse requirements in exportmarkets may be either impossible for the exporting country or would obviously raise costs hurtingthe competitiveness of the exporting country.
(b) Compliance with technical regulations needs to be established through testing,certification orinspection by laboratories or certification bodies. These areusually cumbersome and costly
(c) The exporters also need to incur additional costs for consultation, acquisition of expertise, trainingetc
In effect technical measures, or the ways in which they are applied, discriminate against foreignproducers and turn out to be trade restrictive rather than being legitimate implementation ofsocial policy. Some examples of TBT are: food laws, quality standards, industrial standards, organiccertification, eco-labelling, ingredient standards, shelf-life restrictions, marketing and labellingrequirements.
Q-38 Distinguish between ‘non tariff measures’ and ‘non tariff barriers’ [RTP-Nov’18]
Ans. Non-tariff measures are policy measures other than ordinary customs tariffs that can potentially havean economic effect on international trade in goods, changing quantities traded, or prices or both(UNCTAD, 2010). They form a constellation of different types of policies which alter the conditions ofinternational trade. They are more difficult to quantify or compare than tariffs. NTMs can be institutedfor a range of public policy reasons and have been negotiated within the General Agreement on Tariffsand Trade and at the World Trade Organization NTMs are allowed under the WTO’s regulations and aremeant to allow governments to pursue legitimate policy goals even if this can lead to increased tradecosts. For example, NTMs like sanitary and phytosanitary measures and licensing could be legitimatelyused by members to ensure consumer health and to protect plant and animal life and environment.Depending on their scope and/or design NTMs are categorized as:
(i) Technical Measures: Technical measures refer to product-specific properties such as characteristicsof the product, technical specifications and production processes. These measures are intendedfor ensuring product quality, food safety, environmental protection, national security andprotection of animal and plant health.

234
(ii) Non-technical Measures: Non-technical measures relate to trade requirements; for example;shipping requirements, custom formalities, trade rules, taxation policies,etc.
These are further distinguished as:
a. Hard measures (e.g. Price and quantity control measures),
b. Threat measures (e.g. Anti-dumping and safeguards) and
c. Other measures such as trade-related finance and investment measures.
Furthermore, the categorization also distinguishes between:
(i) Import-related measures which relate to measures imposed by the importing country,and
(ii) Export-related measures which relate to measures imposed by the exporting countryitself.
NTMs are not the same as non-tariff barriers (NTBs). NTMs are sometimes used as means to circumventfree-trade rules and favour domestic industries at the expense of foreign competition. In this casethey are called non-tariff barriers (NTBs). NTBs are a subset of NTMs that have a ‘protectionist ordiscriminatory intent’ and implies a negative impact on trade. NTMs only become NTBs when they aremore trade restrictive than necessary. Some examples of NTBs are compulsory standards, often notbased on international norms or genuine science; stringent technical regulations requiring alterationsin production processes, testing regimes which require complex procedures and product approvalsrequiring inspection of individual premises. In addition, to these, there are procedural obstacles (PO)which are practical problems in administration, transportation, delays in testing, certification etc. thatmay make it difficult for businesses to adhere to a given regulation.
Q-39 How does the WTO address the special needs of developing and the least developed countries?
[RTP-Nov’18]
Ans. The WTO addresses the special needs and problems of developing and the least developed countriesin the following ways.
(i) Special and Differential Treatment (S&DT) for these countries is incorporated inthe WTO laws andrules.
(ii) Developing and the least developed countries are generally given longerimplementation time toconform to their obligations for promotion of freer trade.
(iii) They are also given more flexibility in matter of compliance with the WTO and special privilegesand permission to phase out the transition period.
(iv) These countries are granted transition periods to make adjustments to the not so familiar andintricate WTO provisions
(v) Members may violate the principle of MFN to give special market access to developing countries.
Q-40 What are the objectives of the Agreement on Agriculture (AOA)? [RTP-Nov’18]
Ans. The Agreement on Agriculture (AoA) is an international treaty of the World Trade Organizationnegotiated during the Uruguay Round. It contains provisions in three broad areas of agriculture andtrade policy: market access, domestic support and export subsidies. The Agreement aims to:
(i) establish fair and market oriented agricultural trading system, and
(ii) provide for substantial and progressive reduction in agricultural support andexport subsidieswith a view to remove distortion in the world market. These areto be achieved throughenhancement of market access, reduction of domestic support and elimination of export subsidies.
Q-41 Define foreign direct investment (FDI). Mention two arguments made in favour of FDI to developingeconomies like India? [RTP-May’18]
235
Ans. Foreign direct investment is defined as a process whereby the resident of one country (i.e. homecountry) acquires ownership of an asset in another country (i.e. the host country) and such movementof capital involves ownership, control as well as management of the asset in the host country. Directinvestments are real investments in factories, assets, land, inventories etc. and have three components,viz., equity capital, reinvested earnings and other direct capital in the form of intra-company loans.Foreign direct investment also includes all subsequent investment transactions between the investorand the enterprise and among affiliated enterprises, both incorporated and unincorporated. FDI involveslong term relationship and reflects a lasting interest and control. According to the IMF and OECDdefinitions, the acquisition of at least ten percent of the ordinary shares or voting power in a public orprivate enterprise by non-resident investors makes it eligible to be categorized as FDI. FDI may becategorized as horizontal, vertical, conglomerate and twoway direct foreign investments which arereciprocal investments.
Benefits of Foreign Direct Investment
Following are the benefits ascribed to foreign investments:
(i) Entry of foreign enterprises usually fosters competition and generates a competitive environmentin the host country. The domestic enterprises are compelled to compete with the foreignenterprises operating in the domestic market. This results in positiv e outcomes in the form ofcost-reducing and quality-improving innovations, higher efficiency and increasing variety of betterproducts and services at lower prices ensuring wider choice and welfare for consumers.
(ii) International capital allows countries to finance more investment than can besupported bydomestic savings resulting in higher productivity and enhanced output. From the perspective ofemerging and developing countries, FDI can accelerate growth and foster economic developmentby providing the much needed capital, technological know-how, management skills and marketingmethods and critical human capital skills in the form of managers and technicians. The spill-overeffects as the new technologies usually spread beyond the foreign corporations. In addition, thenew technology can clearly enhance the recipient country’s production possibilities.
Q-42 Explain the nature of changes in exchange rates and their impact on real economy? [RTP-May’18]
Ans. Changes in exchange rates portray depreciation or appreciation of one currency against another. Theterms, ‘currency appreciation’ and ‘currency depreciation’ describe the movements of the exchangerate. Currency appreciates when its value increases with respect to the value of another currency or abasket of other currencies. On the contrary, currency depreciates when its value falls with respect tothe value of another currency or a basket of other currencies. If the Rupee dollar exchange rate changesfrom $1 = ` 65 to $1 = ̀ 68, the value of the Indian Rupee has diminished or Indian Rupee has depreciatedand the US dollar has appreciated. On the contrary, home-currency appreciation or foreigncurrencydepreciation takes place when there is a decrease in the home currency price of foreign currency (oralternatively, an increase in the foreign currency price of home currency). The home currency thusbecomes relatively more valuable. Under a floating rate system, if for any reason, the demand curvefor foreign currency shifts to the right representing increased demand for foreign currency, and supplycurve remains unchanged, then the exchange value of foreign currency rises and the domestic currencydepreciates in value.
Following are the impact of exchange rate changes on the real economy:
The developments in the foreign exchange markets affect the domestic economy both directly andindirectly. All else equal, an appreciation(depreciation) of a country’s currency raises (decreases) therelative price of its exports and lowers (increases) the relative price of its imports leading to changesin import and export volumes and consequently on import spending and export revenue. Depreciationadversely affects importers as they have to pay more domestic currency on the same quantity of

236
imports ad benefits exporters as forex earnings will fetch more in terms of domestic currency.
For an economy where exports are significantly high, a depreciated currency would mean a lot of gain.Depreciation of domestic currency primarily decreases the relative price of domestically producedgoods and diverts spending from foreign goods to domestic goods.Increased demand, both for domesticimport-competing goods and for exports encourages economic activity and creates output expansion.Overall, the outcome of exchange rate depreciation is an expansionary impact on the economy at anaggregate level.
As a result of depreciation or devaluation, the terms of trade of the nation can rise, fall or remainunchanged, depending on whether price of exports rises by more than, less than or same percentagesas price of imports. Depreciation also can have a positive impact on country’s trade deficit as it makesimports more expensive for domestic consumers and exports cheaper for foreigners. However, thefiscal health of a country whose currency depreciates is likely to be affected with rising import paymentsand consequent rising current account deficit (CAD) and diminished growth prospects of overalleconomy.
Depreciation is also likely to fuel consumer price inflation, directly through its effect on prices ofimported consumer goods and also due to increased demand for domestic goods.
The impact will be greater if the composition of domestic consumption baskets consists more ofimported goods. Indirectly, cost push inflation may result through possible escalation in the cost ofimported components and intermediaries used in production.
When a country’s currency depreciates, production of export goods and import substitutes becomesmore profitable. Therefore, factors of production will be induced to move into the tradable goodssectors and out of the non tradable goods sectors. By lowering export prices, currency depreciationhelps increase the international competitiveness of domestic industries, increases the volume ofexports, augments windfall profits in export oriented sectors and import-competing industries andpromotes trade balance. If exports originate from labour-intensive industries, increased export priceswill have spiraling effects on wages, employment and income. If inputs and components formanufacturing are mostly imported and cannot be domestically produced, increased import prices willincrease firms’ cost of production, push domestic prices up and decrease real output.
Foreign capital inflows are characteristically vulnerable to exchange rate fluctuations.
Depreciating currency hits investor sentiments and has radical impact on patterns of internationalcapital flows. Foreign investors are likely to be indecisive or highly cautious before investing in acountry which has high exchange rate volatility. Foreign direct investment flows are likely to shrinkand foreign portfolio investments are likely to flow into debt and equity. This may shoot up capitalaccount deficits affecting the country’s fiscal health. Reduced foreign investments also widen the gapbetween investments required for growth and actual investments. Over a period of time, unemploymentis likely to mount in the economy.
If investor sentiments are such that they anticipate further depreciation, there may be large scalewithdrawal of portfolio investments and huge redemptions through global exchange traded fundsleading to further depreciation of domestic currency. This may result in a highly volatile domesticequity market affecting the confidence of domestic investors.
Companies that have borrowed in foreign exchange through external commercial borrowings (ECBs)but have not sufficiently hedged against foreign exchange risks would also be negatively impacted asthey would require more domestic currency to repay their loans. A depreciated domestic currencywould also increase their debt burden and lower their profits and impact their balance sheets adversely.Exchange rate fluctuations make financial forecasting more difficult for firms and larger amounts willhave to be earmarked for insuring against exchange rate risks through hedging. Investors who have

237
purchased a foreign asset, or the corporation which floats a foreign debt, will find themselves facingforeign exchange risk. However, remittances to homeland by non residents and businesses abroadfetches more in terms of domestic currency.
In case of foreign currency denominated government debts, currency depreciation will increase theinterest burden and cause strain to the exchequer for repaying and servicing foreign debt.
Depreciation would enhance government revenues from import related taxes, especially if the countryimports more of essential goods. Depreciation would also result in higher amount of local currency fora given amount of foreign currency borrowings of government.
Q-43 What are the major functions of the WTO? What do you understand by the term ‘Most-favored-nation’(MFN)? [RTP-May’18]
Ans. The principal objective of the WTO is to facilitate the flow of international trade smoothly, freely, fairlyand predictably. To achieve this, the WTO endeavors:
(i) to set and enforce rules for international trade
(ii) to provide a forum for negotiating and monitoring further trade liberalization
(iii) to resolve trade disputes
(iv) to increase the transparency of decision-making processes
(v) to cooperate with other major international economic institutions involved inglobal economicmanagement, and
(vi) to help developing countries benefit fully from the global trading system.
When a country enjoys the best trade terms given by its trading partner it is said to enjoy the MostFavored Nation (MFN) status. Originally formulated as Article 1 of GATT, this principle of nondiscrimination states that any advantage, favour, privilege or immunity granted by any contractingparty to any product originating in or destined for any other country shall be extended immediatelyand unconditionally to the like product originating or destined for the territories of all other contractingparties. Under the WTO agreements, countries cannot normally discriminate between their tradingpartners. If a country improves the benefits that it gives to one trading partner, (such as a lower a tradebarrier, or opens up a market), it has to give the same best treatment to all the other WTO members tooin respect of the same goods or services so that they all remain ‘most-favoured’. As per the WTOagreements, each member treats all the other members equally as “most-favoured” trading partners.
Q-44 Define ‘dumping’? What is meant by an ‘Anti-dumping’ measure? [RTP-May’18]
Ans. Dumping occurs when manufacturers sell goods in a foreign country below the sales prices in theirdomestic market or below their full average cost of the product.
Dumping may be persistent, seasonal, or cyclical. Dumping may also be resorted to as a predatorypricing practice to drive out established domestic producers from the market and to establish monopolyposition. Dumping is international price discrimination favouring buyers of exports, but in fact, theexporters deliberately forego money in order to harm the domestic producers of the importing countryand to gain market share. This is an unfair trade practice and constitutes a threat to domestic producers.
Anti-dumping measures consist of imposition of additional import duties to offset the effects ofdumping. These measures are initiated as safeguards to offset the foreign firm’s unfair price advantage.This is justified only if the domestic industry is seriously injured by import competition, and protectionis in the national interest (that is, the associated costs to consumers would be less than the benefitsthat would accrue to producers).

238
Q-45 Explain ‘depreciation’ and ‘appreciation’ of home currency under floating exchange rate.
[Sugg.-May’19,2 Marks]
Ans. Under a floating rate system, home currency depreciates when its value falls with respect to the valueof another currency or a basket of other currencies i.e there is an increase in the home currency priceof the foreign currency. For example, if the Rupee dollar exchange rate in the month of January is $1 =`70 and ` 72 in June, then the Indian Rupee has depreciated in its value with respect to the US dollar andthe value of US dollar has appreciated in terms of the Indian Rupee.
On the contrary, home currency appreciates when its value increases with respect to the value ofanother currency or a basket of other currencies i.e. there is a decrease in the home currency price offoreign currency. For example, if the Rupee dollar exchange rate in the month of January is $1 = ` 72 and`70 in June, then the Indian Rup ee has appreciated in its value with respect to the US dollar and thevalue of US dollar has depreciated in terms of the Indian Rupee.
Q-46 Explain the classical theory of Comparative Advantage as given by David Ricardo.
[Sugg.-May’19,3 Marks]
Ans. The law of comparative advantage states that even if one nation is less efficient than (has an absolutedisadvantage with respect to) the other nation in the production of both commodities, there is stillscope for mutually beneficial trade.
The first nation should specialize in the production and export of the commodity in which its absolutedisadvantage is smaller (this is the commodity of its comparative advantage) and import the commodityin which its absolute disadvantage is greater (this is the commodity of its comparative disadvantage).Labour differs in its productivity internationally and different goods have different labour requirements,
so comparative labor productivity advantage was Ricardo’s predictor of trade.
The theory can be explained with a simple example
Output per Hour of Labour
Commodity Country A Country B
Wheat (bushels/hour) 6 1
Cloth (yards/hour) 4 2
Country B has absolute disadvantage in the production of both wheat and cloth.
However, since B’s labour is only half as productive in cloth but six times less productive in wheatcompared to country A, country B has a comparative advantage in cloth. On the other hand, country Ahas an absolute advantage in both wheat and cloth with respect to the country B, but since its absoluteadvantage is greater in wheat (6:1) than in cloth (4:2), country A has a comparative advantage in wheat.
According to the law of comparative advantage, both nations can gain if country A specialises in theproduction of wheat and exports some of it in exchange for country B’s cloth. Simultaneously, countryB should specialise in the production of cloth and export some of it in exchange for country A’s wheat.
If country A could exchange 6W for 6C with country B, then, country A would gain 2C (or save one-halfhour of labour time) since the country A could only exchange 6W for 4C domestically. The 6W that thecountry B receives from the country A would require six hours of labour time to produce in country B.With trade, country B can instead use these six hours to produce 12C and give up only 6C for 6W fromthe country A. Thus, the country B would gain 6C or save three hours of labour time and country Awould gain 2C. However, the gains of both countries are not equal.
Country A would gain if it could exchange 6W for more than 4C from country B; because 6W for 4 C iswhat it can exchange domestically (both require the same one hour labour time). The more C it gets,
239
the greater would be the gain from trade.Conversely, in country B, 6W = 12C (in the sense that bothrequire 6 hours to produce). Anything less than 12C that country B must give up to obtain 6W fromcountry A represents a gain from trade for country B. To summarize, country A gains to the extent thatit can exchange 6W for more than 4C from the country B. country B gains to the extent that it can give upless than 12C for 6W from the country A. Thus, the range for mutually advantageous trade is 4C < 6W <12C.
Q-47 Describe the limitations of fiscal policy. [Sugg.-May’19,3 Marks]
Ans. The following are the significant limitations in respect of choice and implementation of fiscal policy.
1. One of the biggest problems with using discretionary fiscal policy to counteract fluctuations is thedifferent types of lags involved in fiscal-policy action. There are significant lags such as recognitionlag, decision lag, implementation lag and impact lag
2. Fiscal policy changes may at times be badly timed due to the various lags so that it is highlypossible that an expansionary policy is initiated when the economy is already on a path of recoveryand vice versa.
3. There are difficulties in instantaneously changing governments’ spending and taxation policies.
4. It is practically difficult to reduce government spending on various items such as defence andsocial security as well as on huge capital projects which are already midway.
5. Public works cannot be adjusted easily along with movements of the trade cycle because manyhuge projects such as highways and dams have long gestation period. Besides, some urgentpublic projects cannot be postponed for reasons of expenditure cut to correct fluctuations causedby business cycles.
6. Due to uncertainties, there are difficulties of forecasting when a period of inflation or deflationmay set in and also promptly determining the accurate policy to be undertaken.
7. There are possible conflicts between different objectives of fiscal policy such that a policy designedto achieve one goal may adversely affect another. For example, an expansionary fiscal policy mayworsen inflation in an economy
8. Supply-side economists are of the opinion that certain fiscal measures will cause disincentives.For example, increase in profits tax may adversely affect the incentives of firms to invest and anincrease in social security benefits may adversely affect incentives to work and save.
9. Deficit financing increases the purchasing power people. The production of goods and services,especially in under developed countries may not catch up simultaneously to meet the increaseddemand. This will result in prices spiraling beyond control.
10. Increase is government borrowing creates perpetual burden on even future generations as debtshave to be repaid. If the economy lags behind in productive utilization of borrowed money,sufficient surpluses will not be generated for servicing debts. External debt burden has been aconstant problem for India and many developing countries.
11. An increase in the size of government spending during recessions will ‘crowdout’ private spendingin an economy and lead to reduction in an economy’s ability to self-correct from the recession,and possibly also reduce the economy’s prospects of long-run economic growth.
12. If governments compete with the private sector to borrow money for spending, it is likely thatinterest rates will go up, and firms’ willingness to invest may be reduced. Individuals too may bereluctant to borrow and spend and the desired increase in aggregate demand may not be realized.
Q-48 How does international trade Increase economic efficiency? Explain [Sugg.-May’19,3 Marks]
Ans. International trade is a powerful stimulus to economic efficiency and contributes to economic growth
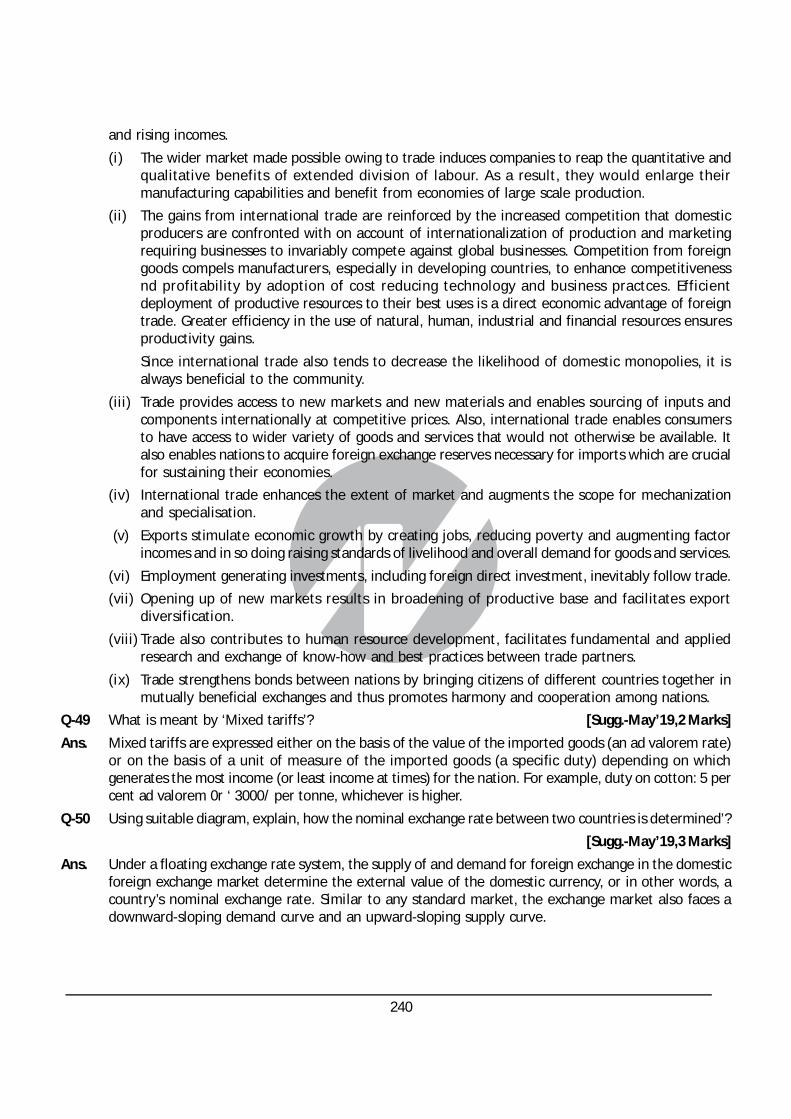
240
and rising incomes.
(i) The wider market made possible owing to trade induces companies to reap the quantitative andqualitative benefits of extended division of labour. As a result, they would enlarge theirmanufacturing capabilities and benefit from economies of large scale production.
(ii) The gains from international trade are reinforced by the increased competition that domesticproducers are confronted with on account of internationalization of production and marketingrequiring businesses to invariably compete against global businesses. Competition from foreigngoods compels manufacturers, especially in developing countries, to enhance competitivenessnd profitability by adoption of cost reducing technology and business practces. Efficientdeployment of productive resources to their best uses is a direct economic advantage of foreigntrade. Greater efficiency in the use of natural, human, industrial and financial resources ensuresproductivity gains.
Since international trade also tends to decrease the likelihood of domestic monopolies, it isalways beneficial to the community.
(iii) Trade provides access to new markets and new materials and enables sourcing of inputs andcomponents internationally at competitive prices. Also, international trade enables consumersto have access to wider variety of goods and services that would not otherwise be available. Italso enables nations to acquire foreign exchange reserves necessary for imports which are crucialfor sustaining their economies.
(iv) International trade enhances the extent of market and augments the scope for mechanizationand specialisation.
(v) Exports stimulate economic growth by creating jobs, reducing poverty and augmenting factorincomes and in so doing raising standards of livelihood and overall demand for goods and services.
(vi) Employment generating investments, including foreign direct investment, inevitably follow trade.
(vii) Opening up of new markets results in broadening of productive base and facilitates exportdiversification.
(viii) Trade also contributes to human resource development, facilitates fundamental and appliedresearch and exchange of know-how and best practices between trade partners.
(ix) Trade strengthens bonds between nations by bringing citizens of different countries together inmutually beneficial exchanges and thus promotes harmony and cooperation among nations.
Q-49 What is meant by ‘Mixed tariffs’? [Sugg.-May’19,2 Marks]
Ans. Mixed tariffs are expressed either on the basis of the value of the imported goods (an ad valorem rate)or on the basis of a unit of measure of the imported goods (a specific duty) depending on whichgenerates the most income (or least income at times) for the nation. For example, duty on cotton: 5 percent ad valorem 0r ‘ 3000/ per tonne, whichever is higher.
Q-50 Using suitable diagram, explain, how the nominal exchange rate between two countries is determined’?
[Sugg.-May’19,3 Marks]
Ans. Under a floating exchange rate system, the supply of and demand for foreign exchange in the domesticforeign exchange market determine the external value of the domestic currency, or in other words, acountry’s nominal exchange rate. Similar to any standard market, the exchange market also faces adownward-sloping demand curve and an upward-sloping supply curve.
241
Determination of Nominal Exchange Rate
The equilibrium rate of exchange is determined by the interaction of the supply and demand for aparticular foreign currency. In the figure above, the demand curve (D$) and supply curve (S$) of dollarsintersect to determine equilibrium exchange rate eeq with Qe as the equilibrium quantity of dollarsexchanged.
Q-51 Explain with example how Ad Valorem Tariff is levied. [Sugg.-Nov’18,3 Marks]
Ans. An ad valorem tariff is a duty or other charges levied on an import item on the basis of its value and noton the basis of its quantity, size, weight, or any other factor.
It is levied as a constant percentage of the monetary value of one unit of the imported good. Forexample, a 20% ad valorem tariff on a computer generates `2,000/ government revenue from tariff oneach imported computer priced at `10,000/ in the world market. If the price of computer rises to `20,000, then it generates a tariff of ` 4,000/
Q-52 What are the modes of Foreign Direct Investment (FDI)? [Sugg.-Nov’18,3 Marks]
Ans. Modes of foreign direct investment (FDI)
Foreign direct investment is defined as the process whereby the resident of one country (i.e. homecountry) acquires more than 10 percent ownership of an asset in another country (i.e. the host country)and such movement of capital involves ownership, control as well as management of the asset in thehost country. Various modes are:
(i) Opening of a subsidiary or associate company in a foreign country,
(ii) Equity injection into an overseas company,
(iii) Acquiring a controlling interest in an existing foreign company,
(iv) Mergers and acquisitions (M&A)
(v) Joint venture with a foreign company.
(vi) Green field investment (establishment of a new overseas affiliate for freshly starting productionby a parent company).
Q-53 The Nominal Exchange rate of India is ` 56/1 $, Price Index in India is 116 andPrice Index in USA is 112.What will be the Real Exchange Rate of India? [Sugg.-Nov’18,2 Marks]
Ans. The ‘real exchange rate’ describes ‘how many’ of a good or service in one country can be traded for‘one’ of that good or service in a foreign country. Thus it incorporates changes in prices.
242
Domestic price indexReal Exchange rate = Nominal exchange rate ×
Foreign price index
116= 56 × = 58
112
Q-54 “World Trade Organisation (WTO) has a three-tier system of decision making.”Explain.
[Sugg.-Nov’18,2 Marks]
Ans. The World Trade Organization has a three- tier system of decision making. The WTO’s top level decision-making body is the Ministerial Conference which can take decisions on all matters under any of themultilateral trade agreements.
The Ministerial Conference meets at least once every two years. The next level is the General Councilwhich meets several times a year at the Geneva headquarters.
The General Council also meets as the Trade Policy Review Body and the Dispute Settlement Body. Atthe next level, the Goods Council, Services Council and Intellectual Property (TRIPS) Council report tothe General Council. These councils are responsible for overseeing the implementation of the WTOagreements in their respective areas of specialisation. The three also have subsidiary bodies.
Numerous specialized committees, working groups and working parties deal with the individualagreements.
Q-55 List the point of difference between fixed exchange rate and floating exchange rate.
[Sugg.-May’18,2 Marks]
Ans.
Fixed Exchange Rate Floating Exchange Rate
A fixed exchange rate, also Under floating exchange rate regime, the
referred to as pegged exchange equilibrium value of the exchange rate of a
rate, is an exchange rate regime country’s currency is market-determined i.e. the
under which a country’s central demand for and supply of currency relative to
bank and/ or government other currencies determine the exchange rate.
announces or decrees what its
currency will be worth in terms of
either another country’s currency
or a basket of currencies or
another measure of value, such
as gold.
In order to maintain the exchange There is no interference on the part of the
rate at the predetermined level, government or the central bank of the country in
the central bank intervenes in the the determination of exchange rate. Any
foreign exchange market interference in the foreign exchange market on
the part of the government or central bank would
be only for moderating the rate of change

243
Q-56 Describe deterrents to Foreign Direct Investment (FDI) in the country. [Sugg.-May’18,2 Marks]
Ans. Deterrents to Foreign Direct Investment (FDI)
(i) Poor macro-economic environment, such as, infrastructure lags, high rates of inflation andcontinuing instability, balance of payment deficits, exchange rate volatility, unfavourable taxregime (including double taxation), small size of market and lack of potential for its growth andpoor track-record of investments.
(ii) Unfavourable resource and labour market conditions such as poor natural and human resources,rigidity in the labour market, low literacy, low labour skills, language barriers and high rates ofindustrial disputes
(iii) Unfavourable legal and regulatory framework such as absence of well-defined property rights,lack of security to life and property, stringent regulations, cumbersome legal formalities anddelays, bureaucracy and corruption and political instability.
(iv) Lack of host country trade openness viz. lack of openness, prevalence of nontariff barriers, lack ofa general spirit of friendliness towards foreign investors, lack of facilities for immigration andemployment of foreign technical and administrative personnel.
Q-57 Describe the objectives of World Trade Organization (WTO). [Sugg.-May’18,3 Marks]
Ans. Objectives of World Trade Organization (WTO):The WTO aims to facilitate the flow of internationaltrade smoothly, freely, fairly andpredictably for the benefit of all. The chief objectives of WTO are:
• to set and enforce rules for international trade
• to provide a forum for negotiating and monitoring further trade liberalization
• to resolve trade disputes
• to increase the transparency of decision-making processes
• to cooperate with other major international economic institutions involved in global economicmanagement and
• to help developing countries to get benefit fully from the global trading system
Q-58 Examine why General Agreement in Tariff & Trade (GATT) lost its relevance. [Sugg.-May’18,2 Mark]
Ans. The GATT lost its relevance by 1980s because:
• It was obsolete to the fast evolving contemporary complex world trade scenario characterized byemerging globalisation
• International investments had expanded substantially
• Intellectual property rights and trade in services were not covered by GATT
• World merchandise trade increased by leaps and bounds and was beyond its scope
• The ambiguities in the multilateral system could be heavily exploited
• Efforts at liberalizing agricultural trade were not successful
• There were inadequacies in institutional structure and dispute settlement system
• It was not a treaty and therefore terms of GATT were binding only insofar as they are not incoherentwith a nation’s domestic rules
Q-59 How do import tariffs affect International Trade? [Sugg.-May’18,2 Marks]
Ans. Demerits of Tariffs in International Trade:
Tariffs are the most visible and universally used trade measures that determine market access forgoods. Tariffs are aimed at altering the relative prices of goods and services imported, so as to contract
244
the domestic demand and thus regulate the volume of their imports.
(i) Tariff barriers create obstacles to international trade, decrease the volume of imports and ofinternational trade.
(ii) The prospect of market access of the exporting country is worsened when an importing countryimposes a tariff.
(iii) By making imported goods more expensive, tariffs discourage domestic consumption of importedforeign goods and therefore imports are discouraged.
(iv) Tariffs create trade distortions by disregarding comparative advantage and prevent countriesfrom enjoying gains from trade arising from comparative advantage. Thus, tariffs discourageefficient production in the rest of the world and encourage inefficient production in the homecountry.
Q-60(a) Explain how a tariff levied on an imported product affects both the country exporting a product and thecountry importing that product.
(b) Why GATT lost its relevance by 1980? [RTP-May’2020]
Ans.(a) A tariff levied on an imported product affects both the country exporting a product and the countryimporting that product. (i) Tariff barriers create obstacles to trade, decrease the volume of imports andexports and therefore of international trade. The prospect of market access of the exporting country isworsened when an importing country imposes a tariff. (ii) By making imported goods more expensive,tariffs discourage domestic consumers from consuming imported foreign goods. Domestic consumerssuffer a loss in consumer surplus because they must now pay a higher price for the good and alsobecause compared to free trade quantity, they now consume lesser quantity of the good. (iii) Tariffsencourage consumption and production of the domestically produced import substitutes and thusprotect domestic industries. (iv)Producers in the importing country experience an increase in well-being as a result of imposition of tariff. The price increase of their product in the domestic marketincreases producer surplus in the industry. They can also charge higher prices than would be possiblein the case of free trade because foreign competition has reduced. (v) The price increase also inducesan increase in the output of the existing firms and possibly addition of new firms due to entry into theindustry to take advantage of the new high profits and consequently an increase in employment in theindustry. (vi)Tariffs create trade distortions by disregarding comparative advantage and preventcountries from enjoying gains from trade arising from comparative advantage. Thus, tariffs discourageefficient production in the rest of the world and encourage inefficient production in the home country.(vii) Tariffs increase government revenues of the importing country by the value of the total tariff itcharges.
(b) The GATT lost its relevance by 1980s because-
(i) It was obsolete to the fast evolving contemporary complex world trade scenario characterized byemerging globalization.
(ii) International investments had expanded substantially.
(iii) Intellectual property rights and trade in services were not covered by GATT.
(iv) World merchandise trade increased by leaps and bounds and was beyond its scope.
(v) The ambiguities in the multilateral system could be heavily exploited.
(vi) Efforts at liberalizing agricultural trade were not successful.
(vii) There were inadequacies in institutional structure and dispute settlement system.
(viii) It was not a treaty and therefore terms of GATT were binding only insofar as they are not incoherentwith a nation’s domestic rules.

245
Q-61 Even if one nation is less efficient than the other nation in the production of all commodities, there isstill scope for mutually beneficial trade. Explain in detail. [RTP-May’2020]
Ans. Yes, there is still scope for mutually beneficial trade. The first step is that nation should specialize inthe production and export of the commodity in which its absolute disadvantage is smaller and importthe commodity in which its absolute disadvantage is greater. This can be explained with the help of anexample (Theory of Comparative Advantage).
Q-62 Many apprehensions have been raised in respect of the WTO and its ability to maintain and extend asystem of liberal world trade. Comment. [RTP-May’2020]
Ans. The major issues are:
(i) The progress of multilateral negotiations on trade liberalization is very slow and the requirementof consensus among all members acts as a constraint and creates rigidity in the system. As a result,countries find regionalism a plausible alternative.
(ii) The complex network of regional agreements introduces uncertainties and murkiness in theglobal trade system.
(iii) While multilateral efforts have effectively reduced tariffs on industrial goods, the achievementin liberalizing trade in agriculture, textiles, and apparel, and in many other areas of internationalcommerce has been negligible.
(iv) The latest negotiations, such as the Doha Development Round, have run into problems, and theirdefinitive success is doubtful.
(v) Most countries, particularly developing countries are dissatisfied with the WTO because, inpractice, most of the promises of the Uruguay Round agreement to expand global trade has notmaterialized.
(vi) The developing countries have raised a number of concerns and a few are presented here:
• The real expansion of trade in the three key areas of agriculture, textiles and services hasbeen dismal.
• Protectionism and lack of willingness among developed countries to provide market accesson a multilateral basis has driven many developing countries to seek regional alternatives.
• The developing countries have raised a number of issues in the Doha Agenda in respect ofthe difficulties that they face in implementing the present agreements.
• The North-South divide apparent in the WTO ministerial meets has fuelled the apprehensionof developing countries about the prospect of trade expansion under the WTO regime.
• Developing countries complain that they face exceptionally high tariffs on selected productsin many markets and this obstructs their vital exports.
• Another major issue concerns ‘tariff escalation’ where an importing country protects itsprocessing or manufacturing industry by setting lower duties on imports of raw materialsand components, and higher duties on finished products.
• There is also possible erosion of preferences i.e. the special tariff concessions granted bydeveloped countries on imports from certain developing countries have become lessmeaningful because of the narrowing of differences between the normal and preferentialrates.
• The least-developed countries find themselves disproportionately disadvantaged andvulnerable with regard to adjustments due to lack of human as well as physical capital, poorinfrastructure, inadequate institutions, political instabilities etc.
246
Q-63 Explain the principle motivations of a country seeking FDI? [RTP-May’2020]
Ans. Motivations for a country seeking investments occurs when:
I. Producers have saturated sales in their home market
II. Firms want to ensure market growth and to find new buyers and larger markets with sizablepopulation.
III. Technological developments and economies arising from large scale production necessitate greaterability of the market to support the expected demand on which the investment is based. Theminimum size of market needed to support technological development in certain industries issometimes larger than the largest national market.
IV. There are substantial barriers to exporting from the home country
V. Firms identify country-specific consumer preferences and favourable structure of marketselsewhere.
VI. Firms realize that their products are unique or superior and that there is scope for exploiting thisopportunity by extending to other regions.
Q-64 Explain the term ‘real exchange rate’. [Sugg.-Nov’19,2 Marks]
Ans. The Real Exchange Rate (RER) compares the relative price of the consumption baskets of two countries,i.e. it describes ‘how many’ of a good or service in one country can be traded for ‘one’ of that good orservice in a foreign country. Unlike nominal exchange rate which assumes constant prices of goods andservices, the real exchange rate incorporates changes in prices. The real exchange rate therefore is theexchange rate times the relative prices of a market basket of goods in the two countries and is calculatedas:
Domestic Price IndexReal exchange rate = Nominal exchange rate X
Foreign Price Index
Q-65 Explain the key features of modern theory of international trade. [Sugg.-Nov’19,3 Marks]
Ans. The Heckscher-Ohlin theory of trade, also referred to as Factor-Endowment Theory of Trade or ModernTheory of Trade, emphasises the role of a country’s factor endowments in explaining the basis for itstrade. ‘Factor endowment’ refers to the overall availability of usable resources including both naturaland man-made means of production.
If two countries have different factor endowments under identical production function and identicalpreferences, then the difference in factor endowment results in two countries having different factorprices and different cost functions. In this model a country’s advantage in production arises solely fromits relative factor abundance. Thus, comparative advantage in cost of production is explained exclusivelyby the differences in factor endowments of the nations.
According to this theory, international trade is but a special case of inter-regional trade. Differentregions have different factor endowments, that is, some regions have abundance of labour, but scarcityof capital; whereas other regions have abundance of capital, but scarcity of labour. Thus, each region issuitable for the production of those goods for whose production it has relatively plentiful supply of therequisite factors. The theory states that a country’s exports depend on its resources endowment i.e.whether the country is capital-abundant or labour-abundant. A country which is capital-abundant willexport capital-intensive goods. Likewise, the country which is labor-abundant will export labour-intensive goods.
The Heckscher-Ohlin Trade Theorem establishes that a country tends to specialize in the export of acommodity whose production requires intensive use of its abundant resources and imports a

247
commodity whose production requires intensive use of its scarce resources.
The Factor-Price Equalization Theorem which is a corollary to the Heckscher-Ohlin trade theory statesthat in the absence of foreign trade, it is quite likely that factor prices are different in different countries.International trade equalizes the absolute and relative returns to homogenous factors of productionand their prices. This implies that the wages and rents will converge across the countries with freetrade, or in other words, trade in goods is a perfect substitute for trade in factors. The Heckscher-Ohlintheorem thus postulates that foreign trade eliminates the factor price differentials.
Q-66 The price index for exports of Bangladesh in the year 2018-19 (based on 2010-11) was 233.73 and theprice index for imports of it was 220.50 (based on 2010-11)
[i) What do these figures mean ?
(ii) Calculate the index of terms of trade for Bangladesh.
(iii) How would you interpret the index of terms of trade for Bangladesh ? [Sugg.-Nov’19,5 Marks]
Ans.(i) The figures represent foreign trade price indices which are compiled using prices of specified group ofcommodities exported from and imported by Bangladesh in the year 2018-19. Both indices have a baseyear of 2010 -11 (=100) and the price changes are measured in relation to that figure. In the current year,the import price index of 220.50 indicates that there has been a 120.50 percent increase in price since2010-11 and export price index shows that there is 133.73 percent increase in export prices. Theseindices track the changes in the price which firms and countries receive / pay for products they export/import and can be used for assessing the impact of international trade on the domestic economy.
(ii) Terms of trade for Bangladesh (ToT) is given by
Price index of Bangladesh exportTerms of Trade = ×100
Price index of Bangladesh import
=233.73
×100 =106220.50
(iii) ‘Terms of trade’ is defined as the ratio between the index of export prices and the index of importprices. It is the relative price of a country’s exports in terms of its imports and can be interpreted as theamount of import goods an economy can purchase per unit of export goods. If the export prices increasemore than the import prices, a country has positive terms of trade, because for the same amount ofexports, it can purchase more imports.
In the given problem, with a ToT of 106, a unit of exports by Bangladesh will buy six percent more ofimports. In other words, from the sale of home produced goods at higher export prices and the purchaseof foreign produced goods at lower prices, trade will result in Bangladesh obtaining a greater volumeof imported products for a given volume of the exported product. This indicates increased welfare forBangladesh.
Q-67 How does the WTO agreement ensure market access ? [Sugg.-Nov’19,2 Marks]
Ans. The principal objective of the WTO is to facilitate the flow of international trade smoothly, freely, fairlyand predictably. The WTO agreement aims to increase world trade by enhancing market access by thefollowing:
(i) The agreement specifies the conduct of trade without discrimination. The Most-favoured-nation(MFN) principle holds that if a country lowers a trade barrier or opens up a market, it has to do sofor the same goods or services from all other WTO members.

248
(ii) The National Treatment Principle requires that a country should not discriminate between itsown and foreign products, services or nationals. With respect to internal taxes, internal laws, etc.applied to imports, treatment not less favourable than that which is accorded to like domesticproducts must be accorded to all other members.
(iii) The principle of general prohibition of quantitative restrictions
(iv) By converting all non- tariff barriers into tariffs which are subject to country specific limits.
(v) The imposition of tariffs should be only legitimate measures for the protection of domesticindustries, and tariff rates for individual items are being gradually reduced through negotiations‘on a reciprocal and mutually advantageous’ basis.
(vi) In major multilateral agreements like the Agreement on Agriculture (AOA), specific targets havebeen specified for ensuring market access.
Q-68 What is ‘Recessionary Gap’ ? [Sugg.-Nov’19,2 Marks]
OR
What is meant by ‘Bound tariff ? [Sugg.-Nov’19,2 Marks]
Ans. A recessionary gap, also known as a contractionary gap, is said to exist if the existing levels of aggregateproduction is less than what would be produced with full employment of resources. It is a measure ofoutput that is lost when actual national income falls short of potential income, and represents thedifference between the actual aggregate demand and the aggregate demand which is required toestablish the equilibrium at full employment level of income. This gap occurs during the contractionaryphase of business-cycle and results in higher rates of unemployment. In other words, a recessionarygap occurs when the aggregate demand is not sufficient to create conditions of full employment.
OR
A bound tariff is a tariff which a WTO member binds itself with a legal commitment not to raise it abovea certain level. By binding a tariff, often during negotiations, the members agree to limit their right toset tariff levels beyond a certain level. The bound rates are specific to individual products and representthe maximum level of import duty that can be levied on a product imported by that member. A memberis always free to impose a tariff that is lower than the bound level. Once bound, a tariff rate becomespermanent and a member can only increase its level after negotiating with its trading partners andcompensating them for possible losses of trade. A bound tariff ensures transparency and predictabilityin trade.