Pakistan Debt Policy Statement, 2011-12 (PDF) - · PDF filePAKISTAN DEBT POLICY STATEMENT...
47
PAKISTAN DEBT POLICY STATEMENT 2011-12 Debt Policy Coordination Office
Transcript of Pakistan Debt Policy Statement, 2011-12 (PDF) - · PDF filePAKISTAN DEBT POLICY STATEMENT...

PAKISTAN DEBT POLICY STATEMENT
2011-12
Debt Policy Coordination Office

DDEEBBTT PPOOLLIICCYY CCOOOORRDDIINNAATTIIOONN OOFFFFIICCEE
MMIINNIISSTTRRYY OOFF FFIINNAANNCCEE
DDEEBBTT PPOOLLIICCYY SSTTAATTEEMMEENNTT
2011-12

This page is left intentionally blank.

Page i
Table of Contents Table of Contents ........................................................................................................................................ i
Acknowledgements .................................................................................................................................... ii
List of Acronyms ........................................................................................................................................ iii
Lists of Tables & Figures .......................................................................................................................... iv
I. Introduction ...................................................................................................................................... 1
II. Debt Policy Statement ................................................................................................................... 3
III. Principles of Sound Debt Management .................................................................................. 4
IV. Review of Public Debt................................................................................................................ 5
IV.i. Dynamics of Public Debt Burden ..................................................................................... 8 IV.ii. Servicing of Public Debt .................................................................................................. 11 IV.iii. Medium Term Macroeconomic Framework .................................................................. 12 IV.iv. Debt Sustainability Analysis ............................................................................................ 13 IV.v. Risks to the Macroeconomic Framework & Structural Factors ................................. 14 IV.v. Sensitivity Analysis ........................................................................................................... 15
V. Domestic Debt .............................................................................................................................. 16
V.i. Permanent Debt ............................................................................................................... 17 V.ii. Floating Debt ..................................................................................................................... 18 V.iii. Unfunded Debt.................................................................................................................... 19 V.iv. Domestic Debt during Jul-Sep 2011 .............................................................................. 21
VI. External Debt & Liabilities ....................................................................................................... 22
Vi.i. Public and Publically Guaranteed Debt ........................................................................ 23 VI.ii. Private Non-Guaranteed Debt ........................................................................................ 24 VI.iii. IMF Debt ............................................................................................................................ 24 VI.iv. Foreign Exchange Liabilities ........................................................................................... 24 VI.v. External Debt & Liabilities during Jul-Sep 2010 .......................................................... 25 VI.vi. Currency Movements and Translational Impact .......................................................... 25 VI.vii. External Debt Servicing ................................................................................................... 26
VII. External Sector Assessment .................................................................................................. 26
VIII. External Debt Sustainability .................................................................................................... 29
IX. Guarantees ................................................................................................................................ 31
X. Report on Compliance with FRDL Act 2005 ............................................................................ 33
XI. Debt Strategy ............................................................................................................................ 35
XII. Concluding Remarks................................................................................................................ 37

Page ii
Acknowledgements
This Policy Statement has been prepared to fulfil the requirement laid out under Section 7 of the Fiscal
Responsibility and Debt Limitation Act 2005. I would like to acknowledge the input of various Ministries,
Departments, Divisions and Agencies, particularly, timely data provision by Budget Wing (MoF),
Economic Affairs Division. I would like to recognize the effort put in by Sajjad Ahmad Sheikh, Joint
Secretary (DPCO), Muhammad Ikram, Deputy Economic Adviser (DPCO), and Farwa Basit Hafiza,
Research Associate (DPCO) in the realization of this comprehensive document.
Masroor Ahmed Qureshi Director General Debt Policy Coordination Office Ministry of Finance

Page iii
List of Acronyms
BoP Balance of Payments CDNS Central Directorate of National Savings CDR Currency-to-Deposit Ratio DSC Defence Savings Certificates DPCO Debt Policy Coordination Office EAD Economic Affairs Division EDL External Debt and Liabilities ENDA Emergency Natural Disaster Assistance FDI Foreign Direct Investment FEE Foreign Exchange Earnings FELs Foreign Exchange Liabilities FER Foreign Exchange Reserves FRDL Act Fiscal Responsibility and Debt Limitation Act GDP Gross Domestic Product IDB Islamic Development Bank IMF International Monetary Fund KESC Karachi Electric Supply Company LTD Long-term Debt MRTB Market Related Treasury Bills MTB Market Treasury Bill NBP National Bank of Pakistan NHA National Highway Authority NSS National Saving Schemes PAF Pakistan Air Force PASSCO Pakistan Agricultural Storage and Services Corporation Ltd. PEPCO Pakistan Electric Power Company PIA Pakistan International Airline PIB Pakistan Investment Bonds PKR Pakistani Rupee PPA Power Purchase Agreement PPG Public and Publically Guaranteed PSEs Public Sector Enterprises PSM Pakistan Steel Mills SBA Stand by Agreement SBP State Bank of Pakistan SDR Special Drawing Rights SFD Saudi Fund for Development STD Short-term Debt TCP Trading Corporation of Pakistan TIP Telephone Industries of Pakistan TPD Total Public Debt USD United States Dollar WAPDA Water and Power Development Authority

Page iv
Lists of Tables & Figures
Table 1. Public Debt, FY07-FY12 Table 2. Selected Debt Indicators Table 3. Real Growth of Public Debt Burden Table 4. Public Debt Servicing, 2010-11 Table 5. Debt Sustainability Analysis Table 6. Outstanding Domestic Debt, FY07-FY12 (in billions of Rs.) Table 7. Causative Factors in Change in Stock of Domestic Debt, FY11 (in billions of Rs.) Table 8. Pakistan: External Debt and Liabilities Table 9. Composition of EDL, FY11 Table 10. Pakistan's Public External Debt Servicing Table 11. Components of Foreign Exchange Earnings & Payments (in billions of US$) Table 12. External Debt Sustainability: FY07 - FY11 (in percent) Table 13. Guarantees Issued, FY11 Table 14. Guarantees Outstanding as of September 30, 2011 (Rs. Billion) Table 15. Domestic Portfolio Mix Table 16. Funding Plan, FY11
Figure 1. Emerging Market Countries: Gross Government Debt, 2011 Figure 2. Composition of Total Public Debt, FY07-FY11 Figure 3. Sources of Increase in Total Public Debt, FY11 Figure 4. Total Public Debt, FY07-FY11, as % of GDP Figure 5. Total Public Debt, FY07-FY11, as % of Govt. Rev Figure 6. Servicing of Public Debt Figure 7. Domestic Debt, FY07-FY11, as % of GDP Figure 8. Structure of Domestic Debt, FY07-FY11 Figure 9. Composition of Permanent Debt Figure 10. MTBs vs. MRTBs, FY07-FY11, in billions of Rs. Figure 11. External Debt and Liabilities Figure 12. Foreign Exchange Reserves, Dec'07-Dec'10, in millions of USD Figure 13. External Debt Sustainability Indicators

Page 1
I. Introduction
Accumulation in debt stock has been the prime problem faced by both developing and
developed countries. Developing countries face this problem more often as they need to borrow
to facilitate their development process and accelerate the pace of growth. However, the
borrowed funds required to be allocated properly for the productive expenditures and in
accordance to their repayment ability. Though debt is useful for the growth of the economy
however dependence on debt must be closely monitored and proper strategy should be adopted
for enhancing the repayment capability of the country. High and unsustainable levels of debt
have serious repercussions for the economy in terms of heavy debt servicing and decreased
developmental expenditures, essential to carry on the growth process. Besides, availability of
lesser funds for investing in the economy and increase in taxes for repayment, hampers growth
as it limits the productive investment, resulting in shrinking of the debt repayment capacity of the
economy. It creates crowding out effect as well as has negative impact on the foreign and
domestic investment and development plans of the government.
The fiscal and real sectors of the economy are strongly linked to internal and external debt
through certain economic variables. On one hand, it appears that the budget deficit is the major
cause of domestic debt. While, on the other hand, it turns out that the deficiency in savings and
its effects on the balance of payments is the basis of foreign debt. Notwithstanding the rationale
behind the occurrence of debt, the level and rate of growth of public debt should not unduly limit
the country’s monetary, fiscal and exchange rate flexibility. A sound debt management strategy
ensures that ample financing is provided for development and growth objectives to be met.
While a debt policy can guarantee the sustainability of a country’s stock of debt, the need for
these debt flows is eventually determined by fiscal and monetary stance along with
developments on the external account. Conversely, the absence of prudent debt management
will have serious consequences to effective monetary management as well as fiscal operations
and will place an additional burden on the external account in the shape of a greater amount of
resources being diverted to debt servicing. In essence, debt policy is a dynamic financing policy
that has to react to implementation of various public policies and act as a constraint to public
policy (over) ambitions.
For quite a few years, most of the countries of the world have made appropriate steps in order
to manage and strategize their public debt. Proper debt sustainability analysis is conducted to
keep the debt levels under check. It is important to note that any attempt to control the debt

Page 2
stock, or the public sector deficit, too tightly may induce instability in other macroeconomic
variables. There is a trade-off between ensuring intergenerational equity through fiscal
responsibility and the goal of short term macroeconomic stabilization.
In recent past majority of the countries around the world have seen worsening of fiscal accounts
and the consequent erosion in debt sustainability indicators as the aftermath of international
debt and credit crisis of 2007-08.
Pakistan’s debt dynamics has undergone substantial changes since FY2007. Higher fiscal
deficit led to accumulation of huge debt both in absolute and relative terms. Due to non
availability of sufficient funds from the external sources, the financing focus shifted towards
domestic sources that led to shortening of maturity profile of public debt. A confluence of
unfavourable factors including lower GDP growth, devastating floods, severe energy shortages,
haemorrhaging PSEs, high inflation, weak security situation and global economic recession
resulted in higher fiscal deficits in the recent past.
Financial discipline over a prolonged period is essential for maintaining macroeconomic stability
in the economy. There is a general consensus that a persistent commitment to financial
discipline can be achieved by following rule-based fiscal policy. Pakistan government also
believes that and accordingly, a rule-based fiscal policy was formed and incorporated in the
Fiscal Responsibility and Debt Limitation (FRDL) Act 2005, which was passed by the Parliament
in June 2005. This Act ensures responsible and accountable fiscal management by all
governments, the present and the future — and would encourage informed public debate about
fiscal policy. According to it, the following statement put out the total public debt in detail and
EMC Average

Page 3
highlights the portions where the government had been successful or failed in achieving the
targets.
II. Debt Policy Statement
The Debt Policy Statement is presented to fulfill the requirement in Section 7 of the Fiscal Responsibility
and Debt Limitation (FRDL) Act 2005. The statement provides an overview of the public debt as well as
external debt and liabilities and explains the changes to debt over the 2009-10.
Section 7 of FRDL Act 2005 requires that:
(1) The Federal Government shall cause to be laid before the National Assembly, the debt policy
statement by the end of January of each year.
(2) The purpose of the debt policy statement is to allow the assessment of the Federal Government’s debt
policies against the principles of sound fiscal and debt management and debt reduction path.
(3) In particular and without prejudice to the provisions of sub-section (2) the debt policy statement shall,
inter alia, contain –
(a) Assessment of the Federal Government's success or failure in meeting the targets of total public
debt to estimated gross domestic product for any given year as specified in the debt reduction
path;
(b) Evaluations of external and domestic borrowing strategies and provide advice on these
strategies;
(c) Evaluations of the nominal and real costs of external and domestic borrowing and suggest ways
to contain these costs;
(d) Analysis of the foreign currency exposure of Pakistan's external debt;
(e) Consistent and authenticated information on public and external debt and guarantees issued by
the Government with ex post facto budgetary out-turns of all guarantees and those of other such
claims and commitments;
(f) Information of all loan agreements contracted, disbursements made thereof and repayments
made thereon, if any, by the Government during the fiscal year; and
(g) Analysis of trends in public debt and external debt and steps taken to conform to the debt
reduction path as well as suggestions for adjustments, if any, in the Federal Government's overall
debt strategy.

Page 4
III. Principles of Sound Debt Management
The modern theory for public debt sustainability discerns a fundamental relationship between
economic stability and debt sustainability in a country. The inadequate debt management and a
permanent and unlimited growth of debt to GDP ratio may result in some negative tendencies
and changes in main macroeconomic indicators, like crowding out of investment, financial
system instability, inflationary pressures, exchange rate fluctuations etc. There are also social
and political implications of unsustainable debt burden. Persistent and high public debt calls for
a large piece of budgetary resources for debt servicing. Ergo, the conventional wisdom focuses
the management of debt, rather debt itself.
Debt is not a stigma in itself, yet the management of debt is important. Debt is an important
measure of bridging the financing gaps. Prudent utilization of debt leads to higher economic
growth and it also helps the government to accomplish its social and developmental goals.
Comprehensive debt management is required on the part of government not only to keep the
current levels of debt under control but also to fulfil the future repayment obligations. This does
not subvert the importance of vigilant fiscal and monetary policies. The management of public
debt also requires effective coordination with macroeconomic policies, including reserve
management and exchange rate policy.
Domestic and external debt should be treated separately. Domestic debt is a charge on budget
and must be serviced through government revenues and/or additional borrowings whereas
external debt (both public and private), in addition to charge on revenues, is also a charge on
balance of payment and must be serviced from foreign exchange earnings, reserve drawdown,
and additional borrowings. Therefore the two should be managed separately to ensure fiscal
and external account solvency. Each of these types of debt has its own benefits and drawbacks,
with a trade-off between costs of borrowing and exposure to various types of risks that needs to
be balanced in order to ensure ample and timely access to cost efficient funding. A
comprehensive approach to managing domestic debt must place a high priority on the
development of domestic capital markets, and avoid the crowding-out of the private sector.
The level of debt depends on the debt servicing capacity of the economy i.e. export earnings
and revenue generation. The debt burden can be expressed in terms of stock ratio i.e. Debt to
GDP, external Debt to GDP or flow ratios i.e. Debt to revenue, external Debt to Foreign
exchange Earnings. It is common practice to measure public debt burden as a percentage of
GDP; however, it makes more sense to measure debt burden in terms of flow ratios because

Page 5
earning potential reflects more accurately on repayment capacity as GDP changes do not fully
translate in to revenues particularly in case of Pakistan where taxation systems are inelastic and
taxation machinery is weak.
As a rule of thumb, as long as the real growth of revenue is higher than the real growth of debt,
the Debt to Revenue ratio will not increase. Crucially, future levels of debt hinge around the
primary balance of the government. Mathematically, if the primary balance (fiscal deficit before
interest payments) is zero and the growth in revenue is higher than the cost of invested funds,
the debt burden will ease. Bridging the gap between revenues and non-interest expenditure,
and ensuring a reduction (generation) in primary deficit (surplus) is an essential pre-requisite
that facilitates debt management efforts.
Managing the levels of external debt, and the risks associated with them pose policy makers
with a different set of challenges. In this case, if the growth in Foreign Exchange Earnings (FEE)
exceeds the growth in External Debt, the ratio of EDL-to-FEE will continue to decline. Although
external debt expressed as a percentage of GDP and export earnings depicts the levels and
burden of external debt, a clear insight in to the future path of debt is gained by analyzing the
non-interest current account deficit. A nil current account deficit before interest payment and
higher growth in FEE compared to the interest rate paid on EDL will ensure a decline in EDL-to-
FEE over time. Focusing on limiting the non-interest current account deficit, while ensuring that
the cost of borrowing is kept at a minimum restricts the increases in debt levels in the medium to
long-term; while partially mitigates the inherent risks of external borrowing.
IV. Review of Public Debt
Pakistan entered the 21 Century with serious financial constraints; public debt was as high as
83 percent of its GDP at the end of FY2001. Pakistan’s economy has experienced a turnaround
since 2000, growth has accelerated, and most macroeconomic indicators have improved. Public
debt indicators have also shown significant improvement. Modest growth in public debt, coupled
with the strong growth in nominal GDP, led to a significant reduction in public debt to GDP ratio,
from 79% in fiscal year 2001-02 to 55.4 percent by the end of FY2007. However since FY07,
fiscal policy became subservient to political exigencies as government extended whole-sale
subsidies on oil, electricity, food and fertilizer to protect the more vulnerable sections of the
society from the effects of global commodity shock. Higher security related expenditures
supplemented by policy inaction on key expenditures plus increased expenditures due to natural
disasters led to rapid escalation of Total Public Debt as a percentage of GDP, reaching 60

Page 6
percent by the end of FY2010. However, the same was 59.3 percent at the end of fiscal year
2011; this would have been 58.2 percent had the government not maintained credit balance
with SBP on June 30, 2011.
The total public debt stood at Rs.10,709 billion as at June 30, 2011, an increase of Rs.1,788
billion or 20 percent higher than the debt stock at the end of last fiscal year. Government
borrowed Rs.1,086 billion from domestic sources and Rs.62 billion from external sources to
finance the fiscal operations. Approximately, US$ 3.3 billion were added to the external debt
stock owing to depreciation of US Dollar against other major international currencies and around
Rs.27 billion were added by depreciation of Pak Rupee against US Dollar by meagre 0.6
percent. In May 2011, government paid Rs. 120 billion against the un-paid tariff differential
subsidy of past years to PEPCO.
Developments in TPD during 2010-11 have been driven mainly by a combination of five distinct
factors. Increased demands on the government budget during 2010-11 for purposes of security
meant that expenditure was fairly rigid even in the face of a committed effort to rationalize
expenditure and curtail the fiscal deficit. Secondly, lower than expected GDP growth, acute
energy shortages, and a high cost of doing business led to a revenue shortfall, situation was
further complicated by the devastating floods that put additional burden on fiscal operations.
Higher international prices for textile products had a positive impact on Pakistan’s trade
balance. In addition to these external developments, import compression measures restricted

Page 7
the import bill significantly despite higher oil prices and shift of power generation mix towards
furnace oil.
Slippages in both revenues and expenditures led to FY2011 budget deficit missing the target.
Gross revenue collection (tax and non-tax) was 12% lower than the budgeted target while total
expenditures (current and development), adjusted for one off payment of energy subsidies
pertaining to previous years, were 2.4% higher than budgetary estimates. FBR tax collection fell
6.5% short of target while non-tax revenues were 22.7% less than target due to non-realization
of expected 3G license receipts and lower logistical support receipts from the US. On the other
hand, expenditure exceeded the target due to higher subsidies and flood related spending
despite PSDP spending being 24% lower than the budgeted target.
The primary source of increase in public
debt during 2010-11 has been a rapid
increase in local currency component that
accounted for almost 76 percent of the total
increase in TPD. The main reasons for this
shift in borrowing were the non-
materialization of privatization proceeds,
slow disbursement from multilateral and
bilateral donors, and higher than budgeted
fiscal deficit.
The external debt component grew by Rs. 424 billion or 24 percent due to increased foreign
public debt inflows on the one hand, and depreciation of US dollar against other major
currencies on the other hand. Rupee lost approximately 0.6 percent of its value against the US
dollar during 2010-11. Depreciation of the US Dollar against other major currencies caused the
foreign currency component of public debt to increase by approximately US $3,300 million. This
capital loss on foreign currency debt, however, is mitigated by the strong concessionality
element associated with Pakistan’s external loans. The impact of any currency shock should not
be looked at in isolation, but rather be analyzed in the context of interest rate differential.
TPD stood at Rs. 10,996 billion at the end of first quarter FY2012, registering an increase of Rs.
287 billion or 2.7 percent in first three months of the current fiscal year. During the first quarter
FY2012, US $ appreciated against other major currencies and registered a meagre capital gain
of approximately US $ 50 million, however Pak Rupee lost its value against US Dollar by 1.7%.
DC: Domestic Component FCC: Foreign Currency Component

Page 8
Government was able to contain the fiscal deficit for the first quarter at 1.2 percent of GDP
against 1.6 percent in same period last fiscal year that helped restricted the growth in public
debt.
A significant positive masked by overall weak fiscal numbers is the distinct uptrend in FBR tax
collection since 4QFY2011. Helped by withdrawal of GST exemption on several sectors and
levy of one-off flood surcharge, FBR tax collection grew by 28.4% in 4QFY2011. However, the
trend has continued into FY2012 with FBR tax collection increasing by 21% during Jul-Dec’2011
despite shifting of GST collection on certain service to the provinces.
Table 1. Public Debt, FY07-FY12* FY07 FY08 FY09 FY10 FY11 (P) FY12* (In billions of Rs.) Domestic Currency Debt 2,601 3,266 3,852 4,651 6,014 6,223Foreign Currency Debt 2,201 2,778 3,776 4,270 4,694 4,773Total Public Debt 4,802 6,044 7,629 8,921 10,709 10,996 (In percent of GDP) Domestic Currency Debt 30.0 31.9 30.3 31.3 33.3 29.8Foreign Currency Debt 25.4 27.1 29.7 28.8 26.0 22.8Total Public Debt 55.4 59.0 60.0 60.1 59.3 52.6 (In percent of Revenue) Domestic Currency Debt 200 218 208 224 266 250Foreign Currency Debt 170 185 204 205 208 192Total Public Debt 370 403 412 429 474 442 (In percent of Total Debt) Domestic Currency Debt 54.2 54.0 50.5 52.1 56.2 56.6Foreign Currency Debt 45.8 46.0 49.5 47.9 43.8 43.4Memo: Foreign Currency Debt (in US$ Billion) 36.4 40.7 46.4 50.0 54.6 54.6Exchange Rate (Rs./US$, E.O.P) 60.4 68.3 81.4 85.5 86.0 87.5GDP (in Rs. Billion) 8,673 10,243 12,724 14,837 18,063 20,905Total Revenue (in Rs. Billion) 1,298 1,499 1,851 2,078 2,261 2,485
P: Provisional
*end-September 2011
Source: EAD, SBP, Budget Wing, MoF and DPCO staff calculations
IV.i. Dynamics of Public Debt Burden
Borrowing is necessary for economic development of any country as long as the economic
returns are higher than the cost of invested funds. As mentioned earlier, the level of debt
depends on the debt servicing capacity of the economy, i.e., export earnings and revenue
generation.

Page 9
The origin of current fiscal predicament can be traced back to FY2006-07 when government
extended wholesale subsidies with a view to protect more vulnerable segments of the society
from the effects of global commodity price shock. However, such measures actually resulted in
pressure on balance of payments, fiscal account (in shape start of circular debt build-up) and
banking system liquidity. The economy finally paid the cost in shape of currency devaluation
with rupee losing more than a third of its value, inflation reaching multi-decade highs of 25
percent in 2nd quarter of FY2008, benchmark interest rates being hiked to 15 percent and GDP
growth falling to 3.7 percent in FY2008 and further to 1.7 percent in FY2009 from an average of
6.8 percent during FY2003-07. Nevertheless, post FY2006 events taught a very expensive
lesson on the need to maintain fiscal discipline as measures haphazardly designed to provide
‘relief’ eventually caused more ‘pain’ for the public in general. As a result of this crises public
debt to GDP ratio shot up to 59 percent in FY2008 from 54.4 percent in FY2007, since then it is
hovering around 60 percent.
A more accurate measure to country’s indebtedness is Total Public Debt in terms of total
revenues. As mentioned earlier if the primary balance (fiscal deficit before interest payments) is
zero and the real growth in revenue is higher than the real growth in debt, the debt burden will
ease. Pakistan saw a primary surplus in FY2004, since then it is running a primary deficit, in
FY2009 government was able to bring the deficit down to 0.1 percent of GDP from 2.5 percent
in FY2008 as a result of fiscal consolidation and rationalization of expenditure. However since
FY2010, owing to increased security expenditure, unsustainable food and energy subsidies and
great floods of 2010, fiscal adjustment path was reversed and the primary deficit reached 2.5
percent of GDP at the end of June 2011.

Page 10
Similar pattern was witnessed in terms of real growth of revenues, from high of 11.9 percent in
FY2007 it declined to -8.4 percent in FY2011. On the other hand a gradual decline in real
growth of debt has been witnessed since FY2008. However, the real growth of debt has been
greater than the real growth of revenues complemented by primary deficit resulted in increase of
debt burden and public debt stood at 4.7 times of government revenues at the end of FY2011.
This ratio is gradually deteriorating over a period of time and government must take corrective
measures to reverse this trend and bring this ratio down to acceptable threshold of 3.5 times.
Table 2. Selected Debt Indicators FY07 FY08 FY09 FY10 FY11 Real Growth of Public Debt 2.3 8.3 5.2 4.5 1.1Real Growth of Revenues 11.9 ‐0.6 2.9 0.3 ‐8.4Real Growth in Non Interest Expenditure 14.1 7.4 ‐11.7 11.6 ‐1.9Real Growth of GDP 6.8 3.7 1.7 3.8 2.4Public Debt/GDP 60.1 59.0 60.0 60.1 59.3Public Debt/Revenue 370.0 403.1 412.1 429.0 474.3Debt Service/Revenue 33.8 37.2 46.6 40.4 37.7
Source: Budget Wing, SBP and DPCO staff calculations
The growing debt burden of the government highlights the importance of increased revenue
generation going forward. As witnessed during 2010-11, even relatively weak real growth of the
level of debt can severely increase the debt burden of the economy if revenue collection in real
terms is not up to par. Government needs to shore up revenue efforts quickly, given the fact that
future payments on account of IMF SBA will increase the quantum of debt servicing, ultimately
increasing pressure on government resources.
Page 11
Debt service as a percentage of total
revenue witnessed a decline though still
higher than the acceptable threshold.
Ideally, this ratio should be below 30
percent to allow government to allocate
more resources towards social and
poverty related expenditure.
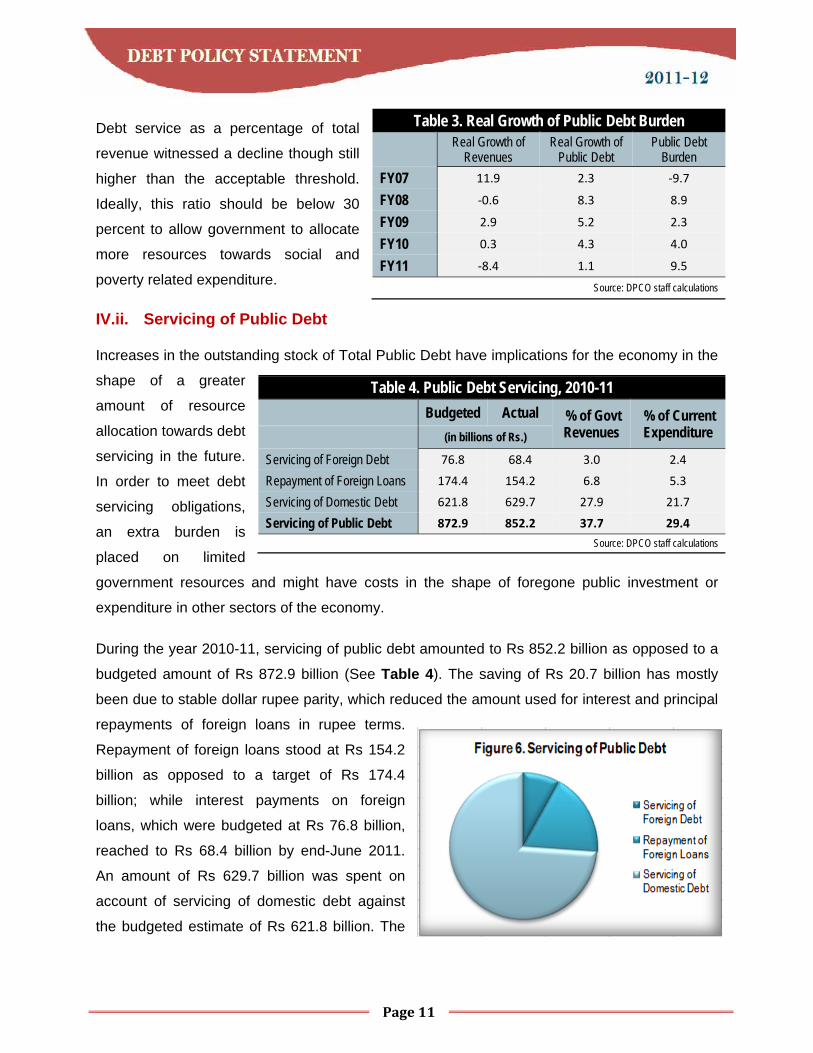
IV.ii. Servicing of Public Debt
Increases in the outstanding stock of Total Public Debt have implications for the economy in the
shape of a greater
amount of resource
allocation towards debt
servicing in the future.
In order to meet debt
servicing obligations,
an extra burden is
placed on limited
government resources and might have costs in the shape of foregone public investment or
expenditure in other sectors of the economy.
During the year 2010-11, servicing of public debt amounted to Rs 852.2 billion as opposed to a
budgeted amount of Rs 872.9 billion (See Table 4). The saving of Rs 20.7 billion has mostly
been due to stable dollar rupee parity, which reduced the amount used for interest and principal
repayments of foreign loans in rupee terms.
Repayment of foreign loans stood at Rs 154.2
billion as opposed to a target of Rs 174.4
billion; while interest payments on foreign
loans, which were budgeted at Rs 76.8 billion,
reached to Rs 68.4 billion by end-June 2011.
An amount of Rs 629.7 billion was spent on
account of servicing of domestic debt against
the budgeted estimate of Rs 621.8 billion. The
Table 3. Real Growth of Public Debt Burden
Real Growth of Revenues
Real Growth of Public Debt
Public Debt Burden
FY07 11.9 2.3 ‐9.7
FY08 ‐0.6 8.3 8.9
FY09 2.9 5.2 2.3
FY10 0.3 4.3 4.0
FY11 ‐8.4 1.1 9.5
Source: DPCO staff calculations
Table 4. Public Debt Servicing, 2010-11 Budgeted Actual % of Govt
Revenues % of Current Expenditure (in billions of Rs.)
Servicing of Foreign Debt 76.8 68.4 3.0 2.4
Repayment of Foreign Loans 174.4 154.2 6.8 5.3
Servicing of Domestic Debt 621.8 629.7 27.9 21.7
Servicing of Public Debt 872.9 852.2 37.7 29.4
Source: DPCO staff calculations

Page 12
increase in domestic debt servicing is partly the result of a tight monetary stance taken in order
to arrest the monetary overhang caused by previous policies.
The increase in the total public debt has implications for the economy in the form of increased
debt servicing in the future. In order to meet these obligations an additional burden is placed on
the limited resources of the government which may result in extraction of recourses from the
developmental programmes and hence hamper growth.
IV.iii. Medium Term Macroeconomic Framework
Projections for key macroeconomic variables are given below;
Economic Growth: GDP growth is expected to be around 3.8 percent for FY12, with growth
momentum increasing in the following years, reaching 4.7 percent GDP growth by FY14.
Inflation: Current projections indicate that inflationary pressures from within and outside the
economy will subside in the medium-term, with increase in CPI falling to 12.0 percent in FY12,
and further to 9.5 percent in FY13. The rate of increase in CPI is projected to fall to 8.0 percent
by FY14.
Revenues: One of the main premises of the medium-term macroeconomic framework is healthy
growth in government revenues. On the basis of successful implementation of tax and tax
administration reforms, revenues are expected to grow by an average of 17 percent per year (in
nominal terms) over the next three years.
Expenditure: On the other hand, expenditures are expected to be growing at a slower pace till
FY14. The quantum of increase is projected to be higher in FY14 owing to an increased outlay
on development projects.
Fiscal Balance: On the back of successful reforms in revenue generation, public sector
enterprises, and a shift from general to targeted subsidies, the fiscal deficit is projected to
decline to 3.0 percent by FY14.
Trade & Current Account Balance: Exports are expected to increase by an average 5.1 percent
over FY12-FY14 while growth in imports is projected to increase to 7.5 percent during the same
period resulting in an increase in the current account deficit in the medium-term.

Page 13
Public Debt: Twin deficits in the medium-term mean that the public debt is bound to rise and
hence, the projected annual growth in the next three years is nearly 7.4 percent. The emphasis
has largely been placed on domestic sources to finance the fiscal deficits in the medium term.
External Debt: The outstanding stock is projected to remain flat once the IMF repayments are
initiated in FY12, with a marginal decrease in stock projected for FY14. Excluding IMF SBA, the
framework envisages gross disbursement of external debt to average at approximately US$ 0.6
billion during the next three years.
IV.iv. Debt Sustainability Analysis
Crucially, future levels of debt hinge around the primary balance of the government.
Mathematically, if the primary balance (fiscal deficit before interest payments) is zero and the
growth in revenue is higher than the cost of invested funds, the debt burden will ease. Bridging
the gap between revenues and non-
interest expenditure, and ensuring a
reduction (generation) in primary deficit
(surplus) is an essential pre-requisite
that facilitates debt management
efforts.
The targeted achievement of a near
zero primary deficit in the medium-term
will pave the way for limiting a rise in
the debt stock of the country. A decline
in the real growth of public debt is
envisaged in the medium term on the
assumption that strict fiscal discipline is accompanied by robust real growth in revenue
collection. Key to the successful implementation of the medium-term framework and its
envisaged impact on debt is that revenue collection will experience real growth over and above
real growth in the debt stock. It is worth-mentioning here that the country is already at higher
than acceptable benchmark levels. Any deviation from the medium-term framework will
adversely affect the country’s debt path. The ability of provinces to generate a surplus is critical
to this scenario. As a percentage of government revenues, total public debt is projected to
decline annually in the medium-term due to significant repayments and a simultaneous increase
Table 5. Debt Sustainability Analysis Base Line FY11 FY12 FY13 FY14
Primary Balance/GDP ‐2.5 ‐0.3 ‐0.1 ‐0.4 Real Growth of Public Debt 1.1 0.9 ‐2.0 ‐2.4 Real Growth of Revenue ‐8.4 9.3 5.1 3.4 Total Public Debt/Revenue 473.4 437.2 407.6 384.8Debt Service/Revenue 37.7 41.2 46.2 40.4
Non-Interest CA/GDP ‐0.8 0.4 0.8 1.2 Growth in EDL 8.1 1.8 ‐2.1 ‐4.0Growth in FEE 24.6 4.1 6.0 5.7 EDL/FEE 126.5 123.6 114.1 103.7 EDL Service/FEE 11.4 9.7 13.0 13.1
Debt Burden 9.4 ‐8.3 ‐7.1 ‐5.8 Fiscal Deficit/GDP 6.6 4.7 4.2 3.7 Total Public Debt/GDP 59.3 57.9 54.2 50.4
Source: DPCO staff calculations

Page 14
in revenues. Similarly, debt service exhibits an inclining trend in the framework owing to
repayment of IMF-SBA, afterwards bringing this indicator down to acceptable threshold.
A stable but significant non-interest current account deficit is expected to persist in the medium-
term. Growth in external debt will be driven by underlying disbursements and repayments to the
fund. The external debt of the country is projected to decline once the IMF payouts begin. The
sustainability of the external debt stock is envisaged through growth in foreign exchange
earnings surpassing that of external debt in the medium-term. Servicing of external debt is
expected to increase due to IMF-SBA repayment as a percentage of the country’s foreign
exchange earnings. Any slippage in the external account will put pressure on the balance of
payments that will in turn jeopardize the currency parity.
The debt burden of the country is projected to decline in the medium-term on the back of
successful revenue generation efforts and implementation of tax administration reform. The
pace of decline in the debt burden is expected to increase once new revenue measures are
implemented. Based on these assumptions, and in the presence of stable economic growth,
total public debt is expected to decline as a percentage of GDP. It is important to note that
throughout the medium-term framework, the level of public debt remains below the threshold of
60 percent of GDP as prescribed under the FRDL Act 2005.
IV.v. Risks to the Macroeconomic Framework & Structural Factors
The debt dynamics of the country can be altered by risks to key macroeconomic indicators in
the medium term. The macroeconomic framework envisages strict financial discipline under a
declining inflationary environment. Any deviation or adverse movement of fiscal and monetary
assumptions poses significant risks to the sustainability of the medium-term macroeconomic
framework.
The underlying catalyst in the creation of fiscal space in the medium-term is an envisaged
robust growth in revenue collection. Failure in implementing various measures to enhance
revenue collection and in meeting the target set for the coming year poses a major risk to the
soundness of the framework. If a shortfall is offset by an adjustment in expenditure, the debt
carrying capacity of the economy may be restricted as a result of lower levels of future growth.
With regard to expenditure, higher than expected outlays similar to those witnessed on account
of security related expenditure and power sector subsidies in recent years will maintain pressure

Page 15
on debt creation, threatening the envisaged reduction in the debt burden and inflationary
pressures.
In addition to the threat posed by slippages on account of revenue collection and expenditure,
there is also a significant risk posed to the medium-term framework by the envisaged fiscal
discipline of the provinces. If the assumed provincial surpluses are not achieved, the fiscal
deficit target will be compromised, adding pressure on debt creation.
Changes in the deficit financing may also alter the medium-term framework. In case of non-
materialization of envisaged foreign financing will add pressure on domestic sources and also
will have negative consequences for interest rates, private sector credit provision, inflation, and
debt servicing.
On the external account, a high current account in the absence of offsetting increases to
current transfers and non-debt creating capital flows can add to the stock of external debt.
Similarly, any increase in interest rates and exchange rate depreciation will increase the debt
servicing cost of the country and will affect the sovereign debt portfolio. Together, these
changes culminate into a visible increase in the public debt stock. Further, in case of added
pressure on balance of payments due to international commodity prices (specifically oil prices),
non-availability of foreign currency flows will adversely impact the currency parity and foreign
currency reserve position of the country.
IV.v. Sensitivity Analysis
When subjected to isolated shocks, the medium-term sustainability of the country’s debt burden
is most susceptible to an increased non-interest current account deficit. With regards to fiscal
account, a failure to increase revenue generation substantially results in increased primary and
fiscal deficits. However, none of these shocks threatens the declining trend in the country’s debt
burden and associated indicators as long as the revenue-expenditure gap does not unduly
disturb the underlying fiscal discipline. While the debt stock may not be vulnerable to individual
shocks, a culmination of negative developments on the external and fiscal accounts highlights
the threat to medium-term debt sustainability.
A combined shock to these variables will largely erode the fiscal stability and debt dynamics of
the country, and will place the economy on an increasing debt path. More specifically, under
such circumstances, not only will the targeted achievement of primary balance be jeopardized,

Page 16
but the falling trend in the debt burden will be reversed. The public debt-to GDP will increase to
65.2 percent by FY14, breaching the limit imposed by FRDL Act 2005.
V. Domestic Debt
Domestic debt is widely perceived as being an endogenous rather than an exogenous policy
choice variable and hence, a country’s issuance capacity in this regard is determined by the
level of income, pool of savings and institutional quality. Moreover, the budget deficit can be
covered directly through money creation by the central bank or by increased credit of the
banking system. Excessive monetary financing translates into excess overall demand and
inflation. Compared to borrowing from the central bank, market-based domestic borrowing adds
more to macroeconomic stability, low inflation and reduced exposure to external real and
domestic monetary shocks, domestic savings generation and private investment. Hence,
governments by and large, opt for a market-based domestic borrowing strategy in order to
develop domestic financial markets.
On the downside, though, a broad expansion in domestic debt poses significant negative
connotations for private investment, fiscal sustainability and ultimately economic growth and
poverty reduction in case of thin financial markets and poor debt management capacity.
Additionally, given access to cheap external finance, in the form of concessionary loans and
grants from international financial institutions, governments preferably avoid seemingly
expensive domestic borrowing. Nonetheless, liquid domestic debt markets can help strengthen
money and debt capital markets, boost private savings, and stimulate investment.
Domestic debt consists of three main categories: permanent debt, floating debt, and unfunded
debt. Permanent debt includes instruments for medium to long-term debt such as Pakistan

Page 17
Investment Bonds (PIBs) while the short-term borrowing needs of the government are catered
to by floating debt which includes Treasury Bills. Unfunded debt is made up of the various
instruments available under the National Savings Scheme (NSS) which is an on-tap source of
financing.
The share of permanent debt in total domestic debt is continuously declining since 2004-05
owing to irregular and thin issuance at the longer end of the sovereign yield curve. This
declining trend was reversed in FY2011 with the debt management strategy to lengthen the
maturity profile of domestic debt. Contribution of permanent debt to total domestic debt stock
increased to 19 percent in FY2011 from 17 percent in FY2010. On the contrary, the share of
unfunded debt in total domestic debt increased by 3 percentage points, due to heavy reliance
on government to borrow in
floating debt to meet the
fiscal deficit and payment of
Rs. 120 billion against past
years unpaid power tariff
differential subsidy through
floating treasury bills. Share
of floating debt to total
domestic increased to 54
percent in FY2011 from 52
percent in last fiscal year.
This imbalance in the term structure of domestic debt needs to be addressed as undue reliance
on short-term sources of financing raises the rollover or refinancing risk for the government.
Failure to issue new debt in order to mature a large amount of outstanding short term debt may
trigger a liquidity or debt rollover crisis. The increase in frequency of such operations (due to
their short term nature) coupled with any adverse rise in interest rates may leave the
government vulnerable to high cost of debt. Below is a detailed analysis of domestic debt
categories:
V.i. Permanent Debt The outstanding stock of permanent debt grew by 41 percent over last fiscal year, registering a
net addition of Rs 327.6 billion in 2010-11. Sizeable receipts from Government Ijara Sukuk bond
and Pakistan Investment Bonds contributed to this expansion.

Page 18
Government mopped up net of retirement
Rs 182.4 billion through successful
auctions of Ijara Sukuk bond and Rs.
112.3 billion through Pakistan Investment
Bonds during fiscal year 2011. Prize bonds
observed a rise of 17 percent in its stock
during the period under review.
A dearth of private sector credit demand
during 2010-11 and banks’ preference of
risk-free sovereign credit in view of
mushrooming non-performing loans
augured well for the government securities market and overwhelming participation was
witnessed in their auctions. Notably, the coupon rates on PIBs were increased in line with
market expectations.
V.ii. Floating Debt
Floating debt recorded an enlargement of 35 percent during 2010-11 compared to 26 percent in
the previous fiscal year. Keeping in view the negative consequences of monetization of the
fiscal deficit, the government has adhered strictly to the “net zero quarterly borrowing limits”
from the SBP and retired Rs 32 billion during the fiscal year.
The outstanding stock of
Treasury bills through auction
increased by 43 percent in
2010-11, as commercial banks’
interest in government paper
revived. This preference for T-
bills was an outcome of a
number of factors including
increase in risk aversion, low
demand for credit from the
private sector and the market expectation of reduction in policy rate.

Page 19
Table 6. Outstanding Domestic Debt, FY07-FY12* (in billions of Rs.) FY07 FY08 FY09 FY10 FY11(P) FY12*Permanent Debt 562.7 616.6 685.9 797.1 1,125.3 1,181.8 Market Loans 2.9 2.9 2.9 2.9 2.9 2.9 Government Bond 9.6 9.3 7.3 7.2 0.7 0.7 Prize Bonds 174.5 182.8 197.4 236.0 277.1 287.6 Foreign Exchange Bearer Certificates 0.2 0.2 0.2 0.1 0.1 0.1 Bearer National Fund Bonds 0.0 0.0 0.0 0.0 0.0 0.0 Federal Investment Bonds 3.1 0.9 1.0 0.0 0.0 0.0 Special National Fund Bonds 0.0 0.0 0.0 0.0 0.0 0.0 Foreign Currency Bearer Certificates 0.0 0.0 0.0 0.0 0.0 0.0 U.S. Dollar Bearer Certificates 0.0 0.0 0.0 0.0 0.0 0.0 Special U.S. Dollar Bonds 9.4 8.2 7.7 2.7 1.0 0.9 Government Bonds Issued to SLIC 0.6 0.6 0.6 0.6 0.6 0.6 Pakistan Investment Bonds (PIB) 352.5 411.6 441.0 505.3 618.2 670.7 Government Bonds issued to HBL 9.8 0.0 0.0 0.0 0.0 0.0 GOP Ijara Sukuk 0.0 0.0 27.8 42.2 224.6 218.1 Floating Debt 1,107.6 1,637.4 1,904.1 2,399.1 3,235.4 3,341.9 Ad hoc Treasury Bills 0.0 0.0 0.0 0.0 0.0 0.0 Treasury Bills on Tap 0.0 0.0 0.0 0.0 0.0 0.0 Treasury Bills through Auction 655.5 536.4 795.6 1,274.1 1,817.6 2,108.2 Rollover of Treasury Bills discounted SBP 0.6 0.6 0.6 0.5 0.5 0.5 Treasury Bills purchased by SBP (MRTBs) 451.5 1,052.6 1,107.3 1,077.7 1,317.0 1,202.9 Outright Sale of MTBs 0.0 47.8 0.6 46.7 100.3 30.3 Unfunded Debt 940.0 1,020.3 1,270.5 1,457.6 1,655.8 1,700.6 Defence Savings Certificates 289.0 284.6 257.2 224.9 234.5 236.4 Khas Deposit Certificates and Accounts 0.6 0.6 0.6 0.6 0.6 0.6 National Deposit Certificates 0.0 0.0 0.0 0.0 0.0 0.0 Savings Accounts 18.7 27.7 16.8 17.8 17.2 15.7 Mahana Amadni Account 2.5 2.5 2.4 2.2 2.1 2.1 Postal Life Insurance 67.1 67.1 67.1 67.1 67.1 67.1 Special Savings Certificates and Accounts 208.3 227.6 377.7 470.9 529.1 540.4 Regular Income Scheme 51.3 51.0 91.1 135.6 182.6 195.6 Pensioners' Benefit Account 69.0 87.7 109.9 128.0 146.0 149.9 Bahbood Savings Certificates 190.2 229.0 307.5 366.8 428.5 443.6 National Savings Bonds 0.0 0.0 0.0 3.6 3.6 3.6 G.P. Fund 43.3 42.5 40.1 39.9 44.3 45.4 0.085 0.245 0.147 0.136 Total Domestic Debt 2,610.3 3,274.3 3,860.4 4,653.8 6,016.4 6,224.3 Total Domestic Debt (excluding foreign
currency debt included in external debt) 2,600.6 3,265.8 3,852.5 4,650.9 6,015.2 6,223.1 P: Provisional * end‐September'11
Source: SBP, Budget Wing, MoF and DPCO staff calculations
V.iii. Unfunded Debt
During 2010-11, major NSS instruments witnessed considerable expansion except Defense
Savings Certificates and Savings Accounts. The stock of unfunded debt stood at Rs 1,655.8

Page 20
billion as of June 30, 2011 recording a healthy growth of 14 percent. Bahbood Savings
Certificates and Special Savings Certificates Accounts topped the list with a net investment of
Rs 61.7 billion and Rs. 58.2 billion respectively during 2010-11.
Table 7. Causative Factors in Change in Stock of Domestic Debt, FY11 (in billions of Rs.)
Stock Stock Receipts Repayments Net Investment
(End FY10) (End FY11) (in FY11) Permanent Debt 797.7 1125.3 730.8 403.3 327.6 Market Loans 2.9 2.9 0.0 0.0 0.0 Government Bond 7.2 0.7 0.0 6.5 ‐6.5 Prize Bonds 236.0 277.1 138.9 97.8 41.1 Foreign Exchange Bearer Certificates 0.1 0.1 0.0 0.0 0.0 Bearer National Fund Bonds 0.0 0.0 0.0 0.0 0.0 Federal Investment Bonds 0.0 0.0 0.0 0.0 0.0 Special National Fund Bonds 0.0 0.0 0.0 0.0 0.0 Foreign Currency Bearer Certificates 0.0 0.0 0.0 0.0 0.0 U.S. Dollar Bearer Certificates 0.0 0.0 0.0 0.0 0.0 Special U.S. Dollar Bonds 2.7 1.0 0.0 1.7 ‐1.7 Government Bonds Issued to SLIC 0.6 0.6 0.0 0.0 0.0 Pakistan Investment Bonds (PIB) 505.9 618.2 409.6 297.3 112.3 Government Bonds issued to HBL 0.0 0.0 0.0 0.0 GOP Ijara Sukuk 42.2 224.6 182.4 0.0 182.4 Floating Debt 2,399.1 3,235.4 6,948.3 6,112.0 836.3 Treasury Bills through Auction 1,274.1 1817.6 3,807.1 3,263.6 543.5 Rollover of Treasury Bills discounted SBP 0.5 0.5 0.0 0.0 0.0 Treasury Bills purchased by SBP (MRTBs) 1,124.4 1317.0 3,018.4 2,825.8 192.6 Outright Sale of MTBs 100.3 122.9 22.6 100.3 Unfunded Debt 1,457.5 1654.7 652.0 454.8 197.2 Defence Savings Certificates 224.7 234.3 49.9 40.3 9.6 Khas Deposit Certificates and Accounts 0.6 0.6 0.0 0.0 0.0 National Deposit Certificates 0.0 0.0 0.0 0.0 0.0 Savings Accounts 17.8 16.2 177.5 179.2 ‐1.6 Mahana Amadni Account 2.2 2.2 2.2 2.2 0.0 Postal Life Insurance 67.1 67.1 0.0 0.0 0.0 Special Savings Certificates and Accounts 470.9 529.2 189.3 131.1 58.2 Regular Income Scheme 135.6 182.6 78.6 31.7 46.9 Pensioners' Benefit Account 128.0 146.0 34.0 16.1 17.9 Bahbood Savings Certificates 366.8 428.5 114.4 52.7 61.7 National Savings Bonds 3.6 3.6 0.0 0.0 0.0 G.P. Fund 39.9 44.3 6.1 1.7 4.4 Total Domestic Debt 4,654.3 6,015.3 8,331.1 6,970.1 1,361.0
Source: Budget Wing, MoF and DPCO staff calculations

Page 21
During the course of the year 2010-11, the rate of return on these instruments has been linked
with the yield on long term government paper such as PIBs. Moreover, price setting is being
done on a quarterly basis.
It is important to note that funds raised through National Saving Schemes (NSS) contribute 28
percent of the total domestic debt down 10 percentage points from FY2006. Central Directorate
of National Savings (CDNS) is a major source for Government to mobilizing domestic retail
savings. Government need to strengthen the capacity building of CDNS with a view to
restructured and converted CDNS into vibrant customer centric distribution channel for
government debt instruments. Transfer pricing mechanism may be introduced to induce
efficiency.
The rates offered on various NSS are aligned with the government bonds (PIBs), however the
time lag involved in resetting profit rates is a major source of interest rate arbitrage. The rate
setting should be dynamic and more closely aligned to the domestic market yield curve.
Furthermore, the put option embedded in most of the NSS is a potential source of severe
liquidity crises. The Government should immediately stop this practice and create instrument
liquidity by developing secondary market for NSS instruments to ensure long term liquidity to the
government. A pre-requisite in this regard, however, is a complete automation of CDNS
operations.
V.iv. Domestic Debt during Jul-Sep 2011 The domestic debt stood at Rs. 6,223 billion at the end of the first quarter of 2011-12,
representing an increase of Rs. 208 billion during the first three months of the current fiscal
year. This increase stems from a healthy issuance of market debt namely Treasury bills (Rs.
290.6 billion) and PIBs (Rs. 52.5 billion). Notably, this quarter witnessed a massive retirement of
Rs. 104 billion in the stock of central bank borrowing. The instruments under the NSS umbrella
contributed Rs. 45 billion to the total stock of domestic debt, bulk of which comes from the
Special Savings Certificates, Bahbood Savings Certificates and Regular Income Certificates.
Duration of domestic debt at 2.15 years is fairly low given the fact that government funding
requirements are generally long term. This estimate of duration may be little inconsistent owing
to non-availability of actual maturity profile of NSS and manual operations of CDNS. A
behavioral analysis was undertaken to estimate the maturity of NSS instruments. Generally, it is
the government’s desire to incur the lowest annual debt servicing cost while ignoring portfolio
risks. It is important for the government to take necessary measures to lengthen the maturity

Page 22
profile of domestic debt. Though this may result in additional debt servicing cost in the short
term, it would certainly help in reducing the associated liquidity and refinancing risks in the
domestic debt portfolio.
The domestic debt portfolio contains a number of instruments under the same credit risk and
maturity horizons. Presently the government borrows through wholesale and retail markets, as
well as in the form of government guaranteed loans carrying different rates for the same
underlying sovereign risk. This high fragmentation of instruments present in the government
debt market cause distortion in the benchmark yield curve and hence, hinder the development
of domestic debt capital markets. The debt capital markets are still at its infancy and need to be
aggressively developed. As part of it, transparency in fiscal data, a consistent debt management
strategy, a level playing field for all investor groups and an efficient transaction mechanism are
some of the important preconditions to start with. The government is geared towards improving
the liquidity of benchmark issues in the market as previous issues are consistently being re-
opened since 2006.
VI. External Debt & Liabilities
The country’s External Debt and Liabilities (EDL) stock
was recorded at US$ 60.1 billion as of June 30, 2011.
During 2010-11, US$ 4.5 billion was added to the stock
resulting in a growth of 8.1 percent. Bulk of this
increase was contributed by depreciation of US Dollar
against other major international currencies. A surplus
current account led by strong export growth primarily
because of higher cotton prices in the international
markets, low debt and non-debt creating foreign were responsible for this muted growth of EDL
adjusted for currency movement. There was no fresh disbursement under IMF-SBA during the
period under review whereas other heads underwent minor changes. As a percentage of GDP
in dollar terms, the EDL was down by 290 bps in 2010-11 compared to 2009-10 and
approximated to 28.5 percent.
Below is a detailed analysis of each category within EDL.

Page 23
Table 8: Pakistan: External Debt and Liabilities FY07 FY08 FY09 FY10 FY11(P) FY12* (in billions of USD) 1. Public and Publically Guaranteed Debt 35.8 40.6 42.6 43.2 46.6 46.7 i) Public debt 35.8 40.6 42.6 43.1 46.5 46.6 A. Medium and Long Term(>1 year) 35.8 39.9 41.9 42.3 45.9 46.0 Paris Club 12.7 13.9 14.0 14.0 15.5 15.6 Multilateral 18.7 21.6 23.1 23.8 25.9 25.7 Other Bilateral 1.0 1.2 1.5 1.8 2.0 2.2 Euro Bonds/Saindak Bonds 2.7 2.7 2.2 1.6 1.6 1.6 Military Debt 0.1 0.0 0.2 0.2 0.1 0.1 Commercial Loans/Credits 0.1 0.1 0.2 0.1 Local Currency Bonds 0.0 0.0 0.1 0.1 0.1 Saudi Fund for Development (SFD) 0.2 0.2 0.2 SAFE China Deposits 0.5 0.5 0.5 0.5 NBP/BOC Deposits 0.5 0.4 0.3 0.2 0.1 0.0 B. Short Term (<1 year) 0.0 0.7 0.7 0.8 0.6 0.6 IDB 0.0 0.7 0.7 0.8 0.6 0.6 ii) Publicly guaranteed debt 0.0 0.0 0.0 0.1 0.1 0.1 Paris Club 0.0 0.0 0.0 Multilateral 0.1 0.1 0.1 Other Bilateral 0.0 0.0 0.0 Commercial Loans/Credits Saindak Bonds 2. Private Non-Guaranteed Debt (>1 year) 2.0 2.9 3.3 3.2 3.5 3.4 3. IMF 1.4 1.3 5.1 8.1 8.9 8.7 of which Central Govt. 1.1 2.0 1.9 Monetary Authorities 1.4 1.3 5.1 7.0 6.9 6.7 4. Scheduled Banks' Borrowing 0.1 0.1 0.6 Total External Debt (1 through 4) 39.2 44.9 51.1 54.5 59.1 59.3 5. Foreign Exchange Liabilities 1.0 1.4 1.4 1.1 1.0 1.0 Total External Debt & Liabilities (1 through 5) 40.2 46.3 52.4 55.6 60.1 60.3 (of which) Public Debt 36.4 40.7 46.4 50.0 54.6 54.6 Official Liquid Reserves 14.3 8.7 9.5 13.1 14.8 13.7 (in percent of GDP) Total External Debt (1 through 4) 27.4 27.4 31.5 30.8 28.0 24.8 1. Public and Publically Guaranteed Debt 25.0 24.8 26.3 24.4 22.0 19.5 A. Medium and Long Term(>1 year) 25.0 24.4 25.9 23.9 21.7 19.2 B. Short Term (<1 year) 0.0 0.4 0.4 0.4 0.3 0.2 3. IMF 1.0 0.8 3.2 4.6 4.2 3.6 4. Foreign Exchange Liabilities 0.7 0.9 0.8 0.6 0.5 0.4 Total External Debt & Liabilities (1 through 5) 28.1 28.3 32.3 31.4 28.5 25.2 Official Liquid Reserves 10.0 5.3 5.9 7.4 7.0 5.7 Memo: GDP (in billions of Rs.) 8,673 10,243 12,724 14,837 18,063 20,905 Exchange Rate (Rs./US$, Period Avg.) 60.6 62.5 78.5 83.8 85.5 86.8 Exchange Rate (Rs./US$, EOP) 60.4 68.3 81.4 85.5 86.0 87.5 GDP (in billions of US dollars) 143.0 163.8 162.1 177.0 211.3 239.0
* end‐September 20111P : Provisional
Source: SBP, EAD and DPCO staff calculations
Vi.i. Public and Publically Guaranteed Debt
Public and Publically Guaranteed (PPG) debt was US$ 46.6 billion at end-June 2011, up by
US$ 3.4 billion against FY2009-10. This lower growth of 7.8 percent has restrained the overall

Page 24
increase in the stock of EDL nonetheless, the PPG
debt still accounts for a major portion of EDL
amounting to 77.4 percent for 2010-11, up by 0.4
percentage points in comparison to 2009-10. Bulk of
this increase is contributed by exchange rate
movement and not by fresh disbursements. There has
been a repayment of USD 75 million and USD 100
million of commercial loans and NBP/Bank of China
deposits respectively.
USD 185 million worth of short term debt guaranteed
by Islamic Development Bank was repaid. The stock of publically guaranteed debt decreased by
11 percent and rested at USD 105 million at the end of FY2010-11, as compared to USD 118
million last year. This has mainly emanated because no new commercial loan was raised and
other bilateral were repaid.
VI.ii. Private Non-Guaranteed Debt
The outstanding stock of private non-guaranteed debt increased by only US $ 315 million at the
end the fiscal year 2010-11 at US$ 3.483 million. Slower economic activity, prolonged power
outages and deteriorating security situation has held back the corporate sector to embark upon
any fresh investment and hence, shrinkage in financing needs to be met through external
sources was apparent in the form of diminishing private sector debt.
VI.iii. IMF Debt
Pakistan entered in to Stand by Arrangement with IMF in 2008; during the fiscal year under review no
fresh disbursements were made rather repaid US $ 267 million to IMF.
VI.iv. Foreign Exchange Liabilities
Foreign Exchange Liabilities (FEL) mainly comprise of central bank deposits and foreign
currency bonds. FEL decreased by 9.1 percent in FY2010-11 and summed to US$ 1.0 billion at
end-June 2011.
Table 9. Composition of EDL, FY11 Component Percent Public & Publicly Guaranteed 77.4 Paris Club 25.7 Multilateral 43.0 Other Bilateral 3.3 Short Term 1.0 Other 4.2 Private Non-Guaranteed 5.8 IMF 14.9 Foreign Exchange Liabilities 1.7 Memo: Total EDL (in billions of US$) 60.1
Source: DPCO staff calculations

Page 25
VI.v. External Debt & Liabilities during Jul-Sep 2010
The first quarter of FY2011-12 observed an increase of USD 93 million in public and publically
guaranteed debt and aggregated to USD 46.7 billion. The increase has mostly been registered
in the stock of medium and long term debt which increased by USD 142 million. The Paris club
and other bilateral loan showed increase of USD 387 million which was nullified by the
repayment of multilateral loans and NBP deposit of USD 246 million. EDL grew by USD 179
million and increased to USD 60.3 billion during the first three months of current fiscal year.
The first quarter of the current fiscal year noticed a meagre capital gain of US $ 44.7 million
owing to US Dollar appreciation against other major international currencies.
VI.vi. Currency Movements and Translational Impact
Foreign loans and other debt obligations of the Government of Pakistan are contracted in
various currencies. The bulk of these loans (approximately 93 percent) are in three major
international currencies. For reporting purposes, the outstanding balance of these loans is
converted into US Dollar. Hence, movement in the US Dollar vs. third currency exchange rates
has a significant impact on Pakistan’s outstanding stock of external debt. Depreciation of the
dollar will cause an increase in the outstanding stock, while appreciation will cause a decrease.
During the course of 2010-11, currency movements caused an increase of approximately US$
3.3 billion in Pakistan’s outstanding EDL. On the contrary, first quarter of the current fiscal year
registered a decrease of US$ 44.7 million in EDL owing to currency movements.
Managing foreign exchange risk is a fundamental component of a prudent debt management
strategy. Careful management of currency risk has been increasingly mandated by sovereigns,
especially after the currency-crisis episodes of the last decade and the consequent heightened
international attention on accounting and balance sheet risks. A comprehensive foreign
exchange risk management programme requires establishing and implementing sound and
prudent foreign exchange risk management policies and control procedures. The external debt
portfolio of Pakistan is contracted in 20 different currencies and the historical losses borne by
Pakistan in this respect call for a sophisticated currency hedging framework to be installed
within the government. If we analyse the currency movements over a longer period of last 20
years, the cost of foreign currency borrowing adjusted for exchange rates movement has been
1.5 percent lower than the average domestic interest rates.

Page 26
VI.vii. External Debt Servicing
During FY2010-11, external debt servicing summed to US$ 4,799 million that is 14.3 percent
lower than the previous year. A segregation of this aggregate number shows a payment of US$
2,348 million in respect of maturing EDL stock while interest payments were US$ 963 million.
US$ 1,488 million was rolled-over.
Among the principal repayments, US$ 980 million of multilateral debt and US$ 325 million of
Islamic Development Bank accounted for most of the share. Similarly, hefty interest payments
worth of US$ 963 million on foreign currency public debt contributed to the bottom line. In
FY2010-11, the central bank deposits were mostly rolled-over.
During July-September 2011, the servicing
on external debt was recorded at US$ 1.356
billion. Out of the grand total, principal
repayments were US$ 475 million and
interest payments were 181 million. The roll-
overs amounted to US$ 700 million in the
first quarter of 2011-12.
Over the last three years, the debt servicing
levels have notably increased.
Notwithstanding, with the IMF-SBA
repayments set to initiate in the second half of FY 2011-12, the servicing will increase to much
higher levels.
VII. External Sector Assessment
Current account showed resilient performance despite different odds by posting a surplus of
USD 268million (0.13% of GDP) during fiscal year 2010-11 against a deficit of USD 3.94billion
(2.2% of GDP) during fiscal year 2009-10 on account of improved trade balance (higher cotton
prices) and swelling inflows in remittances. It was for the first time after fiscal year 2003-04 that
Pakistan managed to post a current account surplus. Benefitting from this surplus, overall
balance of external account stood at USD 2.4billion (1.2% of GDP) in fiscal year 2011 against
USD 1.2billion (0.72% of GDP) in the same period last year.
Table 10. Pakistan's Public External Debt Servicing
Years Actual
Amount Paid
Amount Rolled Over
Total
(in millions of USD)
2006‐07 2,326 1,300 3,626
2007‐08 2,558 1,200 3,758
2008‐09 3,986 1,600 5,586
2009‐10 3,880 1,723 5,603
2010‐11 3,311 1,488 4,799
2011‐12* 656 700 1,356 *July‐September 2011
Source: State Bank of Pakistan

Page 27
After global economic downturn of 2008, trade volumes started to deteriorate in fiscal year
2009-10, however as economic activities showed improvements in fiscal year 2011, trade
volumes showed signs of recovery. Developing countries, including Pakistan, benefitted from
economic recovery in developed world as it boosted its exports during fiscal year 2010-11.
Despite escalating oil prices during fiscal year 2010-11, higher commodity prices of cotton and
strong global demand helped Pakistan trade account. Cotton prices soared from USD 83/lb in
Mar-10 to a high of USD 243/lb in Mar-11. Trade deficit decreased by 9 percent during fiscal
year 2010-11 from USD 11.5Billion (-6.5% of GDP) in FY2009-10 to USD 10.4Billion (-5.0% of
GDP). A 29% increase in exports, mainly driven by higher contributions from textile and food
group surpassed the increase of 15% in imports (on account of higher global crude oil prices)
during fiscal year 2010-11. In addition to improved trade balance, increasing influx of
remittance further helped current account. Remittances jumped up to USD 11.2billion in fiscal
year 2010-11 against USD 8.9billion in last year, registering a robust growth of 26%.
Channelizing remittances into formal sector along with greater outreach of banks overseas
contributed towards strong remittances growth.
Exports amounted to USD 25.4 billion in fiscal year 2010-11 against USD 19.7 billion in the
corresponding period last year. High commodity prices amid demand recovery in international
market resulted in improved growth in exports. Textile sector, a major contributor of exports
witnessed a positive growth of 29%, showing a quantum increase of USD 2.9billion. Low value
added textile products saw healthy export growth, as raw cotton and cotton yarn increased by
Table 11. Components of Foreign Exchange Earnings & Payments (in billions of US$)
FY07 FY08 FY09 FY10 FY11Foreign Exchange Earnings 33.0 37.2 35.4 38.1 47.5
Goods: Exports f.o.b 17.3 20.4 19.1 19.7 25.4 Services: Credit 4.1 3.6 4.1 5.2 5.5 Income: Credit 0.9 1.6 0.9 0.6 0.7 Current Transfers 10.7 11.6 11.3 12.7 15.9 Of which Workers Remittances 5.5 6.5 7.8 8.9 11.2
Foreign Exchange Payments 39.9 51.1 44.6 42.1 47.1 Goods: Imports f.o.b 27.0 35.4 31.7 31.2 35.7 Services: Debit 8.3 10.0 7.5 6.9 7.6 Income: Debit 4.5 5.5 5.3 3.8 3.7 Of which Interest Payments 1.4 2.2 1.9 1.5 1.5 Current Transfers: Debit 0.1 0.1 0.1 0.1 0.1
Source: SBP and DPCO staff calculations

Page 28
48.63% and 44.33% respectively during fiscal year 2010-11, while cotton cloth also posted a
healthy growth of 30% during the same period. High value added product knitwear and bed
wear also registered a growth of 31% and 23.5% respectively, while towels showed a growth of
5% during fiscal year 2010-11. Higher cotton prices in international market, improved demand in
US, UK and currency appreciation of competitors all contributed towards improvement in textile
exports.
Import increased by 15% to reach at USD 35.7 billion in fiscal year 2010-11 against USD
31.2billion during the corresponding period last year on account of higher crude oil and
commodity prices coupled with improved domestic demand.
Net inflows in financial account saw a substantial fall of 59% reaching at USD 2billion in fiscal
year 2010-11 against USD 5billion during the corresponding period last year. Disbursements of
long term loans contributed the most in decline of inflows as it decreased by 33% during fiscal
year 2010-11, taking decline in total disbursement to 43% during the same period. Net portfolio
investment provided some respite as it posted an inflow of USD 338million during fiscal year
2010-11 against an outflow of USD 65million during the corresponding period last year.
Deteriorating law and order situation, weak economic activity and energy crises had a toll on
foreign direct investment, which decreased by 24% during fiscal year 2010-11.

Page 29
Improved balance of payment on account of current account surplus in fiscal year 2010-11
contributed towards higher foreign exchange reserves. June 2011 saw Pakistan foreign
exchange reserves reaching a record high of USD 18.2billion, with SBP holding USD 14.8billion
while banks held USD 3.4billion. Building on improved current account position and reserves,
Pakistan rupee remained stable during fiscal year 2010-11, unlike previous fiscal year where
rupee depreciated substantially. Rupee/USD lost by 0.6% in fiscal year 2010-11 against 5% in
the same period last year.
Gains from last fiscal year surplus quickly reversed in first quarter of fiscal year 2011-12 as
current account deficit amounting to USD 1.3bn was registered during the period on account of
higher imports. Imports saw a hefty increase of 24% in July-Sep 2011-12 meanwhile exports
managed to grow by 16% during the period under review. Increasing prices of crude oil in
international market burden Pakistan’s import bill as was seen in the price of Arab light oil which
increased from an average price of USD 73.9/bbl in first quarter fiscal year 2010-11 to an
average price of USD 108.3/bbl in July-Sep 2011-12. Meanwhile higher remittances continue to
provide cushion to current account deficit, as remittances increased by 25% during first quarter
fiscal year 2011-12. Government’s strong commitment to route inflows through formal sector
has yielded positive and impressive results.
Financial account saw a decrease of 25% during first quarter fiscal year 2011-12 on account
increasingly subdued foreign direct investment, outflows from portfolio account and fewer
disbursements in loan programs. FDI continued its slide in first quarter of current fiscal year as it
decreased by 29% under period review.
After touch an all time high foreign exchange reserves of 18.3billion during the first month of
current fiscal year, reserves slipped in during the month August and September. At the end of
first quarter current fiscal year, reserves stood at 17.3billion, increased payments for oil bill
during the period under review resulted in lower foreign exchange reserves. Decrease in foreign
exchange reserves will have a toll on local currency; however its impact is witness with a lag.
During first quarter fiscal year 2011-12 USD/PKR stood at 86.8 against USD/PKR of 85.7 in the
same period last year.
VIII. External Debt Sustainability
During 2010-11, non interest current account showed a surplus of 0.9 percent of nominal GDP,
a deficit of 1.4 percent recorded in FY2010. Similarly, the foreign exchange earnings of the

Page 30
country were up by 24.6 percent whereas the non-interest foreign currency payments were up
by 12.3 percent. These positive developments on the balance of payments front, besides other
factors, culminated into a restrained growth of 8.1 percent in the country’s external debt and
liabilities stock as opposed to a high average growth of 12 percent over the last three years
(FY2008 and FY2010).
Table 12. External Debt Sustainability: FY07 ‐ FY11 (in percent)
External Debt Indicators FY 07
FY 08
FY 09
FY 10
FY 11
Non Interest Current Account/GDP 3.8 7.1 4.5 1.4 ‐0.9 Growth in Exports 4.4 18.2 ‐6.4 2.9 29.3 Growth in Imports 8.0 31.2 ‐10.3 ‐1.7 14.5 Growth in EDL 7.9 15.2 13.3 6.1 8.1 Growth in FEE 4.0 13.0 ‐5.2 7.9 24.6 Growth in Non Interest Foreign Currency Payments 8.5 27.0 ‐12.7 ‐4.9 12.3 EDL Servicing/FEE 12.6 11.7 18.0 16.5 11.4EDL/FEE (times) 1.22 1.24 1.48 1.46 1.26 EDL/GDP 28.1 28.3 32.4 31.5 28.5 Rollover Ratio (Principal Repayments/Disbursements) public debt 41.0 22.5 37.7 56.6 90.3
FEE: Foreign Exchange Earnings; STD: Short‐term Debt; EDL: External Debt and Liabilities; LTD: Long‐term Debt;
TPD: Total Public Debt; FER: Foreign Exchange Reserves
Source: EAD, SBP & DPCO staff calculations
The fiscal year 2010-11 saw an improvement in the external debt sustainability indicators in
comparison to the preceding year. A major respite has been witnessed in the EDL-to-GDP ratio
as it improves from 31.5 percent in FY2009-10 to 28.5 percent in FY2010-11. Improvement has
also been observed in the EDL-to-FEE that stood at 1.26 times in FY2010-11 as compared to
1.46 times in FY2009-10 at the back of strong workers’ remittances and a positive turn-around
in export earnings. A generally acceptable
threshold requires a country’s EDL to remain
below 2 times of FEE.
External Debt Servicing as a percentage of
Foreign Exchange Earnings has been
declining since FY2010 and stood at 11.4
percent during FY2011. Pakistan is
gradually approaching the internationally
acceptable percentage (20 percent) in terms
of this indicator. The current levels of
servicing are bound to increase as IMF-SBA

Page 31
repayments initiate in FY2012, that require
serious efforts to enhance the export
earnings if Pakistan is to remain under the
accepted threshold.
The roll-over ratio has deteriorated in
FY2011 as opposed to the previous fiscal
year. The Principal repayments-to-
Disbursements ratio was 56.6 percent in
FY2010 that increased to 90.3 percent in
FY2011. This means that most of the
disbursed amounts were used up in paying
off the maturing external debt. This is a
serious situation that requires urgent attention of the policy makers as was evident from
shrinking of Net Foreign Assets of the banking system since start of the current fiscal year that
put pressure on both domestic interest rates and currency parity. It is imperative for the
government to take corrective measures to attract debt and non-debt creating foreign currency
flows.
IX. Guarantees
Guarantees are contingent liabilities that come into play on the occurrence of an event covered
by the guarantee. Since guarantees result in increase in contingent liability, they should be
examined in the same manner as a proposal for a loan, taking into account, inter alia, the credit-
worthiness of the borrower, the amount and risks sought to be covered by a sovereign
guarantee, the terms of the borrowing, the justification and public purpose to be served,
probabilities that various commitments will become due and possible costs of such liabilities,
etc.
The sovereign guarantee is normally extended for the purpose of achieving the following
objectives:-
(i) To improve financial viability of projects or activities undertaken by government entities with
significant social and economic benefits;

Page 32
(ii) To enable public sector companies to raise resources at lower interest charges or on more
favorable terms;
(iii) To fulfill the requirement in cases where sovereign guarantee is a precondition for
concessional loans from bilateral/multilateral agencies to sub-sovereign borrowers.
However, there are also costs associated with the provision of government guarantees. Hence,
such off‐balance sheet transactions cannot be overlooked in order to gain a holistic view of a
country’s fiscal position and unveil the hidden
risks associated with the obligations made by
the government outside the budget. Similarly,
reported debt levels of a sovereign may be
understated owing to the non‐inclusion of
guarantees, explicit or implicit, which may
materialize in future. In the case of Pakistan,
these include, for instance, explicit and implicit
guarantees issued to Public Sector
Enterprises (PSEs) and unfunded losses of
state owned entities such as Pakistan Steel
Mill, PIA, WAPDA, PEPCO, Railways, etc.
During the fiscal year 20010-11, the
Government of Pakistan issued guarantees aggregating to Rs. 62.4 billion (See Table 13). This
issuance amounted to 0.35 percent of GDP.
Public disclosure of information about guarantees is an essential component of fiscal
transparency, but it is more important to reflect the impact of financial risk associated with
guarantees in the fiscal account. The outstanding contingent liabilities as of June 30, 2011 stood
at Rs. 555.5 billion. This includes the stock of explicit debt guarantees in both domestic and
foreign currencies that appear in the accounting books of PSEs. The Rupee guarantees
accounted for 54.4 percent of the total stock.
Other than the publically guaranteed debt of PSEs, Government Issue counter guarantees
against the commodity financing operations undertaken by TCP, PASSCO, and provincial
governments. Commodity financing is secured against hypothecation of commodities and letter
of comfort from the Finance Division. For 2010-11, Rs. 62.4 billion worth of new guarantees
Table 13. Guarantees Issued, FY11
Name of Organization Amount (in billions of Rs.)
WAPDA 6.45 TCP 8.57 Pakistan Stone Development Company 0.40
PIA 4.50 Pakistan Navy 42.47 Grand Total 62.38 (In percent of GDP)
Grand Total 0.35% Memo: GDP (in billions of Rs.) 18,063
Source: DPCO staff calculations

Page 33
were issued on behalf of commodity financing operations, translating into 0.5 percent of the
nominal output.
Table 14. Guarantees Outstanding as of September 30, 2011 (Rs. Billion) Outstanding Guarantees extended to PSEs 555.5
-Domestic Currency 302.2
-Foreign Currency 253.4
Memo:
Foreign Currency (US$ Million) 2,896.4
Source: DPCO
X. Report on Compliance with FRDL Act 2005
The Fiscal Responsibility and Debt Limitation (FRDL) Act, 2005 was approved on 13 June 2005.
The FRDL Act, 2005 requires that the federal government take measures to reduce total public
debt and maintain it within prudent limits thereof. The following sections identifies the various
limits prescribed by the FRDL Act 2005 and reports on progress thereof.
The FRDL Act 2005 requires the following:
(1) Reducing the revenue deficit to nil not later than the thirtieth June, 2008 and
thereafter maintaining a revenue surplus
As of June 30, 2011, the revenue deficit approximated to Rs. 595 billion or 3.3 percent of GDP.
Revenue Balance
FY03 FY04 FY05 FY06 FY07 FY08 FY09 FY10 FY11 ‐1.5% 0.3% 0.5% 1.0% ‐0.6% ‐3.2% ‐1.2% ‐2.4% ‐3.3%
(2) Ensure “that within a period of ten financial year, beginning from the first July, 2003
and ending on thirtieth June, 2013, the total public debt at the end of the tenth
financial year does not exceed sixty percent of the estimated gross domestic product
for that year and thereafter maintaining the total public debt below sixty percent of
gross domestic product for any given year.”
As of 30th June 2011, the total public debt stood at 59.3 percent of GDP. It must be noted here
that the limit of 60 percent of total public debt-to-GDP is applicable from the fiscal year 2012-13
onwards.

Page 34
FY03 FY04 FY05 FY06 FY07 FY08 FY09 FY10 FY11 (in billions of Rs)
Domestic Currency Debt 1,852 1,995 2152 2322 2601 3266 3852 4651 6015
Foreign Currency Debt 1,771 1,816 1,913 2,038 2201 2778 3776 4270 4694
Total Public Debt 3,623 3,810 4,065 4,359 4802 6044 7629 8921 10709
GDP 4,876 5,641 6,500 7,623 8673 10243 12724 14837 18063
Total Public Debt (as % of GDP) 74.3 67.6 62.5 57.2 55.4 59.0 60.0 60.1 59.3
(3) Ensure “that in every financial year, beginning from the first July, 2003, and ending
on the thirtieth June 2013, the total public debt is reduced by no less than two and a
half percent of the estimated gross domestic product for any given year, provided
that social and poverty alleviation related expenditures are not reduced below 4.5
percent of the estimated gross domestic product for any given year and budgetary
allocation to education and health, will be doubled from the existing level in terms of
percentage of gross domestic product during the next ten years.”
During the fiscal year 2010-11, the Debt to GDP ratio was reduced by 0.8 percent. Social and
poverty alleviation related expenditure (as given by pro-poor budgetary expenditure excluding
non-development outlays on law and order) remained at 6.9 percent of GDP in 2010-11.
Additionally, expenditure on health and education in 2010-11 amounted to 0.6 percent and 1.8
percent of GDP respectively.
FY03 FY04 FY05 FY06 FY07 FY08 FY09 FY10 FY11 Social sector and poverty related expenditure (as % of GDP)
3.6 3.9 4.2 4.9 4.9 9.3 6.9 6.7 6.9
Expenditure on education (as % of GDP) 1.6 1.7 1.8 1.9 1.9 1.8 1.9 1.8 1.8
Expenditure on health (as % of GDP) 0.5 0.5 0.5 0.5 0.6 0.6 0.7 0.8 0.6
(4) Not issue “new guarantees, including those for rupee lending, bonds, rates of return,
output purchase agreements and all other claims and commitments that may be
prescribed, from time to time, for any amount exceeding two percent of the
estimated gross domestic product in any financial year: Provided that the renewal of
existing guarantees shall be considered as issuing a new guarantee.”

Page 35
New guarantees issued by the government in 2010-11 amounted to Rs. 62.4 billion or 0.35
percent of GDP. The government also issued letter of comfort equivalent to 0.5 percent of GDP
against commodity finance.
Since last few years Pakistan is faced with serious challenges both at domestic and
international fronts. Serious internal security situation, energy shortages, severe floods and
rising inflation combined with global economic & credit crises and higher commodity prices have
all put enormous pressure on government’s limited fiscal resources. Given the severity of these
constraints the government has been able to manage the fiscal deficits at reasonable levels
though was unable to fully comply with some provisions of FRDLA 2005. However, the
government remains fully committed to adhere to all the provisions of FRDLA 2005 in future.
XI. Debt Strategy With a view to improve the quality of debt management operations, government, for the first
time, adopted a comprehensive debt management strategy for fiscal year 2010-11. The key
focus of the strategy was to;
Explore foreign currency borrowing avenues, and
Augment the domestic liquidity
Quantitative Targets
External Sources; US $500-1,000 million from international debt capital markets.
Domestic Sources;
Government issued a request for proposal to raise US$500 million through issuance of
exchangeable bonds of OGDCL and a consortium of leading international institutions was
assigned the task, however government did not get a favorable response from the international
capital markets owing to Euro zone credit & debt crises and general risk averseness on part of
investors for sovereign debt / equity linked structures. Resultantly, the focus shifted towards
borrowing from the domestic sources.
Table 15. Domestic Portfolio Mix (Rs. Billion) Short term 91 Treasury Bills 91 Long Term 408 Pakistan Investment Bonds 100 GOP Ijara Sukuk 68 National Saving Schemes & Others 240 Total Domestic Borrowings 499

Page 36
Government borrowed Rs.527bn in long term against a target of Rs.408bn; higher demand for
Islamic instruments, favorable liquidity conditions and low private sector credit demand owing to
lower economic growth helped the government to raise long term debt. Government borrowed
Rs569bn in the shorter tenors against the target of Rs.91bn, higher fiscal deficit contributed by
increased security spending, higher energy & food subsidies, non-materialization of defense
and privatization receipts, lower revenue collections, floods in Sindh and payment of Rs.120bn
to clear the energy subsidy claims of past years were the main reasons for this high short term
borrowings.
With a view to develop domestic debt markets by broadening the investor base, government
removed the taxation anomalies in the
Finance Bill 2012 to provide level playing field
to retail investors in government market debt
instruments. A comprehensive campaign on
government debt instruments will be launched
soon to create awareness amongst retail
investors regarding investment options in
government securities. Furthermore, to attract
the offshore investors to invest in domestic
debt markets, relevant changes were made
through the Finance Bill 2012. Results of
these initiatives would be visible in FY2012.
Ministry of Finance intends to develop a comprehensive strategy to deepen the domestic debt
capital markets in collaboration with Securities Exchange Commission of Pakistan, State Bank
of Pakistan and other stake holders.
Furthermore, steps may be taken to augment the domestic resource envelop. One way could be
to reduce currency to deposit ratio (CDR) that currently hovers around 30 percent, highest in the
region. With money multiplier over 3 times, a small reduction in CDR can significantly add to
resource envelop. Ministry of Finance in consultation with SBP shall work out a plan to address
this issue.
A major second source of supplementing domestic liquidity could be to unlock personal equity.
Banking penetration is comparatively lower in the rural economy owing to non-
documentation/non-valuation of real estate in rural areas. Measures shall be taken to incentivize
Table 16. Funding Plan, FY11 (Rs. Billion) Plan Actual Variance T-Bills 91 569 478 PIBs 100 112 12Sukuk 68 182 114CDNS 240 233 ‐7
Domestic Currency 499 1,096 597 Foreign Currency 92 46 ‐46 Grants 94 52 ‐42 Total Borrowing 685 1,194 509
Fiscal Deficit (PKR) 685 1,194 509 Fiscal Deficit* (% of GDP) 4.0% 6.6% 2.6% GDP 16,975 18,036
* includes grants and 120 billion one-off expense

Page 37
the rural public to borrow against their assets. This will not only help in supplementing liquidity
but also provide needed stimulus to domestic demand of goods and services.
Recent developments in Net Foreign Assets, whereby it has shrunk considerable during the
FY2012, immediate action on the proposed measures for augmentation of domestic resource
envelop has become critical, else government will be forced to continue to borrow from SBP that
will not only be inflationary but also complicate management of monetary policy and keep the
domestic interest rates on the higher side.
XII. Concluding Remarks
Increased pressure on government’s limited financial resources from higher security related
expenditures and unsustainable power & food subsidies have resulted in higher fiscal deficits in
the recent path, situation is further compounded by weak taxation machinery. Recent levels of
high public debt and large external debt are results of persistent fiscal and current account
deficits, non-optimal utilization of financial resources, diminishing debt carrying capacity and
rising cost of borrowing.
Public debt to GDP ratio declined by a 0.8 percentage point to stand at 59.3 percent during
FY2011, below the ceiling of 60 percent envisaged in the FRDL Act 2005. Fiscal control and a
limit on borrowing from SBP facilitated this reduction. However, public debt to GDP may be
understated as this ratio does not include any estimates of contingent liabilities, which might
materialize in future. Unfortunately, government has not installed any system to quantify and
manage the fiscal impact of these contingent liabilities, rather these liabilities are created
essentially on an ad hoc basis and without regard to fiscal consequences.
Soundness of Pakistan’s debt position, as given by various sustainability ratios, while
deteriorating slightly in the previous fiscal year, remains higher than the internationally accepted
thresholds. Total Public debt levels around 3.5 times and debt servicing below 30 percent of
government revenue are generally believed to be within the bounds of sustainability. Total
public debt in terms of revenues has increased to 4.7 times during 2010-11, as opposed to 4.3
times in the previous fiscal year whereas the debt serving to revenue has declined to 37.7
percent in 2010-11 from 40.4 percent in 2009-10. Regardless, the widening gap between the
real growth of revenues and real growth of Total Public Debt needs to be aggressively
addressed to reduce the debt burden and improve the debt carrying capacity of the country to
finance the growth and development needs.

Page 38
Pakistan’s external debt and debt servicing in terms of foreign exchange earnings stood at 1.3
times and 11.4 percent during 2010-11 compared to 1.5 times and 16.5 percent respectively in
2009-10, within the acceptable threshold of 2 times and debt servicing below 20 percent of
foreign exchange earnings. However, repayment of IMF debt starting from 2HFY2012 will put
pressure on external debt servicing in coming years, therefore it is imperative for the
government to take measures for attracting both debt and non-debt foreign currency flows. In
the current global economic scenario it will be uphill task for the government to manage external
account solvency.
Divergent trends between growth in foreign exchange earnings and government revenues on
one hand, and foreign exchange payments and expenditure on the other hand, point towards
underlying structural issues which need to be addressed. Export receipts and other foreign
currency non-debt creating flows need to be increased above and beyond the growth of foreign
exchange payments and growth of external debt and liabilities. By doing so, the government will
be able to restrict the non-interest current account deficit, and ensure the sustainability of
present levels of external debt. Failure to arrest the widening gap between foreign exchange
inflows and outflows will severely hamper the government’s room to manoeuvre in case of
future external shocks and may possibly lead to a balance of payment crisis and explosive debt
path.
The difference between revenues and expenditure and their growth rate poses similar problems
for public debt management. To limit the growth of public debt burden and to avoid future debt
traps, it is essential that significant real growth in revenues is achieved while undertaking a
simultaneous rationalization of expenditure. It must be noted however that rationalization of
expenditure should not adversely affect outlays under the PSDP as they are essential in
ensuring future economic growth and social welfare. Debt reduction to sustainable levels cannot
be achieved without persistent economic growth. The slowdown in growth is a major
consequence of rising debt burden and simultaneously adversely impacts the debt servicing
capacity of the economy. Therefore it is important for the government to adopt an integrated
approach for economic revival and debt reduction strategy, which will require some difficult
trade-offs in the short-term, thus implementing structural reforms that boost potential growth is a
key to ensure debt sustainability.
Given the impact international exchange rate movements (US Dollar vis-à-vis other international
currencies) have historically had on external debt, and the significant translational losses

Page 39
suffered in the fiscal year 2011, the government should take measures to mitigate the market
risk factor of external borrowing by planning to implement a broad-based currency and interest
rate hedging strategy and ensuring exchange rate stability.

ffiinnaannccee..ggoovv..ppkk