Debt Policy Statement 2008-09
48
Debt Policy Statement 2008-09 Debt Policy Coordination Office (DPCO) Ministry of Finance Government of Pakistan Islamabad, January 31, 2009
Transcript of Debt Policy Statement 2008-09
Debt Policy Statement 2008-09
Debt Policy Coordination Office (DPCO) Ministry of Finance
Government of Pakistan Islamabad, January 31, 2009
|Deb
t Policy Statem
ent, 2008‐09
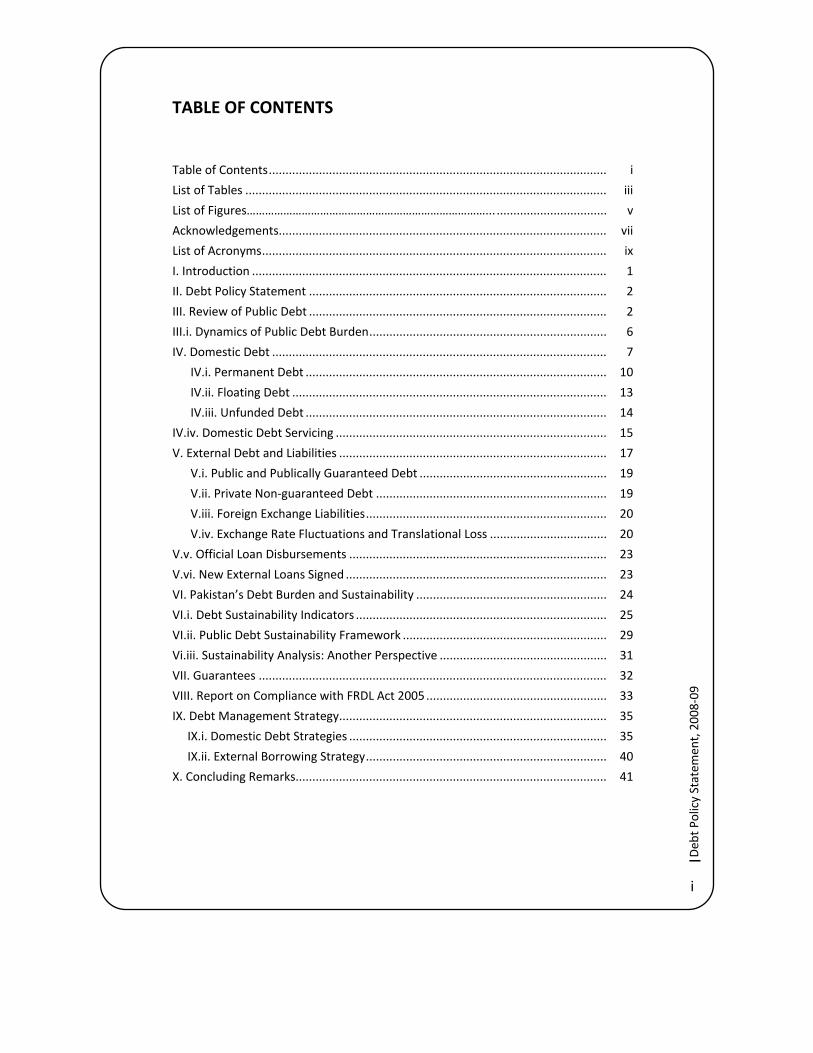
TABLE OF CONTENTS
Table of Contents ..................................................................................................... i
List of Tables ............................................................................................................ iii
List of Figures……………………………………………………………………... ................................. v
Acknowledgements.................................................................................................. vii
List of Acronyms ....................................................................................................... ix
I. Introduction .......................................................................................................... 1
II. Debt Policy Statement ......................................................................................... 2
III. Review of Public Debt ......................................................................................... 2
III.i. Dynamics of Public Debt Burden ....................................................................... 6
IV. Domestic Debt .................................................................................................... 7
IV.i. Permanent Debt .......................................................................................... 10
IV.ii. Floating Debt .............................................................................................. 13
IV.iii. Unfunded Debt .......................................................................................... 14
IV.iv. Domestic Debt Servicing ................................................................................. 15
V. External Debt and Liabilities ................................................................................ 17
V.i. Public and Publically Guaranteed Debt ........................................................ 19
V.ii. Private Non‐guaranteed Debt ..................................................................... 19
V.iii. Foreign Exchange Liabilities ........................................................................ 20
V.iv. Exchange Rate Fluctuations and Translational Loss ................................... 20
V.v. Official Loan Disbursements ............................................................................. 23
V.vi. New External Loans Signed .............................................................................. 23
VI. Pakistan’s Debt Burden and Sustainability ......................................................... 24
VI.i. Debt Sustainability Indicators ........................................................................... 25
VI.ii. Public Debt Sustainability Framework ............................................................. 29
Vi.iii. Sustainability Analysis: Another Perspective .................................................. 31
VII. Guarantees ........................................................................................................ 32
VIII. Report on Compliance with FRDL Act 2005 ...................................................... 33
IX. Debt Management Strategy ................................................................................ 35
IX.i. Domestic Debt Strategies ............................................................................. 35
IX.ii. External Borrowing Strategy ........................................................................ 40
X. Concluding Remarks ............................................................................................. 41
i
| Deb
t Policy Statem
ent, 2008‐09
LIST OF TABLES
Table 1. Public Debt, FY02‐FY09 ............................................................................ 5
Table 2. Servicing of Public Debt FY08 ................................................................... 6
Table 3. Real Cost of Borrowing ............................................................................. 6
Table 4. Dynamics of Public Debt Burden .............................................................. 7
Table 5. Outstanding Domestic Debt, FY02‐FY09 .................................................. 9
Table 6. Causative Factors in Change in Stock of Domestic Debt, FY08 ................ 10
Table 7. Causative Factors in Change in Stock of Domestic Debt, FY09 ................ 11
Table 8. Domestic Debt Burden ............................................................................ 15
Table 9. Interest Payments on Domestic Debt, FY08 ............................................ 17
Table 10. Interest Payments on Domestic Debt, FY09(end‐Oct.) ......................... 17
Table 11. Pakistan: External Debt and Liabilities, FY02‐FY09 ................................ 18
Table 12. Composition of EDLs, FY08 ..................................................................... 19
Table 13. Causative Factors in Change in External Debt and Liabilities, FY08 ......... 20
Table 14. Causative Factors in Change in External Debt and Liabilities, FY09 ......... 21
Table 15. Translational Exchange Rate Impact FY08 …………………………. ................ 21
Table 16. Translational Impact During FY09Q1 ………………………………. ................... 22
Table 17. Disbursement of Official Loans by Economic Classification, FY08 ........... 24
Table 18. New Official Loans Signed, FY08 .............................................................. 24
Table 19. Trends in External Debt Sustainability Indicators, FY00‐FY08 .................. 26
Table 20. Pakistan’s External Debt Servicing………………………………….... ................... 28
Table 21. Guarantees Issued, FY08 and FY09Q1 ..................................................... 33
iii
|Deb
t Policy Statem
ent, 2008‐09
LIST OF FIGURES
Figure 1. Public Debt, FY00‐FY09Q1 (As percent of GDP) ...................................... 3
Figure 2. Public Debt, FY00‐FY09Q1 (As percent of Govt. Revenue) ..................... 4
Figure 3. Structure of Public Debt, FY02‐FY09Q1……………………………... ................. 5
Figure 4. Domestic Debt, FY00‐FY09 end‐Oct (As percent of GDP) ....................... 8
Figure 5. Structure of Domestic Debt, FY03 and FY07 ........................................... 8
Figure 5a. Structure of Domestic Debt, FY04 and FY09 (Oct.) ................................ 9
Figure 6. PIB Issuance, FY01‐FY09 .......................................................................... 12
Figure 7. Weighted Average Yields at Auction (Jul 05‐ Dec 08) ............................. 12
Figure 8. Net Investment (NSS), FY02‐FY09 ........................................................... 14
Figure 9. Trends in Domestic Debt Burden, FY00‐FY08 ........................................ 16
Figure 10. Currency Composition of Official Loan Disbursements, FY08 ............... 23
Figure 11. Trends in External Debt Sustainability Indicators, FY02‐FY08 ............... 27
Figure 12. Trends in External Debt Sustainability Indicators, FY02‐FY08 .............. 27
Figure 13. Pakistan’s External Debt Sustainability ................................................ 32
v
| Deb
t Policy Statem
ent, 2008‐09
Acknowledgement
This report has been prepared by the Debt Policy Coordination Office (DPCO) to fulfill the requirement laid out under Section 7 of the Fiscal Responsibility and Debt Limitation (FRDL) Act 2005. It is a result of concerted efforts of many individuals. I would like to thank various Ministries, Departments, Divisions and Agencies for timely provision of the data to the DPCO. In particular, we would like to acknowledge the support from Budget Wing (MoF), Corporate Finance Wing (MoF), External Finance Wing (MoF), EAD and SBP. I would like to recognize the hard work put in by Syed Jaffer Askari, Economist (DPCO), and Mehwish Ashraf, Financial Analyst (DPCO) in bringing this comprehensive policy statement to fruition. This report also greatly benefited from input and experience of Zafar‐ul‐Hassan, Deputy Economic Advisor (EA Wing).
Dr. Ashfaque Hasan Khan Special Secretary Finance/ Director General (Debt Office) Ministry of Finance
vii
|Deb
t Policy Statem
ent, 2008‐09
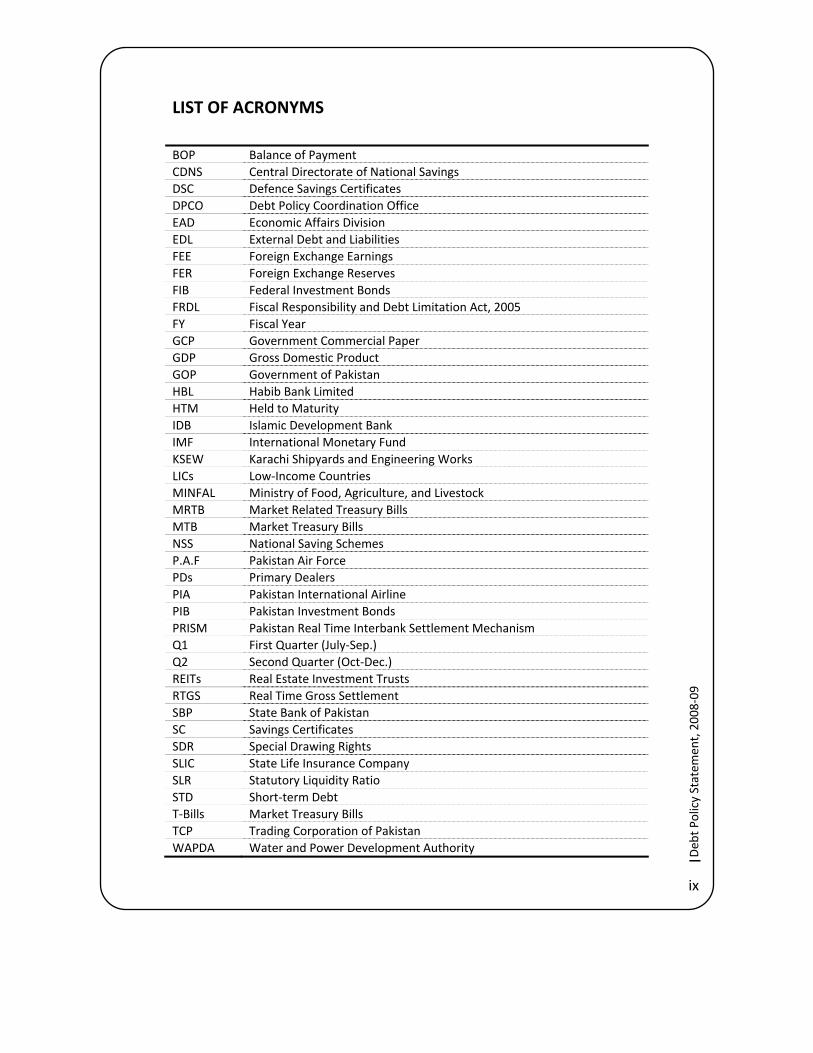
LIST OF ACRONYMS
BOP Balance of PaymentCDNS Central Directorate of National SavingsDSC Defence Savings CertificatesDPCO Debt Policy Coordination OfficeEAD Economic Affairs DivisionEDL External Debt and LiabilitiesFEE Foreign Exchange EarningsFER Foreign Exchange ReservesFIB Federal Investment BondsFRDL Fiscal Responsibility and Debt Limitation Act, 2005FY Fiscal Year GCP Government Commercial PaperGDP Gross Domestic ProductGOP Government of PakistanHBL Habib Bank LimitedHTM Held to MaturityIDB Islamic Development BankIMF International Monetary FundKSEW Karachi Shipyards and Engineering WorksLICs Low‐Income CountriesMINFAL Ministry of Food, Agriculture, and LivestockMRTB Market Related Treasury BillsMTB Market Treasury BillsNSS National Saving SchemesP.A.F Pakistan Air ForcePDs Primary DealersPIA Pakistan International AirlinePIB Pakistan Investment BondsPRISM Pakistan Real Time Interbank Settlement MechanismQ1 First Quarter (July‐Sep.)Q2 Second Quarter (Oct‐Dec.)REITs Real Estate Investment TrustsRTGS Real Time Gross SettlementSBP State Bank of PakistanSC Savings CertificatesSDR Special Drawing RightsSLIC State Life Insurance CompanySLR Statutory Liquidity RatioSTD Short‐term DebtT‐Bills Market Treasury BillsTCP Trading Corporation of PakistanWAPDA Water and Power Development Authority
ix
I . INTRODUCTION
1. Debt, domestic and external, is one of the key forms of financing for most governments. Economies world wide, be they developing or developed, rely on debt inflows to fulfill any balance of payment financing needs. Although it is a useful source of financing, reliance on debt must be closely monitored and strategized. Debt places a future repayment obligation on the economy which has serious consequences for macroeconomic fundamentals. If debt inflows are noticed to put severe burdens on the economy in the future, they are said to be unsustainable. On the other hand, if an economy can repay its debt while maintaining soundness of macroeconomic fundamentals, the debt is said to be sustainable. In other words, debt is sustainable when it can be serviced without resort to exceptional financing (such as debt relief) or a major future correction in the balance of income and expenditure1.
2. Unsustainable levels of debt have repercussions for an economy in the form of a re‐allocation of resources towards debt servicing. Governments are forced to adjust expenditure levels and direct additional resources towards the repayment of debt and associated interest payments. Consequently, this reallocation has a negative impact on development programs, domestic investment, and poverty relief initiatives, known as the crowding‐out effect. A lack of funds for domestic investment and an increase in taxes to repay the debt can have significant negative impacts on economic growth by limiting productive investments. Difficulties in repayment of debt can lead an economy towards a situation recognized as debt distress. A country is said to be facing debt distress when one or more of the following conditions hold: (a) the sum of interest and principal arrears is large relative to the outstanding stock of debt, (b) a country receives debt relief in the form of rescheduling and/or debt reduction from the Paris Club of bilateral creditors, and (c) the Country receives substantial balance of payments support from the IMF under its non‐concessional Standby Arrangements or Extended Fund Facilities. Failure to repay debt obligations increases the cost of financing as well as making it increasingly difficult to obtain financing from multilateral institutions and development banks. A recent example of countries in debt distress is the debt crisis faced by Low‐Income Countries and Latin American countries in the 1980s. A rise in external financing combined with adverse terms of trade shocks and macroeconomic mismanagement, lead to a build up of the debt burden and a deterioration of debt indicators in LICs, providing the onset for the debt problems of the 1980s. In response to the growing debt burden, private creditors reduced their exposure, while official creditors responded through concessional flow rescheduling in the Paris Club and new lending from multilateral agencies.
3. For the above mentioned reasons, it is vital to review a country’s debt situation, with regards to present stock as well as future commitments and obligations, and in relation with key economic variables, assess the sustainability of its levels of debt.
1 How to do a Debt Sustainability Analysis for Low-Income Countries, World Bank, 2005
1
|Deb
t Policy Statem
ent, 2008‐09
I I . DEBT POLICY STATEMENT
4. The Debt Policy Statement is presented to fulfill the requirement in Section 7 of the Fiscal Responsibility and Debt Limitation (FRDL) Act 2005. The statement provides an overview of the public debt as well as external debt and liabilities and explains the changes to debt over the 2006‐07 and early 2007‐08.
Section 7 of FRDL Act 2005 requires that:
(1) The Federal Government shall cause to be laid before the National Assembly, the debt policy statement by the end of January of each year.
(2) The purpose of the debt policy statement is to allow the assessment of the Federal Government’s debt policies against the principles of sound fiscal and debt management and debt reduction path.
(3) In particular and without prejudice to the provisions of sub‐section (2) the debt policy statement shall, inter alia, contain –
(a) Assessment of the Federal Government's success or failure in meeting the targets of total public debt to estimated gross domestic product for any given year as specified in the debt reduction path;
(b) Evaluations of external and domestic borrowing strategies and provide advice on these strategies;
(c) Evaluations of the nominal and real costs of external and domestic borrowing and suggest ways to contain these costs;
(d) Analysis of the foreign currency exposure of Pakistan's external debt; (e) Consistent and authenticated information on public and external debt and guarantees
issued by the Government with ex post facto budgetary out‐turns of all guarantees and those of other such claims and commitments;
(f) Information of all loan agreements contracted, disbursements made thereof and repayments made thereon, if any, by the Government during the fiscal year; and
(g) Analysis of trends in public debt and external debt and steps taken to conform to the debt reduction path as well as suggestions for adjustments, if any, in the Federal Government's overall debt strategy.
III. REVIEW OF PUBLIC DEBT
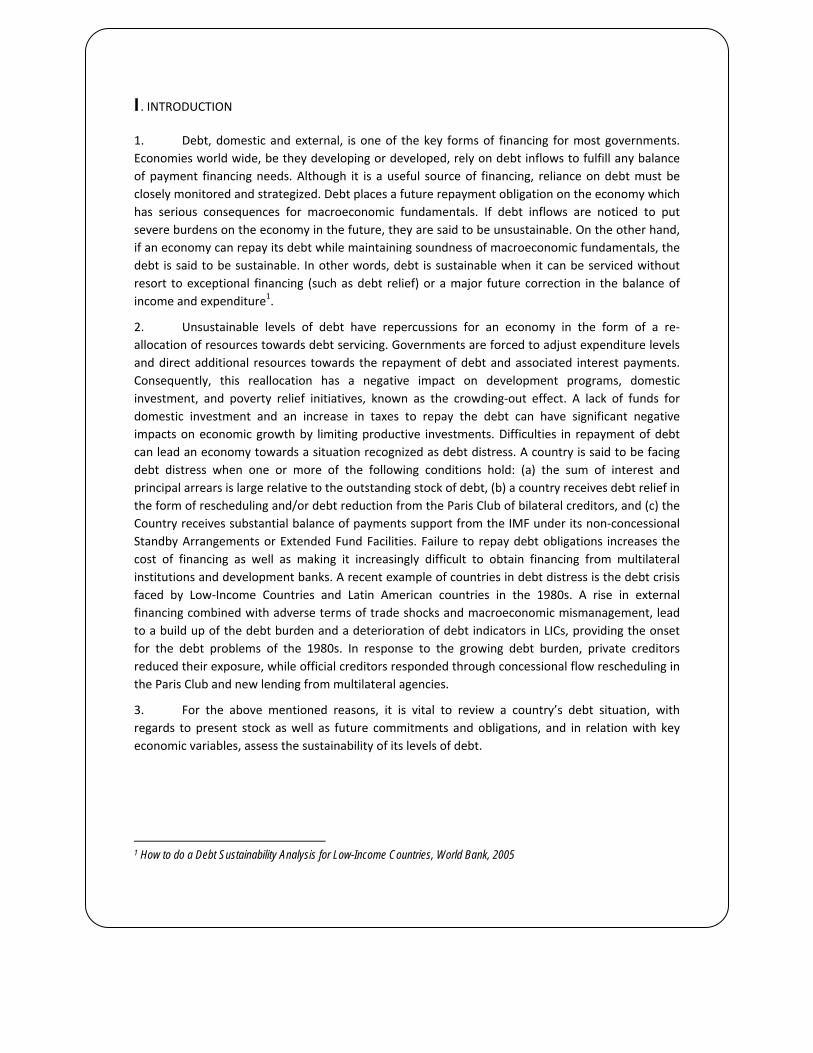
5. Foreign currency debt as well as Rupee denominated debt owed directly by the government is classified as public debt. Total public debt increased by Rs 1087 billion in the outgoing fiscal year 2007‐08, reaching a total outstanding amount of Rs 5901 billion; an increase of 22.6 percent in nominal terms. Total public debt has been growing at an average of 12 percent per year since the fiscal year 1999‐2000. At the end of the first quarter of the current fiscal year, the total public debt amounted to Rs 6572 billion, a massive addition of Rs 671 billion in just three months of the commencement of the fiscal year 2008‐09.
2
| Deb
t Policy Statem
ent, 2008‐09
6. In order to view debt burden in relation to the resources of an economy and the government, it is useful to analyse the debt burden as measured by total public debt as a percentage of GDP and government revenues. As a percentage of GDP, total public debt had been decreasing at an average rate of 4.9 percentage points of GDP annually from 2001‐02 onwards. Falling from a high of 79.8 percent of GDP in 2001‐02, total public debt had reduced to 55.2 percent of GDP by the end of 2006‐07. However, due to a combination of negative factors, total public debt has increased from 55.2 percent in 2006‐07 to 56.3 percent in 2007‐08, making it the first time in seven years that Pakistan has seen a reversal in declining trends. This ratio in percentage terms has declined to 49.1 percent till September 2008‐09.
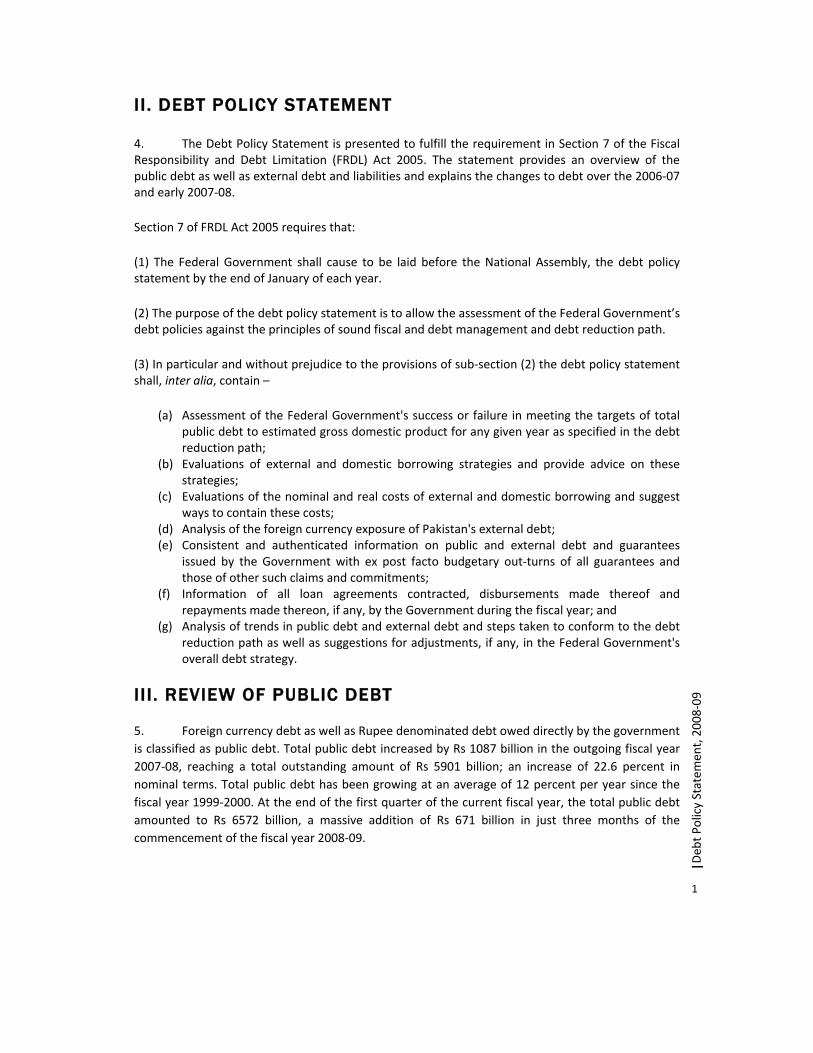
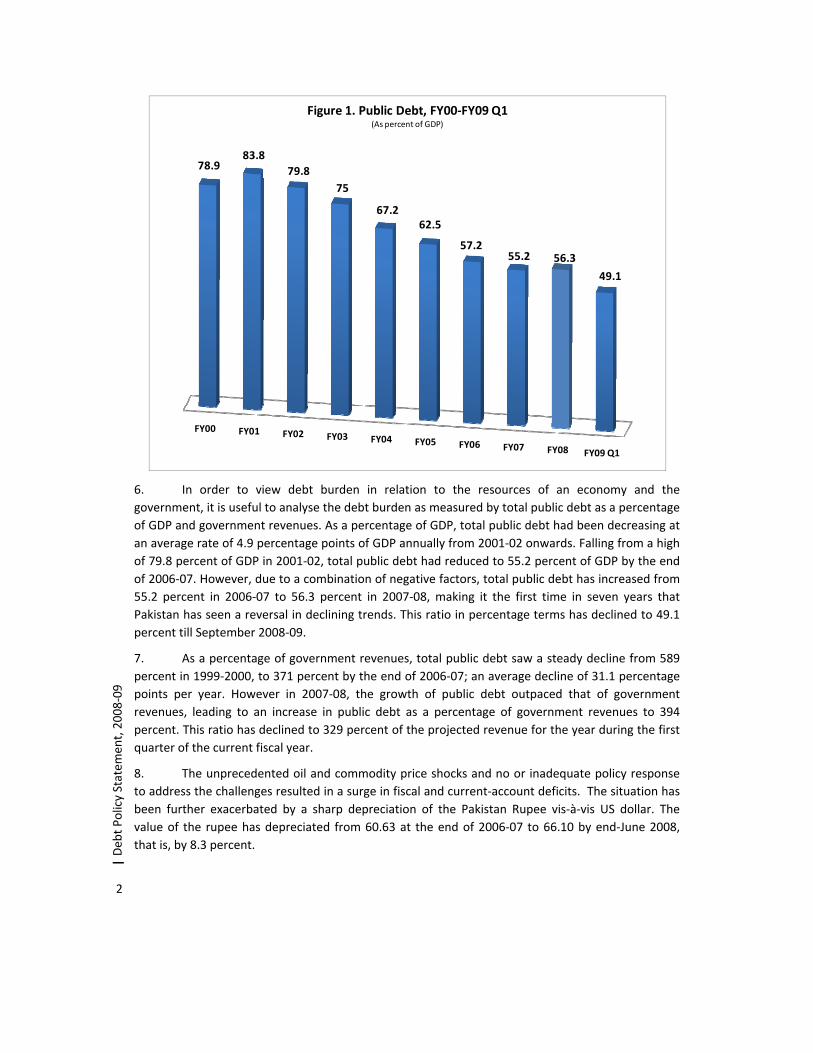
7. As a percentage of government revenues, total public debt saw a steady decline from 589 percent in 1999‐2000, to 371 percent by the end of 2006‐07; an average decline of 31.1 percentage points per year. However in 2007‐08, the growth of public debt outpaced that of government revenues, leading to an increase in public debt as a percentage of government revenues to 394 percent. This ratio has declined to 329 percent of the projected revenue for the year during the first quarter of the current fiscal year.
8. The unprecedented oil and commodity price shocks and no or inadequate policy response to address the challenges resulted in a surge in fiscal and current‐account deficits. The situation has been further exacerbated by a sharp depreciation of the Pakistan Rupee vis‐à‐vis US dollar. The value of the rupee has depreciated from 60.63 at the end of 2006‐07 to 66.10 by end‐June 2008, that is, by 8.3 percent.
FY00 FY01 FY02 FY03 FY04 FY05 FY06 FY07 FY08 FY09 Q1
78.983.8
79.875
67.262.5
57.255.2 56.3
49.1
Figure 1. Public Debt, FY00‐FY09 Q1(As percent of GDP)
3
|Deb
t Policy Statem
ent, 2008‐09
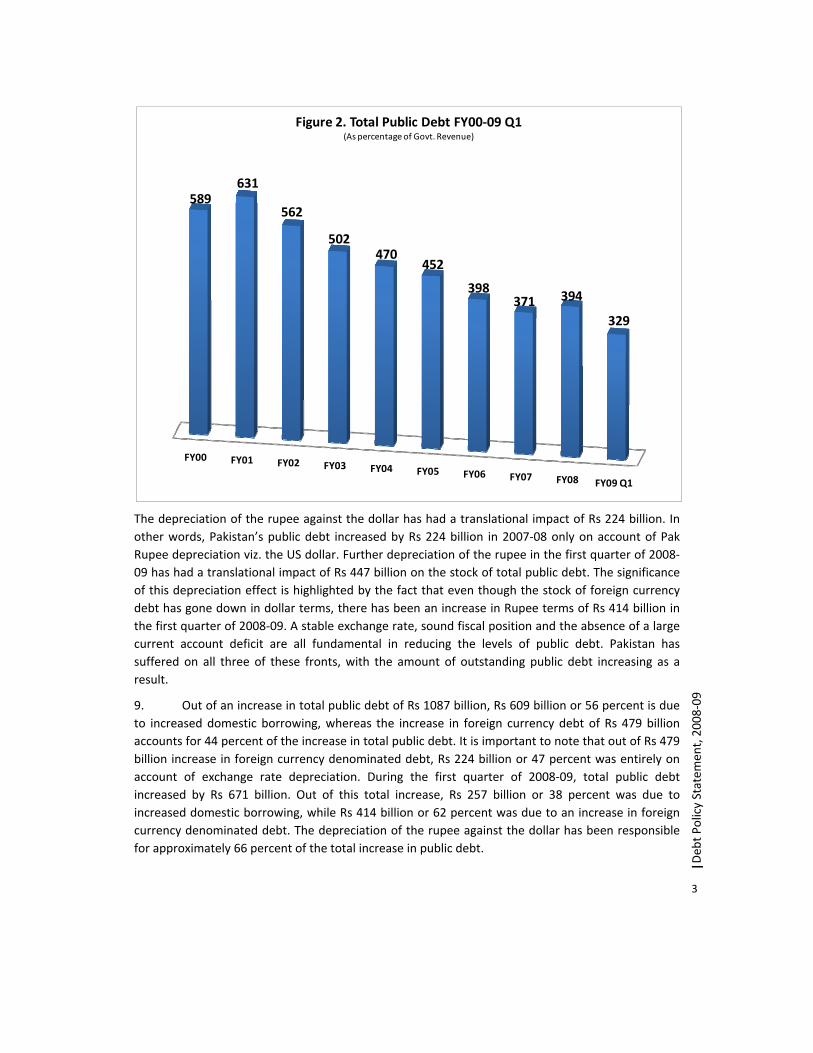
The depreciation of the rupee against the dollar has had a translational impact of Rs 224 billion. In other words, Pakistan’s public debt increased by Rs 224 billion in 2007‐08 only on account of Pak Rupee depreciation viz. the US dollar. Further depreciation of the rupee in the first quarter of 2008‐09 has had a translational impact of Rs 447 billion on the stock of total public debt. The significance of this depreciation effect is highlighted by the fact that even though the stock of foreign currency debt has gone down in dollar terms, there has been an increase in Rupee terms of Rs 414 billion in the first quarter of 2008‐09. A stable exchange rate, sound fiscal position and the absence of a large current account deficit are all fundamental in reducing the levels of public debt. Pakistan has suffered on all three of these fronts, with the amount of outstanding public debt increasing as a result.
9. Out of an increase in total public debt of Rs 1087 billion, Rs 609 billion or 56 percent is due to increased domestic borrowing, whereas the increase in foreign currency debt of Rs 479 billion accounts for 44 percent of the increase in total public debt. It is important to note that out of Rs 479 billion increase in foreign currency denominated debt, Rs 224 billion or 47 percent was entirely on account of exchange rate depreciation. During the first quarter of 2008‐09, total public debt increased by Rs 671 billion. Out of this total increase, Rs 257 billion or 38 percent was due to increased domestic borrowing, while Rs 414 billion or 62 percent was due to an increase in foreign currency denominated debt. The depreciation of the rupee against the dollar has been responsible for approximately 66 percent of the total increase in public debt.
FY00 FY01 FY02 FY03 FY04 FY05 FY06 FY07 FY08 FY09 Q1
589631
562
502470
452
398371 394
329
Figure 2. Total Public Debt FY00‐09 Q1(As percentage of Govt. Revenue)
4
| Deb
t Policy Statem
ent, 2008‐09
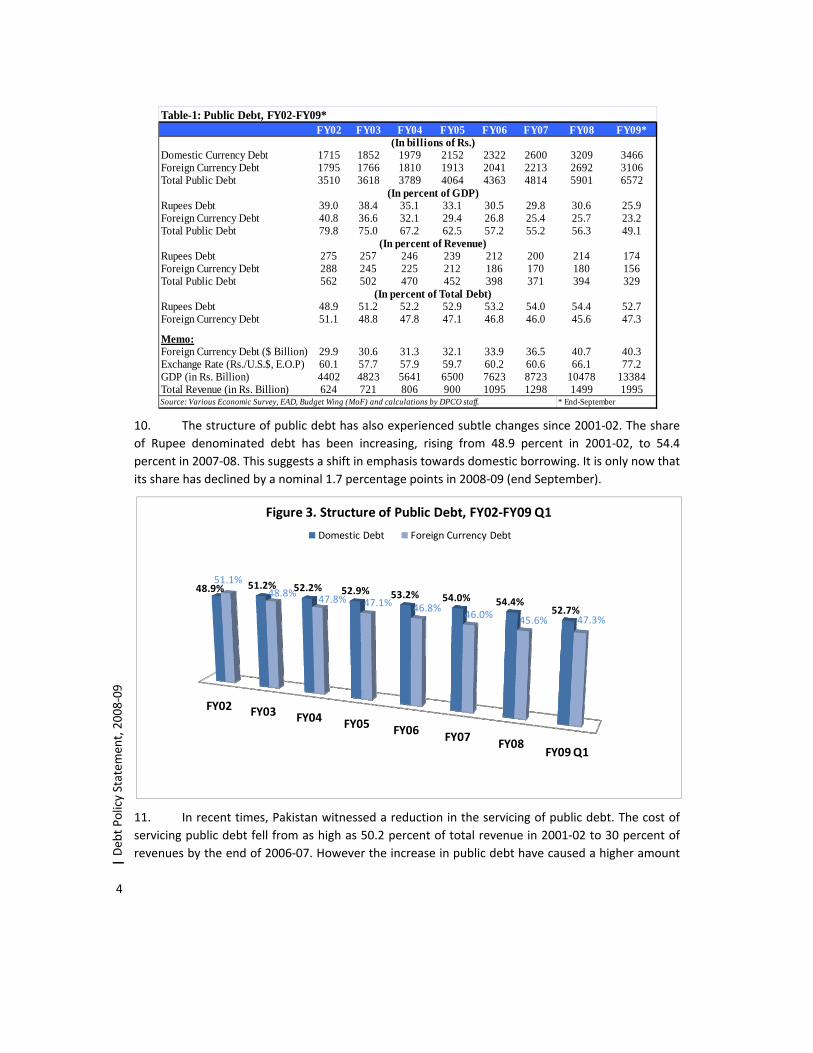
10. The structure of public debt has also experienced subtle changes since 2001‐02. The share of Rupee denominated debt has been increasing, rising from 48.9 percent in 2001‐02, to 54.4 percent in 2007‐08. This suggests a shift in emphasis towards domestic borrowing. It is only now that its share has declined by a nominal 1.7 percentage points in 2008‐09 (end September).
11. In recent times, Pakistan witnessed a reduction in the servicing of public debt. The cost of servicing public debt fell from as high as 50.2 percent of total revenue in 2001‐02 to 30 percent of revenues by the end of 2006‐07. However the increase in public debt have caused a higher amount
FY02 FY03 FY04 FY05 FY06 FY07 FY08 FY09*
Domestic Currency Debt 1715 1852 1979 2152 2322 2600 3209 3466Foreign Currency Debt 1795 1766 1810 1913 2041 2213 2692 3106Total Public Debt 3510 3618 3789 4064 4363 4814 5901 6572
Rupees Debt 39.0 38.4 35.1 33.1 30.5 29.8 30.6 25.9Foreign Currency Debt 40.8 36.6 32.1 29.4 26.8 25.4 25.7 23.2Total Public Debt 79.8 75.0 67.2 62.5 57.2 55.2 56.3 49.1
Rupees Debt 275 257 246 239 212 200 214 174Foreign Currency Debt 288 245 225 212 186 170 180 156Total Public Debt 562 502 470 452 398 371 394 329
Rupees Debt 48.9 51.2 52.2 52.9 53.2 54.0 54.4 52.7Foreign Currency Debt 51.1 48.8 47.8 47.1 46.8 46.0 45.6 47.3
Memo:Foreign Currency Debt ($ Billion) 29.9 30.6 31.3 32.1 33.9 36.5 40.7 40.3Exchange Rate (Rs./U.S.$, E.O.P) 60.1 57.7 57.9 59.7 60.2 60.6 66.1 77.2GDP (in Rs. Billion) 4402 4823 5641 6500 7623 8723 10478 13384Total Revenue (in Rs. Billion) 624 721 806 900 1095 1298 1499 1995
* End-September
Table-1: Public Debt, FY02-FY09*
(In billions of Rs.)
(In percent of GDP)
(In percent of Revenue)
(In percent of Total Debt)
Source: Various Economic Survey, EAD, Budget Wing (MoF) and calculations by DPCO staff.
FY02 FY03 FY04 FY05 FY06 FY07 FY08FY09 Q1
48.9% 51.2% 52.2% 52.9% 53.2% 54.0% 54.4%52.7%
51.1%48.8% 47.8% 47.1% 46.8%
46.0% 45.6% 47.3%
Figure 3. Structure of Public Debt, FY02‐FY09 Q1
Domestic Debt Foreign Currency Debt
5
|Deb
t Policy Statem
ent, 2008‐09
(In Rs. Million) Budgeted Actual As % of Revenues
As % of Current Exp.
56,409 59,353 3.53% 3.97%62,886 61,686 3.67% 4.13%
318,164 443,118 26.39% 29.68%Servicing of Public Debt 437,459 564,157 33.59% 37.78%
Servicing of Foreign DebtRepayment of Foreign LoansServicing of Domestic Debt
Source: Federal Budget FY09 and DPCO staff calculations
Table 2: Servicing of Public Debt FY08
External Debt Domestic Debt Public Debt1980s 3.40 1.00 2.301990s 2.70 3.20 2.901990-95 -3.00 -1.90 -0.601995-2000 -5.50 5.70 5.602000-04 0.90 6.40 4.402004-08 -5.45 4.56 -1.40
Table 3: Real Cost of Borrowing
(Percent)
Source: EA Wing and DPCO staff calculation
of debt servicing in the outgoing fiscal year, with servicing of public debt increasing to 33.6 percent of revenues. This implies that almost 34 percent of the government’s revenues are diverted towards servicing of
public debt. As a percentage of current expenditure, debt servicing decreased from 45.5 percent in 2001‐02, to 28.4 percent by the end of 2006‐07. The fiscal year 2007‐08 saw some slippages concerning targets for debt servicing. Servicing of public debt was budgeted at Rs 437.5 billion for 2007‐08, whereas the actual cost of debt servicing increased to Rs 564 billion by the end of the year. As a result, servicing of public debt increased to 37.8 percent of current expenditure.
III.i . Dynamics of Public Debt Burden
12. Changes in the public debt burden of an economy are influenced by the cost associated with borrowing funds, the rate of inflation, and the real growth rates of pubic debt and government revenues. Periods of higher cost of borrowing coupled with higher growth rates of public debt in periods where growth of revenues was relatively stagnant have yielded an increase in the public debt burden. This was highlighted during 1995‐2000 where the real interest rate on public debt averaged 5.6 percent and public debt grew at 6.2 percent as compared to a growth of revenues of only 2.5 percent. This period saw the average debt burden increase by 3.7 percent. In the following five years, i.e. 2000‐04, although the cost of borrowing remained relatively high at an average of 4.4 percent, the debt burden registered a negative growth rate of 9.3 percent on account of a reduction in the stock of public debt in real terms by 3.3 percent, and a much higher real growth rate of revenues at 6 percent. A higher rate of inflation has translated to a reduction in the real cost of borrowing in recent years, bringing the average real interest rate on public debt down to ‐1.4 percent for the period 2004‐08. Revenues grew at an average of 5.9 percent while the stock of public debt had a real growth rate of 1 percent. This translated to an average reduction of 5 percent in the debt burden of the economy in the same period (See Table 4.).
13. The real cost of foreign borrowing is measured by calculating the interest cost as well as capital loss/gain experienced due to depreciation/appreciation of the Pakistani Rupee. The average real cost of borrowing during the period 2004‐08 has been ‐5.45 percent owing to lower nominal rates on externally borrowed funds and higher than usual inflationary pressures in the time period (See Table 3). Even though the stock of total public debt has been growing in
6
| Deb
t Policy Statem
ent, 2008‐09
nominal terms since 2003‐04, the debt burden had been declining due to higher real growth of revenues and lower cost of borrowing. However this trend suffered a reversal in 2007‐08. In spite of the real cost of borrowing remaining negative and the prevalence of double digit inflation, the debt burden has increased by 6.3 percent. This increase is due to a surge in the stock of total public debt, which increased by 8.1 percent in real terms. Revenues grew in real terms by 1.8 percent in the same period. Table 4 below highlights the dynamics of the public debt burden.
IV. DOMESTIC DEBT
14. The use of domestic sources to borrow funds has various implications for the economy. It has positive aspects such as neutralization of exchange rate risk and increased liquidity. The downside risks include higher interest rates which might stunt growth, the creation of inflationary pressure in an economy, and the possible crowding‐out of the private sector. Therefore any debt strategy should balance risks to its debt stock by focusing on a mix of both domestic and external sources while borrowing funds. The share of domestic debt in Pakistan’s total public debt has been increasing for the past seven years; from 48.9 percent in 2001‐02 to 54.38 percent in 2007‐08. There has been a slight, yet significant increase, in the emphasis on borrowing from domestic sources in the last seven years and while this insulates the stock of debt from exchange rate movements, precautions must be taken to guard against the negative impacts of domestic borrowing.
15. A sound fiscal stance and a debt reduction strategy caused Pakistan’s domestic debt as a percentage of GDP to fall from 2001‐02 onwards. Domestic debt declined from 43.2 percent of GDP in 2000‐01 to 30 percent in 2006‐07. Increase in the fiscal deficit has caused a massive surge in domestic debt for the year 2007‐08. Total domestic debt has increased from Rs 2600 billion in 2006‐07 to Rs 3209 billion in 2007‐08; an increase of Rs 609 billion or 23 percent. The stock of domestic debt in 2008‐09 (end October) rested at Rs 3418 billion resulting in a rise of Rs 209 billion over the outgoing fiscal year.
16. Throughout 2007‐08, an increasing amount of funds have been required to finance a growing fiscal deficit. A large part of the increase in domestic debt is due to an increase of Rs 482 billion in Floating Debt (borrowing from SBP). In the absence of this increase, domestic debt would
Primary Fiscal Balance (Percent of
GDP)
Real Cost of Borrowing
Real Growth of Debt
(Percent)
Real Growth of Revenues
(Percent)
Real Growth of Debt Burden
(Percent)1980s -3.7 2.3 10.6 7.6 3.01990s -0.3 2.9 4.9 2.9 2.01990-95 -1.8 -2.4 3.6 3.2 0.41995-2000 1.1 5.6 6.2 2.5 3.72000-04 1.2 4.4 -3.3 6.0 -9.32004-08 -0.7 -1.4 1.0 5.9 -5.0
Table 4: Dynamics of Public Debt Burden
Source: EA Wing and DPCO staff calculations
7
|Deb
t Policy Statem
ent, 2008‐09
Permanent Debt
Floating Debt
Unfunded Debt
15.0%
20.0%
25.0%
30.0%
35.0%
40.0%
45.0%
50.0%
FY00 FY01 FY02 FY03 FY04 FY05 FY06 FY07 FY08
In percent
Figure 5: Structure of Domestic Debt
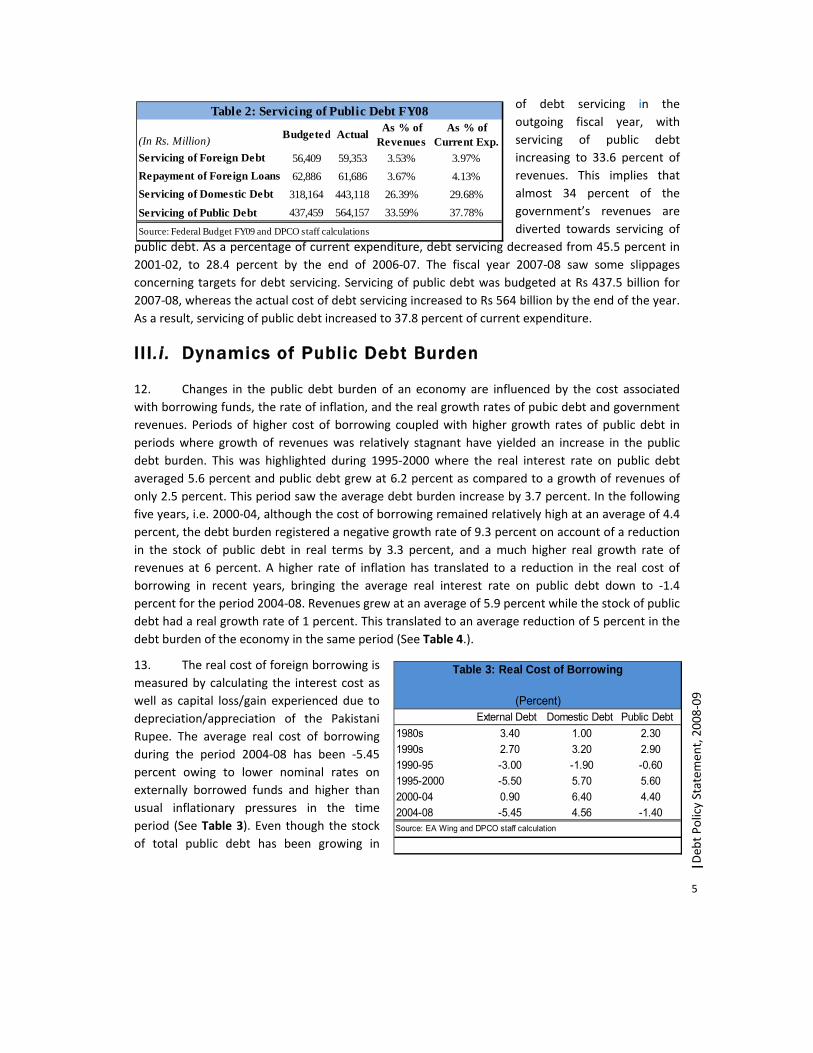
have grown at a mere 4.7 percent as compared to the actual increase of 23 percent in 2007‐08. As a percentage of GDP, total domestic debt increased from 30 percent in 2006‐07 to 30.7 percent in
2007‐08 and subsequently this percentage was 27.4 percent by the end of October’08. This rise in debt is the outcome of the extraordinary array of challenges faced by the economy in the outgoing fiscal year as well as a lack of a diversified financing strategy.
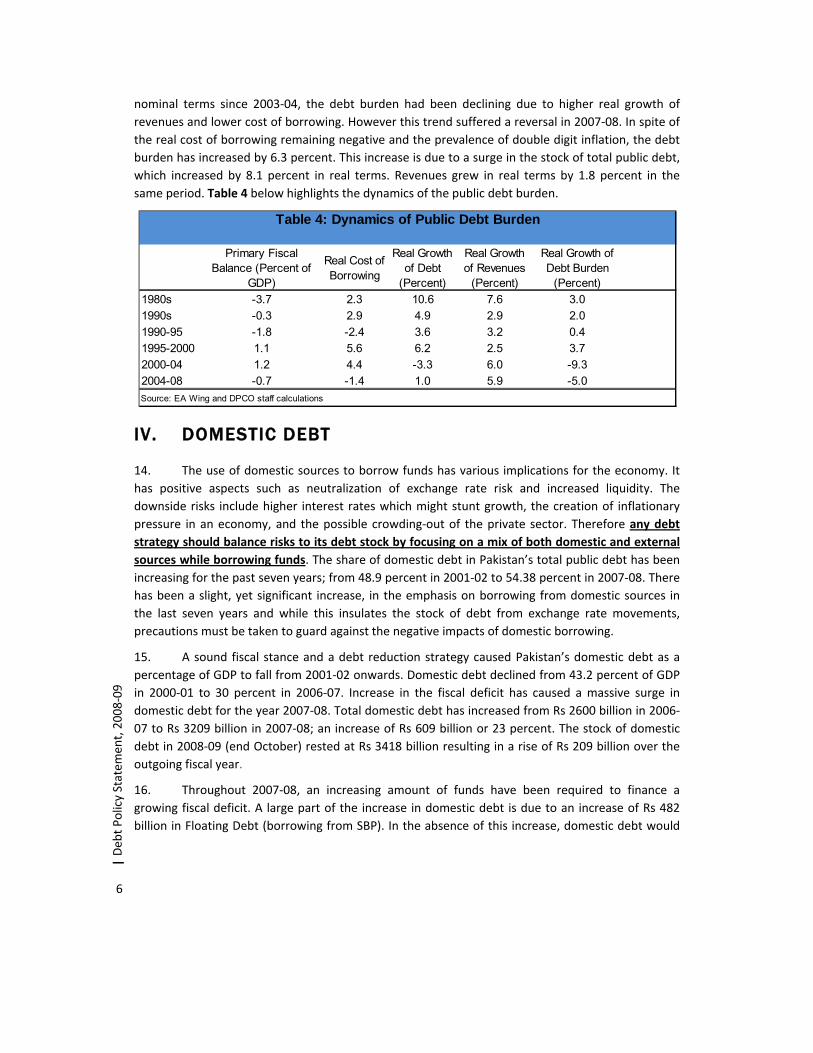
17. Domestic debt consists of three main categories: permanent debt, floating debt, and unfunded debt. Permanent debt includes instruments for medium to long‐term debt (maturities of greater than one year) such as Pakistan Investment Bonds (PIBs) while the short‐term borrowing needs of the government are catered to by floating debt which includes Treasury Bills.
FY00 FY01 FY02 FY03 FY04 FY05 FY06 FY07 FY08 FY09 end-Oct
43 43.240.3
39.3
35.733.2
30.4 30.0 30.727.4
Figure 4: Domestic Debt FY00‐FY09 end‐Oct(As percentage of GDP)
8
| Deb
t Policy Statem
ent, 2008‐09
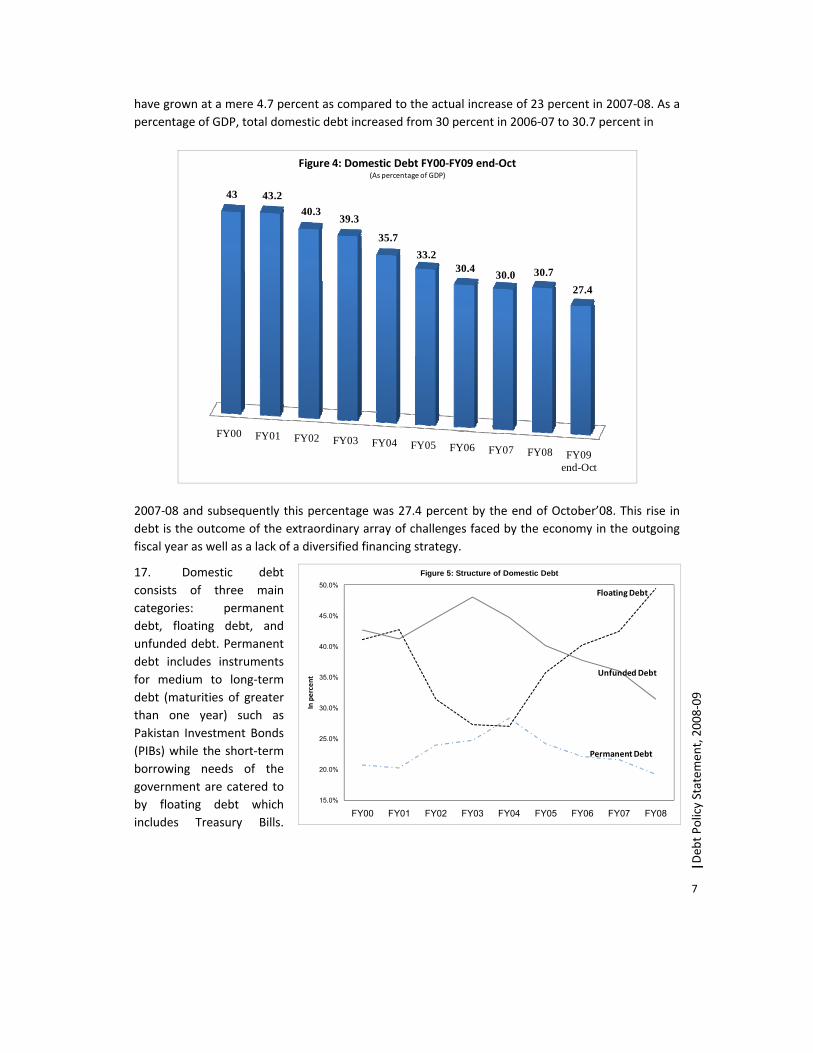
Figure 5a: Structure of Domestic Debt, FY04 and FY09
Prize Bonds8%
PIB16%
T‐Bills (Auctions)
17%T‐Bills (SBP)10%
Unfunded Debt45%
Federal Loans/Bonds
4%
FYO4
Prize Bonds5%PIB
12%
T‐Bills (Auctions)
13%
T‐Bills (SBP)39%
Unfunded Debt31%
Federal Loans/Bonds
0%
FY09 (Oct.)
FY04 FY05 FY06 FY07 FY08 FY09*
Permanent Debt 570.0 526.2 514.9 562.5 616.7 608.4Market Loans 2.9 2.9 2.9 2.9 2.9 2.9Government Bond 9.6 9.5 9.4 19.8 9.3 9.4Prize Bonds 152.8 162.2 165.5 174.5 182.8 180.7Foreign Exchange Bearer Certificates 1.0 0.6 0.3 0.2 0.2 0.2Bearer National Fund Bonds 0.0 0.0 0.0 0.0 0.0 0.0Federal Investment Bonds 33.5 14.6 6.6 3.1 1.0 1.0Special National Fund Bonds 0.0 0.0 0.0 0.0 0.0 0.0Foreign Currency Bearer Certificates 0.1 0.1 0.1 0.0 0.0 0.1U.S. Dollar Bearer Certificates 0.2 0.1 0.0 0.0 0.0 0.0Special U.S. Dollar Bond 32.1 25.1 14.9 9.4 8.3 8.0Government Bonds Issued to SLIC 6.2 3.6 1.5 0.0 0.6 0.6Pakistan Investment Bonds (PIB) 331.6 307.6 303.9 352.5 411.6 399.2Government Bonds issued to HBL 0.0 0.0 9.8 0.0 0.0 0.0GOP Ijara Sukuk 6.5
Floating Debt 542.9 778.2 940.2 1107.7 1589.6 1762.9Adhoc Treasury Bills 0.0 0.0 0.0 0.0 0.0 0.0Treasury Bills on Tap 0.0 0.0 0.0 0.0 0.0 0.0Treasury Bills through Auction 345.2 452.7 432.1 655.5 536.4 442.2Rollover of Treasury Bills discounted SBP 0.5 0.6 0.6 0.6 0.6 0.6Treasurey Bills purchased by SBP (MRTB) 197.2 324.9 507.5 451.5 1052.6 1320.20
Unfunded Debt 899.2 873.2 881.7 940.0 1010.9 1054.2Defence Savings Certificates 312.2 303.5 295.9 289.0 284.9 285.0Khas Deposit Certificates and Accounts 0.6 0.6 0.6 0.6 0.6 0.6National Deposit Certificates 0.0 0.0 0.0 0.0 0.0 0.0Savings Accounts 8.6 9.1 8.7 18.7 18.5 20.2Mahana Amadni Account 2.3 2.4 2.4 2.5 2.5 2.4Postal Life Insurrance 46.0 56.3 67.1 67.1 67.1 67.1Special Savings Certificates and Accounts 335.9 250.7 192.2 208.3 227.1 237.0Regular Income Scheme 125.9 85.2 69.7 51.3 51.0 56.8Pensioners' Benefit Account 23.4 41.1 57.5 69.0 87.7 93.4Bahbood Savings Certificates 22.7 83.3 143.0 190.2 229.0 249.9G.P. Fund 21.6 41.0 44.5 43.3 42.5 41.8
Total Domestic Debt 2012.2 2177.6 2336.8 2610.2 3217.2 3425.6Total Domestic Debt (excluding foreign 1978.8 2151.8 2321.6 2600.5 3208.7 3418.2currency debt included in external debt)Source: Budget Wing, Ministry of Finance and DPCO staff calculations.* End-Oct
Table 5. Outstanding Domestic Debt, FY02-FY09*
(In billions of Rs.)
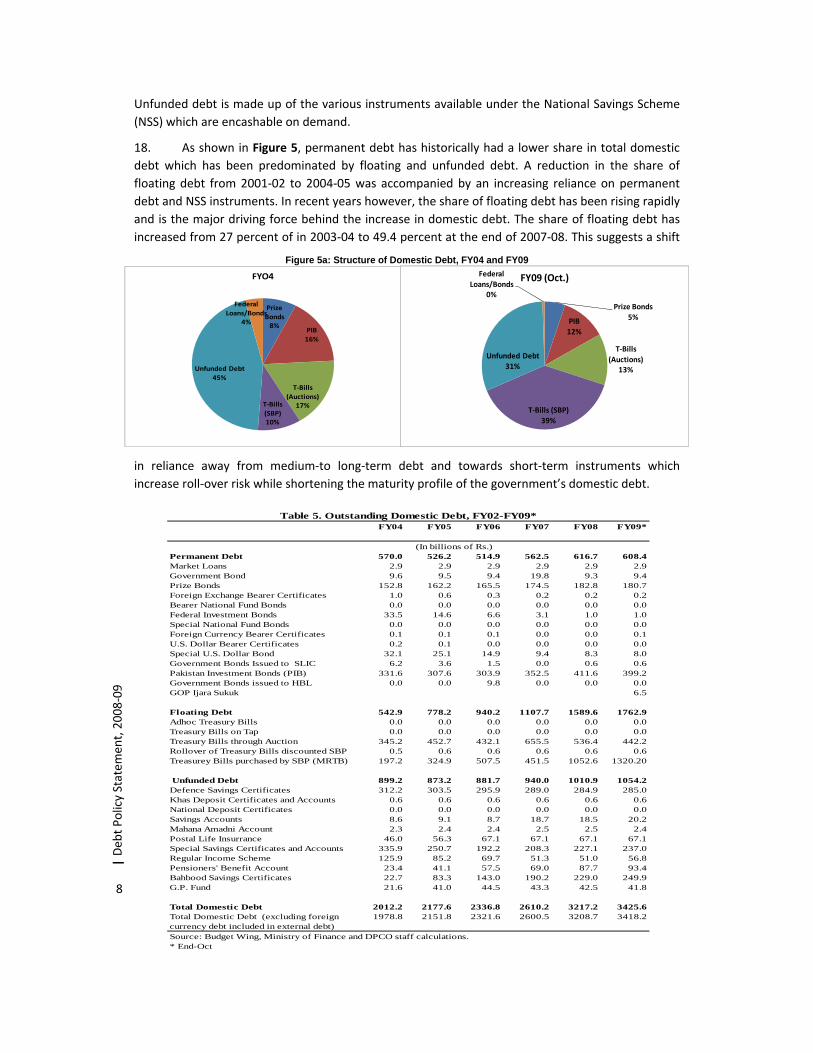
Unfunded debt is made up of the various instruments available under the National Savings Scheme (NSS) which are encashable on demand.
18. As shown in Figure 5, permanent debt has historically had a lower share in total domestic debt which has been predominated by floating and unfunded debt. A reduction in the share of floating debt from 2001‐02 to 2004‐05 was accompanied by an increasing reliance on permanent debt and NSS instruments. In recent years however, the share of floating debt has been rising rapidly and is the major driving force behind the increase in domestic debt. The share of floating debt has increased from 27 percent of in 2003‐04 to 49.4 percent at the end of 2007‐08. This suggests a shift
in reliance away from medium‐to long‐term debt and towards short‐term instruments which increase roll‐over risk while shortening the maturity profile of the government’s domestic debt.
9
|Deb
t Policy Statem
ent, 2008‐09
Following is a break‐up of the developments of the various components of domestic debt:
IV.i . Permanent Debt
19. The stock of permanent debt stood at Rs 325.6 billion at the end of 1999‐2000, and increased steadily to Rs 570 billion by 2003‐04. However the following two years saw a decline in the outstanding stock of permanent debt. The outstanding stock of permanent debt fell to Rs 514 billion by 2005‐06. Permanent debt stood at Rs 562.5 billion at the end of 2006‐07. In the outgoing fiscal year, permanent debt increased to Rs 616.7 billion, a rise of Rs 54.2 billion. The same figure stood at Rs 608.4 billion as of end October 2008, down by Rs 8.3 billion when compared with the stock at end 2007‐08. As a percentage of total domestic debt, permanent debt has decreased from 22 percent in 2006‐07 to 19 percent in 2007‐08 and afterward to 18 percent in 2008‐09 (end Oct).
Stock StockChange in
Stock Reciepts RepaymentsNet
Investment (End FY07) (End FY08)
Permanent Debt 562.54 616.71 54.17 211.44 157.21 54.23Market Loans 2.88 2.88 0.00 0.00 0.00 0.00Government Bond 9.39 9.30 -0.09 0.00 0.03 -0.03Prize Bonds 174.51 182.79 8.28 106.70 98.42 8.28Foreign Exchange Bearer Certificates 0.24 0.18 -0.06 0.00 0.06 -0.06Bearer National Fund Bonds 0.01 0.01 0.00 0.00 0.00 0.00Federal Investment Bonds 3.13 0.98 -2.15 0.10 2.25 -2.15Special National Fund Bonds 0.00 0.00 0.00 0.00 0.00 0.00Foreign Currency Bearer Certificates 0.04 0.03 0.00 0.00 0.01 0.00U.S. Dollar Bearer Certificates 0.04 0.04 0.00 0.00 0.00 0.00Special U.S. Dollar Bond 9.40 8.28 -1.11 1.03 2.15 -1.11Government Bonds Issued to SLIC 0.58 0.58 0.00 0.00 0.00 0.00Pakistan Investment Bonds (PIB) 352.52 411.63 59.11 103.61 44.49 59.11Government Bonds issued to HBL 9.80 0.00 -9.80 0.00 9.80 -9.80Floating Debt 1107.66 1589.60 481.94 2036.72 1554.77 481.94Adhoc Treasury Bills 0.00 0.00 0.00 0.00 0.00 0.00Treasury Bills on Tap 0.01 0.01 0.00 0.00 0.00 0.00Treasury Bills through Auction 655.55 536.43 -119.12 239.74 358.86 -119.12Rollover of Treasury Bills discounted S 0.55 0.55 0.00 0.00 0.00 0.00Treasurey Bills purchased by SBP (MR 451.54 1052.61 601.07 1796.92 1195.86 601.07Unfunded Debt 940.00 1010.90 70.87 446.03 365.65 80.37Defence Savings Certificates 289.00 284.91 -4.09 59.38 63.70 -4.32Khas Deposit Certificates and Account 0.60 0.60 0.00 0.01 0.01 0.00National Deposit Certificates 0.02 0.02 0.00 0.00 0.00 0.00Savings Accounts 18.70 18.46 -0.24 138.93 129.94 8.99Mahana Amadni Account 2.46 2.46 0.00 0.06 0.09 -0.02Postal Life Insurrance 67.12 67.12 0.00 0.00 0.00 0.00Special Savings Certificates and Accou 208.30 227.10 18.80 96.08 76.76 19.32Regular Income Scheme 51.30 51.04 -0.26 25.03 25.31 -0.27Pensioners' Benefit Account 69.00 87.66 18.66 38.82 20.12 18.70Bahbood Savings Certificates 190.20 229.01 38.81 86.38 47.58 38.80G.P. Fund 43.33 42.52 -0.81 1.33 2.15 -0.81Total Domestic Debt 2610.20 3217.22 606.99 2694.19 2077.58 616.61Source: Budget Wing, Ministry of Finance and DPCO Staff calculations
Table 6. Causative Factors in Change in Stock of Domestic Debt, FY08
(in FY08)
(In billions of Rs.)
10
| Deb
t Policy Statem
ent, 2008‐09
20. The share of Pakistan Investment Bonds (PIBs) in total debt has lowered modestly between 2003‐04 (16%) and 2008‐09 end October (12%). The share of other federal loans and bonds has declined from 4 percent to almost negligible because of maturing Federal Investment Bonds & Government Bonds issued to HBL (See Figure 5a). As is apparent from Table 6, in 2007‐08, the largest negative net investment in permanent debt was in the latter instrument (Rs 9.80 billion) trailed by a wholesome Rs 2.15 billion in FIBs. These trends point to the discontinuation of these instruments. Prize bonds also exhibited a decreasing pattern by playing their part of just 5 percent (2008‐09 Oct) as compared to 8 percent in 2003‐04.
Table 7: Causative Factors in Change in Stock of Domestic Debt - FY09 (end Oct.)
Stock Stock Reciepts RepaymentsNet
Investment (End FY08) (End Oct FY09)
Permanent Debt 616.71 608.40 49.92 57.45 -7.52Market Loans 2.88 2.88 0.00 0.00 0.00Government Bond 9.30 9.36 0.00 0.00 0.00Prize Bonds 182.79 180.70 33.98 36.07 -2.09Foreign Exchange Bearer Certificates 0.18 0.17 0.00 0.01 -0.01Bearer National Fund Bonds 0.01 0.00 0.00 0.00 0.00Federal Investment Bonds 0.98 0.98 0.00 0.00 0.00Special National Fund Bonds 0.00 0.00 0.00 0.00 0.00Foreign Currency Bearer Certificates 0.03 0.05 0.00 0.00 0.00U.S. Dollar Bearer Certificates 0.04 0.00 0.00 0.00 0.00Special U.S. Dollar Bond 8.28 8.00 1.17 0.66 0.51Government Bonds Issued to SLIC 0.58 0.60 0.00 0.00 0.00Pakistan Investment Bonds (PIB) 411.63 399.16 8.23 20.71 -12.48Government Bonds issued to HBL 0.00 0.00 0.00 0.00 0.00Ijara Sukuk 6.52 0.00 6.52Floating Debt 1589.60 1762.93 986.50 813.17 173.33Adhoc Treasury Bills 0.00 0.00 0.00 0.00 0.00Treasury Bills on Tap 0.01 0.01 0.00 0.00 0.00Treasury Bills through Auction 536.43 442.17 235.99 330.25 -94.26Rollover of Treasury Bills discounted SBP 0.55 0.55 0.00 0.00 0.00Treasurey Bills purchased by SBP (MRTB) 1052.61 1320.20 750.51 482.92 267.59Unfunded Debt 1010.90 1054.24 360.21 326.36 33.85Defence Savings Certificates 284.91 285.03 27.64 27.26 0.39Khas Deposit Certificates and Accounts 0.60 0.60 0.00 0.00 0.00National Deposit Certificates 0.02 0.02 0.00 0.00 0.00Savings Accounts 18.46 20.16 41.75 47.81 -6.05Mahana Amadni Account 2.46 2.44 0.01 0.04 -0.02Postal Life Insurrance 67.12 67.12 0.00 0.00 0.00Special Savings Certificates and Accounts 227.10 237.00 83.51 75.98 7.53Regular Income Scheme 51.04 56.78 20.51 14.74 5.76Pensioners' Benefit Account 87.66 93.43 51.05 45.28 5.76Bahbood Savings Certificates 229.01 249.87 135.08 114.21 20.87G.P. Fund 42.52 41.79 0.31 1.04 -0.73Total Domestic Debt 1627.6 3425.57 2792.90 2393.95 398.95Source: Budget Wing, Ministry of Finance and DPCO Staff calculations
FY09(in Billion of Rs.)
11
|Deb
t Policy Statem
ent, 2008‐09
3%4%5%6%7%8%9%
10%11%12%13%14%15%
Jan-05
Apr-05
Jul-05
Nov-05
Feb-06
May-06
Aug-06
Dec-06
Mar-07
Jun-07
Oct-07
Jan-08
Apr-08
Jul-08
Nov-08
Figure 7 Weighted Average Yields at Auctions(Jan05-Dec08)
6-Month MTB10-Year PIB
0
20
40
60
80
100
FY01 FY02 FY03 FY04 FY05 FY06 FY07 FY08 FY09(H1)
Rs. (Billion
)
Figure 6 PIB Issuance, FY01-FY09
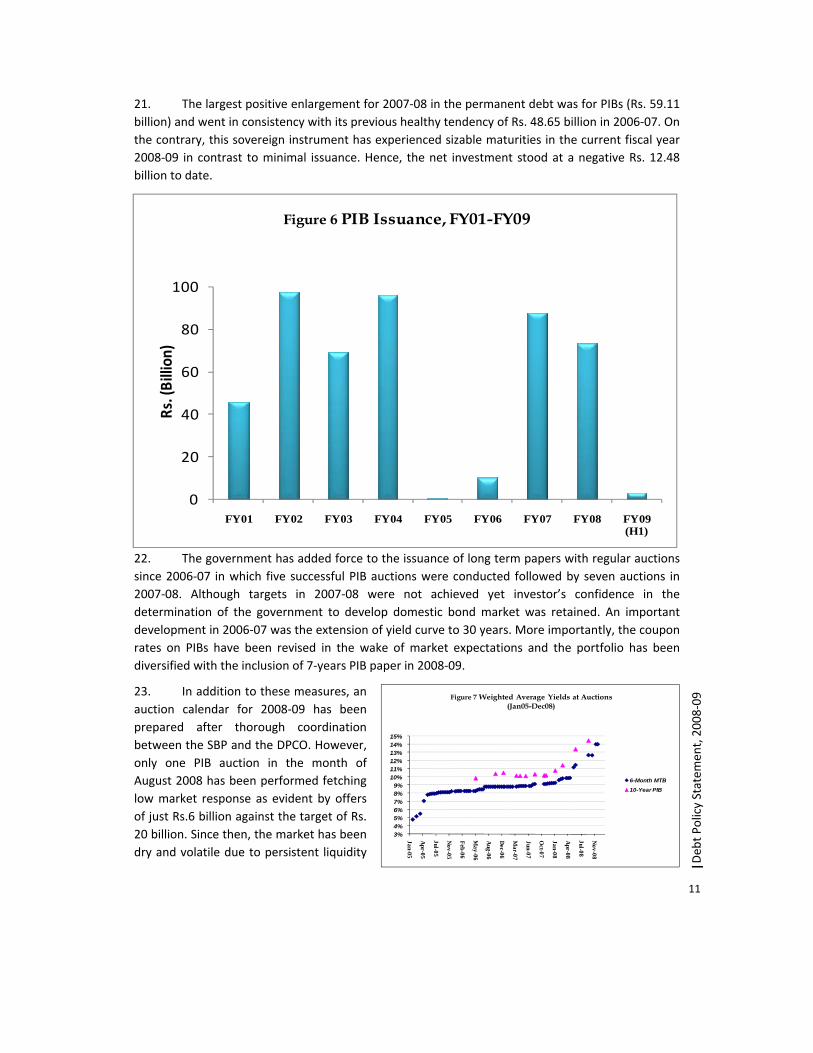
21. The largest positive enlargement for 2007‐08 in the permanent debt was for PIBs (Rs. 59.11 billion) and went in consistency with its previous healthy tendency of Rs. 48.65 billion in 2006‐07. On the contrary, this sovereign instrument has experienced sizable maturities in the current fiscal year 2008‐09 in contrast to minimal issuance. Hence, the net investment stood at a negative Rs. 12.48 billion to date.
22. The government has added force to the issuance of long term papers with regular auctions since 2006‐07 in which five successful PIB auctions were conducted followed by seven auctions in 2007‐08. Although targets in 2007‐08 were not achieved yet investor’s confidence in the determination of the government to develop domestic bond market was retained. An important development in 2006‐07 was the extension of yield curve to 30 years. More importantly, the coupon rates on PIBs have been revised in the wake of market expectations and the portfolio has been diversified with the inclusion of 7‐years PIB paper in 2008‐09.
23. In addition to these measures, an auction calendar for 2008‐09 has been prepared after thorough coordination between the SBP and the DPCO. However, only one PIB auction in the month of August 2008 has been performed fetching low market response as evident by offers of just Rs.6 billion against the target of Rs. 20 billion. Since then, the market has been dry and volatile due to persistent liquidity
12
| Deb
t Policy Statem
ent, 2008‐09
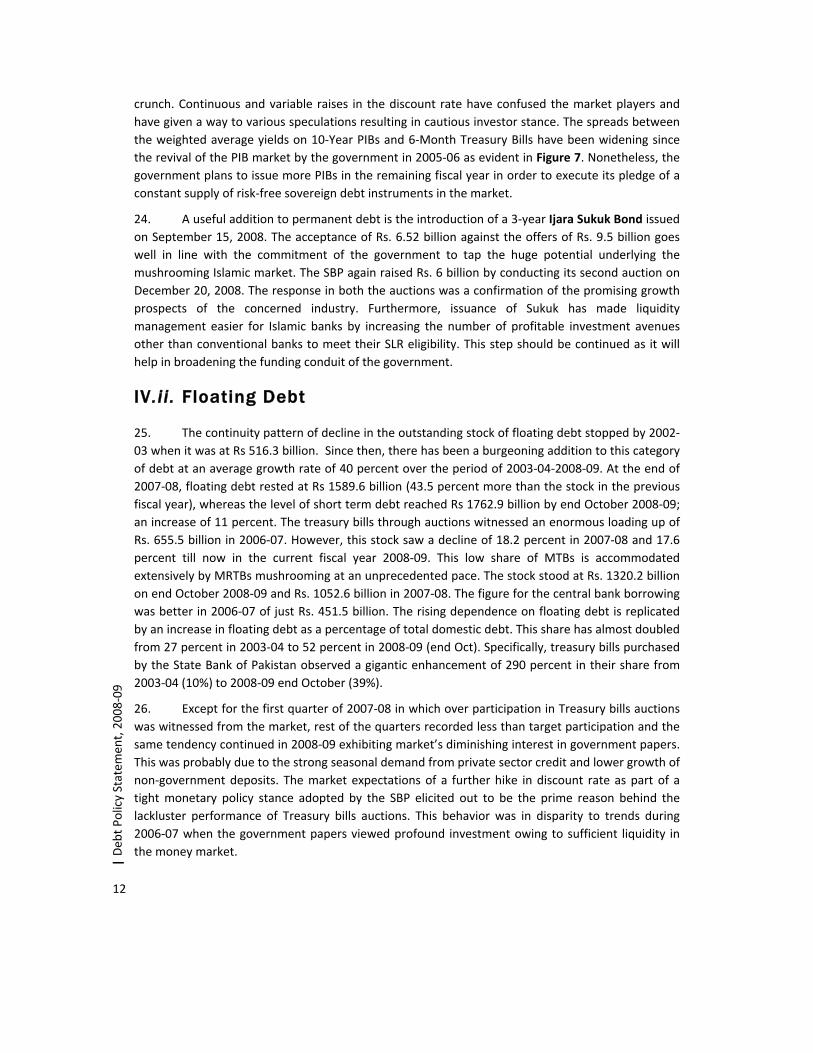
crunch. Continuous and variable raises in the discount rate have confused the market players and have given a way to various speculations resulting in cautious investor stance. The spreads between the weighted average yields on 10‐Year PIBs and 6‐Month Treasury Bills have been widening since the revival of the PIB market by the government in 2005‐06 as evident in Figure 7. Nonetheless, the government plans to issue more PIBs in the remaining fiscal year in order to execute its pledge of a constant supply of risk‐free sovereign debt instruments in the market.
24. A useful addition to permanent debt is the introduction of a 3‐year Ijara Sukuk Bond issued on September 15, 2008. The acceptance of Rs. 6.52 billion against the offers of Rs. 9.5 billion goes well in line with the commitment of the government to tap the huge potential underlying the mushrooming Islamic market. The SBP again raised Rs. 6 billion by conducting its second auction on December 20, 2008. The response in both the auctions was a confirmation of the promising growth prospects of the concerned industry. Furthermore, issuance of Sukuk has made liquidity management easier for Islamic banks by increasing the number of profitable investment avenues other than conventional banks to meet their SLR eligibility. This step should be continued as it will help in broadening the funding conduit of the government.
IV. ii . Floating Debt
25. The continuity pattern of decline in the outstanding stock of floating debt stopped by 2002‐03 when it was at Rs 516.3 billion. Since then, there has been a burgeoning addition to this category of debt at an average growth rate of 40 percent over the period of 2003‐04‐2008‐09. At the end of 2007‐08, floating debt rested at Rs 1589.6 billion (43.5 percent more than the stock in the previous fiscal year), whereas the level of short term debt reached Rs 1762.9 billion by end October 2008‐09; an increase of 11 percent. The treasury bills through auctions witnessed an enormous loading up of Rs. 655.5 billion in 2006‐07. However, this stock saw a decline of 18.2 percent in 2007‐08 and 17.6 percent till now in the current fiscal year 2008‐09. This low share of MTBs is accommodated extensively by MRTBs mushrooming at an unprecedented pace. The stock stood at Rs. 1320.2 billion on end October 2008‐09 and Rs. 1052.6 billion in 2007‐08. The figure for the central bank borrowing was better in 2006‐07 of just Rs. 451.5 billion. The rising dependence on floating debt is replicated by an increase in floating debt as a percentage of total domestic debt. This share has almost doubled from 27 percent in 2003‐04 to 52 percent in 2008‐09 (end Oct). Specifically, treasury bills purchased by the State Bank of Pakistan observed a gigantic enhancement of 290 percent in their share from 2003‐04 (10%) to 2008‐09 end October (39%).
26. Except for the first quarter of 2007‐08 in which over participation in Treasury bills auctions was witnessed from the market, rest of the quarters recorded less than target participation and the same tendency continued in 2008‐09 exhibiting market’s diminishing interest in government papers. This was probably due to the strong seasonal demand from private sector credit and lower growth of non‐government deposits. The market expectations of a further hike in discount rate as part of a tight monetary policy stance adopted by the SBP elicited out to be the prime reason behind the lackluster performance of Treasury bills auctions. This behavior was in disparity to trends during 2006‐07 when the government papers viewed profound investment owing to sufficient liquidity in the money market.
13
|Deb
t Policy Statem
ent, 2008‐09
(50)
0
50
100
150
FY02
FY03
FY04
FY05
FY06
FY07
FY08
FY09(end O
ct.)Rs
. (Bi
llion
)
Figure 8 Net Investment (NSS), FY02-FY09
27. Consequently, in 2007‐08 and 2008‐09 (end Oct), the government had to recourse to central bank borrowings for budgetary support in the absence of alternative funding channels thereby fueling inflationary pressures in the economy. In fact, it was the expansionary fiscal position besides external financing deficit that resulted in increased reliance on MRTBs. It is pertinent to note that the government bears nominal cost when MRTBs are created since interest payments on this instrument accrue back to the government as part of SBP’s profits.
IV. iii . Unfunded Debt
28. Unfunded debt, consisting of various types of savings instruments falling under the National Savings Scheme, increased from Rs 940 billion in 2006‐07 to Rs 1011 billion in 2007‐08. The unfunded debt amplified by Rs. 70.87 billion or 7.5 percent during 2007‐08. Accordingly, the stock till October’08 (2008‐09) has grown to impressive Rs 1054 billion. However, its share in the domestic debt structure accounts for a lesser 31 percent now (end Oct 2008‐09) in comparison to huge 45 percent in 2003‐04.
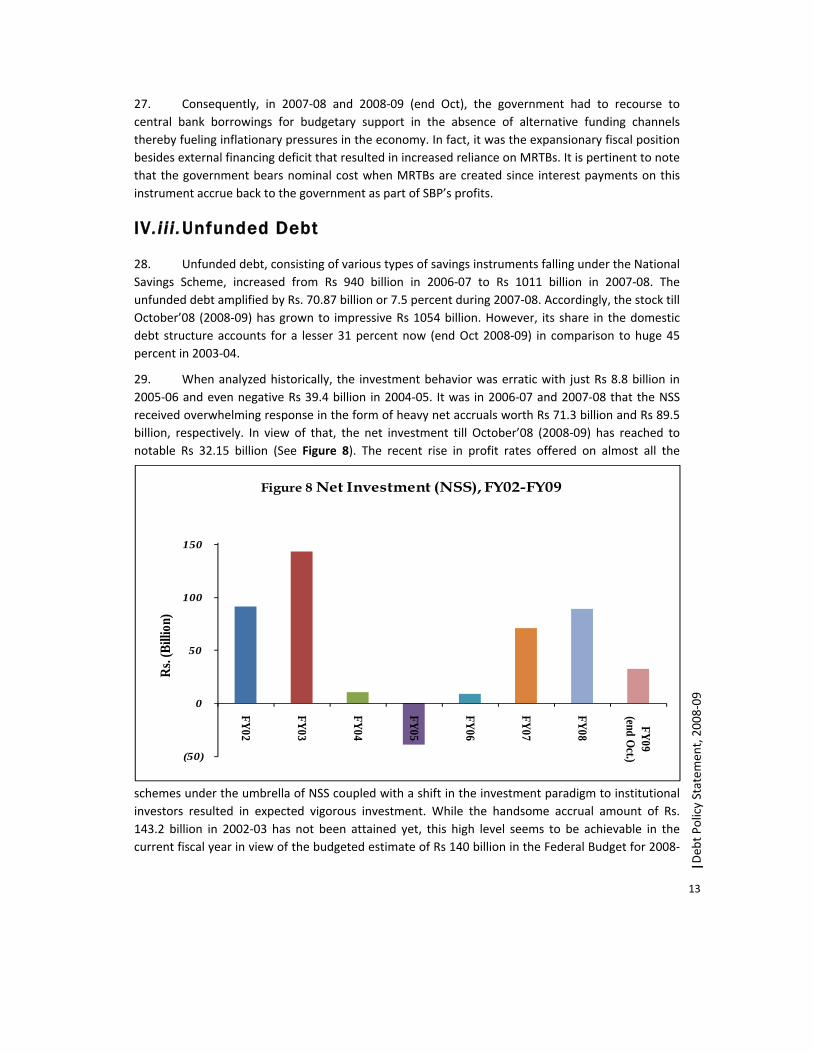
29. When analyzed historically, the investment behavior was erratic with just Rs 8.8 billion in 2005‐06 and even negative Rs 39.4 billion in 2004‐05. It was in 2006‐07 and 2007‐08 that the NSS received overwhelming response in the form of heavy net accruals worth Rs 71.3 billion and Rs 89.5 billion, respectively. In view of that, the net investment till October’08 (2008‐09) has reached to notable Rs 32.15 billion (See Figure 8). The recent rise in profit rates offered on almost all the
schemes under the umbrella of NSS coupled with a shift in the investment paradigm to institutional investors resulted in expected vigorous investment. While the handsome accrual amount of Rs. 143.2 billion in 2002‐03 has not been attained yet, this high level seems to be achievable in the current fiscal year in view of the budgeted estimate of Rs 140 billion in the Federal Budget for 2008‐
14
| Deb
t Policy Statem
ent, 2008‐09
Fiscal YearDomestic Debt (Rs.
Bln)
Interest Payments (Rs. Bln)
Tax Revenue
Total Revenue
Total Expenditure GDP (mp)
FY00 1644.8 210.2 51.8 41.0 29.6 5.5FY01 1799.0 188.5 42.7 34.1 26.3 4.5FY02 1774.7 189.5 39.6 30.4 22.9 4.3FY03 1894.5 166.9 30.0 23.2 18.6 3.4FY04 2027.5 161.5 26.1 20.0 17.2 2.9FY05 2177.6 210.0 26.7 19.6 15.8 3.2FY06 2336.8 237.0 25.2 18.8 14.4 3.1FY07 2610.2 369.0 32.3 22.1 17.2 4.2FY08 3217.2 440.5 46.6 32.6 21.5 4.7
FY09* 3425.6 143.5 51.8 37.3 27.4 1.1
Table 8: Domestic Debt & Its Interest PaymentsInterest Payments as % of
* End-Oct Source: Budget Wing, Ministry of Finance
09. Retail investors are showing a bulk of interest in the three schemes namely Special Savings Certificates & Accounts (net change of Rs 18.8 billion for 2007‐08 and Rs 9.9 billion for end October 2008‐09), Pensioners’ Benefit Account (Rs 18.7 billion and Rs 6.8 billion respectively) and Bahbood Savings Certificates (Rs 38.8 billion and Rs 20.9 billion correspondingly) mainly due to the bi‐annual nature of coupon payments on these instruments. The government’s recent decision to review profit rates on quarterly basis is expected to generate massive interest in the unfunded debt dominated by NSS by the end of the current fiscal year.
IV.iv. Domestic Debt Servicing
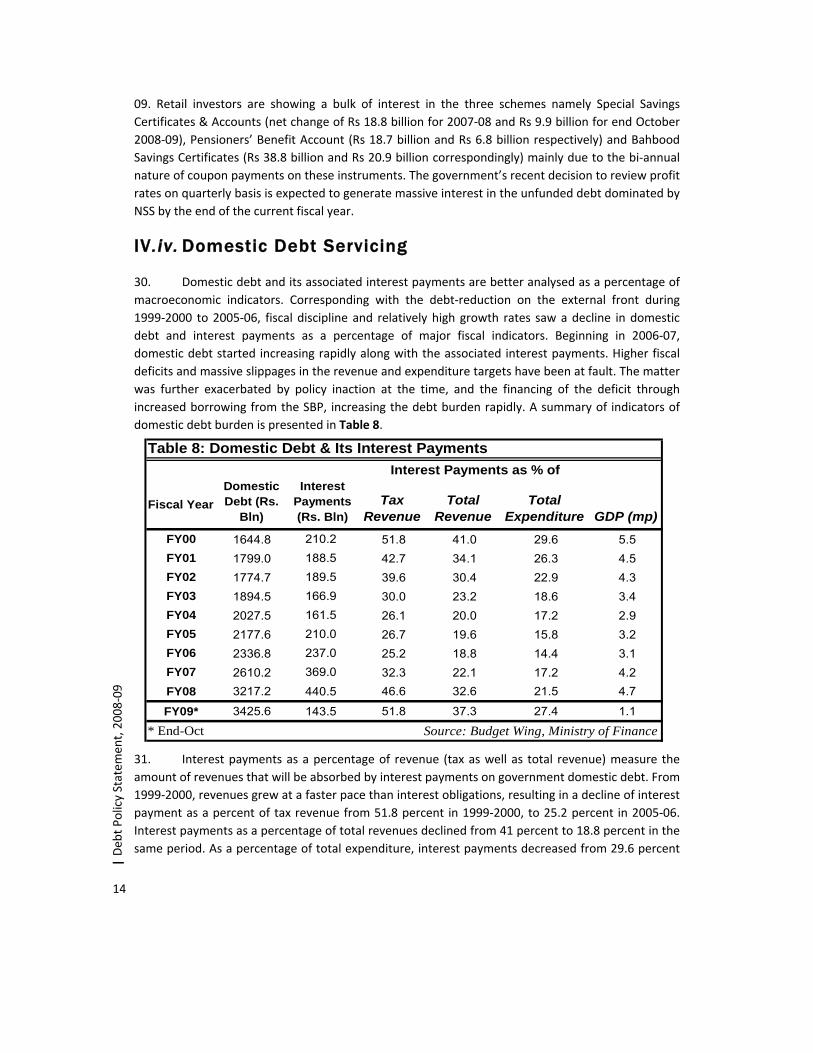
30. Domestic debt and its associated interest payments are better analysed as a percentage of macroeconomic indicators. Corresponding with the debt‐reduction on the external front during 1999‐2000 to 2005‐06, fiscal discipline and relatively high growth rates saw a decline in domestic debt and interest payments as a percentage of major fiscal indicators. Beginning in 2006‐07, domestic debt started increasing rapidly along with the associated interest payments. Higher fiscal deficits and massive slippages in the revenue and expenditure targets have been at fault. The matter was further exacerbated by policy inaction at the time, and the financing of the deficit through increased borrowing from the SBP, increasing the debt burden rapidly. A summary of indicators of domestic debt burden is presented in Table 8.
31. Interest payments as a percentage of revenue (tax as well as total revenue) measure the amount of revenues that will be absorbed by interest payments on government domestic debt. From 1999‐2000, revenues grew at a faster pace than interest obligations, resulting in a decline of interest payment as a percent of tax revenue from 51.8 percent in 1999‐2000, to 25.2 percent in 2005‐06. Interest payments as a percentage of total revenues declined from 41 percent to 18.8 percent in the same period. As a percentage of total expenditure, interest payments decreased from 29.6 percent
15
|Deb
t Policy Statem
ent, 2008‐09
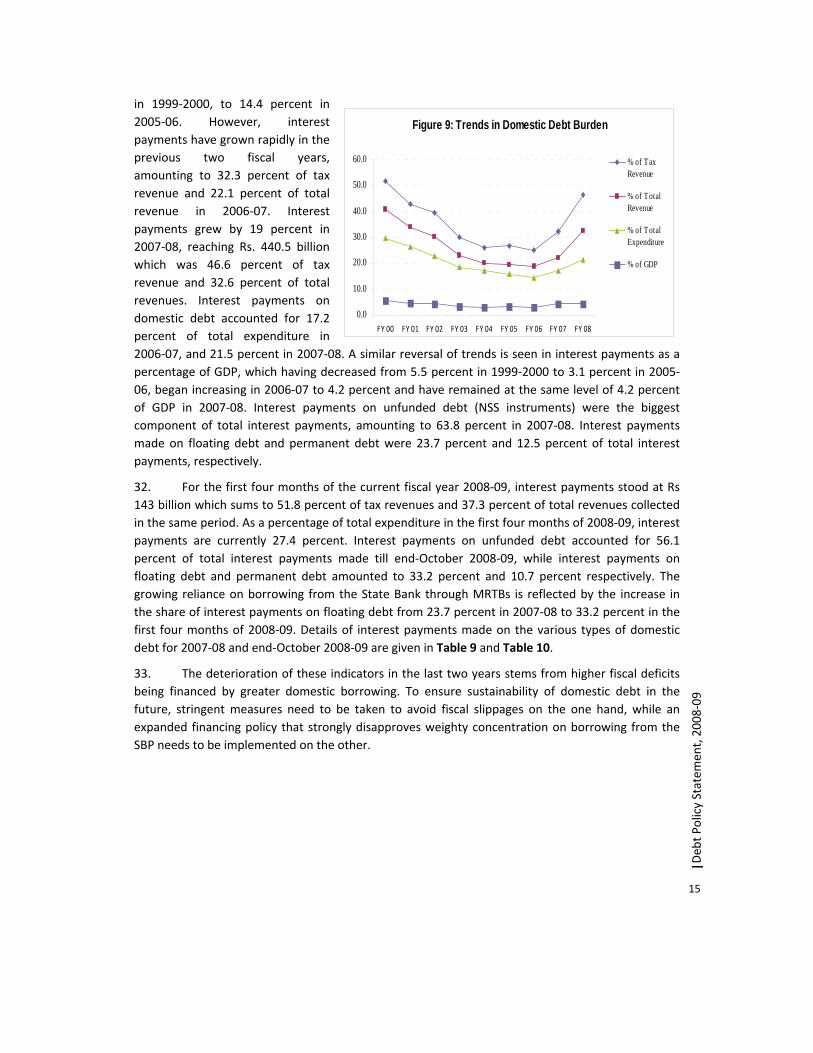
in 1999‐2000, to 14.4 percent in 2005‐06. However, interest payments have grown rapidly in the previous two fiscal years, amounting to 32.3 percent of tax revenue and 22.1 percent of total revenue in 2006‐07. Interest payments grew by 19 percent in 2007‐08, reaching Rs. 440.5 billion which was 46.6 percent of tax revenue and 32.6 percent of total revenues. Interest payments on domestic debt accounted for 17.2 percent of total expenditure in 2006‐07, and 21.5 percent in 2007‐08. A similar reversal of trends is seen in interest payments as a percentage of GDP, which having decreased from 5.5 percent in 1999‐2000 to 3.1 percent in 2005‐06, began increasing in 2006‐07 to 4.2 percent and have remained at the same level of 4.2 percent of GDP in 2007‐08. Interest payments on unfunded debt (NSS instruments) were the biggest component of total interest payments, amounting to 63.8 percent in 2007‐08. Interest payments made on floating debt and permanent debt were 23.7 percent and 12.5 percent of total interest payments, respectively.
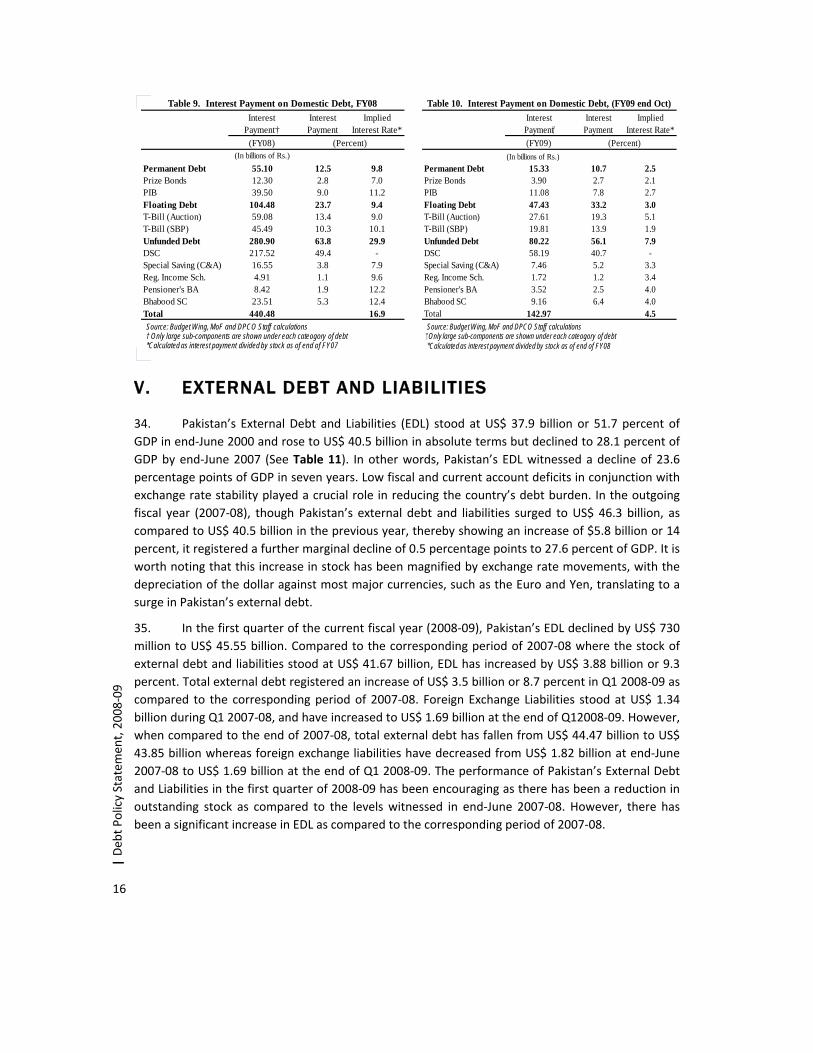
32. For the first four months of the current fiscal year 2008‐09, interest payments stood at Rs 143 billion which sums to 51.8 percent of tax revenues and 37.3 percent of total revenues collected in the same period. As a percentage of total expenditure in the first four months of 2008‐09, interest payments are currently 27.4 percent. Interest payments on unfunded debt accounted for 56.1 percent of total interest payments made till end‐October 2008‐09, while interest payments on floating debt and permanent debt amounted to 33.2 percent and 10.7 percent respectively. The growing reliance on borrowing from the State Bank through MRTBs is reflected by the increase in the share of interest payments on floating debt from 23.7 percent in 2007‐08 to 33.2 percent in the first four months of 2008‐09. Details of interest payments made on the various types of domestic debt for 2007‐08 and end‐October 2008‐09 are given in Table 9 and Table 10.
33. The deterioration of these indicators in the last two years stems from higher fiscal deficits being financed by greater domestic borrowing. To ensure sustainability of domestic debt in the future, stringent measures need to be taken to avoid fiscal slippages on the one hand, while an expanded financing policy that strongly disapproves weighty concentration on borrowing from the SBP needs to be implemented on the other.
Figure 9: Trends in Domestic Debt Burden
0.0
10.0
20.0
30.0
40.0
50.0
60.0
FY 00 FY 01 FY 02 FY 03 FY 04 FY 05 FY 06 FY 07 FY 08
% of TaxRevenue
% of TotalRevenue
% of TotalExpenditure
% of GDP
16
| Deb
t Policy Statem
ent, 2008‐09
V. EXTERNAL DEBT AND LIABILITIES
34. Pakistan’s External Debt and Liabilities (EDL) stood at US$ 37.9 billion or 51.7 percent of GDP in end‐June 2000 and rose to US$ 40.5 billion in absolute terms but declined to 28.1 percent of GDP by end‐June 2007 (See Table 11). In other words, Pakistan’s EDL witnessed a decline of 23.6 percentage points of GDP in seven years. Low fiscal and current account deficits in conjunction with exchange rate stability played a crucial role in reducing the country’s debt burden. In the outgoing fiscal year (2007‐08), though Pakistan’s external debt and liabilities surged to US$ 46.3 billion, as compared to US$ 40.5 billion in the previous year, thereby showing an increase of $5.8 billion or 14 percent, it registered a further marginal decline of 0.5 percentage points to 27.6 percent of GDP. It is worth noting that this increase in stock has been magnified by exchange rate movements, with the depreciation of the dollar against most major currencies, such as the Euro and Yen, translating to a surge in Pakistan’s external debt.
35. In the first quarter of the current fiscal year (2008‐09), Pakistan’s EDL declined by US$ 730 million to US$ 45.55 billion. Compared to the corresponding period of 2007‐08 where the stock of external debt and liabilities stood at US$ 41.67 billion, EDL has increased by US$ 3.88 billion or 9.3 percent. Total external debt registered an increase of US$ 3.5 billion or 8.7 percent in Q1 2008‐09 as compared to the corresponding period of 2007‐08. Foreign Exchange Liabilities stood at US$ 1.34 billion during Q1 2007‐08, and have increased to US$ 1.69 billion at the end of Q12008‐09. However, when compared to the end of 2007‐08, total external debt has fallen from US$ 44.47 billion to US$ 43.85 billion whereas foreign exchange liabilities have decreased from US$ 1.82 billion at end‐June 2007‐08 to US$ 1.69 billion at the end of Q1 2008‐09. The performance of Pakistan’s External Debt and Liabilities in the first quarter of 2008‐09 has been encouraging as there has been a reduction in outstanding stock as compared to the levels witnessed in end‐June 2007‐08. However, there has been a significant increase in EDL as compared to the corresponding period of 2007‐08.
InterestPayment†
Interest Payment
ImpliedInterest Rate*
(FY08)
Permanent Debt 55.10 12.5 9.8Prize Bonds 12.30 2.8 7.0PIB 39.50 9.0 11.2Floating Debt 104.48 23.7 9.4T-Bill (Auction) 59.08 13.4 9.0T-Bill (SBP) 45.49 10.3 10.1Unfunded Debt 280.90 63.8 29.9DSC 217.52 49.4 -Special Saving (C&A) 16.55 3.8 7.9Reg. Income Sch. 4.91 1.1 9.6Pensioner's BA 8.42 1.9 12.2Bhabood SC 23.51 5.3 12.4Total 440.48 16.9
(Percent)(In billions of Rs.)
Table 9. Interest Payment on Domestic Debt, FY08
Source: Budget Wing, MoF and DPCO Staff calculations† Only large sub-components are shown under each cateogory of debt*Calculated as interest payment divided by stock as of end of FY07
InterestPayment
Interest Payment
ImpliedInterest Rate*
(FY09)(In billions of Rs.)
Permanent Debt 15.33 10.7 2.5Prize Bonds 3.90 2.7 2.1PIB 11.08 7.8 2.7Floating Debt 47.43 33.2 3.0T-Bill (Auction) 27.61 19.3 5.1T-Bill (SBP) 19.81 13.9 1.9Unfunded Debt 80.22 56.1 7.9DSC 58.19 40.7 -Special Saving (C&A) 7.46 5.2 3.3Reg. Income Sch. 1.72 1.2 3.4Pensioner's BA 3.52 2.5 4.0Bhabood SC 9.16 6.4 4.0Total 142.97 4.5
(Percent)
Table 10. Interest Payment on Domestic Debt, (FY09 end Oct)
Source: Budget Wing, MoF and DPCO Staff calculations Only large sub-components are shown under each cateogory of debt*Calculated as interest payment divided by stock as of end of FY08
17
|Deb
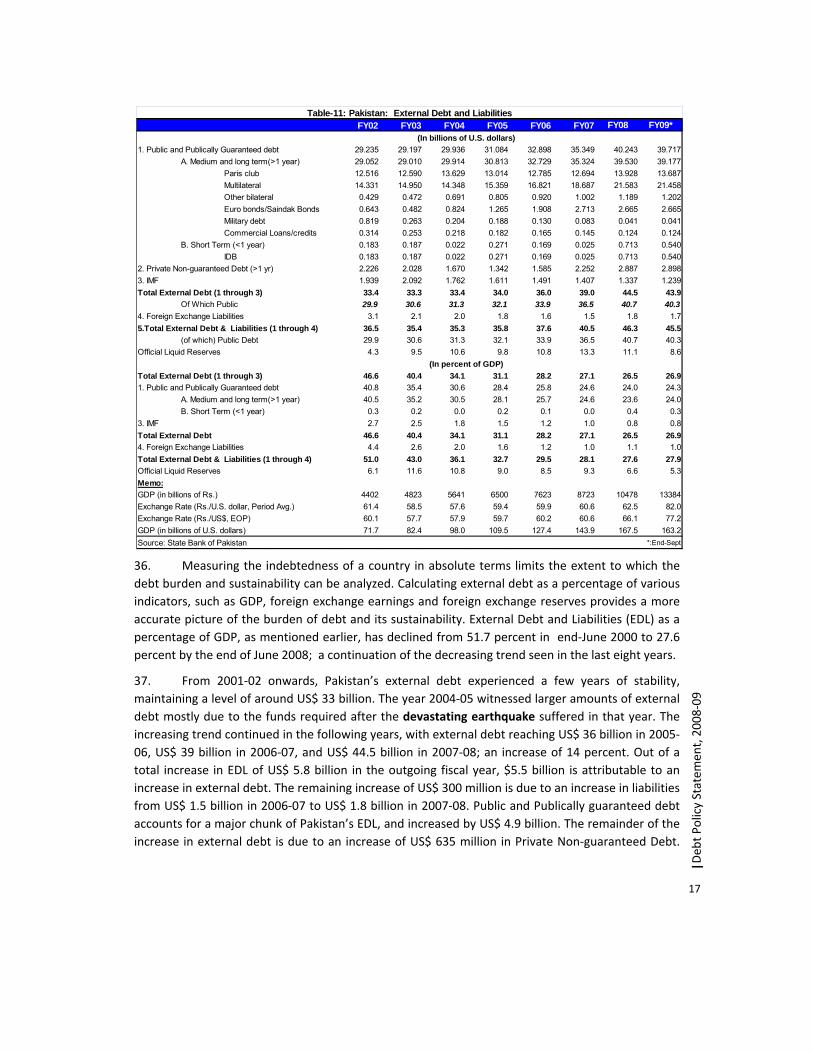
t Policy Statem
ent, 2008‐09
36. Measuring the indebtedness of a country in absolute terms limits the extent to which the debt burden and sustainability can be analyzed. Calculating external debt as a percentage of various indicators, such as GDP, foreign exchange earnings and foreign exchange reserves provides a more accurate picture of the burden of debt and its sustainability. External Debt and Liabilities (EDL) as a percentage of GDP, as mentioned earlier, has declined from 51.7 percent in end‐June 2000 to 27.6 percent by the end of June 2008; a continuation of the decreasing trend seen in the last eight years.
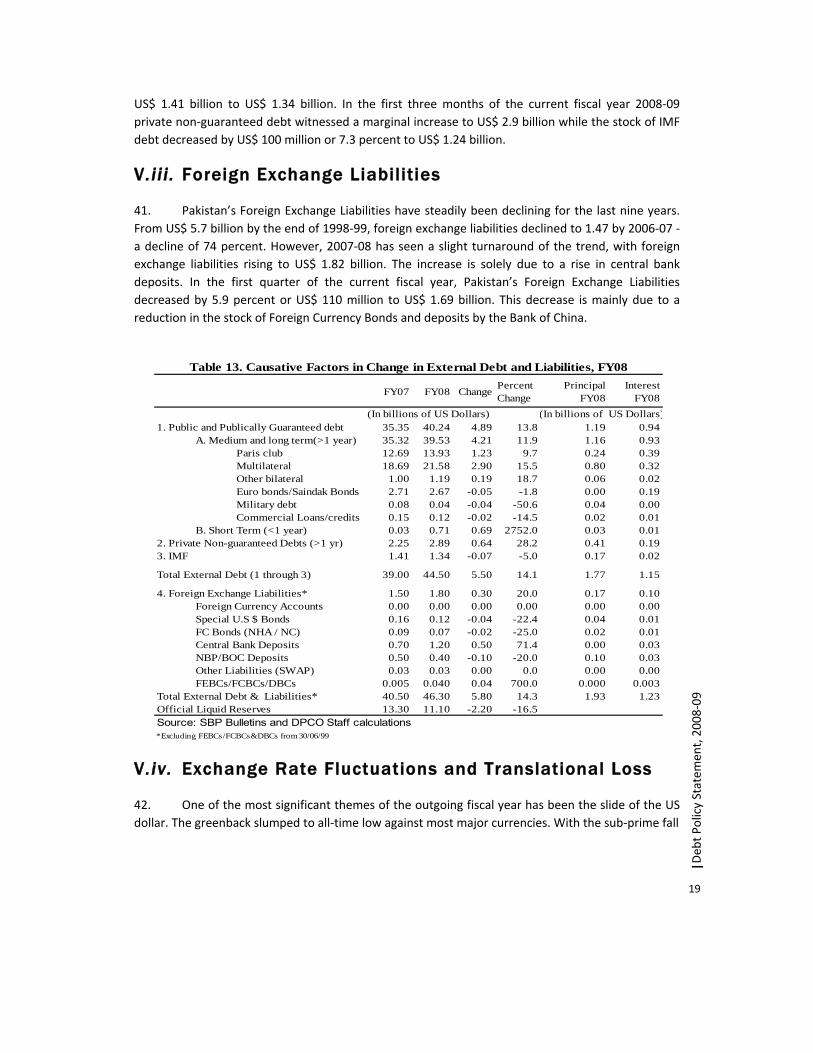
37. From 2001‐02 onwards, Pakistan’s external debt experienced a few years of stability, maintaining a level of around US$ 33 billion. The year 2004‐05 witnessed larger amounts of external debt mostly due to the funds required after the devastating earthquake suffered in that year. The increasing trend continued in the following years, with external debt reaching US$ 36 billion in 2005‐06, US$ 39 billion in 2006‐07, and US$ 44.5 billion in 2007‐08; an increase of 14 percent. Out of a total increase in EDL of US$ 5.8 billion in the outgoing fiscal year, $5.5 billion is attributable to an increase in external debt. The remaining increase of US$ 300 million is due to an increase in liabilities from US$ 1.5 billion in 2006‐07 to US$ 1.8 billion in 2007‐08. Public and Publically guaranteed debt accounts for a major chunk of Pakistan’s EDL, and increased by US$ 4.9 billion. The remainder of the increase in external debt is due to an increase of US$ 635 million in Private Non‐guaranteed Debt.
FY02 FY03 FY04 FY05 FY06 FY07 FY08 FY09*
1. Public and Publically Guaranteed debt 29.235 29.197 29.936 31.084 32.898 35.349 40.243 39.717A. Medium and long term(>1 year) 29.052 29.010 29.914 30.813 32.729 35.324 39.530 39.177
Paris club 12.516 12.590 13.629 13.014 12.785 12.694 13.928 13.687Multilateral 14.331 14.950 14.348 15.359 16.821 18.687 21.583 21.458Other bilateral 0.429 0.472 0.691 0.805 0.920 1.002 1.189 1.202Euro bonds/Saindak Bonds 0.643 0.482 0.824 1.265 1.908 2.713 2.665 2.665Military debt 0.819 0.263 0.204 0.188 0.130 0.083 0.041 0.041Commercial Loans/credits 0.314 0.253 0.218 0.182 0.165 0.145 0.124 0.124
B. Short Term (<1 year) 0.183 0.187 0.022 0.271 0.169 0.025 0.713 0.540IDB 0.183 0.187 0.022 0.271 0.169 0.025 0.713 0.540
2. Private Non-guaranteed Debt (>1 yr) 2.226 2.028 1.670 1.342 1.585 2.252 2.887 2.8983. IMF 1.939 2.092 1.762 1.611 1.491 1.407 1.337 1.239Total External Debt (1 through 3) 33.4 33.3 33.4 34.0 36.0 39.0 44.5 43.9
Of Which Public 29.9 30.6 31.3 32.1 33.9 36.5 40.7 40.34. Foreign Exchange Liabilities 3.1 2.1 2.0 1.8 1.6 1.5 1.8 1.75.Total External Debt & Liabilities (1 through 4) 36.5 35.4 35.3 35.8 37.6 40.5 46.3 45.5
(of which) Public Debt 29.9 30.6 31.3 32.1 33.9 36.5 40.7 40.3Official Liquid Reserves 4.3 9.5 10.6 9.8 10.8 13.3 11.1 8.6
Total External Debt (1 through 3) 46.6 40.4 34.1 31.1 28.2 27.1 26.5 26.91. Public and Publically Guaranteed debt 40.8 35.4 30.6 28.4 25.8 24.6 24.0 24.3
A. Medium and long term(>1 year) 40.5 35.2 30.5 28.1 25.7 24.6 23.6 24.0B. Short Term (<1 year) 0.3 0.2 0.0 0.2 0.1 0.0 0.4 0.3
3. IMF 2.7 2.5 1.8 1.5 1.2 1.0 0.8 0.8Total External Debt 46.6 40.4 34.1 31.1 28.2 27.1 26.5 26.94. Foreign Exchange Liabilities 4.4 2.6 2.0 1.6 1.2 1.0 1.1 1.0Total External Debt & Liabilities (1 through 4) 51.0 43.0 36.1 32.7 29.5 28.1 27.6 27.9Official Liquid Reserves 6.1 11.6 10.8 9.0 8.5 9.3 6.6 5.3
GDP (in billions of Rs.) 4402 4823 5641 6500 7623 8723 10478 13384Exchange Rate (Rs./U.S. dollar, Period Avg.) 61.4 58.5 57.6 59.4 59.9 60.6 62.5 82.0Exchange Rate (Rs./US$, EOP) 60.1 57.7 57.9 59.7 60.2 60.6 66.1 77.2GDP (in billions of U.S. dollars) 71.7 82.4 98.0 109.5 127.4 143.9 167.5 163.2Source: State Bank of Pakistan
Table-11: Pakistan: External Debt and Liabilities
(In billions of U.S. dollars)
(In percent of GDP)
Memo:
*:End-Sept
18
| Deb
t Policy Statem
ent, 2008‐09
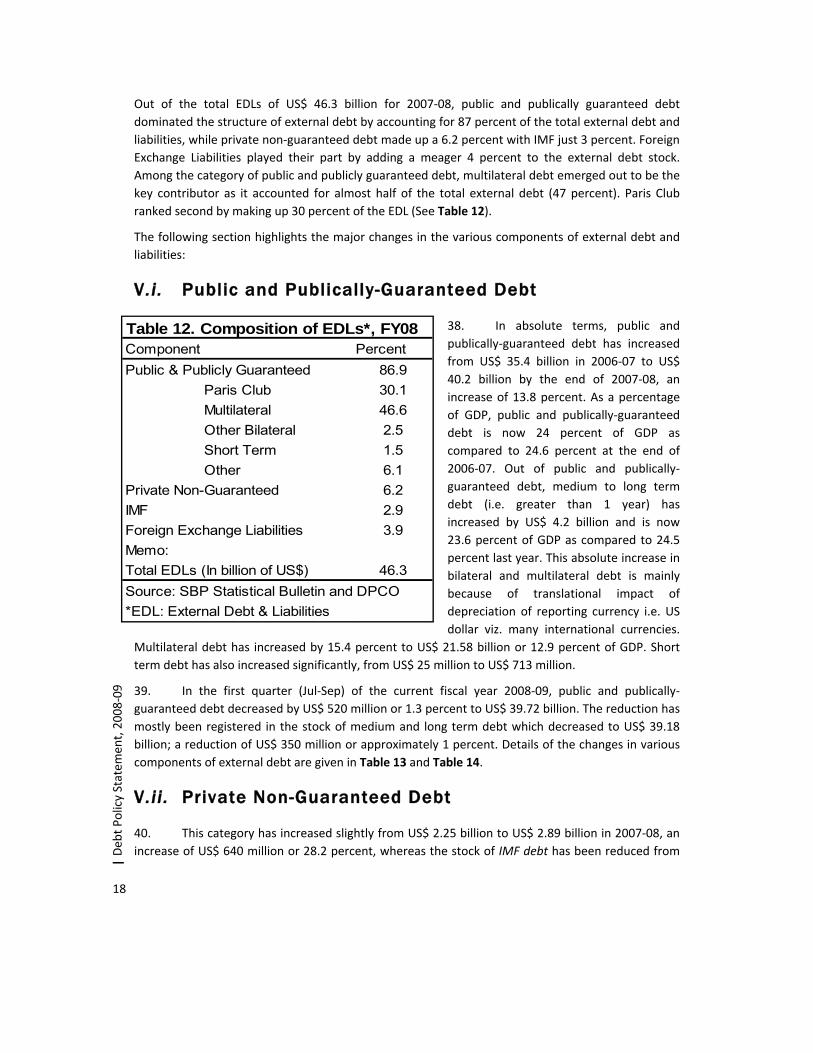
Table 12. Composition of EDLs*, FY08Component PercentPublic & Publicly Guaranteed 86.9
Paris Club 30.1Multilateral 46.6Other Bilateral 2.5Short Term 1.5Other 6.1
Private Non-Guaranteed 6.2IMF 2.9Foreign Exchange Liabilities 3.9Memo:Total EDLs (In billion of US$) 46.3Source: SBP Statistical Bulletin and DPCO*EDL: External Debt & Liabilities
Out of the total EDLs of US$ 46.3 billion for 2007‐08, public and publically guaranteed debt dominated the structure of external debt by accounting for 87 percent of the total external debt and liabilities, while private non‐guaranteed debt made up a 6.2 percent with IMF just 3 percent. Foreign Exchange Liabilities played their part by adding a meager 4 percent to the external debt stock. Among the category of public and publicly guaranteed debt, multilateral debt emerged out to be the key contributor as it accounted for almost half of the total external debt (47 percent). Paris Club ranked second by making up 30 percent of the EDL (See Table 12).
The following section highlights the major changes in the various components of external debt and liabilities:
V .i . Public and Publically-Guaranteed Debt
38. In absolute terms, public and publically‐guaranteed debt has increased from US$ 35.4 billion in 2006‐07 to US$ 40.2 billion by the end of 2007‐08, an increase of 13.8 percent. As a percentage of GDP, public and publically‐guaranteed debt is now 24 percent of GDP as compared to 24.6 percent at the end of 2006‐07. Out of public and publically‐guaranteed debt, medium to long term debt (i.e. greater than 1 year) has increased by US$ 4.2 billion and is now 23.6 percent of GDP as compared to 24.5 percent last year. This absolute increase in bilateral and multilateral debt is mainly because of translational impact of depreciation of reporting currency i.e. US dollar viz. many international currencies.
Multilateral debt has increased by 15.4 percent to US$ 21.58 billion or 12.9 percent of GDP. Short term debt has also increased significantly, from US$ 25 million to US$ 713 million.
39. In the first quarter (Jul‐Sep) of the current fiscal year 2008‐09, public and publically‐guaranteed debt decreased by US$ 520 million or 1.3 percent to US$ 39.72 billion. The reduction has mostly been registered in the stock of medium and long term debt which decreased to US$ 39.18 billion; a reduction of US$ 350 million or approximately 1 percent. Details of the changes in various components of external debt are given in Table 13 and Table 14.
V . ii . Private Non-Guaranteed Debt
40. This category has increased slightly from US$ 2.25 billion to US$ 2.89 billion in 2007‐08, an increase of US$ 640 million or 28.2 percent, whereas the stock of IMF debt has been reduced from
19
|Deb
t Policy Statem
ent, 2008‐09
US$ 1.41 billion to US$ 1.34 billion. In the first three months of the current fiscal year 2008‐09 private non‐guaranteed debt witnessed a marginal increase to US$ 2.9 billion while the stock of IMF debt decreased by US$ 100 million or 7.3 percent to US$ 1.24 billion.
V . iii . Foreign Exchange Liabilities
41. Pakistan’s Foreign Exchange Liabilities have steadily been declining for the last nine years. From US$ 5.7 billion by the end of 1998‐99, foreign exchange liabilities declined to 1.47 by 2006‐07 ‐ a decline of 74 percent. However, 2007‐08 has seen a slight turnaround of the trend, with foreign exchange liabilities rising to US$ 1.82 billion. The increase is solely due to a rise in central bank deposits. In the first quarter of the current fiscal year, Pakistan’s Foreign Exchange Liabilities decreased by 5.9 percent or US$ 110 million to US$ 1.69 billion. This decrease is mainly due to a reduction in the stock of Foreign Currency Bonds and deposits by the Bank of China.
V .iv. Exchange Rate Fluctuations and Translational Loss
42. One of the most significant themes of the outgoing fiscal year has been the slide of the US dollar. The greenback slumped to all‐time low against most major currencies. With the sub‐prime fall
FY07 FY08 Change Percent Change
Principal FY08
Interest FY08
1. Public and Publically Guaranteed debt 35.35 40.24 4.89 13.8 1.19 0.94A. Medium and long term(>1 year) 35.32 39.53 4.21 11.9 1.16 0.93
Paris club 12.69 13.93 1.23 9.7 0.24 0.39Multilateral 18.69 21.58 2.90 15.5 0.80 0.32Other bilateral 1.00 1.19 0.19 18.7 0.06 0.02Euro bonds/Saindak Bonds 2.71 2.67 -0.05 -1.8 0.00 0.19Military debt 0.08 0.04 -0.04 -50.6 0.04 0.00Commercial Loans/credits 0.15 0.12 -0.02 -14.5 0.02 0.01
B. Short Term (<1 year) 0.03 0.71 0.69 2752.0 0.03 0.012. Private Non-guaranteed Debts (>1 yr) 2.25 2.89 0.64 28.2 0.41 0.193. IMF 1.41 1.34 -0.07 -5.0 0.17 0.02
Total External Debt (1 through 3) 39.00 44.50 5.50 14.1 1.77 1.15
4. Foreign Exchange Liabilities* 1.50 1.80 0.30 20.0 0.17 0.10Foreign Currency Accounts 0.00 0.00 0.00 0.00 0.00 0.00Special U.S $ Bonds 0.16 0.12 -0.04 -22.4 0.04 0.01FC Bonds (NHA / NC) 0.09 0.07 -0.02 -25.0 0.02 0.01Central Bank Deposits 0.70 1.20 0.50 71.4 0.00 0.03NBP/BOC Deposits 0.50 0.40 -0.10 -20.0 0.10 0.03Other Liabilities (SWAP) 0.03 0.03 0.00 0.0 0.00 0.00FEBCs/FCBCs/DBCs 0.005 0.040 0.04 700.0 0.000 0.003
Total External Debt & Liabilities* 40.50 46.30 5.80 14.3 1.93 1.23Official Liquid Reserves 13.30 11.10 -2.20 -16.5Source: SBP Bulletins and DPCO Staff calculations*Excluding FEBCs/FCBCs&DBCs from 30/06/99
Table 13. Causative Factors in Change in External Debt and Liabilities, FY08
(In billions of US Dollars) (In billions of US Dollars)
20
| Deb
t Policy Statem
ent, 2008‐09
CurrencyOutstanding
Balance(BC mln) 30/06/08
Exchange rate 30/06/08
Outstanding Balance US$mln 30/06/08
Exchange rate 30/06/07
Outstanding Balance US$mln 30/06/07
Difference (US$ mln)
Euro 3,843.00 0.64 6,038.94 0.74 5,165.32 873.62Japanese
Yen 1,191,595.00 107.77 11,056.32 122.48 9,728.89 1,327.43
SDR 6,004.00 0.61 9,764.19 0.66 9,083.21 680.98US $ 11,072.00 1.00 11,072.00 1.00 11,072.00 0.00
Others 239.00Total 3,121.03
Table 15: Translational Exchange Rate Impact
Source: EAD and Staff calculations
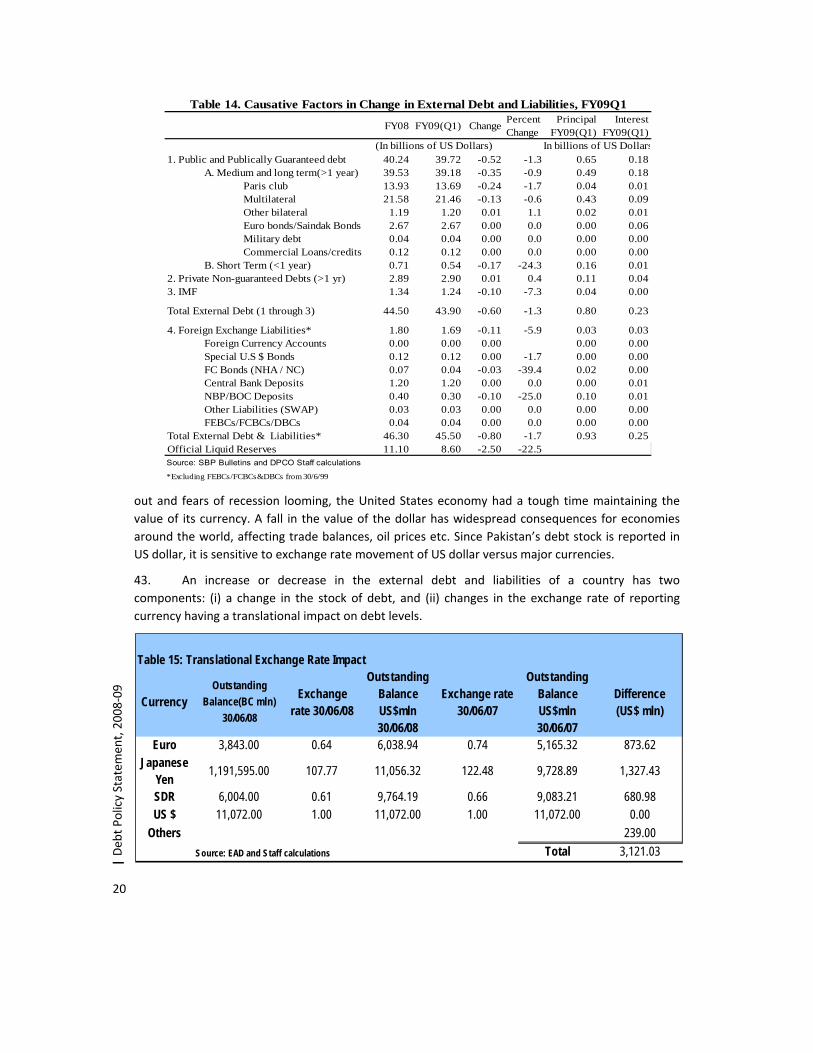
out and fears of recession looming, the United States economy had a tough time maintaining the value of its currency. A fall in the value of the dollar has widespread consequences for economies around the world, affecting trade balances, oil prices etc. Since Pakistan’s debt stock is reported in US dollar, it is sensitive to exchange rate movement of US dollar versus major currencies.
43. An increase or decrease in the external debt and liabilities of a country has two components: (i) a change in the stock of debt, and (ii) changes in the exchange rate of reporting currency having a translational impact on debt levels.
FY08 FY09(Q1) Change Percent Change
Principal FY09(Q1)
Interest FY09(Q1)
1. Public and Publically Guaranteed debt 40.24 39.72 -0.52 -1.3 0.65 0.18A. Medium and long term(>1 year) 39.53 39.18 -0.35 -0.9 0.49 0.18
Paris club 13.93 13.69 -0.24 -1.7 0.04 0.01Multilateral 21.58 21.46 -0.13 -0.6 0.43 0.09Other bilateral 1.19 1.20 0.01 1.1 0.02 0.01Euro bonds/Saindak Bonds 2.67 2.67 0.00 0.0 0.00 0.06Military debt 0.04 0.04 0.00 0.0 0.00 0.00Commercial Loans/credits 0.12 0.12 0.00 0.0 0.00 0.00
B. Short Term (<1 year) 0.71 0.54 -0.17 -24.3 0.16 0.012. Private Non-guaranteed Debts (>1 yr) 2.89 2.90 0.01 0.4 0.11 0.043. IMF 1.34 1.24 -0.10 -7.3 0.04 0.00
Total External Debt (1 through 3) 44.50 43.90 -0.60 -1.3 0.80 0.23
4. Foreign Exchange Liabilities* 1.80 1.69 -0.11 -5.9 0.03 0.03Foreign Currency Accounts 0.00 0.00 0.00 0.00 0.00Special U.S $ Bonds 0.12 0.12 0.00 -1.7 0.00 0.00FC Bonds (NHA / NC) 0.07 0.04 -0.03 -39.4 0.02 0.00Central Bank Deposits 1.20 1.20 0.00 0.0 0.00 0.01NBP/BOC Deposits 0.40 0.30 -0.10 -25.0 0.10 0.01Other Liabilities (SWAP) 0.03 0.03 0.00 0.0 0.00 0.00FEBCs/FCBCs/DBCs 0.04 0.04 0.00 0.0 0.00 0.00
Total External Debt & Liabilities* 46.30 45.50 -0.80 -1.7 0.93 0.25Official Liquid Reserves 11.10 8.60 -2.50 -22.5Source: SBP Bulletins and DPCO Staff calculations
*Excluding FEBCs/FCBCs&DBCs from 30/6/99
Table 14. Causative Factors in Change in External Debt and Liabilities, FY09Q1
(In billions of US Dollars) In billions of US Dollars
21
|Deb
t Policy Statem
ent, 2008‐09
CurrencyOutstanding(BC millions) 30/6/08
Exchange Rate 30/06/08
Outstanding 30/06/08(US$
millions)
Exchange Rate30/9/2008
Outstanding 30/09/08(USD
millions)
Translational Gain/Loss
(US$ millions)Aus-Dollar 17.93 1.04 17.21 1.26 14.19 3.02
CDN 664.78 1.01 660.36 1.06 624.50 35.86
Swiss Franc 163.75 1.03 158.88 1.12 145.69 13.20
Chinese Yuan 2,155.31 6.87 313.92 6.85 314.73 -0.81
Danish Krone 80.37 4.75 16.93 5.30 15.17 1.77
Euro 3,843.09 0.64 6,039.08 0.71 5,412.04 627.04Pound Sterling 50.59 0.50 100.34 0.56 89.97 10.37
Japanese Yen 1,191,595.91 107.77 11,056.33 106.37 11,202.19 -145.86
Korean Won 8,997.42 1,037.50 8.67 1,206.27 7.46 1.21
Kuwaiti Dinar 22.54 0.27 85.06 0.27 84.42 0.64
Libyan Dinar 5.50 1.19 4.62 1.25 4.42 0.21Norwegian Krona 148.50 5.06 29.34 5.87 25.29 4.05
Pak Rupee 9.59 68.10 0.14 78.00 0.12 0.02
Saudi Riyal 60.12 3.75 16.03 3.76 15.98 0.05
SDR 6,004.19 0.61 9,763.70 0.64 9,349.85 413.86Swedish Kronor 334.80 5.99 55.91 6.93 48.35 7.57
Singapore Dollar 0.09 1.36 0.07 1.44 0.06 0.00
Thai Baht 3.30 33.58 0.10 33.90 0.10 0.00
USD 11,072.49 1.00 11,072.49 1.00 11,072.49 0.00
Total 1,225,230.27 39,399.20 38,427.00 972.20
Table 16: Translational Impact During FY09 Q1
Source: DPCO Staff Calculations
44. Pakistan’s external debt is denominated in multiple currencies; however, it is reported as equivalent of US dollars for accounting purposes. Any fluctuation in the value of the US dollar has a significant impact on the amount of external debt. With the dollar depreciating at a rapid pace throughout 2007‐08, there were significant translational losses resulting in a large increase in Pakistan’s EDL (See Table 15). Out of a total increase of US$ 5.8 billion in EDL in 2007‐08, US$ 3.1 billion or 53.4 percent can be attributed to the depreciation of the US dollar against major international currencies and the associated translational loss. The depreciation of the dollar against the Japanese Yen alone caused US $ 1.32 billion in translational losses whereas depreciation against the Euro and SDR added US$ 874 million and US$ 681 million to EDL, respectively. The remaining US$ 2.7 billion increase in EDL was due to new disbursements.
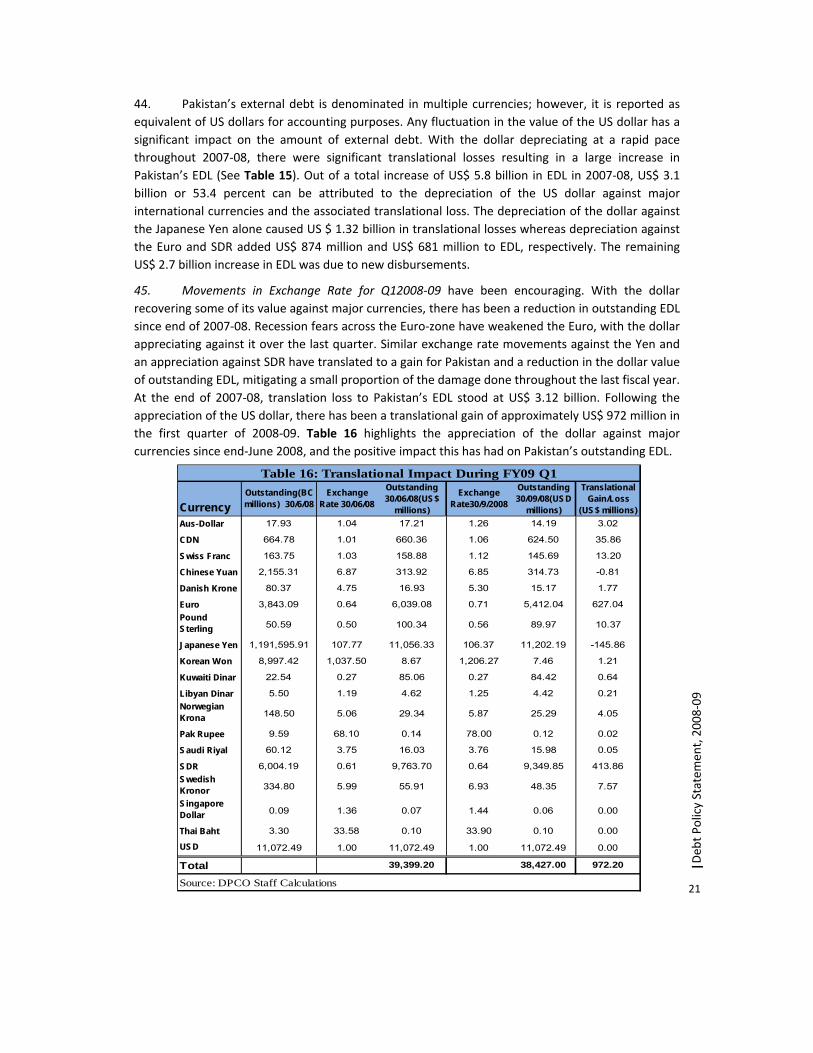
45. Movements in Exchange Rate for Q12008‐09 have been encouraging. With the dollar recovering some of its value against major currencies, there has been a reduction in outstanding EDL since end of 2007‐08. Recession fears across the Euro‐zone have weakened the Euro, with the dollar appreciating against it over the last quarter. Similar exchange rate movements against the Yen and an appreciation against SDR have translated to a gain for Pakistan and a reduction in the dollar value of outstanding EDL, mitigating a small proportion of the damage done throughout the last fiscal year. At the end of 2007‐08, translation loss to Pakistan’s EDL stood at US$ 3.12 billion. Following the appreciation of the US dollar, there has been a translational gain of approximately US$ 972 million in the first quarter of 2008‐09. Table 16 highlights the appreciation of the dollar against major currencies since end‐June 2008, and the positive impact this has had on Pakistan’s outstanding EDL.
22
| Deb
t Policy Statem
ent, 2008‐09
Figure 10. Currency Composition of Official Loans
CNY1%
USD51%
EUR6%
JPY13%
SDR29%
Other0%
DisbursedCNY2%
USD39%
EUR2%
JPY28%
SDR25%
Other4%
Undisbursed
V .v. Official Loan Disbursements
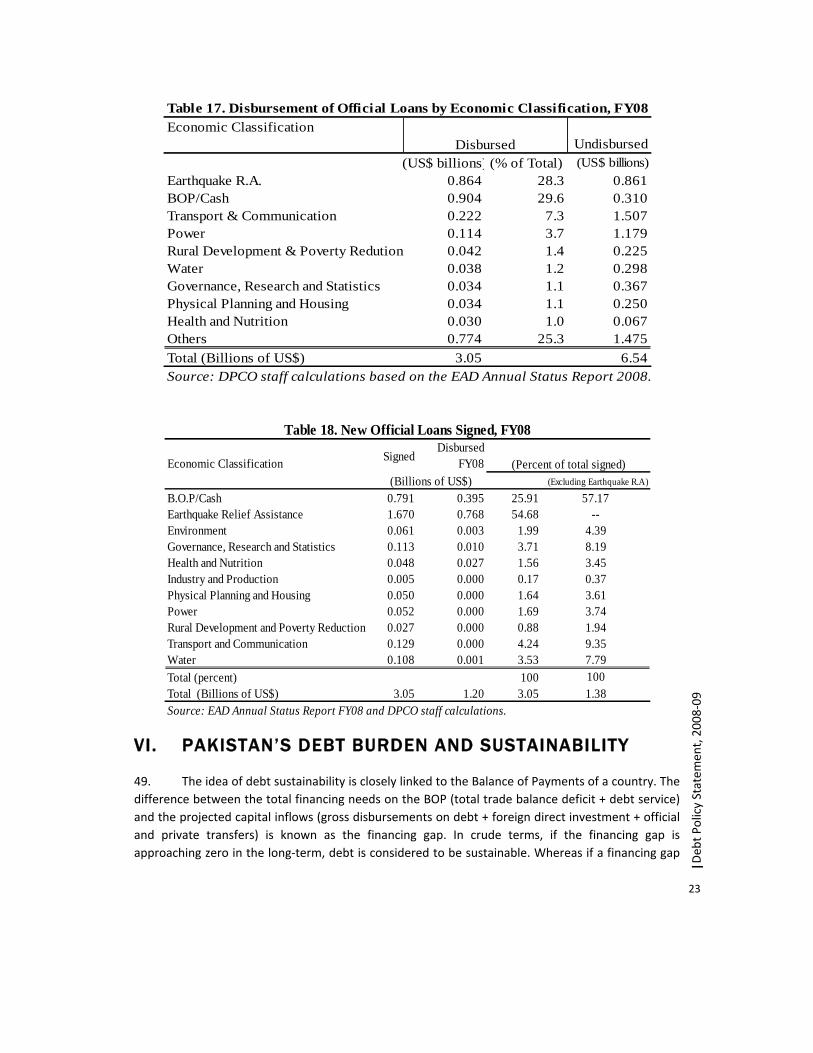
46. The total disbursements of official loans2 during 2007‐08 was US$ 3.05 billion with loans from bilateral sources accounting for US$ 233 million while the remaining US$ 2.8 billion was from multilateral sources. US$ 864 million or 28 percent of the loans disbursed were for Earthquake Relief & Assistance while the bulk of official disbursements were for BOP/cash. The total disbursement of official loans by economic classification is reported in Table 17. This table also shows the outstanding amounts of un‐disbursed loans by economic classification with the majority of the un‐disbursed funds falling under categories of Transport & Communication and Power.
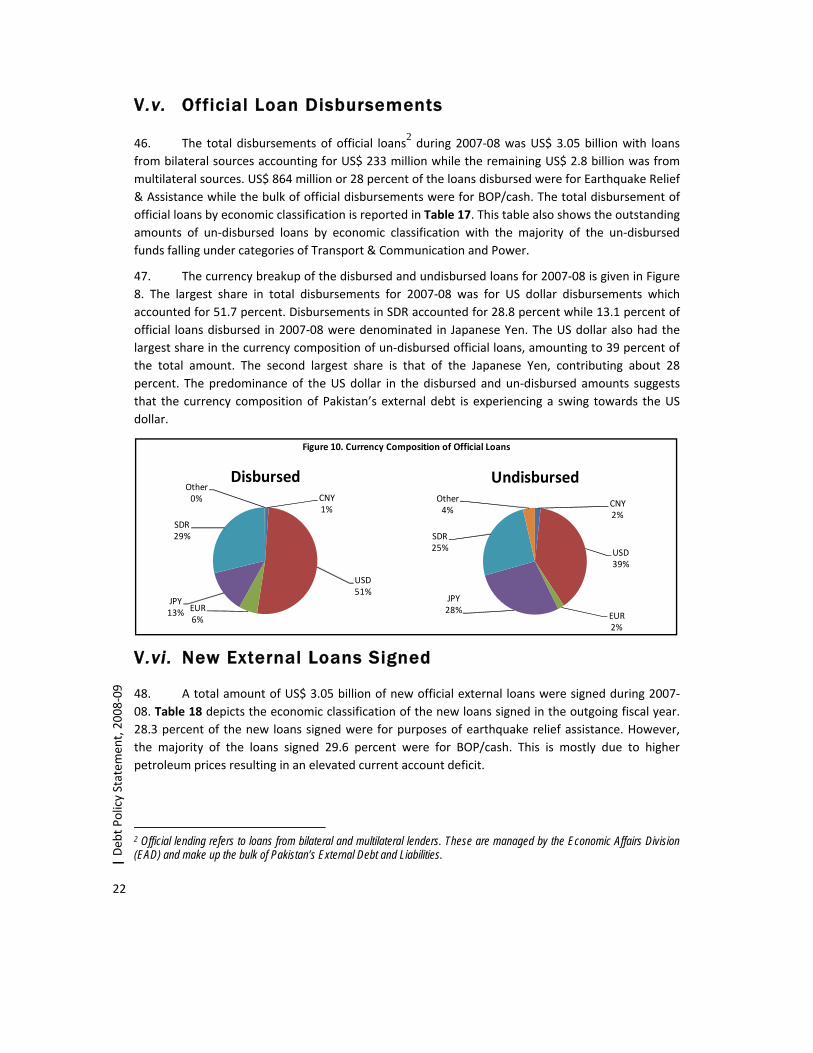
47. The currency breakup of the disbursed and undisbursed loans for 2007‐08 is given in Figure 8. The largest share in total disbursements for 2007‐08 was for US dollar disbursements which accounted for 51.7 percent. Disbursements in SDR accounted for 28.8 percent while 13.1 percent of official loans disbursed in 2007‐08 were denominated in Japanese Yen. The US dollar also had the largest share in the currency composition of un‐disbursed official loans, amounting to 39 percent of the total amount. The second largest share is that of the Japanese Yen, contributing about 28 percent. The predominance of the US dollar in the disbursed and un‐disbursed amounts suggests that the currency composition of Pakistan’s external debt is experiencing a swing towards the US dollar.
V .vi. New External Loans Signed
48. A total amount of US$ 3.05 billion of new official external loans were signed during 2007‐08. Table 18 depicts the economic classification of the new loans signed in the outgoing fiscal year. 28.3 percent of the new loans signed were for purposes of earthquake relief assistance. However, the majority of the loans signed 29.6 percent were for BOP/cash. This is mostly due to higher petroleum prices resulting in an elevated current account deficit.
2 Official lending refers to loans from bilateral and multilateral lenders. These are managed by the Economic Affairs Division (EAD) and make up the bulk of Pakistan’s External Debt and Liabilities.
23
|Deb
t Policy Statem
ent, 2008‐09
VI. PAKISTAN’S DEBT BURDEN AND SUSTAINABILITY
49. The idea of debt sustainability is closely linked to the Balance of Payments of a country. The difference between the total financing needs on the BOP (total trade balance deficit + debt service) and the projected capital inflows (gross disbursements on debt + foreign direct investment + official and private transfers) is known as the financing gap. In crude terms, if the financing gap is approaching zero in the long‐term, debt is considered to be sustainable. Whereas if a financing gap
Economic ClassificationUndisbursed
(US$ billions) (% of Total) (US$ billions)Earthquake R.A. 0.864 28.3 0.861BOP/Cash 0.904 29.6 0.310Transport & Communication 0.222 7.3 1.507Power 0.114 3.7 1.179Rural Development & Poverty Redution 0.042 1.4 0.225Water 0.038 1.2 0.298Governance, Research and Statistics 0.034 1.1 0.367Physical Planning and Housing 0.034 1.1 0.250Health and Nutrition 0.030 1.0 0.067Others 0.774 25.3 1.475Total (Billions of US$) 3.05 6.54Source: DPCO staff calculations based on the EAD Annual Status Report 2008.
Disbursed
Table 17. Disbursement of Official Loans by Economic Classification, FY08
Economic Classification SignedDisbursed
FY08
B.O.P/Cash 0.791 0.395 25.91 57.17Earthquake Relief Assistance 1.670 0.768 54.68 --Environment 0.061 0.003 1.99 4.39Governance, Research and Statistics 0.113 0.010 3.71 8.19Health and Nutrition 0.048 0.027 1.56 3.45Industry and Production 0.005 0.000 0.17 0.37Physical Planning and Housing 0.050 0.000 1.64 3.61Power 0.052 0.000 1.69 3.74Rural Development and Poverty Reduction 0.027 0.000 0.88 1.94Transport and Communication 0.129 0.000 4.24 9.35Water 0.108 0.001 3.53 7.79Total (percent) 100 100Total (Billions of US$) 3.05 1.20 3.05 1.38Source: EAD Annual Status Report FY08 and DPCO staff calculations.
Table 18. New Official Loans Signed, FY08
(Billions of US$) (Excluding Earthquake R.A)
(Percent of total signed)
24
| Deb
t Policy Statem
ent, 2008‐09
exists, it can be filled by resorting to additional borrowing, rescheduling and debt reduction, or by accumulating arrears. Such measures lead to an escalating debt burden and eventual unsustainability of debt.
50. In order to ensure sustainability, developing countries can place limits on funds allocated towards debt servicing, given the level of capital inflows. The three most useful constraints are: (a) foreign exchange constraint used to set an upper limit on the ratio of debt‐service to exports corresponding to an accepted/targeted level of current account deficit, (b) an upper limit set on the debt‐service to income ratio given an acceptable/targeted level of saving‐investment gap (savings constraint), and (c) the fiscal constraint which sets an upper limit for the ratio of debt service to government revenues given an acceptable/targeted fiscal deficit.
VI.i . Debt Sustainability Indicators
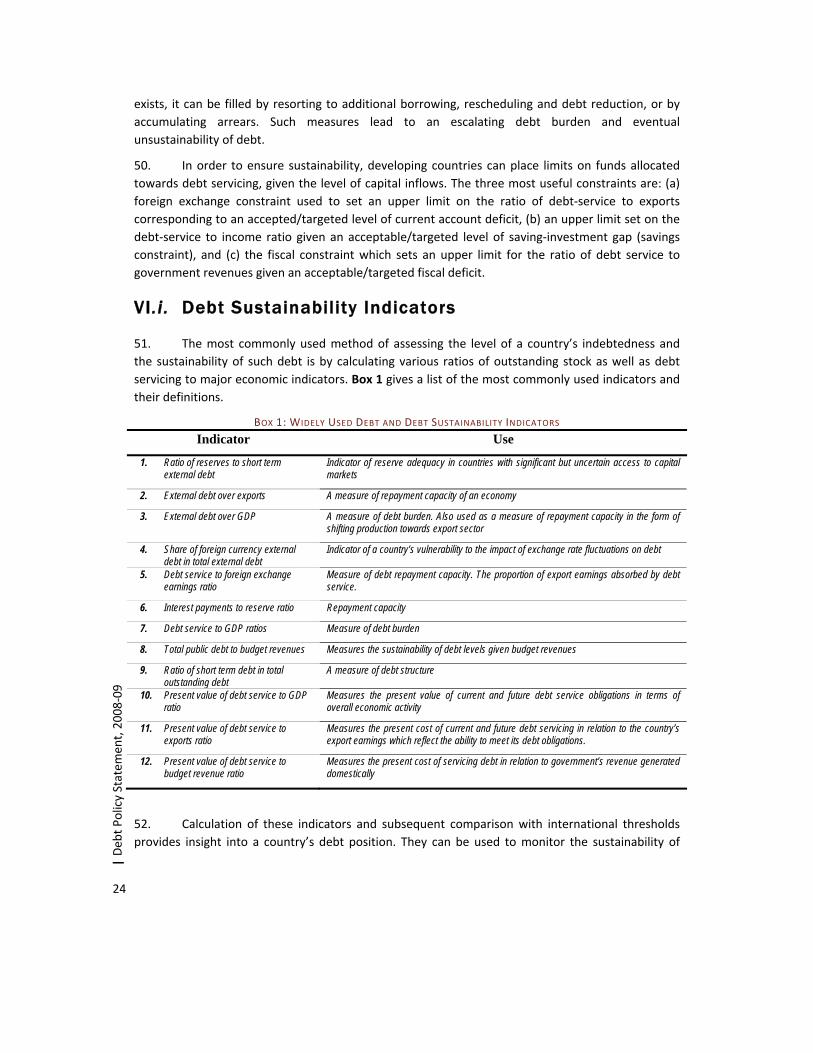
51. The most commonly used method of assessing the level of a country’s indebtedness and the sustainability of such debt is by calculating various ratios of outstanding stock as well as debt servicing to major economic indicators. Box 1 gives a list of the most commonly used indicators and their definitions.
BOX 1: WIDELY USED DEBT AND DEBT SUSTAINABILITY INDICATORS
Indicator Use
1. Ratio of reserves to short term external debt
Indicator of reserve adequacy in countries with significant but uncertain access to capital markets
2. External debt over exports A measure of repayment capacity of an economy
3. External debt over GDP A measure of debt burden. Also used as a measure of repayment capacity in the form of shifting production towards export sector
4. Share of foreign currency external debt in total external debt
Indicator of a country’s vulnerability to the impact of exchange rate fluctuations on debt
5. Debt service to foreign exchange earnings ratio
Measure of debt repayment capacity. The proportion of export earnings absorbed by debt service.
6. Interest payments to reserve ratio Repayment capacity
7. Debt service to GDP ratios Measure of debt burden
8. Total public debt to budget revenues Measures the sustainability of debt levels given budget revenues
9. Ratio of short term debt in total outstanding debt
A measure of debt structure
10. Present value of debt service to GDP ratio
Measures the present value of current and future debt service obligations in terms of overall economic activity
11. Present value of debt service to exports ratio
Measures the present cost of current and future debt servicing in relation to the country’s export earnings which reflect the ability to meet its debt obligations.
12. Present value of debt service to budget revenue ratio
Measures the present cost of servicing debt in relation to government’s revenue generated domestically
52. Calculation of these indicators and subsequent comparison with international thresholds provides insight into a country’s debt position. They can be used to monitor the sustainability of
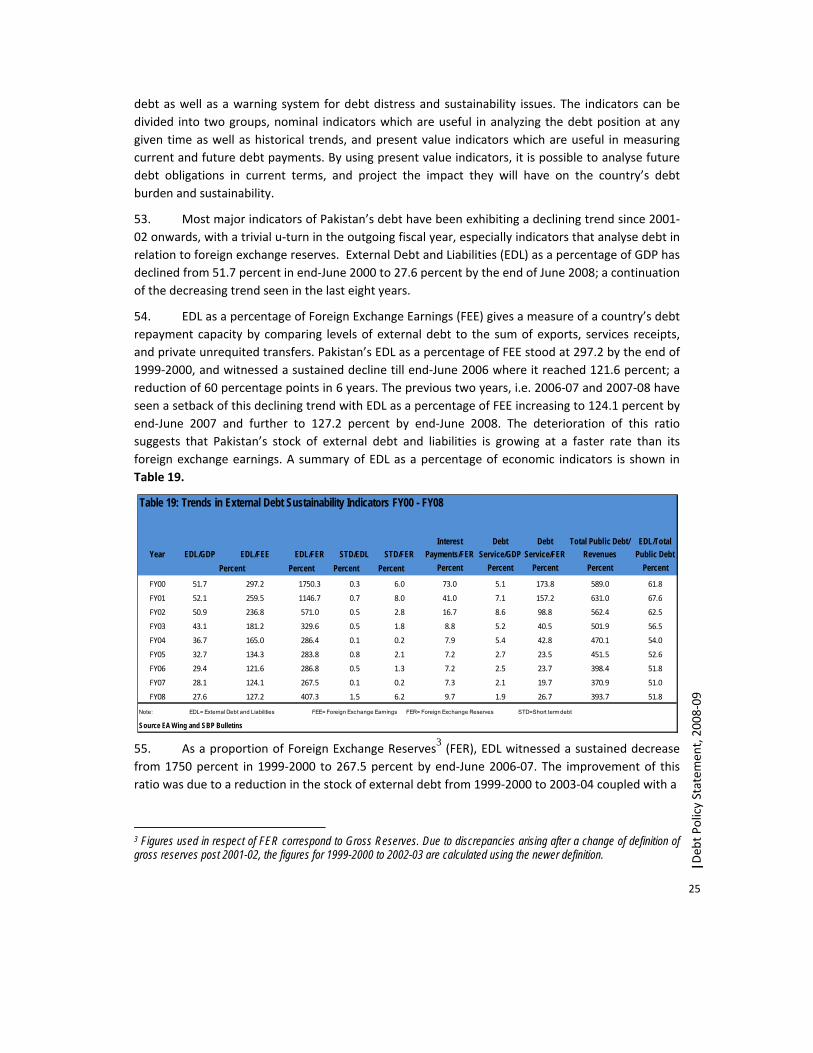
25
|Deb
t Policy Statem
ent, 2008‐09
Year EDL/GDP EDL/FEE EDL/FER STD/EDL STD/FERInterest
Payments/FERDebt
Service/GDPDebt
Service/FERTotal Public Debt/
RevenuesEDL/Total
Public DebtPercent Percent Percent Percent Percent Percent Percent Percent
FY00 51.7 297.2 1750.3 0.3 6.0 73.0 5.1 173.8 589.0 61.8
FY01 52.1 259.5 1146.7 0.7 8.0 41.0 7.1 157.2 631.0 67.6
FY02 50.9 236.8 571.0 0.5 2.8 16.7 8.6 98.8 562.4 62.5
FY03 43.1 181.2 329.6 0.5 1.8 8.8 5.2 40.5 501.9 56.5
FY04 36.7 165.0 286.4 0.1 0.2 7.9 5.4 42.8 470.1 54.0
FY05 32.7 134.3 283.8 0.8 2.1 7.2 2.7 23.5 451.5 52.6
FY06 29.4 121.6 286.8 0.5 1.3 7.2 2.5 23.7 398.4 51.8
FY07 28.1 124.1 267.5 0.1 0.2 7.3 2.1 19.7 370.9 51.0
FY08 27.6 127.2 407.3 1.5 6.2 9.7 1.9 26.7 393.7 51.8
Note: FEE= Foreign Exchange Earnings FER= Foreign Exchange Reserves STD=Short term debt
Table 19: Trends in External Debt Sustainability Indicators FY00 - FY08
Percent
EDL= External Debt and Liabilities
Source EA Wing and SBP Bulletins
debt as well as a warning system for debt distress and sustainability issues. The indicators can be divided into two groups, nominal indicators which are useful in analyzing the debt position at any given time as well as historical trends, and present value indicators which are useful in measuring current and future debt payments. By using present value indicators, it is possible to analyse future debt obligations in current terms, and project the impact they will have on the country’s debt burden and sustainability.
53. Most major indicators of Pakistan’s debt have been exhibiting a declining trend since 2001‐02 onwards, with a trivial u‐turn in the outgoing fiscal year, especially indicators that analyse debt in relation to foreign exchange reserves. External Debt and Liabilities (EDL) as a percentage of GDP has declined from 51.7 percent in end‐June 2000 to 27.6 percent by the end of June 2008; a continuation of the decreasing trend seen in the last eight years.
54. EDL as a percentage of Foreign Exchange Earnings (FEE) gives a measure of a country’s debt repayment capacity by comparing levels of external debt to the sum of exports, services receipts, and private unrequited transfers. Pakistan’s EDL as a percentage of FEE stood at 297.2 by the end of 1999‐2000, and witnessed a sustained decline till end‐June 2006 where it reached 121.6 percent; a reduction of 60 percentage points in 6 years. The previous two years, i.e. 2006‐07 and 2007‐08 have seen a setback of this declining trend with EDL as a percentage of FEE increasing to 124.1 percent by end‐June 2007 and further to 127.2 percent by end‐June 2008. The deterioration of this ratio suggests that Pakistan’s stock of external debt and liabilities is growing at a faster rate than its foreign exchange earnings. A summary of EDL as a percentage of economic indicators is shown in Table 19.
55. As a proportion of Foreign Exchange Reserves3 (FER), EDL witnessed a sustained decrease from 1750 percent in 1999‐2000 to 267.5 percent by end‐June 2006‐07. The improvement of this ratio was due to a reduction in the stock of external debt from 1999‐2000 to 2003‐04 coupled with a
3 Figures used in respect of FER correspond to Gross Reserves. Due to discrepancies arising after a change of definition of gross reserves post 2001-02, the figures for 1999-2000 to 2002-03 are calculated using the newer definition.
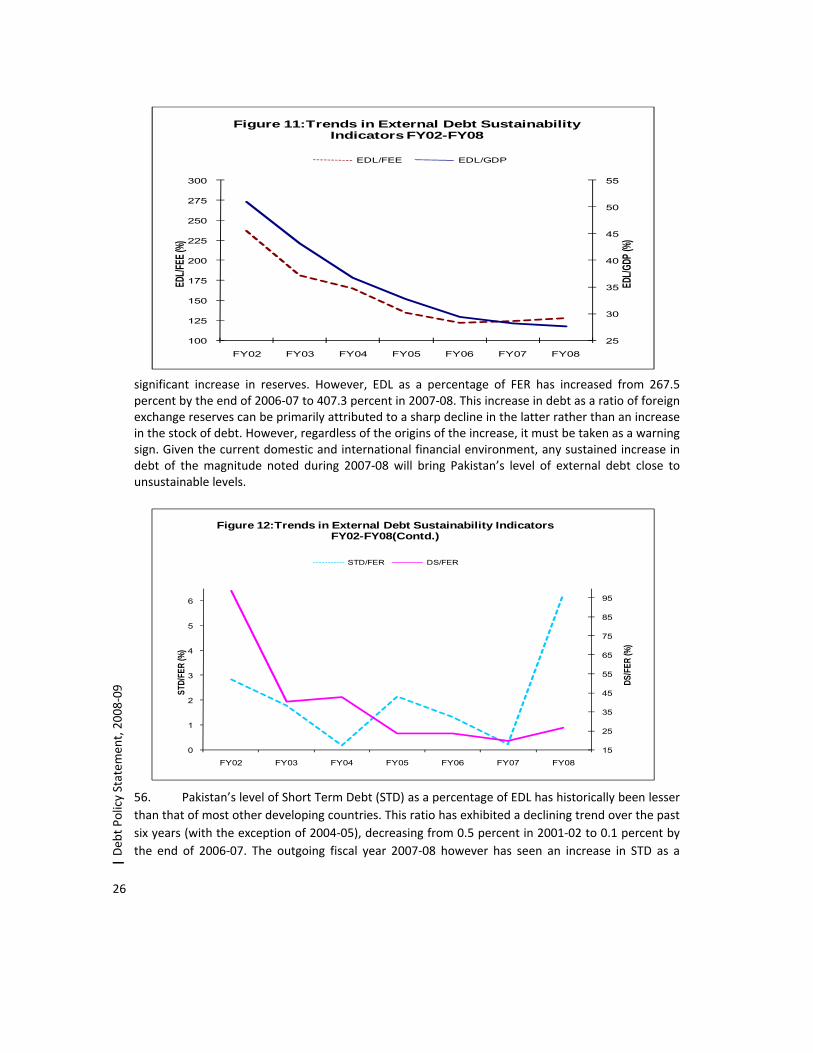
26
| Deb
t Policy Statem
ent, 2008‐09
25
30
35
40
45
50
55
100
125
150
175
200
225
250
275
300
FY02 FY03 FY04 FY05 FY06 FY07 FY08
EDL/G
DP (%
)
EDL/F
EE (%
)
Figure 11:Trends in External Debt Sustainability Indicators FY02-FY08
EDL/FEE EDL/GDP
15
25
35
45
55
65
75
85
95
0
1
2
3
4
5
6
FY02 FY03 FY04 FY05 FY06 FY07 FY08
DS/F
ER (%
)
STD/
FER
(%)
Figure 12:Trends in External Debt Sustainability IndicatorsFY02-FY08(Contd.)
STD/FER DS/FER
significant increase in reserves. However, EDL as a percentage of FER has increased from 267.5 percent by the end of 2006‐07 to 407.3 percent in 2007‐08. This increase in debt as a ratio of foreign exchange reserves can be primarily attributed to a sharp decline in the latter rather than an increase in the stock of debt. However, regardless of the origins of the increase, it must be taken as a warning sign. Given the current domestic and international financial environment, any sustained increase in debt of the magnitude noted during 2007‐08 will bring Pakistan’s level of external debt close to unsustainable levels.
56. Pakistan’s level of Short Term Debt (STD) as a percentage of EDL has historically been lesser than that of most other developing countries. This ratio has exhibited a declining trend over the past six years (with the exception of 2004‐05), decreasing from 0.5 percent in 2001‐02 to 0.1 percent by the end of 2006‐07. The outgoing fiscal year 2007‐08 however has seen an increase in STD as a
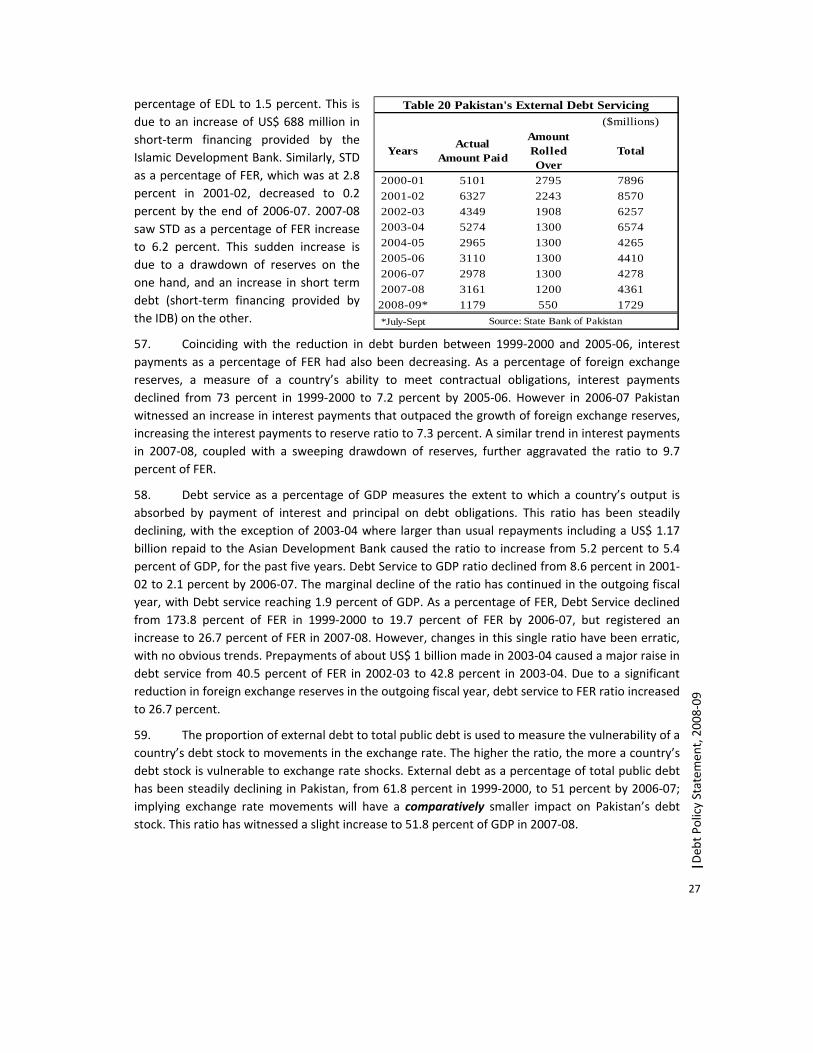
27
|Deb
t Policy Statem
ent, 2008‐09
($millions)
Years Actual Amount Paid
Amount Rolled Over
Total
2000-01 5101 2795 78962001-02 6327 2243 85702002-03 4349 1908 62572003-04 5274 1300 65742004-05 2965 1300 42652005-06 3110 1300 44102006-07 2978 1300 42782007-08 3161 1200 43612008-09* 1179 550 1729*July-Sept
Table 20 Pakistan's External Debt Servicing
Source: State Bank of Pakistan
percentage of EDL to 1.5 percent. This is due to an increase of US$ 688 million in short‐term financing provided by the Islamic Development Bank. Similarly, STD as a percentage of FER, which was at 2.8 percent in 2001‐02, decreased to 0.2 percent by the end of 2006‐07. 2007‐08 saw STD as a percentage of FER increase to 6.2 percent. This sudden increase is due to a drawdown of reserves on the one hand, and an increase in short term debt (short‐term financing provided by the IDB) on the other.
57. Coinciding with the reduction in debt burden between 1999‐2000 and 2005‐06, interest payments as a percentage of FER had also been decreasing. As a percentage of foreign exchange reserves, a measure of a country’s ability to meet contractual obligations, interest payments declined from 73 percent in 1999‐2000 to 7.2 percent by 2005‐06. However in 2006‐07 Pakistan witnessed an increase in interest payments that outpaced the growth of foreign exchange reserves, increasing the interest payments to reserve ratio to 7.3 percent. A similar trend in interest payments in 2007‐08, coupled with a sweeping drawdown of reserves, further aggravated the ratio to 9.7 percent of FER.
58. Debt service as a percentage of GDP measures the extent to which a country’s output is absorbed by payment of interest and principal on debt obligations. This ratio has been steadily declining, with the exception of 2003‐04 where larger than usual repayments including a US$ 1.17 billion repaid to the Asian Development Bank caused the ratio to increase from 5.2 percent to 5.4 percent of GDP, for the past five years. Debt Service to GDP ratio declined from 8.6 percent in 2001‐02 to 2.1 percent by 2006‐07. The marginal decline of the ratio has continued in the outgoing fiscal year, with Debt service reaching 1.9 percent of GDP. As a percentage of FER, Debt Service declined from 173.8 percent of FER in 1999‐2000 to 19.7 percent of FER by 2006‐07, but registered an increase to 26.7 percent of FER in 2007‐08. However, changes in this single ratio have been erratic, with no obvious trends. Prepayments of about US$ 1 billion made in 2003‐04 caused a major raise in debt service from 40.5 percent of FER in 2002‐03 to 42.8 percent in 2003‐04. Due to a significant reduction in foreign exchange reserves in the outgoing fiscal year, debt service to FER ratio increased to 26.7 percent.
59. The proportion of external debt to total public debt is used to measure the vulnerability of a country’s debt stock to movements in the exchange rate. The higher the ratio, the more a country’s debt stock is vulnerable to exchange rate shocks. External debt as a percentage of total public debt has been steadily declining in Pakistan, from 61.8 percent in 1999‐2000, to 51 percent by 2006‐07; implying exchange rate movements will have a comparatively smaller impact on Pakistan’s debt stock. This ratio has witnessed a slight increase to 51.8 percent of GDP in 2007‐08.
28
| Deb
t Policy Statem
ent, 2008‐09
VI- ii . Public Debt Sustainability Framework
60. The following framework based on the work of Blanchard is employed to assess the sustainability of an economy’s debt and fiscal situation with a set of assumptions about key macroeconomic variables. The notations used are given below:
B = Nominal Stock of Public Debt
I = Nominal Interest rate
P = Inflation rate
r = Real rate of Interest
Y= Level of real Output
y = Growth rate of Output
Z = Primary Deficit
b = Public Debt to GDP ratio
s = Acceptable level of Seiniorage
z= Primary Deficit to GDP ratio
The budget identity of the government can be thought of as the sum of primary deficit and interest payments being financed by an increase in monetary base and/or increase in borrowing. This can be illustrated as follows:
(1) Z +IB =dS +dB
Dividing both sides of Equation 1 by GDP gives the following equation:
(2) z + ib = s + db/PY (lower case letters indicate the proportion of GDP)
Since b = B/PY, the equation can be solved for db as follows:
(3) db = (z‐s) + b(r‐y)
61. Equation 3 states that the change in debt to income ratio can be described in terms of primary deficit to GDP ratio, the financing of deficits by base money, the growth rate of GDP, and the real interest rate. Solving the equation for db sheds some light on a country’s debt sustainability. It
29
|Deb
t Policy Statem
ent, 2008‐09
states that the change in debt ratio is equal to the primary deficit to GDP ratio minus the safe level of seiniorage plus the debt ratio multiplied by the real rate of interest on government debt minus the real rate of growth. A positive solution for db signifies an explosive debt situation, with a mounting debt burden that keeps feeding on itself; such a situation is obviously unsustainable. On the other hand, a negative or zero solution for the above equation can be interpreted as a sign of debt sustainability with the debt to income ratio decreasing every year and a lower amount of resources diverted to debt servicing each year. By adding data for Pakistan for 2007‐08 and projections for 2008‐09, the following results are obtained.
2007‐08: In the outgoing fiscal year, Pakistan registered a primary deficit (Revenues – Non‐interest expenditure) of 2.7 percent of GDP. Total public debt as a percentage of GDP stood at 56.3 percent
while the economy grew at 5.8 percent. The real interest rate on government debt is estimated4 to be ‐2.4. The amount of the deficit that can be safely financed (or a credible measure of seiniorage) is
thought to be 1.2 percent5. Plugging in the numbers provides us with the following equation:
db = 0.027 ‐ 0.012 +0.563(‐0.024 ‐0.058) db = 0.015 +0.563(‐0.082) db = 0.015 + (‐ 0.0462) db = ‐0.0312
62. The result from the above equation shows that Pakistan’s total public debt as a percentage of GDP is reducing by 3.1 percentage points. This would imply that Pakistan is not facing an explosive debt situation in the near future and the stock of total public debt in 2007‐08 was satisfactorily sustainable.
The terminal value of the debt‐to‐GDP ratio can be calculated by setting db = 0 (i.e. no change in the ratio), rearranging the terms and solving for b.
b = (z‐s) / (y‐r) b= 0.015 / 0.082 b= 0.183 or 18.3 percent of GDP
63. According to this framework, if the real GDP growth rate, primary deficit, and real rate of interest on government debt are taken to be constant, that is, at 2007‐08 level, the debt‐to‐GDP ratio will decrease every year, beginning by a 3.1 percentage point drop in the first year, till it reaches 18.3 percent of GDP. The scenario shows that the debt situation will become explosive if any of the following shocks are suffered: (a) a negative shock to GDP growth rate, bringing it down to less than one percent, (b) an increase in the real interest rate on government debt to higher than 2 percent, and (c) a massive imbalance in revenues and non interest government expenditure resulting in a primary deficit of approximately 5 percent of GDP. Given that the threat of close to zero GDP
4 Real interest rate on public debt is calculated by dividing the stock of debt in the previous period by interest payments made in the present period. Subtracting the price change from this nominal implied interest rate yields a real interest rate of -2.4 percent. 5 “Money Demand and Seigniorage-Maximizining Inflation” Easterly, Mauro, Hebbel, World Bank, WP1049, 1992
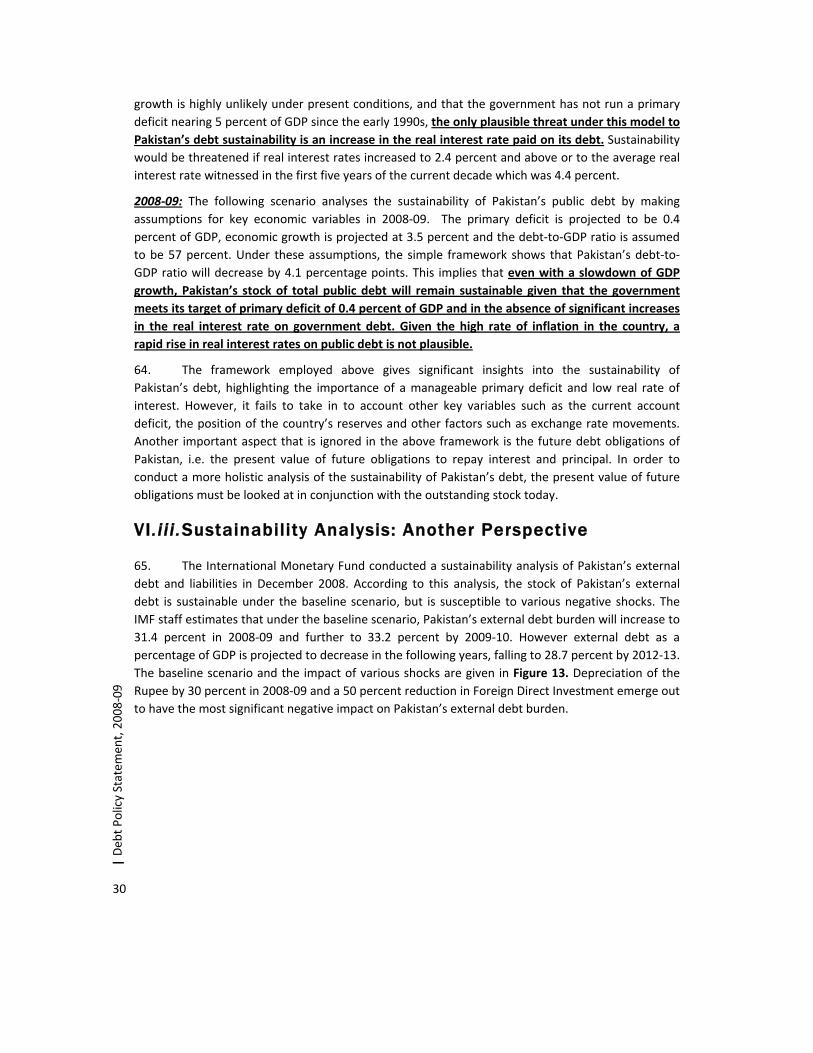
30
| Deb
t Policy Statem
ent, 2008‐09
growth is highly unlikely under present conditions, and that the government has not run a primary deficit nearing 5 percent of GDP since the early 1990s, the only plausible threat under this model to Pakistan’s debt sustainability is an increase in the real interest rate paid on its debt. Sustainability would be threatened if real interest rates increased to 2.4 percent and above or to the average real interest rate witnessed in the first five years of the current decade which was 4.4 percent.
2008‐09: The following scenario analyses the sustainability of Pakistan’s public debt by making assumptions for key economic variables in 2008‐09. The primary deficit is projected to be 0.4 percent of GDP, economic growth is projected at 3.5 percent and the debt‐to‐GDP ratio is assumed to be 57 percent. Under these assumptions, the simple framework shows that Pakistan’s debt‐to‐GDP ratio will decrease by 4.1 percentage points. This implies that even with a slowdown of GDP growth, Pakistan’s stock of total public debt will remain sustainable given that the government meets its target of primary deficit of 0.4 percent of GDP and in the absence of significant increases in the real interest rate on government debt. Given the high rate of inflation in the country, a rapid rise in real interest rates on public debt is not plausible.
64. The framework employed above gives significant insights into the sustainability of Pakistan’s debt, highlighting the importance of a manageable primary deficit and low real rate of interest. However, it fails to take in to account other key variables such as the current account deficit, the position of the country’s reserves and other factors such as exchange rate movements. Another important aspect that is ignored in the above framework is the future debt obligations of Pakistan, i.e. the present value of future obligations to repay interest and principal. In order to conduct a more holistic analysis of the sustainability of Pakistan’s debt, the present value of future obligations must be looked at in conjunction with the outstanding stock today.
VI. iii . Sustainability Analysis: Another Perspective
65. The International Monetary Fund conducted a sustainability analysis of Pakistan’s external debt and liabilities in December 2008. According to this analysis, the stock of Pakistan’s external debt is sustainable under the baseline scenario, but is susceptible to various negative shocks. The IMF staff estimates that under the baseline scenario, Pakistan’s external debt burden will increase to 31.4 percent in 2008‐09 and further to 33.2 percent by 2009‐10. However external debt as a percentage of GDP is projected to decrease in the following years, falling to 28.7 percent by 2012‐13. The baseline scenario and the impact of various shocks are given in Figure 13. Depreciation of the Rupee by 30 percent in 2008‐09 and a 50 percent reduction in Foreign Direct Investment emerge out to have the most significant negative impact on Pakistan’s external debt burden.
31
|Deb
t Policy Statem
ent, 2008‐09
VII. GUARANTEES
66. Contingent liabilities are costs which the government will have to pay if a particular even occurs. These are obligations triggered by a discrete but uncertain event. Relative to government policies, the probability of a contingency occurring and the magnitude of the required public outlays are exogenous (such as natural disasters) or endogenous (such as implications of market institutions and government programs for moral hazard in the markets). Contingent liabilities are therefore not
Source: IMF Country Report, 2009
Figure 13: Pakistan's External Debt Sustainability
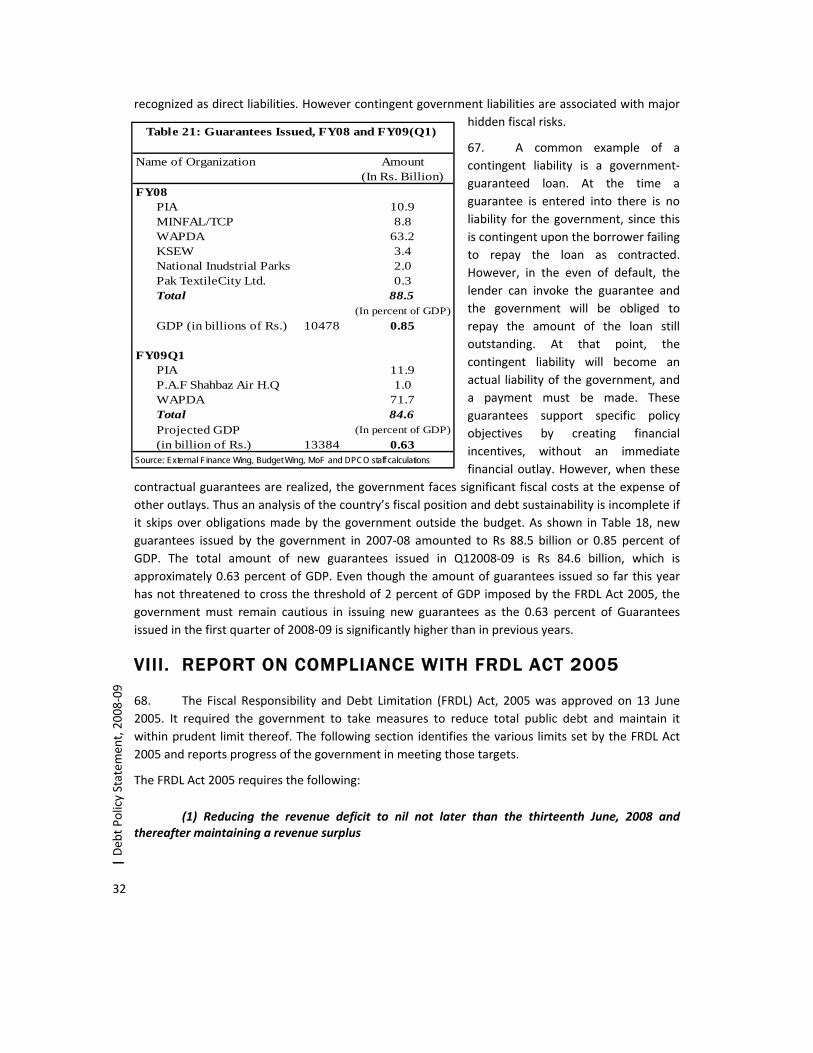
32
| Deb
t Policy Statem
ent, 2008‐09
Name of Organization Amount(In Rs. Billion)
FY08PIA 10.9MINFAL/TCP 8.8WAPDA 63.2KSEW 3.4National Inudstrial Parks 2.0Pak TextileCity Ltd. 0.3Total 88.5
(In percent of GDP)GDP (in billions of Rs.) 10478 0.85
FY09Q1PIA 11.9P.A.F Shahbaz Air H.Q 1.0WAPDA 71.7Total 84.6Projected GDP (In percent of GDP)(in billion of Rs.) 13384 0.63
Table 21: Guarantees Issued, FY08 and FY09(Q1)
Source: External Finance Wing, Budget Wing, MoF and DPCO staff calculations
recognized as direct liabilities. However contingent government liabilities are associated with major hidden fiscal risks.
67. A common example of a contingent liability is a government‐guaranteed loan. At the time a guarantee is entered into there is no liability for the government, since this is contingent upon the borrower failing to repay the loan as contracted. However, in the even of default, the lender can invoke the guarantee and the government will be obliged to repay the amount of the loan still outstanding. At that point, the contingent liability will become an actual liability of the government, and a payment must be made. These guarantees support specific policy objectives by creating financial incentives, without an immediate financial outlay. However, when these
contractual guarantees are realized, the government faces significant fiscal costs at the expense of other outlays. Thus an analysis of the country’s fiscal position and debt sustainability is incomplete if it skips over obligations made by the government outside the budget. As shown in Table 18, new guarantees issued by the government in 2007‐08 amounted to Rs 88.5 billion or 0.85 percent of GDP. The total amount of new guarantees issued in Q12008‐09 is Rs 84.6 billion, which is approximately 0.63 percent of GDP. Even though the amount of guarantees issued so far this year has not threatened to cross the threshold of 2 percent of GDP imposed by the FRDL Act 2005, the government must remain cautious in issuing new guarantees as the 0.63 percent of Guarantees issued in the first quarter of 2008‐09 is significantly higher than in previous years.
VIII. REPORT ON COMPLIANCE WITH FRDL ACT 2005
68. The Fiscal Responsibility and Debt Limitation (FRDL) Act, 2005 was approved on 13 June 2005. It required the government to take measures to reduce total public debt and maintain it within prudent limit thereof. The following section identifies the various limits set by the FRDL Act 2005 and reports progress of the government in meeting those targets.
The FRDL Act 2005 requires the following:
(1) Reducing the revenue deficit to nil not later than the thirteenth June, 2008 and thereafter maintaining a revenue surplus
33
|Deb
t Policy Statem
ent, 2008‐09
69. Revenue balance (Total Revenue minus current expenditure) not only breached the performance target but, in fact, deteriorated significantly during the fiscal year 2007‐08. As against the target of achieving revenue deficit to zero, the fiscal year 2007‐08 has ended up with an all time high revenue deficit of 3.4 percent of GDP. In other words, current expenditure exceeded the total revenue by Rs 359 billion or 3.4 percent of GDP, mainly on account of massive slippages that took place in interest payments and oil and power subsidies during 2007‐08. Revenue deficit is also the dis‐saving of the government which contributed to reducing overall national saving rate (national savings as percent of GDP). Serious corrective measures are required to bring current expenditures at least at the level of total revenue. In other words, total revenue should be sufficient to finance at least the current expenditure and if there is a need to borrow, the government can borrow for development purpose. It is in this perspective that the government has targeted to bring revenue deficit down to Rs 152 billion or 1.1 percent of GDP in 2008‐09. It is expected that the government will achieve the target of bringing revenue deficit to zero by 2009‐10 and will maintain revenue surplus thereafter.
(2) Ensure “that within a period of ten financial year, beginning from the first July, 2003 and ending on thirtieth June, 2013, the total public debt at the end of the tenth financial year does not exceed sixty percent of the estimated gross domestic product for that year and thereafter maintaining the total public debt below sixty percent of gross domestic product for any given year.”
70. Government has already met and actually exceeded the requirement on the level of public debt as a percentage of GDP. The Government has achieved the goal of reducing public debt as percentage of GDP below 60 percent well ahead of time. Furthermore, this limit has been realized within three financial years instead of ten years as envisaged by the FRDL Act. At the beginning of July 2003, the total public debt stood at 75.1 percent of GDP while at the end of June 2008, the same figure stood at 56.3 percent of GDP. By the end‐September 2008, the public debt‐to‐GDP ratio stood at 49.1 percent of the projected GDP for 2008‐09.
(3) Ensure “that in every financial year, beginning from the first July, 2003, and ending on the thirtieth June 2013, the total public debt is reduced by no less than two and a half percent of the estimated gross domestic product for any given year, provided that social and poverty alleviation related expenditures are not reduced below 4.5 percent of the estimated gross domestic product for any given year and budgetary allocation to education and health, will be doubled from the existing level in terms of percentage of gross domestic product during the next ten years.”
71. The government did not meet this requirement in fiscal year 2007‐08. Public debt stood at 55.2 percent of GDP by end June 2007 but increased to 56.3 percent of GDP by end‐June 2008, which implies a 1.3 percentage point rise in the public debt‐to‐GDP ratio instead of a reduction of 2.5 percentage points. Even though the reduction in public debt‐to‐GDP ratio did not meet the target of 2.5 percentage points per annum, this part of the FRDL Act 2005 was meant to be a vehicle in achieving the more important target of reducing the public debt‐to‐GDP ratio to less than 60
34
| Deb
t Policy Statem
ent, 2008‐09
percent within a ten year span. Achieving the target of debt‐to‐GDP ratio ahead of time notwithstanding, the reversal of the declining trend in debt burden is a serious matter. Instead of reducing public debt by 2.5 percentage points, it has, infact, registered an increase of 1.3 percentage points. The government should be vigilant in ensuring that the rise in the debt to GDP ratio during 2007‐08 is not allowed to continue otherwise it will breach the 60 percent targeted level as required by the FRDL Act 2005. By end‐September 2008, the public debt‐to‐GDP ratio declined to 49.1 percent of the projected GDP for 2008‐09. An important aspect about fiscal prudence is that it is not achieved at the expense of reduction in social sector and poverty related expenditure. These expenditures were 4.9 percent of GDP in 2006‐07 but increased to 5.5 percent of GDP in 2007‐08. Poverty and social sector related expenditure is targeted at 6 percent of GDP for the year 2008‐2009. It means legal obligation to keep these expenditures at 4.5 percent of GDP has been met with great ease. Expenditure on education and health are also growing briskly, and there are indications that expenditure on these items will be doubled in terms of percentage of GDP by 2012‐13.
(4) Not issue “new guarantees, including those for rupee lending, bonds, rates of return, output purchase agreements and all other claims and commitments that may be prescribed, from time to time, for any amount exceeding two percent of the estimated gross domestic product in any financial year: Provided that the renewal of existing guarantees shall be considered as issuing a new guarantee.”
72. The government remained within this required limit of 2% of GDP by issuing Rs. 88.5 billion new guarantees which is 0.85% of GDP for fiscal year 2007‐08. For the first quarter of the current fiscal year of 2008‐09, the government has issued Rs. 84.6 billion of new guarantees which amount to 0.63% of GDP which is a fraction of what is required by the FRDL 2005.
IX. DEBT MANAGEMENT STRATEGY
73. There is no formula for successful debt management and Pakistan needs to draw lessons from international best practices. Some of the factors critical to effective debt management include political commitment and a clear legal framework covering external and domestic debt, management of existing debt and new borrowing, and coordination among government agencies to ensure coherence with overall policies for economic growth.
IX .i . Domestic Debt Strategies
74. In emerging economies like Pakistan, domestic debt markets are typically in their nascent stages. This hampers the development and accessibility of alternative sources of cheaper and lower risk finance to the government and confines its options to manage risk through restructuring operations. Overcoming structural weaknesses and creating strategies for managing borrowing from domestic sources should be a core concern.
75. The validation for a Domestic Debt Strategy is additionally highlighted by a steady need to move towards self‐reliance, in which case, the domestic debt market is expected to become an ever
35
|Deb
t Policy Statem
ent, 2008‐09
more vital funding source for the government. It is therefore imperative that the government securities market be developed and strengthened for that purpose on a priority basis. Towards this end, some action plans have been put forward that aim at enhancing the debt markets of the country:
Condense the number of fragmentations within broad funding sources
76. The extension of yield curve up to 30‐Year in 2006‐07 and newly issued 7‐Year PIB in the ongoing fiscal year is helpful in meeting the differing maturity preferences of both short and long term investors. On the other hand, a plethora of schemes resembling in tenor, tax treatment and profit payments administered by CDNS needs to be consolidated in order to defragment this expensive borrowing source.
Regularly publish auction calendars
77. T‐bills auctions are conducted on a fortnightly basis whereas PIB auctions experience ad hoc treatment. The introduction of an issuance calendar for PIBs in the current fiscal year has not met momentous success as volatility has restricted the government to tap the PIB market. Still the practice of issuing a calendar, announcing its intentions in terms of volumes and tenors, each fiscal year should be developed and the stipulated timings should observe utmost adherence. Another option can be a quarterly update of the calendar in view of government’s financing requirements.
Reduce the communication gap between key market players and the government
78. Even though this gap has been largely abridged in the course of recent banking/liquidity crisis at the beginning of the Q2 2008‐09, a strong need is still felt to pursue a fully developed communication strategy to continually monitor and gauge the market sentiments. Apart from issuing an auction calendar, regular and open dialogue with major participants in the government securities auctions should be an integral part of the strategy.
Increase the frequency of auctions by reducing pre‐set volumes
79. Conducting more frequent, but smaller volume (as opposed to less frequent, but larger volume) auctions can improve price discovery and reduce inventory risk for primary dealers (PDs). This approach also assists the government in diversifying its funding costs across time. Then again too frequent auctions can dampen incentives for outright secondary trading and add to the likelihood that some PDs may turn down to participate in auctions once in a while, thereby reducing price tension. An appropriate mix of frequency and volume needs to be reached. For instance, 2006‐07 witnessed seven auctions followed by five auctions in 2007‐08 with just one auction since the beginning of 2008‐09. This frequency should be enhanced by conducting nine to ten auctions in a year spreading the targeted amount over a larger number of auctions.
36
| Deb
t Policy Statem
ent, 2008‐09
Regularly monitor the performance of primary dealers (PDs)
80. The auction‐wise performance evaluation of PDs for MTBs and PIBs is currently being done by the DPCO on a monthly basis. However, this practice should continue with the additional feature of issuance of a letter of performance to the dealers exhibiting weak performance. In this note, it should be mentioned that in case of no improvement on its part, the corresponding PD shall be suspended from the system.
Ensure primary dealers (PDs) quote two‐way pricing
81. Although PDs are required to quote two‐way prices representing market sentiment, this is not always the case. The secondary market is 90% indication‐driven limiting the market’s true potential. Each PD is required to maintain a 50 basis point bid/ask spread when acting as a market maker. Market conditions, however, often lead to much greater quoted spreads. Stringent rules in addition to a strict monitoring mechanism should be put in place to ensure two‐way price quotation as well as market making within predetermined spread by PDs.
Expand the primary dealer (PD) system by including nonbank institutions
82. The PD system is largely skewed towards the banking sector. Commercial banks typically demand short‐term securities for their liquidity management needs reinforced by statutory reserve requirements. Nonbank institutional investors can play a major role in developing government securities market. Contractual savings institutions, with their longer‐term orientation, are critical for developing the extended yield curve. State Life Insurance Company (SLIC) and Employees Old Age Benefits Institution (EOBI) can be potential entrants in the PD system to represent the nonbank market, owing to their strong history of active trading in the secondary market and well‐built equity positions. The induction of these two institutional investors in the system by removing regulatory impediments will, in the first place, surely boost up the long end of the market in the short run. Nevertheless, they should not be treated as captive sources of government funding and should be free from compulsory investment requirements.
Re‐open previous PIB issues to improve liquidity
83. Since 2006, previous issues are consistently being re‐opened with the objective of improving the liquidity of each issue in the market. This practice of establishing single issue per fiscal year has resulted in ensuring higher issue‐wise liquidity in the market thus enabling efficient pricing for government securities and should be continued in the future. This can be done across fiscal years too such as a 10‐Year bond can be reopened in three years’ time as on‐the‐run 7‐Year bond.
Buyback PIBs when needed to ensure ample market liquidity
84. Buyback operations are useful in increasing the fungibility of benchmark issues by reducing the number of issues outstanding and concentrating remaining issues on a few benchmark bonds.
37
|Deb
t Policy Statem
ent, 2008‐09
Recently, an amendment to the PIB rules has been made whereby government now has the option to buy back PIBs at the prevailing market prices determined through a competitive auction process. This opportunity should be exercised now and then or when a need to do so arises, by buying back rump issues to build liquidity in the market.
Phase‐out HTM category
85. The Held to Maturity (HTM) category introduced in 2002 by the SBP allows banks to hold bonds at book value and not at mark‐to‐market value. In a rising interest rate environment, banks are incentivized to hold bonds to maturity and not trade them to avoid book losses. Consequently, a dearth of government paper supply to the market results in thin and illiquid secondary markets. One possible solution is to completely phase‐out this category and to require banks report the outstanding bonds based on prevailing market prices. This step will enable efficient secondary market trading.
Increase the issuance of Sukuks
86. The promising growth prospects of Islamic banking industry have been timely grabbed by issuing a 3‐Year Ijara Sukuk this year. Reasonable response to the debut sovereign issue goes handy in forging the commitment of the government to unveil this long overlooked segment and to widen the investor base. Sukuks are equally useful for Islamic market as a liquidity management instrument.
Promote pension reforms and strengthen the insurance and mutual funds sectors
87. Pension funds and life insurance companies have the potential to stimulate the development of the government securities market because they enjoy economies of scale and have access to highly professional asset management services. With the recent launch of REITs and Private Equity Venture, pension funds are expected to grow by leaps and bounds given the strong tendency of these investment vehicles to invest in riskier asset classes. However, a number of preconditions include most importantly, checking if they have reached a mature stage of development beyond the buy‐and‐hold strategies that characterize the early years of operation. Even when mature, pension fund and life insurance companies must adopt sophisticated asset allocation strategies and emphasize the benefits of diversified portfolios and professional asset management. Mutual funds combine the benefits of portfolio diversification and professional management with low operating costs. Under domestic laws, mutual funds are treated as a ‘Pass Through Entity’ being exempt from tax. Accordingly, fixed income funds earning income from aforesaid sources remain exempt from tax if it distributes 90 percent of its profits. In such cases, mutual funds might become dedicated vehicles for investing pension fund and insurance company asset in long‐term securities in an effort to avoid the tax on financial transactions. In the same way, imperative role can be played by Islamic insurance (Takaful) and mutual funds (Modarabas) industry.
38
| Deb
t Policy Statem
ent, 2008‐09
Promote corporate bond market
88. Corporate debt market could act as a buffer in the face of sudden interruptions in bank credit or international capital flows. A key factor influencing the deficiency of TFC issuance is the twofold role of commercial banks of being the principal investor as well as the main issuer of debt securities. If mutual funds are encouraged to approach corporates directly for issuance of corporate bonds in which they commit to invest, the confined market dominated by banks will give way to a broader investor base that would consecutively, contribute to a deeper bond market. A host of other factors include inefficient pricing, lack of presence of international credit rating agencies, cumbersome primary issuance guidelines, processes and costs. So far in this regard, the maximum initial listing fee for debt instruments has been reduced by Karachi Stock Exchange from Rs 0.5 million to Rs 0.1 million and the stamp duty on debentures and commercial papers has been reduced by the Government of Punjab. The later is also under consideration of provincial governments and administration of Islamabad Capital Territory. In addition to this, the feasibility of getting a foreign recognized rating agency to operate in Pakistan should be assessed. Shelf Registration for corporate bonds is currently allowed by SECP, with an embedded feature of lengthy approval process. Lawyers and investment bankers should be considered for handing over this responsibility. Above all, corporations should be encouraged to publicly issue debt rather than resorting to private placements by easing regulatory interface. Despite regulatory reforms, there is a strong need to set up a corporate bond database having complete information with trading platforms to facilitate investors.
Develop market infrastructure
89. The absence of a Real Time Gross Settlement System (RTGS) is a significant hindrance to the efficiency of debt capital market. PRISM (Pakistan Real Time Inter‐bank Settlement Mechanism) has been planned which will allow shift from traditional paper‐based, end‐of‐the‐day settlement system to electronic payment system for large value, low volume inter‐bank funds’ transfers and settlements. However, this proposal is awaiting implementation. Its timely execution should be given due consideration so as to make the settlement system faster and more reliable.
Convert the NSS instruments into marketable instruments
90. The highly debated issue of non‐marketability of NSS schemes can be counterbalanced by converting these instruments into marketable securities such as PIBs and MTBs to include the share of retail investors in the sovereign debt market.
Launch new initiatives
91. Some new initiatives under the NSS include short term instruments targeted to households and foreign currency denominated instruments for expatriate Pakistanis. There are also plans to induce public‐sector enterprises to invest surplus cash that they currently have on deposit in commercial banks in a new short‐term and non‐tradable instrument, Government Commercial Paper
39
|Deb
t Policy Statem
ent, 2008‐09
(GCP). These programs will surely help in branching out government financing tools. However, care should be taken in aggressive marketing of such instruments as they can result in drainage of bank deposits.
IX . ii . External Borrowing Strategy
92. The key objective of any strategy concerning borrowing from external sources is to meet the financing needs of the economy while ensuring debt sustainability. Therefore an effective external borrowing strategy, in perspective of its financing requirements, should place limits on a country’s external borrowing given its macroeconomic fundamentals and the vulnerability of its debt stock to exogenous and endogenous shocks.
93. The amount of Pakistan’s external borrowing must be defined by the financing needs of the government, which arise from financing of the current account deficit, amortization payments, and build‐up of additional foreign exchange reserves. Furthermore, Pakistan’s medium‐term development priorities and their required financing must be taken in to account. The amount of the financing requirement that can be partly met by non‐debt creating inflows such as foreign direct investment, portfolio investment, budgetary grants, privatization proceeds and Global Depository Receipts. The remainder of the financing needs should be catered to by bilateral and multilateral assistance and the floatation of Sovereign bonds.
94. A debt strategy should provide guidelines to determine the size of the various components of the external debt borrowing. Such guidelines must include a preferred shape of the maturity profile, and an appropriate balance between concessional and non‐concessional debt. Concessional debt has a lower cost of borrowing, but imposes certain restraints on the economy through comparatively stringent terms and conditions. On the other hand, non‐concessional debt has relaxed terms and conditions but comes at a higher cost of capital. Given exchange rate fluctuations in the outgoing fiscal year and the significant impact they have had on Pakistan’s external debt, an appropriate currency mix must also be part of a borrowing strategy to reduce the susceptibility of our external debt stock to movements in the international currency market. Close attention must be paid to the amortization schedule of new loans in order to insure against unnecessarily high debt service obligations falling in any particular year or within short interval of consecutive years.
95. A borrowing strategy which ensures a sustainable debt burden must take into account all these factors, and should have the ability to evolve according to changes in macroeconomic fundamentals including external inflows and the strength of the Rupee as negative shocks to these factors threaten the sustainability of external debt. Continuous monitoring of the stock of debt in order to ascertain the current and projected position of the debt portfolio vis‐à‐vis macroeconomic indicators has to be undertaken in order to ensure the sustainability of the external debt burden. By calculating the external debt stock as a percentage of key macroeconomic variables including GDP, foreign exchange reserves, and export earnings and making similar projections for the medium to long‐term, and comparing them to internationally acceptable thresholds, the government can successfully monitor the sustainability of its debt portfolio.
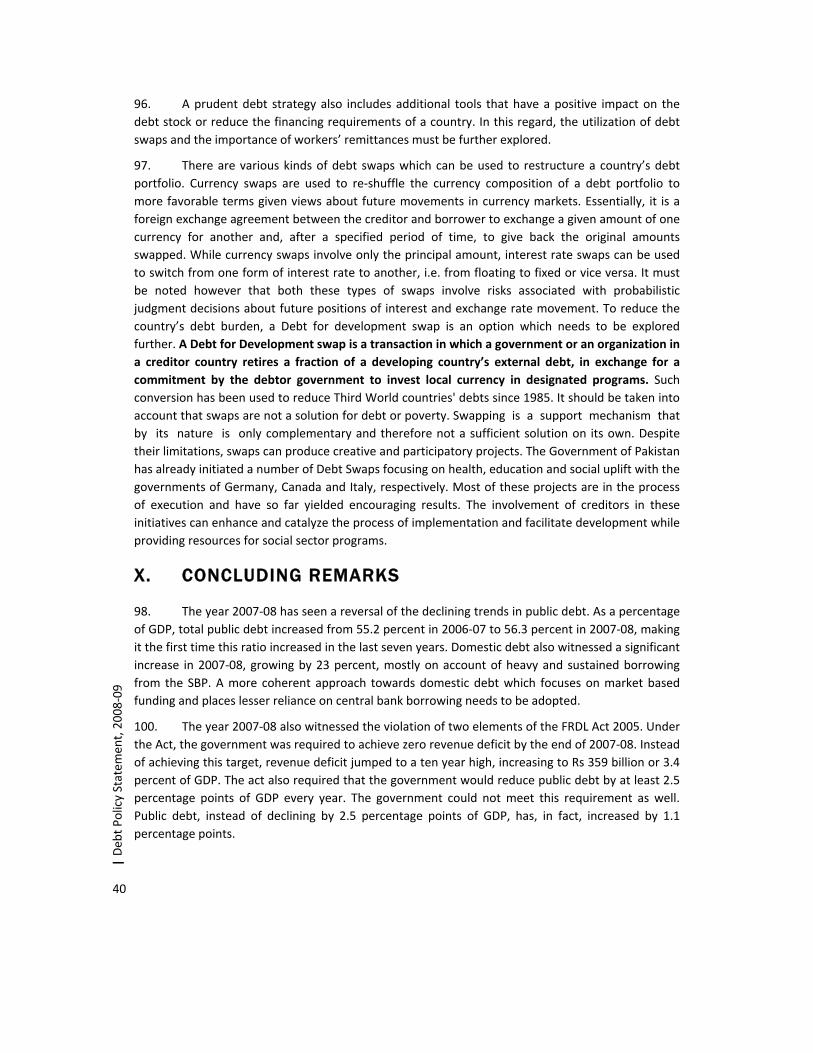
40
| Deb
t Policy Statem
ent, 2008‐09
96. A prudent debt strategy also includes additional tools that have a positive impact on the debt stock or reduce the financing requirements of a country. In this regard, the utilization of debt swaps and the importance of workers’ remittances must be further explored.
97. There are various kinds of debt swaps which can be used to restructure a country’s debt portfolio. Currency swaps are used to re‐shuffle the currency composition of a debt portfolio to more favorable terms given views about future movements in currency markets. Essentially, it is a foreign exchange agreement between the creditor and borrower to exchange a given amount of one currency for another and, after a specified period of time, to give back the original amounts swapped. While currency swaps involve only the principal amount, interest rate swaps can be used to switch from one form of interest rate to another, i.e. from floating to fixed or vice versa. It must be noted however that both these types of swaps involve risks associated with probabilistic judgment decisions about future positions of interest and exchange rate movement. To reduce the country’s debt burden, a Debt for development swap is an option which needs to be explored further. A Debt for Development swap is a transaction in which a government or an organization in a creditor country retires a fraction of a developing country’s external debt, in exchange for a commitment by the debtor government to invest local currency in designated programs. Such conversion has been used to reduce Third World countries' debts since 1985. It should be taken into account that swaps are not a solution for debt or poverty. Swapping is a support mechanism that by its nature is only complementary and therefore not a sufficient solution on its own. Despite their limitations, swaps can produce creative and participatory projects. The Government of Pakistan has already initiated a number of Debt Swaps focusing on health, education and social uplift with the governments of Germany, Canada and Italy, respectively. Most of these projects are in the process of execution and have so far yielded encouraging results. The involvement of creditors in these initiatives can enhance and catalyze the process of implementation and facilitate development while providing resources for social sector programs.
X. CONCLUDING REMARKS
98. The year 2007‐08 has seen a reversal of the declining trends in public debt. As a percentage of GDP, total public debt increased from 55.2 percent in 2006‐07 to 56.3 percent in 2007‐08, making it the first time this ratio increased in the last seven years. Domestic debt also witnessed a significant increase in 2007‐08, growing by 23 percent, mostly on account of heavy and sustained borrowing from the SBP. A more coherent approach towards domestic debt which focuses on market based funding and places lesser reliance on central bank borrowing needs to be adopted.
100. The year 2007‐08 also witnessed the violation of two elements of the FRDL Act 2005. Under the Act, the government was required to achieve zero revenue deficit by the end of 2007‐08. Instead of achieving this target, revenue deficit jumped to a ten year high, increasing to Rs 359 billion or 3.4 percent of GDP. The act also required that the government would reduce public debt by at least 2.5 percentage points of GDP every year. The government could not meet this requirement as well. Public debt, instead of declining by 2.5 percentage points of GDP, has, in fact, increased by 1.1 percentage points.
41
|Deb
t Policy Statem
ent, 2008‐09
101. On the external front, Pakistan’s external debt and liabilities increased by US$ 5.8 billion to reach a total outstanding amount of US $ 46.3 billion in 2007‐08. Exchange rate fluctuations have played a major role in this increase, with depreciation of the US Dollar against major currencies having a negative impact on Pakistan’s stock of external debt. External debt and liabilities witnessed a marginal decline as a percentage of GDP during the same period. However a drawdown of foreign exchange reserves has resulted in the deterioration of some external debt sustainability indicators.
102. A current account deficit of approximately US$ 14 billion in 2007‐08 and US$ 7.3 billion in the first half of 2008‐09 places a severe strain on the economy. Financing of such a large current account deficit will exert greater pressure on the sustainability of Pakistan’s debt. Therefore it is necessary to remain cautious while going forward, and subject new borrowing to a strategy that allows the government to meet its financing requirements without putting the sustainability of its debt stock at risk.
103. The analysis of dynamics of external debt burden provides useful lessons for policy makers to manage the country’s external debt. Firstly, the current account deficit should be minimal so as to limit external borrowing. Second, efforts should be made to finance current account deficit through non‐debt creating inflows, prominent among which is foreign investment. Third, stability of exchange rate is critical for prudent debt management. Sharp depreciation in the exchange rate will add to public debt without borrowing a single additional dollar. Fourth, if there is a need to borrow, the interest cost should be minimal. Finally, the pace of foreign exchange earnings must continue to rise in order to enhance the debt carrying capacity of the country. Center to all these, is the pursuance of prudent monetary, fiscal, and exchange rate policies.
___________________________