Page 1 Combine satellite-based geoinformation, ground measurements and statistical methods to assess...
23
Page 1 Combine satellite-based geoinformation, ground measurements and statistical methods to assess green-up trends in earth observational studies Doktor, D. Helmholtz Centre for Environmental Research – UFZ Contact: [email protected] Two observational sets: dates d GU derived from 1 [km] NDVI vs ground obse of budburst d BB How can the two sets be compared ?
-
Upload
cynthia-harper -
Category
Documents
-
view
219 -
download
0
Transcript of Page 1 Combine satellite-based geoinformation, ground measurements and statistical methods to assess...

Page 1
Combine satellite-based geoinformation, ground measurements and statistical
methods to assess green-up trends in earth observational studies
Doktor, D. Helmholtz Centre for Environmental Research – UFZ
Contact: [email protected]
Two observational sets:Green-up dates dGU derived from 1 [km] NDVI vs ground observations
of budburst dBB
How can the two sets be compared ?
Page 2
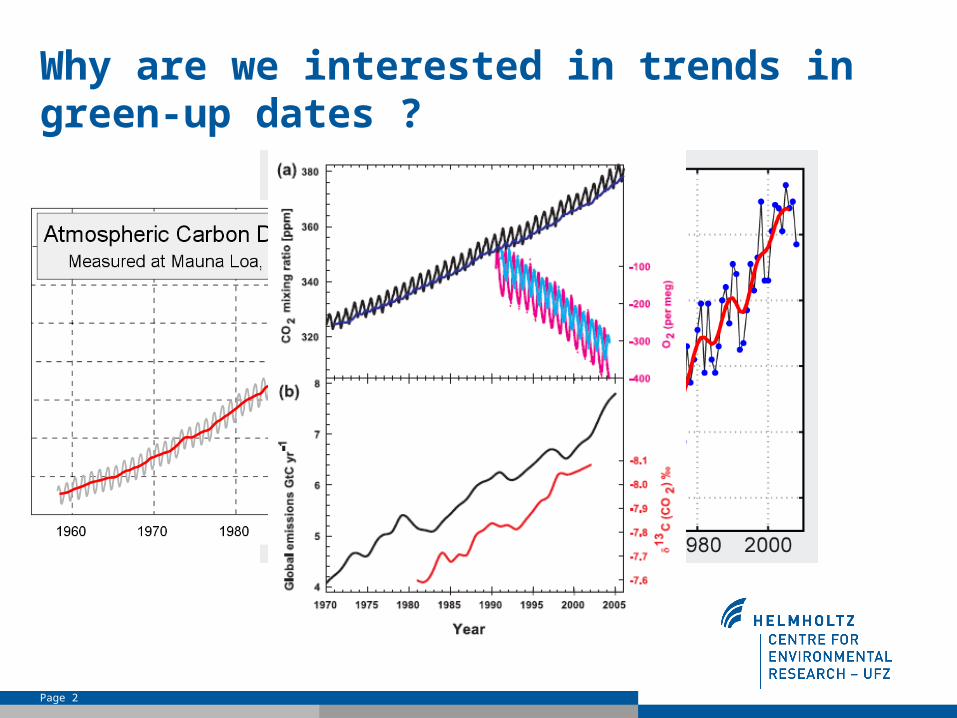
Why are we interested in trends in green-up dates ?
Page 3
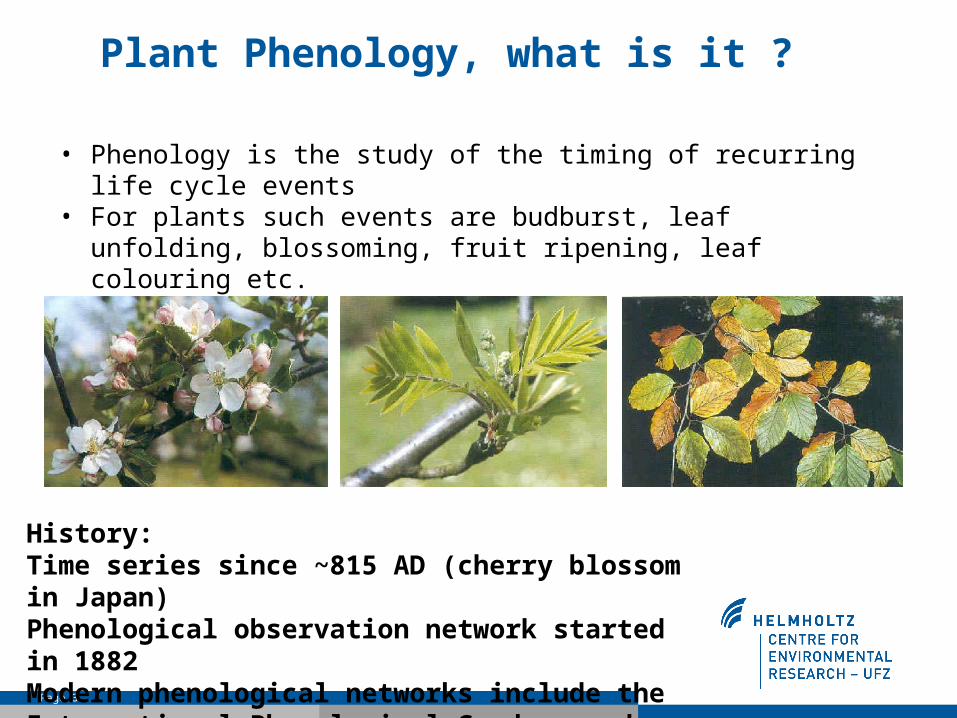
Plant Phenology, what is it ?
• Phenology is the study of the timing of recurring life cycle events
• For plants such events are budburst, leaf unfolding, blossoming, fruit ripening, leaf colouring etc.
History: Time series since ~815 AD (cherry blossom in Japan)Phenological observation network started in 1882Modern phenological networks include the International Phenological Gardens and National Networks

Page 4
Why is phenology important ?
• Track biotic response to climate change
• Strongly influences atmospheric dynamics in the lower boundary layer
• Strong biophysical control on climate model simulations
• Estimating biological productivity
• Understanding land-atmosphere interactions
• Modelling vegetative inputs into biogeochemical cycles

Page 5
Sets of geoinformation
• Satellite data: Daily observations of the Normalized Difference Vegetation Index. Influenced by clouds, atmospheric haze, viewing angle, sun position etc.
• German Weather Service (DWD) phenological database, ground observations: Budburst dates of wildgrowing species
• CORINE (Coordinated Information on the Environment) land-use cover map
• Digital elevation model (DEM), 1*1km resolution over Germany
Page 6
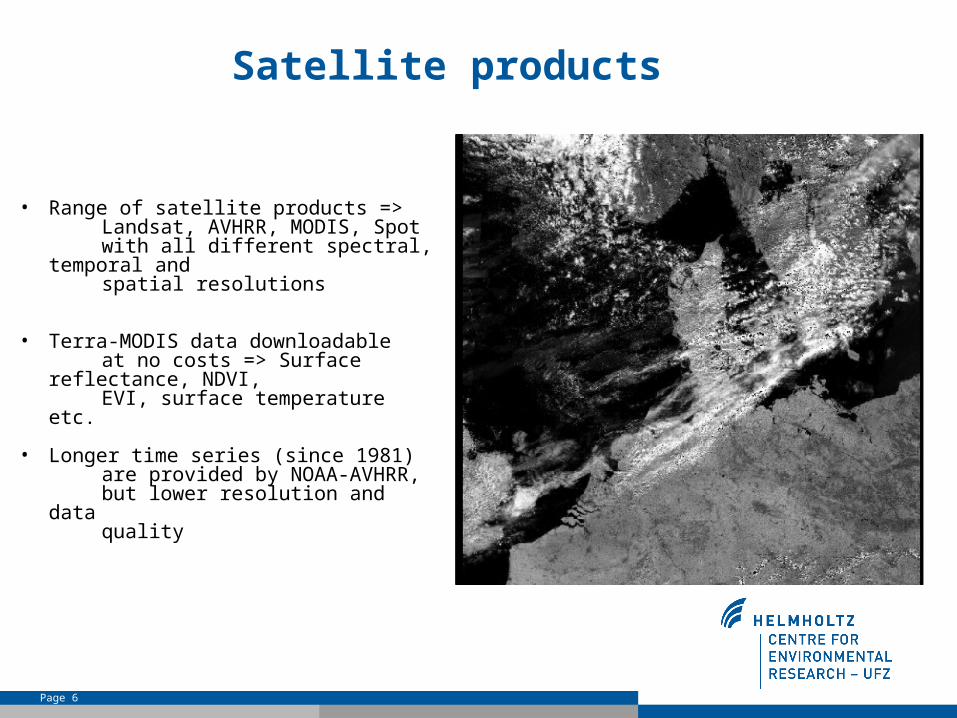
Satellite products
• Range of satellite products => Landsat, AVHRR, MODIS, Spot with all different spectral, temporal and spatial resolutions
• Terra-MODIS data downloadable at no costs => Surface reflectance, NDVI, EVI, surface temperature etc.
• Longer time series (since 1981) are provided by NOAA-AVHRR, but lower resolution and data quality

Page 7
Satellite derived vegetation information - NDVI
• Daily observations or composites of 1*1 km spatial resolution
• Based on reflection differences in the near-infrared red wave lengths
• Values generally between 0-1RNIR
RNIRNDVI
NDVI composites over the Hainich from 1991
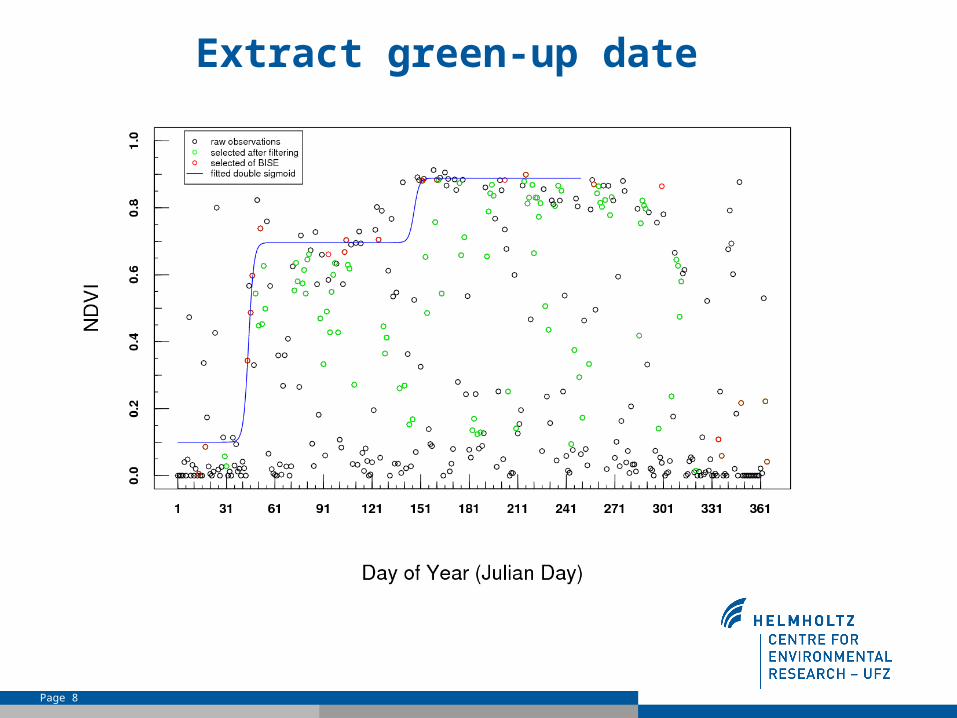
Range of methods to compute green-up dates => half-way between min and max, steepest slope, inflexion point of sigmoidal curve
Page 8
Extract green-up date

Page 9
Satellite and ground observational data
NDVI, 1989-2004, NOAA/AVHRR, 1 km
Atmospheric filtering and corrections
(Koslowsky et al. 2001, Koslowsky et al. 2003)
Dynamic filtering BISE (Viovy et al. 1992)
Ground observations,
Observational network of German Weather Service (DWD)
For Beech and Oak (N = 35195)
(Schaber & Badeck 2002, 2005)

Page 10
CORINE land-use data set

Page 11
Scaling ground observations to the scale observed by satellites
• In contrast to remote sensing ground observations do generally not provide spatially integrated data => individual plant vs canopy
• Low resolution, cloud contamination, atmospheric interferences, slight variation inthe geolocation
• Green-up of understorey, influence of surrounding pixels (sensor‘s spatialreponsitivity)
• Missing habitat maps for potential decomposition of the satellite signal

Page 12
Geostatistical interpolation
• External Drift Kriging (EDK) using a Digital Elevation Model of Germany (1*1 km) as external variable
• Physical relationship between external variable and variable to estimated => Phenological pace dependent on tem-perature
Page 13
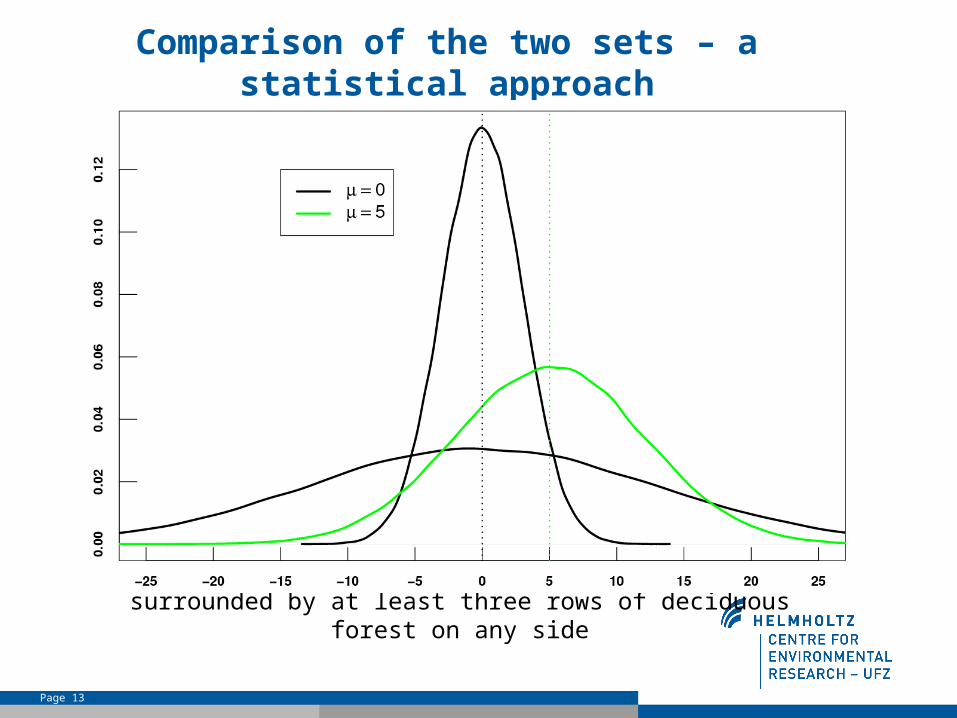
Comparison of the two sets – a statistical approach
• Geographically co-incident data of ground and satellite observations are not directly compared. Statistical approach comparing the parameters of the probability density function of the respective set (Doktor et al. 2005; Badeck et al. 2006)
• Generation of subsets with different proportions of non-forest landuse according to CORINE (resolution of 0.25 x 0.25 km). Those subsets of 1 x 1 km forest pixels are
classified with up to 0 through 9 non-forest 0.25 x 0.25 subpixels
• Additionally, a subset is produced of which the mid-point of the NDVI pixels is inside a CORINE deciduous forest subpixel. This subpixel has to be surrounded by at least
three rows of deciduous forest on any side

Page 14
Expectation: slightly later green-up date than observed budburst
Result: generally substantially earlier green-up than budburstHypotheses: strong impact of non-tree vegetation elements
on the signal, even in mainly forested landscapes
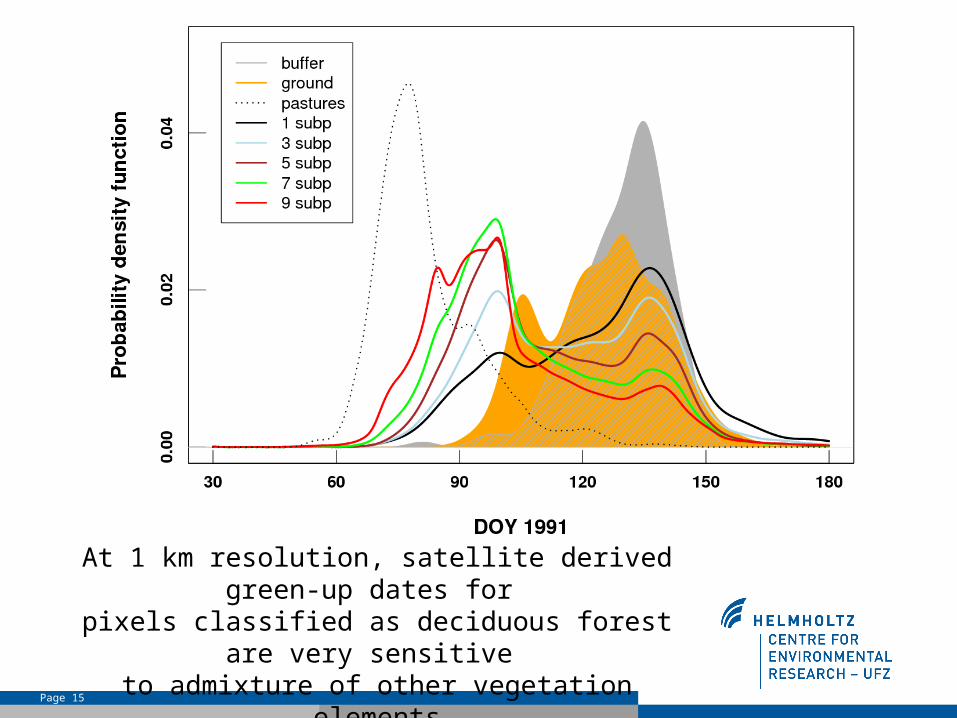
Page 15
At 1 km resolution, satellite derived green-up dates for pixels classified as deciduous forest are very sensitive
to admixture of other vegetation elements

Page 16
Heterogeneity is a major cause for discrepancies
µ Q1 Q3 SD
1989 0.99 0.98 0.99 0.85
1990 0.99 0.99 0.96 0.75
1991 0.97 0.84 0.97 0.28
1992 0.59 0.86 0.00 0.74
1993 0.99 0.98 0.95 0.64
1994 0.11 0.46 0.00 0.81
1995 0.98 0.99 0.99 0.72
1996 0.71 0.87 0.45 0.89
1997 0.73 0.75 0.75 0.73
1998 0.96 0.94 0.99 0.62
1999 0.97 0.90 0.99 0.33
2000 0.99 0.98 0.82 0.85
2001 0.98 0.91 0.99 0.67
2002 0.92 0.89 0.96 0.60
2003 0.76 0.71 0.71 0.55
2004 0.96 0.97 0.93 0.05
Differences between the pdf's parameters of dGU and dBB are calculated. The relationship of these differences and the number of non-forest sub-pixels is modelled using a linear regression baxy

Page 17
Green-up dates on a continental scale
Page 18
Observed green-up trends
Myneni et. al (1997): increased plant growth in high northern latitudesSchwartz et. al (2006) : earlier SOS over the Northern HemisphereStöckli et. al (2004): Trend for earlier green-upDelbart et. al (2004,2005): Earlier green-up over Siberia
• Studies based on satellite data with different spatial and spectral resolution• Use of different methods to determine green-up dates• Mostly done on continental scale with homegeneous land-use

Page 19
Trend of green-up dates
Page 20
Conclusions I
The Statistical approach most promising because remote sensing provides a statistical distribution of a random variable, not an exact representation of the state of the land surface or atmosphere at
a particular pixel. The same holds true for ground observations as they sample from biological variability and landscapes with heterogeneous microclimates
At 1 km resolution and in highly fragmented landscapes, a heterogeneous vegetation cover is a major cause for differences between satellite derived green-up dates and
date of budburst of the main vegetation element observed on the ground.
Therefore, at this spatial scale, green-up dates derived from satellite data and ground observations record two intrinsically different but related traits.
Both can be linked potentially only through the use of high resolution land cover data and thus ground observation can be used for validation purposes with such an analysis of mixed signals

Page 21
Conclusions II
Ground observational networks still provide unique information about plant phenology => go out and observe
Detected green-up trends based on satellite are of course valid but results have to be
evaluated carefully
Page 22
Carbon Sequestration dependent on changing temperature patterns and land-use change
Earlier start of the season increases sequestration, 16 % more absorbed PAR (negative feedback)
C-sequestration varies with land-use, i.e. forest se- questers more than crops
IPCC Guidelines for National Greenhouse Gas tories (GNGG)

Page 23
Thank you for your attention !