Package ‘ShotgunFunctionalizeR’ - Chalmers
40
Package ‘ShotgunFunctionalizeR’ October 26, 2010 Version 1.2-9 Date 2010-10-26 Title ShotgunFunctionalizeR - an R-package for functional comparison of metagenomes Author Erik Kristiansson <[email protected]>, Daniel Dalevi <[email protected]>. Maintainer Erik Kristiansson <[email protected]> Depends R (>= 1.8.0), multtest Description An R-package for functional comparison of metagenomes License GPL (>= 2) URL http://www.r-project.org, http://shotgun.zool.gu.se R topics documented: ShotgunFunctionalizeR-package .............................. 2 calculatePoissonR2 ..................................... 3 calculateRarefaction .................................... 3 clusterSamples ....................................... 5 countCategories ....................................... 5 densityPlot ......................................... 6 diversityPlot.family ..................................... 7 estimateDiversity ...................................... 8 freqPlot.family ....................................... 9 getSamples ......................................... 10 getSupportedFamilies .................................... 11 groupPlot .......................................... 11 groupPlot.category ..................................... 12 groupPlot.family ...................................... 13 MouseCOG ......................................... 14 MouseEC .......................................... 14 OceanCOG ......................................... 15 OceanEC .......................................... 15 OceanPFAM ........................................ 16 OceanTIGR ......................................... 17 ppPlot ............................................ 17 1
Transcript of Package ‘ShotgunFunctionalizeR’ - Chalmers

Package ‘ShotgunFunctionalizeR’October 26, 2010
Version 1.2-9
Date 2010-10-26
Title ShotgunFunctionalizeR - an R-package for functional comparison of metagenomes
Author Erik Kristiansson <[email protected]>, Daniel Dalevi<[email protected]>.
Maintainer Erik Kristiansson <[email protected]>
Depends R (>= 1.8.0), multtest
Description An R-package for functional comparison of metagenomes
License GPL (>= 2)
URL http://www.r-project.org, http://shotgun.zool.gu.se
R topics documented:ShotgunFunctionalizeR-package . . . . . . . . . . . . . . . . . . . . . . . . . . . . . . 2calculatePoissonR2 . . . . . . . . . . . . . . . . . . . . . . . . . . . . . . . . . . . . . 3calculateRarefaction . . . . . . . . . . . . . . . . . . . . . . . . . . . . . . . . . . . . 3clusterSamples . . . . . . . . . . . . . . . . . . . . . . . . . . . . . . . . . . . . . . . 5countCategories . . . . . . . . . . . . . . . . . . . . . . . . . . . . . . . . . . . . . . . 5densityPlot . . . . . . . . . . . . . . . . . . . . . . . . . . . . . . . . . . . . . . . . . 6diversityPlot.family . . . . . . . . . . . . . . . . . . . . . . . . . . . . . . . . . . . . . 7estimateDiversity . . . . . . . . . . . . . . . . . . . . . . . . . . . . . . . . . . . . . . 8freqPlot.family . . . . . . . . . . . . . . . . . . . . . . . . . . . . . . . . . . . . . . . 9getSamples . . . . . . . . . . . . . . . . . . . . . . . . . . . . . . . . . . . . . . . . . 10getSupportedFamilies . . . . . . . . . . . . . . . . . . . . . . . . . . . . . . . . . . . . 11groupPlot . . . . . . . . . . . . . . . . . . . . . . . . . . . . . . . . . . . . . . . . . . 11groupPlot.category . . . . . . . . . . . . . . . . . . . . . . . . . . . . . . . . . . . . . 12groupPlot.family . . . . . . . . . . . . . . . . . . . . . . . . . . . . . . . . . . . . . . 13MouseCOG . . . . . . . . . . . . . . . . . . . . . . . . . . . . . . . . . . . . . . . . . 14MouseEC . . . . . . . . . . . . . . . . . . . . . . . . . . . . . . . . . . . . . . . . . . 14OceanCOG . . . . . . . . . . . . . . . . . . . . . . . . . . . . . . . . . . . . . . . . . 15OceanEC . . . . . . . . . . . . . . . . . . . . . . . . . . . . . . . . . . . . . . . . . . 15OceanPFAM . . . . . . . . . . . . . . . . . . . . . . . . . . . . . . . . . . . . . . . . 16OceanTIGR . . . . . . . . . . . . . . . . . . . . . . . . . . . . . . . . . . . . . . . . . 17ppPlot . . . . . . . . . . . . . . . . . . . . . . . . . . . . . . . . . . . . . . . . . . . . 17
1
2 ShotgunFunctionalizeR-package
readGeneFamilies . . . . . . . . . . . . . . . . . . . . . . . . . . . . . . . . . . . . . . 18ShotgunFunctionalizeRAnnotationData . . . . . . . . . . . . . . . . . . . . . . . . . . 19summarizeData . . . . . . . . . . . . . . . . . . . . . . . . . . . . . . . . . . . . . . . 19testGeneCategories . . . . . . . . . . . . . . . . . . . . . . . . . . . . . . . . . . . . . 20testGeneCategories.dircomp . . . . . . . . . . . . . . . . . . . . . . . . . . . . . . . . 22testGeneCategories.enrichment . . . . . . . . . . . . . . . . . . . . . . . . . . . . . . . 23testGeneCategories.gaussiansum . . . . . . . . . . . . . . . . . . . . . . . . . . . . . . 23testGeneCategories.independence . . . . . . . . . . . . . . . . . . . . . . . . . . . . . 24testGeneCategories.poisson . . . . . . . . . . . . . . . . . . . . . . . . . . . . . . . . . 25testGeneCategories.regression . . . . . . . . . . . . . . . . . . . . . . . . . . . . . . . 26testGeneFamilies . . . . . . . . . . . . . . . . . . . . . . . . . . . . . . . . . . . . . . 27testGeneFamilies.binomial . . . . . . . . . . . . . . . . . . . . . . . . . . . . . . . . . 29testGeneFamilies.dircomp . . . . . . . . . . . . . . . . . . . . . . . . . . . . . . . . . 30testGeneFamilies.gaussian . . . . . . . . . . . . . . . . . . . . . . . . . . . . . . . . . 31testGeneFamilies.hypergeometric . . . . . . . . . . . . . . . . . . . . . . . . . . . . . . 32testGeneFamilies.poisson . . . . . . . . . . . . . . . . . . . . . . . . . . . . . . . . . . 33testGeneFamilies.regression . . . . . . . . . . . . . . . . . . . . . . . . . . . . . . . . 34trendPlot . . . . . . . . . . . . . . . . . . . . . . . . . . . . . . . . . . . . . . . . . . . 35trendPlot.category . . . . . . . . . . . . . . . . . . . . . . . . . . . . . . . . . . . . . . 36trendPlot.family . . . . . . . . . . . . . . . . . . . . . . . . . . . . . . . . . . . . . . . 37writeRankings . . . . . . . . . . . . . . . . . . . . . . . . . . . . . . . . . . . . . . . . 38
Index 39
ShotgunFunctionalizeR-packageShotgunFunctionalizeR - an R-package for shotgun metagenomicanalysis
Description
An R-package for shotgun metagenomic analysis
Details
Package: ShotgunFunctionalizeRVersion: 1.2-8Date: 2010-10-20Depends: R (>= 1.8.0), multtestURL: http://shotgun.zool.gu.se
Author(s)
Erik Kristiansson <[email protected]>, Daniel Dalevi <[email protected]>.
Maintainer: Erik Kristiansson <[email protected]>, Daniel Dalevi <[email protected]>

calculatePoissonR2 3
References
Kristiansson, E., Hugenholtz, P., Dalevi, D. (2009). ShotgunFunctionalizeR: an R-package forfunctional analysis of metagenomes. Bioinformatics 25(20).
calculatePoissonR2 Calculates the goodness-of-fit for Poisson regression
Description
Calculates the goodness-of-fit for Poisson regression as suggested by Mittlbock et al. 2002.
Usage
calculatePoissonR2(res.poiss, k=1)
Arguments
res.poiss the results from a Poisson regression. Produced by glm
k the number of explanatory covariates
Value
calculatePoissonR2 returns an estimate of the goodness-of-fit, which is a number between 0and 1.
References
Mittlbock, M. (2002). Calculating adjusted $R^2$ measures for Poisson regression models. Com-puter Methods and Programs in Biomedicine. 63 (3) pp 205-214.
See Also
glm
calculateRarefactionCalculates rarefaction curves
Description
calculateRarefaction calculates rarefaction curves for one or several samples.
Usage
calculateRarefaction(data, samples, iterations, x.seq)

4 calculateRarefaction
Arguments
data a ShotgunFunctionalizeR data object
samples a vector with samples (column numbers)
iterations number of times the sampling should be repeated
x.seq a vector of values describing the sizes of the sub samples
Details
Assume a set of N observation (e.g. reads) of M gene families. Let Ni be the number of observationfor gene family i such that
M∑i=1
Ni = N.
Assume that a sub sample of size n is drawn and let Sn denote the number of unique gene families.The rarefaction curve is then defined as
E [Sn] = M −(
Nn
) M∑i=1
(N −Ni
n
).
calculateRarefaction estimates the rarefaction curve by iteratively sample the specifiedgene families and then generate a average curve.
Further details about rarefaction curve analysis can be found in Hurlbert 1971 and Raup 1975.
Value
calculateRarefaction returns a rarefaction curve (y-values) for the specified x-values
References
Hurlbert, S. H. (1971). The nonconcept of Species Diversity: A Critique and Alternative Parame-ters. Ecology 52 (4).
Raup, D. M. (1975). Taxonomic Diversity Estimation Using Rarefaction. Paleobiology 1 (4).
See Also
diversityPlot.family
Examples
families.1<-list(Data=data.frame(rpois(1000, lambda=100)), Annotation=data.frame(paste("Gene Family", 1:1000)))x.seq<-seq(10,5000, by=10)curve<-calculateRarefaction(families.1, samples=1, iterations=100, x.seq=x.seq)plot(x=x.seq, y=curve[[1]])
clusterSamples 5
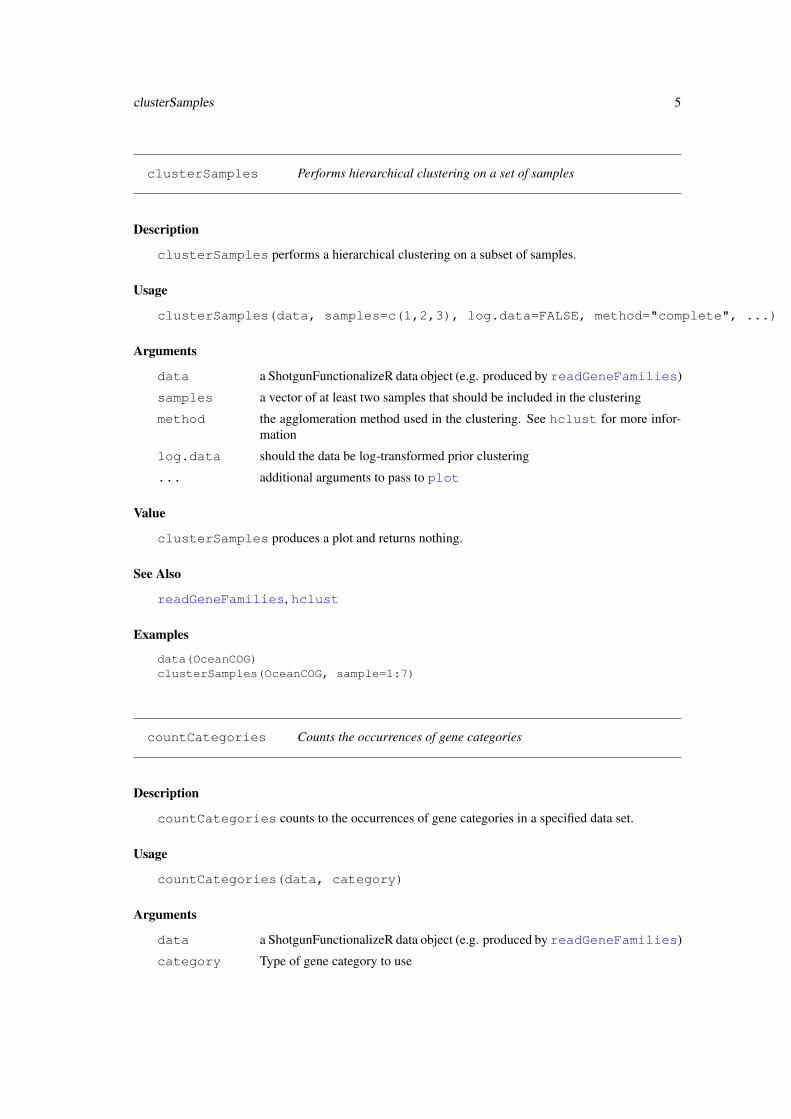
clusterSamples Performs hierarchical clustering on a set of samples
Description
clusterSamples performs a hierarchical clustering on a subset of samples.
Usage
clusterSamples(data, samples=c(1,2,3), log.data=FALSE, method="complete", ...)
Arguments
data a ShotgunFunctionalizeR data object (e.g. produced by readGeneFamilies)
samples a vector of at least two samples that should be included in the clustering
method the agglomeration method used in the clustering. See hclust for more infor-mation
log.data should the data be log-transformed prior clustering
... additional arguments to pass to plot
Value
clusterSamples produces a plot and returns nothing.
See Also
readGeneFamilies, hclust
Examples
data(OceanCOG)clusterSamples(OceanCOG, sample=1:7)
countCategories Counts the occurrences of gene categories
Description
countCategories counts to the occurrences of gene categories in a specified data set.
Usage
countCategories(data, category)
Arguments
data a ShotgunFunctionalizeR data object (e.g. produced by readGeneFamilies)
category Type of gene category to use

6 densityPlot
Value
countCategories returns a data.frame containing the name of the categories and the numberof counts in each samples.
See Also
readGeneFamilies, getCategory
densityPlot Plotting the distribution of counts for a metagenome
Description
densityPlot plots the probability distribution of the counts for a metagenome.
Usage
densityPlot(data, samples=1, log.yaxis=TRUE,color.hist="mistyrose", xlim, ylim,remove.zeros=TRUE, ...)
Arguments
data a ShotgunFunctionalizeR data object.
samples a integer indicating which sample that should be plotted. Defaults to 1.
color.hist the color of the produced histogram
log.yaxis should be y-axis be on a logarithmic scale? Defaults to TRUE
xlim the x limits of the plot
ylim the y limits of the plot
remove.zeros should gene families with zero observation be removed?
... additional arguments for the plot function
See Also
readGeneFamilies, plot
Examples
data(OceanCOG)densityPlot(OceanCOG, sample=1, xlim=c(0,20))

diversityPlot.family 7
diversityPlot.familyCalculates and plots rarefaction curves
Description
diversityPlot.family estimates and visualizes rarefaction curves based on the observedgene families. Curves for multiple samples may be estimated and plotted simultaneously.
Usage
diversityPlot.family(data, samples=1, iterations=100, max.sample.size,step.size, col, show.legend=TRUE, legend.names,smooth.curves=TRUE, print.diagonal=FALSE,col.diagonal="grey", lwd.diagonal=2, ylim, xlab,ylab, lwd.lines=2, cex.lab=1, cex.axis=1,lwd.axis=1, cex.legend=1.5, ...)
Arguments
data a ShotgunFunctionalizeR data objectsamples a vector with samples (column numbers)iterations the number of iterations used to calculate the rarefaction curvemax.sample.size
maximum sub sample size. If omitted, a suitable value is chosen based on thedata
step.size the step size for the different sub samples. Defaults to max.sample.size/10col a vector of colors for the rarefaction curves. If omitted, each curve will be drawn
in a unique colorshow.legend toggles a legend describing the names of the curveslegend.names names shown in the legend. If omitted, the column names of the data will be
usedsmooth.curves
whether splines should be used to smooth the rarefaction curvesprint.diagonal
whether a diagonal line should be drawncol.diagonal color of the diagonal linelwd.diagonal width of the diagonal lineylim y limit of the plot. If omitted, a suitable value will be calculatedxlab the label of the x axisylab the label of the y axislwd.lines the width of the rarefaction curvescex.lab the magnification to be used for axis labelscex.axis the magnification to be used for axis annotationlwd.axis the width of the axescex.legend the magnification to be used for the legend... additional arguments to the plot function

8 estimateDiversity
Value
diversityPlot.family produces a plot and returns nothing.
See Also
calculateRarefaction, estimateDiversity
estimateDiversity Estimate diversity indices for a data set
Description
estimateDiversity estimates the Chao, Simpson and Shannon diversity indices for a set ofsamples.
Usage
estimateDiversity(data, samples=1,method=c("chao", "simpson", "shannon"))
Arguments
data a ShotgunFunctionalizeR data object (e.g. produced by readGeneFamilies)
samples a vector indicating which samples to use (column numbers)
method a vector of methods (indices) to be calculate
Details
The Chao estimator is non-parametric estimator for species (gene families) richness (Chao 1984) ofthe following form
S∗ = Sobs +a2
2b
where SobS is the total number of observed gene families, a is number of gene families observedonly once and b is the number of gene families observed twice.
The Simpson index is a measure of diversity introduced in Simpson 1949. If N is the total numberof observations (reads), S the total number of unique gene families and ni the total number ofobservations for gene family i, then the Simpson index D is defined as
D = 1−∑S
i=1 ni(ni − 1)N(N − 1)
The Shannon index describes the diversity of categorical data and is defined as
H ′ = −S∑
i=1
piln(pi)
where S is the total number of unique gene families and pi is the relative frequency of gene familyi.
Further details about diversity indices can be found in Hurlbert 1971.
freqPlot.family 9
Value
estimateDiversity returns a list with one element for each specified sample. For each sam-ple, the specified indices are calculated and returned as a list.
References
Chao, A. (1984). Nonparametric estimation of the number of classes in a population. ScandinavianJ. Stat. 11:265-270.
Hurlbert, S. H. (1971). The nonconcept of Species Diversity: A Critique and Alternative Parame-ters. Ecology 52 (4).
Simpson, E. H. (1949). Measurement of Diversity. Nature 163 (1949):688.
See Also
diversityPlot.family, calculateRarefaction
Examples
estimateDiversity(list(Data=data.frame(c(3,2,1,1))))estimateDiversity(list(Data=data.frame(c(3,2,2,1,1,1,1))))
freqPlot.family Plots the relative abundance of a gene family
Description
freqPlot.family plots the relative frequency in each sample for user specified gene family.
Usage
freqPlot.family(data, family, col="mistyrose",groups=NULL, groups.space=NULL, groups.color=NULL,ylim, main, xlab="")
Arguments
data a ShotgunFunctionalizeR data object (e.g. the result from readGeneFamilies)
family character string indicating which gene family to plot
col color of the bars in the histogram
groups a vector indicating the groups of the samples
groups.space the amount of space between the groups
groups.color the colors for the different groups
ylim the coordinate range on the y-axis
main the title of the plot
xlab label of the x-axis
10 getSamples
See Also
trendPlot, trendPlot.family, trendPlot.category, groupPlot, groupPlot.family,groupPlot.category
Examples
## Not run:data(OceanCOG)po.stat<-testGeneFamilies.regression(OceanCOG,
covariates=c(10, 70, 130, 200, 500, 770, 4000),log.covariates=T)
freqPlot.family(po.stat, family="COG0415")
## End(Not run)
getSamples Select a subset of samples
Description
getSamples returns a subset of samples from a ShotgunFunctionalizeR data object.
Usage
getSamples(data, samples, exclude=FALSE, removeZeros=FALSE)
Arguments
data a ShotgunFunctionalizeR data object (e.g. produced by readGeneFamilies)
samples a vector of samples (column numbers)
exclude whether the columns specified in sample be included or excluded
removeZeros should gene families with only zeros be removed
Value
getSamples returns a new ShotgunFunctionalizeR data object.
See Also
readGeneFamilies

getSupportedFamilies 11
getSupportedFamiliesReturns the supported gene families
Description
Returns a list with the supported gene families for the current version of the package.
Usage
getSupportedFamilies()
Value
Returns a list of supported family types.
See Also
getAnnotation, detectGeneFamily, readGeneFamilies
Examples
getSupportedFamilies()
groupPlot Plots the result from a direct comparison using the Poisson model
Description
groupPlot plots the result from a direct comparison of two groups. This function requires thatthe Poisson model has been fitted to the data.
Usage
groupPlot(stat, ...)
Arguments
stat results from a direct comparison using Poisson model
... additional arguments to either trendPlot.family or trendPlot.category.
Details
Depending on type of the supplied object, groupPlot uses either groupPlot.family orgroupPlot.category.
See Also
groupPlot.family, groupPlot.category, trendPlot, trendPlot.family, trendPlot.category

12 groupPlot.category
Examples
## Not run:data(MouseCOG)po.stat<-testGeneFamilies.dircomp(MouseCOG, groups=c("Lean", "Lean",
"Lean", "Obese", "Obese"))groupPlot(po.stat, family="COG1662")
## End(Not run)
groupPlot.category Plots the result from a pathway-centric direct comparison using thePoisson model
Description
groupPlot.category plots the result from a pathway-centric direct comparison of two groups.The relative frequency for each sample and gene-function a specified the category is shown. Inaddition, the estimated group-wise rate is drawn for each group as a horizontal line. This functionrequires that the Poisson model has been fitted to the data.
Usage
groupPlot.category(stat.cat, category, ylim,col=c("mistyrose", "lavender", "red3", "royalblue3"),xlab="", main, print.pvalue=FALSE,print.pvalue.pos="topright",print.pvalue.cex=1.3)
Arguments
stat.cat results from a direct comparison using the Poisson model (testGeneCategories.dircomp)
category a number indicating which gene family category to plot
ylim the limit of the y-axis. A suitable value is calculated if omitted
col character vector with four element indicating the colors of the bars of the firstgroup, the bars of the second group, the horizontal line of the first group and thehorizontal line of the second group
xlab label of the x-axis
main the title of the plot. If omitted, the annotation of the gene family will be used
print.pvalue should the corresponding p-value be printed?print.pvalue.pos
where should be p-value be placed? This argument is analogous to the locationkeywords used by legend.
print.pvalue.cexthe magnification of the text used to print the p-value
See Also
groupPlot, groupPlot.family, trendPlot, trendPlot.family, trendPlot.category

groupPlot.family 13
Examples
## Not run:data(MouseCOG)po.stat<-testGeneCategories.dircomp(MouseCOG, pathway="cogpathways",
groups=c("Lean", "Lean", "Lean", "Obese", "Obese"))groupPlot.category(po.stat, category=20)
## End(Not run)
groupPlot.family Plots the result from a gene-centric direct comparison using the Pois-son model
Description
groupPlot.family plots the result from a gene-centric direct comparison of two groups. Therelative frequency is shown as well as the estimated group-wise rate (drawn as horizontal lines).This function requires that the Poisson model has been fitted to the data.
Usage
groupPlot.family(stat.families, family, ylim,col=c("mistyrose", "lavender", "red3", "royalblue3"),xlab="", main, print.pvalue=FALSE,print.pvalue.pos="topright", print.pvalue.cex=1.3)
Arguments
stat.familiesresults from a direct comparison using the Poisson model (testGeneFamilies.dircomp)
family character string indicating which gene family to plot
ylim the limit of the y-axis. A suitable value is calculated if omitted
col character vector with four element indicating the colors of the bars of the firstgroup, the bars of the second group, the horizontal line of the first group and thehorizontal line of the second group
xlab label of the x-axis
main the title of the plot. If omitted, the annotation of the gene family will be used
print.pvalue should the corresponding p-value be printed?print.pvalue.pos
where should be p-value be placed? This argument is analogous to the locationkeywords used by legend.
print.pvalue.cexthe magnification of the text used to print the p-value
See Also
groupPlot, groupPlot.category, trendPlot, trendPlot.family, trendPlot.category

14 MouseEC
Examples
## Not run:data(MouseCOG)po.stat<-testGeneFamilies.dircomp(MouseCOG,
groups=c("Lean", "Lean", "Lean", "Obese", "Obese"))groupPlot.family(po.stat, family="COG1662")
## End(Not run)
MouseCOG Metagenomic data from mouse gut annotated as COGs
Description
This data set contains metagenomes sampled from lean and obese mouse gut. The data was gener-ated by Turnbaugh et al. 2006 and annotated as COGs.
Usage
data(MouseCOG)
Format
A ShotgunFunctionalizeR data object with data from five mice (3 lean and 2 obese).
References
Turnbaugh, P.J., Ley, R.E., Mahowald, M.A., Magrini, V., Mardis, E.R., Gordon, J.I. (2006). Anobesity-associated gut microbiome with increased capacity for energy harvest. Nature 444 pp 1027-131.
See Also
MouseEC
MouseEC Metagenomic data from mouse gut annotated as EC numbers
Description
This data set contains metagenomes sampled from lean and obese mouse gut. The data was gener-ated by Turnbaugh et al. 2006 and annotated as EC numbers.
Usage
data(MouseEC)
Format
A ShotgunFunctionalizeR data object with data from five mice (3 lean and 2 obese).

OceanCOG 15
References
Turnbaugh, P.J., Ley, R.E., Mahowald, M.A., Magrini, V., Mardis, E.R., Gordon, J.I. (2006). Anobesity-associated gut microbiome with increased capacity for energy harvest. Nature 444 pp 1027-131.
See Also
MouseCOG
OceanCOG Metagenomes sampled at multiple depth in the Pacific Ocean anno-tated as COGs
Description
This data set contains metagenomes collected at seven depths (10, 70, 130, 200, 500, 770 and 4000meters) in the Pacific Ocean. The data was generated by DeLong et al. and annotated as COGsusing RPS-BLAST.
Usage
data(OceanCOG)
Format
A ShotgunFunctionalizeR data object containing data from each of the seven depths.
References
DeLong, E.D., Preston, C.M., Mincer, T., Rich, V., Hallam, S.J., Frigaard, N.U., Martinez, A., Sul-livan, M.B., Edwards, R., Brito, B.R., Chisholm, S.W., Karl, D.M. (2006). Community GenomicsAmong Stratified Microbial Assemblages in the Ocean’s Interior. 311 pp 496-503.
See Also
OceanEC, OceanPFAM, OceanTIGR
OceanEC Metagenomes sampled at multiple depth in the Pacific Ocean anno-tated as EC numbers
Description
This data set contains metagenomes collected at seven depths (10, 70, 130, 200, 500, 770 and4000 meters) in the Pacific Ocean. The data was generated by DeLong et al. and annotated as ECnumbers using RPS-BLAST.
Usage
data(OceanEC)
16 OceanPFAM
Format
A ShotgunFunctionalizeR data object containing data from each of the seven depths.
References
DeLong, E.D., Preston, C.M., Mincer, T., Rich, V., Hallam, S.J., Frigaard, N.U., Martinez, A., Sul-livan, M.B., Edwards, R., Brito, B.R., Chisholm, S.W., Karl, D.M. (2006). Community GenomicsAmong Stratified Microbial Assemblages in the Ocean’s Interior. 311 pp 496-503.
See Also
OceanCOG, OceanPFAM, OceanTIGR
OceanPFAM Metagenomes sampled at multiple depth in the Pacific Ocean anno-tated as PFAM domains
Description
This data set contains metagenomes collected at seven depths (10, 70, 130, 200, 500, 770 and 4000meters) in the Pacific Ocean. The data was generated by DeLong et al. and annotated as PFAMdomains using RPS-BLAST.
Usage
data(OceanPFAM)
Format
A ShotgunFunctionalizeR data object containing data from each of the seven depths.
References
DeLong, E.D., Preston, C.M., Mincer, T., Rich, V., Hallam, S.J., Frigaard, N.U., Martinez, A., Sul-livan, M.B., Edwards, R., Brito, B.R., Chisholm, S.W., Karl, D.M. (2006). Community GenomicsAmong Stratified Microbial Assemblages in the Ocean’s Interior. 311 pp 496-503.
See Also
OceanCOG, OceanEC, OceanTIGR

OceanTIGR 17
OceanTIGR Metagenomes sampled at multiple depth in the Pacific Ocean anno-tated as TIGRfam domains
Description
This data set contains metagenomes collected at seven depths (10, 70, 130, 200, 500, 770 and 4000meters) in the Pacific Ocean. The data was generated by DeLong et al. and annotated as TIGRfamdomains using RPS-BLAST.
Usage
data(OceanTIGR)
Format
A ShotgunFunctionalizeR data object containing data from each of the seven depths.
References
DeLong, E.D., Preston, C.M., Mincer, T., Rich, V., Hallam, S.J., Frigaard, N.U., Martinez, A., Sul-livan, M.B., Edwards, R., Brito, B.R., Chisholm, S.W., Karl, D.M. (2006). Community GenomicsAmong Stratified Microbial Assemblages in the Ocean’s Interior. 311 pp 496-503.
See Also
OceanCOG, OceanEC, OceanPFAM
ppPlot Observed and theoretical p-value quantiles
Description
This function plots the observed and theoretical p-value quantiles.
Usage
ppPlot(stat, log.pvalues=TRUE, xlim=NULL, ylim=NULL, col="red3", ...)
Arguments
stat results from any gene- or pathway-centric analysis performed in ShotgunFunc-tionalizeR
log.pvalues should the p-value be plotted on a logarithmic scale?
xlim x limit of the plot. A suitable value is calculated if omitted
ylim y limit of the plot. A suitable value is calculated if omitted
col color of the points
... additional arguments for qqplot

18 readGeneFamilies
See Also
qqplot, trendPlot, trendPlot.family, trendPlot.category, groupPlot, groupPlot.family,groupPlot.category
Examples
## Not run:data(OceanCOG)po.stat<-testGeneFamilies.regression(OceanCOG,
covariates=c(10, 70, 130, 200, 500, 770, 4000), log.covariates=T)ppPlot(po.stat)
## End(Not run)
readGeneFamilies Read a data file
Description
Reads a data file and creates a ShotgunFunctionalizeR data object.
Usage
readGeneFamilies(file, type.family="detect",custom.annotation=NULL, sep="\t")
Arguments
file name of the file to be readtype.family type of gene familysep field separator between the columnscustom.annotation
file containing a custom annotation
Details
readGeneFamilies read a text file with metagenomic data and creates a ShotgunFunctional-izeR data object for further analysis. The text file should be in ANSI format and organized asfollows. The left most column should be named ’GeneFamily’ and contain the identifiers for thetype of gene family used. The following columns should contain the counts for each of the samples.The first row should contain the name of the samples.
readGeneFamilies can detect which type of gene families that are used (type.family=’detect’).This is achieved matching identifiers against those supported by ShotgunFunctionalizeR (currentlyclusters of orthologous genes (COG), Enzyme Commission numbers (EC), Pfam protein domainsand TIGRfam protein domains.. Gene families of COG type are assumed if no valid match can bemade.
A custom gene family can be loaded by setting type.family to ’custom’. The data file can thencontain any form of identifiers. A custom annotation can then be loaded by supplying an annotationfile (e.g. custom.annotation=’myannotation.txt’). The custom annotation file should contain twocolumns, one named ’GeneFamily’ and one named ’Description’, linking the identifiers with anyform of description.
See the User’s Guide for more information. Example files are available at http://shotgun.zool.gu.se.

ShotgunFunctionalizeRAnnotationData 19
Value
readGeneFamilies returns a ShotgunFunctionalizeR data object.
See Also
writeRankings
Examples
## Not run: data<-readGeneFamilies("MetagenomicData.txt")
ShotgunFunctionalizeRAnnotationDataSystem data for ShotgunFunctionalizeR
Description
This data object contains system data for ShotgunFunctionalizeR, including functional annotationsfor gene families as well as gene family categories and their functional annotation.
summarizeData Statistical summary for a set of metagenomes
Description
summarizeData prints a summary statistics for all metagenomes in a data object.
Usage
summarizeData(data, probs=c(0, 0.25, 0.50, 0.75, 0.90, 1),print.diversity=TRUE)
Arguments
data a ShotgunFunctionalizeR data object.
probs a vector with quantile probabilitiesprint.diversity
whether to calculate and print Chao’s, Simpson’s and Shannon’s diversity in-dices
See Also
readGeneFamilies
Examples
data(OceanCOG)summarizeData(OceanCOG)

20 testGeneCategories
testGeneCategories Performs a pathway-centric test for identification of significant genefamily categories
Description
testGeneCategories performs a pathway-centric analysis of a specified data set.
Usage
testGeneCategories(data, method="gaussiansum",category="cogpathways", samples=c(1,2),multtest="BH", ord=TRUE,enrichment.method="Binomial",enrichment.p=0.1,design.matrix=NULL, coef=1,covariates=NULL, log.covariates=FALSE,groups=NULL,overdisp=FALSE)
Arguments
data A ShotgunFunctionalizeR data object
method Testing method to use. See details for more information
category Which type of gene category should be used?
samples A vector of samples to include
multtest Procedure for multiple testing correction. See details
ord Whether the resulting ranking list should be sorted with the most significantgene categories at the top
enrichment.methodWhich method should be used for enrichment analysis
enrichment.p Which p-value cut-off should be used for enrichment analysis
design.matrixDesign matrix (general Poisson model)
coef Which coefficient from the design matrix should be tested for significance (gen-eral Poisson model)
covariates Covariates for regression (Poisson regression model)
log.covariatesWhether the covariates should be log transformed (poisson regression model)
groups Vector of group labels for the direct comparison (Poisson model for direct com-parison)
overdisp Whether the poisson model use overdispersion (all poisson models)
testGeneCategories 21
Details
testGeneCategories supports a number of different testing procedures. The method argu-ment can currently be set to the following values
• gaussiansum. Performs the test using the Gaussian Sum statistic. This procedure can only beperformed for one pair of samples. See testGeneCategories.gaussiansum for moreinformation.
• independence. Performs a test of independence using Fisher’s exact test. This procedure canonly be performed for one pair of samples. See testGeneCategories.independencefor more information.
• enrichment. Performs an enrichment analysis. First a gene-centric analysis is performedwhich is followed by a test of overrepresentation of gene-family categories among the sig-nificant gene families. The enrichment.method argument specifies the method to use to rankthe gene-families (see testGeneFamilies) and enrichment.ph the p-value cut-off. Thetest of overrepresentation is performed using Fisher’s exact test.
• poisson. The general Poisson model. To use this procedure a design matrix describing theexperimental setup is need. See the User’s Guide section 5.4.4 for an example.
• poissonregression. Performs a regression analysis using the Poisson model. The covariatesargument, containing a vector with the covariates, is needed to use this test. This method canalso be called using the testGeneCategories.regression.
• poissongroups. Performs a direct comparison between two groups using the Poisson model.The vector groups containing group labels needs to be specified. Can also be called usingtestGeneCategories.dircomp.
The multtest argument specifies the procedure for adjusting the p-value due to multiple testing.ShotgunFunctionalizeR currently utilizes the multtest package. See mt.rawp2adjp for infor-mation about supported procedures.
References
Kristiansson, E., Hugenholtz, P., Dalevi, D. (2009). ShotgunFunctionalizeR: an R-package forfunctional analysis of metagenomes. Bioinformatics 25(20).
Dudoit, S., van der Laan, M.J. (2008). Multiple Testing Procedures with Applications to Genomics.Springer Series in Statistics
See Also
testGeneCategories.gaussiansum, testGeneCategories.independence, testGeneCategories.enrichment,testGeneCategories.poisson
Examples
## Not run:data(MouseCOG)res.dircomp<-testGeneCategories(MouseCOG, method="poissongroups", category="COGPATHWAYS",
groups=c("Lean", "Lean", "Lean", "Obese", "Obese"))
## End(Not run)## Not run:data(OceanEC)res.reg<-testGeneCategories(OceanEC, method="poissonregression", category="KEGG",
covariates=c(10,70,130,200,500,770,4000), log.covariates=T)

22 testGeneCategories.dircomp
## End(Not run)## Not run:data(OceanEC)res.enrichment<-testGeneCategories(OceanEC, method="enrichment", category="KEGG",
samples=c(1,7), enrichment.p=0.05, enrichment.method="binomial")
## End(Not run)
testGeneCategories.dircompPerforms a pathway-centric analysis using Poisson direct comparison
Description
testGeneCategories.dircomp performs a pathway-centric analysis of a specified data setusing Poisson direct comparison. This function provides an easy-to-use interface for direct compar-ison using the Poisson model.
Usage
testGeneCategories.dircomp(...)
Arguments
... Additional arguments for testGeneCategories
Details
testGeneCategories.dircomp uses testGeneCategories to perform a direct com-parison with the Poisson model. The only arguments necessary are groups specifying a vector ofgroup labels.
References
Kristiansson, E., Hugenholtz, P., Dalevi, D. (2009). ShotgunFunctionalizeR: an R-package forfunctional analysis of metagenomes. Bioinformatics 25(20).
See Also
testGeneCategories
Examples
## Not run:res.dircomp<-testGeneCategories.dircomp(MouseCOG, category="COGPATHWAYS",
groups=c("Lean", "Lean", "Lean", "Obese", "Obese"))
## End(Not run)

testGeneCategories.enrichment 23
testGeneCategories.enrichmentPerforms a pathway-centric test using a test of overrepresentation
Description
testGeneCategories.enrichment performs a pathway-centric analysis of a specified dataset using a test of overrepresentation.
Usage
testGeneCategories.enrichment(data, categories, samples, method, alpha)
Arguments
data A ShotgunFunctionalizeR data object
categories A list of categories (e.g. from getCategory)
samples Samples to use in the analysis
method What procedure should be used to the ranking of gene-families. See testGeneFamiliesfor possible choices
alpha P-value cut-off used in the enrichment analysis
Details
testGeneCategories.enrichment first performs a gene-centric analysis which is followedby a test of statistical overrepresentation of gene-family categories among the significant gene fam-ilies. Further information can be found in Kristiansson et al 2009.
References
Kristiansson, E., Hugenholtz, P., Dalevi, D. (2009). ShotgunFunctionalizeR: an R-package forfunctional analysis of metagenomes. Bioinformatics 25(20).
See Also
testGeneCategories
testGeneCategories.gaussiansumPerforms a pathway-centric analysis using Gaussian Sum statistics
Description
testGeneCategories.gaussian performs a pathway-centric analysis of a specified data setusing Gaussian Sum statistics.
Usage
testGeneCategories.gaussiansum(data, categories, samples)

24 testGeneCategories.independence
Arguments
data A ShotgunFunctionalizeR data object
categories A list of categories (e.g. from getCategory)
samples a vector of samples (column numbers) to use in the analysis
Details
Information about the Gaussian Sum statistic can be found in Kristiansson et al 2009.
References
Kristiansson, E., Hugenholtz, P., Dalevi, D. (2009). ShotgunFunctionalizeR: an R-package forfunctional analysis of metagenomes. Bioinformatics 25(20).
See Also
testGeneCategories
testGeneCategories.independencePerforms a pathway-centric test using a test of independence
Description
testGeneCategories.independence performs a pathway-centric analysis of a specifieddata set using a test of independence.
Usage
testGeneCategories.independence(data, categories, samples,simulate.p.value=TRUE, B=2000)
Arguments
data A ShotgunFunctionalizeR data object
categories A list of categories (e.g. from getCategory)
samples Samples to use in the analysissimulate.p.value
Should the p-value be simulated (see fisher.test)
B B to fisher.test (see fisher.test)
Details
Information about the Gaussian Sum statistic can be found in Kristiansson et al 2009.
References
Kristiansson, E., Hugenholtz, P., Dalevi, D. (2009). ShotgunFunctionalizeR: an R-package forfunctional analysis of metagenomes. Bioinformatics 25(20).
testGeneCategories.poisson 25
See Also
testGeneCategories
testGeneCategories.poissonPerforms a pathway-centric test using a Poisson model
Description
testGeneCategories.poisson performs a pathway-centric analysis of a specified data setusing a Poisson model. This procedures requires a user specified design matrix.
Usage
testGeneCategories.poisson(data, categories,design.matrix, coef,overdisp=FALSE)
Arguments
data A ShotgunFunctionalizeR data object
categories A list of categories (e.g. from getCategory)design.matrix
A design matrix specifying the experimental setup
coef A number specifying which coefficient (column) in the design matrix that shouldbe tested
overdisp Should the Poisson model use overdispersion
Details
testGeneCategories.poisson provides a framework for performing pathway-centric anal-ysis using a Poisson model. The design matrix specifies the experimental setup. Note that inpathway-centric analysis, each gene-family in the category will have an individual baseline andhence, no base line should be specified in the design matrix.
testGeneCategories.regression and testGeneCategories.dircomp provides easy-to-use function for regression analysis and comparison of two groups respectively.
See Kristiansson et al 2009 for further details.
References
Kristiansson, E., Hugenholtz, P., Dalevi, D. (2009). ShotgunFunctionalizeR: an R-package forfunctional analysis of metagenomes. Bioinformatics 25(20).
See Also
testGeneCategories, testGeneFamilies.poisson, testGeneCategories.regression,testGeneCategories.dircomp

26 testGeneCategories.regression
Examples
Data<-matrix(rpois(n=80, lambda=rep((1:8)*10, each=10)),nr=10, nc=8, byrow=FALSE)
colnames(Data)<-c("A1", "A2", "B1", "B2", "C1", "C2", "D1", "D2")Annotation<-data.frame(GeneFamily=paste("GF", 1:10),
Annotation=paste("GF", 1:10))
Data[3,1:2]<-Data[3,1:2]+10Data[3,3:4]<-Data[3,3:4]+40
SimData<-list(Data=data.frame(Data), Annotation=Annotation,Type="Custom")
summarizeData(SimData)
Design<-cbind(rep(1,8), c(rep(1,6), rep(0,2)),c(rep(1,4), rep(0,4)), c(rep(1,2), rep(0,6)))
print(Design)
res.1<-testGeneFamilies(SimData, method="poisson",design.matrix=Design, coef=3)
res.2<-testGeneFamilies(SimData, method="poisson",design.matrix=Design, coef=4)
testGeneCategories.regressionPerforms a pathway-centric analysis using Poisson regression analysis
Description
testGeneCategories.regression performs a pathway-centric analysis of a specified dataset using Poisson regression. This function provides an easy-to-use interface for regression analysisusing the Poisson model.
Usage
testGeneCategories.regression(...)
Arguments
... Additional arguments for testGeneCategories
Details
testGeneCategories.regression uses testGeneCategories to perform a regres-sion analysis with the Poisson model. The only arguments necessary are covariates and ifthese should be log-transformed, log.covariates.
References
Kristiansson, E., Hugenholtz, P., Dalevi, D. (2009). ShotgunFunctionalizeR: an R-package forfunctional analysis of metagenomes. Bioinformatics 25(20).

testGeneFamilies 27
See Also
testGeneCategories
Examples
## Not run:data(OceanEC)res.reg<-testGeneCategories.regression(OceanEC, category="KEGG",
covariates=c(10,70,130,200,500,770,4000), log.covariates=T)
## End(Not run)
testGeneFamilies Performs a gene-centric test for identification of significant gene fam-ilies
Description
testGeneCategories performs a gene-centric analysis of a specified data set.
Usage
testGeneFamilies(data, method="binomial", samples=c(1,2),multtest="BH", ord=TRUE,design.matrix=NULL, coef=1,covariates=NULL, log.covariates=FALSE,groups=NULL,overdisp=FALSE)
Arguments
data A ShotgunFunctionalizeR data object
method Testing method to use. See details for more information
samples A vector of samples to include
multtest Procedure for multiple testing correction. See details for more information
ord Whether the resulting ranking list should be sorted with the most significantgene families at the top
design.matrixDesign matrix (general poisson model)
coef Which coefficient from the design matrix should be tested for significance (gen-eral Poisson model)
covariates Covariates for regression (Poisson regression model)log.covariates
Whether the covariates should be log transformed (poisson regression model)
groups Vector of group labels for the direct comparison (Poisson model for direct com-parison)
overdisp Whether the poisson model use overdispersion (all poisson models)

28 testGeneFamilies
Details
testGeneFamilies supports a wide range of testing procedures. The method argument cancurrently be set to the following values
• binomial. Performs a binomial test for a pair of metagenomes. See testGeneFamilies.binomialfor more information.
• hypergeometric. Performs a hypergeometric test for a pair of metagenomes. See testGeneFamilies.hypergeometricfor more information.
• gaussian. Perform a Gaussian test for a pair of metagenomes. This test is only valid asymptot-ically and should thus only be applied when the number of observations is sufficiently large.See link{testGeneFamilies.gaussian} for more information.
• poisson. The general Poisson model. To use this procedure a design matrix describing theexperimental setup is need. See the User’s Guide section 5.4.4 for an example.
• poissonregression. Performs a regression analysis using the Poisson model. The covariatesargument, containing a vector with the covariates, is needed to use this test. This method canalso be called using the testGeneFamilies.regression.
• Performs a direct comparison between two groups using the Poisson model. The vector groupscontaining group labels needs to be specified. Can also be called using testGeneFamilies.dircomp.
The multtest argument specifies the procedure for adjusting the p-value due to multiple testing.ShotgunFunctionalizeR currently utilizes the multtest package. See mt.rawp2adjp for infor-mation about supported procedures.
References
Kristiansson, E., Hugenholtz, P., Dalevi, D. (2009). ShotgunFunctionalizeR: an R-package forfunctional analysis of metagenomes. Bioinformatics 25(20).
Dudoit, S., van der Laan, M.J. (2008). Multiple Testing Procedures with Applications to Genomics.Springer Series in Statistics
See Also
readGeneFamilies, testGeneFamilies.binomial, testGeneFamilies.hypergeometric,testGeneFamilies.gaussian, testGeneFamilies.poisson
Examples
## Not run:data(OceanCOG)res.bin<-testGeneFamilies(OceanCOG, method="Binomial", samples=c(1,7))
## End(Not run)## Not run:data(OceanPFAM)res.reg<-testGeneFamilies(OceanPFAM, method="poissonregression",
covariates=c(10,70,130,200,500,770,4000), log.covariate=T)
## End(Not run)## Not run:data(MouseEC)res.dircomp<-testGeneFamilies(MouseEC, method="poissongroups",
groups=c("Lean", "Lean", "Lean", "Obese", "Obese"))
## End(Not run)

testGeneFamilies.binomial 29
testGeneFamilies.binomialPerforms a gene-centric analysis using a binomial test
Description
testGeneFamilies.binomial performs a gene-centric analysis of a specified data set usinga binomial test.
Usage
testGeneFamilies.binomial(data, samples)
Arguments
data a ShotgunFunctionalizeR data object
samples vector of samples (column numbers) to use in the analysis
Details
testGeneFamilies.binomial performs an exact binomial test for each row in the data ma-trix. Assume that X1 ∼ Po(M1p1) and X2 ∼ Po(M2p2) where M1 and M2 are the total numberof observations from two metagenomes. It follows that
X1|X1 + X2 = n ∼ Bin
(n,
M1p1
M1p1 + M2p2
)and the binomial test is testing whether p1 = p2. The test can be seen as an approximation of thehypergeometric counterpart (testGeneFamilies.hypergeometric).
testGeneFamilies.binomial is usually called implicitly by using the ’binomial’ method intestGeneFamilies.
Further details are available in Kristiansson et al 2009.
Value
testGeneFamilies.binomial returns a list with the following elements
PValues A list of p-valuesRankings.detail
A list additional elements containing details about the ranking
References
Kristiansson, E., Hugenholtz, P., Dalevi, D. (2009). ShotgunFunctionalizeR: an R-package forfunctional analysis of metagenomes. Bioinformatics 25(20).
See Also
testGeneFamilies

30 testGeneFamilies.dircomp
Examples
counts<-cbind(rpois(10, 100), rpois(10, seq(50,300, length=10)))SimData<-list(Data=counts)testGeneFamilies.binomial(SimData, samples=c(1,2))
testGeneFamilies.dircompPerforms a gene-centric analysis using Poisson direct comparison
Description
testGeneFamilies.dircomp performs a pathway-centric analysis of a specified data set us-ing Poisson direct comparison. This function provides an easy-to-use interface for direct compari-son using the Poisson model.
Usage
testGeneFamilies.dircomp(...)
Arguments
... Additional arguments for testGeneFamilies
Details
testGeneFamilies.dircomp uses testGeneFamilies to perform a direct comparisonwith the Poisson model. The only arguments necessary are groups.
References
Kristiansson, E., Hugenholtz, P., Dalevi, D. (2009). ShotgunFunctionalizeR: an R-package forfunctional analysis of metagenomes. Bioinformatics 25(20).
See Also
testGeneFamilies
Examples
## Not run:data(MouseEC)res.dircomp<-testGeneFamilies.dircomp(MouseEC,
groups=c("Lean", "Lean", "Lean", "Obese", "Obese"))
## End(Not run)

testGeneFamilies.gaussian 31
testGeneFamilies.gaussianPerforms a gene-centric analysis using a Gaussian test
Description
testGeneFamilies.gaussian performs a gene-centric analysis of a specified data set usinga Gaussian.
Usage
testGeneFamilies.gaussian(data, samples)
Arguments
data a ShotgunFunctionalizeR data object
samples vector of samples (column numbers) to use in the analysis
Details
testGeneFamilies.gaussian tests for significant gene families between two samples byusing a Binomial-Gaussian approximation. Let X1 and Xr be the number of observations fromsample 1 and 2 and let N1 and N2 is the total number of observations in each sample respectively.If we define
D =R1 −R2√
PQ(
1N1
+ 1N2
)where R1 = X1/N1, R2 = X2/N2,
P =X1 + X2
N1 + N2
and Q = 1 − P it follows that D is approximately normal with expected value 0 and variance 1(according to the central limit theorem). Hence, we can test whether the relative frequency of readsin sample 1 differs form sample 2 by testing H0 : D = 0 versus H1 : D 6= 0.
More details are available in Kristiansson et al 2009.
Value
testGeneFamilies.binomial returns a list with the following elements
PValues A list of p-valuesRankings.detail
A list additional elements containing details about the ranking
References
Kristiansson, E., Hugenholtz, P., Dalevi, D. (2009). ShotgunFunctionalizeR: an R-package forfunctional analysis of metagenomes. Bioinformatics 25(20).
See Also
testGeneFamilies

32 testGeneFamilies.hypergeometric
Examples
counts<-cbind(rpois(10, 100), rpois(10, seq(50,300, length=10)))SimData<-list(Data=counts)testGeneFamilies.gaussian(SimData, samples=c(1,2))
testGeneFamilies.hypergeometricPerforms a gene-centric analysis using a hypergeometric test
Description
testGeneFamilies.hypergeometric performs a gene-centric analysis of a specified dataset using a hypergeometric test.
Usage
testGeneFamilies.hypergeometric(data, samples)
Arguments
data A ShotgunFunctionalizeR data object
samples vector of samples (column numbers) to use in the analysis
Details
testGeneFamilies.binomial performs an exact hypergeometric test for each row of in thedata matrix. Under the assumption that the counts from both metagenomes follows a multinomialdistribution, the procedure test whether pi1 = pi2 for each row i = 1, . . . , n. If Xi1 and Xi2 are thecounts for row i and metagenome 1 and 2 respectively, it follows that
Xi1|Xi1 + Xi2 = n ∼ Hyper(M1 + M2,M1, n)
where M1 and M2 are the total number of counts in metagenome 1 and 2 respectively. The functiontestGeneFamilies.binomial provides a faster binomial approximation.
testGeneFamilies.hypergeometric is usually called implicitly by using the ’binomial’method in testGeneFamilies.
Further details are available in Kristiansson et al 2009.
Value
testGeneFamilies.binomial returns a list with the following elements
PValues A list of p-valuesRankings.detail
A list additional elements containing details about the ranking
References
Kristiansson, E., Hugenholtz, P., Dalevi, D. (2009). ShotgunFunctionalizeR: an R-package forfunctional analysis of metagenomes. Bioinformatics 25(20).

testGeneFamilies.poisson 33
See Also
testGeneFamilies
Examples
counts<-cbind(rpois(10, 100), rpois(10, seq(50,300, length=10)))SimData<-list(Data=counts)testGeneFamilies.hypergeometric(SimData, samples=c(1,2))
testGeneFamilies.poissonPerforms a gene-centric test using a Poisson model
Description
Test for significant gene families using the poisson model
Usage
testGeneFamilies.poisson(data, design.matrix,coef, overdisp=FALSE)
Arguments
data A ShotgunFunctionalizeR data objectdesign.matrix
A design matrix specifying the experimental setup
coef A number specifying which coefficient (column) in the design matrix that shouldbe tested
overdisp Should the Poisson model use overdispersion
Details
testGeneFamilies.poisson provides a general framework for performing gene-centric anal-ysis using a Poisson model. The design matrix specifies the experimental setup.
testGeneCategories.regression and testGeneCategories.dircomp provides easy-to-use function for regression analysis and comparison of two groups respectively.
See Kristiansson et al 2009 for further details.
References
Kristiansson, E., Hugenholtz, P., Dalevi, D. (2009). ShotgunFunctionalizeR: an R-package forfunctional analysis of metagenomes. Bioinformatics 25(20).
See Also
testGeneFamilies, testGeneCategories.poisson, testGeneFamilies.regression,testGeneFamilies.dircomp

34 testGeneFamilies.regression
Examples
Data<-matrix(rpois(n=80, lambda=rep((1:8)*10, each=10)),nr=10, nc=8, byrow=FALSE)
colnames(Data)<-c("A1", "A2", "B1", "B2", "C1", "C2", "D1", "D2")Annotation<-data.frame(GeneFamily=paste("GF", 1:10),
Annotation=paste("GF", 1:10))
Data[3,1:2]<-Data[3,1:2]+10Data[3,3:4]<-Data[3,3:4]+40
SimData<-list(Data=data.frame(Data), Annotation=Annotation,Type="Custom")
summarizeData(SimData)
Design<-cbind(rep(1,8), c(rep(1,6), rep(0,2)),c(rep(1,4), rep(0,4)), c(rep(1,2), rep(0,6)))
print(Design)
res.1<-testGeneFamilies(SimData, method="poisson",design.matrix=Design, coef=3)
res.2<-testGeneFamilies(SimData, method="poisson",design.matrix=Design, coef=4)
testGeneFamilies.regressionPerforms a gene-centric analysis using Poisson regression analysis
Description
testGeneFamilies.regression performs a gene-centric analysis of a specified data setusing Poisson regression. This function provides an easy-to-use interface for regression analysisusing the Poisson model.
Usage
testGeneFamilies.regression(...)
Arguments
... Additional arguments for testGeneFamilies
Details
testGeneFamilies.regression uses testGeneFamilies to perform a regression anal-ysis with the Poisson model. The only arguments necessary are covariates and if these shouldbe log-transformed, log.covariates.
References
Kristiansson, E., Hugenholtz, P., Dalevi, D. (2009). ShotgunFunctionalizeR: an R-package forfunctional analysis of metagenomes. Bioinformatics 25(20).

trendPlot 35
See Also
testGeneFamilies
Examples
## Not run:data(OceanPFAM)res.reg<-testGeneFamilies.regression(OceanPFAM,
covariates=c(10,70,130,200,500,770,4000), log.covariate=T)
## End(Not run)
trendPlot Plots the result from a regression analysis using the Poisson model
Description
trendPlot plots the result from a regression analysis. The relative frequency is shown for eachsample together with the fitted trend line. This function requires that the Poisson model has beenfitted to the data.
Usage
trendPlot(stat, ...)
Arguments
stat results from a regression analysis using Poisson model
... additional arguments to either trendPlot.family or trendPlot.category
Details
Depending on the supplied data object, trendPlot uses either trendPlot.family or trendPlot.categoryto produce a plot.
See Also
groupPlot, groupPlot.family, groupPlot.category, trendPlot.family, trendPlot.category
Examples
## Not run:data(OceanCOG)po.stat<-testGeneFamilies.regression(OceanCOG, covariates=c(10, 70, 130, 200, 500, 770, 4000), log.covariates=T)trendPlot(po.stat, family="COG0415")
## End(Not run)

36 trendPlot.category
trendPlot.category Plots the result from a gene-centric direct comparison using the Pois-son model
Description
trendPlot.category plots the result from a pathway-centric regression analysis. The relativefrequency is shown for each sample and each gene family together with the fitted trend line. Thisfunction requires that the Poisson model has been fitted to the data.
Usage
trendPlot.category(stat.cat, category, x.axis.lab=NULL, xlim, ylim,col.points="black", col.trend="red3",xlab="", plot.counts=TRUE, main,print.pvalue=FALSE, print.pvalue.pos="topright", print.pvalue.cex=1.3,add=FALSE, ...)
Arguments
stat.cat results from a regression analysis using the Poisson model (testGeneCategories.regression)
category a number indicating which gene category to plot
x.axis.lab character vector with labels for the ticks at the x-axis
xlim x limit of the plot. A suitable value is calculated if omitted
ylim y limit of the plot. A suitable value is calculated if omitted
col the color on the character vector with four element indicating the colors of thebars of the first group, the bars of the second group, the horizontal line of thefirst group and the horizontal line of the second group
col.points color of the data points
col.trend color of the fitted trend line
xlab label of the x-axis
plot.counts should the counts be plotted next to the data points?
main the title of the plot. If omitted, the annotation of the gene family will be used
print.pvalue whether the p-value should be printed in plotprint.pvalue.pos
where should be p-value be placed? This argument is analogous to the locationkeywords used by legend.
print.pvalue.cexthe magnification of the text used to print the p-value
add should a new plot be opened or should the figure be added to an existing plot?
... additional arguments for plot
See Also
trendPlot, trendPlot.family, groupPlot,groupPlot.category,groupPlot.category

trendPlot.family 37
Examples
## Not run:data(OceanCOG)po.stat<-testGeneFamilies.regression(OceanCOG, covariates=c(10, 70, 130, 200, 500, 770, 4000), log.covariates=T)trendPlot.category(po.stat, family="COG0415")
## End(Not run)
trendPlot.family Plots the result from a gene-centric direct comparison using the Pois-son model
Description
trendPlot.family plots the result from a gene-centric regression analysis. The normalizedrate is shown for each sample together with the fitted trend line. This function requires that thePoisson model has been fitted to the data.
Usage
trendPlot.family(stat.families, family, x.axis.lab=NULL, xlim, ylim,col.points="black", col.text="grey30", col.trend="red3",xlab="", plot.counts=TRUE, main,print.pvalue=FALSE, print.pvalue.pos="topright", print.pvalue.cex=1.3,add=FALSE, ...)
Arguments
stat.familiesresults from a regression analysis using the Poisson model
family character string indicating which gene family to plot
x.axis.lab character vector with labels for the ticks at the x-axis
xlim x limit of the plot. A suitable value is calculated if omitted
ylim y limit of the plot. A suitable value is calculated if omitted
col the color on the character vector with four element indicating the colors of thebars of the first group, the bars of the second group, the horizontal line of thefirst group and the horizontal line of the second group
col.points color of the data points
col.text color of the text showing the number of counts
col.trend color of the fitted trend line
xlab label of the x-axis
plot.counts should the counts be plotted next to the data points?
main the title of the plot. If omitted, the annotation of the gene family will be used
print.pvalue should the corresponding p-value be printed?print.pvalue.pos
where should be p-value be placed? This argument is analogous to the locationkeywords used by legend.

38 writeRankings
print.pvalue.cexthe magnification of the text used to print the p-value
add should a new plot be opened or should the figure be added to an existing plot?
... additional arguments for plot
See Also
trendPlot, trendPlot.category, groupPlot,groupPlot.family,groupPlot.category
Examples
## Not run:data(OceanCOG)po.stat<-testGeneFamilies.regression(OceanCOG, covariates=c(10, 70, 130, 200, 500, 770, 4000), log.covariates=T)trendPlot.family(po.stat, family="COG0415")
## End(Not run)
writeRankings Writes rankings to a file
Description
Write rankings testGeneFamilies and testGeneCategories to a text file.
Usage
writeRankings(Result, File, col.names=TRUE, sep="\t")
Arguments
Result Results from either testGeneFamilies or testGeneCategories
File Name of the output file
col.names Whether a header should be included
sep the field separator
Details
writeRankingswrite the ranking list from either testGeneFamilies or testGeneCategoriesto a specified file.
Examples
## Not run:data(MouseCOG)groups<-c("Lean", "Lean", "Lean", "Obese", "Obese")res.mouse<-testGeneFamilies(MouseCOG, method="poissongroups", groups=groups)writeRankings(res.mouse, File="Results.txt")
## End(Not run)

Index
∗Topic attributegetSamples, 9getSupportedFamilies, 10
∗Topic filereadGeneFamilies, 17writeRankings, 37
∗Topic hplotclusterSamples, 4densityPlot, 5diversityPlot.family, 6freqPlot.family, 8groupPlot, 10groupPlot.category, 11groupPlot.family, 12ppPlot, 16trendPlot, 34trendPlot.category, 35trendPlot.family, 36
∗Topic htesttestGeneCategories, 19testGeneCategories.dircomp,
21testGeneCategories.enrichment,
22testGeneCategories.gaussiansum,
22testGeneCategories.independence,
23testGeneCategories.poisson,
24testGeneCategories.regression,
25testGeneFamilies, 26testGeneFamilies.binomial, 28testGeneFamilies.dircomp, 29testGeneFamilies.gaussian, 30testGeneFamilies.hypergeometric,
31testGeneFamilies.poisson, 32testGeneFamilies.regression,
33∗Topic nonparametric
calculateRarefaction, 3
estimateDiversity, 7∗Topic package
ShotgunFunctionalizeR-package,1
∗Topic sysdataShotgunFunctionalizeRAnnotationData,
18∗Topic univar
calculatePoissonR2, 2summarizeData, 18
calculatePoissonR2, 2calculateRarefaction, 3, 7, 8clusterSamples, 4countCategories, 5
densityPlot, 5detectGeneFamily, 10diversityPlot.family, 3, 6, 8
estimateDiversity, 7, 7
fisher.test, 23freqPlot.family, 8
getAnnotation, 10getCategory, 5, 22–24getSamples, 9getSupportedFamilies, 10glm, 2groupPlot, 9, 10, 12, 13, 17, 34, 35, 37groupPlot.category, 9, 10, 11, 11, 13,
17, 34, 35, 37groupPlot.family, 9–11, 12, 12, 17, 34,
37
hclust, 4
legend, 11, 12, 35, 36
MouseCOG, 13, 14MouseEC, 13, 13mt.rawp2adjp, 20, 27
OceanCOG, 14, 15, 16
39
40 INDEX
OceanEC, 14, 15, 16OceanPFAM, 14, 15, 15, 16OceanTIGR, 14, 15, 16, 16
plot, 4–6, 35, 37ppPlot, 16
qqplot, 16, 17
readGeneFamilies, 4–7, 9, 10, 17, 18, 27
ShotgunFunctionalizeR(ShotgunFunctionalizeR-package),1
ShotgunFunctionalizeR-package, 1ShotgunFunctionalizeRAnnotationData,
18summarizeData, 18
testGeneCategories, 19, 21–26, 37testGeneCategories.dircomp, 11, 20,
21, 24testGeneCategories.enrichment,
20, 22testGeneCategories.gaussiansum,
20, 22testGeneCategories.independence,
20, 23testGeneCategories.poisson, 20, 24,
32testGeneCategories.regression,
20, 24, 25, 35testGeneFamilies, 20, 22, 26, 28–34, 37testGeneFamilies.binomial, 27, 28,
31testGeneFamilies.dircomp, 12, 27,
29, 32testGeneFamilies.gaussian, 27, 30testGeneFamilies.hypergeometric,
27, 28, 31testGeneFamilies.poisson, 24, 27, 32testGeneFamilies.regression, 27,
32, 33trendPlot, 9, 11–13, 17, 34, 35, 37trendPlot.category, 9–13, 17, 34, 35,
37trendPlot.family, 9–13, 17, 34, 35, 36
writeRankings, 18, 37