PA. Paulk, M., B. Curtis, M. Chrissis, and C. Weber...
21
21 PA. Paulk, M., B. Curtis, M. Chrissis, and C. Weber (1993), “Capability Maturity Model for Software, Version 1.1”, CMU-SEI-93-TR-24, Software Engineering Institute, Pittsburgh PA 15213. Pfleeger, S. (1991), “Model of Software Effort and Productivity,” Information and Software Tech- nology 33 (3), April 1991, pp. 224-231. Royce, W. (1990), “TRW’s Ada Process Model for Incremental Development of Large Software Systems,” Proceedings, ICSE 12, Nice, France, March 1990. Ruhl, M., and M. Gunn (1991), “Software Reengineering: A Case Study and Lessons Learned,” NIST Special Publication 500-193, Washington, DC, September 1991. Selby, R. (1988), “Empirically Analyzing Software Reuse in a Production Environment,” In Soft- ware Reuse: Emerging Technology, W. Tracz (Ed.), IEEE Computer Society Press, 1988., pp. 176-189. Selby, R., A. Porter, D. Schmidt and J. Berney (1991), “Metric-Driven Analysis and Feedback Sys- tems for Enabling Empirically Guided Software Development,” Proceedings of the Thir- teenth International Conference on Software Engineering (ICSE 13), Austin, TX, May 13- 16, 1991, pp. 288-298. Silvestri, G. and J. Lukasieicz (1991), “Occupational Employment Projections,” Monthly Labor Review 114(11), November 1991, pp. 64-94. SPR (1993), “Checkpoint User’s Guide for the Evaluator”, Software Productivity Research, Inc., Burlington, MA., 1993.
Transcript of PA. Paulk, M., B. Curtis, M. Chrissis, and C. Weber...

21
PA.
Paulk, M., B. Curtis, M. Chrissis, and C. Weber (1993), “Capability Maturity Model for Software,Version 1.1”, CMU-SEI-93-TR-24, Software Engineering Institute, Pittsburgh PA 15213.
Pfleeger, S. (1991), “Model of Software Effort and Productivity,”Information and Software Tech-nology 33 (3), April 1991, pp. 224-231.
Royce, W. (1990), “TRW’s Ada Process Model for Incremental Development of Large SoftwareSystems,”Proceedings, ICSE 12, Nice, France, March 1990.
Ruhl, M., and M. Gunn (1991), “Software Reengineering: A Case Study and Lessons Learned,”NIST Special Publication 500-193, Washington, DC, September 1991.
Selby, R. (1988), “Empirically Analyzing Software Reuse in a Production Environment,” In Soft-ware Reuse: Emerging Technology, W. Tracz (Ed.), IEEE Computer Society Press, 1988.,pp. 176-189.
Selby, R., A. Porter, D. Schmidt and J. Berney (1991), “Metric-Driven Analysis and Feedback Sys-tems for Enabling Empirically Guided Software Development,”Proceedings of the Thir-teenth International Conference on Software Engineering (ICSE 13), Austin, TX, May 13-16, 1991, pp. 288-298.
Silvestri, G. and J. Lukasieicz (1991), “Occupational Employment Projections,” Monthly LaborReview 114(11), November 1991, pp. 64-94.
SPR (1993), “Checkpoint User’s Guide for the Evaluator”, Software Productivity Research, Inc.,Burlington, MA., 1993.
20
Boehm, B., and W. Royce (1989), “Ada COCOMO and the Ada Process Model,”Proceedings,Fifth COCOMO Users’ Group Meeting, Software Engineering Institute, Pittsburgh, PA,November 1989.
Boehm, B., B. Clark, E. Horowitz, C. Westland, R. Madachy, R. Selby (1995), “Cost Models forFuture Software Life Cycle Processes: COCOMO 2.0,” to appear in Annals of SoftwareEngineering Special Volume on Software Process and Product Measurement, J.D. Arthurand S.M. Henry, Eds., J.C. Baltzer AG, Science Publishers, Amsterdam, The Netherlands.Available from the Center for Software Engineering, University of Southern California.
Chidamber, S. and C. Kemerer (1994), “A Metrics Suite for Object Oriented Design,”IEEE Trans-actions on Software Engineering, (to appear 1994).
Computer Science and Telecommunications Board (CSTB) National Research Council (1993),Computing Professionals: Changing Needs for the 1990’s, National Academy Press,Washington DC, 1993.
Devenny, T. (1976). “An Exploratory Study of Software Cost Estimating at the Electronic SystemsDivision,” Thesis No. GSM/SM/765-4, Air Force Institute of Technology, Dayton, OH.
Gerlich, R., and U. Denskat (1994), “A Cost Estimation Model for Maintenance and High Reuse,”Proceedings, ESCOM 1994, Ivrea, Italy.
Goethert, W., E. Bailey, M. Busby (1992), “Software Effort and Schedule Measurement: A Frame-work for Counting Staff Hours and Reporting Schedule Information.” CMU/SEI-92-TR-21, Software Engineering Institute, Pittsburgh, PA.
Goudy, R. (1987), “COCOMO-Based Personnel Requirements Model,”Proceedings, Third CO-COMO Users’ Group Meeting, Software Engineering Institute, Pittsburgh, PA, November1987.
IFPUG (1994),IFPUG Function Point Counting Practices: Manual Release 4.0, InternationalFunction Point Users’ Group, Westerville, OH.
Kauffman, R., and R. Kumar (1993), “Modeling Estimation Expertise in Object Based ICASE En-vironments,” Stern School of Business Report, New York University, January 1993.
Kemerer, C. (1987), “An Empirical Validation of Software Cost Estimation Models,”Communi-cations of the ACM, May 1987, pp. 416-429.
Kominski, R. (1991),Computer Use in the United States: 1989, Current Population Reports, SeriesP-23, No. 171, U.S. Bureau of the Census, Washington, D.C., February 1991.
Kunkler, J. (1983), “A Cooperative Industry Study on Software Development/Maintenance Pro-ductivity,” Xerox Corporation, Xerox Square --- XRX2 52A, Rochester, NY 14644, ThirdReport, March 1985.
Miyazaki, Y., and K. Mori (1985), “COCOMO Evaluation and Tailoring,”Proceedings, ICSE 8,IEEE-ACM-BCS, London, August 1985, pp. 292-299.
Parikh, G., and N. Zvegintzov (1983). “The World of Software Maintenance,”Tutorial on Soft-ware Maintenance, IEEE Computer Society Press, pp. 1-3.
Park R. (1992), “Software Size Measurement: A Framework for Counting Source Statements.”CMU/SEI-92-TR-20, Software Engineering Institute, Pittsburgh, PA.
Park R, W. Goethert, J. Webb (1994), “Software Cost and Schedule Estimating: A Process Im-provement Initiative”, CMU/SEI-94-SR-03, Software Engineering Institute, Pittsburgh,

19
7. CONCLUSIONS
Software development trends towards reuse, reengineering, commercial off-the shelf(COTS) packages, object orientation, applications composition capabilities, non-sequential pro-cess models, rapid development approaches, and distributed middleware capabilities require newapproaches to software cost estimation.
The wide variety of current and future software processes, and the variability of informa-tion available to support software cost estimation, require a family of models to achieve effectivecost estimates.
The baseline COCOMO 2.0 family of software cost estimation models presented here pro-vides a tailorable cost estimation capability well matched to the major current and likely futuresoftware process trends.
The baseline COCOMO 2.0 model effectively addresses its objectives of openness, parsi-mony, and continuity from previous COCOMO models. It is currently serving as the frameworkfor an extensive data collection and analysis effort to further refine and calibrate its estimation ca-pabilities.
8. ACKNOWLEDGMENTS
This work has been supported both financially and technically by the COCOMO 2.0 Pro-gram Affiliates: Aerospace, AT&T Bell Labs, Bellcore, DISA, EDS, E-Systems, Hewlett-Packard,Hughes, IDA, IDE, JPL, Litton Data Systems, Lockheed, Loral, MDAC, Motorola, Northrop, Ra-tional, Rockwell, SAIC, SEI, SPC, Sun, TASC, Teledyne, TI, TRW, USAF Rome Lab, US ArmyResearch Lab, Xerox.
9. REFERENCES
Amadeus (1994),Amadeus Measurement System User’s Guide, Version 2.3a, Amadeus SoftwareResearch, Inc., Irvine, California, July 1994.
Banker, R., R. Kauffman and R. Kumar (1994), “An Empirical Test of Object-Based Output Mea-surement Metrics in a Computer Aided Software Engineering (CASE) Environment,”Journal of Management Information Systems (to appear, 1994).
Banker, R., H. Chang and C. Kemerer (1994a), “Evidence on Economies of Scale in Software De-velopment,” Information and Software Technology (to appear, 1994).
Behrens, C. (1983), “Measuring the Productivity of Computer Systems Development Activitieswith Function Points,”IEEE Transactions on Software Engineering, November 1983.
Boehm, B. (1981),Software Engineering Economics, Prentice Hall.
Boehm, B. (1983), “The Hardware/Software Cost Ratio: Is It a Myth?”Computer 16(3), March1983, pp. 78-80.
Boehm, B. (1985), “COCOMO: Answering the Most Frequent Questions,” InProceedings, FirstCOCOMO Users’ Group Meeting, Wang Institute, Tyngsboro, MA, May 1985.
Boehm, B. (1989),Software Risk Management, IEEE Computer Society Press, Los Alamitos, CA.
Boehm, B., T. Gray, and T. Seewaldt (1984), “Prototyping vs. Specifying: A Multi-Project Exper-iment,” IEEE Transactions on Software Engineering, May 1984, pp. 133-145.
18
6.3.4 PEXP - PLATFORM EXPERIENCE
COCOMO 2.0 broadens the productivity influence of PEXP, recognizing the importanceof understanding the use of more powerful platforms, including more graphic user interface, data-base, networking, and distributed middleware capabilities;
6.3.5 LTEX - LANGUAGE AND TOOL EXPERIENCE
This is a measure of the level of programming language and software tool experience of theproject team developing the software system or subsystem. Software development includes the useof tools that perform requirements and design representation and analysis, configuration manage-ment, document extraction, library management, program style and formatting, consistency check-ing, etc. In addition to experience in programming with a specific language the supporting tool setalso effects development time. A low rating given for experience of less than 2 months. A very highrating is given for experience of 6 or more years.
6.3.6 PCON - PERSONNEL CONTINUITY
The rating scale for PCON is in terms of the project’s annual personnel turnover: from 3%,very high, to 48%, very low.
6.4 PROJECT FACTORS
6.4.1 TOOL - USE OF SOFTWARE TOOLS
Software tools have improved significantly since the 1970’s projects used to calibrate CO-COMO. The tool rating ranges from simple edit and code, very low, to integrated lifecycle man-agement tools, very high.
6.4.2 SITE - MULTISITE DEVELOPMENT
Given the increasing frequency of multisite developments, and indications that multisitedevelopment effects are significant, the SITE cost driver has been added in COCOMO 2.0. Deter-mining its cost driver rating involves the assessment and averaging of two factors: site collocation(from fully collocated to international distribution) and communication support (from surface mailand some phone access to full interactive multimedia).
6.4.3 SCED - REQUIRED DEVELOPMENT SCHEDULE
This rating measures the schedule constraint imposed on the project team developing thesoftware. The ratings are defined in terms of the percentage of schedule stretch-out or accelerationwith respect to a nominal schedule for a project requiring a given amount of effort. Acceleratedschedules tend to produce more effort in the later phases of development because more issues areleft to be determined due to lack of time to resolve them earlier. A schedule compress of 74% israted very low. A stretch-out of a schedule produces more effort in the earlier phases of develop-ment where there is more time for thorough planning, specification and validation. A stretch-outof 160% is rated very high.
17
veloped then the platform is the hardware and the operating system. If a network text browser is tobe developed then the platform is the network, computer hardware, the operating system, and thedistributed information repositories. The platform includes any compilers or assemblers support-ing the development of the software system. This rating ranges from low, where there is a majorchange every 12 months, to very high, where there is a major change every two weeks.
6.3 PERSONNEL FACTORS
6.3.1 ACAP - A NALYST CAPABILITY
Analysts are personnel that work on requirements, high level design and detailed design.The major attributes that should be considered in this rating are ability, efficiency and thorough-ness, and the ability to communicate and cooperate. The rating should not consider the level of ex-perience of the analyst, that is rated with AEXP. Analyst that fall in the 15th percentile are ratedvery low and those that fall in the 95th percentile are rated as very high.
6.3.2 PCAP - PROGRAMMER CAPABILITY
Current trends continue to emphasize the importance of highly capable analysts. Howeverthe increasing role of complex COTS packages, and the significant productivity leverage associat-ed with programmers’ ability to deal with these COTS packages, indicates a trend toward higherimportance of programmer capability as well.
Evaluation should be based on the capability of the programmers as a team rather than asindividuals. Major factors which should be considered in the rating are ability, efficiency and thor-oughness, and the ability to communicate and cooperate. The experience of the programmer shouldnot be considered here; it is rated with AEXP. A very low rated programmer team is in the 15thpercentile and a very high rated programmer team is in the 95th percentile.
6.3.3 AEXP - APPLICATIONS EXPERIENCE
This rating is dependent on the level of applications experience of the project team devel-oping the software system or subsystem. The ratings are defined in terms of the project team’sequivalent level of experience with this type of application. A very low rating is for applicationexperience of less than 2 months. A very high rating is for experience of 6 years or more.
Extra High Multiple resource sched-uling with dynamicallychanging priorities.Microcode-level control.Distributed hard real-time control.
Difficult andunstructurednumerical analy-sis: highly accu-rate analysis ofnoisy, stochasticdata. Complex par-allelization.
Device timing-dependent coding,micro-pro-grammed opera-tions.Performance-criti-cal embedded sys-tems.
Highly coupled,dynamic relationaland object struc-tures. Natural lan-guage datamanagement.
Complex multi-media, virtualreality.
Table 6: Module Complexity Ratings versus Type of Module
Rating Control OperationsComputational
Operations
Device-dependentOperations
DataManagementOperations
UserInterface
ManagementOperations

16
Table 6: Module Complexity Ratings versus Type of Module
Rating Control OperationsComputational
Operations
Device-dependentOperations
DataManagementOperations
UserInterface
ManagementOperations
Very Low Straight-line code with afew non-nested struc-tured programming oper-ators: DOs, CASEs,IFTHENELSEs. Simplemodule composition viaprocedure calls or sim-ple scripts.
Evaluation of sim-ple expressions:e.g., A=B+C*(D-E)
Simple read, writestatements withsimple formats.
Simple arrays inmain memory.Simple COTS-DBqueries, updates.
Simple inputforms, reportgenerators.
Low Straightforward nestingof structured program-ming operators. Mostlysimple predicates
Evaluation of mod-erate-level expres-sions: e.g.,D=SQRT(B**2-4.*A*C)
No cognizanceneeded of particu-lar processor or I/Odevice characteris-tics. I/O done atGET/PUT level.
Single file subset-ting with no datastructure changes,no edits, no inter-mediate files. Mod-erately complexCOTS-DB que-ries, updates.
Use of simplegraphic userinterface (GUI)builders.
Nominal Mostly simple nesting.Some intermodule con-trol. Decision tables.Simple callbacks or mes-sage passing, includingmiddleware-supporteddistributed processing
Use of standardmath and statisti-cal routines. Basicmatrix/vector oper-ations.
I/O processingincludes deviceselection, statuschecking and errorprocessing.
Multi-file input andsingle file output.Simple structuralchanges, simpleedits. ComplexCOTS-DB que-ries, updates.
Simple use ofwidget set.
High Highly nested structuredprogramming operatorswith many compoundpredicates. Queue andstack control. Homoge-neous, distributed pro-cessing. Singleprocessor soft real-timecontrol.
Basic numericalanalysis: multivari-ate interpolation,ordinary differen-tial equations.Basic truncation,roundoff concerns.
Operations at phys-ical I/O level(physical storageaddress transla-tions; seeks, reads,etc.). Optimized I/O overlap.
Simple triggersactivated by datastream contents.Complex datarestructuring.
Widget set devel-opment andextension. Sim-ple voice I/O,multimedia.
Very High Reentrant and recursivecoding. Fixed-priorityinterrupt handling. Tasksynchronization, com-plex callbacks, heteroge-neous distributedprocessing. Single-pro-cessor hard real-timecontrol.
Difficult but struc-tured numericalanalysis: near-sin-gular matrix equa-tions, partialdifferential equa-tions. Simple paral-lelization.
Routines for inter-rupt diagnosis, ser-vicing, masking.Communicationline handling. Per-formance-inten-sive embeddedsystems.
Distributed data-base coordination.Complex triggers.Search optimiza-tion.
Moderately com-plex 2D/3D,dynamic graph-ics, multimedia.

15
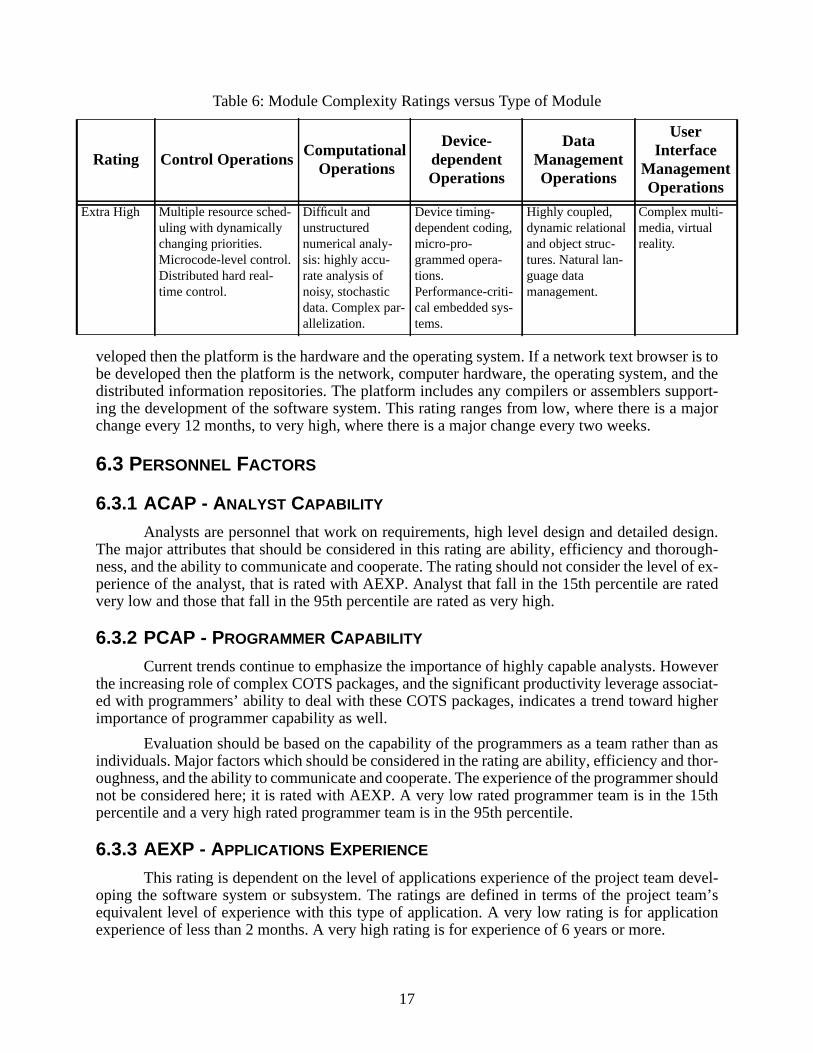
6.1.3 CPLX - PRODUCT COMPLEXITY
Table 6 provides the new COCOMO 2.0 CPLX rating scale. Complexity is divided intofive areas: control operations, computational operations, device-dependent operations, data man-agement operations, and user interface management operations. Select the area or combination ofareas that characterize the product or a sub-system of the product. The ratings range from very lowto extra high.
6.1.4 RUSE - REQUIRED REUSABILITY
This cost driver accounts for the additional effort needed to construct components intendedfor reuse on the current or future projects. This effort is consumed with creating more generic de-sign of software, more elaborate documentation, and more extensive testing to ensure componentsare ready for use in other applications.
6.1.5 DOCU - DOCUMENTATION MATCH TO LIFE -CYCLE NEEDS
Several software cost models have a cost driver for the level of required documentation. InCOCOMO 2.0, the rating scale for the DOCU cost driver is evaluated in terms of the suitability ofthe project’s documentation to its life-cycle needs. The rating scale goes from Very Low (manylife-cycle needs uncovered) to Very High (very excessive for life-cycle needs).
6.2 PLATFORM FACTORS
The platform refers to the target-machine complex of hardware and infrastructure software(previously called the virtual machine). The factors have been revised to reflect this as describedin this section. Some additional platform factors were considered, such as distribution, parallelism,embeddedness, and real-time operation, but these considerations have been accommodated by theexpansion of the Module Complexity ratings in Table 6.
6.2.1 TIME - EXECUTION TIME CONSTRAINT
This is a measure of the execution time constraint imposed upon a software system. Therating is expressed in terms of the percentage of available execution time expected to be used bythe system or subsystem consuming the execution time resource. The rating ranges from nominal,less than 50% of the execution time resource used, to extra high, 95% of the execution time re-source is consumed.
6.2.2 STOR - MAIN STORAGE CONSTRAINT
This rating represents the degree of main storage constraint imposed on a software systemor subsystem. Given the remarkable increase in available processor execution time and main stor-age, one can question whether these constraint variables are still relevant. However, many appli-cations continue to expand to consume whatever resources are available, making these cost driversstill relevant. The rating ranges from nominal, less that 50%, to extra high, 95%.
6.2.3 PVOL - PLATFORM VOLATILITY
“Platform” is used here to mean the complex of hardware and software (OS, DBMS, etc.)the software product calls on to perform its tasks. If the software to be developed is an operatingsystem then the platform is the computer hardware. If a database management system is to be de-

14
Table 5: Effort Multipliers Cost Driver Ratings for the Post-Architecture Model
Very Low Low Nominal High Very High Extra High
RELY slight inconve-nience
low, easilyrecoverablelosses
moderate, eas-ily recoverablelosses
high financialloss
risk to humanlife
DATA DB bytes/PgmSLOC < 10
10 ≤ D/P < 100 100≤ D/P <1000
D/P ≥ 1000
CPLX see Table 6
RUSE none across project across program across productline
across multi-ple productlines
DOCU Many life-cycle needsuncovered
Some life-cycle needsuncovered.
Right-sized tolife-cycleneeds
Excessive forlife-cycleneeds
Very excessivefor life-cycleneeds
TIME ≤ 50% use ofavailable exe-cution time
70% 85% 95%
STOR ≤ 50% use ofavailable stor-age
70% 85% 95%
PVOL major changeevery 12 mo.;minor changeevery 1 mo.
major: 6 mo.;minor: 2 wk.
major: 2 mo.;minor: 1 wk.
major: 2 wk.;minor: 2 days
ACAP 15th percentile 35th percentile 55th percentile 75th percentile 90th percentile
PCAP 15th percentile 35th percentile 55th percentile 75th percentile 90th percentile
PCON 48% / year 24% / year 12% / year 6% / year 3% / year
AEXP ≤ 2 months 6 months 1 year 3 years 6 years
PEXP ≤ 2 months 6 months 1 year 3 years 6 year
LTEX ≤ 2 months 6 months 1 year 3 years 6 year
TOOL edit, code,debug
simple, fron-tend, backendCASE, littleintegration
basic lifecycletools, moder-ately integrated
strong, maturelifecycle tools,moderatelyintegrated
strong,mature, proac-tive lifecycletools, well inte-grated withprocesses,methods, reuse
SITE:Collocation
International Multi-city andMulti-com-pany
Multi-city orMulti-com-pany
Same city ormetro. area
Same buildingor complex
Fully collo-cated
SITE:Communications
Some phone,mail
Individualphone, FAX
Narrowbandemail
Widebandelectroniccommunica-tion.
Widebandelect. comm,occasionalvideo conf.
Interactivemultimedia
SCED 75% of nomi-nal
85% 100% 130% 160%
13
If B > 1.0, the project exhibits diseconomies of scale. This is generally due to two mainfactors: growth of interpersonal communications overhead and growth of large-system integrationoverhead. Larger projects will have more personnel, and thus more interpersonal communicationspaths consuming overhead. Integrating a small product as part of a larger product requires not onlythe effort to develop the small product, but also the additional overhead effort to design, maintain,integrate, and test its interfaces with the remainder of the product.
See [Banker et al 1994a] for a further discussion of software economies and diseconomiesof scale.
5.3 ADJUSTING EFFORT FOR DEVELOPMENT CHARACTERISTICS
Effort multipliers (EM) capture characteristics of the software development that affect theeffort to complete the project. These multipliers are weighted and their product is used to adjustthe nominal person month effort. The nominal weight assigned to each multiplier is 1.0. If a ratinglevel has a detrimental effect on effort, then its corresponding multiplier is above 1.0. Conversely,if the rating level reduces the effort then the corresponding multiplier is less than 1.0. The effortmultipliers are discussed in the next section.
EQ 4.
6. EFFORT-MULTIPLIER COST DRIVERS
These are the effort 17 multipliers used in COCOMO 2.0 Post-Architecture model to adjustthe nominal effort, Person Months, to reflect the software product under development. They aregrouped into four categories: product, platform, personnel, and project. Table 4 lists the differentcost drivers with their rating criterion. The counterpart 7 cost drivers for the Early Design Modelare defined in [Boehm et al. 1995]
6.1 PRODUCT FACTORS
6.1.1 RELY- REQUIRED SOFTWARE RELIABILITY
This is the measure of the extent to which the software must perform its intended functionover a period of time. If the effect of a software failure is only slight inconvenience then RELY islow. If a failure would risk human life then RELY is very high.
6.1.2 DATA - DATA BASE SIZE
This measure attempts to capture the effect of large data requirements on product develop-ment. The rating is determined by calculating D/P.
EQ 5.
DATA is rated as low if D/P is less than 10 and it is very high if it is greater than 1000.
PMadjusted PMnominal EMii
∏ ×=
DP---- DataBaseSize Bytes( )
ProgramSize SLOC( )----------------------------------------------------------=

12
months (PM) is given by EQ 2.
EQ 2.
5.2 EXPONENT SCALE FACTORS
Table 4 provides the rating levels for the COCOMO 2.0 exponent scale factors. A project'snumerical ratingsWi are summed across all of the factors, and used to determine a scale exponentB via the following formula:
EQ 3.
Thus, a 100 KSLOC project with Extra High (0) ratings for all factors will haveWi = 0, B= 1.01, and a relative effortE = 1001.01= 105 PM. A project with Very Low (5) ratings for all fac-tors will haveWi= 25, B = 1.26, and a relative effortE = 331 PM. This represents a large variation,but the increase involved in a one-unit change in one of the factors is only about 4.7%. Thus, thisapproach avoids the 40% swings involved in choosing a development mode for a 100 KSLOCproduct in the original COCOMO.
If B < 1.0, the project exhibits economies of scale. If the product's size is doubled, theproject effort is less than doubled. The project's productivity increases as the product size is in-creased. Some project economies of scale can be achieved via project-specific tools (e.g., simula-tions, testbeds), but in general these are difficult to achieve. For small projects, fixed startup costssuch as tailoring and setup of standards and administrative reports are a source of economies ofscale.
If B = 1.0, the economies and diseconomies of scale are in balance. This linear model isoften used for cost estimation of small projects. It is used for the COCOMO 2.0 Applications Com-position model.
* % significant module interfaces specified,% significant risks eliminated.† The form of the Process Maturity scale is being resolved in coordination with the SEI. The intent is to produce
a process maturity rating as a weighted average of the project's responses to the most recent Capability Ma-turity Model-based Maturity Questionnaire, rather than to use the previous 1-to-5 maturity levels. Theweights to be applied to the Maturity Questionnaire questions are still being determined.
Table 4: Rating Scheme for the COCOMO 2.0 Scale Factors
Scale Factors(Wi)
Very Low(5)
Low(4)
Nominal(3)
High(2)
Very High(1)
Extra High(0)
Precedentedness thoroughlyunprecedented
largelyunprecedented
somewhatunprecedented
generallyfamiliar
largely famil-iar
throughlyfamiliar
DevelopmentFlexibility
rigorous occasionalrelaxation
somerelaxation
generalconformity
someconformity
general goals
Architecture /
risk resolution*little (20%) some (40%) often (60%) generally
(75%)mostly (90%) full (100%)
Team cohesion very difficultinteractions
some difficultinteractions
basicallycooperativeinteractions
largelycooperative
highlycooperative
seamlessinteractions
Process maturity† Weighted average of “Yes” answers to CMM Maturity Questionnaire
PMnominal A Size( ) B×=
B 1.01 0.01ΣWi+=

11
The COCOMO 2.0 re-engineering and conversion estimation approach involves estimationof an additional parameter, AT, the percentage of the code that is re-engineered byautomatic trans-lation. Based on an analysis of the project data above, an effort estimator for automated translationis 2400 source statements / person month; the normal COCOMO 2.0 reuse model is used for theremainder of the re-engineered software.
The NIST case study also provides useful guidance on estimating the AT factor, which isa strong function of the difference between the boundary conditions (e.g., use of COTS packages,change from batch to interactive operation) of the old code and the re-engineered code. The NISTdata on percentage of automated translation (from an original batch processing application withoutCOTS utilities) are given in Table 3.
4.2.4 APPLICATIONS MAINTENANCE
The original COCOMO used Annual Change Traffic (ACT), the percentage of code mod-ified and added to the software product per year, as the primary measure for sizing a software main-tenance activity. This has caused some difficulties, primarily the restriction to annual incrementand a set of inconsistencies with the reuse model. COCOMO 2.0 remedies these difficulties by ap-plying the reuse model to maintenance as well.
5. COCOMO 2.0 COST MODELING
5.1 MODELING EFFORT
This software cost estimation model has an exponential factor to account for the relativeeconomies or diseconomies of scale encountered as a software project increases its size. This factoris represented as the exponentB. A constant is used to capture the linear effects on effort withprojects of increasing size. The nominal effort for a given size project and expressed as person
Table 2: Rating Scale for Assessment and Assimilation Increment (AA)
AA Increment Level of AA Effort
0 None
2 Basic module search and documentation
4 Some module Test and Evaluation (T&E), documentation
6 Considerable module T&E, documentation
8 Extensive module T&E, documentation
Table 3: Variation in Percentage of Automated Re-engineering [Ruhl and Gunn 1991]
Re-engineering Target AT (% automated translation)
Batch processing 96%Batch with SORT 90%Batch with DBMS 88%Batch, SORT, DBMS 82%Interactive 50%

10
This involves estimating the amount of software to be adapted, ASLOC, and three degree-of-modification parameters: the percentage of design modification (DM); the percentage of codemodification (CM), and the percentage of the original integration effort required for integrating thereused software (IM). TheSoftware Understanding increment (SU) is obtained from Table 1. Asindicated in Table 1, if the software is rated very high on structure, applications clarity, and self-descriptiveness, the software understanding and interface checking penalty is only 10%. If the soft-ware is rated very low on these factors, the penalty is 50%.
The other nonlinear reuse increment deals with the degree of assessment and assimilationneeded to determine whether even a fully-reused software module is appropriate to the application,and to integrate its description into the overall product description. Table 2 provides the ratingscale and values for theAssessment and Assimilation increment (AA). For software conversion,this factor extends the Conversion Planning Increment in [Boehm 1981, p. 558].
4.2.3 RE-ENGINEERING AND CONVERSION COST ESTIMATION
The COCOMO 2.0 reuse model needs additional refinement to estimate the costs of soft-ware re-engineering and conversion. The major difference in re-engineering and conversion is theefficiency of automated tools for software restructuring. These can lead to very high values for thepercentage of code modified (CM in the COCOMO 2.0 reuse model), but with very little corre-sponding effort. For example, in the NIST re-engineering case study [Ruhl and Gunn 1991], 80%of the code (13,131 COBOL source statements) was re-engineered by automatic translation, andthe actual re-engineering effort, 35 person months, was a factor of over 4 lower than the COCOMOestimate of 152 person months.
Table 1: Rating Scale for Software Understanding Increment SU
Very Low Low Nom High Very High
Structure
Very low cohe-sion, high cou-pling, spaghetticode.
Moderatelylow cohesion,high coupling.
Reasonablywell-struc-tured; someweak areas.
High cohe-sion, low cou-pling.
Strong modu-larity, infor-mation hidingin data / con-trol structures.
ApplicationClarity
No matchbetween pro-gram and appli-cation worldviews.
Some correla-tion betweenprogram andapplication.
Moderate cor-relationbetween pro-gram andapplication.
Good correla-tion betweenprogram andapplication.
Clear matchbetween pro-gram andapplicationworld-views.
Self-Descriptiveness
Obscure code;documentationmission, obscureor obsolete
Some codecommentaryand headers;some usefuldocumenta-tion.
Moderatelevel of codecommentary,headers, docu-mentations.
Good codecommentaryand headers;useful docu-mentation;some weakareas.
Self-descrip-tive code; doc-umentationup-to-date,well-orga-nized, withdesign ratio-nale.
SU Incrementto AAF
50 40 30 20 10

9
1)/2.
Figure 4 shows this relation between the number of modules modifiedk and the resultingnumber of module interface checks required.
The shape of this curve is similar for other values ofm. It indicates that there are nonlineareffects involved in the module interface checking which occurs during the design, code, integra-tion, and test of modified software.
The size of both the software understanding penalty and the module interface checking pen-alty can be reduced by good software stucturing. Modular, hierarchical structuring can reduce thenumber of interfaces which need checking [Gerlich and Denskat 1994], and software which is wellstructured, explained, and related to its mission will be easier to understand. COCOMO 2.0 reflectsthis in its allocation of estimated effort for modifying reusable software.
The reuse equation for equivalent new software (ESLOC) to be developed is:
EQ 1.
Figure 3. Nonlinear Reuse Effects
0.5
0.25
0.75
1.0
0.046
0.25 0.5 0.75 1.0
Usual Linear Assumption
Data on 2954NASA modules[Selby, 1988]
RelativeCost
Amount Modified
0.55
0.70
1.00
Figure 4. Number of Module Interface Checks vs. Fraction Modified
2 4 6 8 10
15
30
45
k
N
m = 10
●
●
●
●●
17
30
39 44 45
ESLOC ASLOCAA SU+
100--------------------- 0.4 DM 0.3 CM 0.3 IM×+×+×+
×=

8
Some changes were made to the line-of-code definition that depart from the default defini-tion provided in [Park 1992]. These changes eliminate categories of software which are generallysmall sources of project effort. Not included in the definition are commercial-off-the-shelf soft-ware (COTS), government furnished software (GFS), other products, language support librariesand operating systems, or other commercial libraries. Code generated with source code generatorsis not included though measurements will be taken with and without generated code to supportanalysis.
The “COCOMO 2.0 line-of-code definition” is calculated directly by the Amadeus auto-mated metrics collection tool [Amadeus 1994] [Selby et al. 1991], which is being used to ensureuniformly collected data in the COCOMO 2.0 data collection and analysis project. We have devel-oped a set of Amadeus measurement templates that support the COCOMO 2.0 data definitions foruse by the organizations collecting data, in order to facilitate standard definitions and consistentdata across participating sites.
To support further data analysis, Amadeus will automatically collect additional measuresincluding total source lines, comments, executable statements, declarations, structure, componentinterfaces, nesting, and others. The tool will provide various size measures, including some of theobject sizing metrics in [Chidamber and Kemerer 1994], and the COCOMO formulation will adaptaccording to the analysis results.
4.2 ADJUSTING SOFTWARE DEVELOPMENT SIZE
4.2.1 BREAKAGE
COCOMO 2.0 replaces the COCOMO Requirements Volatility effort multiplier and theAda COCOMO Requirements Volatility exponent driver by a breakage percentage, BRAK, usedto adjust the effective size of the product. Consider a project which delivers 100,000 instructionsbut discards the equivalent of an additional 20,000 instructions. This project would have a BRAKvalue of 20, which would be used to adjust its effective size to 120,000 instructions for COCOMO2.0 estimation. The BRAK factor is not used in the Applications Composition model, where a cer-tain degree of product iteration is expected, and included in the data calibration.
4.2.2 EFFECTS FROM REUSE
The COCOMO 2.0 model uses a nonlinear estimation model for estimating size in reusingsoftware products. Analysis in [Selby 1988] of reuse costs across nearly 3000 reused modules inthe NASA Software Engineering Laboratory indicates that the reuse cost function is nonlinear intwo significant ways (see Figure 3):
• It does not go through the origin. There is generally a cost of about 5% for assessing,selecting, and assimilating the reusable component.
• Small modifications generate disproportionately large costs. This is primarily due totwo factors: the cost of understanding the software to be modified, and the relative costof interface checking.
[Parikh and Zvegintzov 1983] contains data indicating that 47% of the effort in softwaremaintenance involves understanding the software to be modified. Thus, as soon as one goes fromunmodified (black-box) reuse to modified-software (white-box) reuse, one encounters this soft-ware understanding penalty. Also, [Gerlich and Denskat 1994] shows that, if one modifiesk out ofm software modules, the numberN of module interface checks required isN = k * (m-k) + k * (k-

7Figure 2. Definition Checklist
Definition Checklist for Source StatementsCounts
Definition name: __Logical Source Statements___Date:________________
________________(basic definition)__________Originator:_COCOMO 2.0____
Measurement unit: Physical source lines
Logical source statements 4Statement type Definition ✔ Data Array Includes Excludes
When a line or statement contains more than one type,classify it as the type with the highest precedence.
1 Executable Order of precedence → 1 ✔
2 Nonexecutable3 Declarations 2 ✔
4 Compiler directives 3 ✔
5 Comments6 On their own lines 4 ✔
7 On lines with source code 5 ✔
8 Banners and non-blank spacers 6 ✔
9 Blank (empty) comments 7 ✔
10 Blank lines 8 ✔
1112How produced Definition ✔ Data array Includes Excludes1 Programmed ✔
2 Generated with source code generators ✔
3 Converted with automated translators ✔
4 Copied or reused without change ✔
5 Modified ✔
6 Removed ✔
78Origin Definition ✔ Data array Includes Excludes1 New work: no prior existence ✔
2 Prior work: taken or adapted from3 A previous version, build, or release ✔
4 Commercial, off-the-shelf software (COTS), other than libraries ✔
5 Government furnished software (GFS), other than reuse libraries ✔
6 Another product ✔
7 A vendor-supplied language support library (unmodified) ✔
8 A vendor-supplied operating system or utility (unmodified) ✔
9 A local or modified language support library or operating system ✔
10 Other commercial library ✔
11 A reuse library (software designed for reuse) ✔
12 Other software component or library ✔
1314

6
tion points and a coarse-grained set of 7 cost drivers (e.g., two cost drivers for Personnel Capabilityand Personnel Experience in place of the 6 Post-Architecture model cost drivers covering variousaspects of personnel capability, continuity, and experience). This level of detail is consistent withthe general level of information available and the general level of estimation accuracy needed atthis time in the development.
ThePost-Architecture Modelinvolves the actual development and maintenance of a soft-ware product. The product should have a life-cycle architecture, which provides more accurate in-formation on cost driver inputs, and enables more accurate cost estimates. This architecture can bevalidated with respect to the system's mission, concept of operation, and risk; and established asthe framework for the product. It uses source instructions and / or function points for sizing, withmodifiers for reuse and software breakage; a set of 17 multiplicative cost drivers; and a set of 5factors determining the project's scaling exponent.
The above models should be considered as current working hypotheses about the most ef-fective forms for COCOMO 2.0. They will be subject to revision based on subsequent data analy-sis. Data analysis should also enable the further calibration of the relationships between objectpoints, function points, and source lines of code for various languages and composition systems,enabling flexibility in the choice of sizing parameters.
4. SIZING SOFTWARE DEVELOPMENT
As has been discussed, the COCOMO 2.0 model uses three different metrics for sizing aproject: Object Points, Unadjusted Function Points, and Source Lines of Code (SLOC). ObjectPoints are defined as in Section 3.1.1 above. Unadjusted Function Points involve using the standard[IFPUG 1994] sizing approach involving a linear combination of inputs, outputs, files, interfaces,and queries; but not using the 14 application characteristics such as distributed functions, perfor-mance, and reuse. Instead, COCOMO 2.0 accounts for such factors via its normal set of cost driversand relationships. The remainder of this Section discusses the definition and rationale for SLOCand how size is adjusted in dealing with software breakage, reuse, re-engineering, and mainte-nance.
4.1 SOURCE LINES OF CODE
In COCOMO 2.0, the logical source statement has been chosen as the standard line of code.Defining a line of code is difficult due to conceptual differences involved in accounting for exe-cutable statements and data declarations in different languages. The goal is to measure the amountof intellectual work put into program development, but difficulties arise when trying to define con-sistent measures across different languages. To minimize these problems, the Software Engineer-ing Institute (SEI) definition checklist for a logical source statement is used in defining the line ofcode measure. The Software Engineering Institute (SEI) has developed this checklist as part of asystem of definition checklists, report forms and supplemental forms to support measurement def-initions [Park 1992, Goethert et al. 1992].
Figure 2 shows a portion of the definition checklist as it is being applied to support the de-velopment of the COCOMO 2.0 model. Each checkmark in the “Includes” column identifies a par-ticular statement type or attribute included in the definition, and vice-versa for the excludes. Othersections in the definition clarify statement attributes for usage, delivery, functionality, replicationsand development status. There are also clarifications for language specific statements for ADA, C,C++, CMS-2, COBOL, FORTRAN, JOVIAL and Pascal.

5
• Preserve the openness of the original COCOMO;
• Key the structure of COCOMO 2.0 to the future software marketplace sectors describedabove;
• Key the inputs and outputs of the COCOMO 2.0 submodels to the level of informationavailable;
• Enable the COCOMO 2.0 submodels to be tailored to a project's particular processstrategy.
COCOMO 2.0 follows the openness principles used in the original COCOMO. Thus, all ofits relationships and algorithms will be publicly available. Also, all of its interfaces are designedto be public, well-defined, and parametrized, so that complementary preprocessors (analogy, case-based, or other size estimation models), post-processors (project planning and control tools, projectdynamics models, risk analyzers), and higher level packages (project management packages, prod-uct negotiation aids), can be combined straightforwardly with COCOMO 2.0.
To support the software marketplace sectors above, COCOMO 2.0 provides a family of in-creasingly detailed software cost estimation models, each tuned to the sectors' needs and type ofinformation available to support software cost estimation.
3.1 COCOMO 2.0 MODELS FOR THE SOFTWARE MARKETPLACE SECTORS
The User Programmingsector does not need a COCOMO 2.0 model. Its applications aretypically developed in hours to days, so a simple activity-based estimate will generally be suffi-cient.
3.1.1 APPLICATION COMPOSITION
The COCOMO 2.0 estimation model for this sector, called theApplication CompositionModel, is based on Object Points. Object Points are a count of the screens, reports and third-gen-eration-language modules developed in the application, each weighted by a three-level (simple,medium, difficult) complexity factor [Banker et al. 1994, Kauffman and Kumar 1993]. This iscommensurate with the level of information generally known about an Application Compositionproduct during its planning stages, and the corresponding level of accuracy needed for its softwarecost estimates (such applications are generally developed by a small team in a few weeks tomonths).
3.1.2 APPLICATION GENERATOR, SYSTEM INTEGRATION, OR INFRASTRUCTURE
Estimations for these three sectors are based on a tailorable mix of the Application Com-position Model and two increasingly detailed estimation models, called the Early Design Modeland the Post-Architecture Model, for subsequent portions of the life cycle.
The earliest life cycle phases or spiral cycles will generally involve prototyping, using Ap-plication Composition capabilities. TheApplication Composition Model supports these phases. Italso supports other prototyping activities occurring later in the life cycle such as efforts to resolvepotential high-risk issues such as user interfaces, software/system interaction, performance, ortechnology maturity.
TheEarly Design Modelinvolves exploration of alternative software/system architecturesand concepts of operation. At this point the development, not enough is generally known to supportfine-grain cost estimation. The corresponding COCOMO 2.0 capability involves the use of func-

4
enable users to determine their desired information processing application via domain-familiar op-tions, parameters, or simple rules. Every enterprise from Fortune 100 companies to small business-es and the U.S. Department of Defense will be involved in this sector.
Typical Infrastructure sector products will be in the areas of operating systems, databasemanagement systems, user interface management systems, and networking systems. Increasingly,the Infrastructure sector will address “middleware” solutions for such generic problems as distrib-uted processing and transaction processing. Representative firms in the Infrastructure sector areMicrosoft, NeXT, Oracle, SyBase, Novell, and the major computer vendors.
In contrast to end-user programmers, who will generally know a good deal about their ap-plications domain and relatively little about computer science, the infrastructure developers willgenerally know a good deal about computer science and relatively little about applications. Theirproduct lines will have many reusable components, but the pace of technology (new processor,memory, communications, display, and multimedia technology) will require them to build manycomponents and capabilities from scratch.
Performers in the three middle sectors in Figure 1 will need to know a good deal about com-puter science-intensive Infrastructure software and also one or more applications domains. Creat-ing this talent pool is a major national challenge.
The Application Generators sector will create largely prepackaged capabilities for userprogramming. Typical firms operating in this sector are Microsoft, Lotus, Novell, Borland, andvendors of computer-aided planning, engineering, manufacturing, and financial analysis systems.Their product lines will have many reusable components, but also will require a good deal of new-capability development from scratch.Application Composition Aids will be developed both by thefirms above and by software product-line investments of firms in the Application Composition sec-tor.
TheApplication Composition sector deals with applications which are too diversified to behandled by prepackaged solutions, but which are sufficiently simple to be rapidly composable frominteroperable components. Typical components will be graphic user interface (GUI) builders, da-tabase or object managers, middleware for distributed processing or transaction processing, hyper-media handlers, smart data finders, and domain-specific components such as financial, medical, orindustrial process control packages.
Most large firms will have groups to compose such applications, but a great many special-ized software firms will provide composed applications on contract. These range from large, ver-satile firms such as Andersen Consulting and EDS, to small firms specializing in such specialtyareas as decision support or transaction processing, or in such applications domains as finance ormanufacturing.
TheSystems Integration sector deals with large scale, highly embedded, or unprecedentedsystems. Portions of these systems can be developed with Application Composition capabilities,but their demands generally require a significant amount of up-front systems engineering and cus-tom software development. Aerospace firms operate within this sector, as do major system inte-gration firms such as EDS and Andersen Consulting, large firms developing software-intensiveproducts and services (telecommunications, automotive, financial, and electronic products firms),and firms developing large-scale corporate information systems or manufacturing support systems.
3. COCOMO 2.0 STRATEGY AND RATIONALEThe four main elements of the COCOMO 2.0 strategy are:
3
ject Points, Function Points, and Source Lines of Code (SLOC), with new adjustment models forreuse and re-engineering. Section 5 discusses the new exponent-driver approach to modeling rela-tive project diseconomies of scale. Section 6 summarizes the revisions to one of COCOMO’s ef-fort-multiplier cost driver sets. Section 7 presents the resulting conclusions based on COCOMO2.0’s current state. Further details on the definition of COCOMO 2.0 are provided in [Boehm et al.1995]
2. FUTURE SOFTWARE PRACTICES MARKETPLACEMODEL
Figure 1 summarizes the model of the future software practices marketplace that we are us-ing to guide the development of COCOMO 2.0. It includes a large upper “end-user programming”sector with roughly 55 million practitioners in the U.S. by the year 2005; a lower “infrastructure”sector with roughly 0.75 million practitioners; and three intermediate sectors, involving the devel-opment of applications generators and composition aids (0.6 million practitioners), the develop-ment of systems by applications composition (0.7 million), and system integration of large-scaleand/or embedded software systems (0.7 million)*.
End-User Programming will be driven by increasing computer literacy and competitivepressures for rapid, flexible, and user-driven information processing solutions. These trends willpush the software marketplace toward having users develop most information processing applica-tions themselves via application generators. Some example application generators are spread-sheets, extended query systems, and simple, specialized planning or inventory systems. They
* These figures are judgement-based extensions of the Bureau of Labor Statistics moderate-growth labor distri-bution scenario for the year 2005 [CSTB 1993; Silvestri and Lukasieicz 1991]. The 55 million End-User pro-gramming figure was obtained by applying judgement based extrapolations of the 1989 Bureau of the Censusdata on computer usage fractions by occupation [Kominski 1991] to generate end-user programming frac-tions by occupation category. These were then applied to the 2005 occupation-category populations (e.g.,10% of the 25M people in “Service Occupations”; 40% of the 17M people in “Marketing and Sales Occupa-tions”). The 2005 total of 2.75 M software practitioners was obtained by applying a factor of 1.6 to the numberof people traditionally identified as “Systems Analysts and Computer Scientists” (0.829M in 2005) and“Computer Programmers (0.882M). The expansion factor of 1.6 to cover software personnel with other jobtitles is based on the results of a 1983 survey on this topic [Boehm 1983].The 2005 distribution of the 2.75M software developers is a judgement-based extrapolation of current trends.
Figure 1. Future Software Practices Marketplace Model
End-User Programming(55M performers in US)
Infrastructure(0.75M)
Application Generatorsand Composition Aids
ApplicationComposition
SystemIntegration
(0.6M) (0.7M) (0.7M)
2
process determination, and for the ability to conduct trade-off analyses among software and systemlife cycle costs, cycle times, functions, performance, and qualities.
Concurrently, a new generation of software processes and products is changing the way or-ganizations develop software. These new approaches—evolutionary, risk-driven, and collabora-tive software processes; fourth generation languages and application generators; commercial off-the-shelf (COTS) and reuse-driven software approaches; fast-track software development ap-proaches; software process maturity initiatives—lead to significant benefits in terms of improvedsoftware quality and reduced software cost, risk, and cycle time.
However, although some of the existing software cost models have initiatives addressingaspects of these issues, these new approaches have not been strongly matched to date by comple-mentary new models for estimating software costs and schedules. This makes it difficult for orga-nizations to conduct effective planning, analysis, and control of projects using the new approaches.
These concerns have led the authors to formulate a new version of the Constructive CostModel (COCOMO) for software effort, cost, and schedule estimation. The original COCOMO[Boehm 1981] and its specialized Ada COCOMO successor [Boehm and Royce 1989] were rea-sonably well-matched to the classes of software project that they modeled: largely custom, build-to-specification software [Miyazaki and Mori 1985, Boehm 1985, Goudy 1987]. Although AdaCOCOMO added a capability for estimating the costs and schedules for incremental software de-velopment, COCOMO encountered increasing difficulty in estimating the costs of business soft-ware [Kemerer 1987, Ruhl and Gunn 1991], of object-oriented software [Pfleeger 1991], ofsoftware created via spiral or evolutionary development models, or of software developed largelyvia commercial-off-the-shelf (COTS) applications-composition capabilities.
1.2 COCOMO 2.0 OBJECTIVES
The initial definition of COCOMO 2.0 and its rationale are described in this paper. The def-inition will be refined as additional data are collected and analyzed. The primary objectives of theCOCOMO 2.0 effort are:
• To develop a software cost and schedule estimation model tuned to the life cycle prac-tices of the 1990's and 2000's.
• To develop software cost database and tool support capabilities for continuous modelimprovement.
• To provide a quantitative analytic framework, and set of tools and techniques for eval-uating the effects of software technology improvements on software life cycle costs andschedules.
These objectives support the primary needs expressed by software cost estimation users ina recent Software Engineering Institute survey [Park et al. 1994]. In priority order, these needswere for support of project planning and scheduling, project staffing, estimates-to-complete,project preparation, replanning and rescheduling, project tracking, contract negotiation, proposalevaluation, resource leveling, concept exploration, design evaluation, and bid/no-bid decisions.
1.3 TOPICS ADDRESSED
Section 2 describes the future software marketplace model being used to guide the devel-opment of COCOMO 2.0. Section 3 presents the overall COCOMO 2.0 strategy and its rationale.Section 4 summarizes a COCOMO 2.0 software sizing approach, involving a tailorable mix of Ob-

1
Presenters: Barry W. Boehm and Bradford K. Clark
Title: An Overview of the COCOMO 2.0 Software Cost Model
Authors: Barry Boehm, Bradford Clark, Ellis Horowitz, Ray Madachy, Richard Selby, ChrisWestland
Track: Track 6
Day: Thursday
Keywords: Cost Modeling, Cost Estimation, COCOMO, Reuse
AN OVERVIEW OF THE COCOMO 2.0SOFTWARE COST MODEL
AbstractCurrent software cost estimation models, such as the 1981 Constructive Cost Model (CO-
COMO) for software cost estimation and its 1987 Ada COCOMO update, have been experiencingincreasing difficulties in estimating the costs of software developed to new life cycle processes andcapabilities. These include non-sequential and rapid-development process models; reuse-drivenapproaches involving commercial off the shelf (COTS) packages, reengineering, applicationscomposition, and applications generation capabilities; object-oriented approaches supported bydistributed middleware; and software process maturity initiatives.
This paper provides an overview of the baseline COCOMO 2.0 model tailored to these newforms of software development, including rationales for the model decisions. The major new mod-eling capabilities of COCOMO 2.0 are a tailorable family of software sizing models, involving Ob-ject Points, Function Points, and Source Lines of Code; nonlinear models for software reuse andreengineering; an exponent-driver approach for modeling relative software diseconomies of scale;and several additions, deletions, and updates to previous COCOMO effort-multiplier cost drivers.This model is serving as a framework for an extensive current data collection and analysis effortto further refine and calibrate the model’s estimation capabilities.
1. INTRODUCTION
1.1 MOTIVATION
“We are becoming a software company,” is an increasingly-repeated phrase in organiza-tions as diverse as finance, transportation, aerospace, electronics, and manufacturing firms. Com-petitive advantage is increasingly dependent on the development of smart, tailorable products andservices, and on the ability to develop and adapt these products and services more rapidly thancompetitors' adaptation times.
Dramatic reductions in computer hardware platform costs, and the prevalence of commod-ity software solutions have indirectly put downward pressure on systems development costs. Thismakes cost-benefit calculations even more important in selecting the correct components for con-struction and life cycle evolution of a system, and in convincing skeptical financial managementof the business case for software investments. It also highlights the need for concurrent product and


![Standard Glossary of Terms Used in Software … Glossary of...[CMMI] M.B. Chrissis, M. Konrad and S. Shrum (2004), CMMI, Guidelines for Process Integration and Product Improvement](https://static.fdocuments.us/doc/165x107/5f47a2425eb3f814c6225ea6/standard-glossary-of-terms-used-in-software-glossary-of-cmmi-mb-chrissis.jpg)