
P663 14B Mod 01b RESENG (Petrophysics) … · Formation Evaluation and the Analysis of Reservoir...
27
Formation Evaluation and the Analysis of Reservoir Performance Tom BLASINGAME | [email protected] | Texas A&M U. T.A. Blasingame, Texas A&M U. Department of Petroleum Engineering Texas A&M University College Station, TX 77843-3116 +1.979.845.2292 — [email protected] Formation Evaluation and the Analysis of Reservoir Performance Reservoir Petrophysics Introduction to Geology Slide — 1
Transcript of P663 14B Mod 01b RESENG (Petrophysics) … · Formation Evaluation and the Analysis of Reservoir...
Formation Evaluation and the Analysis of Reservoir Performance Tom BLASINGAME | [email protected] | Texas A&M U.
T.A. Blasingame, Texas A&M U.Department of Petroleum Engineering
Texas A&M UniversityCollege Station, TX 77843-3116
+1.979.845.2292 — [email protected]
Formation Evaluation and the Analysis of Reservoir Performance
Reservoir PetrophysicsIntroduction to Geology
Slide — 1

Formation Evaluation and the Analysis of Reservoir Performance Tom BLASINGAME | [email protected] | Texas A&M U.
Geology: Basic Porosity Types
Fabric Selective:● Porosity (and permeabil-
ity are functions of de-position and digenesis.
Not Fabric Selective:● Fractures, etc.● Porosity and
permeability may (or may not) be a function of deposition and diagenesis.
Slide — 2
Formation Evaluation and the Analysis of Reservoir Performance Tom BLASINGAME | [email protected] | Texas A&M U.
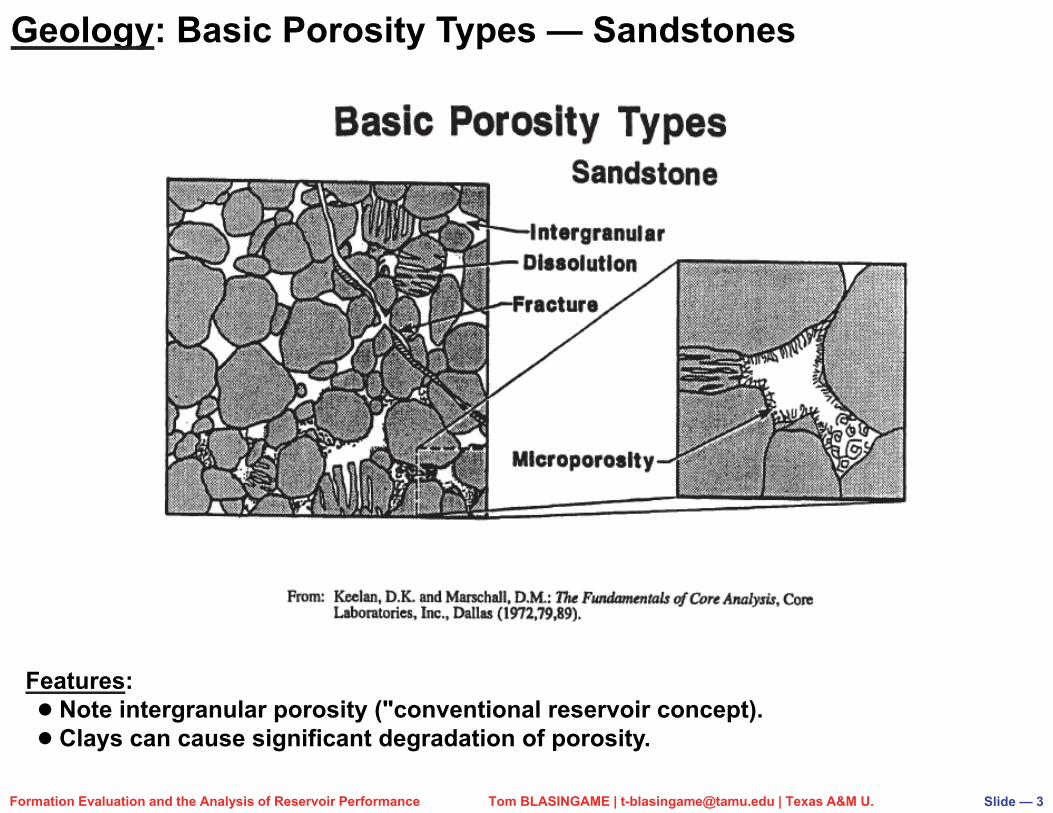
Geology: Basic Porosity Types — Sandstones
Features:● Note intergranular porosity ("conventional reservoir concept).● Clays can cause significant degradation of porosity.
Slide — 3

Formation Evaluation and the Analysis of Reservoir Performance Tom BLASINGAME | [email protected] | Texas A&M U.
From: Reservoir Sandstones — Berg (1986).
a. Various sandstone depositional sequences — note the "transport" system evolves basinward.
b. These schematics illustrate similarity in depositional processes and also give insight into heterogeneity.
Sandstone Reservoirs:● Depositional sequences are well-established/accepted.● Turbidite reservoirs are probably of most current interest.
Geology: Sandstone Depositional Systems
Slide — 4

Formation Evaluation and the Analysis of Reservoir Performance Tom BLASINGAME | [email protected] | Texas A&M U.
Carbonate Reservoirs: Permeability/Porosity Character●Porosity and permeability often weakly correlated in carbonates.●Permeability in carbonates most often dependent on diagenetic processes.
From
:Car
bona
te R
eser
voir
Cha
ract
eriz
atio
n—
Luci
a (1
999)
.
a. Crossplot of permeability versus porosity (logarithmic scales). Includes particle size as a variable.
b. Permeability-porosity profiles for various carbonate depositional sequences.
Geology: Carbonate Depositional Systems — and k
Slide — 5

Formation Evaluation and the Analysis of Reservoir Performance Tom BLASINGAME | [email protected] | Texas A&M U.
Weber Example Core: Laminated Aeolian sandstone. Thin beds (<1 cm) are common. Some laminations have zero permeability
(influence on vertical flow?). General Considerations:
Core-scale heterogeneities may or may not affect overall reservoir performance (depends on continuity).
Attempts to correlate small-scale heterogeneities are likely to fail, except for isolated samples.
Issues: How do such features affect:
— Pressure transient behavior (well test time scale events)?
— Pseudosteady-state behavior(production time scale events)?
Solutions for increasing reservoir exposure? (hydraulic fracturing?)
Petrophysics: Effect of Small-Scale Heterogeneities
From: Weber, KJ.: "How Heterogeneity Affects Oil Recovery — from Reservoir Characterization, Academic Press, Inc.-Harcourt Bruce Jovanovich, Publishers, New York (1986) (Edited by: Lake, L.W. and Carroll, H.B., Jr.).
Slide — 6

Formation Evaluation and the Analysis of Reservoir Performance Tom BLASINGAME | [email protected] | Texas A&M U.
Permeability Comparison: Santa Barbara Field (Venezuela)●Major conclusion is that these data due not appear to be correlated.●High permeability values probably "overweigh" klog mean estimate.● kPTA values higher than kWPA, but we have only 3 (three) kPTA values.
0.12
0.11
0.10
0.09
0.08
0.07
0.06
0.05
0.04
0.03
0.02
0.01
0.00
Prob
abili
ty (F
requ
ency
/n)
-6 -5 -4 -3 -2 -1 0 1 2 3 4 5 6Logarithm of permeability, log(md)
Well TM-1E/Permeability Histogram (Upper Naricual)
Well TM-1E(Upper Naricual -- n = 354)
Statistics for kMedian log(k) = 1.0483Mean log(k) = 13204Standard deviation = 1.1686Mean k = 20.9 md
16300
16200
16100
16000
15900
15800
15700
15600
15500
15400
Dep
th, f
t
0.300.250.200.150.100.050.00Porosity, fraction
Well TM-1E/Porosity Distribution with Depth(Upper Naricual)
16300
16200
16100
16000
15900
15800
15700
15600
15500
15400
Dep
th, f
t
10-1 100 101 102 103 104
Permeability, k, md
Well TM-1E/Permeability Distribution with Depth(Upper Naricual)
Petrophysics: Example — kWPA, kPTA with klog mean
From
:Med
ina,
T.:
Cha
ract
eriz
atio
n of
Gas
Con
dens
ate
Res
ervo
irs
Usi
ng P
ress
ure
Tran
sien
t and
Pro
duct
ion
Dat
a-Sa
nta
Bar
bara
Fi
eld,
Mon
agas
, Ven
ezue
la, M
.S. T
hesi
s Te
xas
A&
M U
nive
rsity
(M
ay 2
003)
.
Slide — 7

Formation Evaluation and the Analysis of Reservoir Performance Tom BLASINGAME | [email protected] | Texas A&M U.
Reservoir Scaling Issues
b. (Halderson) Volume of investigation of a pres-sure build-up test and cross section indicating large-scale internal heterogeneities.
a. (Haldorsen) Four conceptual scales associated with porous media averages.
NANO or ATTO?
Reservoir Scale Issues: Halderson Schematics
From
:Sim
ulat
or P
aram
eter
Ass
ignm
ent a
nd th
e Pr
oble
m o
f Sc
alin
g in
Res
ervo
ir En
gine
erin
g—
Hal
ders
on (1
986)
.
Slide — 8

Formation Evaluation and the Analysis of Reservoir Performance Tom BLASINGAME | [email protected] | Texas A&M U.
Geology/Petrophysics: Questions to ConsiderQ1. Validity of correlations of petrophysical data?A1. These will always be "local" correlations, difficult to extend or
extrapolate across depositional systems.
Q2. Role of geology in PTA?A2. Must consider geology in general, but particularly for cases where
the following reservoir models are employed:● Linear sealing or leaky faults. (any geologic evidence?)● Bounded reservoir system. (geologic or petrophysical evidence?)● Naturally fractured/dual porosity reservoir. (any geologic evidence?)●Multilayered reservoirs. (geologic or petrophysical evidence?)
Q3. Correlation of kcore with kPTA?A3. Always a comparison of "apples and oranges" due to:
● Sample size. (core data are extremely localized)● Saturation/mobility issues. (kcore evaluated using gas at low pressures)
Q4. Effect of reservoir heterogeneity on PTA?A4. Interesting question — volume-averaging appears to dominate the
estimate of permeability obtained from PTA. Attempts to estimate permeability "distributions" will be non-unique and/or overly sim-plified.
Slide — 9
Formation Evaluation and the Analysis of Reservoir Performance Tom BLASINGAME | [email protected] | Texas A&M U.
T.A. Blasingame, Texas A&M U.Department of Petroleum Engineering
Texas A&M UniversityCollege Station, TX 77843-3116
+1.979.845.2292 — [email protected]
Reservoir PetrophysicsFlow in Porous Media
Slide — 10
Formation Evaluation and the Analysis of Reservoir Performance

Formation Evaluation and the Analysis of Reservoir Performance Tom BLASINGAME | [email protected] | Texas A&M U.
Flow Concepts: Concepts for Fluid Flow in Porous Media
Concept:● "Tortuous paths"● Darcy flow.
Concept:● Perfect paths.● Poiseuille flow.● How to reconcile?
Slide — 11

Formation Evaluation and the Analysis of Reservoir Performance Tom BLASINGAME | [email protected] | Texas A&M U.
Flow Concepts: Klinkenberg Effect
Liquid Flow:●Governed by "viscous flow."● Analog = Poiseuille flow.● "Zero-slip" at wall concept.
Gas Flow:●Molecules "slip" at wall.●Gradient is lower than expected.● Computed permeability higher.● Results MUST be corrected.
Slide — 12

Formation Evaluation and the Analysis of Reservoir Performance Tom BLASINGAME | [email protected] | Texas A&M U.
Flow Concepts: High-Velocity Flow in Porous Media
Slide — 13

Formation Evaluation and the Analysis of Reservoir Performance Tom BLASINGAME | [email protected] | Texas A&M U.
Flow Concepts: Klinkenberg Effect — H2, Air, and CO2
Issues:● Smaller molecules =
more severe Klinken-berg effect.
● The Klinkenberg effect can be derived and is a subset of "Knudsen Flow."
Slide — 14
Formation Evaluation and the Analysis of Reservoir Performance Tom BLASINGAME | [email protected] | Texas A&M U.
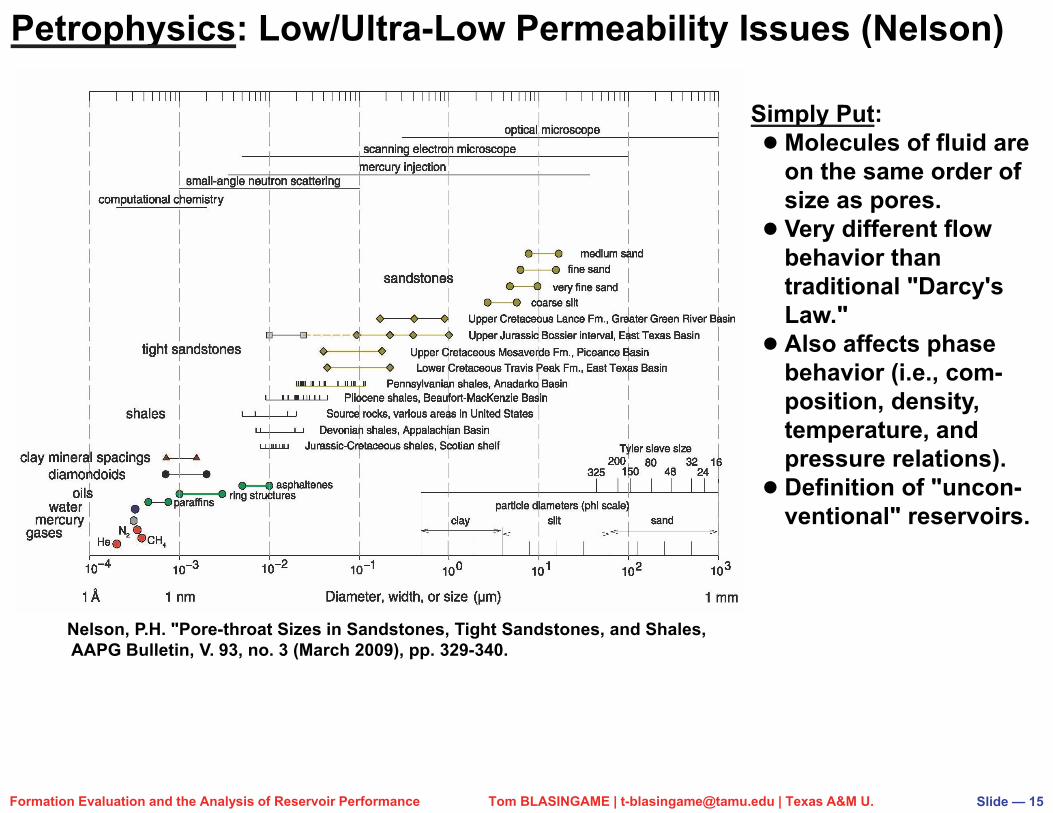
Nelson, P.H. "Pore-throat Sizes in Sandstones, Tight Sandstones, and Shales,AAPG Bulletin, V. 93, no. 3 (March 2009), pp. 329-340.
Petrophysics: Low/Ultra-Low Permeability Issues (Nelson)
Simply Put:●Molecules of fluid are
on the same order of size as pores.
● Very different flow behavior than traditional "Darcy's Law."
● Also affects phase behavior (i.e., com-position, density, temperature, and pressure relations).
● Definition of "uncon-ventional" reservoirs.
Slide — 15

Formation Evaluation and the Analysis of Reservoir Performance Tom BLASINGAME | [email protected] | Texas A&M U.
Permeability Characterization/Correlation:●Permeability = f(, composition, texture, grain size, sorting, etc.).●Simplified correlations for permeability will only be of "local" use.
From
:The
Fun
dam
enta
ls o
f Cor
e A
naly
sis
—K
eela
n (1
972)
.
a. "Cartoon" of kair versus — illustrates k=aexp(b).
b. "Cartoon" of kair versus Swi — illustrates the influence of pore throat structure.
From
:API
Dril
ling
and
Prod
. Pra
c.—
Bru
ce a
nd W
elge
(194
7).
Petrophysics: Permeability Characterizations/Correlations
Slide — 16

Formation Evaluation and the Analysis of Reservoir Performance Tom BLASINGAME | [email protected] | Texas A&M U.
Sketched Trends:● Increase in porosity → increase
in permeability (obvious).● k = a exp[b ]???● This does not seem intuitive
(statistics)?●What about:
k = A B
●What about other variables?
Petrophysics: k = a exp[b ] (Schematic Trends)
Slide — 17

Formation Evaluation and the Analysis of Reservoir Performance Tom BLASINGAME | [email protected] | Texas A&M U.
1000
Porosity (Percent)
Perm
eabi
lity
(md)
● Sketched Trends:●Similar to previous
schematic plot.● This is the "original"
presentation by Archie (to the best of our knowledge, this is the first plot of log(k) versus ).
● There are many other variables:
— Grain sizes— Sorting— Texture— Angularity— …
● These variables can not be directly quantified.
Petrophysics: k = a exp[b ] (Archie Trends)
Slide — 18

Formation Evaluation and the Analysis of Reservoir Performance Tom BLASINGAME | [email protected] | Texas A&M U.
Archie Results:●Porosity:
F = a/m
● This result "makes sense" (i.e., volume of the room is proportional to the volume of the electrolyte).
●Permeability:F = A/kB
● This result DOES NOT"make sense" (i.e., the size of the door is proportional to the volume of the room???).
Petrophysics: Archie k--F Relations
Slide — 19

Formation Evaluation and the Analysis of Reservoir Performance Tom BLASINGAME | [email protected] | Texas A&M U.
a. Crossplot of formation (resistivity) factor versus permeability (F = a/m).
Porosity Model: Permeability Model:
m
w
o aRR F
Bw
okA
RR F
Equating the Models: Solving for k:
Bm kAa
/1
B
maAk
This exercise suggests that permeability and porosity are related by a power law relation — this observation is only true for
uniform pore systems.
b. Crossplot of formation (resistivity) factor versus permeability (F = A/kB).
Petrophysics: Archie k--F Relations
Slide — 20

Formation Evaluation and the Analysis of Reservoir Performance Tom BLASINGAME | [email protected] | Texas A&M U.
Legend: Thin Sections (photomicrographs)A. Upper shoreface ( = 0.207, k = 46.5 md) Vinton Cty, OH. B. Lower shoreface ( = 0.085, k = 3.43 md) Hocking Cty, OH.C. Tidal channel ( = 0.066, k = 0.0178 md) Carroll Cty, OH.D. Tidal flat ( = 0.053, k = 0.0011 md) Portage Cty, OH.E. Fluvial ( = 0.087, k = 15.3 md) Kanawha Cty, WV.F. Estuarine ( = 0.068, k = 0.0048 md) Preston Cty, WV.
b. Appalachian samples — permeability is approximated as a power law function of porosity.
a. Thin sections of Lower Silurian Sandstones, Appalachian Basin (US).
c. Attempt to correlate Morrow samples by deposition —similar to Appalachian samples.
From: Castle, J.W. and Byrnes, A.P.: "Petrophysics of Lower Silurian Sandstones and Integration with The Tectonic-Stratigraphic Framework, Appalachian Basin, United States," Bull., AAPG (2005) 89, 41-60.
Petrophysics: Porosity-Permeability — Power Law Relation
Slide — 21

Formation Evaluation and the Analysis of Reservoir Performance Tom BLASINGAME | [email protected] | Texas A&M U.
a. Pape concept model plot — based on a fractal pore distribution. Some concern regarding the additive structure of the model (this seems to be a simplistic reduction of the fractal concept).
b. Legend for the Pape concept model plot. Note that there are several quite different data sets shown, yet the "structure" of the correlation appears consistent.
From: Pape, H., Clauser, C., Iffland, J.: "Permeability Prediction Based on Fractal Pore-Space Geometry," Geophysics (1999) Vol. 64, (September-October 1999), 1447–1460.
103
221 aaak
Pape et al Fractal Model for Permeability:
Petrophysics: Fractal Model for Permeability (Pape)
Slide — 22
Formation Evaluation and the Analysis of Reservoir Performance Tom BLASINGAME | [email protected] | Texas A&M U.
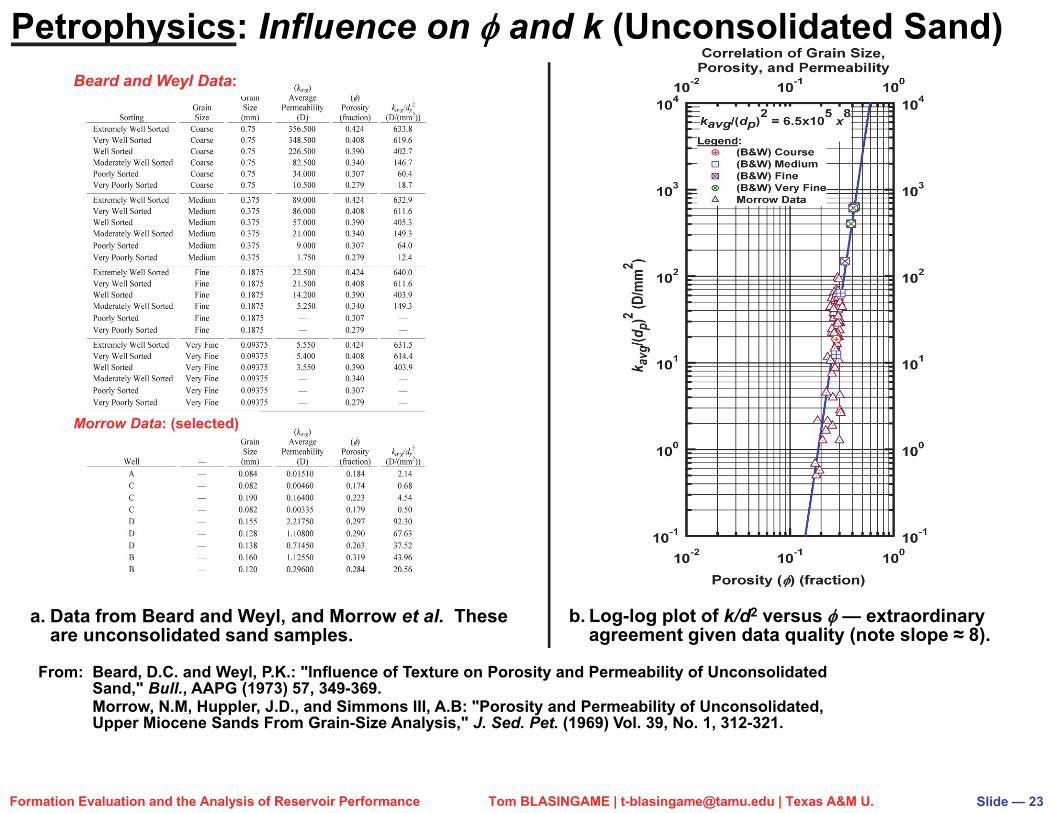
a. Data from Beard and Weyl, and Morrow et al. These are unconsolidated sand samples.
b. Log-log plot of k/d2 versus — extraordinary agreement given data quality (note slope ≈ 8).
From: Beard, D.C. and Weyl, P.K.: "Influence of Texture on Porosity and Permeability of Unconsolidated Sand," Bull., AAPG (1973) 57, 349-369. Morrow, N.M, Huppler, J.D., and Simmons III, A.B: "Porosity and Permeability of Unconsolidated, Upper Miocene Sands From Grain-Size Analysis," J. Sed. Pet. (1969) Vol. 39, No. 1, 312-321.
Beard and Weyl Data:
Morrow Data: (selected)
Petrophysics: Influence on and k (Unconsolidated Sand)
Slide — 23

Formation Evaluation and the Analysis of Reservoir Performance Tom BLASINGAME | [email protected] | Texas A&M U.
East Texas Tight Gas Sand
1.E-04
1.E-03
1.E-02
1.E-01
1.E+00
1.E-
04
1.E-
03
1.E-
02
1.E-
01
1.E+
00Measured Permeability (md)
Cal
cula
ted
Perm
eabi
lity
(md)
Correlation Linek_EOS Model
]exp[
8)( )( 32
1maxc
wc
b
Sccc
bcak
From:Siddiqui, A. Towards a Characteristic Equation for Permeability, M.S. Theses, Texas A&M University (May 2008).
1.E-05
1.E-04
1.E-03
1.E-02
1.E-01
1.E+00
1.E+01
1.E+02
1.E+03
1.E-
02
1.E-
01
1.E+
00
Porosity (fraction)
Perm
eabi
lity
(md)
Permeability Correlation13140
13160
13180
13200
13220
13240
1.E-
04
1.E-
03
1.E-
02
1.E-
01
Permeability (md)
Dep
th (f
t)
a. Correlation plot of calculated versus measured permeability. — East Texas (US) tight gas example.
b. Log-log correlation plot of kversus . The correlation function yields an envelope.
c. Correlation plot of depth versus log(k). Correlation appears to be excellent.
Correlation relation for this case.k=f(,Sw)
Petrophysics: and k (Power Law Relation)
Slide — 24

Formation Evaluation and the Analysis of Reservoir Performance Tom BLASINGAME | [email protected] | Texas A&M U.
Fanc
her,
G.H
., Le
wis
, J.A
., an
d B
arne
s, K
.B.:
"Som
e Ph
ysic
al C
hara
cter
istic
sof
Oil
Sand
s,"
Pa. S
tate
Col
lege
, Min
. Ind
. Exp
. Sta
. Bul
l. 12
(193
3), 6
5-17
1.
Orientation:●Possibly one of the most important
sequences of experimental results in Petroleum Engineering.
Observations:●Do you see "Darcy's Law?"● Is it a good idea to formulate
pressure drop as a "friction factor" for flow in porous media?
●What would you do?Comment:●Note that this approach is not perfect,
ALL trends should overlay if the friction factor and Reynolds number are properly defined.
●Reformulate?
Petrophysics: Early Concepts for Flow in Porous Media
Slide — 25

Formation Evaluation and the Analysis of Reservoir Performance Tom BLASINGAME | [email protected] | Texas A&M U.
Formulation:●Cornell and Katz appear to
have chosen appropriate definitions for Reynolds number and friction factor.
●Are all of these variables "measurable?"
Observations:●Excellent conformance for
all cases?● The curved and flat portions
are for "Forchheimer" flow (pressure gradient is proportional to velocity squared).
Comment:●Non-linear, requires
numerical solutions.
Petrophysics: Cornell-Katz Relation for High-Velocity Flow
Slide — 26
Formation Evaluation and the Analysis of Reservoir Performance Tom BLASINGAME | [email protected] | Texas A&M U.
T.A. Blasingame, Texas A&M U.Department of Petroleum Engineering
Texas A&M UniversityCollege Station, TX 77843-3116
+1.979.845.2292 — [email protected]
Reservoir Petrophysics(End of Lecture)
Slide — 27
Formation Evaluation and the Analysis of Reservoir Performance
![[Blasingame] SPE 107967](https://static.fdocuments.us/doc/165x107/577c779b1a28abe0548cc526/blasingame-spe-107967.jpg)


![[Blasingame] SPE 103204](https://static.fdocuments.us/doc/165x107/577c776b1a28abe0548c04af/blasingame-spe-103204.jpg)


![[Blasingame] SPE 109625](https://static.fdocuments.us/doc/165x107/577c778e1a28abe0548c91b3/blasingame-spe-109625.jpg)


![[Blasingame] SPE 107954](https://static.fdocuments.us/doc/165x107/577c779b1a28abe0548cc4f0/blasingame-spe-107954.jpg)