![Rules of Probability. The additive rule P[A B] = P[A] + P[B] – P[A B] and if P[A B] = P[A B] = P[A] + P[B]](https://static.fdocuments.us/doc/165x107/5697c0121a28abf838ccc5b4/rules-of-probability-the-additive-rule-pa-b-pa-pb-pa-.jpg)
P Report Prueba B
10
Report Compendium
Transcript of P Report Prueba B

Report Compendium
2
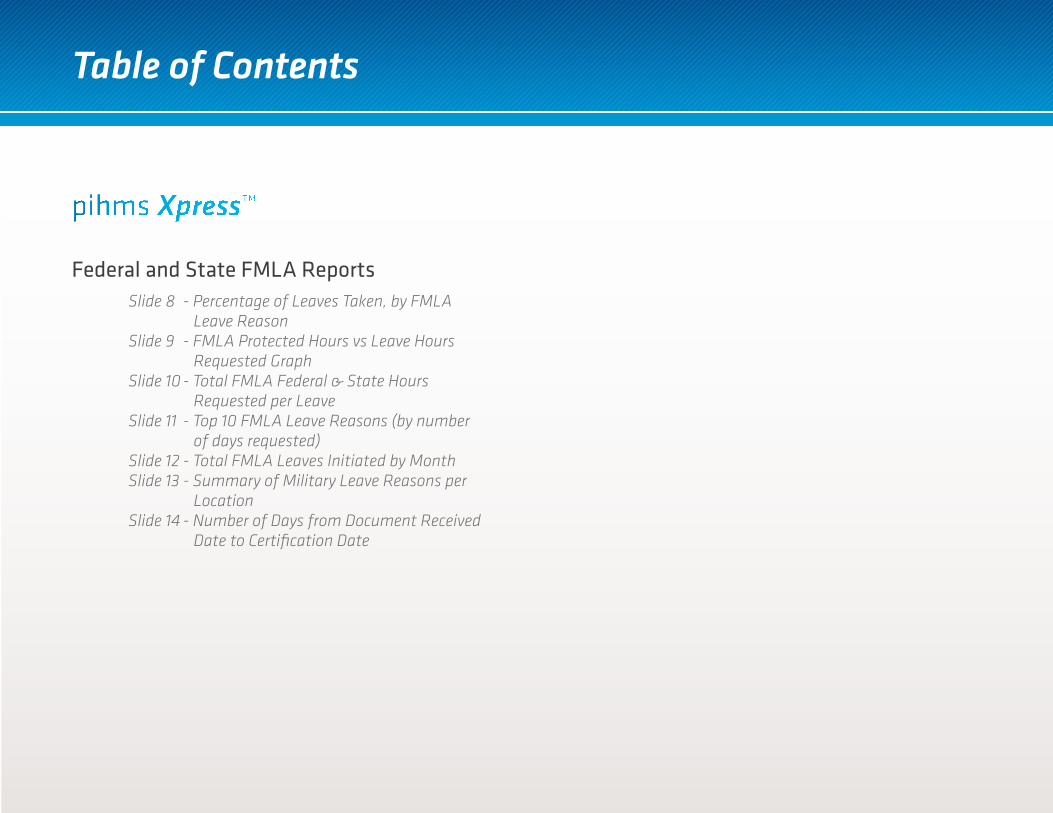
Federal and State FMLA ReportsSlide 8 - Percentage of Leaves Taken, by FMLA Leave ReasonSlide 9 - FMLA Protected Hours vs Leave Hours Requested GraphSlide 10 - Total FMLA Federal & State Hours Requested per LeaveSlide 11 - Top 10 FMLA Leave Reasons (by number of days requested)Slide 12 - Total FMLA Leaves Initiated by MonthSlide 13 - Summary of Military Leave Reasons per LocationSlide 14 - Number of Days from Document Received Date to Certification Date
Table of Contents
3
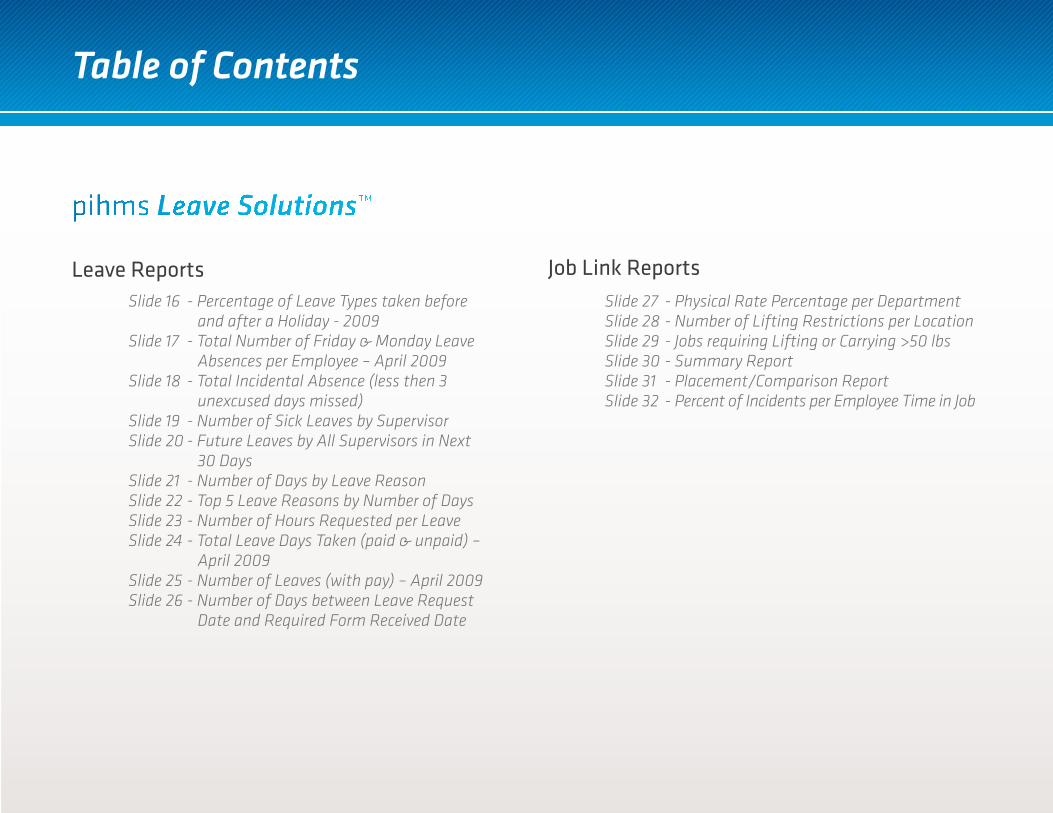
Leave Reports Job Link ReportsSlide 16 - Percentage of Leave Types taken before and after a Holiday - 2009Slide 17 - Total Number of Friday & Monday Leave Absences per Employee – April 2009Slide 18 - Total Incidental Absence (less then 3 unexcused days missed)Slide 19 - Number of Sick Leaves by SupervisorSlide 20 - Future Leaves by All Supervisors in Next 30 DaysSlide 21 - Number of Days by Leave ReasonSlide 22 - Top 5 Leave Reasons by Number of DaysSlide 23 - Number of Hours Requested per LeaveSlide 24 - Total Leave Days Taken (paid & unpaid) – April 2009Slide 25 - Number of Leaves (with pay) – April 2009Slide 26 - Number of Days between Leave Request Date and Required Form Received Date
Slide 27 - Physical Rate Percentage per DepartmentSlide 28 - Number of Lifting Restrictions per LocationSlide 29 - Jobs requiring Lifting or Carrying >50 lbsSlide 30 - Summary ReportSlide 31 - Placement/Comparison ReportSlide 32 - Percent of Incidents per Employee Time in Job
Table of Contents
4
Safety Reports Industrial Hygiene Reports
Ergonomic Reports
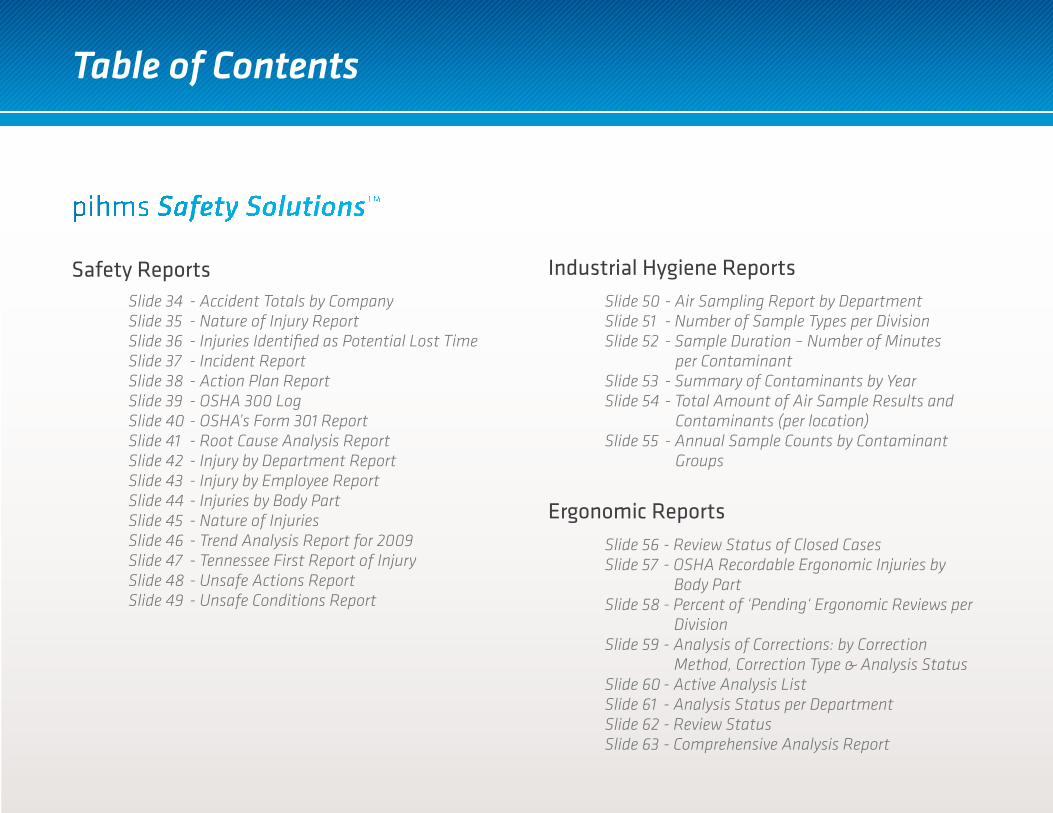
Slide 34 - Accident Totals by CompanySlide 35 - Nature of Injury ReportSlide 36 - Injuries Identified as Potential Lost TimeSlide 37 - Incident ReportSlide 38 - Action Plan ReportSlide 39 - OSHA 300 LogSlide 40 - OSHA’s Form 301 ReportSlide 41 - Root Cause Analysis ReportSlide 42 - Injury by Department ReportSlide 43 - Injury by Employee ReportSlide 44 - Injuries by Body PartSlide 45 - Nature of InjuriesSlide 46 - Trend Analysis Report for 2009Slide 47 - Tennessee First Report of InjurySlide 48 - Unsafe Actions ReportSlide 49 - Unsafe Conditions Report
Slide 50 - Air Sampling Report by DepartmentSlide 51 - Number of Sample Types per DivisionSlide 52 - Sample Duration – Number of Minutes per ContaminantSlide 53 - Summary of Contaminants by YearSlide 54 - Total Amount of Air Sample Results and Contaminants (per location)Slide 55 - Annual Sample Counts by Contaminant Groups
Slide 56 - Review Status of Closed CasesSlide 57 - OSHA Recordable Ergonomic Injuries by Body PartSlide 58 - Percent of ‘Pending‘ Ergonomic Reviews per DivisionSlide 59 - Analysis of Corrections: by Correction Method, Correction Type & Analysis Status Slide 60 - Active Analysis ListSlide 61 - Analysis Status per DepartmentSlide 62 - Review StatusSlide 63 - Comprehensive Analysis Report
Table of Contents
5
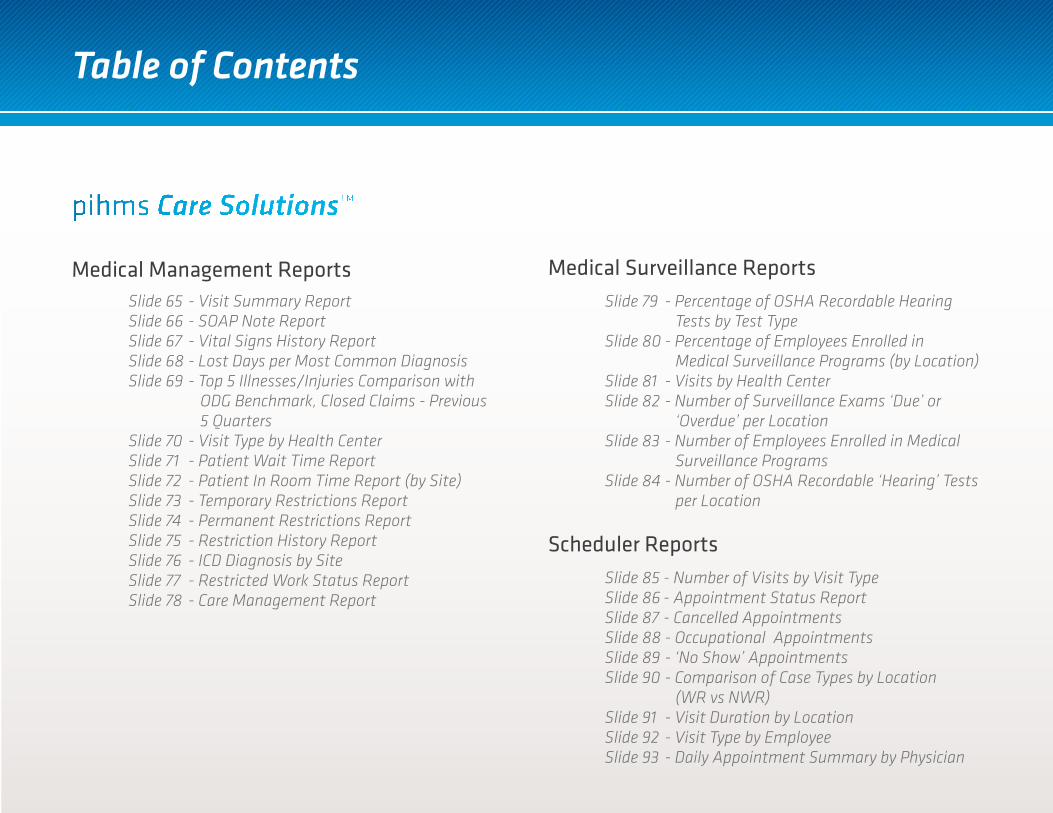
Medical Management Reports Medical Surveillance Reports
Scheduler Reports
Slide 65 - Visit Summary ReportSlide 66 - SOAP Note ReportSlide 67 - Vital Signs History ReportSlide 68 - Lost Days per Most Common DiagnosisSlide 69 - Top 5 Illnesses/Injuries Comparison with ODG Benchmark, Closed Claims - Previous 5 QuartersSlide 70 - Visit Type by Health CenterSlide 71 - Patient Wait Time ReportSlide 72 - Patient In Room Time Report (by Site)Slide 73 - Temporary Restrictions ReportSlide 74 - Permanent Restrictions ReportSlide 75 - Restriction History ReportSlide 76 - ICD Diagnosis by SiteSlide 77 - Restricted Work Status ReportSlide 78 - Care Management Report
Slide 79 - Percentage of OSHA Recordable Hearing Tests by Test TypeSlide 80 - Percentage of Employees Enrolled in Medical Surveillance Programs (by Location)Slide 81 - Visits by Health CenterSlide 82 - Number of Surveillance Exams ‘Due’ or ‘Overdue’ per LocationSlide 83 - Number of Employees Enrolled in Medical Surveillance ProgramsSlide 84 - Number of OSHA Recordable ‘Hearing’ Tests per Location
Slide 85 - Number of Visits by Visit Type Slide 86 - Appointment Status ReportSlide 87 - Cancelled AppointmentsSlide 88 - Occupational AppointmentsSlide 89 - ‘No Show’ AppointmentsSlide 90 - Comparison of Case Types by Location (WR vs NWR)Slide 91 - Visit Duration by LocationSlide 92 - Visit Type by EmployeeSlide 93 - Daily Appointment Summary by Physician
Table of Contents
6
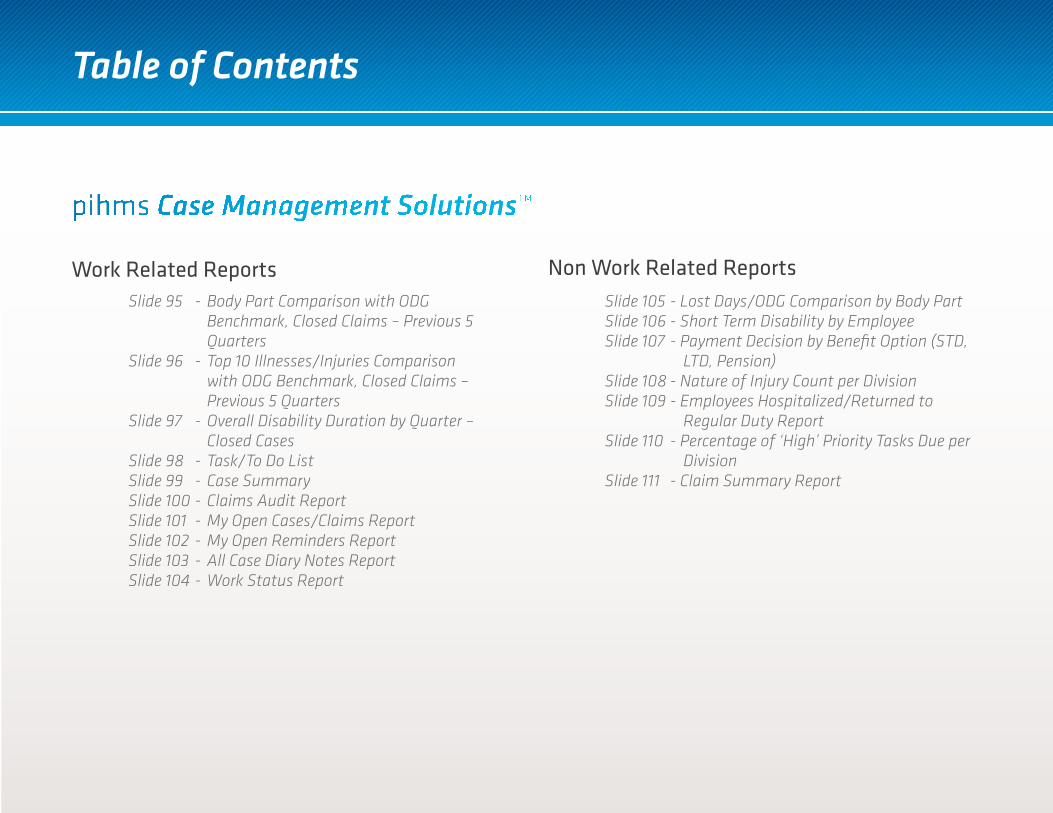
Work Related Reports Non Work Related ReportsSlide 95 - Body Part Comparison with ODG Benchmark, Closed Claims – Previous 5 QuartersSlide 96 - Top 10 Illnesses/Injuries Comparison with ODG Benchmark, Closed Claims – Previous 5 QuartersSlide 97 - Overall Disability Duration by Quarter – Closed CasesSlide 98 - Task/To Do ListSlide 99 - Case SummarySlide 100 - Claims Audit ReportSlide 101 - My Open Cases/Claims ReportSlide 102 - My Open Reminders ReportSlide 103 - All Case Diary Notes ReportSlide 104 - Work Status Report
Slide 105 - Lost Days/ODG Comparison by Body PartSlide 106 - Short Term Disability by EmployeeSlide 107 - Payment Decision by Benefit Option (STD, LTD, Pension)Slide 108 - Nature of Injury Count per DivisionSlide 109 - Employees Hospitalized/Returned to Regular Duty ReportSlide 110 - Percentage of ‘High’ Priority Tasks Due per DivisionSlide 111 - Claim Summary Report
Table of Contents
pihms Xpress™
8
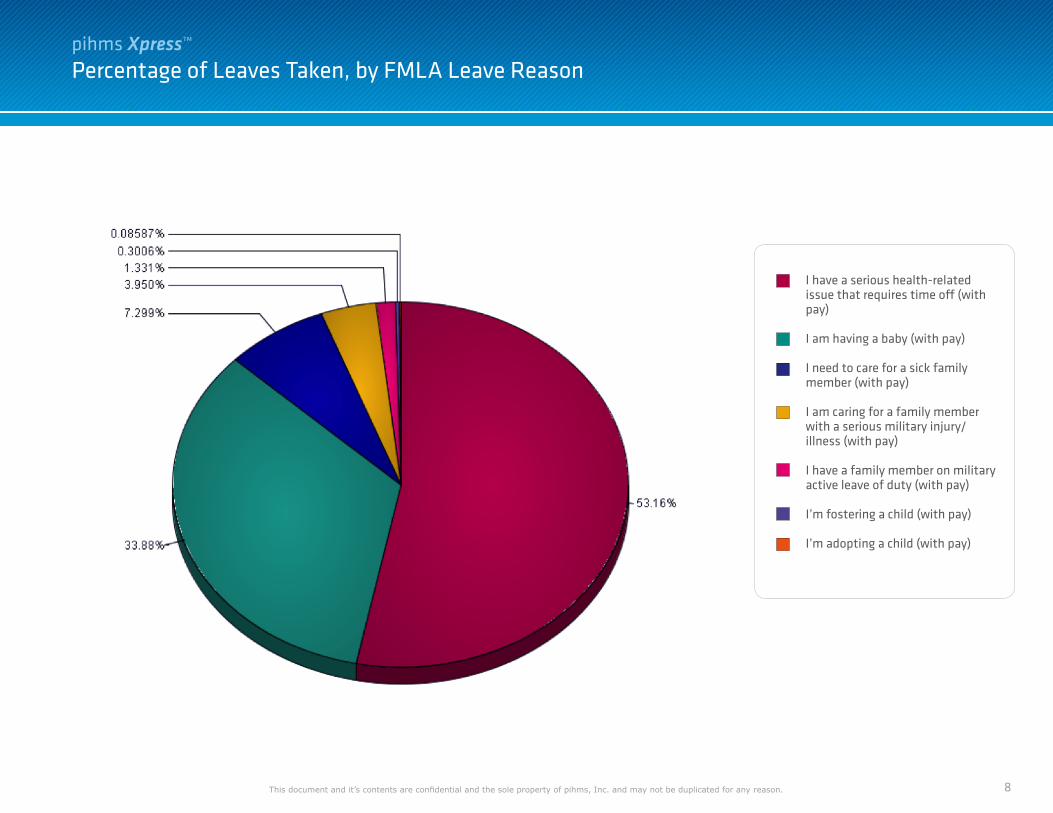
Percentage of Leaves Taken, by FMLA Leave Reasonpihms Xpress™
This document and it’s contents are confidential and the sole property of pihms, Inc. and may not be duplicated for any reason.
I have a serious health-related issue that requires time off (with pay)
I am having a baby (with pay)
I need to care for a sick family member (with pay)
I am caring for a family member with a serious military injury/illness (with pay)
I have a family member on military active leave of duty (with pay)
I’m fostering a child (with pay)
I’m adopting a child (with pay)
9
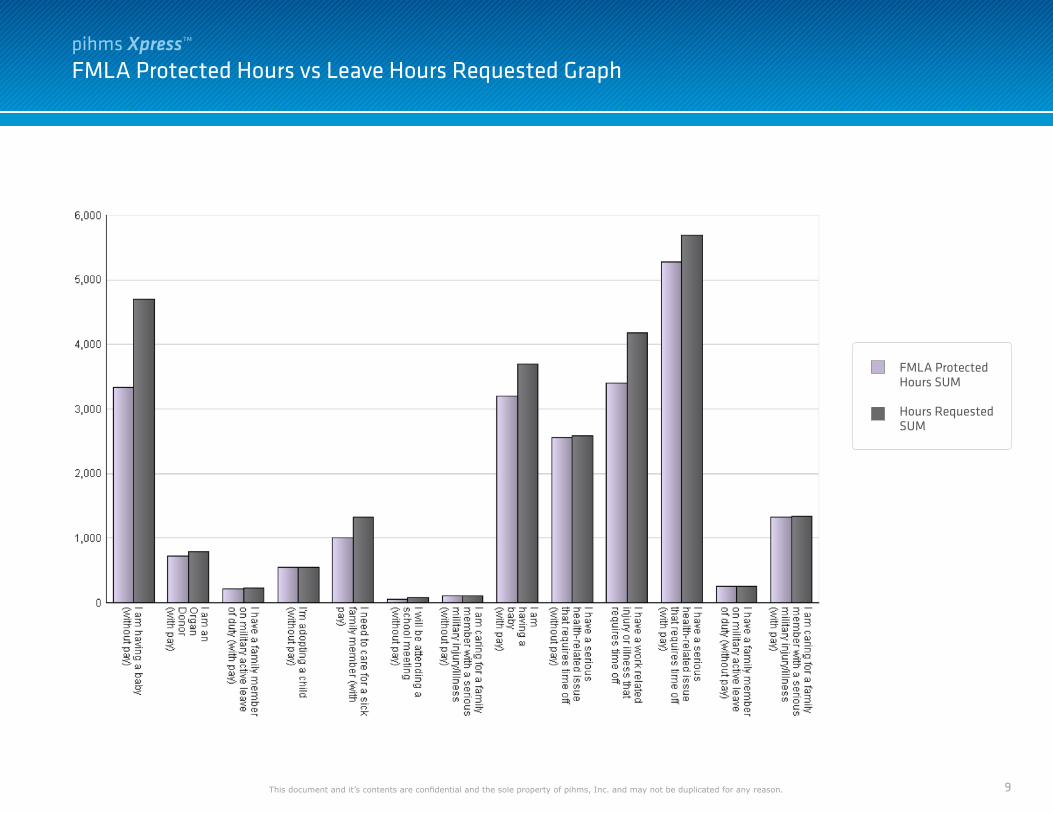
FMLA Protected Hours vs Leave Hours Requested Graph
This document and it’s contents are confidential and the sole property of pihms, Inc. and may not be duplicated for any reason.
FMLA Protected Hours SUM
Hours Requested SUM
pihms Xpress™
10
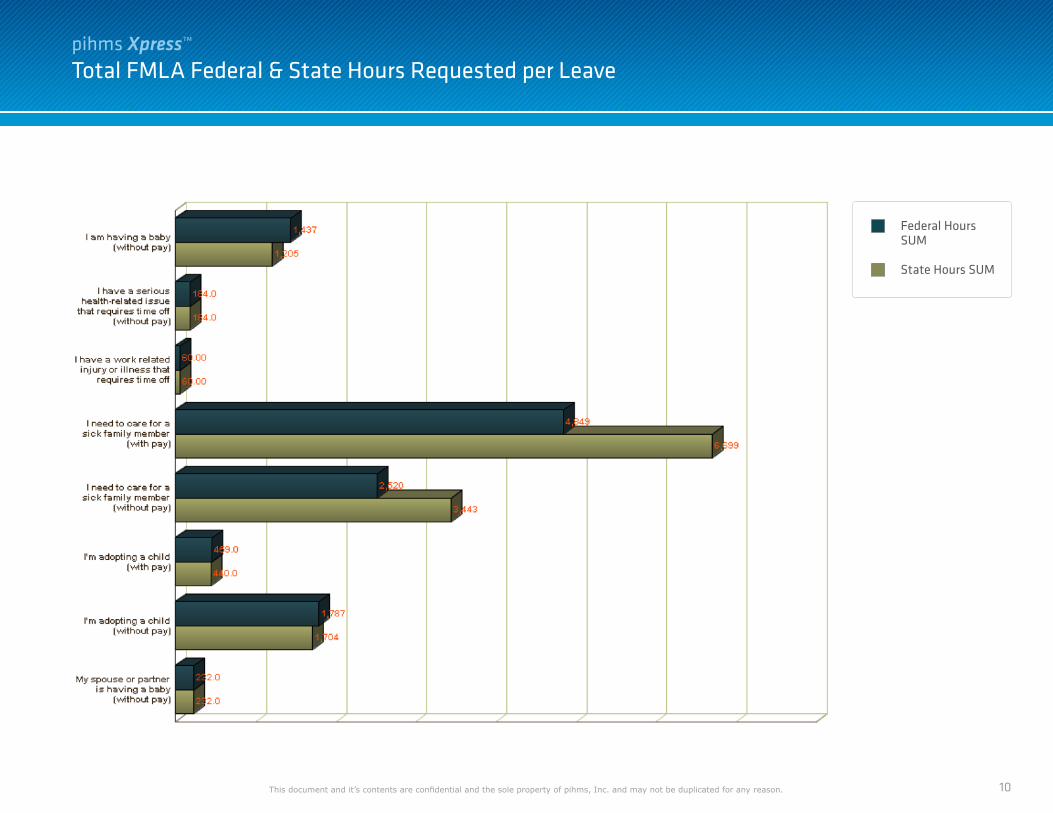
Total FMLA Federal & State Hours Requested per Leave
This document and it’s contents are confidential and the sole property of pihms, Inc. and may not be duplicated for any reason.
Federal HoursSUM
State Hours SUM
pihms Xpress™