Oxygen 1s X-ray-Absorption Edges of Transition-metal Oxides
9
PHYSICAL REVIEW B VOLUME 40, NUMBER 8 15 SEPTEMBER 1989-I Oxygen 1s x-ray-absorption edges of transition-metal oxides F. . F. de Groot, M. Gnom, and J. C. Fuggle Research Institute for Materials, University of Njimegen, Toernooiveld, NL 652-5 ED Nijmegen, The Netherlands J. Ghijsen and G. A. Sawatzky Materials Science Centre, University of Groningen, addepoel, Njienborgh 18, NL 9747-AG Groningen, The ¹therlands H. Petersen Berliner Elektronenspeicherring-Gesellschaft fiir Synchrotronstrahlung m b . B. ES. SY), Lentzeallee 100, D 1000 B-erlin 33, Federal Republic of Germany (Received 17 February 1989; revised manuscript received 8 May 1989) The oxygen 1s x-ray-absorption edges of a series of 3d-transition-metal oxides have been mea- sured. The structures at the edge arise from covalent mixing of the metal and oxygen states, which introduces oxygen p character in unoccupied states of mainly metal character. The spectra can be divided into two regions: The first is a double-peaked sharp s tru ct ur e ne ar threshold, which can be related to the metal 3d states; the second is a broader structure 5 — 10 eV above the edge and is relat- ed to the metal 4s and 4p bands. We attribute the oxygen p character up to 15 eV above threshold to mainly oxygen 2p character. The data are analyzed in terms of ligand-field and exchange split- tings. It is shown that the splitting between the two sharp peaks near threshold is related closely to the ligand-field splitting, but the rela ti ve inte nsit ie s of the peaks are not fully explained at the present time. I. INTRODUCTION In this study we try to learn something about the elec- tronic structure of binary 3d-transition-metal oxides, which st ill is not well understood despite many past stud- ies. ' By studying the oxygen ls (or K) absorption edge of binary oxides, we hope to set up a reference for the in- terpretation of x-ray-absorption edges and the electronic structure of ore complex compounds, such as the high- T, superconducting oxides. The oxygen 1s edge, with an absorption energy of about 530 eV, is situated in the ener- gy range between 300 and 1000 eV, which until recently was technically difficult to The relatively under- developed role of this energy region, containing besides the oxygen ls edge also the 3d — ransition-metal 2p (or L2 ) edges, compared to, e. g. , the transition-metal ls (or IC) edges is predominantly caused by poor monochroma- tor resolution. Studies such as ours, with an instrumental resolution of -500 meV, are n ow f ea si bl e as a result of the development of new and better monochromators for synchrotron radiation in this energy range. ' X-ray absorption (XAS) is a local process in which an electron is promoted to an excited electronic state, which can be coupled to the original core level with the dipole selection rule stating that the change in the angular momentum quantum number (b, L) is +1, while the spin is not changed. " For the oxygen ls edge (L=0) this means that only oxygen p character (L= 1) can be reached. The resulting spectrum can be envisaged in a first-order ap- proximation as an image of the oxygen p projected unoc- cupied density of states. For more detailed studies, we note below three problems in relating a calculated DOS to an XAS spectrum. First, the usual way to calculate the density of states is via the Hohenberg-Kohn density-functional theory within the Kohn-Sham local-density approach' (LDA). Using the LDA, the occupied part of the DOS calcula- tion is a routine task for the 3d-transition-metal oxides. For the unoccupied states there are, however, purely technical problems of the requirements for more extend- ed basis sets and avoidance of inappropriate linearization schemes. ' For instance, the 0 3p levels, which begin 10 — 15 eV above EF, are not included in density-of-states (DOS) calculations with a basis set limited to one wave function per I value. Thus, ost published calcula- tions are limited to the first few eV of the unoccupied states. Unfortunately, we know of only one oxide band- structure calculation (for CuO) (Ref. 13) whose basis set is sufhcient for a sensible comparison with XAS far above threshold. Calculations also exist within the multiple- scattering f or ma li sm w hi ch treat the unoccupied density of states (UDOS) up to some 50 eV above threshold. ' owever, these calculations, which are used in the description of the transition-metal 1s x-ray-absorption near-edge spectroscopy (XANES) spectra, have not been published for the oxygen 1s edges of many of t he o xi de s we consider here. A second technical problem concerns the single-particle matrix elements for XAS. ' Here we will assume that the oxygen 1s~np matrix elements are constant for any given n unless otherwise stated. Finally, there is an important problem of principle. Even if the UDOS was calculated correctly within LDA and corrected for matrix ' a comparison to the x-ray-absorption edges is not strictly valid. The excited electron in the final state interacts with its surroundings, modifying the density of states due 40 5715 1989 The American Physical Society
Transcript of Oxygen 1s X-ray-Absorption Edges of Transition-metal Oxides
8/2/2019 Oxygen 1s X-ray-Absorption Edges of Transition-metal Oxides
http://slidepdf.com/reader/full/oxygen-1s-x-ray-absorption-edges-of-transition-metal-oxides 1/9
PHYSICAL REVIEW B VOLUME 40, NUMBER 8 15 SEPTEMBER 1989-I
Oxygen 1s x-ray-absorption edges of transition-metal oxides
F.M. F. de Groot, M. Gnom, and J.C. FuggleResearch Institute for Materials, University ofNjimegen, Toernooiveld, NL 652-5ED Nijmegen, The Netherlands
J.Ghijsen and G. A. SawatzkyMaterials Science Centre, University ofGroningen, Paddepoel, Njienborgh 18, NL 9747-AG Groningen, The ¹therlands
H. PetersenBerliner Elektronenspeicherring-Gesellschaft fiir Synchrotronstrahlung m b H .B.ES.SY), Lentzeallee 100,
D 1000B-erlin 33, Federal Republic ofGermany(Received 17 February 1989; revised manuscript received 8 May 1989)
The oxygen 1s x-ray-absorption edges of a series of 3d-transition-metal oxides have been mea-
sured. The structures at the edge arise from covalent mixing of the metal and oxygen states, which
introduces oxygen p character in unoccupied states of mainly metal character. The spectra can be
divided into two regions: The first is a double-peaked sharp structure near threshold, which can be
related to the metal 3d states; the second is a broader structure 5—10 eV above the edge and is relat-
ed to the metal 4s and 4p bands. We attribute the oxygen p character up to 15 eV above threshold
to mainly oxygen 2p character. The data are analyzed in terms of ligand-field and exchange split-
tings. It is shown that the splitting between the two sharp peaks near threshold is related closely tothe ligand-field splitting, but the relative intensities of the peaks are not fully explained at the
present time.
I. INTRODUCTION
In this study we try to learn something about the elec-
tronic structure of binary 3d-transition-metal oxides,
which still is not well understood despite many past stud-
ies. ' By studying the oxygen ls (or K) absorption edge
of binary oxides, we hope to set up a reference for the in-
terpretation of x-ray-absorption edges and the electronic
structure of more complex compounds, such as the high-
T, superconducting oxides. The oxygen 1s edge, with an
absorption energy of about 530 eV, is situated in the ener-
gy range between 300 and 1000 eV, which until recently
was technically difficult to reach. The relatively under-
developed role of this energy region, containing besides
the oxygen ls edge also the 3d—ransition-metal 2p (or
L2 3) edges, compared to, e.g., the transition-metal ls (or
IC) edges is predominantly caused by poor monochroma-
tor resolution. Studies such as ours, with an instrumental
resolution of -500 meV, are now feasible as a result ofthe development of new and better monochromators forsynchrotron radiation in this energy range. '
X-ray absorption (XAS) is a local process in which an
electron is promoted to an excited electronic state, which
can be coupled to the original core level with the dipoleselection rule stating that the change in the angular
momentum quantum number (b,L) is +1,while the spin is
not changed. " For the oxygen ls edge (L=0) this means
that only oxygen p character (L= 1) can be reached. The
resulting spectrum can be envisaged in a first-order ap-
proximation as an image of the oxygen p projected unoc-
cupied density of states. For more detailed studies, we
note below three problems in relating a calculated DOSto an XAS spectrum.
First, the usual way to calculate the density of states isvia the Hohenberg-Kohn density-functional theorywithin the Kohn-Sham local-density approach' (LDA).Using the LDA, the occupied part of the DOS calcula-
tion is a routine task for the 3d-transition-metal oxides.
For the unoccupied states there are, however, purely
technical problems of the requirements for more extend-
ed basis sets and avoidance of inappropriate linearization
schemes. ' For instance, the 0 3p levels, which begin
10—15 eV above EF, are not included in density-of-states
(DOS) calculations with a basis set limited to one wave
function per I value. Thus, most published calcula-
tions are limited to the first few eV of the unoccupied
states. Unfortunately, we know of only one oxide band-
structure calculation (for CuO) (Ref. 13) whose basis set
is sufhcient for a sensible comparison with XAS far above
threshold. Calculations also exist within the multiple-
scattering formalism which treat the unoccupied density
of states (UDOS) up to some 50 eV above threshold. '
However, these calculations, which are used in the
description of the transition-metal 1s x-ray-absorption
near-edge spectroscopy (XANES) spectra, have not been
published for the oxygen 1s edges of many of the oxides
we consider here. A second technical problem concernsthe single-particle matrix elements for XAS. ' Here we
will assume that the oxygen 1s~np matrix elements are
constant for any given n unless otherwise stated.
Finally, there is an important problem of principle.Even if the UDOS was calculated correctly within LDAand corrected for single-particle matrix elements, ' a
comparison to the x-ray-absorption edges is not strictlyvalid. The excited electron in the final state interacts
with its surroundings, modifying the density of states due
40 5715 1989 The American Physical Society
8/2/2019 Oxygen 1s X-ray-Absorption Edges of Transition-metal Oxides
http://slidepdf.com/reader/full/oxygen-1s-x-ray-absorption-edges-of-transition-metal-oxides 2/9
F.M. F. de GROOT et al.
to correlation. Moreover, the created core hole affects
the final-state DOS, as has, for instance, been shown forthe early-transition-metal 2p (L2 3) (Ref. 16) and Al and
Si is (Ref. 17) x-ray-absorption spectra. Both effects
come under the heading of self-energy. For the oxygen 1s
edges these effects probably are less severe, compared to
the transition-metal 2p edges, because the core hole nowis situated on oxygen while the states in the unoccupiedbands just above the Fermi level have most weight on the
metal sites. Oxygen 2p character hybridizes with these
unoccupied metal bands, but the 1s hole on oxygen only
indirectly inAuences them.
Because not much high-resolution data are available,
and even more because of the lack of suitable calculations
of the UDOS, we confine ourselves here to a more empiri-
cal approach as a starting point. In this paper we study a
series of 3d-transition-metal oxides, of which all but one
(CuO) contain a transition metal which is octahedrally
surrounded by oxygen. The major variation is the num-
ber of 3d electrons, ranging from zero to nine. Also the
formal valency varies between 2 and 4, resulting in
different crystal structures for each valency: Sc203,T 2O3 V2O3 Cr203 and Fe203, each with the corundum
structure; Ti02, VO2, and MnOz, each with the rutile
structure and the complex inverse spinel-structures
Fe304. We also consider the spectra of the monoxides
TiO, MnO, FeO, NiO, and CuO of Nakai et al. ' Thefirst four materials have the rocksalt structure and CuO
has its typical structure in which Cu is surrounded byfour oxygen atoms. The measurements on NiO and CuO
were repeated by us to check the reproducibility of theresults under different experimental conditions. We notethat especially the monoxides discussed are defect struc-
tures defects can have a considerable inhuence on XASspectra as they distort the local symmetry. Besides the
known defect structures of the monoxides, the samplesmeasured as commercial powders (see Sec. II) can be ex-
pected to contain a fair amount of defects. As a start we
will consider all compounds as stoichiometric; the possi-
ble effects of nonstoichiometry are discussed in Sec. IV F.After a short description of the experimental condi-
tions (Sec. II), we will present the oxygen ls edges. In
their interpretation we will focus on the transition-metal
3d-band region (Sec. III). In the discussion (Sec. IV) acomparison is made with the ligand-field-splitting data
from the literature and simple models to explain the
specific shapes of the 3d-band region are discussed.
II. EXPERIMENTAL
The x-ray-absorption measurements were carried out
at the Berlin synchrotron-radiation source BESSY, usingthe SX700 plane-grating monochromator. ' The contri-
bution to the resolution could be reasonably simulated by
a Lorentzian of about 0.5 eV full width at half max-
imum ' (FWHM). However, it should be noted that our
spectra show as much detail as those of Nakai et al. ,'
who claims 0.1 eV monochromator resolution. The spec-
tra were recorded in the total-electron-yield mode. They
were normalized to the beam current, to correct for
synchrotron-intensity loss during a measurement. The
samples used were commercial powders (Sc203, Tiz03,VO~, V203, and Crz03) and natural minerals (Ti02,Mn02, MnO, Pe&03, Fe304, and NiO). CuO was ob-
tained as a single crystal from Oxford Laboratories.Solid samples were scraped under vacuum to ensure clean
surfaces and were thus preferred to powders. The pres-
sure during measurements was in the 10 torr range.The throughput of Cu was measured at the oxygen 1s
edge to check for oxygen contamination in the mono-
chromator. No contamination was found. The energy
calibration of the monochromator was performed by tak-
ing pure transition metals (V, Cr, Mn, Fe, and Ni) 2p
edges and using the energy-loss data of Fink et al. ' as areference. The calibration curve was linear in the energy
range probed (400—800 eV). Comparing our numerical
results for NiO and CuO with those of Nakai et al. '
showed in both cases that our threshold was shifted 0.3eV to higher energy, which at this time is an acceptabledisagreement for these XAS edges.
III. RESULTS AND INTERPRETATION
Figures 1(a) and 1(b) show the oxygen is edge x-ray-
absorption spectra of a series of 3d-transition-metal ox-
ides. The spectra have been approximately normalized tothe peak heights; absolute normalization of the intensity
scale is not feasible. The spectra have strong structure up
to at least 15 eV above threshold and it is this structure
we wish to interpret. First, we note that the data present-
ed here are in good agreement with the high-resolution
data that exist for Ti02 (Ref. 22) and for NiO and CuO. '
There is also no disagreement with the available lower-
resolution spectra. Besides the oxygen 1s edge data
there are results on the metal edges of 3d-transition-metaloxides. ' These are significant for a complete picture
of the electronic structure. However, in this paper we donot include the discussion of the metal edges and consid-
er only the oxygen 1s edge.We divide the spectra into two regions. The first, shad-
ed in the figures, is attributed to oxygen 2p weight in
states of predominantly transition-metal 3d character:the transition-metal 3d band. This assignment conforms
with that of Fisher and other studies, ' ' 9 based on amolecular-orbital treatment. Further discussion of this
region is given in Sec. IV.The second region, typically 5—10 eV above threshold,
is attributed to oxygen p character hybridized with metal
4s and 4p states. Detailed calculations on CuO with an
extended basis set (with the inclusion of both oxygen 2p
and 3p character) show this to have principally oxygen 2p(not 3p!) character, with the 2p count reaching -6 at
about 15 eV above EF. We proceed under the assump-
tion that the peaks up to about 15 eV in the othertransition-meta1 oxides are also due to oxygen 2p charac-
ter in the unoccupied states. This high-energy range ofspread for oxygen 2p character is an indication of strongcovalency in these materials and is not in disagreement
with traditional chemical ideas. ' From Fig. 1 and Table
I a common structure of the 4sp band, consisting of amain peak (E&2) and a low-energy shoulder (E~,) at ap-
proximately 3.2 eV (=bp), appears throughout the series.

8/2/2019 Oxygen 1s X-ray-Absorption Edges of Transition-metal Oxides
http://slidepdf.com/reader/full/oxygen-1s-x-ray-absorption-edges-of-transition-metal-oxides 3/9
0 1s X-RAY-ABSORPTION OF TRANSITION-METAL OXIDES 5717
(a)
D
N
O
S 0~@~
02
I I
i
I I I Ii
I I I I
i
I
530 540 550Energy {ev)
820
This structure can be related to the OH symmetry set up
by the nearest (oxygen) neighbors, which octahedrallysurround the 3d-transition-metal atoms. It shows no
strong dependence on the specific crystal structure. Thisstructure is absent in the nonoctahedral Cuo.A salient point is the decrease in intensity of the 3d
band, relative to the 4sp band across the transition-metalseries (see Fig. 2). As noted above, the dominant reason
for this is the decrease in the number of unoccupied 3dstates available for mixing with 0 2p states; this means
that the intensity of the XAS spectra should be linear
with the number of holes as is indicated by the line in
Fig. 2. However, there is a substantial lower intensity ofthe 3d-band region, especially for the d and d oxides.This additional loss of intensity can be explained by thediminished hybridization of the metal 3d orbitals with
the oxygen 2p orbitals due to shrinking of the metal 3dorbitals in the late-transition-metal oxides. Note that we
have plotted the relative intensity of the 3d region with
respect to the 4sp region. The intensity of this latter re-
gion also will be infIuenced by hybridization. We can saysomething more about the changes in hybridization in the3d and 4s bands with the use of the hybridization
strengths (5 values) from Andersen et al. 3 For all tran-
sition metals they give tables of the 6 values of each indi-
vidual I band (l=0,1,2,3). This b value, a potential pa-rameter in the linear muffin-tin orbital (LMTO) calcula-
tion, is proportional to the amplitude of the correspond-
ing radial wave function at the average Wigner-Seitz ra-
dius of the lattice. The hybridization is equal to 6'which gives a direct relation between 6 and the intensity
of the 3d and 4s bands. The values for the pure metals
give a c1ear and—xcept for titanium —onotone trend
to smaller 3d versus 4s hybridization with a higher atom-
ic number. Using these (metal) values for the oxides, we
have to multiply the number of holes (the straight line in
Fig. 2) by 53d/A4, and renormalize the plot. We find
that the experimental points are scattered around the re-
sulting curve. This indicates strongly that the additional
Ti
I I I
(
I I I I
530 540 550Energy {eV)
'o 5number of d ~t~ 10
FIG. 1. (a) and (b) Oxygen 1s x-ray-absorption spectra: the
shaded area is assigned to oxygen p character in the transition-
metal, 3d band. The broader structure above is assigned to oxy-
gen p character in the metal 4s and 4p bands. The vanadium
edges are distorted by the tail of the vanadium L2 edge.
FIG. 2. The intensity of the 3d-band region with respect to
the 4sp region is plotted against the number of 3d electrons in
the ground state. The intensity of Ti02 is set to 10. The line
gives the expected intensity ratio, assuming this is proportional
to the number of holes.

8/2/2019 Oxygen 1s X-ray-Absorption Edges of Transition-metal Oxides
http://slidepdf.com/reader/full/oxygen-1s-x-ray-absorption-edges-of-transition-metal-oxides 4/9
5718 F.M. F. de GROOT et al.
loss of intensity can be explained by taking into accounthybridization of both the 3d and 4s bands. (The curve it-
self is not included in order not to mislead the reader; acomplete treatment would involve calculation of the 5'sfor the oxides. )
IV. DISCUSSION
A. Implication of the 0 1sXAS for ideas on covalency
In a purely ionic model, oxygen would have the
configuration 0 1s 2s 2p and the 1s~2p channel would
be closed in XAS. Covalency reduces the number offilled states with 0 2p character, so that the strength of
the 0 1s signal at threshold is related to the degree of co-valency. It is well known that the transition-metal ox-
ides are not ionic, but have a considerable covalent con-tribution. There is much evidence for this from purecomputations as well as from comparison of computedand experimental magnetic or ligand-field effects. ' ' It
is of particular interest that the ligand-field splittings cal-culated for early-transition-metal oxides in an ionic mod-
el (the crystal field) are about a factor of 3 smaller than
those found by optical measurements, but come out
correctly when covalency is taken into account. Thediscrepancies are smaller in the late-transition-metal ox-
ides, which is extra evidence that the (oxygen 2p —metal3d) hybridization is smaller in the late-transition-metal
TABLE I. (a) The crystal structures, formal valencies, and number of d electrons are given. From the spectra in Fig. 1 and from
Ref. 19 the first (Ed&) and second (Ed2) peak positions of the 3d band (shaded area) and the first (E») and second (E») peak positions
of the 4sp band are measured. (b) The peak splittings and widths of the oxygen 1s XAS spectra: the separation of Edi and Ed2 is
identified with the ligand-field splitting (Ad). The characteristic 3.2-eV distance between E» and E» in the sp band is given as Ap.
The left-side HWHM(l) of the first peak (I &), the FWHM of the total 3d band (I d), and the FWHM of the 4sp band (I ~) are given.
The 0 1s edges in VO„are distorted by the tailing effect of the vanadium L edges. We estimate the uncertainty in I D as +0.3 eV.
All energies are in eV.
Compound
Sc203TiO2
Ti203TiO'
VO2
Cr203
MnO2MnO'
Fe,o,Fe304FeO'
NiONiO'
CUO
CuO'
Compound
Sc203
TiO~
Ti203TiO'
VO2
V2O3Cr203
MnO2MnO'
Fe203
Fe304FeO'
NiONiO'
CuOCuO'
Crystal
structure
coIUndum
rutile
corundum
rocksalt
rutile
COI UndUn1
corundum
rutile
rocksalt
corundum
inverse spinel
rocksalt
rocksalt
rocksalt
CUO
CuO
IEHWHM(l)
0.81.01.20.60.9
1.00.90.90.60.70.8
0.70.60.60.45
Valency
3+4+3+2+4+3+3+4+2+3+
2+ and 3+2+2+2+2+2+
IDFWHM
6.04.85.3
5.34.9
4.93.64.23.73.33.03.82.32.01.41.1
d count
001
2
1
2
3
3
5
5
Sand 6
6
8
8
99
(b)
I p
FWHM
9.59.19.17.6
6.57.38.5
7.88.47.16.86.75.63.23.3
Edl
532.4530.7
530.8
530.2
528.8
529.8
531.4528.9
529.6
529.4528.9
529.8
3.32.62.42.82.2
2.22.32.51.31.30.91.2
Ed2
535.7
533.3533.2533.0531.0531.9533.7531.4530.9530.7530.5531.0531.7531.4530.1
529.8
3.33.23.02.7
3.64.32.94.13.23.13.33.23.31.31.3
E»
539.4539.0539.5540.4
539.2538.4540.5
538.4
537.4537.1
536.3
537.0536.7534.6
534.3
543.1
542.7
542.2
S42.5
543.1
542.8
542.7
543.4
542.5
540.6
540.2540.2
540.2
540.0535.9535.6
'Data taken from Reference 19.
8/2/2019 Oxygen 1s X-ray-Absorption Edges of Transition-metal Oxides
http://slidepdf.com/reader/full/oxygen-1s-x-ray-absorption-edges-of-transition-metal-oxides 5/9
40 0 1s X-RAY-ABSORPTION OF TRANSITION-METAL OXIDES 5719
oxides, as we already suggested in the discussion of theintensities of the 3d band throughout the series.
Because of the technical problems in computing the
unoccupied DOS over some energy range, it is not always
realized that there is considerable weight of 0 2p charac-ter in states 10—15 eV above EF. The evidence from the
LASW calculation of CuO is that most 0 p character upto 15 eV above EF is in fact 0 2p. The 0 1s XAS spec-
tra of the transition-metal oxides show similar broad
peaks, which we have attributed to 0 2p character in
bands with predominantly transition-metal 4sp character.We note that the integrated intensity of the broad 4sp
band is comparable to that of the 3d band. In the very
reasonable first approximation of constant 0 1s~2p ma-
trix elements, the XAS intensity is proportional to the
weight of 0 2p character in a band. Thus, in chemical
language, the observed intensity ratios in the two spectralregions is evidence that, besides the metal 3d states, also
the metal 4sp states are important for the covalency oftransition-metal oxides.
B. Ligand-field splittings
We now examine more closely the first structure, the
3d band, which is shaded in Fig. 1. This structure con-
sists of two (often similar) peaks. In a first approximation
these two peaks can be identified as the t2 - and e-symmetry bands separated by a ligand-field splitting; we
shall use the term "ligand-field splitting" to denote the"bare" (ionic) crystal-field splitting plus hybridization.
To check the validity of the assignment of the two
sharp peaks as being related to the t2~ and eg symmetry,
with the peak separation mirroring the ligand-field split-
ting, we first compare our splittings, Ad, with optical
data of octahedrally hydrated transition-metal ions,
which have been related to the ligand-field splitting. '
In this comparison some precautions must be taken. Ob-
viously the materials compared are not identical, though
in both cases the transition metal is octahedrally sur-
rounded by oxygen ions. Bearing this in mind we com-
pare the results for the ligand-field splitting which are
tabulated in Table II. Considering the precision in the
determination of our Ad value, good agreement is found
for all five transition-metal oxides.
In contrast to the "general rule" that the ligand-field
splitting of trivalent ions is around 2.5 eV and the
divalent-ion ligand-field splitting is approximately half
that value, we come to the generalization of the division
of early- and late-transition-metal oxides, the early-
transition-metal oxides with a splitting around 2.5 eV andthe late-transition-metal oxides with a splitting round 1.2
eV, as can be checked in Table I. The dividing line be-
tween early- and late-transition-metal oxides is the pres-
ence of a filled e orbital in the ground state. Up to d
compounds only t2 states are filled. From d com-
pounds the filled e states increase the lattice parameter
with respect to the orbital radii, which decrease
throughout the 3d-transition-metal series. The conse-
quence for the 3d orbitals is a decrease of hybridizationas we discussed in Sec. III. The d compounds fall in be-
tween the early- and late-transition-metal compounds.
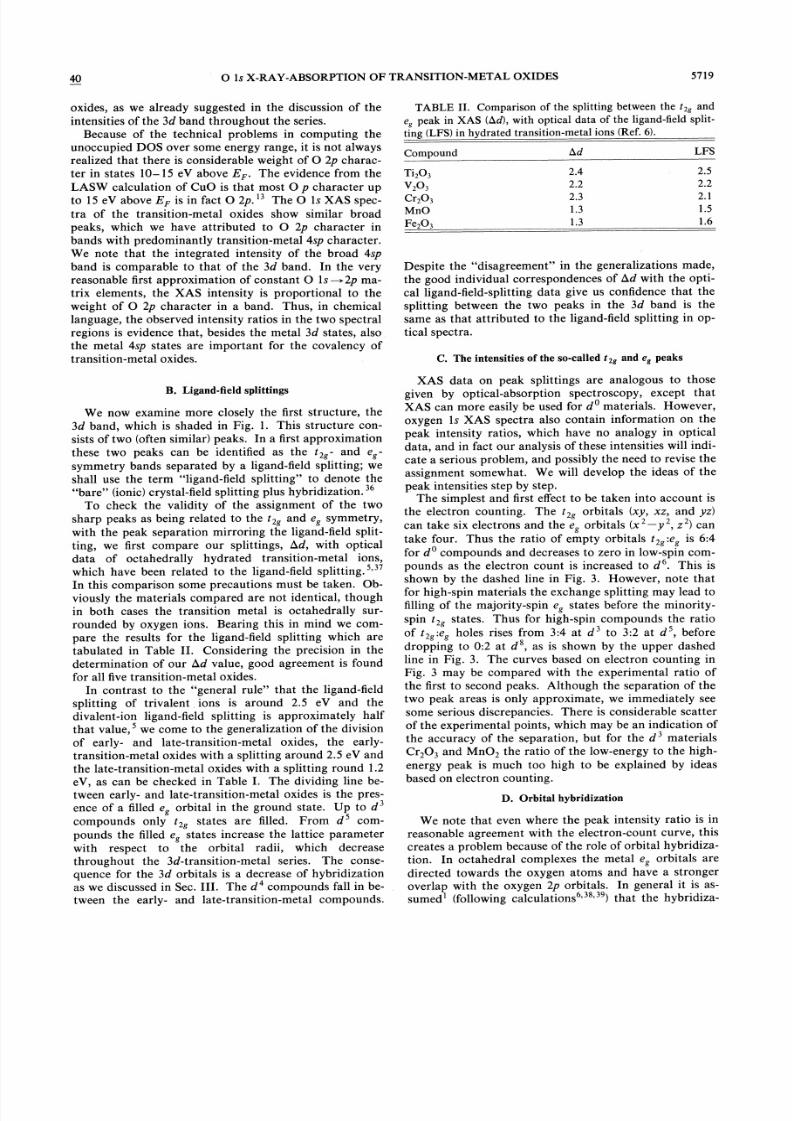
TABLE II. Comparison of the splitting between the t2g and
e peak in XAS (Ad), with optical data of the ligand-field split-
ting (LFS) in hydrated transition-metal ions (Ref. 6).
Compound
Ti~03
V2O3Cr203MnO
Fe203
2.4
2.22.31.3
1.3
LFS
2.5
2.22.11.51.6
Despite the "disagreement" in the generalizations made,
the good individual correspondences of hd with the opti-
cal ligand-field-splitting data give us confidence that the
splitting between the two peaks in the 3d band is the
same as that attributed to the ligand-field splitting in op-
tical spectra.
We note that even where the peak intensity ratio is in
reasonable agreement with the electron-count curve, this
creates a problem because of the role of orbital hybridiza-
tion. In octahedral complexes the metal eg orbitals are
directed towards the oxygen atoms and have a stronger
overlap with the oxygen 2p orbitals. In general it is as-
sumed' (following calculations ' ') that the hybridiza-
C. The intensities of the so-called t2g and e~ peaks
XAS data on peak splittings are analogous to thosegiven by optical-absorption spectroscopy, except that
XAS can more easily be used for d materials. However,
oxygen 1s XAS spectra also contain information on the
peak intensity ratios, which have no analogy in optical
data, and in fact our analysis of these intensities will indi-
cate a serious problem, and possibly the need to revise the
assignment somewhat. We wi11 develop the ideas of the
peak intensities step by step.The simplest and first effect to be taken into account is
the electron counting. The t2g orbitals (xy, xz, and yz)
can take six electrons and the es orbitals (x —y, z ) can
take four. Thus the ratio of empty orbitals t2 .e is 6:4for d compounds and decreases to zero in low-spin com-
pounds as the electron count is increased to d . This isshown by the dashed line in Fig. 3. However, note that
for high-spin materials the exchange splitting may lead to
filling of the majority-spin eg states before the minority-
spin t2 states. Thus for high-spin compounds the ratio
of t2~:e~ holes rises from 3:4 at d to 3:2 at d, before
dropping to 0:2 at d, as is shown by the upper dashed
line in Fig. 3. The curves based on electron counting in
Fig. 3 may be compared with the experimental ratio ofthe first to second peaks. Although the separation of thetwo peak areas is only approximate, we immediately see
some serious discrepancies. There is considerable scatter
of the experimental points, which may be an indication ofthe accuracy of the separation, but for the d materials
Cr203 and MnOz the ratio of the low-energy to the high-energy peak is much too high to be explained by ideas
based on electron counting.
D. Orbital hybridization
8/2/2019 Oxygen 1s X-ray-Absorption Edges of Transition-metal Oxides
http://slidepdf.com/reader/full/oxygen-1s-x-ray-absorption-edges-of-transition-metal-oxides 6/9
5720 F.M. F. de GROOT et al. 40
Cr
~m F~Tia
2.0
NiOCuO
1.0-
h0 I \I/IIII \/II//
//
////
'I/
\
\
tion of tz orbitals (forming m bonds) is about half that ofe orbitals (forming o bonds). The ground state of theearly-3d-transition-metal compounds can be described by
&+(n, )'"a, r +'L, &+(n, )'"a, ~r,"egL &, with N
ranging from 0 to 3. In the presence of the dominating
octahedral surrounding the two distinct states, tz +'L &
and~tz~esL
& have to be considered. This implies that
due to covalency the d state mixed with states in which
an electron has jumped from the ligand (in this case a
hole of oxygen 2p character is formed) to a transition-
metal 3d orbital. This means that as the mixing
coeKcients e, and a, account for the amounts of hybridi-zation with, respectively, tzg and e~ character, a, =—,a, .In oxygen 1s absorption, an electron is excited from the
oxygen 1s core state to states with some oxygen p charac-ter, i.e., ~ tz e L &. Thus we can now relate the intensities
to the covalency: n, a, gives the amount of ~tz+'L &
character in the ground state and it is this characterwhich is probed in the oxygen 1s absorption process.From this it is clear that the intensity ratio I, /I, should
be equivalent to the amount of covalent mixing
n, a, /n, u, =n, /4n, . In Fig. 3 we have compared this ra-
tio (solid line) to the experimental values. It is directlyevident that the theoretical lines strongly underestimate
the experimental ratio, i.e., the relative tz~ intensity. At
this moment we cannot explain the relative intensities
generally observed, despite consideration of several subsi-
diary effects described below.
E. Exchange splitting
The whole concept of high-spin and low-spin
configurations for 3d-transition-metal oxides implies that
0 1 2 3 4 5 6 7 8 9 10number o7 d electrons
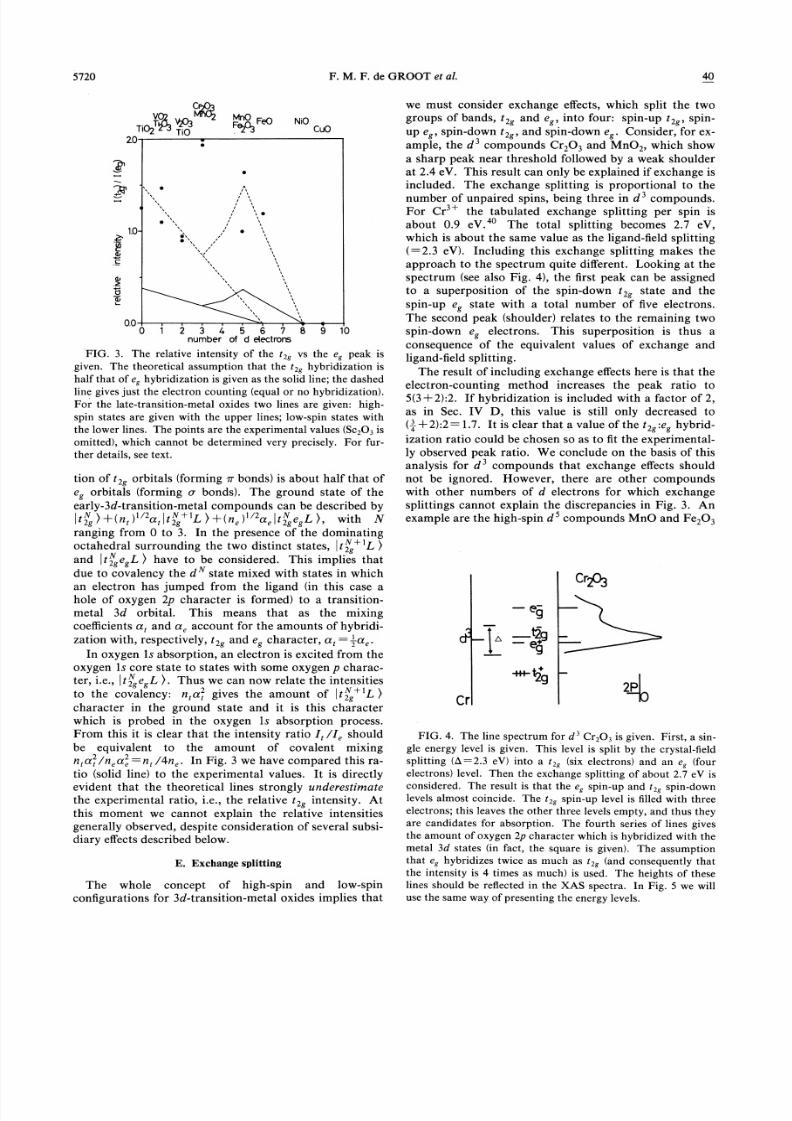
FIG. 3. The relative intensity of the t~g vs the e~ peak is
given. The theoretical assumption that the t&g hybridization is
half that of e~ hybridization is given as the solid line; the dashedline gives just the electron counting (equal or no hybridization).
For the late-transition-metal oxides two lines are given: high-
spin states are given with the upper lines; low-spin states with
the lower lines. The points are the experimental values (Sc&03 is
omitted), which cannot be determined very precisely. For fur-
ther details, see text.
we must consider exchange effects, which split the two
groups of bands, tz and e, into four: spin-up tz, spin-
up eg, spin-down tz, and spin-down eg. Consider, for ex-
ample, the d compounds Crz03 and MnOz, which show
a sharp peak near threshold followed by a weak shoulder
at 2.4 eV. This result can only be explained if exchange is
included. The exchange splitting is proportional to thenumber of unpaired spins, being three in d compounds.For Cr + the tabulated exchange splitting per spin is
about 0.9 eV. The total splitting becomes 2.7 eV,which is about the same value as the ligand-field splitting(=2.3 eV). Including this exchange splitting makes the
approach to the spectrum quite different. Looking at thespectrum (see also Fig. 4), the first peak can be assigned
to a superposition of the spin-down t~ state and the
spin-up e state with a total number of five electrons.
The second peak (shoulder) relates to the remaining two
spin-down e electrons. This superposition is thus a
consequence of the equivalent values of exchange and
ligand-field splitting.
The result of including exchange effects here is that theelectron-counting method increases the peak ratio to5(3+2):2. If hybridization is included with a factor of 2,as in Sec. IV D, this value is still only decreased to
(—,+2):2= 1.7. It is clear that a value of the tzg. eg hybrid-
ization ratio could be chosen so as to fit the experimental-
ly observed peak ratio. We conclude on the basis of thisanalysis for d compounds that exchange effects should
not be ignored. However, there are other compoundswith other numbers of d electrons for which exchange
splittings cannot explain the discrepancies in Fig. 3. An
example are the high-spin d compounds MnO and Fez03
~ ~
I ~ I
FIG. 4. The line spectrum for d Cr~03 is given. First, a sin-
gle energy level is given. This level is splitby
the crystal-field
splitting (6=2.3 eV) into a t&g (six electrons) and an eg {fourelectrons) level. Then the exchange splitting of about 2.7 eV is
considered. The result is that the e~ spin-up and t&g spin-down
levels almost coincide. The t~g spin-up level is filled with threeelectrons; this leaves the other three levels empty, and thus theyare candidates for absorption. The fourth series of lines givesthe amount of oxygen 2p character which is hybridized with themetal 3d states (in fact, the square is given). The assumptionthat e~ hybridizes twice as much as t~g (and consequently thatthe intensity is 4 times as much) is used. The heights of theselines should be rejected in the XAS spectra. In Fig. 5 we will
use the same way of presenting the energy levels.
8/2/2019 Oxygen 1s X-ray-Absorption Edges of Transition-metal Oxides
http://slidepdf.com/reader/full/oxygen-1s-x-ray-absorption-edges-of-transition-metal-oxides 7/9
0 1s X-RAY-ABSORPTION OF TRANSITION-METAL OXIDES 5721
for which the energy levels are illustrated in Fig. 5. Theexchange splitting is much larger than the crystal-field
splitting, so that spin-up tzz and ez states are filled and
the spin-down ones are empty. As a consequence, the ex-
change splitting does not change the ratio of the two
peaks and the intensity ratiot2g.eg should be —,:2=0.38
when the different hybridization is taken into account.This is far lower than the values measured (1.0 and 1.6).
F. Possible reasons for the discrepancies
In the solid, bond formation leads to broadening of the
t2g and eg levels. It is probable that the t2g and e~
descriptions are only approximately applicable to the two
peaks observed and to some extent t2 and ez character is
spread throughout the whole region of the unoccupied 3dlevels. ' This will modify the spectra distributions direct-
ly. In addition, it opens the possibility for the core-hole
potential to shift weight towards the threshold. %'e have
argued earlier that the inAuence of the core hole on the
oxygen 1s site is small because the unoccupied states have
principally metal 3d character. However, this does not
mean it can be ignored completely in the context of inten-sity distributions within the rather narrow, empty 3d re-
gion. There may be other reasons for the anomalous in-
tensity ratios we find, but we feel that these two effects ofband formation cannot be dismissed without furtherquantitative investigation.A further reason of discrepancies might be found in the
nonstoichiometry of some samples; defects distort the lo-
cal symmetry and lead to some variation in the intera-tomic distances. This results in a variation in the amountof hybridization, which in principle can infIuence the
t2g versus eg intensity distribution and also the ligand-
field splitting. We note that although computed charges
of the vanadium 1s XAS spectra from VOO 8 to VO& 25 arequite large, published vanadium 1s spectra show asmaller sensitivity, which, if reproduced at the oxygen 1s
edges, would not be large enough to explain thediscrepancies we observe. Although we have not con-sidered defects in detail here, we have measured NiO in
+I. +g
.!.t2
its black (defect-rich) and green form. Their oxygen lsXAS spectra were identical, which suggests that defectsare not too critical for the shape of the spectra. A studyof Li-doped NiO (or Ni& „Li„O)which results in oxygen
2p holes, revealed that besides the extra peak at the
edge (2p hole states) the rest of the spectrum did not
change much, except for an increasing width of thepeaks. This may not be true for highly defective oxides,like VO and TiO, and the question of the inhuence of de-fects deserves much more detailed study. However, theresults discussed in this paragraph suggest that defectscannot explain the discrepancies we discuss.
V. CONCLUDING REMARKS
All oxygen 1s absorption edges of the transition-metaloxides can be divided into two regions. In the first, nearthreshold, the oxygen 2p character is hybridized with thesharp structured transition-metal 3d band. In the secondregion, 0 2p character is hybridized with the weaklystructured
4'band. The integrated intensity of the 4sp
region is at least equal to the 3d-band region, which indi-cates that the metal 4sp states are important for the co-valency of the transition-metal oxides. The metal 4' hy-bridization gives a more or less constant bonding effectabove which the metal 3d hybridization accounts for thespecific, material-dependent, effects.The 3d band consists of two peaks, which we believe
are mainly related to, respectively, t2 and e symmetry,despite the observation of anomalous intensity ratios.For all oxides considered, the ligand-field-splitting pa-rameter, from optical spectroscopy, is well reproduced bythe separation of the first two sharp XAS peaks. forCr203 and Mn02 the description of the combined e6'ect
of ligand-field and exchange splitting leads to the con-
clusion that the first peak is an "accidental" superposi-tion of t2 spin-down and e~ spin-up states, while thesecond peak relates to the remaining e spin-down states.The intensities of t2g and eg do not conform with the
rule that eg hybridization is twice as big at t2g hybridiza-tion. ' Across the series the intensity of the t2g peak is
underestimated. The reason is not clear to us, but we be-lieve that band formation in the solid, with all its c'onse-
quences, may explain at least some of the discrepancies.Our analysis showed that an important factor deter-
mining the shape and magnitude of the 3d region in theoxygen 1s XAS spectra of the 3d-transition-metal oxidesis the presence of a filled e orbital in the ground state.
This criterion splits the 3d-transition-metal oxides into
two main groups: the early- (or light) 3d-transition-metaloxides with zero to three d electrons, and the late- (orheavy) 3d-transition-metal oxides with five or more delectrons, which are more localized.
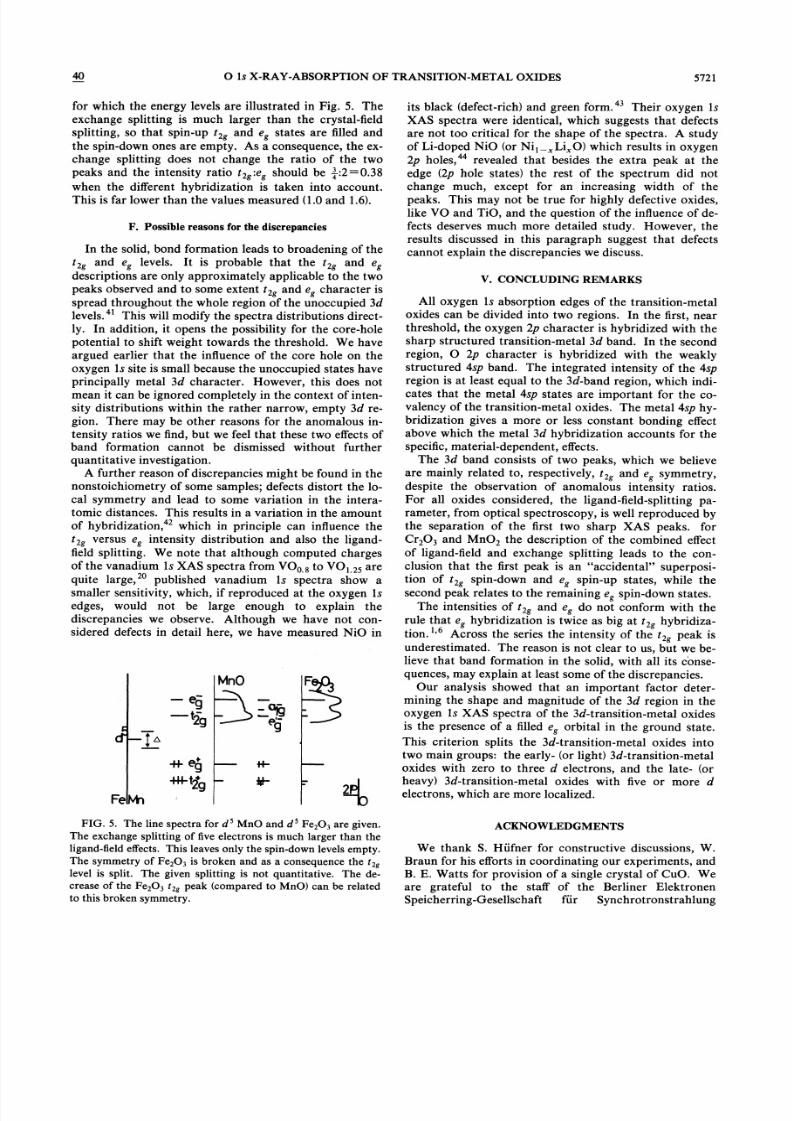
FIG. 5. The line spectra for d' MnO and d' Fe&03 are given.The exchange splitting of five electrons is much larger than the
ligand-field e6'ects. This leaves only the spin-down levels empty.The symmetry of Fe203 is broken and as a consequence the t2~
level is split. The given splitting is not quantitative. The de-
crease of the Fe203 t2g peak (compared to MnO) can be related
to this broken symmetry.
ACKNOWLEDGMENTS
We thank S. Hufner for constructive discussions, W.Braun for his efforts in coordinating our experiments, and
B. E.Watts for provision of a single crystal of CuO. Weare grateful to the staff of the Berliner Elektronen
Speicher ring-Gesellschaft fur Synchrotron strahlung
8/2/2019 Oxygen 1s X-ray-Absorption Edges of Transition-metal Oxides
http://slidepdf.com/reader/full/oxygen-1s-x-ray-absorption-edges-of-transition-metal-oxides 8/9
5722 F.M. F. de GROOT et al.
(BESSY) for their support. This work was supported, in
part, by the Dutch Foundation for Chemical Research
[Stichting Scheikundig Onderzoek Nederland (SON)]with financial assistance of the Netherlands Organization
for Scientific Research [Nederlandse Organisatie voor
Wetenschappelijk Onderzoek (NWO)] and by the Com-
mittee for the European Development of Science and
Technology (CODEST) program.
G. A. Sawatzky, in %arrow Band Phenomena, edited by J. C.Fuggle, G. A. Sawatzky, and J. W. Allen (Plenum, New
York, 1988).2J. B. Goodenough, Phys. Rev. 117, 1442 (1960); Frog. Solid
State Chem. 5, 145 {1972).J. B. Goodenough, in Magnetism and the Chemical Bond
(Wiley-Interscience, New York, 1963).4P. W. Anderson, Phys. Rev. 115, 2 (1959).5S. Sugano, Y. Tanabe, and H. Kitamura, in Multiplets of Transition Metal Ions in Crystals (Academic, New York, 1970).
L. F.Mattheiss, Phys. Rev. 5, 290 (1972);5, 306 (1972).7J.-L. Calais, Adv. Phys. 26, 847 (1977).A. Neckel, P. Rastl, R. Eibler, P.Weinberger, and K. Schwarz,J. Phys. C9, 579 (1976).K. Terakura, T. Oguchi, A. R. Williams, and J. Kubler, Phys.
Rev. B 30, 4734 (1984).Examples of high-resolution monochromators for the oxygen
1s edge (500 eV) are the SX700 at BESSY, Berlin, H. Peter-
sen, Nucl. Instrum. Methods A 246, 260 (1986); the 10-m
grazing-incidence monochromator at the Photon Factory, H.
Maezawa, S. Nakai, S. Mitani, A. Mikuni, T. Namioka, and
T. Sasaki, Nucl. Instrum. Methods A 246, 310 (1986);and the
Dragon monochromator at Brookhaven National Laborato-
ry, C.T. Chen, Nucl. Instrum. Methods A 256, 595 (1987).
The pace of development in this area is so high that within
the last year 500 meV resolution can be significantly bettered
in some instruments.
"For example, R. D. Cowan, in The Theory
ofAtomic Structure
and Spectra (University of California Press, Berkeley, 1981).'2For example, L. Hedin, Phys. Rev. 139,A796 (1965).
We know of only one oxide band-structure calculation (for
CuO), whose basis set includes also the metal 4s and 4p and
the oxygen 3s and 3p states and thus is more appropriate for a
comparison with oxygen 1s XAS. A detailed comparison for
CuO is given by M. Grioni, M. T. Czyzyk, F.M. F. de Groot,J. C. Fuggle, and B.E.Watts, Phys. Rev. B 39, 4886 (1989);The theoretical and mathematical details concerning this ex-
tended basis set are discussed by M. T. Czycyk and R. A. deGroot {unpublished).
D. Norman, K. B.Garg, and P. J. Durham, Solid State Com-
mun. 56, 895 (1985).H. Winter, P. J. Durham, and G. M. Stocks, J. Phys. F 14,1047 (1984).
J. Zaanen, G. A. Sawatzky, J. Fink, W. Speier, and J. C. Fug-gle, Phys. Rev. 32, 4905 (1985); J. Fink, Th. Muller-
Heinzerling, B. Scheerer, W. Speier, F. U. Hillebrecht, J. C.Fuggle, J.Zaanen, and G. A. Sawatzky, ibid. 32, 4899 (1985).S.W. Kortboyer, M. Grioni, W. Speier, R. Zeller, L.M. Wat-
son, M. T. Gibson, F. Schafers, and J. C. Fuggle, J. Phys. C
(to be published).8S. Nakai, T. Mitsuishi, H. Sugawara, H. Maezawa, T.Matsukawa, S. Mitani, K. Yamasaki, and T. Fujikawa, Phys.
Rev. B 36, 9241 (1987).A. F. Wells, in Structural Inorganic Chemistry, 3rd ed..
(Clarendon, Oxford, 1962), p. 475.
F.W. Kutzler and D. E. Ellis, Phys. Rev. B 29, 6890 (1984).
S. W. Kortboyer, J. B. Goedkoop, F. M. F. de Groot, M.Grioni, J. C. Fuggle, and H. Petersen, Nucl. Instrum.
Methods A 275, 435 (1989).R. Brydson, B. G. Williams, W. Engel, H. Sauer, E. Zeitler,and J.M. Thomas, Solid State Commun. 64, 609 (1987).L. A. Grunes, R.D. Leapman, C. N. Wilker, R. Hoffman, and
A. B. Kunz, Phys. Rev. B 25, 7157 (1982).~4D. W. Fisher, J.Phys. Chem. Solids 32, 2455 (1971).I. Davoli, A. Macelli, A. Bianconi, M. Tomellini, and M. Fan-
foni, Phys. Rev. B 33, 2979 (1986);G. E. Brown, Jr., G. A.Waychunas, J. Stohr, and F. Sette, J. Phys. (Paris) Colloq. 47,C8-685 (1986).A discussion on TM oxide metal E edges is given in A. Bal-
zarotti, F. Comin, L. Incoccia, M. Piacenti, S. Mobilio, and
A. Savoia, Solid State Commun. 35, 145 (1980) (on Ti02); M.
Belli, A. Scafati, A. Bianconi, S. Mobilio, L. Palladino, A.
Reale, and E. Burratini, ibid. 35, 355 (1980) (on manganese);
A. Bianconi, Phys. Rev. B 26, 2741 (1982) (on VO2); G. S.Knapp, B.W. Veal, H. K. Pan, and T. Klippert, Solid State
Commun. 44, 1343 (1982); L. A. Grunes, Phys. Rev. B 27,2111 (1983);J.Wong, F.W. Lytle, R. P. Messmer, and D. H.Maylotte, ibid. 30, 5596 (1984) (on vanadium); Th. Lindner,H. Sauer, W. Engel, and K. Kambe, ibid. 33, 22 (1986) {on
MgO); S.-H. Chou, J.Guo, and D. E. Ellis, ibid. 34, 12 (1986)(on FeO).Results on the TM oxide metal L2 3 edges can be found in R.D. Leapman, L. A. Grunes, and P. L. Fejes, Phys. Rev. B 26,
614 (1982); S. L. Hulbert, B.A. Bunker, F. C. Brown, and P.Pianetta, ibid. 30, 2120 (1984) (on Cu20).K. Tsutsumi, O. Aita, and K. Ichikawa, Phys. Rev. B 15, 4638(1977).C. Sugiura, M. Kitamura, and S. Muramatsu, J. Chem. Phys.
84, 4824 (1986);C. Sugiura, M. Kitamura, and S.Muramatsu,
ibid. 85, 5269 (1986); C. Sugiura, M, Kitamura, and S. Mu-
ramatsu, Phys. Status Solidi B 135, K57 (1986); C. Sugiura,M. Kitamura, and S. Muramatsu, ibid. 141, K173 (1987);M.
Kitamura, S. Muramatsu, and C. Sugiura, Phys. Rev. B 33,5294 (1986);Y. Ohno, K. Hirama, S. Nakai, C. Sugiura, and
S. Okada, ibid. 27, 3811 (1983); Y. Ohno and S. Nakai, J.Phys. Soc. Jpn. 54, 3591 (1985); S. Nakai, K. Ogata, M.
Ohashi, C. Sugiura, T. Mitsuishi, and H. Maezawa, ibid. 54,4034 (1985);S. Nakai, A. Kawata, M. Ohashi, M. Kitamura,C. Sugiura, T. Mitsuishi, and H. Maezawa, Phys. Rev. B37,10 895 (1988).This assignment does agree with, e.g. , P. R. Sarode, J. Phys. F17, 1605 {1987).'K. Fajans and G. Joos, Z. Phys. 23, 1 (1923);K. Fajans, Na-
turwissenschaften 11, 165 (1923); Z. Krystallogr. 61, 18
(1924).
O. K. Andersen, O. Jepsen, and D. Glotzel, in Highlights in
Condensed Matter Theory, edited by F. Bassani, F. Fumi, and
M. P. Tosi (North-Holland, Amsterdam, 1985), pp. 82 and
113.

8/2/2019 Oxygen 1s X-ray-Absorption Edges of Transition-metal Oxides
http://slidepdf.com/reader/full/oxygen-1s-x-ray-absorption-edges-of-transition-metal-oxides 9/9
40 0 1s X-RAY-ABSORPTION OF TRANSITION-METAL OXIDES 5723
M. P. Tosi (North-Holland, Amsterdam, 1985), pp. 82 and
113.M. Pedio, J. C. Fuggle, J. Somers, E. Umbach, J. Haase, Th.Lindner, U. Hofer, M. Grioni, F.M. F. de Groot, B.Hillert,L. Becker, and A. Robinson, Phys. Rev. 8 {unpublished).
J. Owens and J. H. M. Thornley, Rep. Prog. Phys. 29, 675
(1966);K.W. H. Stevens and C. A. Bates, in Magnetic Oxides,edited by D. J. Craik (Wiley, London, 1975), pp. 141ff; A. S.Chakravarty, Introduction to the Magnetic Properties ofSolids{Wiley, New York, 1980), pp. 271ff, and references therein.
35See, e.g. , M. Tsukada, J. Phys. Soc. Jpn. 49, 1183 (1980);M.Tsukada, H. Adachi, and C. Satoko, Frog. Surf. Sci. 14, 113(1983}.
36C. J. Ballhausen, in An Introduction to Ligand Field Theory
{McGraw-Hill, New York, 1962).
O. W. Holmes and D. S. McClure, J. Chem. Phys. 26, 1686
(1957).3sW. Harrison, in Electronic Structure and Properties of Solids(Freeman, San Francisco, 1980).
39O. Gunnarsson, O. K. Andersen, O. Jepsen, and J. Zaanen,Phys. Rev. B 39, 1708 {1989).C. E. Moore, Atomic Energy Levels, Nat. Bur. Stand. {U.S.)
Circ. No. 467 (U.S. GPO, Washington, D.C., 1958), Pts.I-III.This is reflected in a band-structure calculation of TiO2, asgiven by S. Munnix and M. Schmeits, Phys. Rev. B 30, 2202(1984).K. E. Smith and V. E.Henrich, Phys. Rev. B 38, 5965 (1988).
43See, e.g. , P. A. Cox, in The E/ectronrc Structure and Chemistry
ofSolids (Oxford University Press, London, 1987), pp. 215ff.44P. Kuiper, G. Kruizinga, J. Ghijsen, G. A. Sawatzky, and H.Verweij, Phys. Rev. Lett. 62, 221 (1989).