OWNERSHIP STRUCTURE AND INFORMATION DISCLOSURE: AN APPROACH AT FIRM LEVEL IN VIETNAM Quach M. Hung...
27
OWNERSHIP STRUCTURE AND OWNERSHIP STRUCTURE AND INFORMATION DISCLOSURE: INFORMATION DISCLOSURE: AN APPROACH AT FIRM LEVEL IN AN APPROACH AT FIRM LEVEL IN VIETNAM VIETNAM Quach M. Hung and Pham T. B. Ngoc University of Economics HCMC Hoa Sen University SMALL TALKS BIG IDEAS – UEH April 2015 Presented at the International Conference in Finance and Economics (ICFE, Ton Duc Thang University) and Hoa Sen Research Seminar (Hoa Sen University)
-
Upload
carmella-cobb -
Category
Documents
-
view
217 -
download
3
Transcript of OWNERSHIP STRUCTURE AND INFORMATION DISCLOSURE: AN APPROACH AT FIRM LEVEL IN VIETNAM Quach M. Hung...

OWNERSHIP STRUCTURE AND INFORMATION OWNERSHIP STRUCTURE AND INFORMATION DISCLOSURE: DISCLOSURE:
AN APPROACH AT FIRM LEVEL IN VIETNAMAN APPROACH AT FIRM LEVEL IN VIETNAM
Quach M. Hung and Pham T. B. NgocUniversity of Economics HCMC Hoa Sen University
SMALL TALKS BIG IDEAS – UEH
April 2015
Presented at the International Conference in Finance and Economics
(ICFE, Ton Duc Thang University)
and Hoa Sen Research Seminar (Hoa Sen University)

Corporate disclosureCorporate disclosure• Corporate disclosure is the communication
between the firm managers, controlling owners and the outside investors about the firm performance, financial situation or potential development or even risks. (Healy and Palepu, 2001)
• This process could be obliged by law (through regulated financial, annual reports) or voluntary (by press release or firm online news).

Ownership concentrationOwnership concentration
• The ownership concentration is the situation when one or a few shareholders hold large percentage of stock of a firm. (Jung & Kwon, 2002)
• When the stock holding is equivalent to the voting right, the result is the power concentration.

• The VNI confronted a decreasing trend from the range 950-1000 in the years 2007-2008 to be now sustainably above 500 in recent years (Bloomberg)
• the corporate disclosure problem – market failure: the cost for acquiring information becomes higher for the outside investor (Jiang, et al, 2011) the investment environment is less attractive.
• The fund attraction progress for the capital market in order to lower the domestic cost of capital could be in vain if the corporate disclosure problem is not resolved (Jiang, et al, 2011; Lawrence, 2013).
Ownership concentration and corporate disclosure - WHY?Ownership concentration and corporate disclosure - WHY?

• Emerging and transition economies are dominated by young firms which are hold mainly by entrepreneurs or the family members.
• Controlling owners have incentives to hide firm specific information or disclose them in a selective way in order to benefit their self-serving activities.
• => Hidden information could not be reflected into the stock price. When the ownership concentration rises, less amount of information are disclosed to the public.
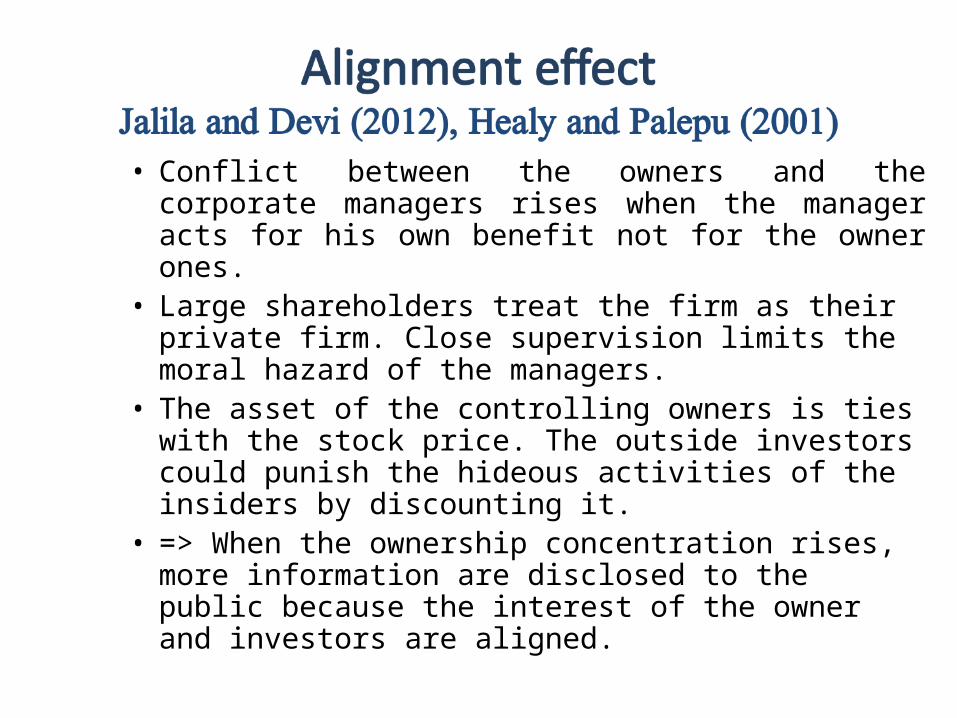
• Conflict between the owners and the corporate managers rises when the manager acts for his own benefit not for the owner ones.
• Large shareholders treat the firm as their private firm. Close supervision limits the moral hazard of the managers.
• The asset of the controlling owners is ties with the stock price. The outside investors could punish the hideous activities of the insiders by discounting it.
• => When the ownership concentration rises, more information are disclosed to the public because the interest of the owner and investors are aligned.

State vs. Private ownershipState vs. Private ownership
• The number of partially privatized former SOEs is dominating the Vietnamese financial market.
• State joint stock firm: its largest owner is related to the state.
• Government agency is believed not effective and possibly corrupted. Hence, their benefit from controlling cash flow, contract or corruption must be hidden from the public at all cost.
• Hence, the information disclosure of these firms could be low.

Research questionsResearch questions
• Does ownership concentration have significant influence on the corporate disclosure for the case of Vietnam?
• How does government ownership have impact on the corporate disclosure?

Ownership concentration and the information disclosureOwnership concentration and the information disclosureAuthors
Period & Sample
MethodologyDisclosure
measurement
Ownership concentration measurement
Results
Gul, Kim and Qiu (2010)
1996 - 20031142 firms6129 obs
Multivariate regression
Stock Synchronization
Percentage of topshareholder
Negative relationship with concave function
Chau & Gray
(2010)
2002273 firmsHong Kong
OLS
Voluntary disclosure index
Percentage of family member
Family ownership disclose more information
Ding et al (2013)
2003-2008China
OLS
Stock informativeness
Percentege of fund ownership
Fund ownership is positively related to disclosure.
Jung and Kwon (2002)
Korea OLS
Return informativeness
Dummy variableEqual 1 if ownership above mean value.
Positive relationship between ownership
Jiang et al (2011)
103 firms390 firm-year obsNew Zealand
Panel corrected standard error (PCSE)
Bid - Ask spread
Ownership index
Ownership concentration blocks the information

Government ownership and the Government ownership and the information disclosureinformation disclosure
Authors Period & Sample MethodologyDisclosure
measurementGovernment measurement
Results
Gul, Kim and Qiu (2010)
1996 - 20031142 firms6129 observations
Multivariate regression
Stock Synchronization
Dummy variable. Top holder related to the state = 1
Government ownership limits disclosure.
Ding et al (2013)
2003-2008China
OLSStock informativeness
Percentege of government ownership
State ownership is negatively related to disclosure.

The main modelThe main model
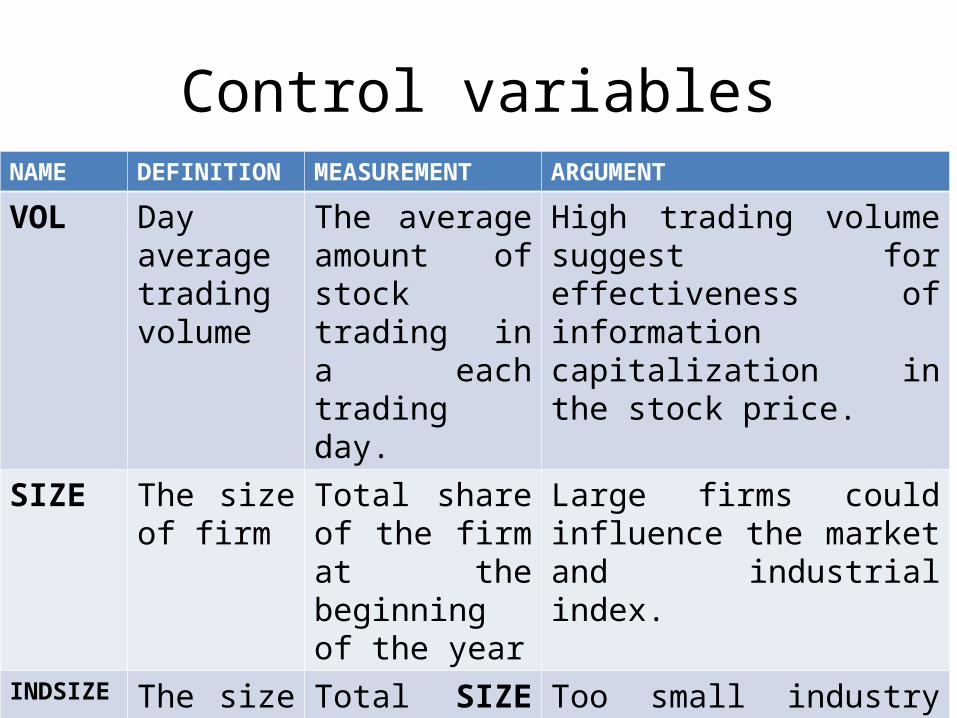
Control variablesNAME DEFINITION MEASUREMENT ARGUMENT
VOL Day average trading volume
The average amount of stock trading in a each trading day.
High trading volume suggest for effectiveness of information capitalization in the stock price.
SIZE The size of firm
Total share of the firm at the beginning of the year
Large firms could influence the market and industrial index.
INDSIZE The size of the industry
Total SIZE of all firms in the industry
Too small industry will be sensitive with the firm stock return.

How to measure corporate disclosure?How to measure corporate disclosure?Roll(1988)Roll(1988)

Constructing the dependent variable

Industrial return

Measuring the corporate disclosureMeasuring the corporate disclosure

Comparison progress between FE & RE models
Source: Park (2011)

Descriptive statisticsDescriptive statistics• The variables data of 195 listed firms on HoSE
from 2006 to 2011:Variables
Number of observation
MeanStandard Deviation
Min Max
R2 729 0.3033 0.1699 0.0257 0.7349INFO 729 1.0283 1.0032 -1.0196 3.6352
Ownership concentrationTOPHOLD 723 0.3681 0.1918 0.0500 0.8370Private JS 306 0.3326 0.2022 0.0500 0.8370State JS 417 0.3941 0.1796 0.0550 0.7990
VOL 729 91,376 142,699 478 1,174,396 SIZE 729 21,000,000 16,900,000 1,138,501 82,700,000 INDSIZE 729 808,000,000 639,000,000 3,000,000 1,970,000,000
Dependent variable
Independent variables
Control variables
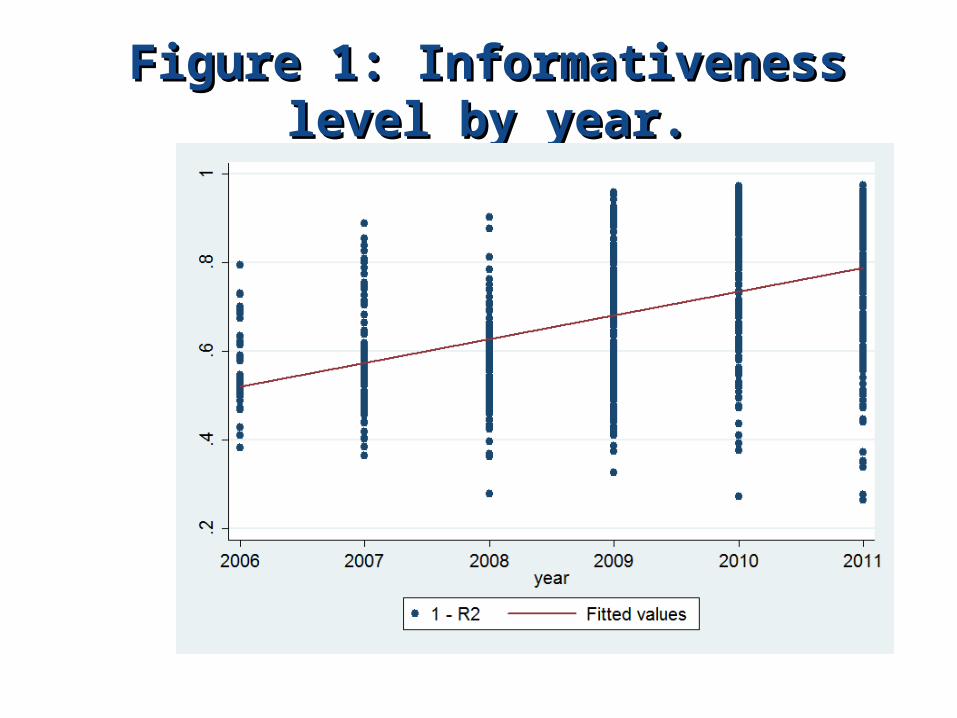
Figure 1: Informativeness level by year.Figure 1: Informativeness level by year.

Fitted value of Corporate disclosure against Fitted value of Corporate disclosure against Ownership concentration.Ownership concentration.

Fitted value of INFO against TOPHOLD of Private joint stock firms.

Table 2: Table 2: The Impact of Ownership Concentration on Corporate DisclosureThe Impact of Ownership Concentration on Corporate Disclosure..Column 1 2 3 4 5 6
GROUP FE RE FE RE FE RE
1.0570 0.4312 1.5935 0.2171 1.4114 0.9005
(2.28)** (2.02)** (0.94) (0.67 ) (2.65)*** (3.17)***
-1.39E-08 -1.11E-08 -1.33E-08 -9.22E-09 -7.66E-09 -1.33E-08
(-2.25)** (-3.88)*** (-1.48) (-2.26)** (-0.98) (-3.64)***
-4.64E-11 2.12E-11 5.11E-11 1.40E-10 -3.65E-10 -2.77E-10
(-0.25) (0.12) (0.21) (0.63) (-0.99 ) (-0.89)
-1.46E-06 -2.02E-06 -1.41E-06 -2.21E-06 -1.46E-06 -1.91E-06
(-4.40)*** (-6.83)*** (-3.08 )*** (-4.15 )*** (-3.75)*** (-6.28 )***
0.0648 0.0432 -0.0610 -0.0415 0.4867 0.3565(0.59) (-0.42) (-0.46) (-0.32) (2.19)** (2.00)**0.2104 0.2324 0.0613 0.1147 0.7042 0.6469(1.51) (-1.79)* (0.35) (0.71) (2.52)** (2.86)***0.6357 0.6258 0.5262 0.5097 1.1856 1.1058
(3.25)*** (3.47)*** (2.22 )** (2.03)*** (2.82)*** (3.28)***1.3711 1.3202 1.1140 1.0419 2.1360 2.0562
(5.60)*** (6.01)*** (3.85)*** (3.89)*** (3.94)*** (4.83)***1.4176 1.3766 1.2941 1.2288 2.0230 1.9826
(5.27)*** (5.69)*** (4.12)*** (4.18)*** (3.32)*** (4.14)***
0.2366 0.3947 -0.0115 0.2619 -0.1681 -0.0369
(1.12) (1.92)* (-0.02) (-1.07) (-0.56 ) (-0.11)Dummies Industry Industry Industry
F-test (3.58)*** (3.33)*** (3.19)*** (47.19)***
LM test (98.5)*** ( 23.22)*** (41.69)***
Hausman test
(12.65)** (14.37)** (14.37)** (7.96) (7.96)
Obs 723 723 417 417 306 306
Private JS firms
Control variables
Year dummies
TOPHOLD
SIZE
INDSIZE
VOL
State JS firmsAll firms
_constant
2007
2008
2009
2010
2011

RobustnessRobustness checkcheck

Table 3: Weighted regression by FE and RE modelTable 3: Weighted regression by FE and RE model
1 2 3 4 5 6
GROUP Total State Private Total State Private
1.042 -1.317 1.935 0.498 0.191 1.120
(1.61) (-0.80) (3.30 )*** (1.88)* (0.57) (3.16 )***
9.2E-06 9.0E-05 2.8E-05 3.1E-05 4.9E-05 4.3E-06
(0.21) (1.12) (0.43) (1.27)* (1.55)* (0.13)
-3.9E-07 -3.0E-07 -1.5E-06 -1.3E-07 4.4E-08 -1.3E-06
(-0.41) (-0.25 ) (-0.91) (-0.15) (0.04) (-0.80)
-1.0E-02 -1.0E-02 -9.4E-03 -1.2E-02 -1.4E-02 -1.1E-02
(-5.53 )*** (-4.03 )*** (-4.45)*** (-7.50 )*** (-4.83)*** (-6.41)***
405.25 2543.76 -1575.83 614.94 -494.26 -979.20
(0.45 ) (1.43) (-1.50 ) (0.69)*** (-0.45) (-0.69)
Dummies Industry Industry Industry
F-test (3.14)*** (2.62)*** (2.87)***
LM test (80.60)*** (23.22)*** (42.62)***Hausman
test(6.49) (14.14)** (7.47) (6.49) (14.14)** (7.47)
Obs 723 417 306 723 417 306
Dependent variable: wINFO
Constant
Fixed effects Random effects
wTOPHOLD
SIZE
INDSIZE
VOL
Control variables

CONCLUSIONCONCLUSION• Ownership concentration favors corporate
disclosure.• The effect comes mainly from the private
sector.• With the state joint stock firm, the
insignificant result could be explained that the good effect is offset by the bad side.
• A strong trend of enhancing of disclosure situation through time is confirmed.

THANK YOU THANK YOU FOR FOR
YOUR ATTENTION!YOUR ATTENTION!


![[INTERNSHIP APPLICATION 2016][QUACH YEN NHI]-[CERTIFICATES]](https://static.fdocuments.us/doc/165x107/5885cf941a28ab42028b6277/internship-application-2016quach-yen-nhi-certificates.jpg)