Overweight (no change) Upside potential intact for our top ... · Technology│Singapore│Tech...
52
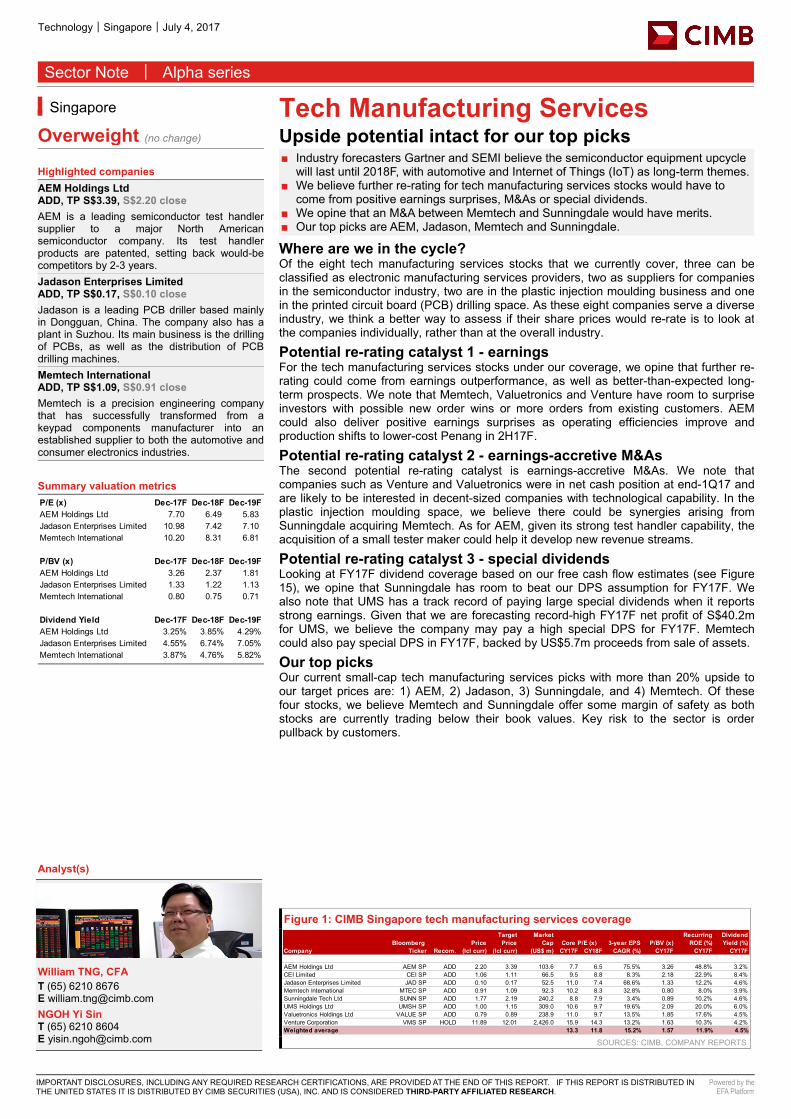
Technology│Singapore│July 4, 2017 Sector Note │ Alpha series IMPORTANT DISCLOSURES, INCLUDING ANY REQUIRED RESEARCH CERTIFICATIONS, ARE PROVIDED AT THE END OF THIS REPORT. IF THIS REPORT IS DISTRIBUTED IN THE UNITED STATES IT IS DISTRIBUTED BY CIMB SECURITIES (USA), INC. AND IS CONSIDERED THIRD-PARTY AFFILIATED RESEARCH. Powered by the EFA Platform Tech Manufacturing Services Upside potential intact for our top picks ■ Industry forecasters Gartner and SEMI believe the semiconductor equipment upcycle will last until 2018F, with automotive and Internet of Things (IoT) as long-term themes. ■ We believe further re-rating for tech manufacturing services stocks would have to come from positive earnings surprises, M&As or special dividends. ■ We opine that an M&A between Memtech and Sunningdale would have merits. ■ Our top picks are AEM, Jadason, Memtech and Sunningdale. Where are we in the cycle? Of the eight tech manufacturing services stocks that we currently cover, three can be classified as electronic manufacturing services providers, two as suppliers for companies in the semiconductor industry, two are in the plastic injection moulding business and one in the printed circuit board (PCB) drilling space. As these eight companies serve a diverse industry, we think a better way to assess if their share prices would re-rate is to look at the companies individually, rather than at the overall industry. Potential re-rating catalyst 1 - earnings For the tech manufacturing services stocks under our coverage, we opine that further re- rating could come from earnings outperformance, as well as better-than-expected long- term prospects. We note that Memtech, Valuetronics and Venture have room to surprise investors with possible new order wins or more orders from existing customers. AEM could also deliver positive earnings surprises as operating efficiencies improve and production shifts to lower-cost Penang in 2H17F. Potential re-rating catalyst 2 - earnings-accretive M&As The second potential re-rating catalyst is earnings-accretive M&As. We note that companies such as Venture and Valuetronics were in net cash position at end-1Q17 and are likely to be interested in decent-sized companies with technological capability. In the plastic injection moulding space, we believe there could be synergies arising from Sunningdale acquiring Memtech. As for AEM, given its strong test handler capability, the acquisition of a small tester maker could help it develop new revenue streams. Potential re-rating catalyst 3 - special dividends Looking at FY17F dividend coverage based on our free cash flow estimates (see Figure 15), we opine that Sunningdale has room to beat our DPS assumption for FY17F. We also note that UMS has a track record of paying large special dividends when it reports strong earnings. Given that we are forecasting record-high FY17F net profit of S$40.2m for UMS, we believe the company may pay a high special DPS for FY17F. Memtech could also pay special DPS in FY17F, backed by US$5.7m proceeds from sale of assets. Our top picks Our current small-cap tech manufacturing services picks with more than 20% upside to our target prices are: 1) AEM, 2) Jadason, 3) Sunningdale, and 4) Memtech. Of these four stocks, we believe Memtech and Sunningdale offer some margin of safety as both stocks are currently trading below their book values. Key risk to the sector is order pullback by customers. Figure 1: CIMB Singapore tech manufacturing services coverage SOURCES: CIMB, COMPANY REPORTS Singapore Overweight (no change) Highlighted companies AEM Holdings Ltd ADD, TP S$3.39, S$2.20 close AEM is a leading semiconductor test handler supplier to a major North American semiconductor company. Its test handler products are patented, setting back would-be competitors by 2-3 years. Jadason Enterprises Limited ADD, TP S$0.17, S$0.10 close Jadason is a leading PCB driller based mainly in Dongguan, China. The company also has a plant in Suzhou. Its main business is the drilling of PCBs, as well as the distribution of PCB drilling machines. Memtech International ADD, TP S$1.09, S$0.91 close Memtech is a precision engineering company that has successfully transformed from a keypad components manufacturer into an established supplier to both the automotive and consumer electronics industries. Summary valuation metrics Analyst(s) William TNG, CFA T (65) 6210 8676 E [email protected] NGOH Yi Sin T (65) 6210 8604 E [email protected] P/E (x) Dec-17F Dec-18F Dec-19F AEM Holdings Ltd 7.70 6.49 5.83 Jadason Enterprises Limited 10.98 7.42 7.10 Memtech International 10.20 8.31 6.81 P/BV (x) Dec-17F Dec-18F Dec-19F AEM Holdings Ltd 3.26 2.37 1.81 Jadason Enterprises Limited 1.33 1.22 1.13 Memtech International 0.80 0.75 0.71 Dividend Yield Dec-17F Dec-18F Dec-19F AEM Holdings Ltd 3.25% 3.85% 4.29% Jadason Enterprises Limited 4.55% 6.74% 7.05% Memtech International 3.87% 4.76% 5.82% Bloomberg Price Target Price Market Cap Core P/E (x) 3-year EPS P/BV (x) Recurring ROE (%) Dividend Yield (%) Company Ticker Recom. (lcl curr) (lcl curr) (US$ m) CY17F CY18F CAGR (%) CY17F CY17F CY17F AEM Holdings Ltd AEM SP ADD 2.20 3.39 103.6 7.7 6.5 75.5% 3.26 48.8% 3.2% CEI Limited CEI SP ADD 1.06 1.11 66.5 9.5 8.8 8.3% 2.18 22.9% 8.4% Jadason Enterprises Limited JAD SP ADD 0.10 0.17 52.5 11.0 7.4 68.6% 1.33 12.2% 4.6% Memtech International MTEC SP ADD 0.91 1.09 92.3 10.2 8.3 32.8% 0.80 8.0% 3.9% Sunningdale Tech Ltd SUNN SP ADD 1.77 2.19 240.2 8.8 7.9 3.4% 0.89 10.2% 4.6% UMS Holdings Ltd UMSH SP ADD 1.00 1.15 309.0 10.6 9.7 19.6% 2.09 20.0% 6.0% Valuetronics Holdings Ltd VALUE SP ADD 0.79 0.89 238.9 11.0 9.7 13.5% 1.85 17.6% 4.5% Venture Corporation VMS SP HOLD 11.89 12.01 2,426.0 15.9 14.3 13.2% 1.63 10.3% 4.2% Weighted average 13.3 11.8 15.2% 1.57 11.9% 4.5%
Transcript of Overweight (no change) Upside potential intact for our top ... · Technology│Singapore│Tech...
Technology│Singapore│July 4, 2017
Sector Note │ Alpha series
IMPORTANT DISCLOSURES, INCLUDING ANY REQUIRED RESEARCH CERTIFICATIONS, ARE PROVIDED AT THE END OF THIS REPORT. IF THIS REPORT IS DISTRIBUTED IN THE UNITED STATES IT IS DISTRIBUTED BY CIMB SECURITIES (USA), INC. AND IS CONSIDERED THIRD-PARTY AFFILIATED RESEARCH.
Powered by the EFA Platform
Tech Manufacturing Services Upside potential intact for our top picks ■ Industry forecasters Gartner and SEMI believe the semiconductor equipment upcycle
will last until 2018F, with automotive and Internet of Things (IoT) as long-term themes. ■ We believe further re-rating for tech manufacturing services stocks would have to
come from positive earnings surprises, M&As or special dividends. ■ We opine that an M&A between Memtech and Sunningdale would have merits. ■ Our top picks are AEM, Jadason, Memtech and Sunningdale.
Where are we in the cycle? Of the eight tech manufacturing services stocks that we currently cover, three can be classified as electronic manufacturing services providers, two as suppliers for companies in the semiconductor industry, two are in the plastic injection moulding business and one in the printed circuit board (PCB) drilling space. As these eight companies serve a diverse industry, we think a better way to assess if their share prices would re-rate is to look at the companies individually, rather than at the overall industry.
Potential re-rating catalyst 1 - earnings For the tech manufacturing services stocks under our coverage, we opine that further re-rating could come from earnings outperformance, as well as better-than-expected long-term prospects. We note that Memtech, Valuetronics and Venture have room to surprise investors with possible new order wins or more orders from existing customers. AEM could also deliver positive earnings surprises as operating efficiencies improve and production shifts to lower-cost Penang in 2H17F.
Potential re-rating catalyst 2 - earnings-accretive M&As The second potential re-rating catalyst is earnings-accretive M&As. We note that companies such as Venture and Valuetronics were in net cash position at end-1Q17 and are likely to be interested in decent-sized companies with technological capability. In the plastic injection moulding space, we believe there could be synergies arising from Sunningdale acquiring Memtech. As for AEM, given its strong test handler capability, the acquisition of a small tester maker could help it develop new revenue streams.
Potential re-rating catalyst 3 - special dividends Looking at FY17F dividend coverage based on our free cash flow estimates (see Figure 15), we opine that Sunningdale has room to beat our DPS assumption for FY17F. We also note that UMS has a track record of paying large special dividends when it reports strong earnings. Given that we are forecasting record-high FY17F net profit of S$40.2m for UMS, we believe the company may pay a high special DPS for FY17F. Memtech could also pay special DPS in FY17F, backed by US$5.7m proceeds from sale of assets.
Our top picks Our current small-cap tech manufacturing services picks with more than 20% upside to our target prices are: 1) AEM, 2) Jadason, 3) Sunningdale, and 4) Memtech. Of these four stocks, we believe Memtech and Sunningdale offer some margin of safety as both stocks are currently trading below their book values. Key risk to the sector is order pullback by customers.
Figure 1: CIMB Singapore tech manufacturing services coverage
SOURCES: CIMB, COMPANY REPORTS
Singapore
Overweight (no change)
Highlighted companies AEM Holdings Ltd ADD, TP S$3.39, S$2.20 close AEM is a leading semiconductor test handler supplier to a major North American semiconductor company. Its test handler products are patented, setting back would-be competitors by 2-3 years. Jadason Enterprises Limited ADD, TP S$0.17, S$0.10 close Jadason is a leading PCB driller based mainly in Dongguan, China. The company also has a plant in Suzhou. Its main business is the drilling of PCBs, as well as the distribution of PCB drilling machines. Memtech International ADD, TP S$1.09, S$0.91 close Memtech is a precision engineering company that has successfully transformed from a keypad components manufacturer into an established supplier to both the automotive and consumer electronics industries. Summary valuation metrics
Analyst(s)
William TNG, CFA T (65) 6210 8676 E [email protected] NGOH Yi Sin T (65) 6210 8604 E [email protected]
P/E (x) Dec-17F Dec-18F Dec-19FAEM Holdings Ltd 7.70 6.49 5.83 Jadason Enterprises Limited 10.98 7.42 7.10 Memtech International 10.20 8.31 6.81
P/BV (x) Dec-17F Dec-18F Dec-19FAEM Holdings Ltd 3.26 2.37 1.81 Jadason Enterprises Limited 1.33 1.22 1.13 Memtech International 0.80 0.75 0.71
Dividend Yield Dec-17F Dec-18F Dec-19FAEM Holdings Ltd 3.25% 3.85% 4.29%Jadason Enterprises Limited 4.55% 6.74% 7.05%Memtech International 3.87% 4.76% 5.82%
Bloomberg PriceTarget
PriceMarket
Cap Core P/E (x) 3-year EPS P/BV (x)Recurring
ROE (%)Dividend Yield (%)
Company Ticker Recom. (lcl curr) (lcl curr) (US$ m) CY17F CY18F CAGR (%) CY17F CY17F CY17F
AEM Holdings Ltd AEM SP ADD 2.20 3.39 103.6 7.7 6.5 75.5% 3.26 48.8% 3.2%CEI Limited CEI SP ADD 1.06 1.11 66.5 9.5 8.8 8.3% 2.18 22.9% 8.4%Jadason Enterprises Limited JAD SP ADD 0.10 0.17 52.5 11.0 7.4 68.6% 1.33 12.2% 4.6%Memtech International MTEC SP ADD 0.91 1.09 92.3 10.2 8.3 32.8% 0.80 8.0% 3.9%Sunningdale Tech Ltd SUNN SP ADD 1.77 2.19 240.2 8.8 7.9 3.4% 0.89 10.2% 4.6%UMS Holdings Ltd UMSH SP ADD 1.00 1.15 309.0 10.6 9.7 19.6% 2.09 20.0% 6.0%Valuetronics Holdings Ltd VALUE SP ADD 0.79 0.89 238.9 11.0 9.7 13.5% 1.85 17.6% 4.5%Venture Corporation VMS SP HOLD 11.89 12.01 2,426.0 15.9 14.3 13.2% 1.63 10.3% 4.2%Weighted average 13.3 11.8 15.2% 1.57 11.9% 4.5%
Technology│Singapore│Tech Manufacturing Services│July 4, 2017
2
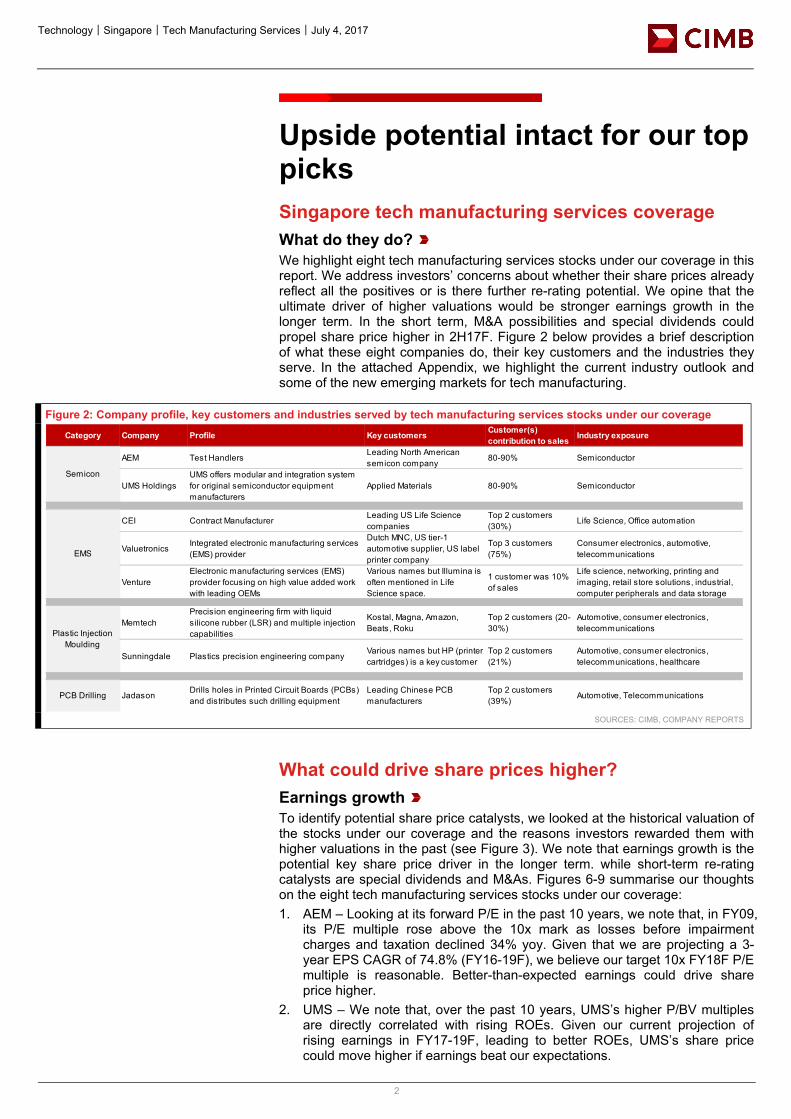
Upside potential intact for our top picks Singapore tech manufacturing services coverage What do they do? We highlight eight tech manufacturing services stocks under our coverage in this report. We address investors’ concerns about whether their share prices already reflect all the positives or is there further re-rating potential. We opine that the ultimate driver of higher valuations would be stronger earnings growth in the longer term. In the short term, M&A possibilities and special dividends could propel share price higher in 2H17F. Figure 2 below provides a brief description of what these eight companies do, their key customers and the industries they serve. In the attached Appendix, we highlight the current industry outlook and some of the new emerging markets for tech manufacturing.
Figure 2: Company profile, key customers and industries served by tech manufacturing services stocks under our coverage
SOURCES: CIMB, COMPANY REPORTS
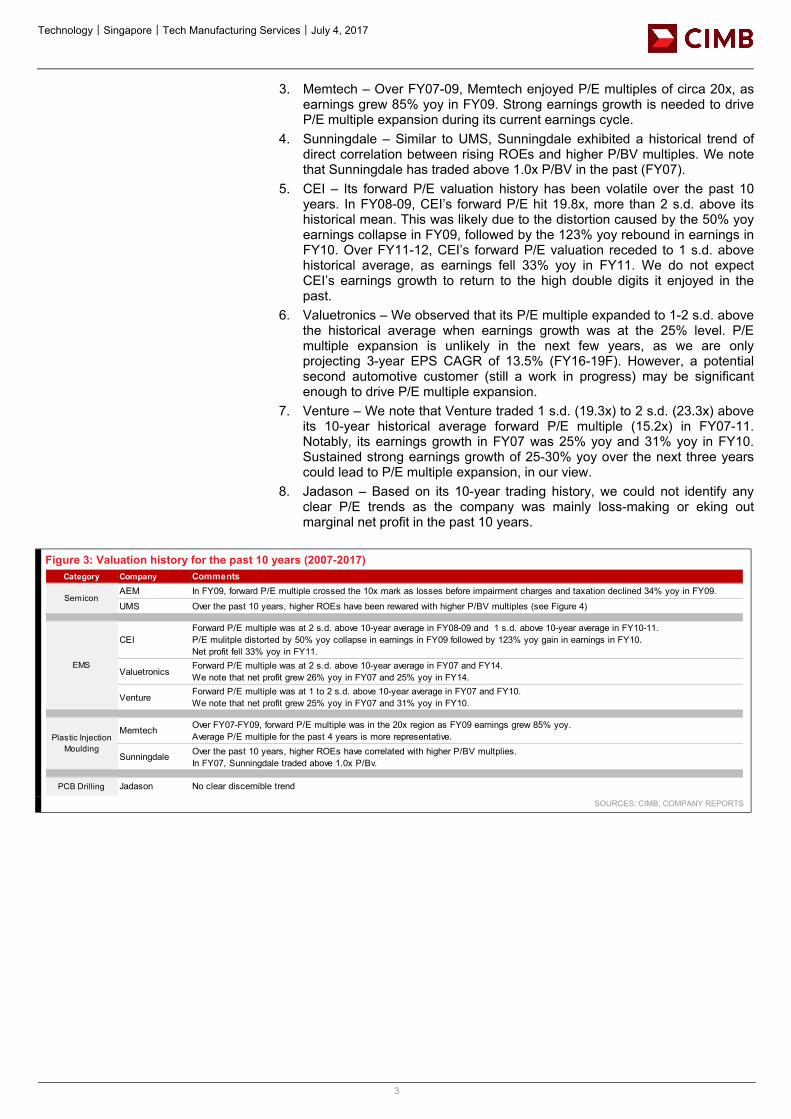
What could drive share prices higher? Earnings growth To identify potential share price catalysts, we looked at the historical valuation of the stocks under our coverage and the reasons investors rewarded them with higher valuations in the past (see Figure 3). We note that earnings growth is the potential key share price driver in the longer term. while short-term re-rating catalysts are special dividends and M&As. Figures 6-9 summarise our thoughts on the eight tech manufacturing services stocks under our coverage: 1. AEM – Looking at its forward P/E in the past 10 years, we note that, in FY09,
its P/E multiple rose above the 10x mark as losses before impairment charges and taxation declined 34% yoy. Given that we are projecting a 3-year EPS CAGR of 74.8% (FY16-19F), we believe our target 10x FY18F P/E multiple is reasonable. Better-than-expected earnings could drive share price higher.
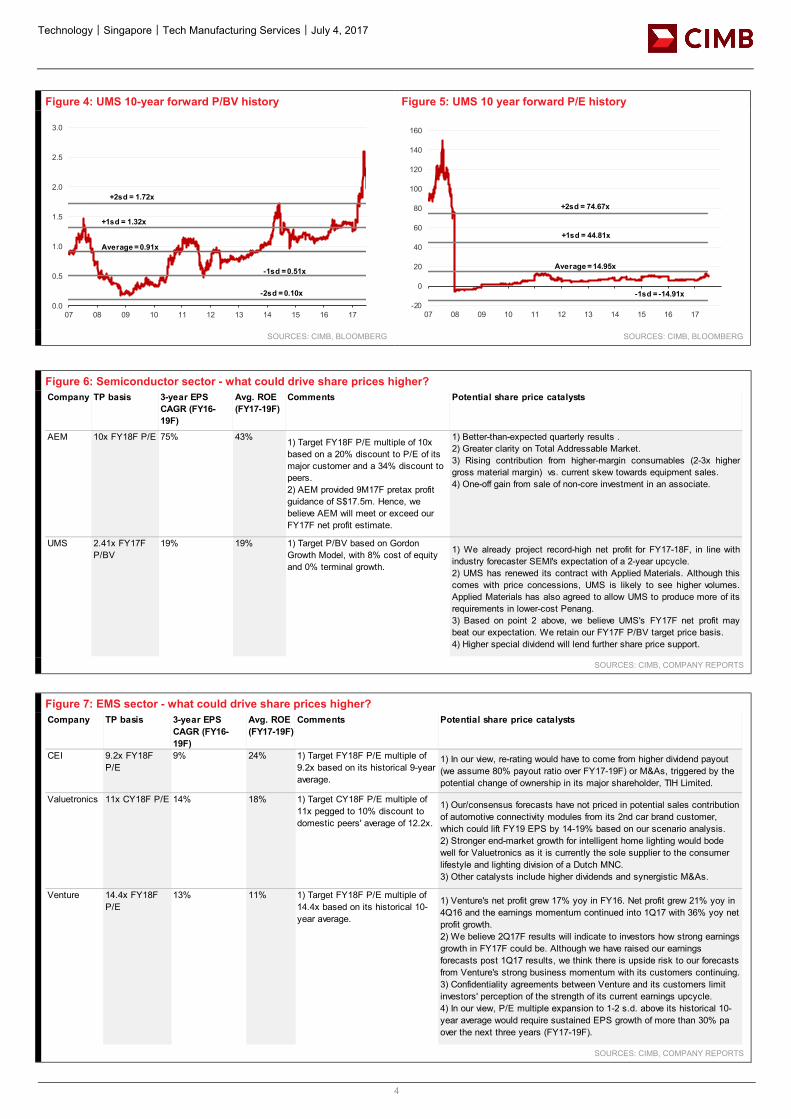
2. UMS – We note that, over the past 10 years, UMS’s higher P/BV multiples are directly correlated with rising ROEs. Given our current projection of rising earnings in FY17-19F, leading to better ROEs, UMS’s share price could move higher if earnings beat our expectations.
Category Company Profile Key customers Customer(s) contribution to sales Industry exposure
AEM Test HandlersLeading North American semicon company
80-90% Semiconductor
UMS HoldingsUMS offers modular and integration system for original semiconductor equipment manufacturers
Applied Materials 80-90% Semiconductor
CEI Contract ManufacturerLeading US Life Science companies
Top 2 customers (30%)
Life Science, Office automation
ValuetronicsIntegrated electronic manufacturing services (EMS) provider
Dutch MNC, US tier-1 automotive supplier, US label printer company
Top 3 customers (75%)
Consumer electronics, automotive, telecommunications
VentureElectronic manufacturing services (EMS) provider focusing on high value added work with leading OEMs
Various names but Illumina is often mentioned in Life Science space.
1 customer was 10% of sales
Life science, networking, printing and imaging, retail store solutions, industrial, computer peripherals and data storage
MemtechPrecision engineering firm with liquid silicone rubber (LSR) and multiple injection capabilities
Kostal, Magna, Amazon, Beats, Roku
Top 2 customers (20-30%)
Automotive, consumer electronics, telecommunications
Sunningdale Plastics precision engineering companyVarious names but HP (printer cartridges) is a key customer
Top 2 customers (21%)
Automotive, consumer electronics, telecommunications, healthcare
PCB Drilling Jadason Drills holes in Printed Circuit Boards (PCBs) and distributes such drilling equipment
Leading Chinese PCB manufacturers
Top 2 customers (39%)
Automotive, Telecommunications
Semicon
EMS
Plastic Injection Moulding
Technology│Singapore│Tech Manufacturing Services│July 4, 2017
3
3. Memtech – Over FY07-09, Memtech enjoyed P/E multiples of circa 20x, as earnings grew 85% yoy in FY09. Strong earnings growth is needed to drive P/E multiple expansion during its current earnings cycle.
4. Sunningdale – Similar to UMS, Sunningdale exhibited a historical trend of direct correlation between rising ROEs and higher P/BV multiples. We note that Sunningdale has traded above 1.0x P/BV in the past (FY07).
5. CEI – Its forward P/E valuation history has been volatile over the past 10 years. In FY08-09, CEI’s forward P/E hit 19.8x, more than 2 s.d. above its historical mean. This was likely due to the distortion caused by the 50% yoy earnings collapse in FY09, followed by the 123% yoy rebound in earnings in FY10. Over FY11-12, CEI’s forward P/E valuation receded to 1 s.d. above historical average, as earnings fell 33% yoy in FY11. We do not expect CEI’s earnings growth to return to the high double digits it enjoyed in the past.
6. Valuetronics – We observed that its P/E multiple expanded to 1-2 s.d. above the historical average when earnings growth was at the 25% level. P/E multiple expansion is unlikely in the next few years, as we are only projecting 3-year EPS CAGR of 13.5% (FY16-19F). However, a potential second automotive customer (still a work in progress) may be significant enough to drive P/E multiple expansion.
7. Venture – We note that Venture traded 1 s.d. (19.3x) to 2 s.d. (23.3x) above its 10-year historical average forward P/E multiple (15.2x) in FY07-11. Notably, its earnings growth in FY07 was 25% yoy and 31% yoy in FY10. Sustained strong earnings growth of 25-30% yoy over the next three years could lead to P/E multiple expansion, in our view.
8. Jadason – Based on its 10-year trading history, we could not identify any clear P/E trends as the company was mainly loss-making or eking out marginal net profit in the past 10 years.
Figure 3: Valuation history for the past 10 years (2007-2017)
SOURCES: CIMB, COMPANY REPORTS
Category Company CommentsAEM In FY09, forward P/E multiple crossed the 10x mark as losses before impairment charges and taxation declined 34% yoy in FY09.
UMS Over the past 10 years, higher ROEs have been rewared with higher P/BV multiples (see Figure 4)
CEIForward P/E multiple was at 2 s.d. above 10-year average in FY08-09 and 1 s.d. above 10-year average in FY10-11.P/E mulitple distorted by 50% yoy collapse in earnings in FY09 followed by 123% yoy gain in earnings in FY10.Net profit fell 33% yoy in FY11.
ValuetronicsForward P/E multiple was at 2 s.d. above 10-year average in FY07 and FY14. We note that net profit grew 26% yoy in FY07 and 25% yoy in FY14.
VentureForward P/E multiple was at 1 to 2 s.d. above 10-year average in FY07 and FY10.We note that net profit grew 25% yoy in FY07 and 31% yoy in FY10.
Memtech Over FY07-FY09, forward P/E multiple was in the 20x region as FY09 earnings grew 85% yoy. Average P/E multiple for the past 4 years is more representative.
Sunningdale Over the past 10 years, higher ROEs have correlated with higher P/BV multplies. In FY07, Sunningdale traded above 1.0x P/Bv.
PCB Drilling Jadason No clear discernible trend
Semicon
Plastic Injection Moulding
EMS
Technology│Singapore│Tech Manufacturing Services│July 4, 2017
4
Figure 4: UMS 10-year forward P/BV history Figure 5: UMS 10 year forward P/E history
SOURCES: CIMB, BLOOMBERG SOURCES: CIMB, BLOOMBERG
Figure 6: Semiconductor sector - what could drive share prices higher?
SOURCES: CIMB, COMPANY REPORTS
Figure 7: EMS sector - what could drive share prices higher?
SOURCES: CIMB, COMPANY REPORTS
0.0
0.5
1.0
1.5
2.0
2.5
3.0
07 08 09 10 11 12 13 14 15 16 17
Average = 0.91x
+1sd = 1.32x
-1sd = 0.51x
+2sd = 1.72x
-2sd = 0.10x
-20
0
20
40
60
80
100
120
140
160
07 08 09 10 11 12 13 14 15 16 17
Average = 14.95x
+1sd = 44.81x
-1sd = -14.91x
+2sd = 74.67x
Company TP basis 3-year EPS CAGR (FY16-19F)
Avg. ROE (FY17-19F)
Comments Potential share price catalysts
AEM 10x FY18F P/E 75% 43% 1) Target FY18F P/E multiple of 10x based on a 20% discount to P/E of its major customer and a 34% discount to peers.2) AEM provided 9M17F pretax profit guidance of S$17.5m. Hence, we believe AEM will meet or exceed our FY17F net profit estimate.
1) Better-than-expected quarterly results .2) Greater clarity on Total Addressable Market.3) Rising contribution from higher-margin consumables (2-3x highergross material margin) vs. current skew towards equipment sales.4) One-off gain from sale of non-core investment in an associate.
UMS 2.41x FY17F P/BV
19% 19% 1) Target P/BV based on Gordon Growth Model, with 8% cost of equity and 0% terminal growth.
1) We already project record-high net profit for FY17-18F, in line withindustry forecaster SEMI's expectation of a 2-year upcycle.2) UMS has renewed its contract with Applied Materials. Although thiscomes with price concessions, UMS is likely to see higher volumes.Applied Materials has also agreed to allow UMS to produce more of itsrequirements in lower-cost Penang.3) Based on point 2 above, we believe UMS's FY17F net profit maybeat our expectation. We retain our FY17F P/BV target price basis.4) Higher special dividend will lend further share price support.
Company TP basis 3-year EPS CAGR (FY16-19F)
Avg. ROE (FY17-19F)
Comments Potential share price catalysts
CEI 9.2x FY18F P/E
9% 24% 1) Target FY18F P/E multiple of 9.2x based on its historical 9-year average.
1) In our view, re-rating would have to come from higher dividend payout (we assume 80% payout ratio over FY17-19F) or M&As, triggered by the potential change of ownership in its major shareholder, TIH Limited.
Valuetronics 11x CY18F P/E 14% 18% 1) Target CY18F P/E multiple of 11x pegged to 10% discount to domestic peers' average of 12.2x.
1) Our/consensus forecasts have not priced in potential sales contribution of automotive connectivity modules from its 2nd car brand customer, which could lift FY19 EPS by 14-19% based on our scenario analysis.2) Stronger end-market growth for intelligent home lighting would bode well for Valuetronics as it is currently the sole supplier to the consumer lifestyle and lighting division of a Dutch MNC. 3) Other catalysts include higher dividends and synergistic M&As.
Venture 14.4x FY18F P/E
13% 11% 1) Target FY18F P/E multiple of 14.4x based on its historical 10-year average.
1) Venture's net profit grew 17% yoy in FY16. Net profit grew 21% yoy in 4Q16 and the earnings momentum continued into 1Q17 with 36% yoy net profit growth.2) We believe 2Q17F results will indicate to investors how strong earnings growth in FY17F could be. Although we have raised our earnings forecasts post 1Q17 results, we think there is upside risk to our forecasts from Venture's strong business momentum with its customers continuing.3) Confidentiality agreements between Venture and its customers limit investors' perception of the strength of its current earnings upcycle.4) In our view, P/E multiple expansion to 1-2 s.d. above its historical 10-year average would require sustained EPS growth of more than 30% pa over the next three years (FY17-19F).
Technology│Singapore│Tech Manufacturing Services│July 4, 2017
5
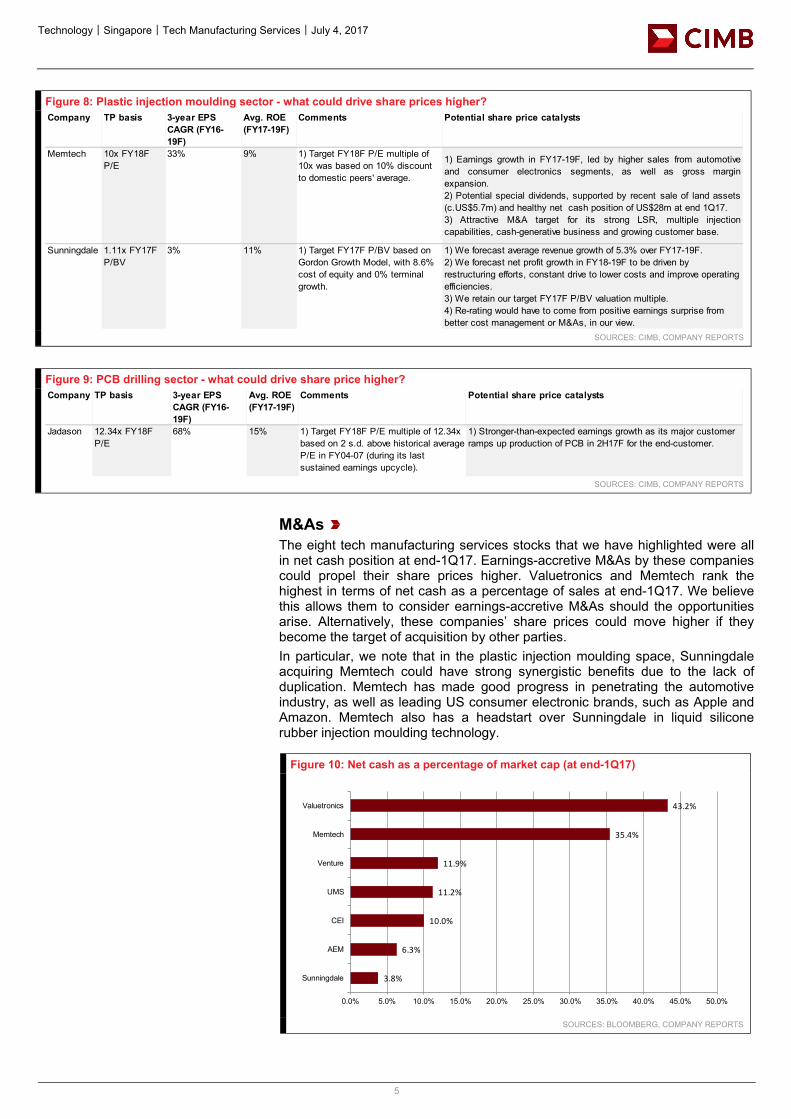
Figure 8: Plastic injection moulding sector - what could drive share prices higher?
SOURCES: CIMB, COMPANY REPORTS
Figure 9: PCB drilling sector - what could drive share price higher?
SOURCES: CIMB, COMPANY REPORTS
M&As The eight tech manufacturing services stocks that we have highlighted were all in net cash position at end-1Q17. Earnings-accretive M&As by these companies could propel their share prices higher. Valuetronics and Memtech rank the highest in terms of net cash as a percentage of sales at end-1Q17. We believe this allows them to consider earnings-accretive M&As should the opportunities arise. Alternatively, these companies’ share prices could move higher if they become the target of acquisition by other parties. In particular, we note that in the plastic injection moulding space, Sunningdale acquiring Memtech could have strong synergistic benefits due to the lack of duplication. Memtech has made good progress in penetrating the automotive industry, as well as leading US consumer electronic brands, such as Apple and Amazon. Memtech also has a headstart over Sunningdale in liquid silicone rubber injection moulding technology.
Figure 10: Net cash as a percentage of market cap (at end-1Q17)
SOURCES: BLOOMBERG, COMPANY REPORTS
Company TP basis 3-year EPS CAGR (FY16-19F)
Avg. ROE (FY17-19F)
Comments Potential share price catalysts
Memtech 10x FY18F P/E
33% 9% 1) Target FY18F P/E multiple of 10x was based on 10% discount to domestic peers' average.
1) Earnings growth in FY17-19F, led by higher sales from automotiveand consumer electronics segments, as well as gross marginexpansion.2) Potential special dividends, supported by recent sale of land assets(c.US$5.7m) and healthy net cash position of US$28m at end 1Q17. 3) Attractive M&A target for its strong LSR, multiple injectioncapabilities, cash-generative business and growing customer base.
Sunningdale 1.11x FY17F P/BV
3% 11% 1) Target FY17F P/BV based on Gordon Growth Model, with 8.6% cost of equity and 0% terminal growth.
1) We forecast average revenue growth of 5.3% over FY17-19F.2) We forecast net profit growth in FY18-19F to be driven by restructuring efforts, constant drive to lower costs and improve operating efficiencies.3) We retain our target FY17F P/BV valuation multiple.4) Re-rating would have to come from positive earnings surprise from better cost management or M&As, in our view.
Company TP basis 3-year EPS CAGR (FY16-19F)
Avg. ROE (FY17-19F)
Comments Potential share price catalysts
Jadason 12.34x FY18F P/E
68% 15% 1) Target FY18F P/E multiple of 12.34x based on 2 s.d. above historical average P/E in FY04-07 (during its last sustained earnings upcycle).
1) Stronger-than-expected earnings growth as its major customer ramps up production of PCB in 2H17F for the end-customer.
3.8%
6.3%
10.0%
11.2%
11.9%
35.4%
43.2%
0.0% 5.0% 10.0% 15.0% 20.0% 25.0% 30.0% 35.0% 40.0% 45.0% 50.0%
Sunningdale
AEM
CEI
UMS
Venture
Memtech
Valuetronics
Technology│Singapore│Tech Manufacturing Services│July 4, 2017
6
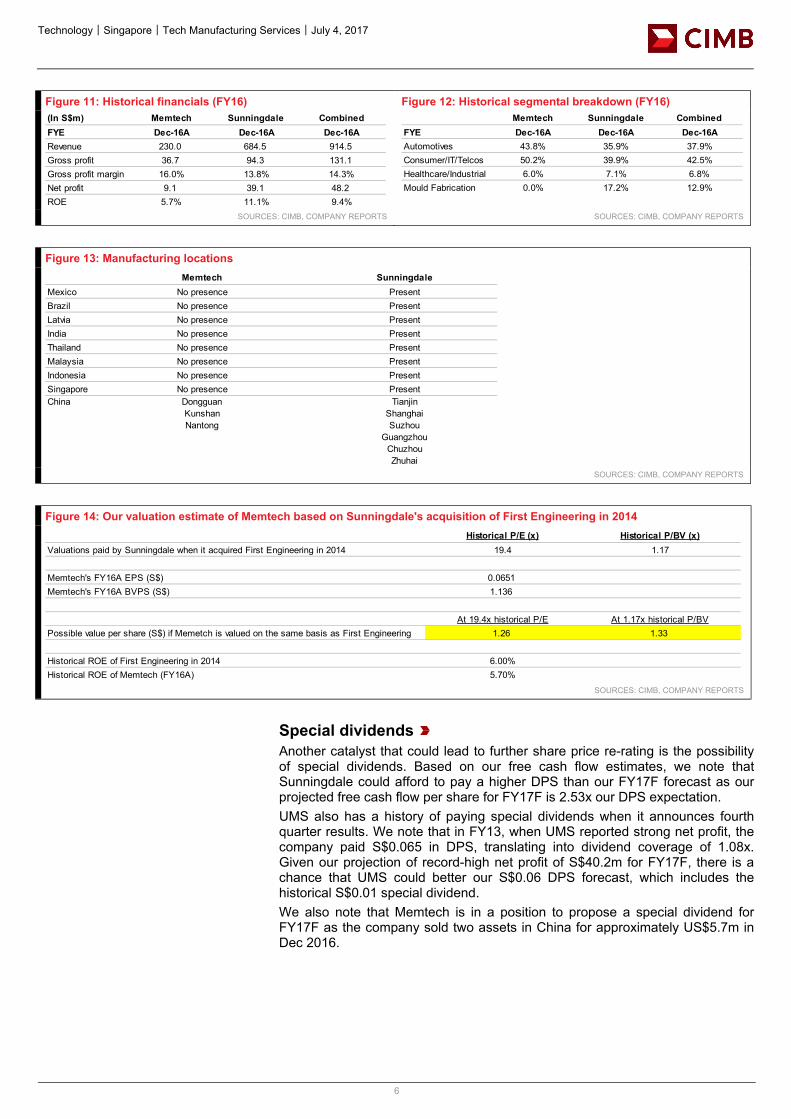
Figure 11: Historical financials (FY16) Figure 12: Historical segmental breakdown (FY16)
SOURCES: CIMB, COMPANY REPORTS SOURCES: CIMB, COMPANY REPORTS
Figure 13: Manufacturing locations
SOURCES: CIMB, COMPANY REPORTS
Figure 14: Our valuation estimate of Memtech based on Sunningdale's acquisition of First Engineering in 2014
SOURCES: CIMB, COMPANY REPORTS
Special dividends Another catalyst that could lead to further share price re-rating is the possibility of special dividends. Based on our free cash flow estimates, we note that Sunningdale could afford to pay a higher DPS than our FY17F forecast as our projected free cash flow per share for FY17F is 2.53x our DPS expectation. UMS also has a history of paying special dividends when it announces fourth quarter results. We note that in FY13, when UMS reported strong net profit, the company paid S$0.065 in DPS, translating into dividend coverage of 1.08x. Given our projection of record-high net profit of S$40.2m for FY17F, there is a chance that UMS could better our S$0.06 DPS forecast, which includes the historical S$0.01 special dividend. We also note that Memtech is in a position to propose a special dividend for FY17F as the company sold two assets in China for approximately US$5.7m in Dec 2016.
(In S$m) Memtech Sunningdale CombinedFYE Dec-16A Dec-16A Dec-16ARevenue 230.0 684.5 914.5Gross profit 36.7 94.3 131.1Gross profit margin 16.0% 13.8% 14.3%Net profit 9.1 39.1 48.2ROE 5.7% 11.1% 9.4%
Memtech Sunningdale CombinedFYE Dec-16A Dec-16A Dec-16AAutomotives 43.8% 35.9% 37.9%Consumer/IT/Telcos 50.2% 39.9% 42.5%Healthcare/Industrial 6.0% 7.1% 6.8%Mould Fabrication 0.0% 17.2% 12.9%
Memtech SunningdaleMexico No presence PresentBrazil No presence PresentLatvia No presence PresentIndia No presence PresentThailand No presence PresentMalaysia No presence PresentIndonesia No presence PresentSingapore No presence PresentChina Dongguan
KunshanNantong
TianjinShanghaiSuzhou
GuangzhouChuzhouZhuhai
Historical P/E (x) Historical P/BV (x)Valuations paid by Sunningdale when it acquired First Engineering in 2014 19.4 1.17
Memtech's FY16A EPS (S$) 0.0651Memtech's FY16A BVPS (S$) 1.136
At 19.4x historical P/E At 1.17x historical P/BVPossible value per share (S$) if Memetch is valued on the same basis as First Engineering 1.26 1.33
Historical ROE of First Engineering in 2014 6.00%Historical ROE of Memtech (FY16A) 5.70%
Technology│Singapore│Tech Manufacturing Services│July 4, 2017
7
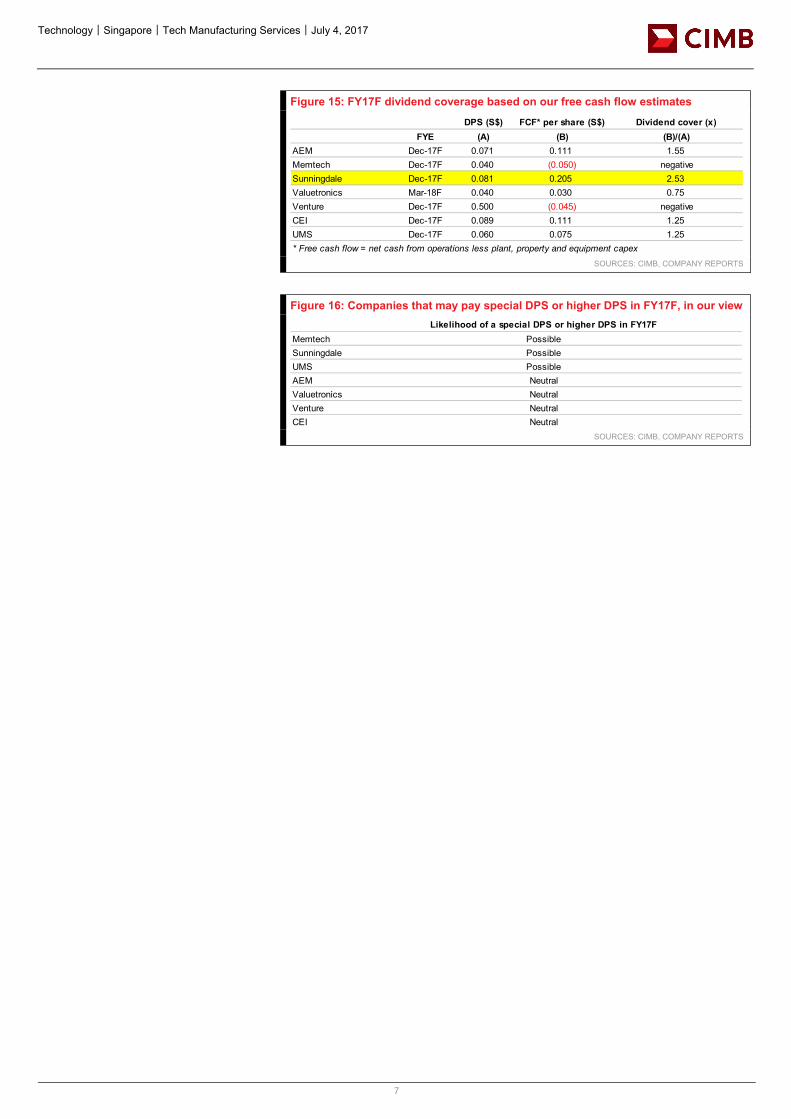
Figure 15: FY17F dividend coverage based on our free cash flow estimates
SOURCES: CIMB, COMPANY REPORTS
Figure 16: Companies that may pay special DPS or higher DPS in FY17F, in our view
SOURCES: CIMB, COMPANY REPORTS
DPS (S$) FCF* per share (S$) Dividend cover (x)FYE (A) (B) (B)/(A)
AEM Dec-17F 0.071 0.111 1.55Memtech Dec-17F 0.040 (0.050) negativeSunningdale Dec-17F 0.081 0.205 2.53Valuetronics Mar-18F 0.040 0.030 0.75Venture Dec-17F 0.500 (0.045) negativeCEI Dec-17F 0.089 0.111 1.25UMS Dec-17F 0.060 0.075 1.25* Free cash flow = net cash from operations less plant, property and equipment capex
Likelihood of a special DPS or higher DPS in FY17FMemtech PossibleSunningdale PossibleUMS PossibleAEM NeutralValuetronics NeutralVenture NeutralCEI Neutral
Technology│Singapore│Tech Manufacturing Services│July 4, 2017
8
Risks The key risks for the tech manufacturing services stocks under our coverage are pullbacks or delays in customers’ orders due to changes in global economic conditions. The US$ weakening against other currencies is also a risk to the earnings of these companies.
Technology│Singapore│Tech Manufacturing Services│July 4, 2017
9
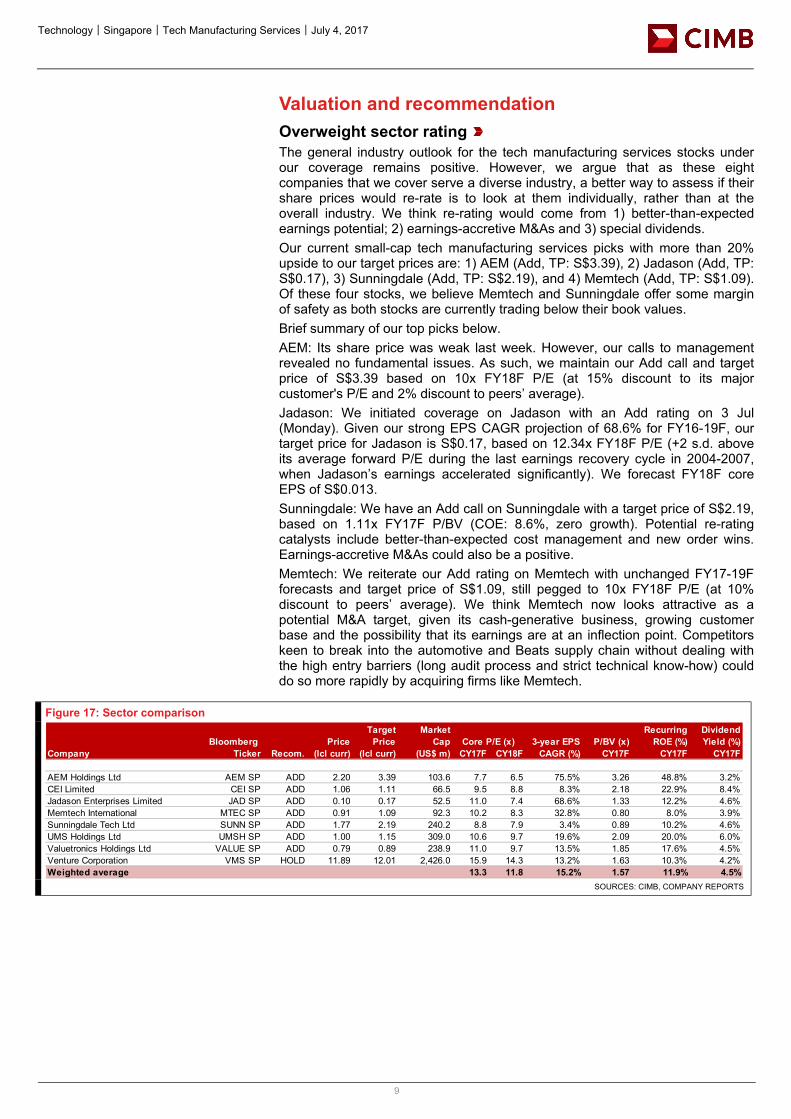
Valuation and recommendation Overweight sector rating The general industry outlook for the tech manufacturing services stocks under our coverage remains positive. However, we argue that as these eight companies that we cover serve a diverse industry, a better way to assess if their share prices would re-rate is to look at them individually, rather than at the overall industry. We think re-rating would come from 1) better-than-expected earnings potential; 2) earnings-accretive M&As and 3) special dividends. Our current small-cap tech manufacturing services picks with more than 20% upside to our target prices are: 1) AEM (Add, TP: S$3.39), 2) Jadason (Add, TP: S$0.17), 3) Sunningdale (Add, TP: S$2.19), and 4) Memtech (Add, TP: S$1.09). Of these four stocks, we believe Memtech and Sunningdale offer some margin of safety as both stocks are currently trading below their book values. Brief summary of our top picks below. AEM: Its share price was weak last week. However, our calls to management revealed no fundamental issues. As such, we maintain our Add call and target price of S$3.39 based on 10x FY18F P/E (at 15% discount to its major customer's P/E and 2% discount to peers’ average). Jadason: We initiated coverage on Jadason with an Add rating on 3 Jul (Monday). Given our strong EPS CAGR projection of 68.6% for FY16-19F, our target price for Jadason is S$0.17, based on 12.34x FY18F P/E (+2 s.d. above its average forward P/E during the last earnings recovery cycle in 2004-2007, when Jadason’s earnings accelerated significantly). We forecast FY18F core EPS of S$0.013. Sunningdale: We have an Add call on Sunningdale with a target price of S$2.19, based on 1.11x FY17F P/BV (COE: 8.6%, zero growth). Potential re-rating catalysts include better-than-expected cost management and new order wins. Earnings-accretive M&As could also be a positive. Memtech: We reiterate our Add rating on Memtech with unchanged FY17-19F forecasts and target price of S$1.09, still pegged to 10x FY18F P/E (at 10% discount to peers’ average). We think Memtech now looks attractive as a potential M&A target, given its cash-generative business, growing customer base and the possibility that its earnings are at an inflection point. Competitors keen to break into the automotive and Beats supply chain without dealing with the high entry barriers (long audit process and strict technical know-how) could do so more rapidly by acquiring firms like Memtech.
Figure 17: Sector comparison
SOURCES: CIMB, COMPANY REPORTS
Bloomberg PriceTarget
PriceMarket
Cap Core P/E (x) 3-year EPS P/BV (x)Recurring
ROE (%)Dividend Yield (%)
Company Ticker Recom. (lcl curr) (lcl curr) (US$ m) CY17F CY18F CAGR (%) CY17F CY17F CY17F
AEM Holdings Ltd AEM SP ADD 2.20 3.39 103.6 7.7 6.5 75.5% 3.26 48.8% 3.2%CEI Limited CEI SP ADD 1.06 1.11 66.5 9.5 8.8 8.3% 2.18 22.9% 8.4%Jadason Enterprises Limited JAD SP ADD 0.10 0.17 52.5 11.0 7.4 68.6% 1.33 12.2% 4.6%Memtech International MTEC SP ADD 0.91 1.09 92.3 10.2 8.3 32.8% 0.80 8.0% 3.9%Sunningdale Tech Ltd SUNN SP ADD 1.77 2.19 240.2 8.8 7.9 3.4% 0.89 10.2% 4.6%UMS Holdings Ltd UMSH SP ADD 1.00 1.15 309.0 10.6 9.7 19.6% 2.09 20.0% 6.0%Valuetronics Holdings Ltd VALUE SP ADD 0.79 0.89 238.9 11.0 9.7 13.5% 1.85 17.6% 4.5%Venture Corporation VMS SP HOLD 11.89 12.01 2,426.0 15.9 14.3 13.2% 1.63 10.3% 4.2%Weighted average 13.3 11.8 15.2% 1.57 11.9% 4.5%
Technology│Singapore│Tech Manufacturing Services│July 4, 2017
10
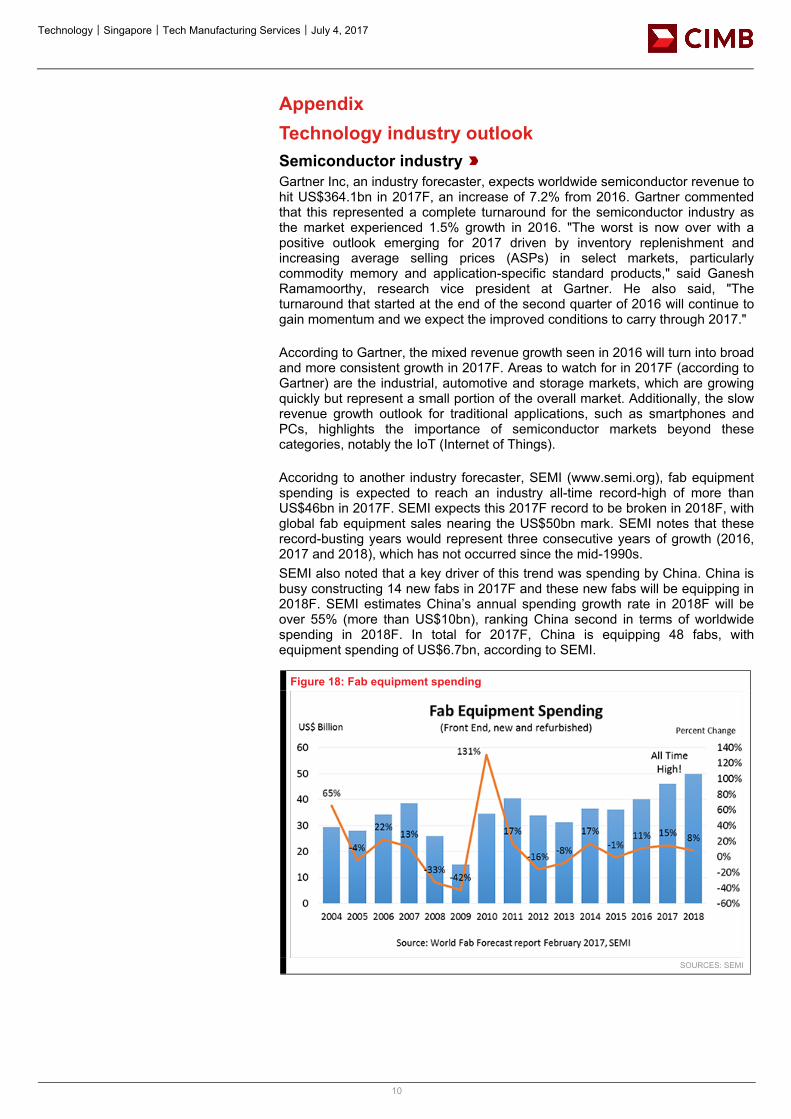
Appendix Technology industry outlook Semiconductor industry Gartner Inc, an industry forecaster, expects worldwide semiconductor revenue to hit US$364.1bn in 2017F, an increase of 7.2% from 2016. Gartner commented that this represented a complete turnaround for the semiconductor industry as the market experienced 1.5% growth in 2016. "The worst is now over with a positive outlook emerging for 2017 driven by inventory replenishment and increasing average selling prices (ASPs) in select markets, particularly commodity memory and application-specific standard products," said Ganesh Ramamoorthy, research vice president at Gartner. He also said, "The turnaround that started at the end of the second quarter of 2016 will continue to gain momentum and we expect the improved conditions to carry through 2017." According to Gartner, the mixed revenue growth seen in 2016 will turn into broad and more consistent growth in 2017F. Areas to watch for in 2017F (according to Gartner) are the industrial, automotive and storage markets, which are growing quickly but represent a small portion of the overall market. Additionally, the slow revenue growth outlook for traditional applications, such as smartphones and PCs, highlights the importance of semiconductor markets beyond these categories, notably the IoT (Internet of Things). Accoridng to another industry forecaster, SEMI (www.semi.org), fab equipment spending is expected to reach an industry all-time record-high of more than US$46bn in 2017F. SEMI expects this 2017F record to be broken in 2018F, with global fab equipment sales nearing the US$50bn mark. SEMI notes that these record-busting years would represent three consecutive years of growth (2016, 2017 and 2018), which has not occurred since the mid-1990s. SEMI also noted that a key driver of this trend was spending by China. China is busy constructing 14 new fabs in 2017F and these new fabs will be equipping in 2018F. SEMI estimates China’s annual spending growth rate in 2018F will be over 55% (more than US$10bn), ranking China second in terms of worldwide spending in 2018F. In total for 2017F, China is equipping 48 fabs, with equipment spending of US$6.7bn, according to SEMI.
Figure 18: Fab equipment spending
SOURCES: SEMI

Technology│Singapore│Tech Manufacturing Services│July 4, 2017
11
Mobile devices industry Gartner expects worldwide mobile device shipments, which includes PCs, tablets, ultramobile and mobile phones, to record flattish growth in 2017F, coming in at 2.3bn units, partly due to a longer replacement cycle and matured market situation. Gartner estimated that there were nearly 7bn phones, tablets and PCs in use globally at end-2016. However, it projects marginal growth in mobile phone volume shipments in the emerging Asia-Pacific market and for the PC volume shipments to fall to trough this year. In addition, Gartner attributed the likely flattish volume growth in 2017F to a saturated market and slower rate of product innovations as consumers seek newer applications in emerging categories, such as virtual reality and wearables. In spite of the marginal mobile device shipment growth forecast, independent market research provider GfK still projects that smartphone shipment volume will rise by about 5% in 2017F, slightly lower than the 6.6% in 2016. GfK highlighted that demand for smartphones remains stable despite the saturated market situation. It expects new innovations, such as artificial intelligence, smart home functionality, mobile payments and mobile health, to drive demand for smartphones in developed markets. Moreover, it sees pockets of growth opportunities in developing regions, such as the Middle East, Africa and emerging Asia, to drive demand growth in 2017F. Automotive industry We see automotive as the next sales growth driver in the semiconductor industry due to the rising adoption of electronics in vehicles for infotainment and safety features. For example, independent market research group IC Insights forecasts 4.9% sales CAGR in 2015-2020F for automotive electronics, with rising integrated circuit (IC) content in all new cars, from luxury to base models. This is ahead of IC Insights’s semiconductor industry sales growth forecast of 3-4% for 2017F. In addition, the world's leading automotive semiconductor player NXP Semiconductor expects global automotive semiconductor sales to deliver 5% CAGR over 2015-2020F, mainly due to increasing electronics content per vehicle.
Figure 19: Semiconductor sales 5-year CAGR, by sub-segment (2015-2020F)
SOURCES: CIMB, IC INSIGHTS
Meanwhile, independent market research group IHS projects the total market for power semiconductor discretes, power modules and power ICs for cars and light passenger vehicles to post stronger 2016-2022F CAGR of 7.5% from US$5.5bn in 2016 to US$8.5bn in 2020F. It attributes the robust growth in the automotive segment to three key drivers: 1) development of advanced driver assistance systems (ADAS) and self-driving to reduce the number of road accident fatalities, 2) clean and environmentally-friendly vehicles through higher efficiency of the internal combustion engine and electrification of the drivetrain in hybrid and electric vehicles, and 3) the connected car - integrating the connectivity function to allow the exchange of information between vehicles to avoid collision.
1.5%
2.5%
2.8%
3.9%
4.3%
4.9%
0.0% 1.0% 2.0% 3.0% 4.0% 5.0% 6.0%
PC
Military
Consumer
Communications
Industrial
Automotive
2015-2020F CAGR
Technology│Singapore│Tech Manufacturing Services│July 4, 2017
12
Another leading automotive semiconductor player, Infineon, expects the average semiconductor content in vehicles to increase from US$100 in 2016 to US$400 in 2025F due to rising demand for additional camera modules, radar modules, light detection and ranging (lidar) modules, sensors and actuators to accommodate the self-driving vehicles ecosystem.
Technology│Singapore│Tech Manufacturing Services│July 4, 2017
13
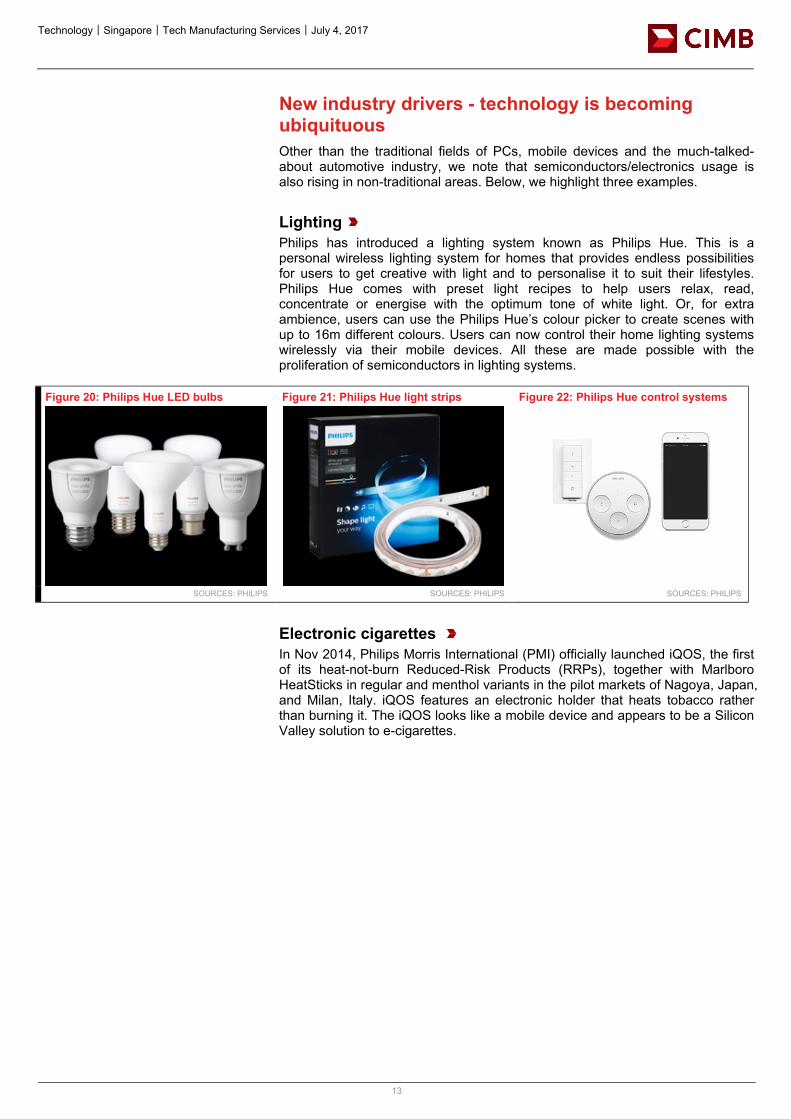
New industry drivers - technology is becoming ubiquituous Other than the traditional fields of PCs, mobile devices and the much-talked-about automotive industry, we note that semiconductors/electronics usage is also rising in non-traditional areas. Below, we highlight three examples. Lighting Philips has introduced a lighting system known as Philips Hue. This is a personal wireless lighting system for homes that provides endless possibilities for users to get creative with light and to personalise it to suit their lifestyles. Philips Hue comes with preset light recipes to help users relax, read, concentrate or energise with the optimum tone of white light. Or, for extra ambience, users can use the Philips Hue’s colour picker to create scenes with up to 16m different colours. Users can now control their home lighting systems wirelessly via their mobile devices. All these are made possible with the proliferation of semiconductors in lighting systems.
Figure 20: Philips Hue LED bulbs Figure 21: Philips Hue light strips Figure 22: Philips Hue control systems
SOURCES: PHILIPS SOURCES: PHILIPS SOURCES: PHILIPS
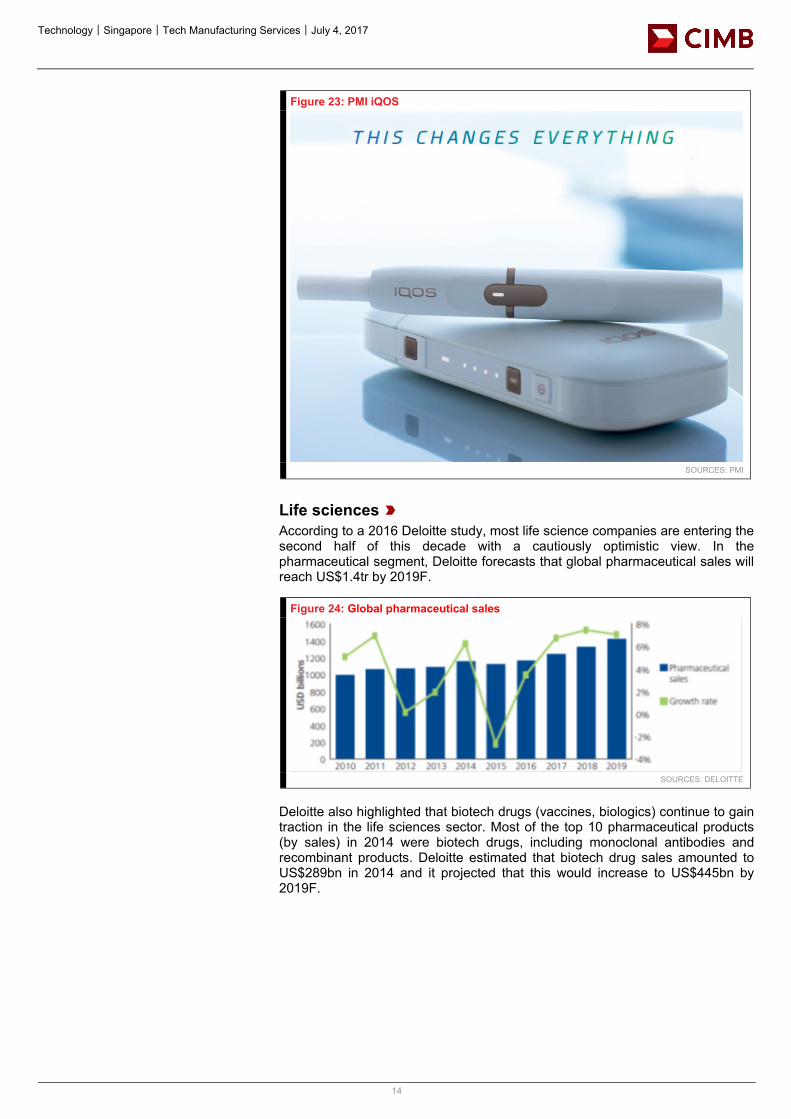
Electronic cigarettes In Nov 2014, Philips Morris International (PMI) officially launched iQOS, the first of its heat-not-burn Reduced-Risk Products (RRPs), together with Marlboro HeatSticks in regular and menthol variants in the pilot markets of Nagoya, Japan, and Milan, Italy. iQOS features an electronic holder that heats tobacco rather than burning it. The iQOS looks like a mobile device and appears to be a Silicon Valley solution to e-cigarettes.
Technology│Singapore│Tech Manufacturing Services│July 4, 2017
14
Figure 23: PMI iQOS
SOURCES: PMI
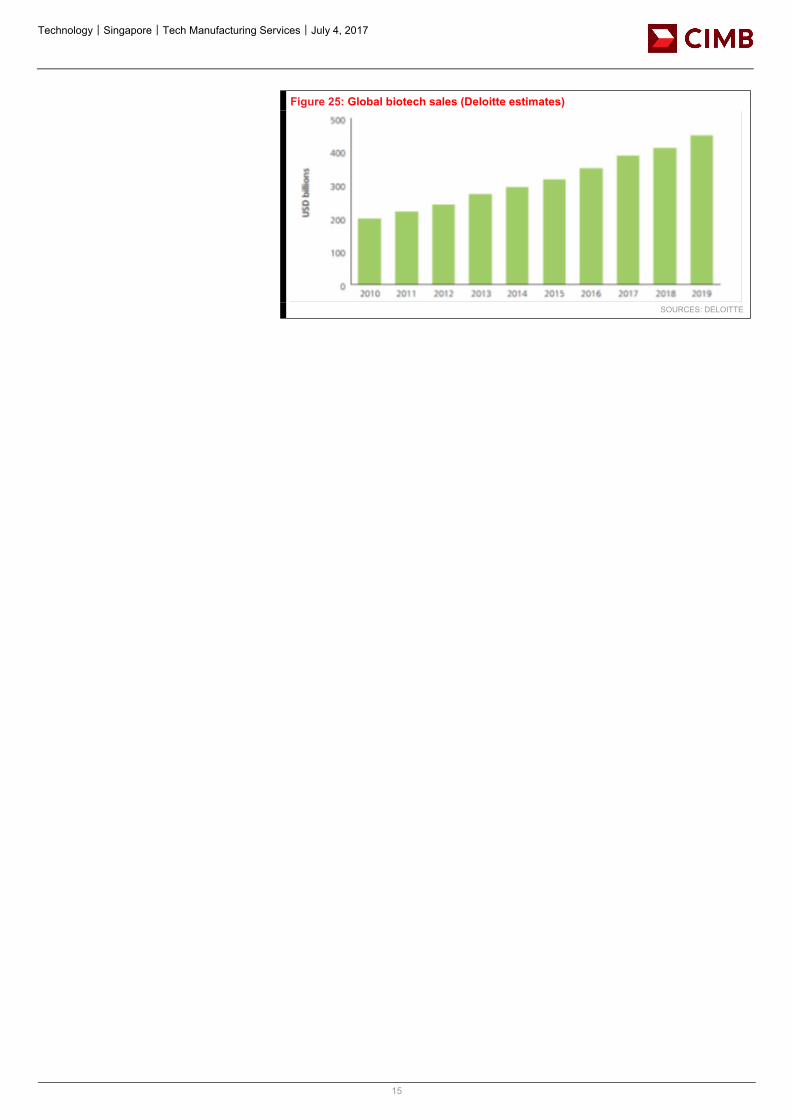
Life sciences According to a 2016 Deloitte study, most life science companies are entering the second half of this decade with a cautiously optimistic view. In the pharmaceutical segment, Deloitte forecasts that global pharmaceutical sales will reach US$1.4tr by 2019F.
Figure 24: Global pharmaceutical sales
SOURCES: DELOITTE
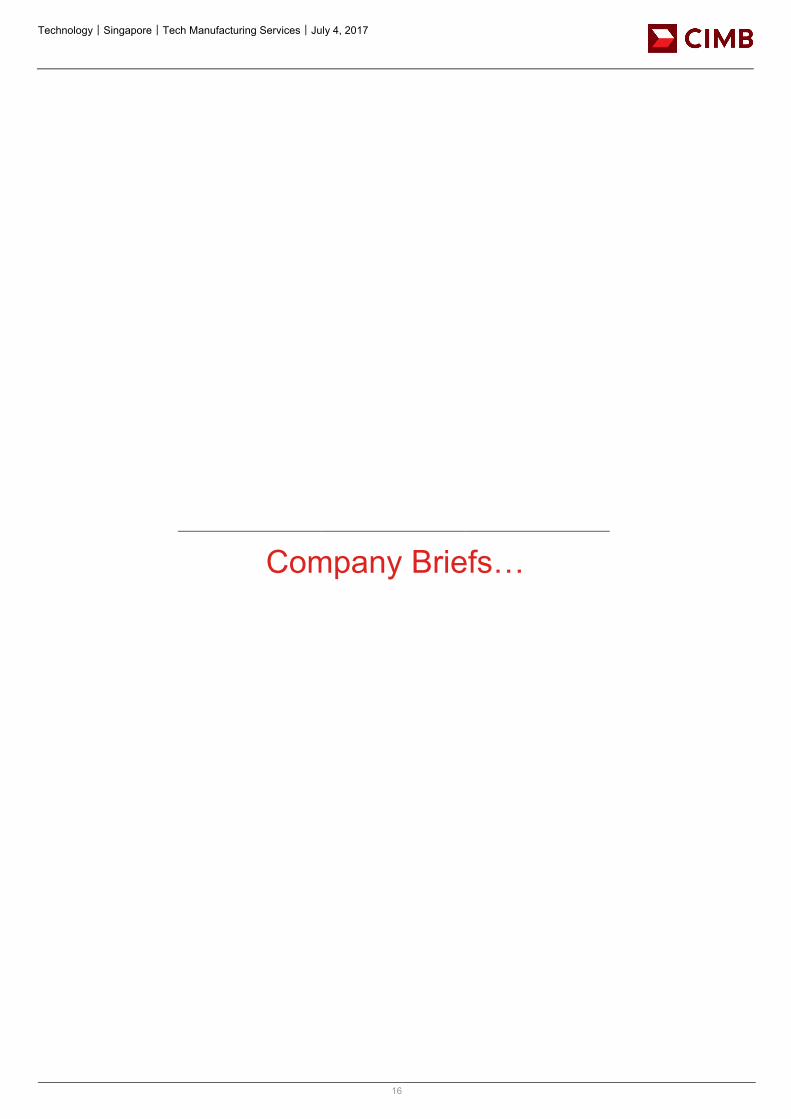
Deloitte also highlighted that biotech drugs (vaccines, biologics) continue to gain traction in the life sciences sector. Most of the top 10 pharmaceutical products (by sales) in 2014 were biotech drugs, including monoclonal antibodies and recombinant products. Deloitte estimated that biotech drug sales amounted to US$289bn in 2014 and it projected that this would increase to US$445bn by 2019F.
Technology│Singapore│Tech Manufacturing Services│July 4, 2017
15
Figure 25: Global biotech sales (Deloitte estimates)
SOURCES: DELOITTE
Technology│Singapore│Tech Manufacturing Services│July 4, 2017
16
Company Briefs…
Technology - Others│Singapore│July 4, 2017
Company Note
IMPORTANT DISCLOSURES, INCLUDING ANY REQUIRED RESEARCH CERTIFICATIONS, ARE PROVIDED AT THE END OF THIS REPORT. IF THIS REPORT IS DISTRIBUTED IN THE UNITED STATES IT IS DISTRIBUTED BY CIMB SECURITIES (USA), INC. AND IS CONSIDERED THIRD-PARTY AFFILIATED RESEARCH.
Powered by the EFA Platform
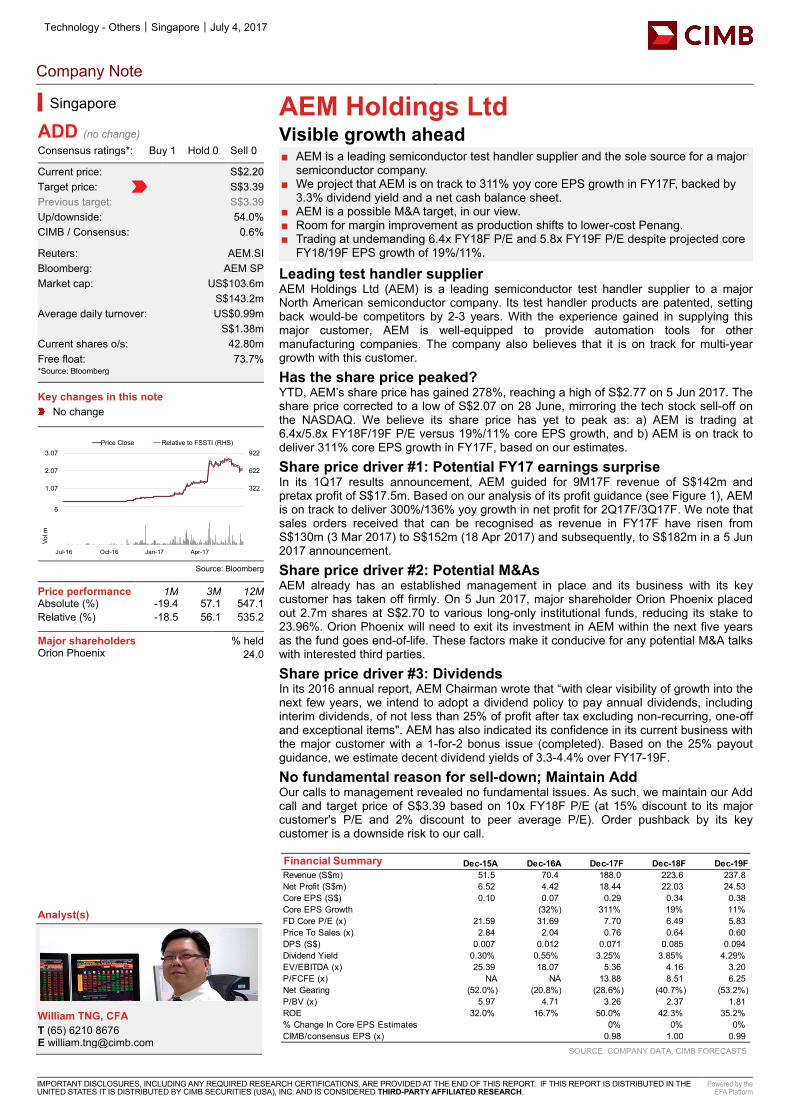
AEM Holdings Ltd Visible growth ahead ■ AEM is a leading semiconductor test handler supplier and the sole source for a major
semiconductor company. ■ We project that AEM is on track to 311% yoy core EPS growth in FY17F, backed by
3.3% dividend yield and a net cash balance sheet. ■ AEM is a possible M&A target, in our view. ■ Room for margin improvement as production shifts to lower-cost Penang. ■ Trading at undemanding 6.4x FY18F P/E and 5.8x FY19F P/E despite projected core
FY18/19F EPS growth of 19%/11%.
Leading test handler supplier AEM Holdings Ltd (AEM) is a leading semiconductor test handler supplier to a major North American semiconductor company. Its test handler products are patented, setting back would-be competitors by 2-3 years. With the experience gained in supplying this major customer, AEM is well-equipped to provide automation tools for other manufacturing companies. The company also believes that it is on track for multi-year growth with this customer.
Has the share price peaked? YTD, AEM’s share price has gained 278%, reaching a high of S$2.77 on 5 Jun 2017. The share price corrected to a low of S$2.07 on 28 June, mirroring the tech stock sell-off on the NASDAQ. We believe its share price has yet to peak as: a) AEM is trading at 6.4x/5.8x FY18F/19F P/E versus 19%/11% core EPS growth, and b) AEM is on track to deliver 311% core EPS growth in FY17F, based on our estimates.
Share price driver #1: Potential FY17 earnings surprise In its 1Q17 results announcement, AEM guided for 9M17F revenue of S$142m and pretax profit of S$17.5m. Based on our analysis of its profit guidance (see Figure 1), AEM is on track to deliver 300%/136% yoy growth in net profit for 2Q17F/3Q17F. We note that sales orders received that can be recognised as revenue in FY17F have risen from S$130m (3 Mar 2017) to S$152m (18 Apr 2017) and subsequently, to S$182m in a 5 Jun 2017 announcement.
Share price driver #2: Potential M&As AEM already has an established management in place and its business with its key customer has taken off firmly. On 5 Jun 2017, major shareholder Orion Phoenix placed out 2.7m shares at S$2.70 to various long-only institutional funds, reducing its stake to 23.96%. Orion Phoenix will need to exit its investment in AEM within the next five years as the fund goes end-of-life. These factors make it conducive for any potential M&A talks with interested third parties.
Share price driver #3: Dividends In its 2016 annual report, AEM Chairman wrote that “with clear visibility of growth into the next few years, we intend to adopt a dividend policy to pay annual dividends, including interim dividends, of not less than 25% of profit after tax excluding non-recurring, one-off and exceptional items". AEM has also indicated its confidence in its current business with the major customer with a 1-for-2 bonus issue (completed). Based on the 25% payout guidance, we estimate decent dividend yields of 3.3-4.4% over FY17-19F.
No fundamental reason for sell-down; Maintain Add Our calls to management revealed no fundamental issues. As such, we maintain our Add call and target price of S$3.39 based on 10x FY18F P/E (at 15% discount to its major customer's P/E and 2% discount to peer average P/E). Order pushback by its key customer is a downside risk to our call.
SOURCE: COMPANY DATA, CIMB FORECASTS
Singapore
ADD (no change) Consensus ratings*: Buy 1 Hold 0 Sell 0
Current price: S$2.20 Target price: S$3.39 Previous target: S$3.39 Up/downside: 54.0% CIMB / Consensus: 0.6%
Reuters: AEM.SI Bloomberg: AEM SP Market cap: US$103.6m S$143.2m Average daily turnover: US$0.99m S$1.38m Current shares o/s: 42.80m Free float: 73.7% *Source: Bloomberg Key changes in this note
No change
Source: Bloomberg
Price performance 1M 3M 12M Absolute (%) -19.4 57.1 547.1 Relative (%) -18.5 56.1 535.2
Major shareholders % held Orion Phoenix 24.0
Analyst(s)
William TNG, CFA T (65) 6210 8676 E [email protected]
Financial Summary Dec-15A Dec-16A Dec-17F Dec-18F Dec-19FRevenue (S$m) 51.5 70.4 188.0 223.6 237.8Net Profit (S$m) 6.52 4.42 18.44 22.03 24.53Core EPS (S$) 0.10 0.07 0.29 0.34 0.38Core EPS Growth (32%) 311% 19% 11%FD Core P/E (x) 21.59 31.69 7.70 6.49 5.83Price To Sales (x) 2.84 2.04 0.76 0.64 0.60DPS (S$) 0.007 0.012 0.071 0.085 0.094Dividend Yield 0.30% 0.55% 3.25% 3.85% 4.29%EV/EBITDA (x) 25.39 18.07 5.36 4.16 3.20P/FCFE (x) NA NA 13.88 8.51 6.25Net Gearing (52.0%) (20.8%) (28.6%) (40.7%) (53.2%)P/BV (x) 5.97 4.71 3.26 2.37 1.81ROE 32.0% 16.7% 50.0% 42.3% 35.2%% Change In Core EPS Estimates 0% 0% 0%CIMB/consensus EPS (x) 0.98 1.00 0.99
22
322
622
922
0.07
1.07
2.07
3.07Price Close Relative to FSSTI (RHS)
2
4
6
Jul-16 Oct-16 Jan-17 Apr-17
Vol m
Technology - Others│Singapore│AEM Holdings Ltd│July 4, 2017
18
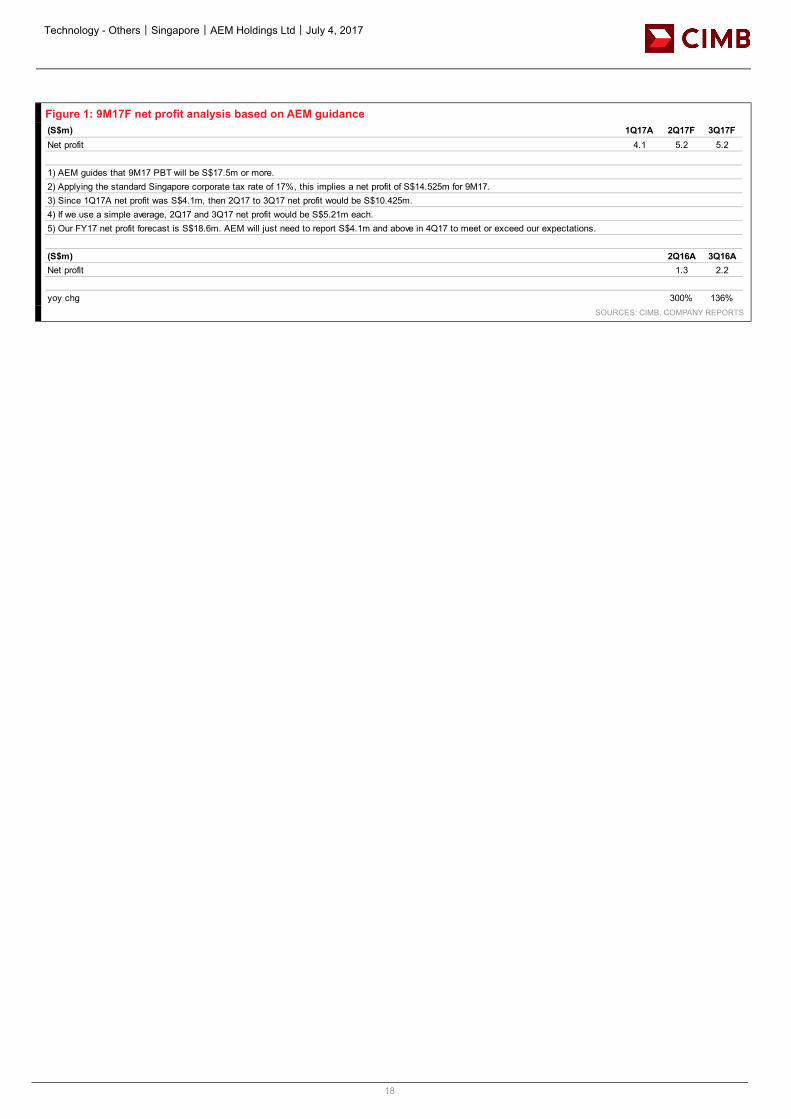
Figure 1: 9M17F net profit analysis based on AEM guidance
SOURCES: CIMB, COMPANY REPORTS
(S$m) 1Q17A 2Q17F 3Q17FNet profit 4.1 5.2 5.2
1) AEM guides that 9M17 PBT will be S$17.5m or more.2) Applying the standard Singapore corporate tax rate of 17%, this implies a net profit of S$14.525m for 9M17.3) Since 1Q17A net profit was S$4.1m, then 2Q17 to 3Q17 net profit would be S$10.425m. 4) If we use a simple average, 2Q17 and 3Q17 net profit would be S$5.21m each.5) Our FY17 net profit forecast is S$18.6m. AEM will just need to report S$4.1m and above in 4Q17 to meet or exceed our expectations.
(S$m) 2Q16A 3Q16ANet profit 1.3 2.2
yoy chg 300% 136%
Technology - Others│Singapore│AEM Holdings Ltd│July 4, 2017
19
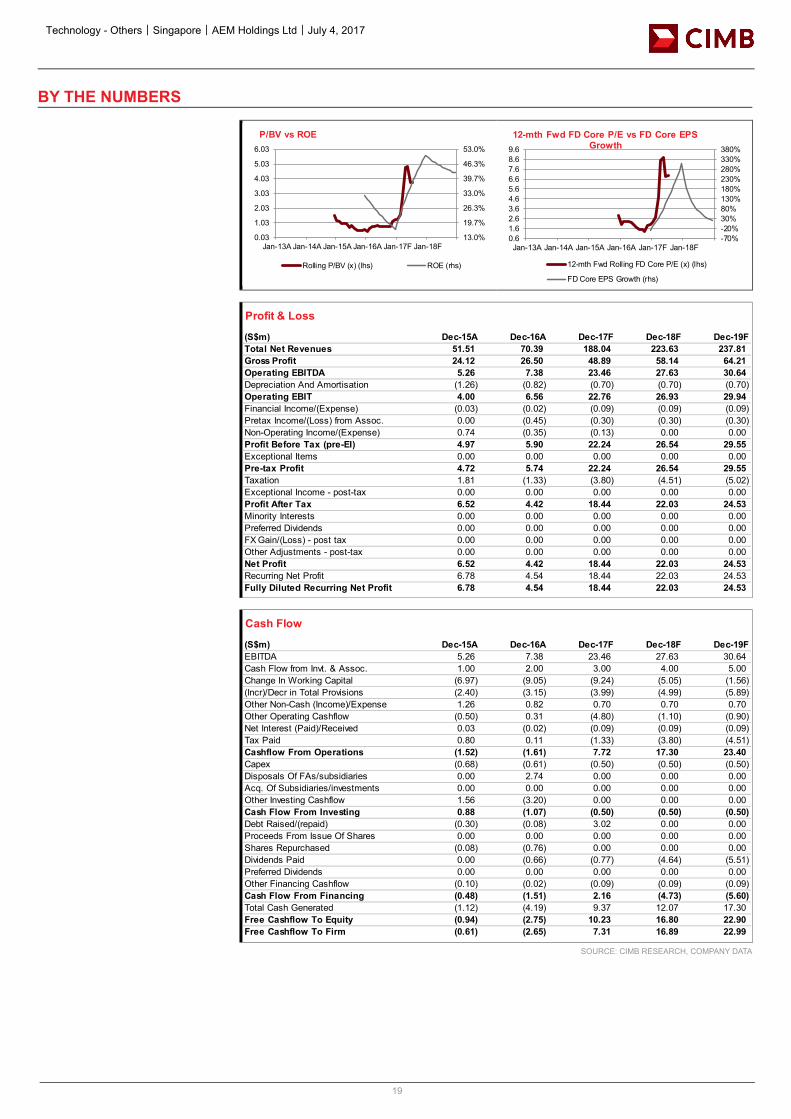
BY THE NUMBERS
SOURCE: CIMB RESEARCH, COMPANY DATA
13.0%
19.7%
26.3%
33.0%
39.7%
46.3%
53.0%
0.03
1.03
2.03
3.03
4.03
5.03
6.03
Jan-13A Jan-14A Jan-15A Jan-16A Jan-17F Jan-18F
P/BV vs ROE
Rolling P/BV (x) (lhs) ROE (rhs)
-70%-20%30%80%130%180%230%280%330%380%
0.61.62.63.64.65.66.67.68.69.6
Jan-13A Jan-14A Jan-15A Jan-16A Jan-17F Jan-18F
12-mth Fwd FD Core P/E vs FD Core EPS Growth
12-mth Fwd Rolling FD Core P/E (x) (lhs)
FD Core EPS Growth (rhs)
Profit & Loss
(S$m) Dec-15A Dec-16A Dec-17F Dec-18F Dec-19FTotal Net Revenues 51.51 70.39 188.04 223.63 237.81Gross Profit 24.12 26.50 48.89 58.14 64.21Operating EBITDA 5.26 7.38 23.46 27.63 30.64Depreciation And Amortisation (1.26) (0.82) (0.70) (0.70) (0.70)Operating EBIT 4.00 6.56 22.76 26.93 29.94Financial Income/(Expense) (0.03) (0.02) (0.09) (0.09) (0.09)Pretax Income/(Loss) from Assoc. 0.00 (0.45) (0.30) (0.30) (0.30)Non-Operating Income/(Expense) 0.74 (0.35) (0.13) 0.00 0.00Profit Before Tax (pre-EI) 4.97 5.90 22.24 26.54 29.55Exceptional Items 0.00 0.00 0.00 0.00 0.00Pre-tax Profit 4.72 5.74 22.24 26.54 29.55Taxation 1.81 (1.33) (3.80) (4.51) (5.02)Exceptional Income - post-tax 0.00 0.00 0.00 0.00 0.00Profit After Tax 6.52 4.42 18.44 22.03 24.53Minority Interests 0.00 0.00 0.00 0.00 0.00Preferred Dividends 0.00 0.00 0.00 0.00 0.00FX Gain/(Loss) - post tax 0.00 0.00 0.00 0.00 0.00Other Adjustments - post-tax 0.00 0.00 0.00 0.00 0.00Net Profit 6.52 4.42 18.44 22.03 24.53Recurring Net Profit 6.78 4.54 18.44 22.03 24.53Fully Diluted Recurring Net Profit 6.78 4.54 18.44 22.03 24.53
Cash Flow
(S$m) Dec-15A Dec-16A Dec-17F Dec-18F Dec-19FEBITDA 5.26 7.38 23.46 27.63 30.64Cash Flow from Invt. & Assoc. 1.00 2.00 3.00 4.00 5.00Change In Working Capital (6.97) (9.05) (9.24) (5.05) (1.56)(Incr)/Decr in Total Provisions (2.40) (3.15) (3.99) (4.99) (5.89)Other Non-Cash (Income)/Expense 1.26 0.82 0.70 0.70 0.70Other Operating Cashflow (0.50) 0.31 (4.80) (1.10) (0.90)Net Interest (Paid)/Received 0.03 (0.02) (0.09) (0.09) (0.09)Tax Paid 0.80 0.11 (1.33) (3.80) (4.51)Cashflow From Operations (1.52) (1.61) 7.72 17.30 23.40Capex (0.68) (0.61) (0.50) (0.50) (0.50)Disposals Of FAs/subsidiaries 0.00 2.74 0.00 0.00 0.00Acq. Of Subsidiaries/investments 0.00 0.00 0.00 0.00 0.00Other Investing Cashflow 1.56 (3.20) 0.00 0.00 0.00Cash Flow From Investing 0.88 (1.07) (0.50) (0.50) (0.50)Debt Raised/(repaid) (0.30) (0.08) 3.02 0.00 0.00Proceeds From Issue Of Shares 0.00 0.00 0.00 0.00 0.00Shares Repurchased (0.08) (0.76) 0.00 0.00 0.00Dividends Paid 0.00 (0.66) (0.77) (4.64) (5.51)Preferred Dividends 0.00 0.00 0.00 0.00 0.00Other Financing Cashflow (0.10) (0.02) (0.09) (0.09) (0.09)Cash Flow From Financing (0.48) (1.51) 2.16 (4.73) (5.60)Total Cash Generated (1.12) (4.19) 9.37 12.07 17.30Free Cashflow To Equity (0.94) (2.75) 10.23 16.80 22.90Free Cashflow To Firm (0.61) (2.65) 7.31 16.89 22.99
Technology - Others│Singapore│AEM Holdings Ltd│July 4, 2017
20
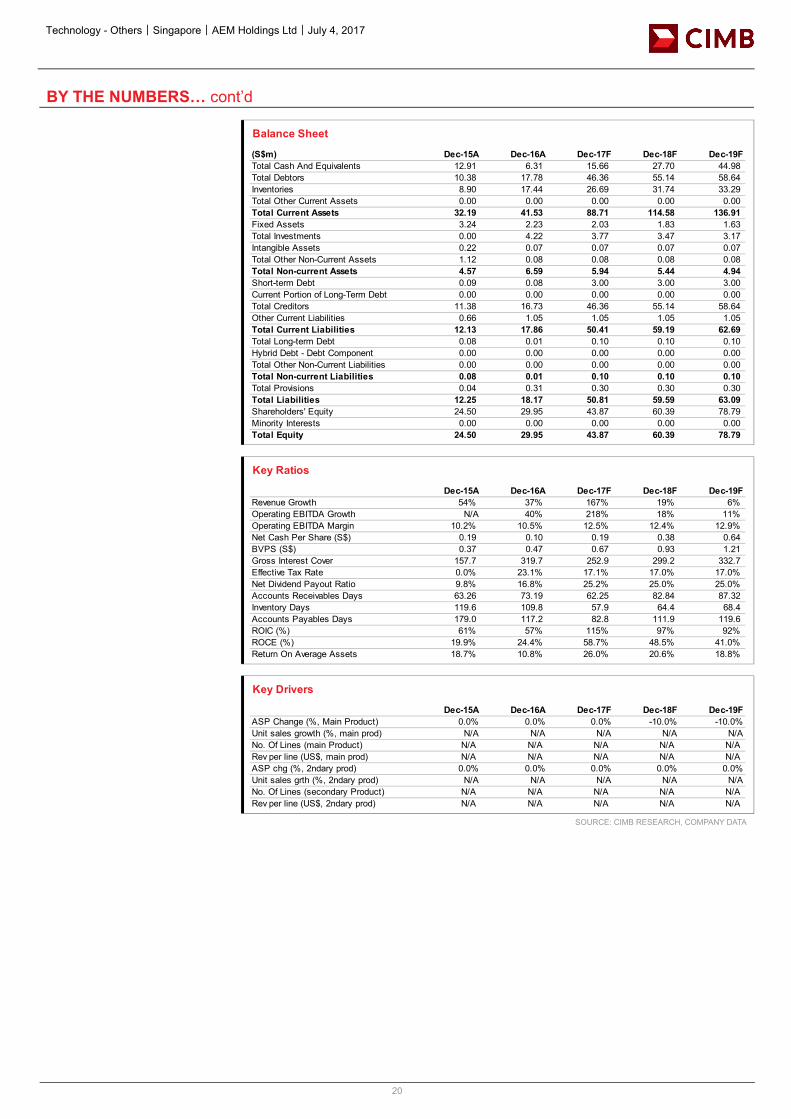
BY THE NUMBERS… cont’d
SOURCE: CIMB RESEARCH, COMPANY DATA
Balance Sheet
(S$m) Dec-15A Dec-16A Dec-17F Dec-18F Dec-19FTotal Cash And Equivalents 12.91 6.31 15.66 27.70 44.98Total Debtors 10.38 17.78 46.36 55.14 58.64Inventories 8.90 17.44 26.69 31.74 33.29Total Other Current Assets 0.00 0.00 0.00 0.00 0.00Total Current Assets 32.19 41.53 88.71 114.58 136.91Fixed Assets 3.24 2.23 2.03 1.83 1.63Total Investments 0.00 4.22 3.77 3.47 3.17Intangible Assets 0.22 0.07 0.07 0.07 0.07Total Other Non-Current Assets 1.12 0.08 0.08 0.08 0.08Total Non-current Assets 4.57 6.59 5.94 5.44 4.94Short-term Debt 0.09 0.08 3.00 3.00 3.00Current Portion of Long-Term Debt 0.00 0.00 0.00 0.00 0.00Total Creditors 11.38 16.73 46.36 55.14 58.64Other Current Liabilities 0.66 1.05 1.05 1.05 1.05Total Current Liabilities 12.13 17.86 50.41 59.19 62.69Total Long-term Debt 0.08 0.01 0.10 0.10 0.10Hybrid Debt - Debt Component 0.00 0.00 0.00 0.00 0.00Total Other Non-Current Liabilities 0.00 0.00 0.00 0.00 0.00Total Non-current Liabilities 0.08 0.01 0.10 0.10 0.10Total Provisions 0.04 0.31 0.30 0.30 0.30Total Liabilities 12.25 18.17 50.81 59.59 63.09Shareholders' Equity 24.50 29.95 43.87 60.39 78.79Minority Interests 0.00 0.00 0.00 0.00 0.00Total Equity 24.50 29.95 43.87 60.39 78.79
Key Ratios
Dec-15A Dec-16A Dec-17F Dec-18F Dec-19FRevenue Growth 54% 37% 167% 19% 6%Operating EBITDA Growth N/A 40% 218% 18% 11%Operating EBITDA Margin 10.2% 10.5% 12.5% 12.4% 12.9%Net Cash Per Share (S$) 0.19 0.10 0.19 0.38 0.64BVPS (S$) 0.37 0.47 0.67 0.93 1.21Gross Interest Cover 157.7 319.7 252.9 299.2 332.7Effective Tax Rate 0.0% 23.1% 17.1% 17.0% 17.0%Net Dividend Payout Ratio 9.8% 16.8% 25.2% 25.0% 25.0%Accounts Receivables Days 63.26 73.19 62.25 82.84 87.32Inventory Days 119.6 109.8 57.9 64.4 68.4Accounts Payables Days 179.0 117.2 82.8 111.9 119.6ROIC (%) 61% 57% 115% 97% 92%ROCE (%) 19.9% 24.4% 58.7% 48.5% 41.0%Return On Average Assets 18.7% 10.8% 26.0% 20.6% 18.8%
Key Drivers
Dec-15A Dec-16A Dec-17F Dec-18F Dec-19FASP Change (%, Main Product) 0.0% 0.0% 0.0% -10.0% -10.0%Unit sales growth (%, main prod) N/A N/A N/A N/A N/ANo. Of Lines (main Product) N/A N/A N/A N/A N/ARev per line (US$, main prod) N/A N/A N/A N/A N/AASP chg (%, 2ndary prod) 0.0% 0.0% 0.0% 0.0% 0.0%Unit sales grth (%, 2ndary prod) N/A N/A N/A N/A N/ANo. Of Lines (secondary Product) N/A N/A N/A N/A N/ARev per line (US$, 2ndary prod) N/A N/A N/A N/A N/A
Tech Manufacturing Services│Singapore│July 4, 2017
Company Note
IMPORTANT DISCLOSURES, INCLUDING ANY REQUIRED RESEARCH CERTIFICATIONS, ARE PROVIDED AT THE END OF THIS REPORT. IF THIS REPORT IS DISTRIBUTED IN THE UNITED STATES IT IS DISTRIBUTED BY CIMB SECURITIES (USA), INC. AND IS CONSIDERED THIRD-PARTY AFFILIATED RESEARCH.
Powered by the EFA Platform
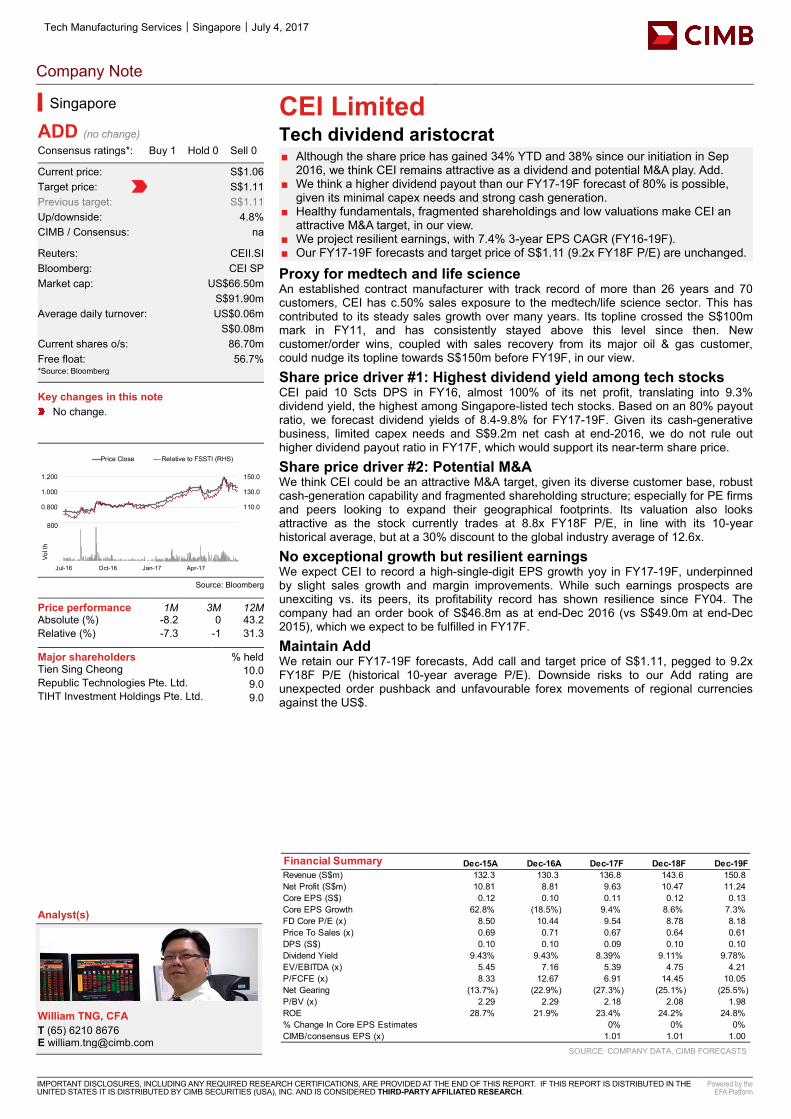
CEI Limited Tech dividend aristocrat ■ Although the share price has gained 34% YTD and 38% since our initiation in Sep
2016, we think CEI remains attractive as a dividend and potential M&A play. Add. ■ We think a higher dividend payout than our FY17-19F forecast of 80% is possible,
given its minimal capex needs and strong cash generation. ■ Healthy fundamentals, fragmented shareholdings and low valuations make CEI an
attractive M&A target, in our view. ■ We project resilient earnings, with 7.4% 3-year EPS CAGR (FY16-19F). ■ Our FY17-19F forecasts and target price of S$1.11 (9.2x FY18F P/E) are unchanged.
Proxy for medtech and life science An established contract manufacturer with track record of more than 26 years and 70 customers, CEI has c.50% sales exposure to the medtech/life science sector. This has contributed to its steady sales growth over many years. Its topline crossed the S$100m mark in FY11, and has consistently stayed above this level since then. New customer/order wins, coupled with sales recovery from its major oil & gas customer, could nudge its topline towards S$150m before FY19F, in our view.
Share price driver #1: Highest dividend yield among tech stocks CEI paid 10 Scts DPS in FY16, almost 100% of its net profit, translating into 9.3% dividend yield, the highest among Singapore-listed tech stocks. Based on an 80% payout ratio, we forecast dividend yields of 8.4-9.8% for FY17-19F. Given its cash-generative business, limited capex needs and S$9.2m net cash at end-2016, we do not rule out higher dividend payout ratio in FY17F, which would support its near-term share price.
Share price driver #2: Potential M&A We think CEI could be an attractive M&A target, given its diverse customer base, robust cash-generation capability and fragmented shareholding structure; especially for PE firms and peers looking to expand their geographical footprints. Its valuation also looks attractive as the stock currently trades at 8.8x FY18F P/E, in line with its 10-year historical average, but at a 30% discount to the global industry average of 12.6x.
No exceptional growth but resilient earnings We expect CEI to record a high-single-digit EPS growth yoy in FY17-19F, underpinned by slight sales growth and margin improvements. While such earnings prospects are unexciting vs. its peers, its profitability record has shown resilience since FY04. The company had an order book of S$46.8m as at end-Dec 2016 (vs S$49.0m at end-Dec 2015), which we expect to be fulfilled in FY17F.
Maintain Add We retain our FY17-19F forecasts, Add call and target price of S$1.11, pegged to 9.2x FY18F P/E (historical 10-year average P/E). Downside risks to our Add rating are unexpected order pushback and unfavourable forex movements of regional currencies against the US$.
SOURCE: COMPANY DATA, CIMB FORECASTS
Singapore
ADD (no change) Consensus ratings*: Buy 1 Hold 0 Sell 0
Current price: S$1.06 Target price: S$1.11 Previous target: S$1.11 Up/downside: 4.8% CIMB / Consensus: na
Reuters: CEII.SI Bloomberg: CEI SP Market cap: US$66.50m S$91.90m Average daily turnover: US$0.06m S$0.08m Current shares o/s: 86.70m Free float: 56.7% *Source: Bloomberg Key changes in this note
No change.
Source: Bloomberg
Price performance 1M 3M 12M Absolute (%) -8.2 0 43.2 Relative (%) -7.3 -1 31.3
Major shareholders % held Tien Sing Cheong 10.0 Republic Technologies Pte. Ltd. 9.0 TIHT Investment Holdings Pte. Ltd. 9.0
Analyst(s)
William TNG, CFA T (65) 6210 8676 E [email protected]
Financial Summary Dec-15A Dec-16A Dec-17F Dec-18F Dec-19FRevenue (S$m) 132.3 130.3 136.8 143.6 150.8Net Profit (S$m) 10.81 8.81 9.63 10.47 11.24Core EPS (S$) 0.12 0.10 0.11 0.12 0.13Core EPS Growth 62.8% (18.5%) 9.4% 8.6% 7.3%FD Core P/E (x) 8.50 10.44 9.54 8.78 8.18Price To Sales (x) 0.69 0.71 0.67 0.64 0.61DPS (S$) 0.10 0.10 0.09 0.10 0.10Dividend Yield 9.43% 9.43% 8.39% 9.11% 9.78%EV/EBITDA (x) 5.45 7.16 5.39 4.75 4.21P/FCFE (x) 8.33 12.67 6.91 14.45 10.05Net Gearing (13.7%) (22.9%) (27.3%) (25.1%) (25.5%)P/BV (x) 2.29 2.29 2.18 2.08 1.98ROE 28.7% 21.9% 23.4% 24.2% 24.8%% Change In Core EPS Estimates 0% 0% 0%CIMB/consensus EPS (x) 1.01 1.01 1.00
90.0
110.0
130.0
150.0
0.600
0.800
1.000
1.200
Price Close Relative to FSSTI (RHS)
200400600800
Jul-16 Oct-16 Jan-17 Apr-17
Vol t
h
Tech Manufacturing Services│Singapore│CEI Limited│July 4, 2017
22
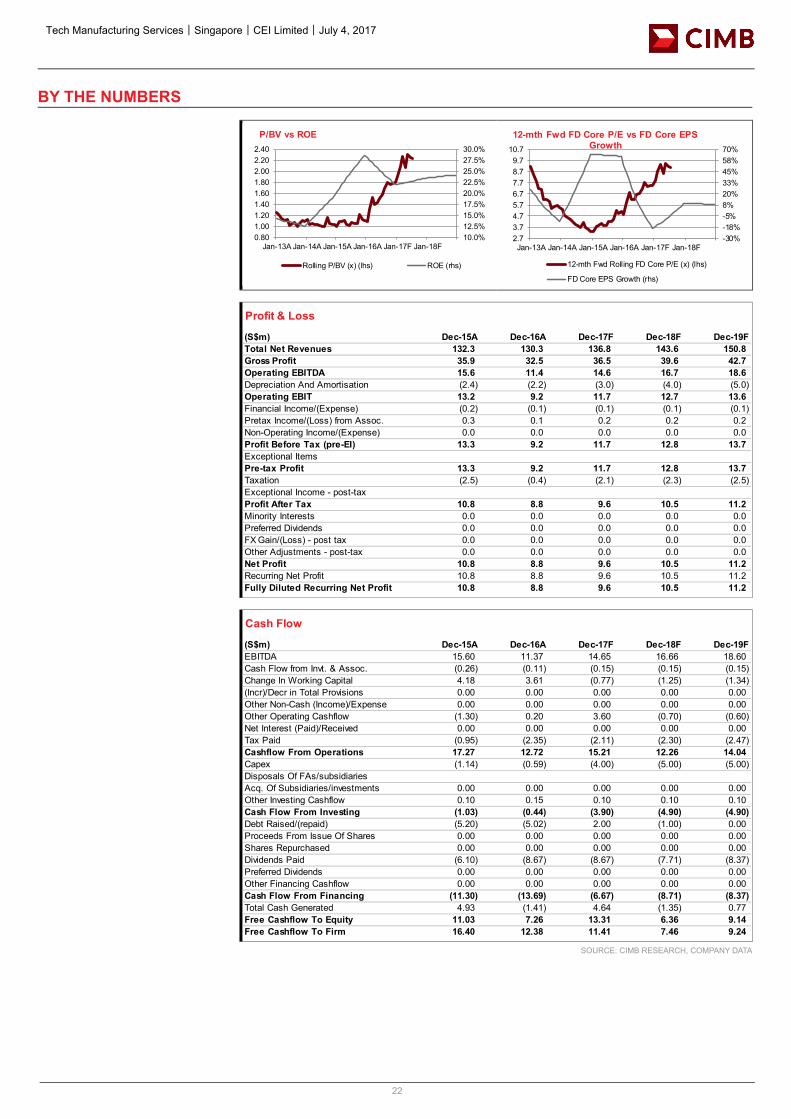
BY THE NUMBERS
SOURCE: CIMB RESEARCH, COMPANY DATA
10.0%12.5%15.0%17.5%20.0%22.5%25.0%27.5%30.0%
0.801.001.201.401.601.802.002.202.40
Jan-13A Jan-14A Jan-15A Jan-16A Jan-17F Jan-18F
P/BV vs ROE
Rolling P/BV (x) (lhs) ROE (rhs)
-30%-18%-5%8%20%33%45%58%70%
2.73.74.75.76.77.78.79.7
10.7
Jan-13A Jan-14A Jan-15A Jan-16A Jan-17F Jan-18F
12-mth Fwd FD Core P/E vs FD Core EPS Growth
12-mth Fwd Rolling FD Core P/E (x) (lhs)
FD Core EPS Growth (rhs)
Profit & Loss
(S$m) Dec-15A Dec-16A Dec-17F Dec-18F Dec-19FTotal Net Revenues 132.3 130.3 136.8 143.6 150.8Gross Profit 35.9 32.5 36.5 39.6 42.7Operating EBITDA 15.6 11.4 14.6 16.7 18.6Depreciation And Amortisation (2.4) (2.2) (3.0) (4.0) (5.0)Operating EBIT 13.2 9.2 11.7 12.7 13.6Financial Income/(Expense) (0.2) (0.1) (0.1) (0.1) (0.1)Pretax Income/(Loss) from Assoc. 0.3 0.1 0.2 0.2 0.2Non-Operating Income/(Expense) 0.0 0.0 0.0 0.0 0.0Profit Before Tax (pre-EI) 13.3 9.2 11.7 12.8 13.7Exceptional ItemsPre-tax Profit 13.3 9.2 11.7 12.8 13.7Taxation (2.5) (0.4) (2.1) (2.3) (2.5)Exceptional Income - post-taxProfit After Tax 10.8 8.8 9.6 10.5 11.2Minority Interests 0.0 0.0 0.0 0.0 0.0Preferred Dividends 0.0 0.0 0.0 0.0 0.0FX Gain/(Loss) - post tax 0.0 0.0 0.0 0.0 0.0Other Adjustments - post-tax 0.0 0.0 0.0 0.0 0.0Net Profit 10.8 8.8 9.6 10.5 11.2Recurring Net Profit 10.8 8.8 9.6 10.5 11.2Fully Diluted Recurring Net Profit 10.8 8.8 9.6 10.5 11.2
Cash Flow
(S$m) Dec-15A Dec-16A Dec-17F Dec-18F Dec-19FEBITDA 15.60 11.37 14.65 16.66 18.60Cash Flow from Invt. & Assoc. (0.26) (0.11) (0.15) (0.15) (0.15)Change In Working Capital 4.18 3.61 (0.77) (1.25) (1.34)(Incr)/Decr in Total Provisions 0.00 0.00 0.00 0.00 0.00Other Non-Cash (Income)/Expense 0.00 0.00 0.00 0.00 0.00Other Operating Cashflow (1.30) 0.20 3.60 (0.70) (0.60)Net Interest (Paid)/Received 0.00 0.00 0.00 0.00 0.00Tax Paid (0.95) (2.35) (2.11) (2.30) (2.47)Cashflow From Operations 17.27 12.72 15.21 12.26 14.04Capex (1.14) (0.59) (4.00) (5.00) (5.00)Disposals Of FAs/subsidiariesAcq. Of Subsidiaries/investments 0.00 0.00 0.00 0.00 0.00Other Investing Cashflow 0.10 0.15 0.10 0.10 0.10Cash Flow From Investing (1.03) (0.44) (3.90) (4.90) (4.90)Debt Raised/(repaid) (5.20) (5.02) 2.00 (1.00) 0.00Proceeds From Issue Of Shares 0.00 0.00 0.00 0.00 0.00Shares Repurchased 0.00 0.00 0.00 0.00 0.00Dividends Paid (6.10) (8.67) (8.67) (7.71) (8.37)Preferred Dividends 0.00 0.00 0.00 0.00 0.00Other Financing Cashflow 0.00 0.00 0.00 0.00 0.00Cash Flow From Financing (11.30) (13.69) (6.67) (8.71) (8.37)Total Cash Generated 4.93 (1.41) 4.64 (1.35) 0.77Free Cashflow To Equity 11.03 7.26 13.31 6.36 9.14Free Cashflow To Firm 16.40 12.38 11.41 7.46 9.24

Tech Manufacturing Services│Singapore│CEI Limited│July 4, 2017
23
BY THE NUMBERS… cont’d
SOURCE: CIMB RESEARCH, COMPANY DATA
Balance Sheet
(S$m) Dec-15A Dec-16A Dec-17F Dec-18F Dec-19FTotal Cash And Equivalents 13.01 11.70 16.01 14.62 15.35Total Debtors 25.60 26.83 26.98 28.33 29.75Inventories 24.21 20.63 20.37 21.31 22.31Total Other Current Assets 0.00 0.00 0.00 0.00 0.00Total Current Assets 62.83 59.15 63.37 64.26 67.41Fixed Assets 7.16 5.59 6.64 7.69 7.73Total Investments 1.34 1.30 1.45 1.60 1.75Intangible Assets 1.06 1.06 1.10 1.10 1.10Total Other Non-Current Assets 0.66 0.77 0.70 0.70 0.70Total Non-current Assets 10.22 8.73 9.89 11.09 11.28Short-term Debt 7.52 2.50 4.50 3.50 3.50Current Portion of Long-Term Debt 0.00 0.00 0.00 0.00 0.00Total Creditors 22.04 23.55 23.11 24.14 25.23Other Current Liabilities 3.45 1.66 3.50 3.50 3.50Total Current Liabilities 33.01 27.71 31.11 31.14 32.23Total Long-term Debt 0.00 0.00 0.00 0.00 0.00Hybrid Debt - Debt Component 0.00 0.00 0.00 0.00 0.00Total Other Non-Current Liabilities 0.00 0.00 0.00 0.00 0.00Total Non-current Liabilities 0.00 0.00 0.00 0.00 0.00Total Provisions 0.00 0.00 0.00 0.00 0.00Total Liabilities 33.01 27.71 31.11 31.14 32.23Shareholders' Equity 40.07 40.16 42.15 44.25 46.49Minority InterestsTotal Equity 40.07 40.16 42.15 44.25 46.49
Key Ratios
Dec-15A Dec-16A Dec-17F Dec-18F Dec-19FRevenue Growth 9.08% (1.56%) 5.00% 5.00% 5.00%Operating EBITDA Growth 51.0% (27.1%) 28.9% 13.8% 11.6%Operating EBITDA Margin 11.8% 8.7% 10.7% 11.6% 12.3%Net Cash Per Share (S$) 0.06 0.11 0.13 0.13 0.14BVPS (S$) 0.46 0.46 0.49 0.51 0.54Gross Interest Cover 78.0 95.0 120.6 131.0 140.7Effective Tax Rate 18.5% 4.8% 18.0% 18.0% 18.0%Net Dividend Payout Ratio 80.2% 98.5% 80.0% 80.0% 80.0%Accounts Receivables Days 70.94 73.64 71.79 70.29 70.29Inventory Days 99.44 83.95 74.58 73.10 73.60Accounts Payables Days 77.85 76.84 76.57 74.11 74.87ROIC (%) 34.0% 27.7% 39.4% 43.6% 43.4%ROCE (%) 27.6% 20.5% 26.2% 26.9% 27.9%Return On Average Assets 14.9% 12.6% 13.8% 14.2% 14.7%
Key Drivers
Dec-15A Dec-16A Dec-17F Dec-18F Dec-19FASP Change (%, Main Product) 9.1% -1.6% 5.0% 5.0% 5.0%Unit sales growth (%, main prod) N/A N/A N/A N/A N/ANo. Of Lines (main Product) 14 14 14 14 14 Rev per line (US$, main prod) N/A N/A N/A N/A N/AASP chg (%, 2ndary prod) N/A N/A N/A N/A N/AUnit sales grth (%, 2ndary prod) N/A N/A N/A N/A N/ANo. Of Lines (secondary Product) N/A N/A N/A N/A N/ARev per line (US$, 2ndary prod) N/A N/A N/A N/A N/A
Tech Manufacturing Services│Singapore│July 4, 2017 Shariah Compliant
Company Note
IMPORTANT DISCLOSURES, INCLUDING ANY REQUIRED RESEARCH CERTIFICATIONS, ARE PROVIDED AT THE END OF THIS REPORT. IF THIS REPORT IS DISTRIBUTED IN THE UNITED STATES IT IS DISTRIBUTED BY CIMB SECURITIES (USA), INC. AND IS CONSIDERED THIRD-PARTY AFFILIATED RESEARCH.
Powered by the EFA Platform
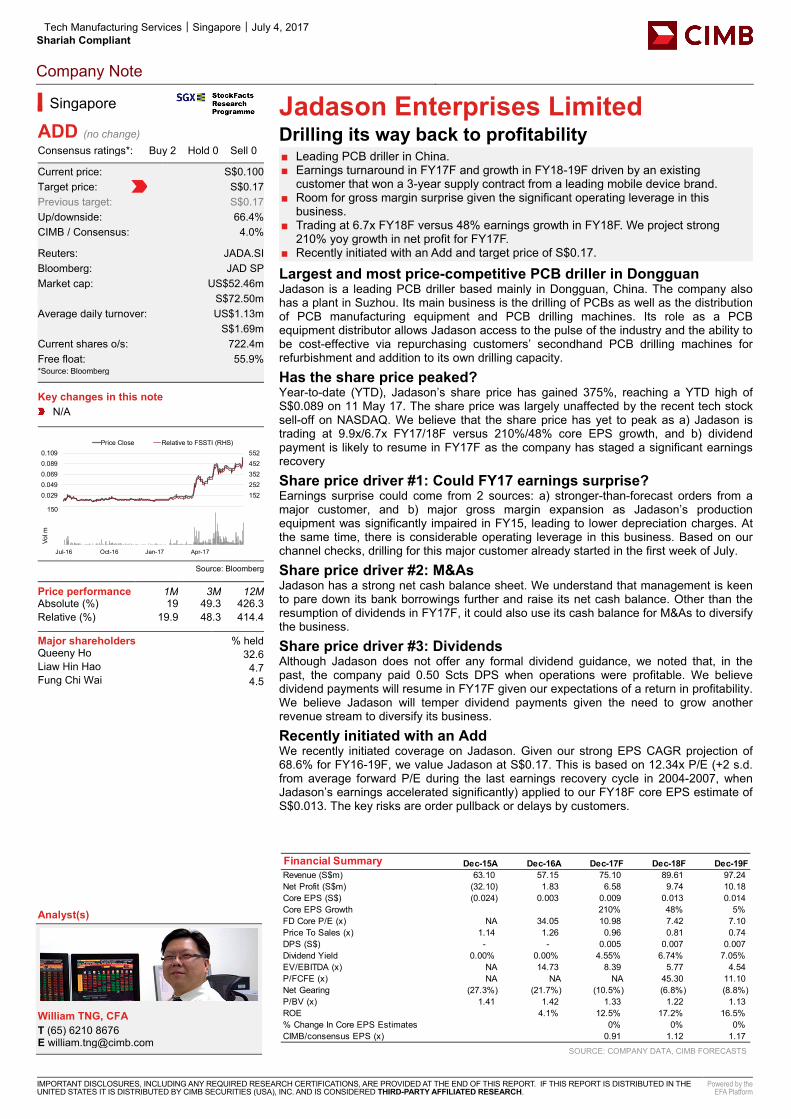
Jadason Enterprises Limited Drilling its way back to profitability ■ Leading PCB driller in China. ■ Earnings turnaround in FY17F and growth in FY18-19F driven by an existing
customer that won a 3-year supply contract from a leading mobile device brand. ■ Room for gross margin surprise given the significant operating leverage in this
business. ■ Trading at 6.7x FY18F versus 48% earnings growth in FY18F. We project strong
210% yoy growth in net profit for FY17F. ■ Recently initiated with an Add and target price of S$0.17.
Largest and most price-competitive PCB driller in Dongguan Jadason is a leading PCB driller based mainly in Dongguan, China. The company also has a plant in Suzhou. Its main business is the drilling of PCBs as well as the distribution of PCB manufacturing equipment and PCB drilling machines. Its role as a PCB equipment distributor allows Jadason access to the pulse of the industry and the ability to be cost-effective via repurchasing customers’ secondhand PCB drilling machines for refurbishment and addition to its own drilling capacity.
Has the share price peaked? Year-to-date (YTD), Jadason’s share price has gained 375%, reaching a YTD high of S$0.089 on 11 May 17. The share price was largely unaffected by the recent tech stock sell-off on NASDAQ. We believe that the share price has yet to peak as a) Jadason is trading at 9.9x/6.7x FY17/18F versus 210%/48% core EPS growth, and b) dividend payment is likely to resume in FY17F as the company has staged a significant earnings recovery
Share price driver #1: Could FY17 earnings surprise? Earnings surprise could come from 2 sources: a) stronger-than-forecast orders from a major customer, and b) major gross margin expansion as Jadason’s production equipment was significantly impaired in FY15, leading to lower depreciation charges. At the same time, there is considerable operating leverage in this business. Based on our channel checks, drilling for this major customer already started in the first week of July.
Share price driver #2: M&As Jadason has a strong net cash balance sheet. We understand that management is keen to pare down its bank borrowings further and raise its net cash balance. Other than the resumption of dividends in FY17F, it could also use its cash balance for M&As to diversify the business.
Share price driver #3: Dividends Although Jadason does not offer any formal dividend guidance, we noted that, in the past, the company paid 0.50 Scts DPS when operations were profitable. We believe dividend payments will resume in FY17F given our expectations of a return in profitability. We believe Jadason will temper dividend payments given the need to grow another revenue stream to diversify its business.
Recently initiated with an Add We recently initiated coverage on Jadason. Given our strong EPS CAGR projection of 68.6% for FY16-19F, we value Jadason at S$0.17. This is based on 12.34x P/E (+2 s.d. from average forward P/E during the last earnings recovery cycle in 2004-2007, when Jadason’s earnings accelerated significantly) applied to our FY18F core EPS estimate of S$0.013. The key risks are order pullback or delays by customers.
SOURCE: COMPANY DATA, CIMB FORECASTS
Singapore
ADD (no change) Consensus ratings*: Buy 2 Hold 0 Sell 0
Current price: S$0.100 Target price: S$0.17 Previous target: S$0.17 Up/downside: 66.4% CIMB / Consensus: 4.0%
Reuters: JADA.SI Bloomberg: JAD SP Market cap: US$52.46m S$72.50m Average daily turnover: US$1.13m S$1.69m Current shares o/s: 722.4m Free float: 55.9% *Source: Bloomberg Key changes in this note
N/A
Source: Bloomberg
Price performance 1M 3M 12M Absolute (%) 19 49.3 426.3 Relative (%) 19.9 48.3 414.4
Major shareholders % held Queeny Ho 32.6 Liaw Hin Hao 4.7 Fung Chi Wai 4.5
Analyst(s)
William TNG, CFA T (65) 6210 8676 E [email protected]
Financial Summary Dec-15A Dec-16A Dec-17F Dec-18F Dec-19FRevenue (S$m) 63.10 57.15 75.10 89.61 97.24Net Profit (S$m) (32.10) 1.83 6.58 9.74 10.18Core EPS (S$) (0.024) 0.003 0.009 0.013 0.014Core EPS Growth 210% 48% 5%FD Core P/E (x) NA 34.05 10.98 7.42 7.10Price To Sales (x) 1.14 1.26 0.96 0.81 0.74DPS (S$) - - 0.005 0.007 0.007Dividend Yield 0.00% 0.00% 4.55% 6.74% 7.05%EV/EBITDA (x) NA 14.73 8.39 5.77 4.54P/FCFE (x) NA NA NA 45.30 11.10Net Gearing (27.3%) (21.7%) (10.5%) (6.8%) (8.8%)P/BV (x) 1.41 1.42 1.33 1.22 1.13ROE 4.1% 12.5% 17.2% 16.5%% Change In Core EPS Estimates 0% 0% 0%CIMB/consensus EPS (x) 0.91 1.12 1.17
52152252352452552
0.0090.0290.0490.0690.0890.109
Price Close Relative to FSSTI (RHS)
50
100
150
Jul-16 Oct-16 Jan-17 Apr-17
Vol m
Tech Manufacturing Services│Singapore│Jadason Enterprises Limited│July 4, 2017
25
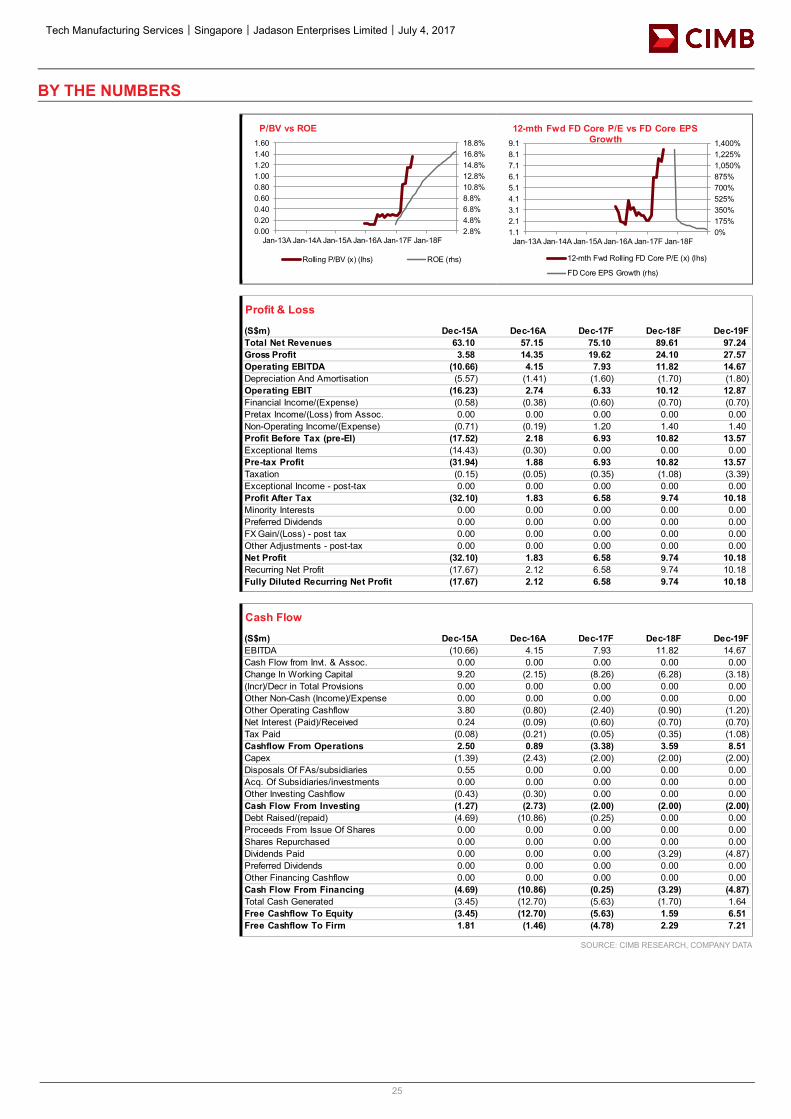
BY THE NUMBERS
SOURCE: CIMB RESEARCH, COMPANY DATA
2.8%4.8%6.8%8.8%10.8%12.8%14.8%16.8%18.8%
0.000.200.400.600.801.001.201.401.60
Jan-13A Jan-14A Jan-15A Jan-16A Jan-17F Jan-18F
P/BV vs ROE
Rolling P/BV (x) (lhs) ROE (rhs)
0%175%350%525%700%875%1,050%1,225%1,400%
1.12.13.14.15.16.17.18.19.1
Jan-13A Jan-14A Jan-15A Jan-16A Jan-17F Jan-18F
12-mth Fwd FD Core P/E vs FD Core EPS Growth
12-mth Fwd Rolling FD Core P/E (x) (lhs)
FD Core EPS Growth (rhs)
Profit & Loss
(S$m) Dec-15A Dec-16A Dec-17F Dec-18F Dec-19FTotal Net Revenues 63.10 57.15 75.10 89.61 97.24Gross Profit 3.58 14.35 19.62 24.10 27.57Operating EBITDA (10.66) 4.15 7.93 11.82 14.67Depreciation And Amortisation (5.57) (1.41) (1.60) (1.70) (1.80)Operating EBIT (16.23) 2.74 6.33 10.12 12.87Financial Income/(Expense) (0.58) (0.38) (0.60) (0.70) (0.70)Pretax Income/(Loss) from Assoc. 0.00 0.00 0.00 0.00 0.00Non-Operating Income/(Expense) (0.71) (0.19) 1.20 1.40 1.40Profit Before Tax (pre-EI) (17.52) 2.18 6.93 10.82 13.57Exceptional Items (14.43) (0.30) 0.00 0.00 0.00Pre-tax Profit (31.94) 1.88 6.93 10.82 13.57Taxation (0.15) (0.05) (0.35) (1.08) (3.39)Exceptional Income - post-tax 0.00 0.00 0.00 0.00 0.00Profit After Tax (32.10) 1.83 6.58 9.74 10.18Minority Interests 0.00 0.00 0.00 0.00 0.00Preferred Dividends 0.00 0.00 0.00 0.00 0.00FX Gain/(Loss) - post tax 0.00 0.00 0.00 0.00 0.00Other Adjustments - post-tax 0.00 0.00 0.00 0.00 0.00Net Profit (32.10) 1.83 6.58 9.74 10.18Recurring Net Profit (17.67) 2.12 6.58 9.74 10.18Fully Diluted Recurring Net Profit (17.67) 2.12 6.58 9.74 10.18
Cash Flow
(S$m) Dec-15A Dec-16A Dec-17F Dec-18F Dec-19FEBITDA (10.66) 4.15 7.93 11.82 14.67Cash Flow from Invt. & Assoc. 0.00 0.00 0.00 0.00 0.00Change In Working Capital 9.20 (2.15) (8.26) (6.28) (3.18)(Incr)/Decr in Total Provisions 0.00 0.00 0.00 0.00 0.00Other Non-Cash (Income)/Expense 0.00 0.00 0.00 0.00 0.00Other Operating Cashflow 3.80 (0.80) (2.40) (0.90) (1.20)Net Interest (Paid)/Received 0.24 (0.09) (0.60) (0.70) (0.70)Tax Paid (0.08) (0.21) (0.05) (0.35) (1.08)Cashflow From Operations 2.50 0.89 (3.38) 3.59 8.51Capex (1.39) (2.43) (2.00) (2.00) (2.00)Disposals Of FAs/subsidiaries 0.55 0.00 0.00 0.00 0.00Acq. Of Subsidiaries/investments 0.00 0.00 0.00 0.00 0.00Other Investing Cashflow (0.43) (0.30) 0.00 0.00 0.00Cash Flow From Investing (1.27) (2.73) (2.00) (2.00) (2.00)Debt Raised/(repaid) (4.69) (10.86) (0.25) 0.00 0.00Proceeds From Issue Of Shares 0.00 0.00 0.00 0.00 0.00Shares Repurchased 0.00 0.00 0.00 0.00 0.00Dividends Paid 0.00 0.00 0.00 (3.29) (4.87)Preferred Dividends 0.00 0.00 0.00 0.00 0.00Other Financing Cashflow 0.00 0.00 0.00 0.00 0.00Cash Flow From Financing (4.69) (10.86) (0.25) (3.29) (4.87)Total Cash Generated (3.45) (12.70) (5.63) (1.70) 1.64Free Cashflow To Equity (3.45) (12.70) (5.63) 1.59 6.51Free Cashflow To Firm 1.81 (1.46) (4.78) 2.29 7.21

Tech Manufacturing Services│Singapore│Jadason Enterprises Limited│July 4, 2017
26
BY THE NUMBERS… cont’d
SOURCE: CIMB RESEARCH, COMPANY DATA
Balance Sheet
(S$m) Dec-15A Dec-16A Dec-17F Dec-18F Dec-19FTotal Cash And Equivalents 32.57 18.72 13.10 11.41 13.04Total Debtors 30.00 33.04 45.26 54.01 58.61Inventories 4.53 5.09 6.25 7.37 7.83Total Other Current Assets 1.80 1.36 1.40 1.40 1.40Total Current Assets 68.90 58.20 66.02 74.18 80.89Fixed Assets 20.02 19.97 20.37 20.67 20.87Total Investments 0.00 0.00 0.00 0.00 0.00Intangible Assets 0.00 0.00 0.00 0.00 0.00Total Other Non-Current Assets 0.00 0.00 0.00 0.00 0.00Total Non-current Assets 20.02 19.97 20.37 20.67 20.87Short-term Debt 16.22 7.64 7.40 7.40 7.40Current Portion of Long-Term Debt 0.00 0.00 0.00 0.00 0.00Total Creditors 16.16 17.33 22.52 26.10 27.98Other Current Liabilities 2.36 1.72 1.72 1.72 1.72Total Current Liabilities 34.74 26.68 31.63 35.21 37.09Total Long-term Debt 2.30 0.01 0.00 0.00 0.00Hybrid Debt - Debt Component 0.00 0.00 0.00 0.00 0.00Total Other Non-Current Liabilities 0.52 0.53 0.50 0.50 0.50Total Non-current Liabilities 2.82 0.53 0.50 0.50 0.50Total Provisions 0.00 0.00 0.00 0.00 0.00Total Liabilities 37.56 27.22 32.13 35.71 37.59Shareholders' Equity 51.36 50.95 54.24 59.11 64.20Minority Interests 0.00 0.00 0.00 0.00 0.00Total Equity 51.36 50.95 54.24 59.11 64.20
Key Ratios
Dec-15A Dec-16A Dec-17F Dec-18F Dec-19FRevenue Growth N/A (9.4%) 31.4% 19.3% 8.5%Operating EBITDA Growth N/A N/A 90.9% 49.1% 24.1%Operating EBITDA Margin (16.9%) 7.3% 10.6% 13.2% 15.1%Net Cash Per Share (S$) 0.019 0.015 0.008 0.006 0.008BVPS (S$) 0.071 0.071 0.075 0.082 0.089Gross Interest Cover (28.08) 7.29 10.54 14.46 18.39Effective Tax Rate 0.0% 2.6% 5.0% 10.0% 25.0%Net Dividend Payout Ratio NA NA 50.0% 50.0% 50.0%Accounts Receivables Days N/A 153.0 155.3 165.4 172.9Inventory Days N/A 41.09 37.31 37.94 39.81Accounts Payables Days N/A 105.9 104.1 113.1 120.7ROIC (%) N/A 7.2% 15.7% 20.6% 23.1%ROCE (%) N/A 4.3% 10.5% 15.8% 18.6%Return On Average Assets N/A 3.0% 8.7% 11.5% 11.1%
Key Drivers
Dec-15A Dec-16A Dec-17F Dec-18F Dec-19FASP Change (%, Main Product) -8.7% -33.7% 3.0% 3.0% 3.0%Unit sales growth (%, main prod) N/A N/A N/A N/A N/ANo. Of Lines (main Product) N/A N/A N/A N/A N/ARev per line (US$, main prod) N/A N/A N/A N/A N/AASP chg (%, 2ndary prod) -33.3% 19.1% 50.0% 26.7% 10.5%Unit sales grth (%, 2ndary prod) N/A N/A N/A N/A N/ANo. Of Lines (secondary Product) N/A N/A N/A N/A N/ARev per line (US$, 2ndary prod) N/A N/A N/A N/A N/A
Tech Manufacturing Services│Singapore│July 4, 2017
Company Note
IMPORTANT DISCLOSURES, INCLUDING ANY REQUIRED RESEARCH CERTIFICATIONS, ARE PROVIDED AT THE END OF THIS REPORT. IF THIS REPORT IS DISTRIBUTED IN THE UNITED STATES IT IS DISTRIBUTED BY CIMB SECURITIES (USA), INC. AND IS CONSIDERED THIRD-PARTY AFFILIATED RESEARCH.
Powered by the EFA Platform
Memtech International All stars aligned ■ Memtech is a precision engineering firm known for its liquid silicone rubber (LSR) and
multiple injection capabilities. ■ We believe its earnings trajectory in FY17-19F will be driven by higher AU and CE
sales orders and better margins. ■ MTEC could be an attractive M&A target, with its strong balance sheet, earnings
profile and established customer base, in our view. ■ Other potential catalysts include new customer wins and special dividends. ■ At 8.2x FY18F P/E and 0.74x P/BV, MTEC remains one of the cheaper tech plays in
Singapore, with 32.8% 3-year EPS CAGR and 4-6% dividend yields in FY17-19F.
Laggard tech manufacturing play As a precision engineering company, MTEC prides itself on its core competencies in LSR and multiple injection technology, which have successfully led its transformation from a pure keypad components manufacturer into an established supplier for both the automotive (AU) and consumer electronics (CE) industries today. It counts many tier-1 AU companies (such as Kostal, Magna and Faurecia) as well as leading CE brands (Beats, Amazon) as its major customers.
+45% ytd, but ripe for valuation re-rating MTEC has historically traded at a steep discount to its peers’ average as a result of its smaller market cap, trading illiquidity and patchy earnings record. We think the stock deserves a re-rating due to: a) its robust earnings growth, and b) net cash/share of 24.6 Scts at end-1Q17 (representing c.27% of market cap) that may be better utilised for higher dividends or synergistic M&A opportunities.
Still an Add rating We reiterate Add on MTEC with unchanged FY17-19F forecasts and target price of S$1.09, still pegged to 10x FY18F P/E (at 10% discount to peer average). Downside risks to our Add call include unexpected project delays or cancellation.
Share price driver #1: Earnings growth accelerating MTEC’s 1Q17 core net profit of US$1.7m was an improvement over the US$0.4m in 1Q16, driven by double-digit sales growth in both AU and CE segments. 1Q17 gross margin of 18.1% benefited from greater volume and economies of scale, up from 1Q16’s 15.9%. We project earnings growth of 22-56% p.a. over FY17-19F, underpinned by increasing orders from existing customers and margin expansion. We note that 2H is seasonally stronger and our forecasts have yet to factor in potential new customer wins.
Share price driver #2: Potential special dividends We forecast FY17-19F dividend yields of 4-6% for MTEC, based on its dividend policy of not less than 30% of net profit. The company has consistently paid dividends, even during its loss-making years of FY12-13. Backed by recent net proceeds of c.US$5.7m from the sale of two land assets in China and a healthy net cash position of US$28m as at end-1Q17 to meet its annual estimated capex requirement of US$10m-12m, we believe a special dividend could be on the cards for FY17F to reward shareholders.
Share price driver #3: M&As? We think MTEC now looks attractive as an M&A target given its cash-generative business, growing customer base and the fact that earnings are possibly at an inflection point. Competitors keen to break into the automotive and Beats supply chain but deterred by the high entry barriers (long audit process and strict technical know-how) could instead seek a faster way by acquiring firms like MTEC.
SOURCE: COMPANY DATA, CIMB FORECASTS
Singapore
ADD (no change) Consensus ratings*: Buy 2 Hold 1 Sell 0
Current price: S$0.91 Target price: S$1.09 Previous target: S$1.09 Up/downside: 20.6% CIMB / Consensus: 12.5%
Reuters: MEMT.SI Bloomberg: MTEC SP Market cap: US$92.26m S$127.5m Average daily turnover: US$0.47m S$0.65m Current shares o/s: 140.9m Free float: 50.0% *Source: Bloomberg Key changes in this note
Not applicable.
Source: Bloomberg
Price performance 1M 3M 12M Absolute (%) -6.2 33.1 41.4 Relative (%) -5.3 32.1 29.5
Major shareholders % held Keytech Investment Pte Ltd 43.7 Chuang Wen Fu 3.9 Gu Cheng Hua 1.0
Analyst(s)
NGOH Yi Sin T (65) 6210 8604 E [email protected] William TNG, CFA T (65) 6210 8676 E [email protected]
Financial Summary Dec-15A Dec-16A Dec-17F Dec-18F Dec-19FRevenue (US$m) 142.2 159.0 187.8 211.1 239.9Net Profit (US$m) 8.18 6.48 9.05 11.10 13.55Core EPS (US$) 0.054 0.041 0.064 0.079 0.096Core EPS Growth 20.6% (23.3%) 56.4% 22.8% 22.0%FD Core P/E (x) 12.23 15.95 10.20 8.31 6.81Price To Sales (x) 0.65 0.58 0.49 0.44 0.38DPS (US$) 0.024 0.018 0.025 0.031 0.038Dividend Yield 3.60% 2.73% 3.87% 4.76% 5.82%EV/EBITDA (x) 4.23 4.79 3.42 2.60 1.84P/FCFE (x) 381.6 16.0 NA 20.5 7.9Net Gearing (23.7%) (22.3%) (18.1%) (17.2%) (21.0%)P/BV (x) 0.82 0.83 0.80 0.75 0.71ROE 6.7% 5.2% 8.0% 9.3% 10.7%% Change In Core EPS Estimates 0% 0% 0%CIMB/consensus EPS (x) 1.07 1.13 0.96
79.0
102.3
125.7
149.0
0.500
0.700
0.900
1.100Price Close Relative to FSSTI (RHS)
1234
Jul-16 Oct-16 Jan-17 Apr-17
Vol m
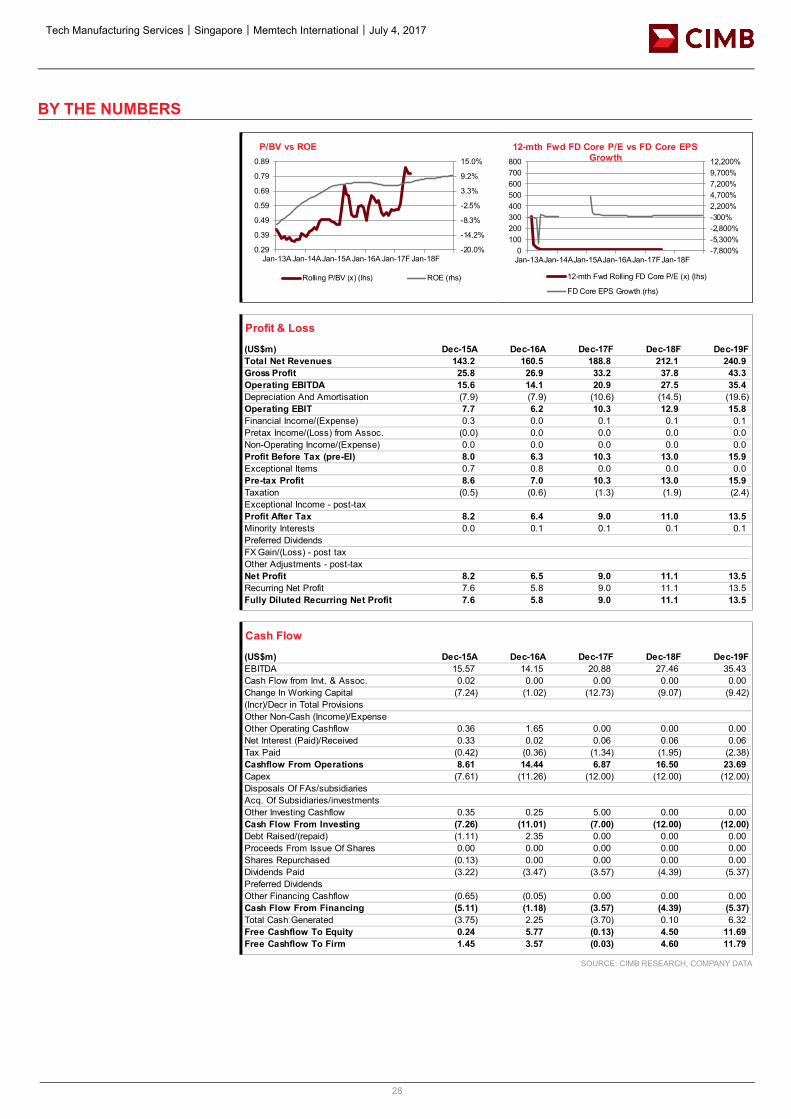
Tech Manufacturing Services│Singapore│Memtech International│July 4, 2017
28
BY THE NUMBERS
SOURCE: CIMB RESEARCH, COMPANY DATA
-20.0%
-14.2%
-8.3%
-2.5%
3.3%
9.2%
15.0%
0.29
0.39
0.49
0.59
0.69
0.79
0.89
Jan-13AJan-14AJan-15AJan-16A Jan-17F Jan-18F
P/BV vs ROE
Rolling P/BV (x) (lhs) ROE (rhs)
-7,800%-5,300%-2,800%-300%2,200%4,700%7,200%9,700%12,200%
0100200300400500600700800
Jan-13AJan-14AJan-15AJan-16AJan-17FJan-18F
12-mth Fwd FD Core P/E vs FD Core EPS Growth
12-mth Fwd Rolling FD Core P/E (x) (lhs)
FD Core EPS Growth (rhs)
Profit & Loss
(US$m) Dec-15A Dec-16A Dec-17F Dec-18F Dec-19FTotal Net Revenues 143.2 160.5 188.8 212.1 240.9Gross Profit 25.8 26.9 33.2 37.8 43.3Operating EBITDA 15.6 14.1 20.9 27.5 35.4Depreciation And Amortisation (7.9) (7.9) (10.6) (14.5) (19.6)Operating EBIT 7.7 6.2 10.3 12.9 15.8Financial Income/(Expense) 0.3 0.0 0.1 0.1 0.1Pretax Income/(Loss) from Assoc. (0.0) 0.0 0.0 0.0 0.0Non-Operating Income/(Expense) 0.0 0.0 0.0 0.0 0.0Profit Before Tax (pre-EI) 8.0 6.3 10.3 13.0 15.9Exceptional Items 0.7 0.8 0.0 0.0 0.0Pre-tax Profit 8.6 7.0 10.3 13.0 15.9Taxation (0.5) (0.6) (1.3) (1.9) (2.4)Exceptional Income - post-taxProfit After Tax 8.2 6.4 9.0 11.0 13.5Minority Interests 0.0 0.1 0.1 0.1 0.1Preferred DividendsFX Gain/(Loss) - post taxOther Adjustments - post-taxNet Profit 8.2 6.5 9.0 11.1 13.5Recurring Net Profit 7.6 5.8 9.0 11.1 13.5Fully Diluted Recurring Net Profit 7.6 5.8 9.0 11.1 13.5
Cash Flow
(US$m) Dec-15A Dec-16A Dec-17F Dec-18F Dec-19FEBITDA 15.57 14.15 20.88 27.46 35.43Cash Flow from Invt. & Assoc. 0.02 0.00 0.00 0.00 0.00Change In Working Capital (7.24) (1.02) (12.73) (9.07) (9.42)(Incr)/Decr in Total ProvisionsOther Non-Cash (Income)/ExpenseOther Operating Cashflow 0.36 1.65 0.00 0.00 0.00Net Interest (Paid)/Received 0.33 0.02 0.06 0.06 0.06Tax Paid (0.42) (0.36) (1.34) (1.95) (2.38)Cashflow From Operations 8.61 14.44 6.87 16.50 23.69Capex (7.61) (11.26) (12.00) (12.00) (12.00)Disposals Of FAs/subsidiariesAcq. Of Subsidiaries/investmentsOther Investing Cashflow 0.35 0.25 5.00 0.00 0.00Cash Flow From Investing (7.26) (11.01) (7.00) (12.00) (12.00)Debt Raised/(repaid) (1.11) 2.35 0.00 0.00 0.00Proceeds From Issue Of Shares 0.00 0.00 0.00 0.00 0.00Shares Repurchased (0.13) 0.00 0.00 0.00 0.00Dividends Paid (3.22) (3.47) (3.57) (4.39) (5.37)Preferred DividendsOther Financing Cashflow (0.65) (0.05) 0.00 0.00 0.00Cash Flow From Financing (5.11) (1.18) (3.57) (4.39) (5.37)Total Cash Generated (3.75) 2.25 (3.70) 0.10 6.32Free Cashflow To Equity 0.24 5.77 (0.13) 4.50 11.69Free Cashflow To Firm 1.45 3.57 (0.03) 4.60 11.79
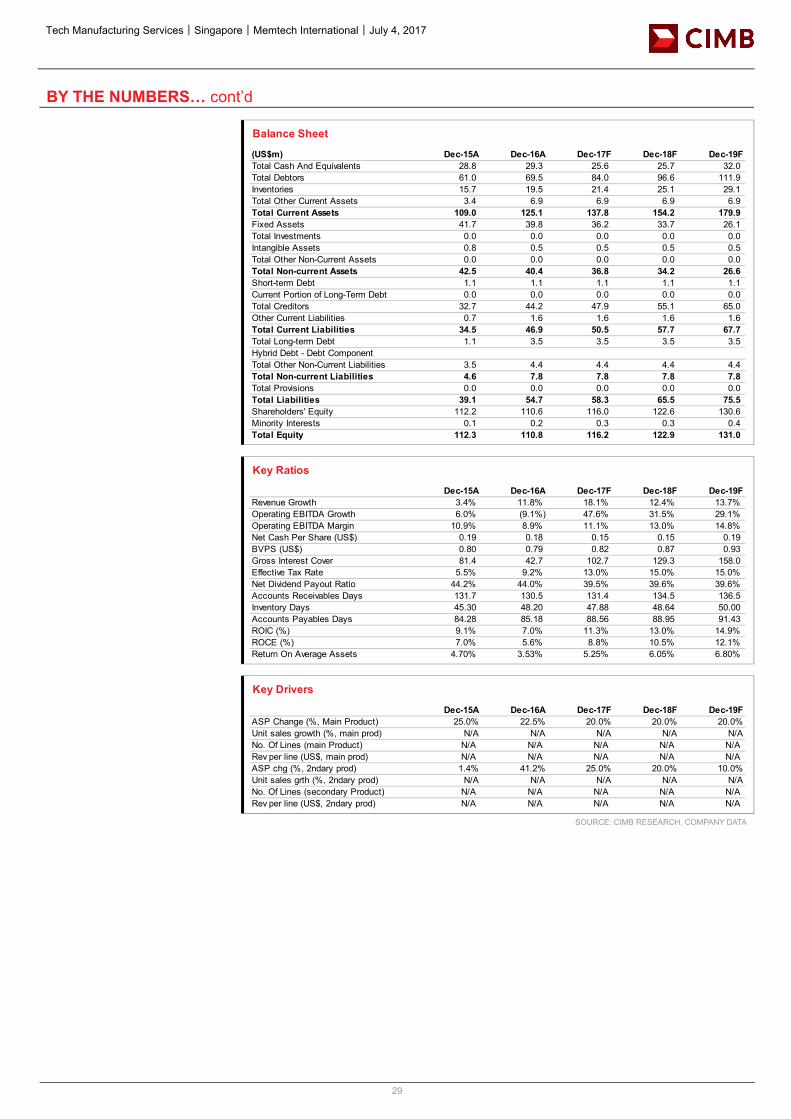
Tech Manufacturing Services│Singapore│Memtech International│July 4, 2017
29
BY THE NUMBERS… cont’d
SOURCE: CIMB RESEARCH, COMPANY DATA
Balance Sheet
(US$m) Dec-15A Dec-16A Dec-17F Dec-18F Dec-19FTotal Cash And Equivalents 28.8 29.3 25.6 25.7 32.0Total Debtors 61.0 69.5 84.0 96.6 111.9Inventories 15.7 19.5 21.4 25.1 29.1Total Other Current Assets 3.4 6.9 6.9 6.9 6.9Total Current Assets 109.0 125.1 137.8 154.2 179.9Fixed Assets 41.7 39.8 36.2 33.7 26.1Total Investments 0.0 0.0 0.0 0.0 0.0Intangible Assets 0.8 0.5 0.5 0.5 0.5Total Other Non-Current Assets 0.0 0.0 0.0 0.0 0.0Total Non-current Assets 42.5 40.4 36.8 34.2 26.6Short-term Debt 1.1 1.1 1.1 1.1 1.1Current Portion of Long-Term Debt 0.0 0.0 0.0 0.0 0.0Total Creditors 32.7 44.2 47.9 55.1 65.0Other Current Liabilities 0.7 1.6 1.6 1.6 1.6Total Current Liabilities 34.5 46.9 50.5 57.7 67.7Total Long-term Debt 1.1 3.5 3.5 3.5 3.5Hybrid Debt - Debt ComponentTotal Other Non-Current Liabilities 3.5 4.4 4.4 4.4 4.4Total Non-current Liabilities 4.6 7.8 7.8 7.8 7.8Total Provisions 0.0 0.0 0.0 0.0 0.0Total Liabilities 39.1 54.7 58.3 65.5 75.5Shareholders' Equity 112.2 110.6 116.0 122.6 130.6Minority Interests 0.1 0.2 0.3 0.3 0.4Total Equity 112.3 110.8 116.2 122.9 131.0
Key Ratios
Dec-15A Dec-16A Dec-17F Dec-18F Dec-19FRevenue Growth 3.4% 11.8% 18.1% 12.4% 13.7%Operating EBITDA Growth 6.0% (9.1%) 47.6% 31.5% 29.1%Operating EBITDA Margin 10.9% 8.9% 11.1% 13.0% 14.8%Net Cash Per Share (US$) 0.19 0.18 0.15 0.15 0.19BVPS (US$) 0.80 0.79 0.82 0.87 0.93Gross Interest Cover 81.4 42.7 102.7 129.3 158.0Effective Tax Rate 5.5% 9.2% 13.0% 15.0% 15.0%Net Dividend Payout Ratio 44.2% 44.0% 39.5% 39.6% 39.6%Accounts Receivables Days 131.7 130.5 131.4 134.5 136.5Inventory Days 45.30 48.20 47.88 48.64 50.00Accounts Payables Days 84.28 85.18 88.56 88.95 91.43ROIC (%) 9.1% 7.0% 11.3% 13.0% 14.9%ROCE (%) 7.0% 5.6% 8.8% 10.5% 12.1%Return On Average Assets 4.70% 3.53% 5.25% 6.05% 6.80%
Key Drivers
Dec-15A Dec-16A Dec-17F Dec-18F Dec-19FASP Change (%, Main Product) 25.0% 22.5% 20.0% 20.0% 20.0%Unit sales growth (%, main prod) N/A N/A N/A N/A N/ANo. Of Lines (main Product) N/A N/A N/A N/A N/ARev per line (US$, main prod) N/A N/A N/A N/A N/AASP chg (%, 2ndary prod) 1.4% 41.2% 25.0% 20.0% 10.0%Unit sales grth (%, 2ndary prod) N/A N/A N/A N/A N/ANo. Of Lines (secondary Product) N/A N/A N/A N/A N/ARev per line (US$, 2ndary prod) N/A N/A N/A N/A N/A
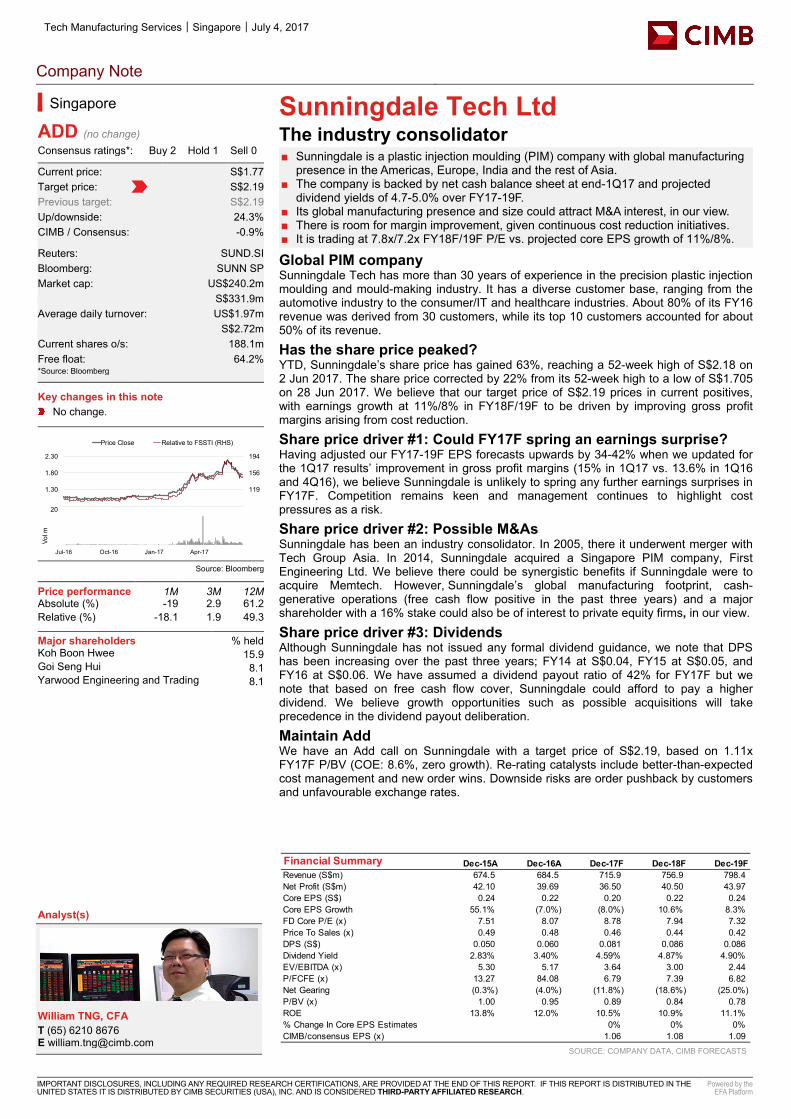
Tech Manufacturing Services│Singapore│July 4, 2017
Company Note
IMPORTANT DISCLOSURES, INCLUDING ANY REQUIRED RESEARCH CERTIFICATIONS, ARE PROVIDED AT THE END OF THIS REPORT. IF THIS REPORT IS DISTRIBUTED IN THE UNITED STATES IT IS DISTRIBUTED BY CIMB SECURITIES (USA), INC. AND IS CONSIDERED THIRD-PARTY AFFILIATED RESEARCH.
Powered by the EFA Platform
Sunningdale Tech Ltd The industry consolidator ■ Sunningdale is a plastic injection moulding (PIM) company with global manufacturing
presence in the Americas, Europe, India and the rest of Asia. ■ The company is backed by net cash balance sheet at end-1Q17 and projected
dividend yields of 4.7-5.0% over FY17-19F. ■ Its global manufacturing presence and size could attract M&A interest, in our view. ■ There is room for margin improvement, given continuous cost reduction initiatives. ■ It is trading at 7.8x/7.2x FY18F/19F P/E vs. projected core EPS growth of 11%/8%.
Global PIM company Sunningdale Tech has more than 30 years of experience in the precision plastic injection moulding and mould-making industry. It has a diverse customer base, ranging from the automotive industry to the consumer/IT and healthcare industries. About 80% of its FY16 revenue was derived from 30 customers, while its top 10 customers accounted for about 50% of its revenue.
Has the share price peaked? YTD, Sunningdale’s share price has gained 63%, reaching a 52-week high of S$2.18 on 2 Jun 2017. The share price corrected by 22% from its 52-week high to a low of S$1.705 on 28 Jun 2017. We believe that our target price of S$2.19 prices in current positives, with earnings growth at 11%/8% in FY18F/19F to be driven by improving gross profit margins arising from cost reduction.
Share price driver #1: Could FY17F spring an earnings surprise? Having adjusted our FY17-19F EPS forecasts upwards by 34-42% when we updated for the 1Q17 results’ improvement in gross profit margins (15% in 1Q17 vs. 13.6% in 1Q16 and 4Q16), we believe Sunningdale is unlikely to spring any further earnings surprises in FY17F. Competition remains keen and management continues to highlight cost pressures as a risk.
Share price driver #2: Possible M&As Sunningdale has been an industry consolidator. In 2005, there it underwent merger with Tech Group Asia. In 2014, Sunningdale acquired a Singapore PIM company, First Engineering Ltd. We believe there could be synergistic benefits if Sunningdale were to acquire Memtech. However, Sunningdale’s global manufacturing footprint, cash-generative operations (free cash flow positive in the past three years) and a major shareholder with a 16% stake could also be of interest to private equity firms, in our view.
Share price driver #3: Dividends Although Sunningdale has not issued any formal dividend guidance, we note that DPS has been increasing over the past three years; FY14 at S$0.04, FY15 at S$0.05, and FY16 at S$0.06. We have assumed a dividend payout ratio of 42% for FY17F but we note that based on free cash flow cover, Sunningdale could afford to pay a higher dividend. We believe growth opportunities such as possible acquisitions will take precedence in the dividend payout deliberation.
Maintain Add We have an Add call on Sunningdale with a target price of S$2.19, based on 1.11x FY17F P/BV (COE: 8.6%, zero growth). Re-rating catalysts include better-than-expected cost management and new order wins. Downside risks are order pushback by customers and unfavourable exchange rates.
SOURCE: COMPANY DATA, CIMB FORECASTS
Singapore
ADD (no change) Consensus ratings*: Buy 2 Hold 1 Sell 0
Current price: S$1.77 Target price: S$2.19 Previous target: S$2.19 Up/downside: 24.3% CIMB / Consensus: -0.9%
Reuters: SUND.SI Bloomberg: SUNN SP Market cap: US$240.2m S$331.9m Average daily turnover: US$1.97m S$2.72m Current shares o/s: 188.1m Free float: 64.2% *Source: Bloomberg Key changes in this note
No change.
Source: Bloomberg
Price performance 1M 3M 12M Absolute (%) -19 2.9 61.2 Relative (%) -18.1 1.9 49.3
Major shareholders % held Koh Boon Hwee 15.9 Goi Seng Hui 8.1 Yarwood Engineering and Trading 8.1
Analyst(s)
William TNG, CFA T (65) 6210 8676 E [email protected]
Financial Summary Dec-15A Dec-16A Dec-17F Dec-18F Dec-19FRevenue (S$m) 674.5 684.5 715.9 756.9 798.4Net Profit (S$m) 42.10 39.69 36.50 40.50 43.97Core EPS (S$) 0.24 0.22 0.20 0.22 0.24Core EPS Growth 55.1% (7.0%) (8.0%) 10.6% 8.3%FD Core P/E (x) 7.51 8.07 8.78 7.94 7.32Price To Sales (x) 0.49 0.48 0.46 0.44 0.42DPS (S$) 0.050 0.060 0.081 0.086 0.086Dividend Yield 2.83% 3.40% 4.59% 4.87% 4.90%EV/EBITDA (x) 5.30 5.17 3.64 3.00 2.44P/FCFE (x) 13.27 84.08 6.79 7.39 6.82Net Gearing (0.3%) (4.0%) (11.8%) (18.6%) (25.0%)P/BV (x) 1.00 0.95 0.89 0.84 0.78ROE 13.8% 12.0% 10.5% 10.9% 11.1%% Change In Core EPS Estimates 0% 0% 0%CIMB/consensus EPS (x) 1.06 1.08 1.09
81
119
156
194
0.80
1.30
1.80
2.30
Price Close Relative to FSSTI (RHS)
5101520
Jul-16 Oct-16 Jan-17 Apr-17
Vol m
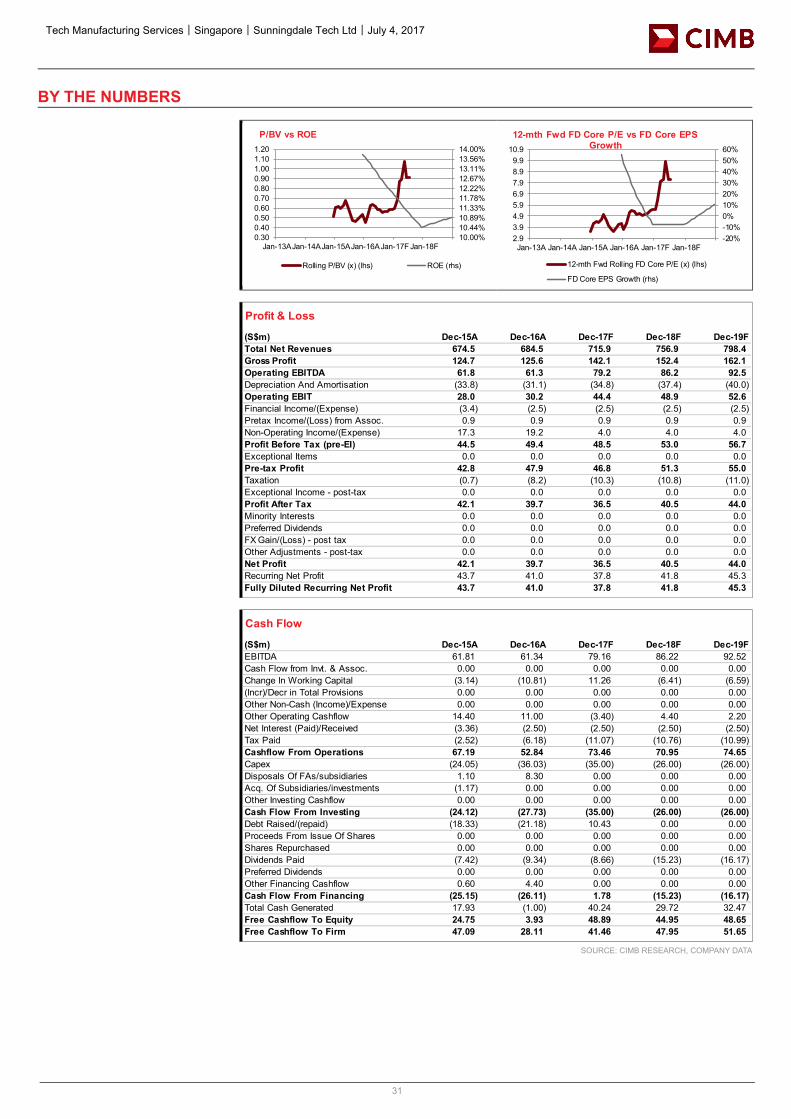
Tech Manufacturing Services│Singapore│Sunningdale Tech Ltd│July 4, 2017
31
BY THE NUMBERS
SOURCE: CIMB RESEARCH, COMPANY DATA
10.00%10.44%10.89%11.33%11.78%12.22%12.67%13.11%13.56%14.00%
0.300.400.500.600.700.800.901.001.101.20
Jan-13AJan-14AJan-15AJan-16AJan-17F Jan-18F
P/BV vs ROE
Rolling P/BV (x) (lhs) ROE (rhs)
-20%-10%0%10%20%30%40%50%60%
2.93.94.95.96.97.98.99.9
10.9
Jan-13A Jan-14A Jan-15A Jan-16A Jan-17F Jan-18F
12-mth Fwd FD Core P/E vs FD Core EPS Growth
12-mth Fwd Rolling FD Core P/E (x) (lhs)
FD Core EPS Growth (rhs)
Profit & Loss
(S$m) Dec-15A Dec-16A Dec-17F Dec-18F Dec-19FTotal Net Revenues 674.5 684.5 715.9 756.9 798.4Gross Profit 124.7 125.6 142.1 152.4 162.1Operating EBITDA 61.8 61.3 79.2 86.2 92.5Depreciation And Amortisation (33.8) (31.1) (34.8) (37.4) (40.0)Operating EBIT 28.0 30.2 44.4 48.9 52.6Financial Income/(Expense) (3.4) (2.5) (2.5) (2.5) (2.5)Pretax Income/(Loss) from Assoc. 0.9 0.9 0.9 0.9 0.9Non-Operating Income/(Expense) 17.3 19.2 4.0 4.0 4.0Profit Before Tax (pre-EI) 44.5 49.4 48.5 53.0 56.7Exceptional Items 0.0 0.0 0.0 0.0 0.0Pre-tax Profit 42.8 47.9 46.8 51.3 55.0Taxation (0.7) (8.2) (10.3) (10.8) (11.0)Exceptional Income - post-tax 0.0 0.0 0.0 0.0 0.0Profit After Tax 42.1 39.7 36.5 40.5 44.0Minority Interests 0.0 0.0 0.0 0.0 0.0Preferred Dividends 0.0 0.0 0.0 0.0 0.0FX Gain/(Loss) - post tax 0.0 0.0 0.0 0.0 0.0Other Adjustments - post-tax 0.0 0.0 0.0 0.0 0.0Net Profit 42.1 39.7 36.5 40.5 44.0Recurring Net Profit 43.7 41.0 37.8 41.8 45.3Fully Diluted Recurring Net Profit 43.7 41.0 37.8 41.8 45.3
Cash Flow
(S$m) Dec-15A Dec-16A Dec-17F Dec-18F Dec-19FEBITDA 61.81 61.34 79.16 86.22 92.52Cash Flow from Invt. & Assoc. 0.00 0.00 0.00 0.00 0.00Change In Working Capital (3.14) (10.81) 11.26 (6.41) (6.59)(Incr)/Decr in Total Provisions 0.00 0.00 0.00 0.00 0.00Other Non-Cash (Income)/Expense 0.00 0.00 0.00 0.00 0.00Other Operating Cashflow 14.40 11.00 (3.40) 4.40 2.20Net Interest (Paid)/Received (3.36) (2.50) (2.50) (2.50) (2.50)Tax Paid (2.52) (6.18) (11.07) (10.76) (10.99)Cashflow From Operations 67.19 52.84 73.46 70.95 74.65Capex (24.05) (36.03) (35.00) (26.00) (26.00)Disposals Of FAs/subsidiaries 1.10 8.30 0.00 0.00 0.00Acq. Of Subsidiaries/investments (1.17) 0.00 0.00 0.00 0.00Other Investing Cashflow 0.00 0.00 0.00 0.00 0.00Cash Flow From Investing (24.12) (27.73) (35.00) (26.00) (26.00)Debt Raised/(repaid) (18.33) (21.18) 10.43 0.00 0.00Proceeds From Issue Of Shares 0.00 0.00 0.00 0.00 0.00Shares Repurchased 0.00 0.00 0.00 0.00 0.00Dividends Paid (7.42) (9.34) (8.66) (15.23) (16.17)Preferred Dividends 0.00 0.00 0.00 0.00 0.00Other Financing Cashflow 0.60 4.40 0.00 0.00 0.00Cash Flow From Financing (25.15) (26.11) 1.78 (15.23) (16.17)Total Cash Generated 17.93 (1.00) 40.24 29.72 32.47Free Cashflow To Equity 24.75 3.93 48.89 44.95 48.65Free Cashflow To Firm 47.09 28.11 41.46 47.95 51.65
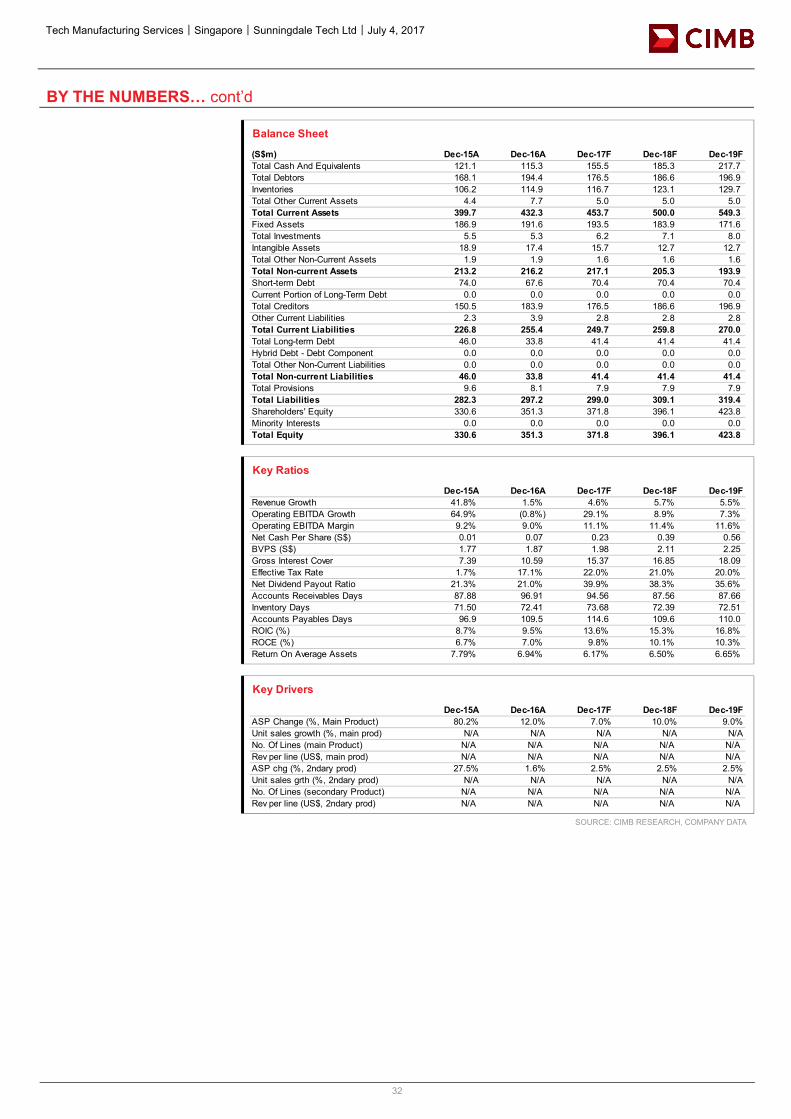
Tech Manufacturing Services│Singapore│Sunningdale Tech Ltd│July 4, 2017
32
BY THE NUMBERS… cont’d
SOURCE: CIMB RESEARCH, COMPANY DATA
Balance Sheet
(S$m) Dec-15A Dec-16A Dec-17F Dec-18F Dec-19FTotal Cash And Equivalents 121.1 115.3 155.5 185.3 217.7Total Debtors 168.1 194.4 176.5 186.6 196.9Inventories 106.2 114.9 116.7 123.1 129.7Total Other Current Assets 4.4 7.7 5.0 5.0 5.0Total Current Assets 399.7 432.3 453.7 500.0 549.3Fixed Assets 186.9 191.6 193.5 183.9 171.6Total Investments 5.5 5.3 6.2 7.1 8.0Intangible Assets 18.9 17.4 15.7 12.7 12.7Total Other Non-Current Assets 1.9 1.9 1.6 1.6 1.6Total Non-current Assets 213.2 216.2 217.1 205.3 193.9Short-term Debt 74.0 67.6 70.4 70.4 70.4Current Portion of Long-Term Debt 0.0 0.0 0.0 0.0 0.0Total Creditors 150.5 183.9 176.5 186.6 196.9Other Current Liabilities 2.3 3.9 2.8 2.8 2.8Total Current Liabilities 226.8 255.4 249.7 259.8 270.0Total Long-term Debt 46.0 33.8 41.4 41.4 41.4Hybrid Debt - Debt Component 0.0 0.0 0.0 0.0 0.0Total Other Non-Current Liabilities 0.0 0.0 0.0 0.0 0.0Total Non-current Liabilities 46.0 33.8 41.4 41.4 41.4Total Provisions 9.6 8.1 7.9 7.9 7.9Total Liabilities 282.3 297.2 299.0 309.1 319.4Shareholders' Equity 330.6 351.3 371.8 396.1 423.8Minority Interests 0.0 0.0 0.0 0.0 0.0Total Equity 330.6 351.3 371.8 396.1 423.8
Key Ratios
Dec-15A Dec-16A Dec-17F Dec-18F Dec-19FRevenue Growth 41.8% 1.5% 4.6% 5.7% 5.5%Operating EBITDA Growth 64.9% (0.8%) 29.1% 8.9% 7.3%Operating EBITDA Margin 9.2% 9.0% 11.1% 11.4% 11.6%Net Cash Per Share (S$) 0.01 0.07 0.23 0.39 0.56BVPS (S$) 1.77 1.87 1.98 2.11 2.25Gross Interest Cover 7.39 10.59 15.37 16.85 18.09Effective Tax Rate 1.7% 17.1% 22.0% 21.0% 20.0%Net Dividend Payout Ratio 21.3% 21.0% 39.9% 38.3% 35.6%Accounts Receivables Days 87.88 96.91 94.56 87.56 87.66Inventory Days 71.50 72.41 73.68 72.39 72.51Accounts Payables Days 96.9 109.5 114.6 109.6 110.0ROIC (%) 8.7% 9.5% 13.6% 15.3% 16.8%ROCE (%) 6.7% 7.0% 9.8% 10.1% 10.3%Return On Average Assets 7.79% 6.94% 6.17% 6.50% 6.65%
Key Drivers
Dec-15A Dec-16A Dec-17F Dec-18F Dec-19FASP Change (%, Main Product) 80.2% 12.0% 7.0% 10.0% 9.0%Unit sales growth (%, main prod) N/A N/A N/A N/A N/ANo. Of Lines (main Product) N/A N/A N/A N/A N/ARev per line (US$, main prod) N/A N/A N/A N/A N/AASP chg (%, 2ndary prod) 27.5% 1.6% 2.5% 2.5% 2.5%Unit sales grth (%, 2ndary prod) N/A N/A N/A N/A N/ANo. Of Lines (secondary Product) N/A N/A N/A N/A N/ARev per line (US$, 2ndary prod) N/A N/A N/A N/A N/A
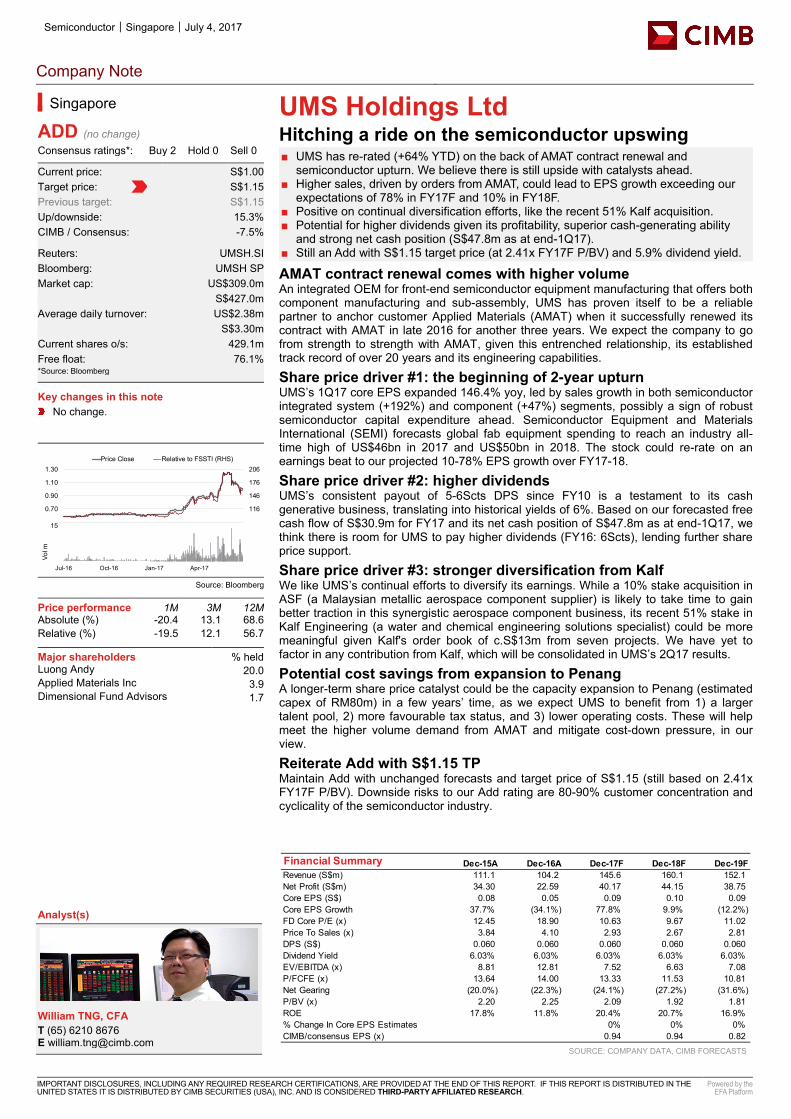
Semiconductor│Singapore│July 4, 2017
Company Note
IMPORTANT DISCLOSURES, INCLUDING ANY REQUIRED RESEARCH CERTIFICATIONS, ARE PROVIDED AT THE END OF THIS REPORT. IF THIS REPORT IS DISTRIBUTED IN THE UNITED STATES IT IS DISTRIBUTED BY CIMB SECURITIES (USA), INC. AND IS CONSIDERED THIRD-PARTY AFFILIATED RESEARCH.
Powered by the EFA Platform
UMS Holdings Ltd Hitching a ride on the semiconductor upswing ■ UMS has re-rated (+64% YTD) on the back of AMAT contract renewal and
semiconductor upturn. We believe there is still upside with catalysts ahead. ■ Higher sales, driven by orders from AMAT, could lead to EPS growth exceeding our
expectations of 78% in FY17F and 10% in FY18F. ■ Positive on continual diversification efforts, like the recent 51% Kalf acquisition. ■ Potential for higher dividends given its profitability, superior cash-generating ability
and strong net cash position (S$47.8m as at end-1Q17). ■ Still an Add with S$1.15 target price (at 2.41x FY17F P/BV) and 5.9% dividend yield.
AMAT contract renewal comes with higher volume An integrated OEM for front-end semiconductor equipment manufacturing that offers both component manufacturing and sub-assembly, UMS has proven itself to be a reliable partner to anchor customer Applied Materials (AMAT) when it successfully renewed its contract with AMAT in late 2016 for another three years. We expect the company to go from strength to strength with AMAT, given this entrenched relationship, its established track record of over 20 years and its engineering capabilities.
Share price driver #1: the beginning of 2-year upturn UMS’s 1Q17 core EPS expanded 146.4% yoy, led by sales growth in both semiconductor integrated system (+192%) and component (+47%) segments, possibly a sign of robust semiconductor capital expenditure ahead. Semiconductor Equipment and Materials International (SEMI) forecasts global fab equipment spending to reach an industry all-time high of US$46bn in 2017 and US$50bn in 2018. The stock could re-rate on an earnings beat to our projected 10-78% EPS growth over FY17-18.
Share price driver #2: higher dividends UMS’s consistent payout of 5-6Scts DPS since FY10 is a testament to its cash generative business, translating into historical yields of 6%. Based on our forecasted free cash flow of S$30.9m for FY17 and its net cash position of S$47.8m as at end-1Q17, we think there is room for UMS to pay higher dividends (FY16: 6Scts), lending further share price support.
Share price driver #3: stronger diversification from Kalf We like UMS’s continual efforts to diversify its earnings. While a 10% stake acquisition in ASF (a Malaysian metallic aerospace component supplier) is likely to take time to gain better traction in this synergistic aerospace component business, its recent 51% stake in Kalf Engineering (a water and chemical engineering solutions specialist) could be more meaningful given Kalf's order book of c.S$13m from seven projects. We have yet to factor in any contribution from Kalf, which will be consolidated in UMS’s 2Q17 results.
Potential cost savings from expansion to Penang A longer-term share price catalyst could be the capacity expansion to Penang (estimated capex of RM80m) in a few years’ time, as we expect UMS to benefit from 1) a larger talent pool, 2) more favourable tax status, and 3) lower operating costs. These will help meet the higher volume demand from AMAT and mitigate cost-down pressure, in our view.
Reiterate Add with S$1.15 TP Maintain Add with unchanged forecasts and target price of S$1.15 (still based on 2.41x FY17F P/BV). Downside risks to our Add rating are 80-90% customer concentration and cyclicality of the semiconductor industry.
SOURCE: COMPANY DATA, CIMB FORECASTS
Singapore
ADD (no change) Consensus ratings*: Buy 2 Hold 0 Sell 0
Current price: S$1.00 Target price: S$1.15 Previous target: S$1.15 Up/downside: 15.3% CIMB / Consensus: -7.5%
Reuters: UMSH.SI Bloomberg: UMSH SP Market cap: US$309.0m S$427.0m Average daily turnover: US$2.38m S$3.30m Current shares o/s: 429.1m Free float: 76.1% *Source: Bloomberg Key changes in this note
No change.
Source: Bloomberg
Price performance 1M 3M 12M Absolute (%) -20.4 13.1 68.6 Relative (%) -19.5 12.1 56.7
Major shareholders % held Luong Andy 20.0 Applied Materials Inc 3.9 Dimensional Fund Advisors 1.7
Analyst(s)
William TNG, CFA T (65) 6210 8676 E [email protected]
Financial Summary Dec-15A Dec-16A Dec-17F Dec-18F Dec-19FRevenue (S$m) 111.1 104.2 145.6 160.1 152.1Net Profit (S$m) 34.30 22.59 40.17 44.15 38.75Core EPS (S$) 0.08 0.05 0.09 0.10 0.09Core EPS Growth 37.7% (34.1%) 77.8% 9.9% (12.2%)FD Core P/E (x) 12.45 18.90 10.63 9.67 11.02Price To Sales (x) 3.84 4.10 2.93 2.67 2.81DPS (S$) 0.060 0.060 0.060 0.060 0.060Dividend Yield 6.03% 6.03% 6.03% 6.03% 6.03%EV/EBITDA (x) 8.81 12.81 7.52 6.63 7.08P/FCFE (x) 13.64 14.00 13.33 11.53 10.81Net Gearing (20.0%) (22.3%) (24.1%) (27.2%) (31.6%)P/BV (x) 2.20 2.25 2.09 1.92 1.81ROE 17.8% 11.8% 20.4% 20.7% 16.9%% Change In Core EPS Estimates 0% 0% 0%CIMB/consensus EPS (x) 0.94 0.94 0.82
86
116
146
176
206
0.50
0.70
0.90
1.10
1.30Price Close Relative to FSSTI (RHS)
5
10
15
Jul-16 Oct-16 Jan-17 Apr-17
Vol m
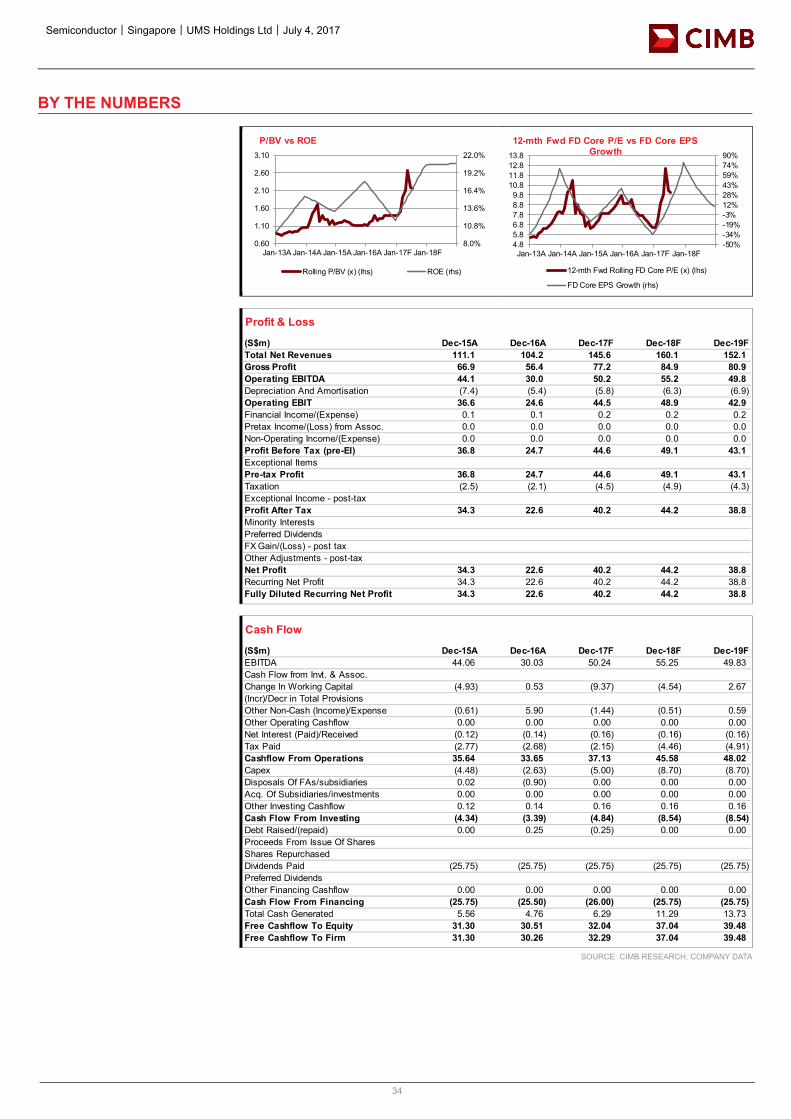
Semiconductor│Singapore│UMS Holdings Ltd│July 4, 2017
34
BY THE NUMBERS
SOURCE: CIMB RESEARCH, COMPANY DATA
8.0%
10.8%
13.6%
16.4%
19.2%
22.0%
0.60
1.10
1.60
2.10
2.60
3.10
Jan-13A Jan-14A Jan-15A Jan-16A Jan-17F Jan-18F
P/BV vs ROE
Rolling P/BV (x) (lhs) ROE (rhs)
-50%-34%-19%-3%12%28%43%59%74%90%
4.85.86.87.88.89.8
10.811.812.813.8
Jan-13A Jan-14A Jan-15A Jan-16A Jan-17F Jan-18F
12-mth Fwd FD Core P/E vs FD Core EPS Growth
12-mth Fwd Rolling FD Core P/E (x) (lhs)
FD Core EPS Growth (rhs)
Profit & Loss
(S$m) Dec-15A Dec-16A Dec-17F Dec-18F Dec-19FTotal Net Revenues 111.1 104.2 145.6 160.1 152.1Gross Profit 66.9 56.4 77.2 84.9 80.9Operating EBITDA 44.1 30.0 50.2 55.2 49.8Depreciation And Amortisation (7.4) (5.4) (5.8) (6.3) (6.9)Operating EBIT 36.6 24.6 44.5 48.9 42.9Financial Income/(Expense) 0.1 0.1 0.2 0.2 0.2Pretax Income/(Loss) from Assoc. 0.0 0.0 0.0 0.0 0.0Non-Operating Income/(Expense) 0.0 0.0 0.0 0.0 0.0Profit Before Tax (pre-EI) 36.8 24.7 44.6 49.1 43.1Exceptional ItemsPre-tax Profit 36.8 24.7 44.6 49.1 43.1Taxation (2.5) (2.1) (4.5) (4.9) (4.3)Exceptional Income - post-taxProfit After Tax 34.3 22.6 40.2 44.2 38.8Minority InterestsPreferred DividendsFX Gain/(Loss) - post taxOther Adjustments - post-taxNet Profit 34.3 22.6 40.2 44.2 38.8Recurring Net Profit 34.3 22.6 40.2 44.2 38.8Fully Diluted Recurring Net Profit 34.3 22.6 40.2 44.2 38.8
Cash Flow
(S$m) Dec-15A Dec-16A Dec-17F Dec-18F Dec-19FEBITDA 44.06 30.03 50.24 55.25 49.83Cash Flow from Invt. & Assoc.Change In Working Capital (4.93) 0.53 (9.37) (4.54) 2.67(Incr)/Decr in Total ProvisionsOther Non-Cash (Income)/Expense (0.61) 5.90 (1.44) (0.51) 0.59Other Operating Cashflow 0.00 0.00 0.00 0.00 0.00Net Interest (Paid)/Received (0.12) (0.14) (0.16) (0.16) (0.16)Tax Paid (2.77) (2.68) (2.15) (4.46) (4.91)Cashflow From Operations 35.64 33.65 37.13 45.58 48.02Capex (4.48) (2.63) (5.00) (8.70) (8.70)Disposals Of FAs/subsidiaries 0.02 (0.90) 0.00 0.00 0.00Acq. Of Subsidiaries/investments 0.00 0.00 0.00 0.00 0.00Other Investing Cashflow 0.12 0.14 0.16 0.16 0.16Cash Flow From Investing (4.34) (3.39) (4.84) (8.54) (8.54)Debt Raised/(repaid) 0.00 0.25 (0.25) 0.00 0.00Proceeds From Issue Of SharesShares RepurchasedDividends Paid (25.75) (25.75) (25.75) (25.75) (25.75)Preferred DividendsOther Financing Cashflow 0.00 0.00 0.00 0.00 0.00Cash Flow From Financing (25.75) (25.50) (26.00) (25.75) (25.75)Total Cash Generated 5.56 4.76 6.29 11.29 13.73Free Cashflow To Equity 31.30 30.51 32.04 37.04 39.48Free Cashflow To Firm 31.30 30.26 32.29 37.04 39.48
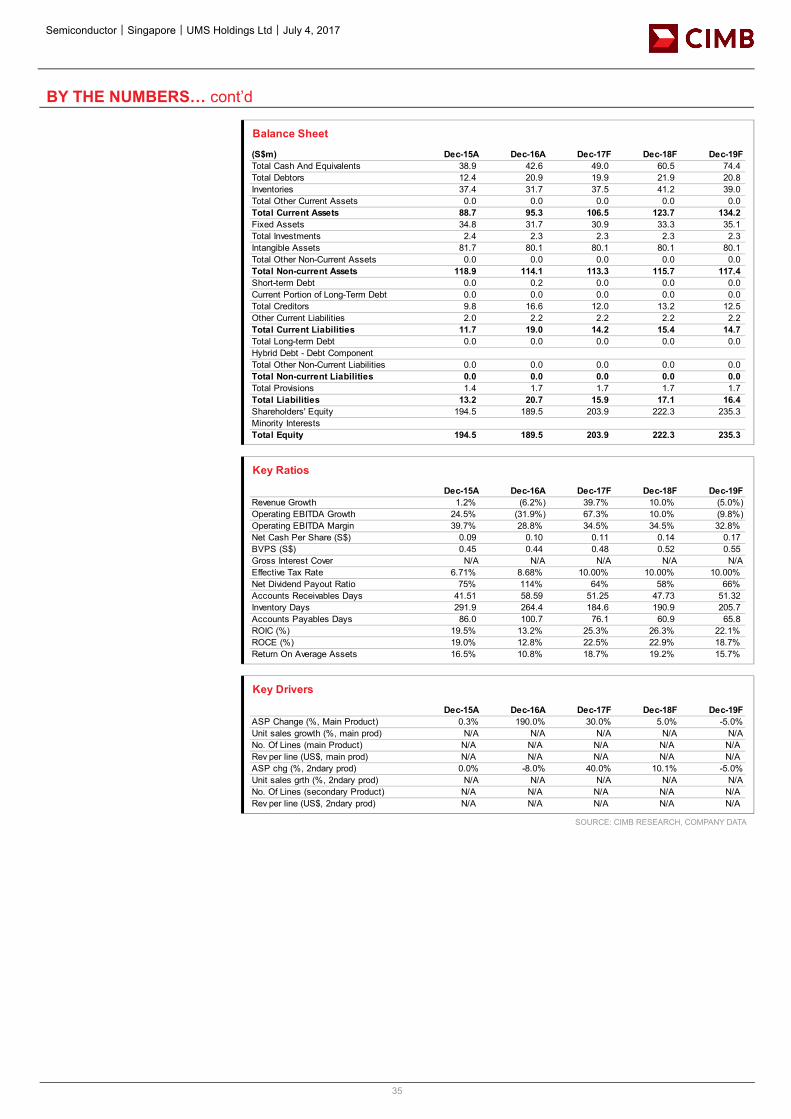
Semiconductor│Singapore│UMS Holdings Ltd│July 4, 2017
35
BY THE NUMBERS… cont’d
SOURCE: CIMB RESEARCH, COMPANY DATA
Balance Sheet
(S$m) Dec-15A Dec-16A Dec-17F Dec-18F Dec-19FTotal Cash And Equivalents 38.9 42.6 49.0 60.5 74.4Total Debtors 12.4 20.9 19.9 21.9 20.8Inventories 37.4 31.7 37.5 41.2 39.0Total Other Current Assets 0.0 0.0 0.0 0.0 0.0Total Current Assets 88.7 95.3 106.5 123.7 134.2Fixed Assets 34.8 31.7 30.9 33.3 35.1Total Investments 2.4 2.3 2.3 2.3 2.3Intangible Assets 81.7 80.1 80.1 80.1 80.1Total Other Non-Current Assets 0.0 0.0 0.0 0.0 0.0Total Non-current Assets 118.9 114.1 113.3 115.7 117.4Short-term Debt 0.0 0.2 0.0 0.0 0.0Current Portion of Long-Term Debt 0.0 0.0 0.0 0.0 0.0Total Creditors 9.8 16.6 12.0 13.2 12.5Other Current Liabilities 2.0 2.2 2.2 2.2 2.2Total Current Liabilities 11.7 19.0 14.2 15.4 14.7Total Long-term Debt 0.0 0.0 0.0 0.0 0.0Hybrid Debt - Debt ComponentTotal Other Non-Current Liabilities 0.0 0.0 0.0 0.0 0.0Total Non-current Liabilities 0.0 0.0 0.0 0.0 0.0Total Provisions 1.4 1.7 1.7 1.7 1.7Total Liabilities 13.2 20.7 15.9 17.1 16.4Shareholders' Equity 194.5 189.5 203.9 222.3 235.3Minority InterestsTotal Equity 194.5 189.5 203.9 222.3 235.3
Key Ratios
Dec-15A Dec-16A Dec-17F Dec-18F Dec-19FRevenue Growth 1.2% (6.2%) 39.7% 10.0% (5.0%)Operating EBITDA Growth 24.5% (31.9%) 67.3% 10.0% (9.8%)Operating EBITDA Margin 39.7% 28.8% 34.5% 34.5% 32.8%Net Cash Per Share (S$) 0.09 0.10 0.11 0.14 0.17BVPS (S$) 0.45 0.44 0.48 0.52 0.55Gross Interest Cover N/A N/A N/A N/A N/AEffective Tax Rate 6.71% 8.68% 10.00% 10.00% 10.00%Net Dividend Payout Ratio 75% 114% 64% 58% 66%Accounts Receivables Days 41.51 58.59 51.25 47.73 51.32Inventory Days 291.9 264.4 184.6 190.9 205.7Accounts Payables Days 86.0 100.7 76.1 60.9 65.8ROIC (%) 19.5% 13.2% 25.3% 26.3% 22.1%ROCE (%) 19.0% 12.8% 22.5% 22.9% 18.7%Return On Average Assets 16.5% 10.8% 18.7% 19.2% 15.7%
Key Drivers
Dec-15A Dec-16A Dec-17F Dec-18F Dec-19FASP Change (%, Main Product) 0.3% 190.0% 30.0% 5.0% -5.0%Unit sales growth (%, main prod) N/A N/A N/A N/A N/ANo. Of Lines (main Product) N/A N/A N/A N/A N/ARev per line (US$, main prod) N/A N/A N/A N/A N/AASP chg (%, 2ndary prod) 0.0% -8.0% 40.0% 10.1% -5.0%Unit sales grth (%, 2ndary prod) N/A N/A N/A N/A N/ANo. Of Lines (secondary Product) N/A N/A N/A N/A N/ARev per line (US$, 2ndary prod) N/A N/A N/A N/A N/A
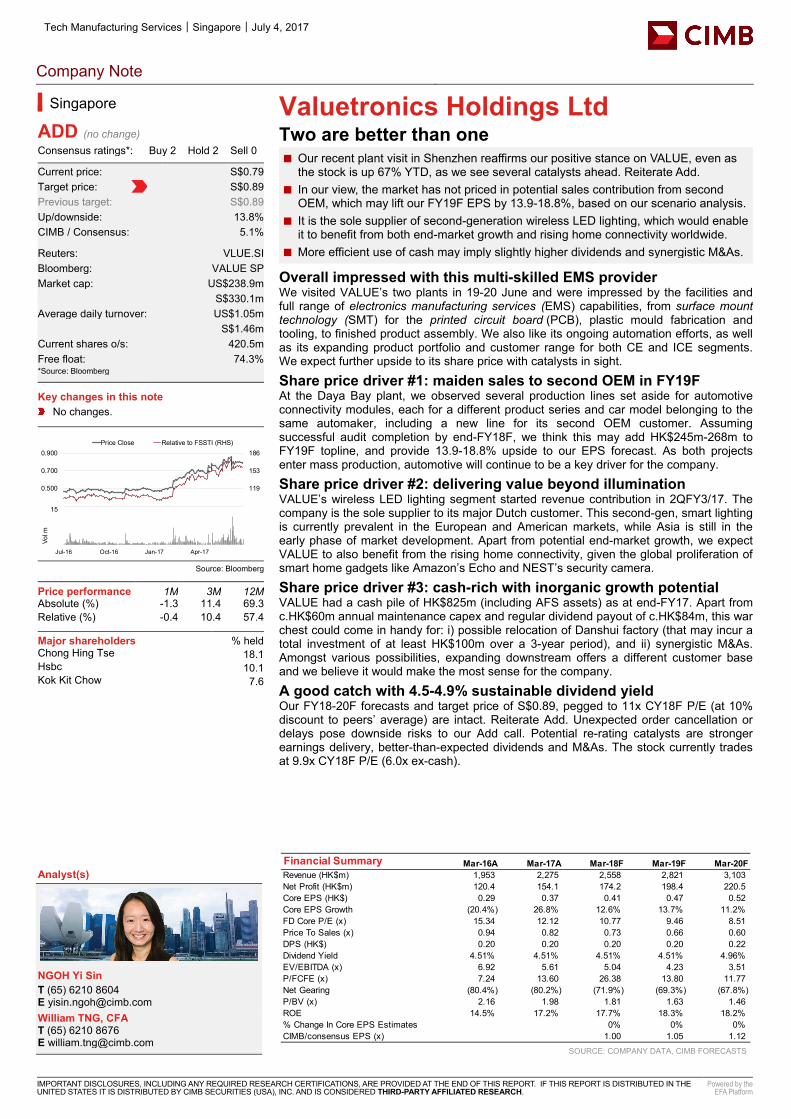
Tech Manufacturing Services│Singapore│July 4, 2017
Company Note
IMPORTANT DISCLOSURES, INCLUDING ANY REQUIRED RESEARCH CERTIFICATIONS, ARE PROVIDED AT THE END OF THIS REPORT. IF THIS REPORT IS DISTRIBUTED IN THE UNITED STATES IT IS DISTRIBUTED BY CIMB SECURITIES (USA), INC. AND IS CONSIDERED THIRD-PARTY AFFILIATED RESEARCH.
Powered by the EFA Platform
Valuetronics Holdings Ltd Two are better than one ■ Our recent plant visit in Shenzhen reaffirms our positive stance on VALUE, even as
the stock is up 67% YTD, as we see several catalysts ahead. Reiterate Add. ■ In our view, the market has not priced in potential sales contribution from second
OEM, which may lift our FY19F EPS by 13.9-18.8%, based on our scenario analysis. ■ It is the sole supplier of second-generation wireless LED lighting, which would enable
it to benefit from both end-market growth and rising home connectivity worldwide. ■ More efficient use of cash may imply slightly higher dividends and synergistic M&As.
Overall impressed with this multi-skilled EMS provider We visited VALUE’s two plants in 19-20 June and were impressed by the facilities and full range of electronics manufacturing services (EMS) capabilities, from surface mount technology (SMT) for the printed circuit board (PCB), plastic mould fabrication and tooling, to finished product assembly. We also like its ongoing automation efforts, as well as its expanding product portfolio and customer range for both CE and ICE segments. We expect further upside to its share price with catalysts in sight.
Share price driver #1: maiden sales to second OEM in FY19F At the Daya Bay plant, we observed several production lines set aside for automotive connectivity modules, each for a different product series and car model belonging to the same automaker, including a new line for its second OEM customer. Assuming successful audit completion by end-FY18F, we think this may add HK$245m-268m to FY19F topline, and provide 13.9-18.8% upside to our EPS forecast. As both projects enter mass production, automotive will continue to be a key driver for the company.
Share price driver #2: delivering value beyond illumination VALUE’s wireless LED lighting segment started revenue contribution in 2QFY3/17. The company is the sole supplier to its major Dutch customer. This second-gen, smart lighting is currently prevalent in the European and American markets, while Asia is still in the early phase of market development. Apart from potential end-market growth, we expect VALUE to also benefit from the rising home connectivity, given the global proliferation of smart home gadgets like Amazon’s Echo and NEST’s security camera.
Share price driver #3: cash-rich with inorganic growth potential VALUE had a cash pile of HK$825m (including AFS assets) as at end-FY17. Apart from c.HK$60m annual maintenance capex and regular dividend payout of c.HK$84m, this war chest could come in handy for: i) possible relocation of Danshui factory (that may incur a total investment of at least HK$100m over a 3-year period), and ii) synergistic M&As. Amongst various possibilities, expanding downstream offers a different customer base and we believe it would make the most sense for the company.
A good catch with 4.5-4.9% sustainable dividend yield Our FY18-20F forecasts and target price of S$0.89, pegged to 11x CY18F P/E (at 10% discount to peers’ average) are intact. Reiterate Add. Unexpected order cancellation or delays pose downside risks to our Add call. Potential re-rating catalysts are stronger earnings delivery, better-than-expected dividends and M&As. The stock currently trades at 9.9x CY18F P/E (6.0x ex-cash).
SOURCE: COMPANY DATA, CIMB FORECASTS
Singapore
ADD (no change) Consensus ratings*: Buy 2 Hold 2 Sell 0
Current price: S$0.79 Target price: S$0.89 Previous target: S$0.89 Up/downside: 13.8% CIMB / Consensus: 5.1%
Reuters: VLUE.SI Bloomberg: VALUE SP Market cap: US$238.9m S$330.1m Average daily turnover: US$1.05m S$1.46m Current shares o/s: 420.5m Free float: 74.3% *Source: Bloomberg Key changes in this note
No changes.
Source: Bloomberg
Price performance 1M 3M 12M Absolute (%) -1.3 11.4 69.3 Relative (%) -0.4 10.4 57.4
Major shareholders % held Chong Hing Tse 18.1 Hsbc 10.1 Kok Kit Chow 7.6
Analyst(s)
NGOH Yi Sin T (65) 6210 8604 E [email protected] William TNG, CFA T (65) 6210 8676 E [email protected]
Financial Summary Mar-16A Mar-17A Mar-18F Mar-19F Mar-20FRevenue (HK$m) 1,953 2,275 2,558 2,821 3,103Net Profit (HK$m) 120.4 154.1 174.2 198.4 220.5Core EPS (HK$) 0.29 0.37 0.41 0.47 0.52Core EPS Growth (20.4%) 26.8% 12.6% 13.7% 11.2%FD Core P/E (x) 15.34 12.12 10.77 9.46 8.51Price To Sales (x) 0.94 0.82 0.73 0.66 0.60DPS (HK$) 0.20 0.20 0.20 0.20 0.22Dividend Yield 4.51% 4.51% 4.51% 4.51% 4.96%EV/EBITDA (x) 6.92 5.61 5.04 4.23 3.51P/FCFE (x) 7.24 13.60 26.38 13.80 11.77Net Gearing (80.4%) (80.2%) (71.9%) (69.3%) (67.8%)P/BV (x) 2.16 1.98 1.81 1.63 1.46ROE 14.5% 17.2% 17.7% 18.3% 18.2%% Change In Core EPS Estimates 0% 0% 0%CIMB/consensus EPS (x) 1.00 1.05 1.12
86
119
153
186
0.300
0.500
0.700
0.900Price Close Relative to FSSTI (RHS)
5
10
15
Jul-16 Oct-16 Jan-17 Apr-17
Vol m
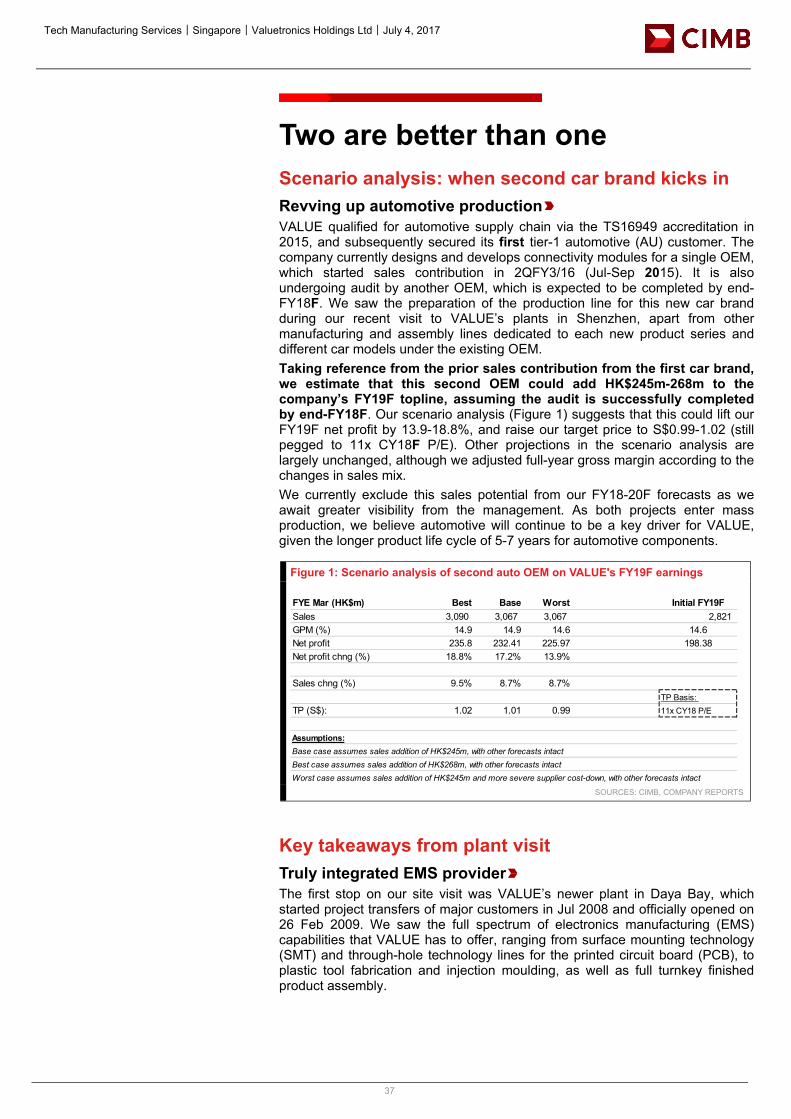
Tech Manufacturing Services│Singapore│Valuetronics Holdings Ltd│July 4, 2017
37
Two are better than one Scenario analysis: when second car brand kicks in Revving up automotive production VALUE qualified for automotive supply chain via the TS16949 accreditation in 2015, and subsequently secured its first tier-1 automotive (AU) customer. The company currently designs and develops connectivity modules for a single OEM, which started sales contribution in 2QFY3/16 (Jul-Sep 2015). It is also undergoing audit by another OEM, which is expected to be completed by end-FY18F. We saw the preparation of the production line for this new car brand during our recent visit to VALUE’s plants in Shenzhen, apart from other manufacturing and assembly lines dedicated to each new product series and different car models under the existing OEM. Taking reference from the prior sales contribution from the first car brand, we estimate that this second OEM could add HK$245m-268m to the company’s FY19F topline, assuming the audit is successfully completed by end-FY18F. Our scenario analysis (Figure 1) suggests that this could lift our FY19F net profit by 13.9-18.8%, and raise our target price to S$0.99-1.02 (still pegged to 11x CY18F P/E). Other projections in the scenario analysis are largely unchanged, although we adjusted full-year gross margin according to the changes in sales mix. We currently exclude this sales potential from our FY18-20F forecasts as we await greater visibility from the management. As both projects enter mass production, we believe automotive will continue to be a key driver for VALUE, given the longer product life cycle of 5-7 years for automotive components.
Figure 1: Scenario analysis of second auto OEM on VALUE's FY19F earnings
SOURCES: CIMB, COMPANY REPORTS
Key takeaways from plant visit Truly integrated EMS provider The first stop on our site visit was VALUE’s newer plant in Daya Bay, which started project transfers of major customers in Jul 2008 and officially opened on 26 Feb 2009. We saw the full spectrum of electronics manufacturing (EMS) capabilities that VALUE has to offer, ranging from surface mounting technology (SMT) and through-hole technology lines for the printed circuit board (PCB), to plastic tool fabrication and injection moulding, as well as full turnkey finished product assembly.
FYE Mar (HK$m) Best Base Worst Initial FY19FSales 3,090 3,067 3,067 2,821 GPM (%) 14.9 14.9 14.6 14.6Net profit 235.8 232.41 225.97 198.38Net profit chng (%) 18.8% 17.2% 13.9%
Sales chng (%) 9.5% 8.7% 8.7%TP Basis:
TP (S$): 1.02 1.01 0.99 11x CY18 P/E
Assumptions:Base case assumes sales addition of HK$245m, with other forecasts intactBest case assumes sales addition of HK$268m, with other forecasts intactWorst case assumes sales addition of HK$245m and more severe supplier cost-down, with other forecasts intact
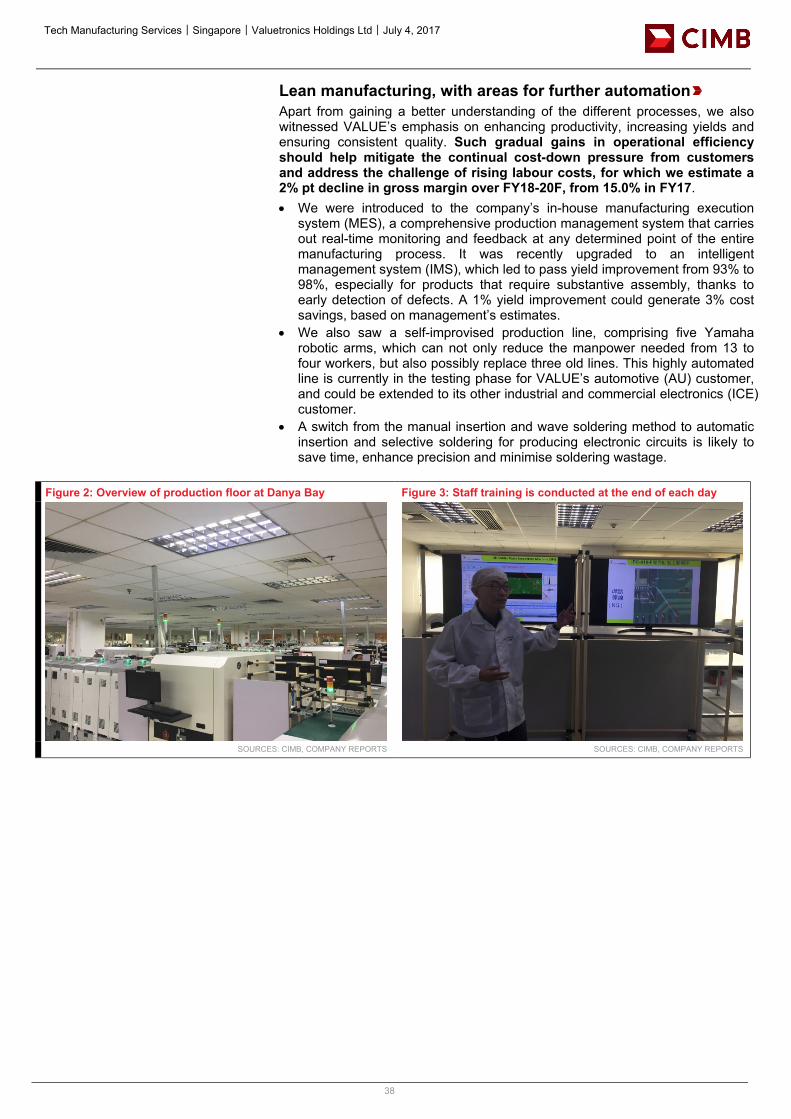
Tech Manufacturing Services│Singapore│Valuetronics Holdings Ltd│July 4, 2017
38
Lean manufacturing, with areas for further automation Apart from gaining a better understanding of the different processes, we also witnessed VALUE’s emphasis on enhancing productivity, increasing yields and ensuring consistent quality. Such gradual gains in operational efficiency should help mitigate the continual cost-down pressure from customers and address the challenge of rising labour costs, for which we estimate a 2% pt decline in gross margin over FY18-20F, from 15.0% in FY17. • We were introduced to the company’s in-house manufacturing execution
system (MES), a comprehensive production management system that carries out real-time monitoring and feedback at any determined point of the entire manufacturing process. It was recently upgraded to an intelligent management system (IMS), which led to pass yield improvement from 93% to 98%, especially for products that require substantive assembly, thanks to early detection of defects. A 1% yield improvement could generate 3% cost savings, based on management’s estimates.
• We also saw a self-improvised production line, comprising five Yamaha robotic arms, which can not only reduce the manpower needed from 13 to four workers, but also possibly replace three old lines. This highly automated line is currently in the testing phase for VALUE’s automotive (AU) customer, and could be extended to its other industrial and commercial electronics (ICE) customer.
• A switch from the manual insertion and wave soldering method to automatic insertion and selective soldering for producing electronic circuits is likely to save time, enhance precision and minimise soldering wastage.
Figure 2: Overview of production floor at Danya Bay Figure 3: Staff training is conducted at the end of each day
SOURCES: CIMB, COMPANY REPORTS SOURCES: CIMB, COMPANY REPORTS
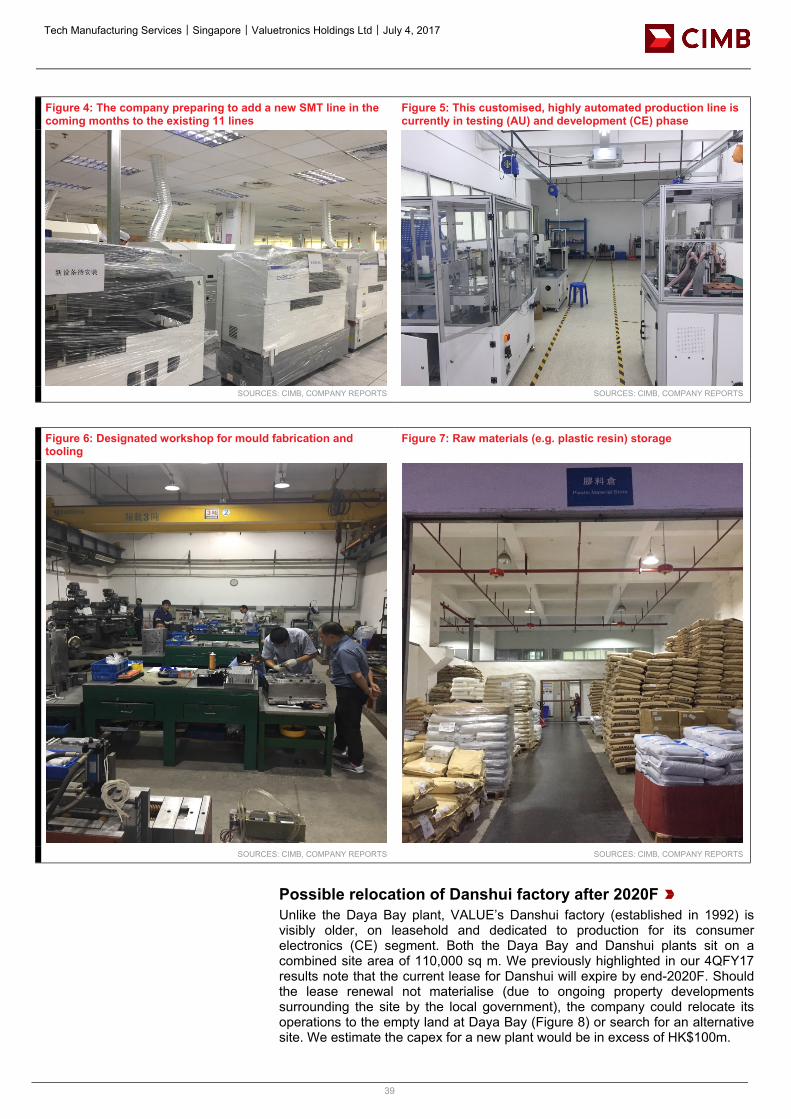
Tech Manufacturing Services│Singapore│Valuetronics Holdings Ltd│July 4, 2017
39
Figure 4: The company preparing to add a new SMT line in the coming months to the existing 11 lines
Figure 5: This customised, highly automated production line is currently in testing (AU) and development (CE) phase
SOURCES: CIMB, COMPANY REPORTS SOURCES: CIMB, COMPANY REPORTS
Figure 6: Designated workshop for mould fabrication and tooling
Figure 7: Raw materials (e.g. plastic resin) storage
SOURCES: CIMB, COMPANY REPORTS SOURCES: CIMB, COMPANY REPORTS
Possible relocation of Danshui factory after 2020F Unlike the Daya Bay plant, VALUE’s Danshui factory (established in 1992) is visibly older, on leasehold and dedicated to production for its consumer electronics (CE) segment. Both the Daya Bay and Danshui plants sit on a combined site area of 110,000 sq m. We previously highlighted in our 4QFY17 results note that the current lease for Danshui will expire by end-2020F. Should the lease renewal not materialise (due to ongoing property developments surrounding the site by the local government), the company could relocate its operations to the empty land at Daya Bay (Figure 8) or search for an alternative site. We estimate the capex for a new plant would be in excess of HK$100m.
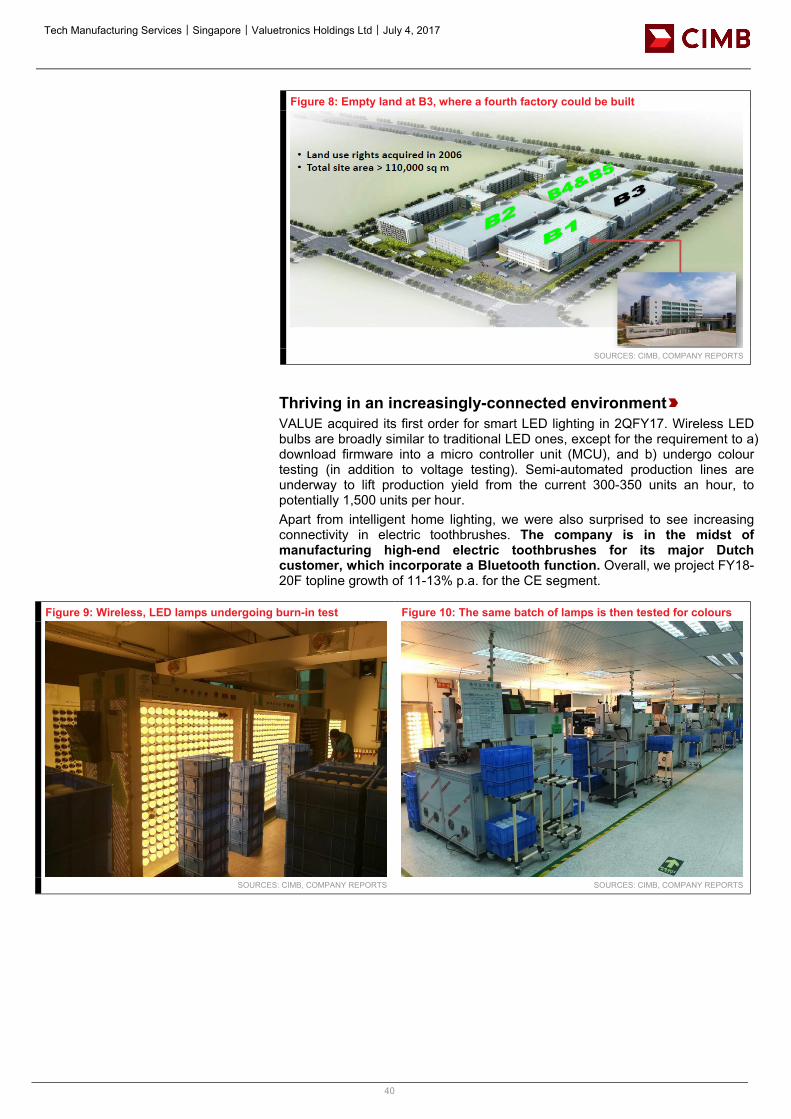
Tech Manufacturing Services│Singapore│Valuetronics Holdings Ltd│July 4, 2017
40
Figure 8: Empty land at B3, where a fourth factory could be built
SOURCES: CIMB, COMPANY REPORTS
Thriving in an increasingly-connected environment VALUE acquired its first order for smart LED lighting in 2QFY17. Wireless LED bulbs are broadly similar to traditional LED ones, except for the requirement to a) download firmware into a micro controller unit (MCU), and b) undergo colour testing (in addition to voltage testing). Semi-automated production lines are underway to lift production yield from the current 300-350 units an hour, to potentially 1,500 units per hour. Apart from intelligent home lighting, we were also surprised to see increasing connectivity in electric toothbrushes. The company is in the midst of manufacturing high-end electric toothbrushes for its major Dutch customer, which incorporate a Bluetooth function. Overall, we project FY18-20F topline growth of 11-13% p.a. for the CE segment.
Figure 9: Wireless, LED lamps undergoing burn-in test Figure 10: The same batch of lamps is then tested for colours
SOURCES: CIMB, COMPANY REPORTS SOURCES: CIMB, COMPANY REPORTS
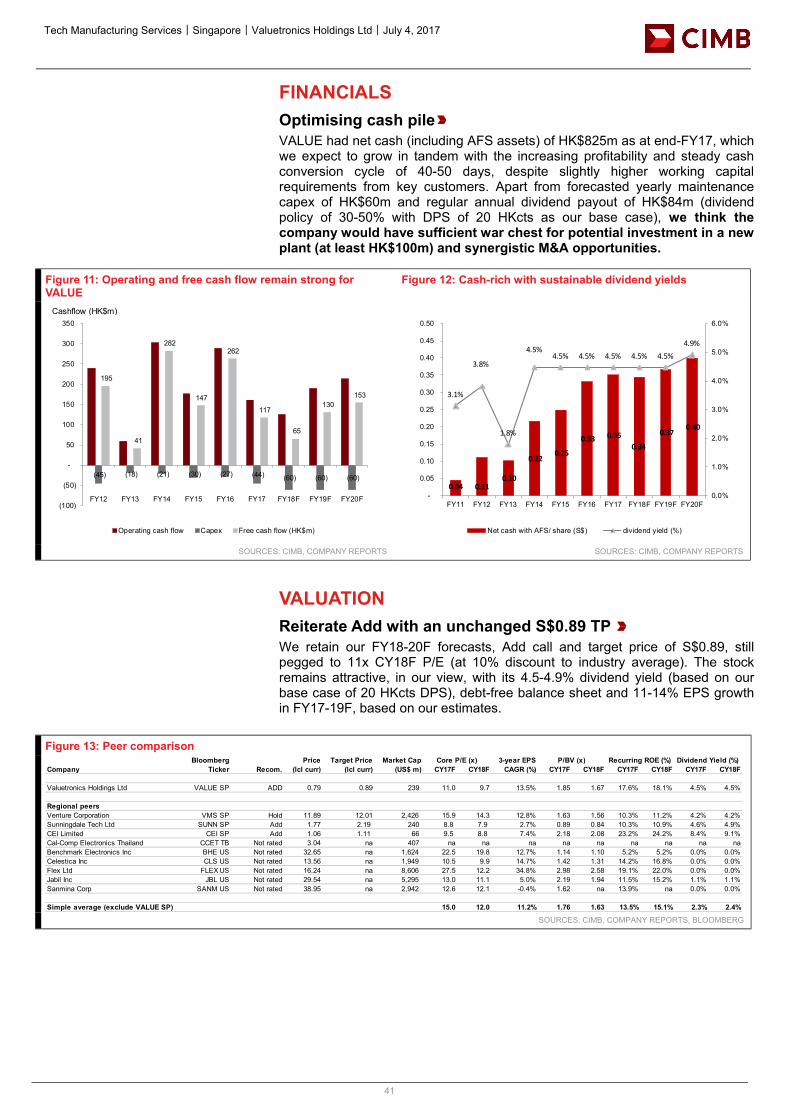
Tech Manufacturing Services│Singapore│Valuetronics Holdings Ltd│July 4, 2017
41
FINANCIALS Optimising cash pile VALUE had net cash (including AFS assets) of HK$825m as at end-FY17, which we expect to grow in tandem with the increasing profitability and steady cash conversion cycle of 40-50 days, despite slightly higher working capital requirements from key customers. Apart from forecasted yearly maintenance capex of HK$60m and regular annual dividend payout of HK$84m (dividend policy of 30-50% with DPS of 20 HKcts as our base case), we think the company would have sufficient war chest for potential investment in a new plant (at least HK$100m) and synergistic M&A opportunities.
Figure 11: Operating and free cash flow remain strong for VALUE
Figure 12: Cash-rich with sustainable dividend yields
SOURCES: CIMB, COMPANY REPORTS SOURCES: CIMB, COMPANY REPORTS
VALUATION Reiterate Add with an unchanged S$0.89 TP We retain our FY18-20F forecasts, Add call and target price of S$0.89, still pegged to 11x CY18F P/E (at 10% discount to industry average). The stock remains attractive, in our view, with its 4.5-4.9% dividend yield (based on our base case of 20 HKcts DPS), debt-free balance sheet and 11-14% EPS growth in FY17-19F, based on our estimates.
Figure 13: Peer comparison
SOURCES: CIMB, COMPANY REPORTS, BLOOMBERG
195
41
282
147
262
117
65
130 153
(45) (18) (21) (30) (27) (44) (60) (60) (60)
(100)
(50)
-
50
100
150
200
250
300
350
FY12 FY13 FY14 FY15 FY16 FY17 FY18F FY19F FY20F
Operating cash flow Capex Free cash flow (HK$m)
Cashflow (HK$m)
0.04 0.11 0.10
0.22 0.25
0.33 0.35 0.34
0.37 0.40
3.1%
3.8%
1.8%
4.5%4.5% 4.5% 4.5% 4.5% 4.5%
4.9%
0.0%
1.0%
2.0%
3.0%
4.0%
5.0%
6.0%
-
0.05
0.10
0.15
0.20
0.25
0.30
0.35
0.40
0.45
0.50
FY11 FY12 FY13 FY14 FY15 FY16 FY17 FY18F FY19F FY20F
Net cash with AFS/ share (S$) dividend yield (%)
Bloomberg Price Target Price Market Cap Core P/E (x) 3-year EPS P/BV (x) Recurring ROE (%) Dividend Yield (%)Company Ticker Recom. (lcl curr) (lcl curr) (US$ m) CY17F CY18F CAGR (%) CY17F CY18F CY17F CY18F CY17F CY18F
Valuetronics Holdings Ltd VALUE SP ADD 0.79 0.89 239 11.0 9.7 13.5% 1.85 1.67 17.6% 18.1% 4.5% 4.5%
Regional peersVenture Corporation VMS SP Hold 11.89 12.01 2,426 15.9 14.3 12.8% 1.63 1.56 10.3% 11.2% 4.2% 4.2%Sunningdale Tech Ltd SUNN SP Add 1.77 2.19 240 8.8 7.9 2.7% 0.89 0.84 10.3% 10.9% 4.6% 4.9%CEI Limited CEI SP Add 1.06 1.11 66 9.5 8.8 7.4% 2.18 2.08 23.2% 24.2% 8.4% 9.1%Cal-Comp Electronics Thailand CCET TB Not rated 3.04 na 407 na na na na na na na na naBenchmark Electronics Inc BHE US Not rated 32.65 na 1,624 22.5 19.8 12.7% 1.14 1.10 5.2% 5.2% 0.0% 0.0%Celestica Inc CLS US Not rated 13.56 na 1,949 10.5 9.9 14.7% 1.42 1.31 14.2% 16.8% 0.0% 0.0%Flex Ltd FLEX US Not rated 16.24 na 8,606 27.5 12.2 34.8% 2.98 2.58 19.1% 22.0% 0.0% 0.0%Jabil Inc JBL US Not rated 29.54 na 5,295 13.0 11.1 5.0% 2.19 1.94 11.5% 15.2% 1.1% 1.1%Sanmina Corp SANM US Not rated 38.95 na 2,942 12.6 12.1 -0.4% 1.62 na 13.9% na 0.0% 0.0%
Simple average (exclude VALUE SP) 15.0 12.0 11.2% 1.76 1.63 13.5% 15.1% 2.3% 2.4%
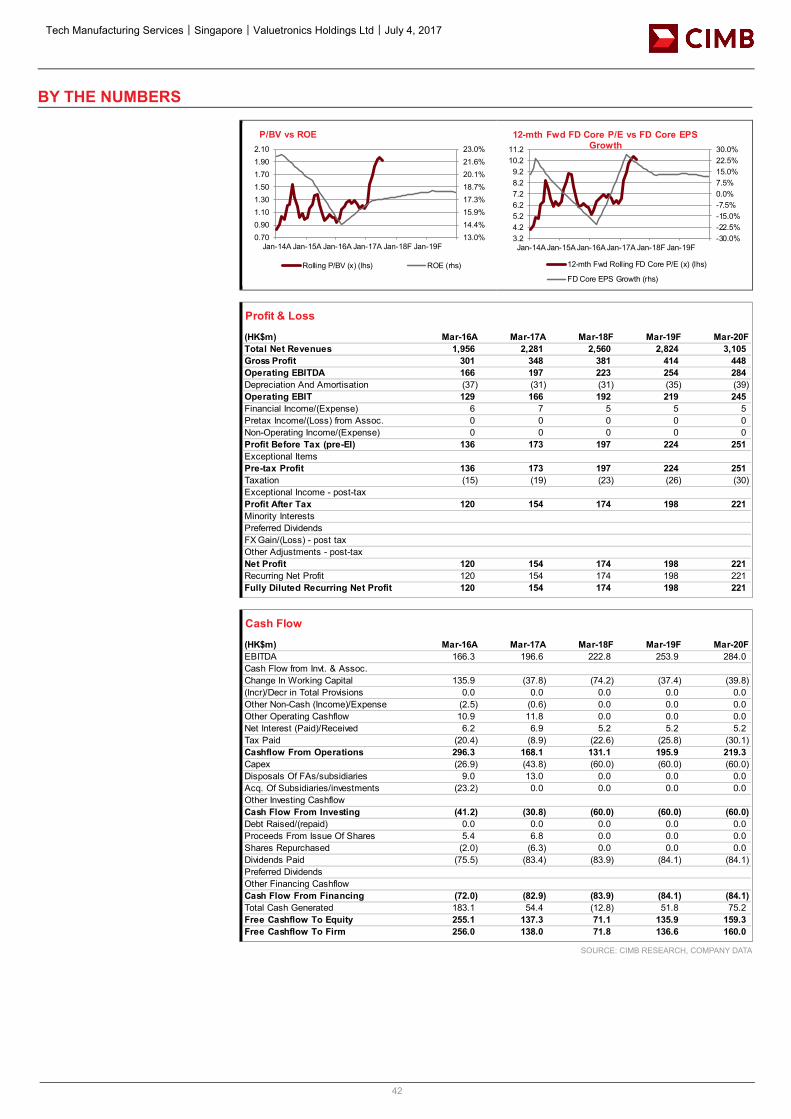
Tech Manufacturing Services│Singapore│Valuetronics Holdings Ltd│July 4, 2017
42
BY THE NUMBERS
SOURCE: CIMB RESEARCH, COMPANY DATA
13.0%14.4%15.9%17.3%18.7%20.1%21.6%23.0%
0.700.901.101.301.501.701.902.10
Jan-14A Jan-15A Jan-16A Jan-17A Jan-18F Jan-19F
P/BV vs ROE
Rolling P/BV (x) (lhs) ROE (rhs)
-30.0%-22.5%-15.0%-7.5%0.0%7.5%15.0%22.5%30.0%
3.24.25.26.27.28.29.2
10.211.2
Jan-14A Jan-15A Jan-16A Jan-17A Jan-18F Jan-19F
12-mth Fwd FD Core P/E vs FD Core EPS Growth
12-mth Fwd Rolling FD Core P/E (x) (lhs)
FD Core EPS Growth (rhs)
Profit & Loss
(HK$m) Mar-16A Mar-17A Mar-18F Mar-19F Mar-20FTotal Net Revenues 1,956 2,281 2,560 2,824 3,105Gross Profit 301 348 381 414 448Operating EBITDA 166 197 223 254 284Depreciation And Amortisation (37) (31) (31) (35) (39)Operating EBIT 129 166 192 219 245Financial Income/(Expense) 6 7 5 5 5Pretax Income/(Loss) from Assoc. 0 0 0 0 0Non-Operating Income/(Expense) 0 0 0 0 0Profit Before Tax (pre-EI) 136 173 197 224 251Exceptional ItemsPre-tax Profit 136 173 197 224 251Taxation (15) (19) (23) (26) (30)Exceptional Income - post-taxProfit After Tax 120 154 174 198 221Minority InterestsPreferred DividendsFX Gain/(Loss) - post taxOther Adjustments - post-taxNet Profit 120 154 174 198 221Recurring Net Profit 120 154 174 198 221Fully Diluted Recurring Net Profit 120 154 174 198 221
Cash Flow
(HK$m) Mar-16A Mar-17A Mar-18F Mar-19F Mar-20FEBITDA 166.3 196.6 222.8 253.9 284.0Cash Flow from Invt. & Assoc.Change In Working Capital 135.9 (37.8) (74.2) (37.4) (39.8)(Incr)/Decr in Total Provisions 0.0 0.0 0.0 0.0 0.0Other Non-Cash (Income)/Expense (2.5) (0.6) 0.0 0.0 0.0Other Operating Cashflow 10.9 11.8 0.0 0.0 0.0Net Interest (Paid)/Received 6.2 6.9 5.2 5.2 5.2Tax Paid (20.4) (8.9) (22.6) (25.8) (30.1)Cashflow From Operations 296.3 168.1 131.1 195.9 219.3Capex (26.9) (43.8) (60.0) (60.0) (60.0)Disposals Of FAs/subsidiaries 9.0 13.0 0.0 0.0 0.0Acq. Of Subsidiaries/investments (23.2) 0.0 0.0 0.0 0.0Other Investing CashflowCash Flow From Investing (41.2) (30.8) (60.0) (60.0) (60.0)Debt Raised/(repaid) 0.0 0.0 0.0 0.0 0.0Proceeds From Issue Of Shares 5.4 6.8 0.0 0.0 0.0Shares Repurchased (2.0) (6.3) 0.0 0.0 0.0Dividends Paid (75.5) (83.4) (83.9) (84.1) (84.1)Preferred DividendsOther Financing CashflowCash Flow From Financing (72.0) (82.9) (83.9) (84.1) (84.1)Total Cash Generated 183.1 54.4 (12.8) 51.8 75.2Free Cashflow To Equity 255.1 137.3 71.1 135.9 159.3Free Cashflow To Firm 256.0 138.0 71.8 136.6 160.0
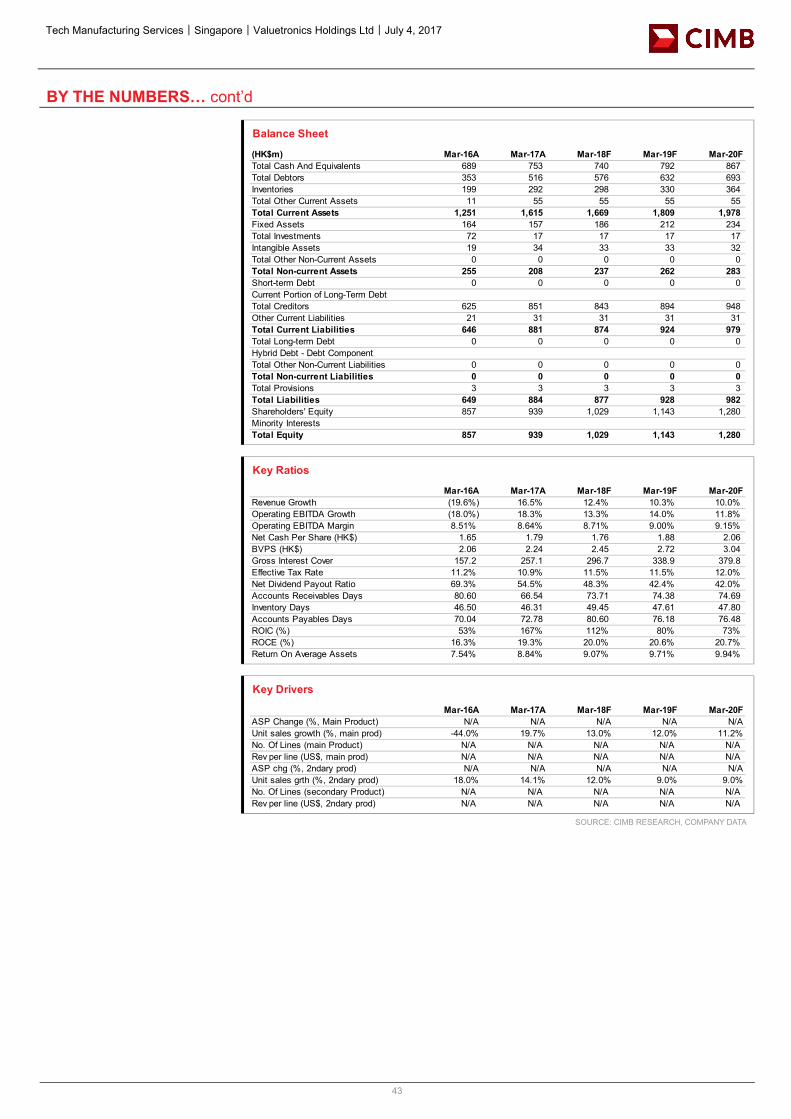
Tech Manufacturing Services│Singapore│Valuetronics Holdings Ltd│July 4, 2017
43
BY THE NUMBERS… cont’d
SOURCE: CIMB RESEARCH, COMPANY DATA
Balance Sheet
(HK$m) Mar-16A Mar-17A Mar-18F Mar-19F Mar-20FTotal Cash And Equivalents 689 753 740 792 867Total Debtors 353 516 576 632 693Inventories 199 292 298 330 364Total Other Current Assets 11 55 55 55 55Total Current Assets 1,251 1,615 1,669 1,809 1,978Fixed Assets 164 157 186 212 234Total Investments 72 17 17 17 17Intangible Assets 19 34 33 33 32Total Other Non-Current Assets 0 0 0 0 0Total Non-current Assets 255 208 237 262 283Short-term Debt 0 0 0 0 0Current Portion of Long-Term DebtTotal Creditors 625 851 843 894 948Other Current Liabilities 21 31 31 31 31Total Current Liabilities 646 881 874 924 979Total Long-term Debt 0 0 0 0 0Hybrid Debt - Debt ComponentTotal Other Non-Current Liabilities 0 0 0 0 0Total Non-current Liabilities 0 0 0 0 0Total Provisions 3 3 3 3 3Total Liabilities 649 884 877 928 982Shareholders' Equity 857 939 1,029 1,143 1,280Minority InterestsTotal Equity 857 939 1,029 1,143 1,280
Key Ratios
Mar-16A Mar-17A Mar-18F Mar-19F Mar-20FRevenue Growth (19.6%) 16.5% 12.4% 10.3% 10.0%Operating EBITDA Growth (18.0%) 18.3% 13.3% 14.0% 11.8%Operating EBITDA Margin 8.51% 8.64% 8.71% 9.00% 9.15%Net Cash Per Share (HK$) 1.65 1.79 1.76 1.88 2.06BVPS (HK$) 2.06 2.24 2.45 2.72 3.04Gross Interest Cover 157.2 257.1 296.7 338.9 379.8Effective Tax Rate 11.2% 10.9% 11.5% 11.5% 12.0%Net Dividend Payout Ratio 69.3% 54.5% 48.3% 42.4% 42.0%Accounts Receivables Days 80.60 66.54 73.71 74.38 74.69Inventory Days 46.50 46.31 49.45 47.61 47.80Accounts Payables Days 70.04 72.78 80.60 76.18 76.48ROIC (%) 53% 167% 112% 80% 73%ROCE (%) 16.3% 19.3% 20.0% 20.6% 20.7%Return On Average Assets 7.54% 8.84% 9.07% 9.71% 9.94%
Key Drivers
Mar-16A Mar-17A Mar-18F Mar-19F Mar-20FASP Change (%, Main Product) N/A N/A N/A N/A N/AUnit sales growth (%, main prod) -44.0% 19.7% 13.0% 12.0% 11.2%No. Of Lines (main Product) N/A N/A N/A N/A N/ARev per line (US$, main prod) N/A N/A N/A N/A N/AASP chg (%, 2ndary prod) N/A N/A N/A N/A N/AUnit sales grth (%, 2ndary prod) 18.0% 14.1% 12.0% 9.0% 9.0%No. Of Lines (secondary Product) N/A N/A N/A N/A N/ARev per line (US$, 2ndary prod) N/A N/A N/A N/A N/A
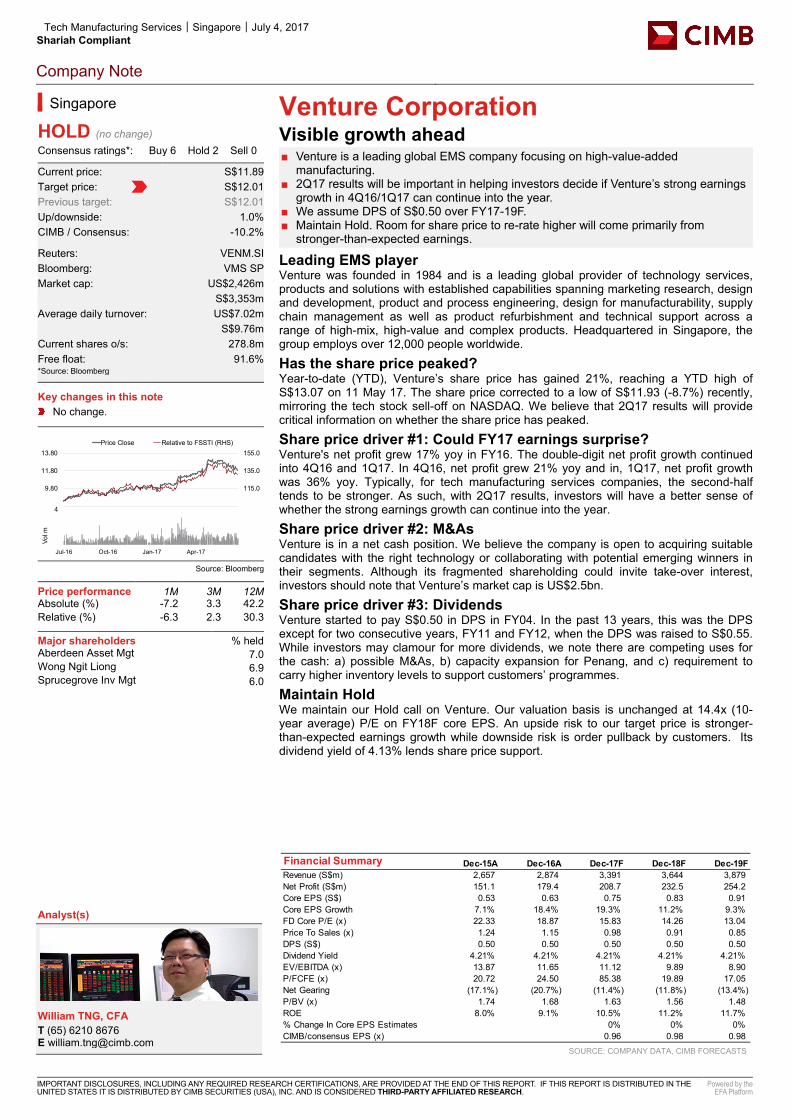
Tech Manufacturing Services│Singapore│July 4, 2017 Shariah Compliant
Company Note
IMPORTANT DISCLOSURES, INCLUDING ANY REQUIRED RESEARCH CERTIFICATIONS, ARE PROVIDED AT THE END OF THIS REPORT. IF THIS REPORT IS DISTRIBUTED IN THE UNITED STATES IT IS DISTRIBUTED BY CIMB SECURITIES (USA), INC. AND IS CONSIDERED THIRD-PARTY AFFILIATED RESEARCH.
Powered by the EFA Platform
Venture Corporation Visible growth ahead ■ Venture is a leading global EMS company focusing on high-value-added
manufacturing. ■ 2Q17 results will be important in helping investors decide if Venture’s strong earnings
growth in 4Q16/1Q17 can continue into the year. ■ We assume DPS of S$0.50 over FY17-19F. ■ Maintain Hold. Room for share price to re-rate higher will come primarily from
stronger-than-expected earnings.
Leading EMS player Venture was founded in 1984 and is a leading global provider of technology services, products and solutions with established capabilities spanning marketing research, design and development, product and process engineering, design for manufacturability, supply chain management as well as product refurbishment and technical support across a range of high-mix, high-value and complex products. Headquartered in Singapore, the group employs over 12,000 people worldwide.
Has the share price peaked? Year-to-date (YTD), Venture’s share price has gained 21%, reaching a YTD high of S$13.07 on 11 May 17. The share price corrected to a low of S$11.93 (-8.7%) recently, mirroring the tech stock sell-off on NASDAQ. We believe that 2Q17 results will provide critical information on whether the share price has peaked.
Share price driver #1: Could FY17 earnings surprise? Venture's net profit grew 17% yoy in FY16. The double-digit net profit growth continued into 4Q16 and 1Q17. In 4Q16, net profit grew 21% yoy and in, 1Q17, net profit growth was 36% yoy. Typically, for tech manufacturing services companies, the second-half tends to be stronger. As such, with 2Q17 results, investors will have a better sense of whether the strong earnings growth can continue into the year.
Share price driver #2: M&As Venture is in a net cash position. We believe the company is open to acquiring suitable candidates with the right technology or collaborating with potential emerging winners in their segments. Although its fragmented shareholding could invite take-over interest, investors should note that Venture’s market cap is US$2.5bn.
Share price driver #3: Dividends Venture started to pay S$0.50 in DPS in FY04. In the past 13 years, this was the DPS except for two consecutive years, FY11 and FY12, when the DPS was raised to S$0.55. While investors may clamour for more dividends, we note there are competing uses for the cash: a) possible M&As, b) capacity expansion for Penang, and c) requirement to carry higher inventory levels to support customers’ programmes.
Maintain Hold We maintain our Hold call on Venture. Our valuation basis is unchanged at 14.4x (10-year average) P/E on FY18F core EPS. An upside risk to our target price is stronger-than-expected earnings growth while downside risk is order pullback by customers. Its dividend yield of 4.13% lends share price support.
SOURCE: COMPANY DATA, CIMB FORECASTS
Singapore
HOLD (no change) Consensus ratings*: Buy 6 Hold 2 Sell 0
Current price: S$11.89 Target price: S$12.01 Previous target: S$12.01 Up/downside: 1.0% CIMB / Consensus: -10.2%
Reuters: VENM.SI Bloomberg: VMS SP Market cap: US$2,426m S$3,353m Average daily turnover: US$7.02m S$9.76m Current shares o/s: 278.8m Free float: 91.6% *Source: Bloomberg Key changes in this note
No change.
Source: Bloomberg
Price performance 1M 3M 12M Absolute (%) -7.2 3.3 42.2 Relative (%) -6.3 2.3 30.3
Major shareholders % held Aberdeen Asset Mgt 7.0 Wong Ngit Liong 6.9 Sprucegrove Inv Mgt 6.0
Analyst(s)
William TNG, CFA T (65) 6210 8676 E [email protected]
Financial Summary Dec-15A Dec-16A Dec-17F Dec-18F Dec-19FRevenue (S$m) 2,657 2,874 3,391 3,644 3,879Net Profit (S$m) 151.1 179.4 208.7 232.5 254.2Core EPS (S$) 0.53 0.63 0.75 0.83 0.91Core EPS Growth 7.1% 18.4% 19.3% 11.2% 9.3%FD Core P/E (x) 22.33 18.87 15.83 14.26 13.04Price To Sales (x) 1.24 1.15 0.98 0.91 0.85DPS (S$) 0.50 0.50 0.50 0.50 0.50Dividend Yield 4.21% 4.21% 4.21% 4.21% 4.21%EV/EBITDA (x) 13.87 11.65 11.12 9.89 8.90P/FCFE (x) 20.72 24.50 85.38 19.89 17.05Net Gearing (17.1%) (20.7%) (11.4%) (11.8%) (13.4%)P/BV (x) 1.74 1.68 1.63 1.56 1.48ROE 8.0% 9.1% 10.5% 11.2% 11.7%% Change In Core EPS Estimates 0% 0% 0%CIMB/consensus EPS (x) 0.96 0.98 0.98
95.0
115.0
135.0
155.0
7.80
9.80
11.80
13.80Price Close Relative to FSSTI (RHS)
1234
Jul-16 Oct-16 Jan-17 Apr-17
Vol m
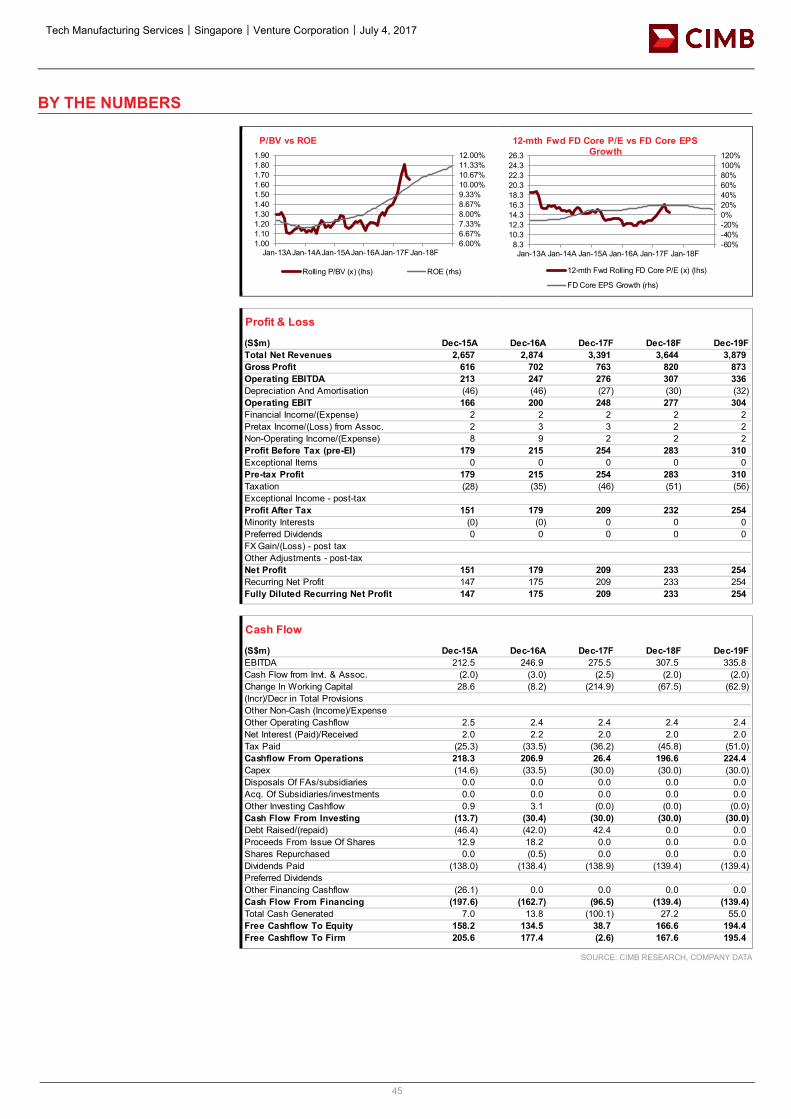
Tech Manufacturing Services│Singapore│Venture Corporation│July 4, 2017
45
BY THE NUMBERS
SOURCE: CIMB RESEARCH, COMPANY DATA
6.00%6.67%7.33%8.00%8.67%9.33%10.00%10.67%11.33%12.00%
1.001.101.201.301.401.501.601.701.801.90
Jan-13AJan-14AJan-15AJan-16AJan-17F Jan-18F
P/BV vs ROE
Rolling P/BV (x) (lhs) ROE (rhs)
-60%-40%-20%0%20%40%60%80%100%120%
8.310.312.314.316.318.320.322.324.326.3
Jan-13A Jan-14A Jan-15A Jan-16A Jan-17F Jan-18F
12-mth Fwd FD Core P/E vs FD Core EPS Growth
12-mth Fwd Rolling FD Core P/E (x) (lhs)
FD Core EPS Growth (rhs)
Profit & Loss
(S$m) Dec-15A Dec-16A Dec-17F Dec-18F Dec-19FTotal Net Revenues 2,657 2,874 3,391 3,644 3,879Gross Profit 616 702 763 820 873Operating EBITDA 213 247 276 307 336Depreciation And Amortisation (46) (46) (27) (30) (32)Operating EBIT 166 200 248 277 304Financial Income/(Expense) 2 2 2 2 2Pretax Income/(Loss) from Assoc. 2 3 3 2 2Non-Operating Income/(Expense) 8 9 2 2 2Profit Before Tax (pre-EI) 179 215 254 283 310Exceptional Items 0 0 0 0 0Pre-tax Profit 179 215 254 283 310Taxation (28) (35) (46) (51) (56)Exceptional Income - post-taxProfit After Tax 151 179 209 232 254Minority Interests (0) (0) 0 0 0Preferred Dividends 0 0 0 0 0FX Gain/(Loss) - post taxOther Adjustments - post-taxNet Profit 151 179 209 233 254Recurring Net Profit 147 175 209 233 254Fully Diluted Recurring Net Profit 147 175 209 233 254
Cash Flow
(S$m) Dec-15A Dec-16A Dec-17F Dec-18F Dec-19FEBITDA 212.5 246.9 275.5 307.5 335.8Cash Flow from Invt. & Assoc. (2.0) (3.0) (2.5) (2.0) (2.0)Change In Working Capital 28.6 (8.2) (214.9) (67.5) (62.9)(Incr)/Decr in Total ProvisionsOther Non-Cash (Income)/ExpenseOther Operating Cashflow 2.5 2.4 2.4 2.4 2.4Net Interest (Paid)/Received 2.0 2.2 2.0 2.0 2.0Tax Paid (25.3) (33.5) (36.2) (45.8) (51.0)Cashflow From Operations 218.3 206.9 26.4 196.6 224.4Capex (14.6) (33.5) (30.0) (30.0) (30.0)Disposals Of FAs/subsidiaries 0.0 0.0 0.0 0.0 0.0Acq. Of Subsidiaries/investments 0.0 0.0 0.0 0.0 0.0Other Investing Cashflow 0.9 3.1 (0.0) (0.0) (0.0)Cash Flow From Investing (13.7) (30.4) (30.0) (30.0) (30.0)Debt Raised/(repaid) (46.4) (42.0) 42.4 0.0 0.0Proceeds From Issue Of Shares 12.9 18.2 0.0 0.0 0.0Shares Repurchased 0.0 (0.5) 0.0 0.0 0.0Dividends Paid (138.0) (138.4) (138.9) (139.4) (139.4)Preferred DividendsOther Financing Cashflow (26.1) 0.0 0.0 0.0 0.0Cash Flow From Financing (197.6) (162.7) (96.5) (139.4) (139.4)Total Cash Generated 7.0 13.8 (100.1) 27.2 55.0Free Cashflow To Equity 158.2 134.5 38.7 166.6 194.4Free Cashflow To Firm 205.6 177.4 (2.6) 167.6 195.4
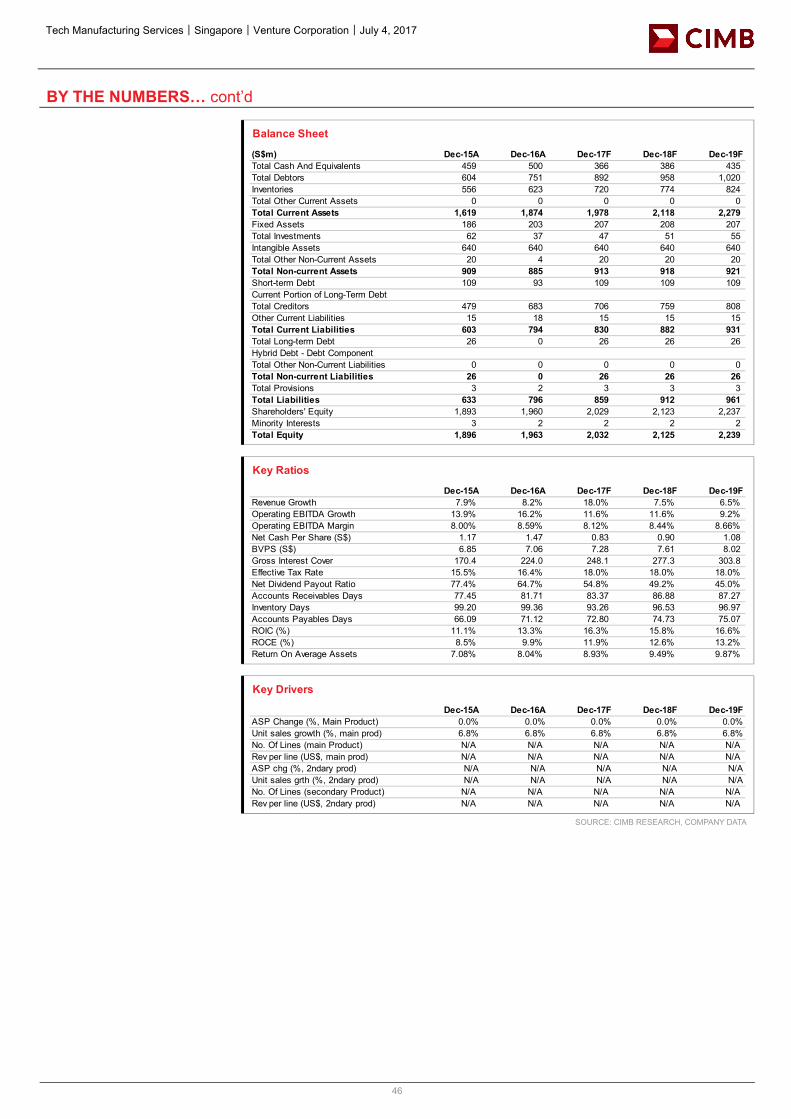
Tech Manufacturing Services│Singapore│Venture Corporation│July 4, 2017
46
BY THE NUMBERS… cont’d
SOURCE: CIMB RESEARCH, COMPANY DATA
Balance Sheet
(S$m) Dec-15A Dec-16A Dec-17F Dec-18F Dec-19FTotal Cash And Equivalents 459 500 366 386 435Total Debtors 604 751 892 958 1,020Inventories 556 623 720 774 824Total Other Current Assets 0 0 0 0 0Total Current Assets 1,619 1,874 1,978 2,118 2,279Fixed Assets 186 203 207 208 207Total Investments 62 37 47 51 55Intangible Assets 640 640 640 640 640Total Other Non-Current Assets 20 4 20 20 20Total Non-current Assets 909 885 913 918 921Short-term Debt 109 93 109 109 109Current Portion of Long-Term DebtTotal Creditors 479 683 706 759 808Other Current Liabilities 15 18 15 15 15Total Current Liabilities 603 794 830 882 931Total Long-term Debt 26 0 26 26 26Hybrid Debt - Debt ComponentTotal Other Non-Current Liabilities 0 0 0 0 0Total Non-current Liabilities 26 0 26 26 26Total Provisions 3 2 3 3 3Total Liabilities 633 796 859 912 961Shareholders' Equity 1,893 1,960 2,029 2,123 2,237Minority Interests 3 2 2 2 2Total Equity 1,896 1,963 2,032 2,125 2,239
Key Ratios
Dec-15A Dec-16A Dec-17F Dec-18F Dec-19FRevenue Growth 7.9% 8.2% 18.0% 7.5% 6.5%Operating EBITDA Growth 13.9% 16.2% 11.6% 11.6% 9.2%Operating EBITDA Margin 8.00% 8.59% 8.12% 8.44% 8.66%Net Cash Per Share (S$) 1.17 1.47 0.83 0.90 1.08BVPS (S$) 6.85 7.06 7.28 7.61 8.02Gross Interest Cover 170.4 224.0 248.1 277.3 303.8Effective Tax Rate 15.5% 16.4% 18.0% 18.0% 18.0%Net Dividend Payout Ratio 77.4% 64.7% 54.8% 49.2% 45.0%Accounts Receivables Days 77.45 81.71 83.37 86.88 87.27Inventory Days 99.20 99.36 93.26 96.53 96.97Accounts Payables Days 66.09 71.12 72.80 74.73 75.07ROIC (%) 11.1% 13.3% 16.3% 15.8% 16.6%ROCE (%) 8.5% 9.9% 11.9% 12.6% 13.2%Return On Average Assets 7.08% 8.04% 8.93% 9.49% 9.87%
Key Drivers
Dec-15A Dec-16A Dec-17F Dec-18F Dec-19FASP Change (%, Main Product) 0.0% 0.0% 0.0% 0.0% 0.0%Unit sales growth (%, main prod) 6.8% 6.8% 6.8% 6.8% 6.8%No. Of Lines (main Product) N/A N/A N/A N/A N/ARev per line (US$, main prod) N/A N/A N/A N/A N/AASP chg (%, 2ndary prod) N/A N/A N/A N/A N/AUnit sales grth (%, 2ndary prod) N/A N/A N/A N/A N/ANo. Of Lines (secondary Product) N/A N/A N/A N/A N/ARev per line (US$, 2ndary prod) N/A N/A N/A N/A N/A
Technology│Singapore│Tech Manufacturing Services│July 4, 2017
47
DISCLAIMER #03 The content of this report (including the views and opinions expressed therein, and the information comprised therein) has been prepared by and belongs to CIMB and is distributed by CIMB. This report is not directed to, or intended for distribution to or use by, any person or entity who is a citizen or resident of or located in any locality, state, country or other jurisdiction where such distribution, publication, availability or use would be contrary to law or regulation. By accepting this report, the recipient hereof represents and warrants that he is entitled to receive such report in accordance with the restrictions set forth below and agrees to be bound by the limitations contained herein (including the “Restrictions on Distributions” set out below). Any failure to comply with these limitations may constitute a violation of law. This publication is being supplied to you strictly on the basis that it will remain confidential. No part of this report may be (i) copied, photocopied, duplicated, stored or reproduced in any form by any means or (ii) redistributed or passed on, directly or indirectly, to any other person in whole or in part, for any purpose without the prior written consent of CIMB. The information contained in this research report is prepared from data believed to be correct and reliable at the time of issue of this report. CIMB may or may not issue regular reports on the subject matter of this report at any frequency and may cease to do so or change the periodicity of reports at any time. CIMB is under no obligation to update this report in the event of a material change to the information contained in this report. CIMB has no, and will not accept any, obligation to (i) check or ensure that the contents of this report remain current, reliable or relevant, (ii) ensure that the content of this report constitutes all the information a prospective investor may require, (iii) ensure the adequacy, accuracy, completeness, reliability or fairness of any views, opinions and information, and accordingly, CIMB, or any of their respective affiliates, or its related persons (and their respective directors, associates, connected persons and/or employees) shall not be liable in any manner whatsoever for any consequences (including but not limited to any direct, indirect or consequential losses, loss of profits and damages) of any reliance thereon or usage thereof. In particular, CIMB disclaims all responsibility and liability for the views and opinions set out in this report. Unless otherwise specified, this report is based upon sources which CIMB considers to be reasonable. Such sources will, unless otherwise specified, for market data, be market data and prices available from the main stock exchange or market where the relevant security is listed, or, where appropriate, any other market. Information on the accounts and business of company(ies) will generally be based on published statements of the company(ies), information disseminated by regulatory information services, other publicly available information and information resulting from our research. Whilst every effort is made to ensure that statements of facts made in this report are accurate, all estimates, projections, forecasts, expressions of opinion and other subjective judgments contained in this report are based on assumptions considered to be reasonable as of the date of the document in which they are contained and must not be construed as a representation that the matters referred to therein will occur. Past performance is not a reliable indicator of future performance. The value of investments may go down as well as up and those investing may, depending on the investments in question, lose more than the initial investment. No report shall constitute an offer or an invitation by or on behalf of CIMB or its affiliates to any person to buy or sell any investments. CIMB, its affiliates and related companies, their directors, associates, connected parties and/or employees may own or have positions in securities of the company(ies) covered in this research report or any securities related thereto and may from time to time add to or dispose of, or may be materially interested in, any such securities. Further, CIMB, its affiliates and its related companies do and seek to do business with the company(ies) covered in this research report and may from time to time act as market maker or have assumed an underwriting commitment in securities of such company(ies), may sell them to or buy them from customers on a principal basis and may also perform or seek to perform significant investment banking, advisory, underwriting or placement services for or relating to such company(ies) as well as solicit such investment, advisory or other services from any entity mentioned in this report. CIMB or its affiliates may enter into an agreement with the company(ies) covered in this report relating to the production of research reports. CIMB may disclose the contents of this report to the company(ies) covered by it and may have amended the contents of this report following such disclosure. The analyst responsible for the production of this report hereby certifies that the views expressed herein accurately and exclusively reflect his or her personal views and opinions about any and all of the issuers or securities analysed in this report and were prepared independently and autonomously. No part of the compensation of the analyst(s) was, is, or will be directly or indirectly related to the inclusion of specific recommendations(s) or view(s) in this report. CIMB prohibits the analyst(s) who prepared this research report from receiving any compensation, incentive or bonus based on specific investment banking transactions or for providing a specific recommendation for, or view of, a particular company. Information barriers and other arrangements may be established where necessary to prevent conflicts of interests arising. However, the analyst(s) may receive compensation that is based on his/their coverage of company(ies) in the performance of his/their duties or the performance of his/their recommendations and the research personnel involved in the preparation of this report may also participate in the solicitation of the businesses as described above. In reviewing this research report, an investor should be aware that any or all of the foregoing, among other things, may give rise to real or potential conflicts of interest. Additional information is, subject to the duties of confidentiality, available on request. Reports relating to a specific geographical area are produced by the corresponding CIMB entity as listed in the table below. The term “CIMB” shall denote, where appropriate, the relevant entity distributing or disseminating the report in the particular jurisdiction referenced below, or, in every other case, CIMB Group Holdings Berhad ("CIMBGH") and its affiliates, subsidiaries and related companies.
Country CIMB Entity Regulated by Hong Kong CIMB Securities Limited Securities and Futures Commission Hong Kong India CIMB Securities (India) Private Limited Securities and Exchange Board of India (SEBI) Indonesia PT CIMB Securities Indonesia Financial Services Authority of Indonesia Malaysia CIMB Investment Bank Berhad Securities Commission Malaysia Singapore CIMB Research Pte. Ltd. Monetary Authority of Singapore South Korea CIMB Securities Limited, Korea Branch Financial Services Commission and Financial Supervisory Service Taiwan CIMB Securities Limited, Taiwan Branch Financial Supervisory Commission Thailand CIMB Securities (Thailand) Co. Ltd. Securities and Exchange Commission Thailand
Technology│Singapore│Tech Manufacturing Services│July 4, 2017
48
(i) As of July 3, 2017, CIMB has a proprietary position in the securities (which may include but not limited to shares, warrants, call warrants and/or any other derivatives) in the following company or companies covered or recommended in this report: (a) AEM Holdings Ltd, CEI Limited, Memtech International, Sunningdale Tech Ltd, UMS Holdings Ltd, Valuetronics Holdings Ltd, Venture Corporation (ii) As of July 4, 2017, the analyst(s) who prepared this report, and the associate(s), has / have an interest in the securities (which may include but not limited to shares, warrants, call warrants and/or any other derivatives) in the following company or companies covered or recommended in this report: (a) -
This report does not purport to contain all the information that a prospective investor may require. CIMB or any of its affiliates does not make any guarantee, representation or warranty, express or implied, as to the adequacy, accuracy, completeness, reliability or fairness of any such information and opinion contained in this report. Neither CIMB nor any of its affiliates nor its related persons shall be liable in any manner whatsoever for any consequences (including but not limited to any direct, indirect or consequential losses, loss of profits and damages) of any reliance thereon or usage thereof. This report is general in nature and has been prepared for information purposes only. It is intended for circulation amongst CIMB and its affiliates’ clients generally and does not have regard to the specific investment objectives, financial situation and the particular needs of any specific person who may receive this report. The information and opinions in this report are not and should not be construed or considered as an offer, recommendation or solicitation to buy or sell the subject securities, related investments or other financial instruments or any derivative instrument, or any rights pertaining thereto. Investors are advised to make their own independent evaluation of the information contained in this research report, consider their own individual investment objectives, financial situation and particular needs and consult their own professional and financial advisers as to the legal, business, financial, tax and other aspects before participating in any transaction in respect of the securities of company(ies) covered in this research report. The securities of such company(ies) may not be eligible for sale in all jurisdictions or to all categories of investors. Australia: Despite anything in this report to the contrary, this research is provided in Australia by CIMB Securities (Singapore) Pte. Ltd. and CIMB Securities Limited. This research is only available in Australia to persons who are “wholesale clients” (within the meaning of the Corporations Act 2001 (Cth) and is supplied solely for the use of such wholesale clients and shall not be distributed or passed on to any other person. You represent and warrant that if you are in Australia, you are a “wholesale client”. This research is of a general nature only and has been prepared without taking into account the objectives, financial situation or needs of the individual recipient. CIMB Securities (Singapore) Pte. Ltd. and CIMB Securities Limited do not hold, and are not required to hold an Australian financial services licence. CIMB Securities (Singapore) Pte. Ltd. and CIMB Securities Limited rely on “passporting” exemptions for entities appropriately licensed by the Monetary Authority of Singapore (under ASIC Class Order 03/1102) and the Securities and Futures Commission in Hong Kong (under ASIC Class Order 03/1103). Canada: This research report has not been prepared in accordance with the disclosure requirements of Dealer Member Rule 3400 – Research Restrictions and Disclosure Requirements of the Investment Industry Regulatory Organization of Canada. For any research report distributed by CIBC, further disclosures related to CIBC conflicts of interest can be found at https://researchcentral.cibcwm.com . China: For the purpose of this report, the People’s Republic of China (“PRC”) does not include the Hong Kong Special Administrative Region, the Macau Special Administrative Region or Taiwan. The distributor of this report has not been approved or licensed by the China Securities Regulatory Commission or any other relevant regulatory authority or governmental agency in the PRC. This report contains only marketing information. The distribution of this report is not an offer to buy or sell to any person within or outside PRC or a solicitation to any person within or outside of PRC to buy or sell any instruments described herein. This report is being issued outside the PRC to a limited number of institutional investors and may not be provided to any person other than the original recipient and may not be reproduced or used for any other purpose. France: Only qualified investors within the meaning of French law shall have access to this report. This report shall not be considered as an offer to subscribe to, or used in connection with, any offer for subscription or sale or marketing or direct or indirect distribution of financial instruments and it is not intended as a solicitation for the purchase of any financial instrument. Germany: This report is only directed at persons who are professional investors as defined in sec 31a(2) of the German Securities Trading Act (WpHG). This publication constitutes research of a non-binding nature on the market situation and the investment instruments cited here at the time of the publication of the information. The current prices/yields in this issue are based upon closing prices from Bloomberg as of the day preceding publication. Please note that neither the German Federal Financial Supervisory Agency (BaFin), nor any other supervisory authority exercises any control over the content of this report. Hong Kong: This report is issued and distributed in Hong Kong by CIMB Securities Limited (“CHK”) which is licensed in Hong Kong by the Securities and Futures Commission for Type 1 (dealing in securities), Type 4 (advising on securities) and Type 6 (advising on corporate finance) activities. Any investors wishing to purchase or otherwise deal in the securities covered in this report should contact the Head of Sales at CIMB Securities Limited. The views and opinions in this research report are our own as of the date hereof and are subject to change. If the Financial Services and Markets Act of the United Kingdom or the rules of the Financial Conduct Authority apply to a recipient, our obligations owed to such recipient therein are unaffected. CHK has no obligation to update its opinion or the information in this research report. This publication is strictly confidential and is for private circulation only to clients of CHK. CIMB Securities Limited does not make a market on other securities mentioned in the report. India: This report is issued and distributed in India by CIMB Securities (India) Private Limited (“CIMB India”) which is registered with the National Stock Exchange of India Limited and BSE Limited as a trading and clearing member under the Securities and Exchange Board of India (Stock Brokers and Sub-Brokers) Regulations, 1992. In accordance with the provisions of Regulation 4(g) of the Securities and Exchange Board of India (Investment Advisers) Regulations, 2013, CIMB India is not required to seek registration with the Securities and Exchange Board of India (“SEBI”) as an Investment Adviser. CIMB India is registered with SEBI as a Research Analyst pursuant to the SEBI (Research Analysts) Regulations, 2014 ("Regulations"). This report does not take into account the particular investment objectives, financial situations, or needs of the recipients. It is not intended for
Technology│Singapore│Tech Manufacturing Services│July 4, 2017
49
and does not deal with prohibitions on investment due to law/jurisdiction issues etc. which may exist for certain persons/entities. Recipients should rely on their own investigations and take their own professional advice before investment. The report is not a “prospectus” as defined under Indian Law, including the Companies Act, 2013, and is not, and shall not be, approved by, or filed or registered with, any Indian regulator, including any Registrar of Companies in India, SEBI, any Indian stock exchange, or the Reserve Bank of India. No offer, or invitation to offer, or solicitation of subscription with respect to any such securities listed or proposed to be listed in India is being made, or intended to be made, to the public, or to any member or section of the public in India, through or pursuant to this report. The research analysts, strategists or economists principally responsible for the preparation of this research report are segregated from the other activities of CIMB India and they have received compensation based upon various factors, including quality, accuracy and value of research, firm profitability or revenues, client feedback and competitive factors. Research analysts', strategists' or economists' compensation is not linked to investment banking or capital markets transactions performed or proposed to be performed by CIMB India or its affiliates. CIMB Securities (India) Pte Ltd has not received any investment banking related compensation from the companies mentioned in the report in the past 12 months. CIMB Securities (India) Pte Ltd has not received any compensation from the companies mentioned in the report in the past 12 months. Indonesia: This report is issued and distributed by PT CIMB Securities Indonesia (“CIMBI”). The views and opinions in this research report are our own as of the date hereof and are subject to change. If the Financial Services and Markets Act of the United Kingdom or the rules of the Financial Conduct Authority apply to a recipient, our obligations owed to such recipient therein are unaffected. CIMBI has no obligation to update its opinion or the information in this research report. Neither this report nor any copy hereof may be distributed in Indonesia or to any Indonesian citizens wherever they are domiciled or to Indonesian residents except in compliance with applicable Indonesian capital market laws and regulations. This research report is not an offer of securities in Indonesia. The securities referred to in this research report have not been registered with the Financial Services Authority (Otoritas Jasa Keuangan) pursuant to relevant capital market laws and regulations, and may not be offered or sold within the territory of the Republic of Indonesia or to Indonesian citizens through a public offering or in circumstances which constitute an offer within the meaning of the Indonesian capital market law and regulations. Ireland: CIMB is not an investment firm authorised in the Republic of Ireland and no part of this document should be construed as CIMB acting as, or otherwise claiming or representing to be, an investment firm authorised in the Republic of Ireland. Malaysia: This report is issued and distributed by CIMB Investment Bank Berhad (“CIMB”) solely for the benefit of and for the exclusive use of our clients. If the Financial Services and Markets Act of the United Kingdom or the rules of the Financial Conduct Authority apply to a recipient, our obligations owed to such recipient therein are unaffected. CIMB has no obligation to update, revise or reaffirm its opinion or the information in this research reports after the date of this report. New Zealand: In New Zealand, this report is for distribution only to persons who are wholesale clients pursuant to section 5C of the Financial Advisers Act 2008. Singapore: This report is issued and distributed by CIMB Research Pte Ltd (“CIMBR”). CIMBR is a financial adviser licensed under the Financial Advisers Act, Cap 110 (“FAA”) for advising on investment products, by issuing or promulgating research analyses or research reports, whether in electronic, print or other form. Accordingly CIMBR is a subject to the applicable rules under the FAA unless it is able to avail itself to any prescribed exemptions. Recipients of this report are to contact CIMB Research Pte Ltd, 50 Raffles Place, #19-00 Singapore Land Tower, Singapore in respect of any matters arising from, or in connection with this report. CIMBR has no obligation to update its opinion or the information in this research report. This publication is strictly confidential and is for private circulation only. If you have not been sent this report by CIMBR directly, you may not rely, use or disclose to anyone else this report or its contents. If the recipient of this research report is not an accredited investor, expert investor or institutional investor, CIMBR accepts legal responsibility for the contents of the report without any disclaimer limiting or otherwise curtailing such legal responsibility. If the recipient is an accredited investor, expert investor or institutional investor, the recipient is deemed to acknowledge that CIMBR is exempt from certain requirements under the FAA and its attendant regulations, and as such, is exempt from complying with the following : (a) Section 25 of the FAA (obligation to disclose product information); (b) Section 27 (duty not to make recommendation with respect to any investment product without having a reasonable basis where you may be reasonably expected to rely on the recommendation) of the FAA; (c) MAS Notice on Information to Clients and Product Information Disclosure [Notice No. FAA-N03]; (d) MAS Notice on Recommendation on Investment Products [Notice No. FAA-N16]; (e) Section 36 (obligation on disclosure of interest in securities), and (f) any other laws, regulations, notices, directive, guidelines, circulars and practice notes which are relates to the above, to the extent permitted by applicable laws, as may be amended from time to time, and any other laws, regulations, notices, directive, guidelines, circulars, and practice notes as we may notify you from time to time. In addition, the recipient who is an accredited investor, expert investor or institutional investor acknowledges that a CIMBR is exempt from Section 27 of the FAA, the recipient will also not be able to file a civil claim against CIMBR for any loss or damage arising from the recipient’s reliance on any recommendation made by CIMBR which would otherwise be a right that is available to the recipient under Section 27 of the FAA, the recipient will also not be able to file a civil claim against CIMBR for any loss or damage arising from the recipient’s reliance on any recommendation made by CIMBR which would otherwise be a right that is available to the recipient under Section 27 of the FAA. CIMB Research Pte Ltd ("CIMBR"), its affiliates and related companies, their directors, associates, connected parties and/or employees may own or have positions in securities of the company(ies) covered in this research report or any securities related thereto and may from time to time add to or dispose of, or may be materially interested in, any such securities. Further, CIMBR, its affiliates and its related companies do and seek to do business with the company(ies) covered in this research report and may from time to time act as market maker or have assumed an underwriting commitment in securities of such company(ies), may sell them to or buy them from customers on a principal basis and may also perform or seek to perform significant investment banking, advisory, underwriting or placement services for or relating to such company(ies) as well as solicit
Technology│Singapore│Tech Manufacturing Services│July 4, 2017
50
such investment, advisory or other services from any entity mentioned in this report. As of July 3, 2017, CIMBR does not have a proprietary position in the recommended securities in this report. CIMB Research Pte Ltd does not make a market on other securities mentioned in the report. CIMB Securities Singapore Pte Ltd does not make a market on other securities mentioned in the report. CIMB Bank Berhad, Singapore branch does not make a market on other securities mentioned in the report. South Korea: This report is issued and distributed in South Korea by CIMB Securities Limited, Korea Branch (“CIMB Korea”) which is licensed as a cash equity broker, and regulated by the Financial Services Commission and Financial Supervisory Service of Korea. In South Korea, this report is for distribution only to professional investors under Article 9(5) of the Financial Investment Services and Capital Market Act of Korea (“FSCMA”). Spain: This document is a research report and it is addressed to institutional investors only. The research report is of a general nature and not personalised and does not constitute investment advice so, as the case may be, the recipient must seek proper advice before adopting any investment decision. This document does not constitute a public offering of securities. CIMB is not registered with the Spanish Comision Nacional del Mercado de Valores to provide investment services. Sweden: This report contains only marketing information and has not been approved by the Swedish Financial Supervisory Authority. The distribution of this report is not an offer to sell to any person in Sweden or a solicitation to any person in Sweden to buy any instruments described herein and may not be forwarded to the public in Sweden. Switzerland: This report has not been prepared in accordance with the recognized self-regulatory minimal standards for research reports of banks issued by the Swiss Bankers’ Association (Directives on the Independence of Financial Research). Taiwan: This research report is not an offer or marketing of foreign securities in Taiwan. The securities as referred to in this research report have not been and will not be registered with the Financial Supervisory Commission of the Republic of China pursuant to relevant securities laws and regulations and may not be offered or sold within the Republic of China through a public offering or in circumstances which constitutes an offer or a placement within the meaning of the Securities and Exchange Law of the Republic of China that requires a registration or approval of the Financial Supervisory Commission of the Republic of China. Thailand: This report is issued and distributed by CIMB Securities (Thailand) Company Limited (“CIMBS”) based upon sources believed to be reliable (but their accuracy, completeness or correctness is not guaranteed). The statements or expressions of opinion herein were arrived at after due and careful consideration for use as information for investment. Such opinions are subject to change without notice and CIMBS has no obligation to update its opinion or the information in this research report. If the Financial Services and Markets Act of the United Kingdom or the rules of the Financial Conduct Authority apply to a recipient, our obligations owed to such recipient are unaffected. CIMB Securities (Thailand) Co., Ltd. may act or acts as Market Maker, and issuer and offerer of Derivative Warrants and Structured Note which may have the following securities as its underlying securities. Investors should carefully read and study the details of the derivative warrants in the prospectus before making investment decisions. AAV, ADVANC, AMATA, AOT, AP, BA, BANPU, BBL, BCH, BCP, BDMS, BEAUTY, BEC, BEM, BH, BIG, BLA, BLAND, BTS, CBG, CENTEL, CHG, CK, CKP, COM7, CPALL, CPF, CPN, DELTA, DTAC, EGCO, EPG, GLOBAL, GLOW, GPSC, GUNKUL, HANA, HMPRO, ICHI, IFEC, INTUCH, IRPC, ITD, IVL, KAMART, KBANK, KCE, KKP, KTB, KTC, LH, LHBANK, LPN, MAJOR, MINT, MTLS, PLANB, PSH, PTG, PTT, PTTEP, PTTGC, QH, ROBINS, RS, S, SAMART, SAWAD, SCB, SCC, SCN, SGP, SIRI, SPALI, SPCG, SPRC, STEC, STPI, SUPER, TASCO, TCAP, THAI, THANI, THCOM, TISCO, TKN, TMB, TOP, TPIPL, TRUE, TTA, TTCL, TTW, TU, TVO, UNIQ, VGI, VIBHA, VNG, WHA. Corporate Governance Report: The disclosure of the survey result of the Thai Institute of Directors Association (“IOD”) regarding corporate governance is made pursuant to the policy of the Office of the Securities and Exchange Commission. The survey of the IOD is based on the information of a company listed on the Stock Exchange of Thailand and the Market for Alternative Investment disclosed to the public and able to be accessed by a general public investor. The result, therefore, is from the perspective of a third party. It is not an evaluation of operation and is not based on inside information. The survey result is as of the date appearing in the Corporate Governance Report of Thai Listed Companies. As a result, the survey result may be changed after that date. CIMBS does not confirm nor certify the accuracy of such survey result.
Score Range: 90 - 100 80 - 89 70 - 79 Below 70 or No Survey Result Description: Excellent Very Good Good N/A
United Arab Emirates: The distributor of this report has not been approved or licensed by the UAE Central Bank or any other relevant licensing authorities or governmental agencies in the United Arab Emirates. This report is strictly private and confidential and has not been reviewed by, deposited or registered with UAE Central Bank or any other licensing authority or governmental agencies in the United Arab Emirates. This report is being issued outside the United Arab Emirates to a limited number of institutional investors and must not be provided to any person other than the original recipient and may not be reproduced or used for any other purpose. Further, the information contained in this report is not intended to lead to the sale of investments under any subscription agreement or the conclusion of any other contract of whatsoever nature within the territory of the United Arab Emirates. United Kingdom: In the United Kingdom and European Economic Area, this report is being disseminated by CIMB Securities (UK) Limited (“CIMB UK”). CIMB UK is authorized and regulated by the Financial Conduct Authority and its registered office is at 27 Knightsbridge, London, SW1X7YB. Unless specified to the contrary, this report has been issued and approved for distribution in the U.K. and the EEA by CIMB UK. Investment research issued by CIMB UK has been prepared in accordance with CIMB Group’s policies for managing conflicts of interest arising as a result of publication and distribution of investment research. This report is for distribution only to, and is solely directed at, selected persons on the basis that those persons: (a) are eligible counterparties and professional clients of CIMB UK; (b) have professional experience in matters relating to investments falling within Article 19(5) of the Financial Services and Markets Act 2000 (Financial Promotion) Order 2005 (as amended, the “Order”), (c) fall within Article 49(2)(a) to (d) (“high net worth companies, unincorporated associations etc”) of the Order; (d) are outside the United Kingdom subject to relevant regulation in each jurisdiction, or (e) are persons to whom an invitation or inducement to engage in
Technology│Singapore│Tech Manufacturing Services│July 4, 2017
51
investment activity (within the meaning of section 21 of the Financial Services and Markets Act 2000) in connection with any investments to which this report relates may otherwise lawfully be communicated or caused to be communicated (all such persons together being referred to as “relevant persons”). This report is directed only at relevant persons and must not be acted on or relied on by persons who are not relevant persons. Any investment or investment activity to which this report relates is available only to relevant persons and will be engaged in only with relevant persons. Where this report is labelled as non-independent, it does not provide an impartial or objective assessment of the subject matter and does not constitute independent “investment research” under the applicable rules of the Financial Conduct Authority in the UK. Consequently, any such non-independent report will not have been prepared in accordance with legal requirements designed to promote the independence of investment research and will not subject to any prohibition on dealing ahead of the dissemination of investment research. Any such non-independent report must be considered as a marketing communication. United States: This research report is distributed in the United States of America by CIMB Securities (USA) Inc, a U.S. registered broker-dealer and a related company of CIMB Research Pte Ltd, CIMB Investment Bank Berhad, PT CIMB Securities Indonesia, CIMB Securities (Thailand) Co. Ltd, CIMB Securities Limited, CIMB Securities (India) Private Limited, and is distributed solely to persons who qualify as “U.S. Institutional Investors” as defined in Rule 15a-6 under the Securities and Exchange Act of 1934. This communication is only for Institutional Investors whose ordinary business activities involve investing in shares, bonds, and associated securities and/or derivative securities and who have professional experience in such investments. Any person who is not a U.S. Institutional Investor or Major Institutional Investor must not rely on this communication. The delivery of this research report to any person in the United States of America is not a recommendation to effect any transactions in the securities discussed herein, or an endorsement of any opinion expressed herein. CIMB Securities (USA) Inc, is a FINRA/SIPC member and takes responsibility for the content of this report. For further information or to place an order in any of the above-mentioned securities please contact a registered representative of CIMB Securities (USA) Inc. CIMB Securities (USA) Inc does not make a market on other securities mentioned in the report. Neither CIMB Securities (USA) Inc., nor its affiliates have managed or co-managed a public offering of any of the securities mentioned in the past 12 months. Neither CIMB Securities (USA) Inc., nor its affiliates have received compensation for investment banking services from any of the company mentioned in the past 12 months. Neither CIMB Securities (USA) Inc., nor its affiliates expects to receive or intends to seek compensation for investment banking services from any of the company mentioned within the next 3 months. Other jurisdictions: In any other jurisdictions, except if otherwise restricted by laws or regulations, this report is only for distribution to professional, institutional or sophisticated investors as defined in the laws and regulations of such jurisdictions.
Corporate Governance Report of Thai Listed Companies (CGR). CG Rating by the Thai Institute of Directors Association (Thai IOD) in 2016, Anti-Corruption 2016 AAV – Very Good, n/a, ADVANC – Very Good, Certified, AEONTS – Good, n/a, AMATA – Excellent, Declared, ANAN – Very Good, Declared, AOT – Excellent, Declared, AP – Very Good, Declared, ASK – Very Good, Declared, ASP – Very Good, Certified, BANPU – Very Good, Certified, BAY – Excellent, Certified, BBL – Very Good, Certified, BCH – not available, Declared, BCP - Excellent, Certified, BEM – Very Good, n/a, BDMS – Very Good, n/a, BEAUTY – Good, Declared, BEC - Good, n/a, BH - Good, Declared, BIGC - Excellent, Declared, BJC – Good, n/a, BJCHI – Good, Declared, BLA – Very Good, Certified, BPP – not available, n/a, BTS - Excellent, Certified, CBG – Good, n/a, CCET – not available, n/a, CENTEL – Very Good, Certified, CHG – Very Good, n/a, CK – Excellent, n/a, COL – Very Good, Declared, CPALL – not available, Declared, CPF – Excellent, Declared, CPN - Excellent, Certified, DELTA - Excellent, Declared, DEMCO – Excellent, Certified, DIF – not available, n/a, DTAC – Excellent, Certified, EA – Very Good, Declared, ECL – Good, Certified, EGCO - Excellent, Certified, EPG – Good, n/a, GFPT - Excellent, Declared, GLOBAL – Very Good, Declared, GLOW – Very Good, Certified, GPSC – Excellent, Declared, GRAMMY - Excellent, n/a, GUNKUL – Very Good, Declared, HANA - Excellent, Certified, HMPRO - Excellent, Declared, ICHI – Very Good, Declared, INTUCH - Excellent, Certified, ITD – Good, n/a, IVL - Excellent, Certified, JAS – not available, Declared, JASIF – not available, n/a, JUBILE – Good, Declared, KAMART – not available, n/a, KBANK - Excellent, Certified, KCE - Excellent, Certified, KGI – Good, Certified, KKP – Excellent, Certified, KSL – Very Good, Declared, KTB - Excellent, Certified, KTC – Excellent, Certified, LH - Very Good, n/a, LPN – Excellent, Declared, M – Very Good, Declared, MAJOR - Good, n/a, MAKRO – Good, Declared, MALEE – Very Good, Declared, MBKET – Very Good, Certified, MC – Very Good, Declared, MCOT – Excellent, Declared, MEGA – Very Good, Declared, MINT - Excellent, Certified, MTLS – Very Good, Declared, NYT – Excellent, n/a, OISHI – Very Good, n/a, PLANB – Very Good, Declared, PLAT – Good, Declared, PSH – not available, n/a, PSL - Excellent, Certified, PTT - Excellent, Certified, PTTEP - Excellent, Certified, PTTGC - Excellent, Certified, QH – Excellent, Declared, RATCH – Excellent, Certified, ROBINS – Very Good, Declared, RS – Very Good, n/a, SAMART - Excellent, n/a, SAPPE - Good, n/a, SAT – Excellent, Certified, SAWAD – Good, n/a, SC – Excellent, Declared, SCB - Excellent, Certified, SCBLIF – not available, n/a, SCC – Excellent, Certified, SCN – Good, Declared, SCCC - Excellent, Declared, SIM - Excellent, n/a, SIRI - Good, n/a, SPALI - Excellent, Declared, SPRC – Very Good, Declared, STA – Very Good, Declared, STEC – Excellent, n/a, SVI – Excellent, Certified, TASCO – Very Good, Declared, TCAP – Excellent, Certified, THAI – Very Good, Declared, THANI – Very Good, Certified, THCOM – Excellent, Certified, THRE – Very Good, Certified, THREL – Very Good, Certified, TICON – Very Good, Declared, TIPCO – Very Good, Certified, TISCO - Excellent, Certified, TK – Very Good, n/a, TKN – Good, n/a, TMB - Excellent, Certified, TNR – not available, n/a, TOP - Excellent, Certified, TPCH – Good, n/a, TPIPP – not available, n/a, TRUE – Very Good, Declared, TTW – Very Good, Declared, TU – Excellent, Declared, UNIQ – not available, Declared, VGI – Excellent, Declared, WHA
Rating Distribution (%) Investment Banking clients (%)Add 55.9% 5.2%Hold 30.0% 1.6%Reduce 10.4% 0.3%
Distribution of stock ratings and investment banking clients for quarter ended on 31 March 20171244 companies under coverage for quarter ended on 31 March 2017
Technology│Singapore│Tech Manufacturing Services│July 4, 2017
52
– not available, Declared, WHART – not available, n/a, WORK – not available, n/a. Companies participating in Thailand’s Private Sector Collective Action Coalition Against Corruption programme (Thai CAC) under Thai Institute of Directors (as of October 28, 2016) are categorized into: - Companies that have declared their intention to join CAC, and - Companies certified by CAC
CIMB Recommendation Framework Stock Ratings Definition: Add The stock’s total return is expected to exceed 10% over the next 12 months. Hold The stock’s total return is expected to be between 0% and positive 10% over the next 12 months. Reduce The stock’s total return is expected to fall below 0% or more over the next 12 months. The total expected return of a stock is defined as the sum of the: (i) percentage difference between the target price and the current price and (ii) the forward net dividend yields of the stock. Stock price targets have an investment horizon of 12 months.
Sector Ratings Definition: Overweight An Overweight rating means stocks in the sector have, on a market cap-weighted basis, a positive absolute recommendation. Neutral A Neutral rating means stocks in the sector have, on a market cap-weighted basis, a neutral absolute recommendation. Underweight An Underweight rating means stocks in the sector have, on a market cap-weighted basis, a negative absolute recommendation.
Country Ratings Definition: Overweight An Overweight rating means investors should be positioned with an above-market weight in this country relative to benchmark. Neutral A Neutral rating means investors should be positioned with a neutral weight in this country relative to benchmark. Underweight An Underweight rating means investors should be positioned with a below-market weight in this country relative to benchmark.
Note: CIMB Research is a participant in the SGX StockFacts Research Programme and receives fees from the account maintained by SGX for providing research coverage on the Company.