Overview of GCMS System - WordPress.com · Overview of GCMS System Waters Korea ©2009 Waters...
52
2009-07-30 1 ©2009 Waters Corporation Overview of GCMS System Overview of GCMS System Waters Korea ©2009 Waters Corporation 2 Nitrogen Helium Hydrogen Components of a GC System Components of a GC System Carrier Gas Injector Column Detector Data Acquisition System Thermostatted Enclosure (Oven) Split/Splitless On-column PTV SPME Headspace Purge and Trap AutoSampler Packed Capillary FID ECD TCD NPD FPD MS(Quard, Tof, Sector, Ion trap) FID Capillary Column Split/Splitles s
Transcript of Overview of GCMS System - WordPress.com · Overview of GCMS System Waters Korea ©2009 Waters...

2009-07-30
1
©2009 Waters Corporation
Overview of GCMS SystemOverview of GCMS System
Waters Korea
©2009 Waters Corporation 2
�Nitrogen
�Helium
�Hydrogen
Components of a GC SystemComponents of a GC System
Carrier Gas Injector Column DetectorData
Acquisition System
Thermostatted Enclosure (Oven)
�Split/Splitless
�On-column
�PTV
�SPME
�Headspace
�Purge and Trap
�AutoSampler
�Packed
�Capillary
�FID
�ECD
�TCD
�NPD
�FPD
�MS(Quard, Tof, Sector, Ion trap)
FID
Capillary Column
Spl
it/S
plitl
ess

2009-07-30
2
©2009 Waters Corporation 3
Ionizations for GCMSIonizations for GCMS
EI(Electron Impact) CI(Chemical Ionization)
FI/FD(Fiel Ionization)
©2009 Waters Corporation 4
CI v. EICI v. EI

2009-07-30
3
©2009 Waters Corporation 5
Chemical IonizationChemical Ionization
©2009 Waters Corporation 6
Common Fragment Ions
m/z Ion Functional Group
15 CH3+ Methyl, alkane
29 C2H5+ OR HCO+ Alkane, aldehyde
30 CH2=NH2+ Amine
31 CH2=OH+ Ether or alcohol
43 C3H7+ OR CH3CO
+ Alkane, ketone
45 CO2H+ OR CHS+ Carboxylic Acid, thiophene
50,51 C4H2+•, C4H3
+ Aryl
77 C6H5+ Phenyl
83 C6H11+ Cyclohexyl
91 C7H7+ Benzyl (Tropylium ion)
105 C6H5C2H4+
CH3-C6H4-CH2+
C6H5CO+
Substituted Benzene Di-
substituted Benzene
Benzoyl
Stability of Molecular Ions
Aromatics>
Conjugated Alkenes>
Cyclic Compounds>
n-Alkanes>
ketones>
Amines >
Esters>
Ethers>
Carboxylic Acids, Aldehydesand Amides
Characteristic Fragment Ions Characteristic Fragment Ions Observed in EI SpectraObserved in EI Spectra

2009-07-30
4
©2009 Waters Corporation 7
Chemical IonizationChemical Ionization
©2009 Waters Corporation 8
Positive Chemical Positive Chemical IonizationIonization

2009-07-30
5
©2009 Waters Corporation 9
Negative Chemical IonizationNegative Chemical Ionization
©2009 Waters Corporation 10
� Principle :
� ion source is filled with reagent gas (eg. CH4) and 30-70 eV
� electrons are slowed down to thermal energy.
� These electrons can be “captured” by molecules that have
electronegative functional groups such as oxygen, sulphur
(cfr. Electron capture GC) and halogens.
� Gives rise to the formation of M●- ions
Negative Chemical IonisationNegative Chemical Ionisation

2009-07-30
6
©2009 Waters Corporation 11
CI vs EI CI vs EI –– Butyl caprylateButyl caprylate
m/z60 80 100 120 140 160 180 200 220 240 260
%
0
100
%
0
100201.2
145.1127.1
199.2173.2
218.2
229.2 241.2
145.1
127.1
56.1
101.173.0 146.1
©2009 Waters Corporation 12
FI Ionisation Theory FI Ionisation Theory

2009-07-30
7
©2009 Waters Corporation 13
FI Source Arrangement FI Source Arrangement
©2009 Waters Corporation 14
FI vs CI vs EI FI vs CI vs EI -- SensitivitySensitivity
Time5.00 6.00 7.00 8.00 9.00 10.00 11.00
%
0
100
5.00 6.00 7.00 8.00 9.00 10.00 11.00
%
0
100
5.00 6.00 7.00 8.00 9.00 10.00 11.00
%
0
100
FI Example Data TOF MS
TIC2.76e3
PCI Example Data TOF MS CI+ TIC
5.61e4
EI Example Data TOF MS EI+ TIC
7.67e4

2009-07-30
8
©2009 Waters Corporation 15
FI vs CI vs EI FI vs CI vs EI –– Butyl caprylateButyl caprylate
m/z60 80 100 120 140 160 180 200 220 240 260
%
0
100
%
0
100
%
0
100200.2
56.1 145.3116.4 157.1201.2
201.2
145.1127.1
199.2173.2
218.2 229.2
145.1127.1
56.1101.173.0 146.1
©2009 Waters Corporation 16
NIST Library
Acquired SpectrumM+. Predominant
Theoretical M+.
(mainlib ) Phenol, 2,6-d imethyl-10 20 30 40 50 60 70 80 90 100 110 120 130
0
50
100
15 18 26
27
29 3138
39
40
41
42
43
45 47 49
50
51
53
55 60 62
63
64
65
6668 74 76
77
78
79
80 82 86 89
91
93
95 98
103
107
122
OH
13:28:17
m/z55 60 65 70 75 80 85 90 95 100 105 110 115 120 125 130
%
0
100
%
0
100
APGC160408RUN007_8270 998 (4.491) Cm (995:1001-(965:986+1007:1053)) TOF MS AP+ 2.98e3122.0723
107.0498
121.0658 123.0782
APGC160408RUN007_8270 (0.021) Is (1.00,0.10) C8H10O TOF MS AP+ 9.12e12122.0732
123.0766
2,4-Dimethylphenol
APGC Ionization APGC Ionization Example: Charge TransferExample: Charge Transfer
2,4-Dimethylphenol

2009-07-30
9
©2009 Waters Corporation 17
Mass Spectrometers for GCMass Spectrometers for GC
� Quadrupoles
—Single
—Triple (aka tandem)
� Quadrupole Ion Trap
� Time of Flight
—Low Resolution
—Elevated Resolution
� Magnetic Sector
—Many possible configurations – EBE, BE common
©2009 Waters Corporation 18
Mass Spectrometers for GCMass Spectrometers for GC
� Advantages
+ Ease of use
+ Cost
+ Dynamic range
O Disadvantagesー No MS/MS ー Mass accuracyー Resolving powerー Scanning instrument
Single Quadrupole

2009-07-30
10
©2009 Waters Corporation 19
Mass Spectrometers for GCMass Spectrometers for GC
� Advantages
+ Ease of use
+ MS/MS Capability
+ Excellent Dynamic range
O Disadvantagesー Mass accuracyー Resolving powerー Scanning instrument
Triple Quadrupole
©2009 Waters Corporation 20
Mass Spectrometers for GCMass Spectrometers for GC
� Advantages
+ Ease of use
+ Cost
+ MS/MS
+ Full scan sensitivity
+ Low speed for Multi-residues
O Disadvantagesー Mass accuracyー Resolving powerー Dynamic rangeー Scanning instrument
Ion Trap

2009-07-30
11
©2009 Waters Corporation 21
Mass Spectrometers for GCMass Spectrometers for GC
� Advantages
+ Mass accuracy
+ Excellent resolving power
+ Excellent dynamic range
+ Linked scan functions
O Disadvantagesー Complexー Costー Sizeー Scanning instrument
Sector
©2009 Waters Corporation 22
Mass Spectrometers for GCMass Spectrometers for GC
� Advantages
+ Ease of use
+ Dynamic range
+ Excellent sampling rate
+ No spectral skew
+ High full scan sensitivity
O Disadvantagesー No MS/MS ー Mass accuracyー Resolving power
TOF
(Low Resolution)

2009-07-30
12
©2009 Waters Corporation 23
Mass Spectrometers for GCMass Spectrometers for GC
� Advantages
+ Ease of use+ Good sampling rate+ No spectral skew+ High full scan sensitivity+ Resolving power+ Mass accuracy
O Disadvantagesー No MS/MS ー Dynamic Range
TOF
(High Resolution)
©2009 Waters Corporation 24
‘Non‘Non--skewed’ spectraskewed’ spectra
Quadrupole
TOF
≠≠≠≠
=
oa-TOF
Fewer points required across
the peak for accurate
quantification

2009-07-30
13
©2009 Waters Corporation 25
Trend in Analytical Method DevelopmentTrend in Analytical Method Development
Sample
Preparation
Compound
SpecificGeneric Generic Generic
Separation /
Detection
Compound
Specific
Compound
SpecificGeneric Generic
Data
Processing
Compound
Specific
Compound
Specific
Compound
SpecificUntargeted
ResultsGC-ECD
GC-MS (SIR)
GC-MS (SIR)
GC-MS/MSGC-TOF >GC-TOF
©2009 Waters Corporation 26
Waters GC/MS SystemsWaters GC/MS Systems
GCT Premier Quattro micro GC
AutoSpec Premier
Xevo APGC

2009-07-30
14
©2009 Waters Corporation 27
GC/MS ApplicationsGC/MS ApplicationsApplications QMGC (MS/MS) GCT P (HR-TOF) Autospec P (Sector) APGC (MS/MS) APGC (Q-tof)Flavors/Fragrans ResearchFlavors/Fragrans MonitoringCore Analytical LabPetroChemical AnalysisImpurity IDImpurity Monitoring(Food safety, Pesticides..)Environmental Applications(Dioxin, POPs..)Metabonomics/Biomarker DiscoveryMetabonomics/Biomarker MonitoringToxicology, Forensics, Drug Screening
©2009 Waters Corporation 28
Why GC/MSMSWhy GC/MSMS System?System?
� Analysis of 100 or more multi residues in single run
- Common GC Detectors: NPD, ECD…??? – NO!!!
- LODs at or lower than the reporting level
� Single quadrupole and ion trap suitable for simple matrices where
LOD > 0.01mg/kg required
- Insufficient selectivity for baby food and complex food matrices,
e.g. garlic, ginger, herbs, spices etc.
� Selective MS detection method(MRM)
- require to compensate for less selective sample prep.

2009-07-30
15
©2009 Waters Corporation 29
What can it be used for?What can it be used for?
� Versatility:
� Use to provide mass spectral information
� Use to provide structural information
� Use for fragment scan analysis
� Use to identify compounds in a mixture
having common functional groups
� Use to provide structural information
� Use to monitor highly specific and characteristic precursor
to product ion transitions for the quantitation of
trace levels of target compounds in complex matrices
©2009 Waters Corporation 30
Why MSMS?Why MSMS?MS v. MS/MS Example : Ethion 13.14minsMS v. MS/MS Example : Ethion 13.14mins
MRM SIR
MS/MSData
MSData

2009-07-30
16
©2009 Waters Corporation 31
Why GC/MSMS(Identification Points)?Why GC/MSMS(Identification Points)?
MS-based confirmatory method
Require 3 or 4 points
(Decision 657/2002/EC)
©2009 Waters Corporation
Analysis of Persistant Organic Pollutants Analysis of Persistant Organic Pollutants
(POPs) by GC/MS/MS(POPs) by GC/MS/MS

2009-07-30
17
©2009 Waters Corporation 33
Global concerns about POPsGlobal concerns about POPs
� Toxicity
— POPs have been linked to adverse health effects in humans and wildlife by many studies
� Persistence
— POPs resist natural degradation processes and can remain in the environment for a long time
� Long-range Transport
— POPs generated in one region can travel large distances by wind, water and, to a lesser extent, migratory species
� Bioaccumulation
— POPs are readily absorbed into fatty tissue and become more concentrated as they move up the food-chain
� Compounds of interest include
— Poybrominated Diphenyl ethers (PBDEs)
— Dioxins and Furans
— Polychlorinated biphenyls (PCBs)
©2009 Waters Corporation 34
Why use tandem MS/MSWhy use tandem MS/MS
� Traditionally an application for high resolution MS
—Offers ultimate sensitivity and high selectivity
— But at a price (capital and on-going costs)
� Some low resolution work on single quads and ion traps
but often limited quantitative applicability
—Matrix effects may dictate multiple sample clean-up steps
— Limited use of 13C12 internal standards for quantitation
� Tandem quad MS/MS potentially offers …
—Cost effective ease of use
— Good sensitivity and dynamic range
— Highly selective analysis eliminating potential interferences
— Good quantitative accuracy on real samples using 13C12
internal standards for screening applications.

2009-07-30
18
©2009 Waters Corporation 35
Application:PBDEs backgroundApplication:PBDEs background
� Substantial use; production of PBDEs peaked at >65k
tonnes
� Widespread use as flame retardants, in electronics,
furniture, automotive and other consumer industries
� Persistent and bioaccumulative compounds meeting
Stockholm Convention requirements for POPs.
� Found in many biota and human adipose tissue at
increasing levels over past 30 years
� Concerns over long term effects on human health,
notably as neurodevelopmental disruptors
©2009 Waters Corporation 36
Approaches to PBDE analysisApproaches to PBDE analysis
� Historically, methods have relied upon GC-HRMS, or
GC-LRMS
—GC-HRMS :- expensive, operated in EI+ ion mode allowing
use of 13C12 labelled internal standards – highly selective,
highly sensitive
— GC-LRMS :- relatively cheap, CI- ion mode generally
detect Br- (79/81), use of 13C12 labelled internal standards
very limited, low selectivity, sensitive
� More recently, GC-MS/MS has been used
— Provides relatively cheap, easy to use option
— Highly selective method for PBDEs in EI+
— Allows use of 13C12 labelled internal standards for accurate
quantitation

2009-07-30
19
©2009 Waters Corporation 37
Advantages of GC tandem quad Advantages of GC tandem quad MS/MS for PBDE analysisMS/MS for PBDE analysis
� PBDEs fragment readily, giving highly specific patterns
— Can generate a highly selective MS/MS experiments
— Minimise interferences present in other techniques
� QmGC mass range (to m/z 1500) allows the determination of
Deca BDE, using MRMs from the molecular ion cluster
— Can obtain ‘true’ confirmation of the presence of the target compound
� Stable instrument calibration. (Single calibration may last for
months)
— No need for a daily location and regulation of reference peaks as with
high resolution MS instruments
— No need to work with reference compound across a wide mass range
— No need to have reference compound present during analysis
o Maintains source cleanliness
o Reduces background chemical noise
©2009 Waters Corporation 38
Instrument calibrationInstrument calibrationTris(perfluoroheptyl)Tris(perfluoroheptyl)--1,3,51,3,5--triazinetriazine

2009-07-30
20
©2009 Waters Corporation 39
BDE#47 BDE#47 Full scan spectrumFull scan spectrum
� Full scan mass spectrum for 2,2’,4,4’-TetraBDE (BDE#47)
— See molecular ion cluster
— And most abundant fragment is [M-Br2]+ for tri-deca BDEs
©2009 Waters Corporation 40
BDE#47 BDE#47 Product scan spectrum from [M]Product scan spectrum from [M]++
� Product scan mass spectrum for BDE#47
— Spectra dominated by Br2 loss from the [M]+ for di-deca BDEs
— Provides good product ion candidates for sensitive, selective
MRMs
-2Br

2009-07-30
21
©2009 Waters Corporation 41
BDE#47 BDE#47 Product scan spectrum from [MProduct scan spectrum from [M--BrBr22]]
++
� Daughter scan mass spectrum for BDE#47
— Shows loss of COBr2 in this case,,from the M-Br2 major fragment
ion
— Again good product ion candidates for MRM
-COBr2
©2009 Waters Corporation 42
Development of analytical methodDevelopment of analytical method
• Analysis performed on three GC columns to assess relative
sensitivity and separation
— All injections made in splitless mode
— Temperature programs designed to provide adequate separation
across mono-deca BDE range
— Calibration using multi-level standards (27 native components)
— Quantify using internal standard method with 13C12 congeners
(one for each level of bromination)
— For each congener and 13C12 internal standard two MRMs were
recorded allowing for quantitation and confirmatory analysis in a
single run
— MRM experiment arranged in 10 function windows corresponding
to mono-deca BDEs and overlapped in time where necessary to
collect full data set for each level of bromination.

2009-07-30
22
©2009 Waters Corporation 43
15m DB115m DB1--HTHTseparation of 27 congenersseparation of 27 congeners
©2009 Waters Corporation 44
� Best separation given by 20m DB5-ms, 15m DB1-HT
separation ‘fit for purpose’ <50% valley
GC separation of critical congener pairGC separation of critical congener pair

2009-07-30
23
©2009 Waters Corporation 45
Comparative sensitivity Comparative sensitivity between columnsbetween columns
0
2
4
6
8
10
12
14
16
18
20
LO
D (
pg
on
co
lum
n)
BD
E#3
BD
E#7
BD
E#1
5
BD
E#1
7
BD
E#2
8
BD
E#4
9
BD
E#7
1
BD
E#4
7
BD
E#6
6
BD
E#7
7
BD
E#1
00
BD
E#1
19
BD
E#9
9
BD
E#8
5
BD
E#1
26
BD
E#1
54
BD
E#1
53
BD
E#1
38
BD
E#1
56
BD
E#1
84
BD
E#1
83
BD
E#1
91
BD
E#1
97
BD
E#1
96
BD
E#2
07
BD
E#2
06
BD
E#2
09
PBDE
15m HT1 30m HT1 20m DB5
The limits of detection and quantification were calculated for each of the three GC columns.
©2009 Waters Corporation 46
Quantitative resultsQuantitative results
� Five Bio-solid and a number of air emission samples were
analysed as part of the sequence
� Each sample had been previously acquired by high resolution
methods using an AutoSpec Ultima NT
—MTM Research Centre, Örebro University, Sweden
— Ontario Ministry of Environment, Toronto, Canada
� BDEs #47 & #209 used as examples of the comparative
quantitative results obtained.

2009-07-30
24
©2009 Waters Corporation 47
Quantitative resultsQuantitative resultsfor BDE#47 and BDE#209for BDE#47 and BDE#209
Matrix GC-MSMS (ng/g) GC-HRMS (ng/g)Liquid stabilised biosolid 482 530Liquid stabilised biosolid 311 350dewatered biosolid 435 490Fish tissue 8.81 8.8Freeze dried fish tissue 139 150
Comparative data for BDE#47
Matrix GC-MSMS (ng/g) GC-HRMS (ng/g)Liquid stabilised biosolid 297 340Liquid stabilised biosolid 264 290dewatered biosolid 1630 1700Fish tissue 0.32 0.4Freeze dried fish tissue 0.4 0.3
Comparative data for BDE#209
©2009 Waters Corporation 48
MS/MS v HRMS Comparative dataMS/MS v HRMS Comparative data
0
400
800
1200
1600
0 500 1000 1500
GC/MS/MS (ng/g)
GC
/HR
MS
(n
g/g
) R2=0.9991Bias 4%

2009-07-30
25
©2009 Waters Corporation 49
BDE#47 in a fish tissue extractBDE#47 in a fish tissue extract8.8ng/g8.8ng/g
©2009 Waters Corporation 50
BDE#209 in a biosolid extractBDE#209 in a biosolid extract297ng/g297ng/g

2009-07-30
26
©2009 Waters Corporation 51
Summary of PBDEs analysis by GC Summary of PBDEs analysis by GC tandem quadrupole MS/MStandem quadrupole MS/MS
� Simple, stable instrument calibration over broad mass
range
� Sensitive and highly selective MRMs selected allowing
quantitation and confirmatory analysis in single run
� Rapid analysis achieved on short columns
� Good calibration linearity and stability using 13C12
internal standards
� Excellent agreement with HR-MS for real samples
� Waters Application Note “A study of the analysis of
polybrominated diphenyl ether flame retardants by
GC/MS/MS” www.waters.com
©2009 Waters Corporation
Dioxin Screening with the Dioxin Screening with the
Quattro Micro GCQuattro Micro GC

2009-07-30
27
©2009 Waters Corporation 53
Application: Dioxins/Furans Application: Dioxins/Furans backgroundbackground
� PCDDs/PCDFs consist of 210 individual congeners, 17 of
which are targeted as “toxic”.
O
O
Cl
Cl
Cl
Cl
OCl
ClCl
Cl
Cl
75 congeners 135 congeners
• Produced unintentionally in various industrial and combustion processes.
• Listed in the Stockholm Convention “dirty dozen”
• Extensive legislation and monitoring in the environment and food chain due to bioaccumulative nature and toxicology findings
©2009 Waters Corporation 54
PCDD/DFs analytical challengesPCDD/DFs analytical challenges
� Correctly identifying and quantifying 17 toxic congeners
among 193 others.
� Low levels present; typically ppb and ppt.
� Matrix effects (significant clean-up may be required).
� Resolving interferences from related compounds such as
PCBs which are often at much higher levels.
� Traditional solution has been to use GC with high
resolution magnetic sector mass spectrometry.

2009-07-30
28
©2009 Waters Corporation 55
� In recent years, screening has become more and
more common
—Screening is a lower cost alternative for large studies
—Screening methods should be simple to operate, rapid
and cost effective, when compared with confirmatory
high resolution analyses
� Screening of sites/samples is now accepted by
legislation (European Union) for food safety
monitoring
— Although at least 10% of samples must be confirmed by
high resolution (e.g. AutoSpec Premier) analysis
Background to Dioxin ScreeningBackground to Dioxin Screening
©2009 Waters Corporation 56
� GC-MSMS methods can provide a highly selective screening
method
—Chemical determination giving comparable TEQ results when
compared with high resolution
� Dioxins/Furans give a highly specific fragmentation
—Good degree of selectivity, easy to set up, can do confirmatory
analysis
� MRM analysis
—Records compound specific transitions for each target analyte
— High selectivity, High sensitivity, no interference from PCBs
Advantages of GC/MS/MS Advantages of GC/MS/MS for Dioxin screeningfor Dioxin screening

2009-07-30
29
©2009 Waters Corporation 57
� MRM conditions
— Firstly, acquire standard in product scan mode, to identify the
most intense product ions, from the two most intense ions of
the molecular ion cluster of each target compound
— Example of product scan of m/z 339.9, (PeCDFs)
— Most intense product ion found to be M-[CO35Cl] for all of the
PCDD/Fs, or M-[13CO35Cl] for the 13C12 labelled internal
standards
Dioxin/Furans Fragmentation patternDioxin/Furans Fragmentation pattern
©2009 Waters Corporation 58
� MRM optimisation
—Daughter scans repeated at different collision cell energies to
optimise transition sensitivity
� MRM experiment
— Two transitions monitored for each dioxin, furan and 13C-
labelled dioxins and furan internal standards
� Multiple function acquisition
— Five acquisition functions created, function 1 monitoring tetra-
chlorinated congeners, function 2 monitoring penta-chlorinated
congeners, through to function 5 monitoring octa-chlorinated
congeners
Quattro Micro GC Quattro Micro GC Experimental conditionsExperimental conditions

2009-07-30
30
©2009 Waters Corporation 59
� Overlapping functions
— 1,2,8,9-TCDF and 1,3,4,6,8-PeCDF acquired
Quattro Micro GC Quattro Micro GC GC Separation GC Separation –– acquired peaksacquired peaks
©2009 Waters Corporation 60
� Temperature ramp optimised to satisfy EU legislation
— Separation of 1,2,3,4,7,8-HxCDF and 1,2,3,6,7,8-HxCDF must be
<25% valley. A 13% valley separation is obtained under these
conditions. This chromatogram is injection number 80 from the batch
runs.
� OCDF elutes <20mins
— Rapid analysis time, maintaining required separation, maximum
throughput
Quattro Micro GC Quattro Micro GC GC ConditionsGC Conditions

2009-07-30
31
©2009 Waters Corporation 61
� Reproducibility
—%RSD values calculated for 25 injections, as part of a series of >80 injections
— RRF, ion ratio and retention times all show low %RSD values
— Indicates stable response and chromatography over extended time period
Quattro Micro GC Quattro Micro GC ReproducibilityReproducibility
©2009 Waters Corporation 62
Quattro Micro GC Quattro Micro GC calculated concentrationscalculated concentrations
� Single sample injection from
each day selected
—Calculated concentration
compared with Certified values
and confirmed by confirmatory
(HRGC-HRMS) analysis on Waters
AutoSpec Ultima NT
— Certified values are
Carp 18.2 ng/kg
Flyash 900 ng/kg
� Good agreement with certified
values
—Confidence in results

2009-07-30
32
©2009 Waters Corporation 63
Quattro Micro GC Quattro Micro GC
TCDFs in flyashTCDFs in flyash
©2009 Waters Corporation 64
Quattro Micro GC Quattro Micro GC
TCDFs in carpTCDFs in carp
2009-07-30
33
©2009 Waters Corporation 65
Summary PCDD/DFs analysis by GC Summary PCDD/DFs analysis by GC tandem quadrupole MS/MS tandem quadrupole MS/MS
� Rapid screening method to compliment high resolution
MS for all toxic and non-toxic congeners
� High selectivity achieved using MRM experiments
minimizes interferences and enables confirmatory
analysis in one run
� Stable and robust calibration enables accurate
quantitation
� Excellent agreement with high resolution MS
� Waters Application Note “A single injection screening
method for tetra-octa chlorinated PCDD/Fs in fish and
flyash matrices using GC triple quadrupole MS/MS”
www.waters.com
©2009 Waters Corporation 66
Conclusions Conclusions
� The Quattro micro GC has demonstrated …
—Good sensitivity and high selectivity enabling quantitation and
confirmation of significant POP classes including dioxins/furans
and PBDEs.
— Strong performance in terms of working mass range, calibration
linearity and stability, and ion ratio accuracy and precision. All
critical factors for quantitative accuracy
— Excellent correlation with high resolution MS for real samples.
� GC tandem quadrupole MS/MS can provide …
— A sensitive, rapid, cost effective method for analysis of PBDEs
enabling accurate quantitation and confirmatory analysis in one
run.
— A rapid, robust and cost effective screening method for
dioxins/furans with excellent quantitative accuracy

2009-07-30
34
©2009 Waters Corporation
Multiresidue Analysis of Priority Multiresidue Analysis of Priority
Pollutants in Surface Waters using Pollutants in Surface Waters using
Exact Mass GCExact Mass GC--TOF/MSTOF/MS
©2009 Waters Corporation 68
Compound ListCompound ListBenzidines
Benzidine
3,3’-dichlorobenzidine
Chloroanilines
2-chloroaniline
3-chloroaniline
4-chloroaniline
2,6-dichloroaniline
2,4-dichloroaniline
2,5-dichloroaniline
2,3-dichloroaniline
3,5-dichloroaniline
3,4-dichloroaniline
4-chloro-2-nitroaniline
Chloronitrotoluenes
2-chloro-6-nitrotoluene
4-chloro-2-nitrotoluene
4-chloro-3-nitrotoluene
Miscellaneous
Biphenyl
Tributhyl phosphate
Trifluralin
Propanil
BentazonePyrazon
Chlorophenols
2-chlorophenol
2,4-dichlorophenol
3-chlorophenol
4-chlorophenol
4-chloro-3-methylphenol
2,3,5-trichlorophenol
2,4,6-trichlorophenol
2,4,5-trichlorophenol
2,3,4-trichlorophenol
2,3,6-trichlorophenol
2-amino-4-chlorophenol
Chlorotoluidines
2-chloro-4-toluidine
Voltaile Amines
Cumene
PCBs
PCB 28 PCB 52 PCB 101 PCB 77 PCB 118 PCB 153 PCB 138 PCB 126PCB 180 PCB 169
Chloronitrobenzenes
1-chloro-3-nitrobenzene
1-chloro-4-nitrobenzene
1-chloro-2-nitrobenzene
3,5-dichloronitrobenzene
2,5-dichloronitrobenezene
2,4-dichloronitrobenzene
3,4-dichloronitrobenzene
2,3-dichloronitrobenzene
1-chloro-2,4-dinitrobenzene
PAHs
Naphthalene
Phenanthrene
Anthracene
Fluoranthene
Benzo[b]fluoranthene
Benzo[k]fluoranthene
Benzo[a]pyrene
Indeno(1,2,3-cd)pyrene
Benzo[ghi]perylene
Dibenz(a,h)anthracene
Phenylureas
Monolinuron
Linuron
Organochlorines
Hexachlorobenzene
α-Hexachlorocyclohexane
β-Hexachlorocyclohexane
Lindane
δ-Hexachlorocyclohexane
Heptachlor
Aldrin
Isodrin
o,o'-DDE
α-Chlordane
α-Endosulfan
o,p'-DDE
γ-Chlordane
Dieldrin
p,p'-DDE
o,p'-DDD
Endrin
β-Endosulfan
p,p'-DDD
o,p'-DDT p,p'-DDT
Triazines
Simazine
Atrazine
Organophosphorus
Dichlorvos
Mevinphos(Z)
Mevinphos(E)
Omethoate
Demeton-S-methyl
Dimethoate
Demethon-O
Disulfoton
Fenitrothion
Fenthion
Malathion
Parathion-ethyl
Parathion-methyl
Azinphos-methyl
Azinphos-ethyl Coumaphos
Halogenated Compounds
Hexachlorobutadiene
1,2-dichloronaphthalene
1,2,3,4-tetrachloronaphthalene

2009-07-30
35
©2009 Waters Corporation 69
� Extract, detect, locate and identify all components
—Minimal non-selective sample preparation for a wide range of
compound groups with different polarities
— Simple high resolution GC separation to minimise matrix
interference whilst maintaining resolution of critical pairs
— High sensitivity
— Full mass spectrum
— Automated peak detection and deconvolution of all components
in the sample
— Automated production of background subtracted spectra for each
component
— Automated library search and identification
— Exact mass may help identification
— Estimate the concentrations of all the components in the sample
Screening RequirementsScreening Requirements
©2009 Waters Corporation 70
GCT PremierGCT PremierOrthogonal Acceleration TOFOrthogonal Acceleration TOF
� Rapid full spectral sampling and acquisition rates
—Non skewed spectra
— Narrow chromatographic peaks
— Accurate chromatographic peak profiling enabling deconvolution
� Non scanning instrument with a high duty cycle
—High full scan sensitivity
� Predictable scan law
—Routine exact mass calibration with a single lock mass
� Elevated Resolution
— Enhanced selectivity

2009-07-30
36
©2009 Waters Corporation 71
GCT PremierGCT Premier
� Plug in EI/CI ion volumes for rapid change over
� Resolution
—Greater than 7000 (Full width half maximum)
� Exact mass
— Less than 5ppm RMS
� Dynamic range
— 4 orders linear dynamic range
� Spectral acquisition rate
— 20 spectra per second
©2009 Waters Corporation 72
GCT Premier ParametersGCT Premier Parameters
� Electron Impact (EI+) with a mass range of m/z 50 → 550
� Acquisition Speed = 10 spectra / s
� 2,4,6-tris-(trifluoromethyl)-1,3,5-triazine lock mass
—m/z = 284.9949
� Dynamic Range Enhancement (DRE) On
� Low Mass Cut Off = 45
� Electron Energy = 70 eV
� Trap Current = 200 µA
� Source Temperature = 200 °C
� Interface Temperature = 280 °C

2009-07-30
37
©2009 Waters Corporation 73
� Agilent 6890 with CTC CombiPal autosampler
� Pulsed splitless injection, 1 µL
— 4 mm i.d. double taper deactivated liner
— 140 kPa pulse for 1.1 min
� J & W Scientific, DB-17MS, 30 m x 0.25 mm i.d., 0.25 µm
� Constant flow rate of 1.0 mL/min helium
� Oven temperature program
GC ConditionsGC Conditions
Ramp rate, °C/min Hold, min
40 °C 1
310 °C @ 15 °C/min 11
Total run time30min
©2009 Waters Corporation 74
Resolution of Critical PairsResolution of Critical Pairs
3- and 4-Chlorophenol
128.003
Mevinphos E and Z
192.020
o,p’-DDT and p,p’-DDD
235.008

2009-07-30
38
©2009 Waters Corporation 75
Total Ion Chromatogram Total Ion Chromatogram TICTIC
Cum
ene
Ben
zo(g
hi)p
eryl
ene
©2009 Waters Corporation 76
� 200 mL filtered water adjusted to pH 4.0 with 1N HCl
� Sample spiked with 500ng internal standards
� d5-nitrophenol, 2-fluorobiphenyl, p-terphenyl-d14
� Waters Oasis HLB 60 mg, 3cc SPE cartridge
� Conditioned with 6 mL DCM, 6 mL acetonitrile, 6 mL water
� Sample loaded @ ~ 6 mL/min
� Cartridge washed with 1mL water and N2 dried for 20 mins
� Elution with 2 x 2.5 mL DCM
� Volume adjusted to 0.5 mL with N2 @ ambient temperature
� 500ng recovery standard added
� d10-anthracene
� 400 fold concentration step during extraction
Extraction ProcedureExtraction Procedure

2009-07-30
39
©2009 Waters Corporation 77
Extraction ResultsExtraction ResultsSpiked Drinking WaterSpiked Drinking Water
• Good overall recovery @ 0.5 µg/L (n = 5)
– 4-chloroaniline and 3,4,5-trichlorophenol gave very low
recoveries (Mean recovery = 32% and 14%)
– DCM extract had no effect on chromatography
– Good recovery of low boiling point compounds
Mean Recovery Number of Compounds (%)
70 - 120% 79 (72%)
50 - 70% 9 (8 %)
< 50% 14 (13%)
>120% 8 (7%)
©2009 Waters Corporation 78
Extraction ResultsExtraction ResultsSpiked Drinking WaterSpiked Drinking Water
0
20
40
60
80
100
120
140
160
0 20 40 60 80 100
Compound Number
% R
ec
ov
ery

2009-07-30
40
©2009 Waters Corporation 79
Method LODsMethod LODs
No. Compounds
< 0.1 µg/L
No. Compounds
> 0.1 µg/L
InstrumentScreening 102 1
Confirmation 101 2
Method
Drinking WaterScreening 101 2
Confirmation 98 5
Surface WaterScreening 101 2
Confirmation 99 4
• Summary of LODs, based upon peak-to-peak S/N of 3:1
– Screening LOD is based on one exact mass per compound
– Confirmation LOD is based on two exact masses per compound
with a peak area ratio between them
– Instrument LOD is based on solvent standards
– Method LOD is based on mean recovery (n = 5) from 0.5 µg/L
spiked water extracts
©2009 Waters Corporation 80
Targeted Screening and Targeted Screening and ConfirmationConfirmation
� Compound list is known
— TargetLynx application manager
— Extracted exact mass chromatograms, 0.05 Da window
— Highlight samples that…
…do not pass quality control criteria
…have concentrations greater than the reporting level
— Screening is based on one exact mass chromatogram
— Confirmation is based on two exact mass chromatograms
with a peak area ratio between them

2009-07-30
41
©2009 Waters Corporation 81
Selectivity of Exact Mass Selectivity of Exact Mass ChromatogramsChromatograms
Chlorophenols (CP), 0.1 µg/L in Surface Water
2-CP 4-CP3-CP
1.0 Da
0.02 Da
©2009 Waters Corporation 82
Selectivity of Exact Mass Selectivity of Exact Mass ChromatogramsChromatograms
Isodrin, 0.1 µg/L in Surface Water, Screening = 192.0379
1.0 Da
0.02 Da

2009-07-30
42
©2009 Waters Corporation 83
Selectivity of Exact Mass Selectivity of Exact Mass ChromatogramsChromatograms
Isodrin, 0.1 µg/L in Surface Water, Confirmation = 194.9349
1.0 Da
0.02 Da
©2009 Waters Corporation 84
SensitivitySensitivityScreening versus ConfirmationScreening versus Confirmation
Dichlorvos, 0.1 µg/L in Surface Water
Screening109.006
Confirmation109.006
184.977

2009-07-30
43
©2009 Waters Corporation 85
Compound name: 2,5-DichloroanilineCorrelation coefficient: r = 0.999139, r^2 = 0.998278Calibration curve: 1.9991 * x + -0.305329Response type: Internal Std ( Ref 26 ), Area * ( IS Conc. / IS Area )Curve type: Linear, Origin: Exclude, Weighting: 1/x, Axis trans: None
Conc0 50 100 150 200 250 300 350 400 450 500
Re
spo
nse
0
200
400
600
800
1000
LinearityLinearity
2,5-Dichloroaniliner2 = 0.9983
Concentration Range1 - 500 pg/µL equivalent to
0.005 – 2.5 µg/L
©2009 Waters Corporation 86
TargetLynx BrowserTargetLynx Browser

2009-07-30
44
©2009 Waters Corporation 87
Untargeted ScreeningUntargeted Screening
� Compound list is unknown
—ChromaLynx application manager
— Automatic peak detection and deconvolution
— Automatic production of background subtracted spectra
— Automatic identification via library searching
— Exact mass confirmation
©2009 Waters Corporation 88
DeconvolutionDeconvolution
5 Components?
2009-07-30
45
©2009 Waters Corporation 89
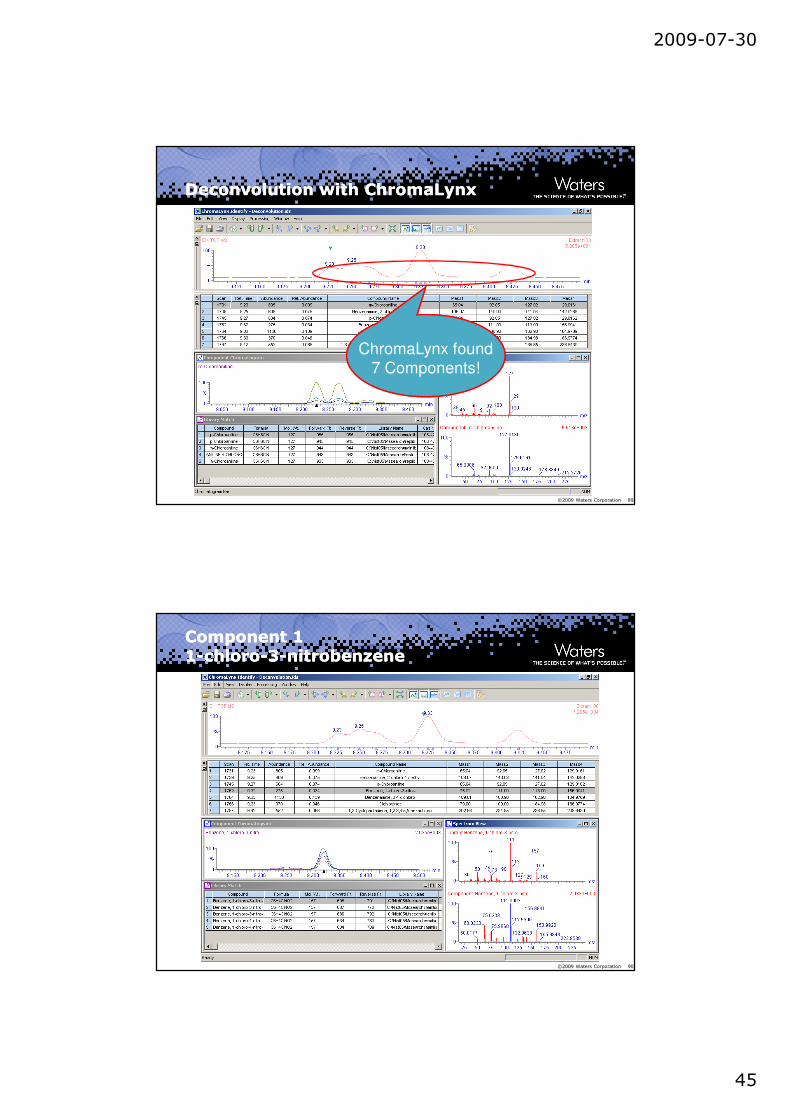
Deconvolution with ChromaLynxDeconvolution with ChromaLynx
ChromaLynx found 7 Components!
©2009 Waters Corporation 90
Component 1Component 111--chlorochloro--33--nitrobenzenenitrobenzene

2009-07-30
46
©2009 Waters Corporation 91
Component 2Component 22,62,6--dichloroanilinedichloroaniline
©2009 Waters Corporation 92
Component 3Component 3DichlorvosDichlorvos

2009-07-30
47
©2009 Waters Corporation 93
Extracted Mass ChromatogramsExtracted Mass Chromatograms3 Components3 Components
1-chloro-3-nitrobenzene
Dichlorvos
2,6-dichloroaniline
©2009 Waters Corporation 94
Spiked Surface WaterSpiked Surface WaterChromaLynxChromaLynx
ChromaLynx found ~ 800 Components
180 compounds were spiked @ 0.5 µg/Lof which ~ 100 are in the targeted method

2009-07-30
48
©2009 Waters Corporation 95
Spiked Surface WaterSpiked Surface WaterDibenzofuranDibenzofuran
©2009 Waters Corporation 96
ConclusionsConclusions
� A method has been presented for the targeted confirmation
of > 100 priority pollutants using Oasis SPE cartridges and the
GCT Premier with TargetLynx
� A majority of the pollutants can be confirmed to concentration
levels of < 0.1 µg/L in surface waters using a single injection
technique and exact mass chromatograms
� The method can also be extended to larger numbers of
residues without loss in sensitivity due to the full spectrum
approach provided by TOF instruments
� This single injection can also be used to screen for non-
targeted residues in the same extract with ChromaLynx
� ChromaLynx enables automatic detection, deconvolution,
library searching and exact mass confirmation

2009-07-30
49
©2009 Waters Corporation 9797
Standard Tune Page Parameters & Potential
Energy Diagrams
©2009 Waters Corporation 98
Outer Source TuningOuter Source Tuning

2009-07-30
50
©2009 Waters Corporation 99
Source ParametersSource Parameters
� There is a wide
range of
“acceptable”
parameters for the
tuning of the
Quattro micro GC
source!
©2009 Waters Corporation 100
MS1 Analyser ParametersMS1 Analyser Parameters
� Resolution at “default” setting (15) for MS1, MS2 Resolution settings do not effect MS1 Beam
� High Entrance and Exit (50 V) on collision cell
� Small DC voltage applied to collision rods (2)
� MS1 has “Optimum” Ion Energy (approx. 0.5*)
� MS2 has high Ion Energy (approx. 3)
� Note: SIR mode will use similar parameters, IE1 should increase to 1V and LM/HMRes1 should decrease to give FWHM of 0.8 Da

2009-07-30
51
©2009 Waters Corporation 101
MS2 Analyser ParametersMS2 Analyser Parameters
� Resolution at “default” setting (15) for MS2, MS1 Resolution settings do not effect MS2 Beam
� Low Entrance and Exit (2 V) on collision cell
� Small DC voltage applied to collision rods (2)
� MS2 has “Optimum” Ion Energy (approx. 0.5*)
� MS1 has high Ion Energy (approx. 3)
� Note: Small changes to entrance, collision and exit may effect sensitivity, and so should be tuned
©2009 Waters Corporation 102
MSMS Analyser ParametersMSMS Analyser Parameters
� Lower resolution & raise Ion Energy to get more sensitivity
� Entrance may optimise zero or slightly negative- v. important to tune
� This gives ions longer in the collision cell and may result in more fragmentation
� Collision Energy must be tuned!

2009-07-30
52
©2009 Waters Corporation 103
Any Question?Thank You