Overview of Distressed and Special Situation Investing Presentation to Wharton...
96
Presentation to Wharton School of Business March 2014 This presentation, furnished on a confidential basis to the recipient, does not constitute an offer of any securities or investment advisory services. It is intended exclusively for the use of the person to whom it has been delivered by Wolf Capital Management LLC, and it is not to be reproduced or redistributed to any other person without the prior consent of Wolf Capital Management LLC. Overview of Distressed and Special Situation Investing
Transcript of Overview of Distressed and Special Situation Investing Presentation to Wharton...

Presentation to Wharton School of Business March 2014
This presentation, furnished on a confidential basis to the recipient, does not constitute an offer of any securities or investment advisory services. It is intended exclusively for the use of the person to whom it has been delivered by Wolf Capital Management LLC, and it is not to be reproduced or redistributed to any other person without the prior consent of Wolf Capital Management LLC.
Overview of Distressed and Special Situation Investing

Introduction to Distressed and Special Situation Investing
2 Confidential

Introduction Distressed and Special Situation investing represents a broad spectrum of investment strategies
that seek to capitalize on market dislocations or other events to purchase assets at what is hoped to be a significant discount to their intrinsic value
Distressed debt is typically defined as trading at >1000bp over Treasuries or below 80 cents on the dollar for bonds and below 90 for leveraged loans
In the wake of the 2008 credit crisis distressed investing gained increased prominence as distressed opportunities in global credit markets exploded
In anticipation of the crisis a great deal of money had been raised by distressed and credit opportunity funds, nevertheless, many were caught over-invested and over-leveraged when the crisis hit
In 2008 the vast majority of distressed and credit opportunity funds experienced substantial losses, down 50% or more
In 2009 as a result of TARP and Quantitative Easing the markets stabilized and distressed and credit funds came roaring back generating 70%+ returns. By 2010 most funds had hit their “high water mark” and were able to again collect performance fees. This was the best year for distressed since 2002-03 cycle
In July and October 2011 the US credit markets experienced violent sell offs as the result of fears over a European sovereign debt crisis and lackluster US economic growth
The $64,000 question remains when the next cycle will begin, not if there will be another one. This seems to be a forgone conclusion given the excess credit in the system. Current central bank policies around the globe are likely sowing the seeds of the next crisis
3 Confidential

Distressed and Event Driven Strategies Distressed investing represents a broad spectrum of investment strategies that seek to capitalize
on market dislocations or other events to purchase assets at what is hoped to be a significant discount to their intrinsic value
Distressed debt is typically defined as trading at >1000bp over Treasuries or below 80 cents on the dollar for bonds and below 90 for leveraged loans
Within the broad spectrum of distressed investing there are several sub strategies including: Distressed for control (a/k/a distressed private equity)
Oaktree Centerbridge Cerberus
Activist Distressed/Event Driven (non-control Focus) Aurelius Elliot Third Point
Credit Opportunities Contrarian Caspian Golden Tree
Middle Market Distressed (Control distressed in the middle market) Littlejohn Versa Ares
4 Confidential
Apollo Avenue Matlin Patterson
Jana Perry Capital Steel Partners
Angelo Gordon Sun Capital Strategic Value Partners
Saba Millennium White Box
Carl Icahn Pershing Greenlight
HIG/Bayside Patriarch Wellspring
Black Diamond Levine Liechtman Z Capital
Baupost Marathon Och Ziff

Distressed for Control
5 Confidential
Distressed for control or Distressed Private Equity seeks to purchase controlling stakes in companies (segmented into large cap >$1bn EV and middle market) either through the bankruptcy process such as a court mandated auction known as a §363 sale, by obtaining a controlling or blocking position in the “Fulcrum” security prior to bankruptcy and effecting control either through additional ownership in a rights offering or by negotiating board control
During the 2008-2009 credit crisis many distressed for control firms utilized the Debtor-in-possession (DIP) loan as tool for gaining control of a company. Due to a lack of 3rd party DIP providers willing to lend, Distressed PE funds agreed to put in DIP loans that were effectively bridges to a sale with the PE fund becoming the stalking horse bidder. This was accomplished by incorporating aggressive “milestones’ into the DIP covenant such as a sale or POR filed within 60 days
Funds engaged in this strategy are long term investors and generally are structured as PE funds with locked up money for 7-10 years with an investment period (3-5 years) and harvest period (3-5 years). They are not subject to quarterly or annual redemptions and therefore can afford to hold illiquid investments. Investment is monetized or harvested either through an outright sale of the business, IPO or a dividend recap
Investors in this space target rates of return based on a multiple of invested capital (MOIC). LPs expect the fund to return at least a 2x on its original investment and in the middle market it may be 3-4x. These funds tend to deploy capital in large chunks (10-20%) as opposed to the more common 3-5% positions found in the average hedge fund
In order to manage this strategy effectively funds must have the infrastructure to monitor and a portfolio of operating companies. This will require operating partners familiar with managing and restructuring businesses as well as audit, compliance, tax and accounting issues. Most traditional hedge funds are not set up for this kind investing. The due diligence and compliance costs along with less stable capital make control investing less attractive to all but the largest credit hedge funds

Activist Distressed Funds
6 Confidential
Activist distressed funds tend to invest in larger, more liquid capital structures and may seek to wield significant influence in a restructuring or bankruptcy. Alternatively they may seek to trade out if the credit if it improves
Activists look to a take a leading position in negotiations with the Debtor and need to own enough of a class of a security to get a seat at the negotiating table. May form steering committees or ad hoc groups along with other Creditors. Typically are willing to enter into trading restriction agreements when necessary
Funds tend to have a long bias but will short as a hedge, engage in Cap Arb and outright short overvalued securities Activists tend not seek operational or ownership control but may do so depending on the situation. As hedge funds have
grown larger and need to take larger positions activists have entered the middle market distressed loan arena and taken control of the company. Angelo Gordon lead Philly News and American Media transactions
Activist funds typically have traditional 2-20% structure with annual and sometimes even quarterly redemptions, although most funds have tried to move towards longer lock ups due to the illiquid and volatile nature of distressed securities. In 2008 many funds were forced to put up Gate, this cause considerable problems with LPs
Activist funds typically target a 20% IRR, however given the current low interest rate environment most funds are guiding investors to expect low to mid teen returns. Big return are generated post a credit dislocation such as 2002-03 and 2009-10
Activists may also seek to exploit opportunities related to covenant violations or other event driven strategies. For example a company may need to extend the term on its bank debt or be in violation of a covenant. In exchange for granting an amendment or waiver the fund may extract a large consent fee or as well as increase the coupon and potentially institute a LIBOR floor if one does not already exist. May also be able to enforce inspection rights to look at a company’s books as well as be given a board seat if the company is private (not likely if company has public equity)
With respect to high yield bonds activists may seek to exploit difference among a companies existing indentures with respect to guarantees, structural seniority, layering provisions or types of collateral and security or inter-creditor issues. May also seek to enforce CoC of control language in an out of court restructuring
If there is significant secured debt, particularly bank debt, bond holders may have little recourse until there is an event of default or bankruptcy given that most HY bonds don not contain maintenance covenants

Credit Opportunity Funds
7 Confidential
Credit opportunity funds are either credit funds that employ a trading based strategy to earn excess returns in the credit markets based on relative value, exploiting HY or distressed opportunities, credit selection, or a combination of these strategies. Some funds use quantitative strategies, while other use fundamental. Credit opportunity players may be part of a larger multi-strategy fund that has a credit team. Citadel, Och Ziff, Whitebox and Paulson are examples of multi-strategy funds with credit teams. Bank prop desks function very similar to credit opportunity funds, albeit with even more leverage
Typically these funds hold less concentrated positions (2-3%) and are less inclined to become restricted or sit on steering committees. These funds are also to use leverage to enhance returns as they typically are not investing in credit intensive distressed securities with 20%+ YTW
In the 2002-2008 time frame many of these funds used Total Return Swaps (TRS) which allowed them to employ 2-10x leverage to enhance returns. During that time LIBOR was around 5% and HY spreads were anywhere from 250-500bp. Due to the boom in the CLO market and unprecedented LBO activity, there was a tremendous opportunity to make money “flipping” new issues that would trade up 1-3pts post pricing. Hedge funds would purchase the securities at issue and then flip them to CLOs and institutional fund managers that did not receive a their desired allocation in the offering. Capital markets desks were incentivized to funnel product to hedge funds because they tend to trade more frequently generating more commissions and the demand for product from institutional funds allowed the hedge funds to earn a quick “arb” and cause the issue to trade up in the secondary market
Credit opportunities funds tend to invest more globally including sovereign debt, non-US$ denominated corporate debt and also will do more relative value and spread arbitrage
These funds may at times take more concentrated bets or increase their weighting towards distressed securities opportunistically. For example Paulson in Lehman Brothers

Shareholder Activism
8 Confidential
In 2013, activist hedge funds added nearly $5.3 billion in net asset inflows, up sharply from $2.9 billion in the previous year and the most since 2006, according to data compiled by Hedge Fund Research. Total assets in activist funds – a small slice of all hedge fund assets – stood at $93 billion at the end of 2013, an all-time high and up 42 percent from the prior year.
On average, the roughly 60 funds tracked by HFR that specialize in activist investing returned 16.6 percent in 2013. While that is still less than the Standard & Poor's 500 stock index jump of roughly 30 percent, it is far better than the average hedge fund, which returned 9.3 percent according to HFR.
John Studzinski, who leads the advisory arm of Blackstone Group LP, estimates that almost 20 percent of the S&P 500 companies have already had some type of activist involvement.
The strength of stock markets - the S&P rose 30 percent in 2013 – means there are fewer cheap stocks to buy. Moreover, companies, realizing that it's too late when activists show up on their doorsteps, are proactively taking steps such as breaking up the company or boosting buybacks.
For the companies themselves, the consequence of multiple agitators could mean a more costly and time-consuming battle, a distraction from running day-to-day operations, as well as greater fees for legal and defense advisors.

Shareholder Activism
9 Confidential
In 2013 an activist fund was preparing to go public with proposals to shake up Aeropostale Inc. and was amassing a stake, only to learn that Sycamore Partners had taken an 8 percent stake in the teen clothing retailer. Sycamore's disclosure sent stocks surging nearly 20 percent on the day of the announcement.
Similarly, activist Barrington Capital took a 2% position in Darden Restaurants and was followed by an announcement that Starboard Capital had taken a 5.6% position.
Other companies fending off multiple activist investors include Juniper Networks Inc., where both Elliott Management Corp. and Jana Partners LLC reported stakes, and Sotheby's, which is under the scrutiny of Third Point LLC and Marcato Capital Management LP.
Emulex Corp. and Compuware Corp. have three activist funds involved in the stock. In the last two weeks alone, at least three U.S. companies – Aarons Inc., BJ's Restaurants Inc. and ALCO Stores Inc. – saw two different investor groups nominate competing slates to their boards.
Other campaigns include large cap companies previously considered too large for an activist such Third Point’s call for Dow to be split up, Nelson Peltz’s Trian pressuring Dupont to spin out its specialty chemicals business, Value Acts investment in Microsoft and Icahn and Greenlight in Apple.

Rise of Activist Investing
10 Confidential

Activist Pressure Increasing in Stabilizing Market
11 Confidential

Attributes of Activist Targets
12 Confidential

Size is No Longer a Deterrent
13 Confidential

Top Activists
14 Confidential

Hedge Fund Performance
15 Confidential Source: Credit Suisse

Hedge Fund Performance
16 Source: HFRI

Hedge Fund Performance Continued
17 Confidential
Source: HFRI

Returns on Various Asset Classes
18 Confidential Source: JP Morgan

Returns LL/HY/Equities
19 Confidential Source: LCD
-60%
-40%
-20%
0%
20%
40%
60%
80%
1997
1998
1999
2000
2001
2002
2003
2004
2005
2006
2007
2008
2009
2010
2011
2012
2013
ML High Yield (H0A0) S&P/LSTA Performing Leveraged Loan Index S&P 500

Investing in Distressed and Debt and Special Situations
20 Confidential

Investing in Distressed and Special Situations
Distressed investing combines a variety of skill sets including valuation, capital markets, M&A, operations, negotiation, execution, trading and legal expertise
While FAs and attorneys are helpful, a successful investor must be able to driver process, and steer FA’s and attorneys who are by nature more conservative towards a desired outcome. Particularly if you are fighting for value in a class that may be deemed out-of-the money or impaired
Understanding Capital Structure is critical to being a successful distressed investor This requires reading documents, understanding covenants and inter-creditor rights, detailed
knowledge of the corporate legal structure In depth understanding of the bankruptcy process is also essential for distressed
investors Must be able to anticipate potential issues regarding valuation, distribution of recovery value
among various classes, potential challenges to confirmation, the ability to obtain exit financing and the conditions of the capital markets
Distressed investors need to be able to assess long term fundamental value versus timing of turn around, return thresholds, opportunity costs, liquidity needs
21 Confidential

How do Distressed Situations Arise? Distressed opportunities can occur for company specific reasons such as an overleveraged balance
sheet or exogenous event, however changes in the credit cycle and hence the default rate tend to be the best time to make distressed investments. During these crises it is much more likely to be able to purchase good companies with bad balance sheets or capture discounts due to a liquidity squeezes
Primary causes of financial distress Overleveraged balance sheet leads to event of default or a forced restructuring Technological disintermediation or secular shift in demand (Newspapers, printers, wireline, publishing) Exogenous shock such as a natural disaster, terrorist attack or other systemic event (Packaging and
Chemicals during hurricane Katrina) Fraud such as Enron or WorldCom Adverse event such large legal judgment or a busted merger (Asbestos)
Distressed investing is rarely about making a good company great, its about buying a poor performing company at a great price and making it an average company
For example during the 2005-2008 period many US auto companies and auto suppliers could be created at 2x EBITDA if one was willing to bet that they could get relief on costs and better pricing throughout the supply chain which the big 3 had been squeezing as a result of their own legacy pension and OPEB issues and high union labor costs
22 Confidential

Company Considerations In Distressed Situations
23 Confidential
I MPACT ON
AL TERN ATI VE DES CRI PTI ON L EVERAGE L I QUI DI TY SHARE PRI CE
EXE CUTI ON RI SK KEY CON SI DERA TI ON S
Stay the Course n Implement business plan
n Seek covenant relief from banks
n High risk of default and liquidity crisis
n Ability to achieve covenant relief
n Credibility of business plan
n Best upside for existing shareholders
Out-of-Court Restructuring n Concessions From Stakeholders
n Bondholders (Debt/Equity) n Employees/Retirees/PBGC n Customers/Vendors
n Financing
n Rights offering n PIPE n Convertible preferred stock
n Requires execution of multiple strategies to have material impact
n Ability to achieve outside of Chapter 11
n Flat financial performance through 2007
n Operational stress
n Dilution of current shareholders
n Management retention
Strategic Transaction n Sell select division(s)
n Sell or merge whole company
n Interest of potential buyers
n Many competing assets in market
n Management distraction/turnover
Chapter 11 n Pre-packaged/Pre-negotiated
n Free-fall
n High secured debt levels and international pension limits ability to deleverage
n Liquidity and deleveraging benefits partially offset by Chapter 11 costs
n Minimal prospect for shareholder recovery
n Cannot pursue pre-pack if Company seeks to terminate legacy costs
High Medium Low
Source: Lazard

Investment Approach Founded in classic distressed investing where we seek to capitalize on market
dislocations or other events to purchase assets at what is hoped to be a significant discount to their intrinsic value.
We commonly look for value in out of favor sectors either as the result of cyclical swings, industry disruption or disintermediation, or other shifting industry fundamentals as well as other macro idiosyncratic dislocations.
We are continually looking globally for opportunities across assets classes where securities are being mispriced as a result of liquidity, corporate events such as: distress, restructurings, bankruptcy, merger/sale/liquidation and litigation.
We employ PE type approach looking at long-term cash flow generation potential while adjusting for the optimized capital structure and using normalized earnings and multiples as the base case for out exit valuations.
We believe there is significant excess return that can be generated from taking liquidity and timing risks which most institutional and retail investors are unable or unwilling to take either due to LP liquidity preferences or a general bias towards herd investing.
However, we do not limit ourselves to “Classic Distressed” situations. We simply believe that it is the most comprehensive and encompassing framework for analyzing businesses and generating long term wealth creation.
24 Confidential

Opportunity Set One of the most frequent remarks in distressed circles is “there is nothing to do in
distressed”, yet distressed funds have tens of billions of dollars under management and very few are returning capital. Larger funds are at a disadvantage currently because many of the opportunities are in smaller, less liquid names.
However, part of the problems stems from too narrow a view of what constitutes distress. If you limit it solely to bankruptcies or bonds trading >1000 bp over Treasuries, then the statement is true. However, if you look at distress as merely a framework through which to view the universe of investible assets then the opportunity set expands significantly.
So while there might not be “anything to do in distressed” there are always opportunities for the well honed distressed investor. For example, there is currently a $200mm 1st lien secured bond 4x leveraged with a 12% coupon and a 2% amort kicker with the potential for a 112 call trading at par. While not distressed, this opportunity is the type that an experienced distressed investor ferrets out.
We have found opportunities over the last year have including lower tier securities of European banks; loans and secured bonds of distressed shipping companies; busted preferred stock in REITs that have “gone dark” or are utilizing shareholder oppression techniques where our experience in litigation and contacts with top litigators is essential to unlocking value; bankruptcy trade claims; post-reorg and event driven equities; as well as middle market leverage loans and HY bonds.
25 Confidential

Opportunity Set With leveraged loans returning 4.5%, HY returning 6% and CCC returning 11% YTD,
clearly to earn excess return one has to move further out on the risk curve in general to capture returns. That is why distressed and absolute return investors have flocked to munis, emerging markets, Greek banks, Lower Tier securities in European banks and equities. Another reason is there are large enough issues to accommodate the big hedge funds.
While we do not rule out a sector or region “for the sake of being contrarian” and have certainly been active in distressed European financials and emerging market issues, we prefer to look towards smaller or less liquid issues primarily in the US and to lesser extent Western Europe.
These include issues under $200mm in HY and leverage loans, busted converts, distressed energy such as Oil Sands and fracking companies, post-reorg and event driven equities, trade claims and stubs as well as distressed for control situation where we will be a minority to the “plan sponsor” but through our experience and influence in the restructuring process are able to obtain minority shareholder protections or feel our interests are sufficiently aligned to mitigate the risk.
Other areas of interest are preferred stock, particularly of REITs where the equity owners have turned off dividends and tried coercive tenders well below par+accrued. We believe this situations are ripe for distressed investors who are experienced at forming ad hoc groups and employing litigation or the threat of obtain remedy.
26 Confidential

Identify operation weaknesses, cyclical,
secular and structural factors causing distress
Identify Target develop investment thesis, perform valuation,
projections and recovery analysis
Combined Skills of a Distressed
Investor
In order to be a successful distressed investor one must be
able to operate comfortable across a variety of functions
including the new issue markets, legal strategy,
valuation, operational and execution skills
Extensive due diligence required on both operations and
financials
Identifying key employees, Board representation, new
management,
Extensive structuring, execution, trading, negotiating
skill are need to effect a distressed transaction
Post-reorg monitoring, compliance and management
Position sizing and trading execution, bankruptcy process
and timing risk mitigation, working with committees and
other constituencies
Developing POR, evaluating post-reorg capital structure,
estimating recoveries, obtaining exit financing, post-reorg
trading
Drafting documentation, plan support agreements, POR, DS,
Corporate governance and shareholder rights
M&A, PE, Leverage finance, Restructuring and Legal analysis all
go into distressed investment process
27
Diverse and Unique Skill Set Required for Distressed

Identify Cause of Distress
Capital Structure Analysis
Valuation and Analysis
Portfolio Management
• While most distressed funds employ a “bottoms up” valuation methodology, understanding the factors driving the current distressed opportunity are critical
• Macro factors, secular vs cyclical • Operational factors, cost structure, labor, suppliers, working capital, access to liquidity • Management, need to be replaced? How soon, cost of transition. Need to hire turnaround firm
(eg: Zolfo, Alvarez) • Overleveraged capital structure
• The target investment’s capital structure must be broken down and the likely fulcrum security identified • Credit agreements, covenants, security and guarantee agreements, inter-creditor agreement, and bond
indentures must be reviewed in depth to understand the company’s ability to issue more debt and at what level of the capital structure as well terms that may impact seniority, collateral value, structural issues
• Evaluate other potential claims, trade, pension, leases, environmental and litigation • Need for a DIP, ability to prevent priming DIP, ability to put in DIP, receive adequate protection, risks of
cram-up or cram down
• Deep dive on the company’s operating and financial drivers. • Identify and estimate COGS drivers by commodities, supplier cost-push, supply chain inefficiency.
Compare against industry norm. Read 10-K’s and Q’s of industry leaders and laggards and see how company stacks up
• SG&A Drivers. Labor, Pension, OPEB, unions, outsourcing other inefficiencies • Is there high operating and or financial leverage? What should the optimal capital structure look like?
• What is the fulcrum security? What is your target return? Do you want to be at top of capital structure and risk being crammed up, or lower down and risk being crammed down?
• What size position? 2%, 5% 10%. Looking for control 33% 51%? How do you put on trade • Form ad hoc committee or steering committee. Looking for leadership role? • Will the investment require additional capital? DIP, rights offering etc. How much do you keep in
reserve? • Can deal be done out of court? Pre-pack? Exit financing and post-reorg cap structure. Will it be public or
private? What is your exit? 28
Distressed Debt Investing Overview

Investment Process
29 Confidential
Analysis of industry and competitive landscape
Compare with market multiples
Model cash flows Valuation: DCF, LBO,
M&A, break-up Identification of hidden
asset value Liquidation values
Determination of Enterprise Valuation
IdeaGeneration
Detailed analysis of credit agreements and bond indentures
Structural and legal analysis
Identification, measurement, and ranking of contingent or hidden liabilities and claims
Liquidation priorities Guarantees
Structure
Construct a view of the bankruptcy or out-of-court restructuring process
Analyze factors after an in- or out-of-court event
• Quality of management• Governance issues
Assess motivations of other stakeholders; strategic blocking positions
Process
Measure potential downside
Assess recovery scenarios and their timing
Determine entry price; accumulate position
Monitor specific catalysts / milestones identified at onset of investment as a means to measure the validity of the thesis over time
Risk / Return Analysis
Work with management and other stakeholders to determine appropriate capital structure
Assess need to restructure Board or replace management
Timing the liquidation of investment to maximize return
Exit Strategy
InvestmentAnalysis
InvestmentDecision
PortfolioComposition

Deteriorating operating results
Covenant and/or liquidity issues
Deteriorating Credit Profile
Early Stage Restructuring
Mid-Stage Restructuring
Late Stage Restructuring
Recovery
Event of default catalyst (Missed coupon payment or covenant violation)
Ad-hoc formation of creditor committees
Out-of-court restructuring or Chapter 11 filing (official committees formed)
Committees drive restructuring process
Restructuring process in development
Balance sheet restructuring being negotiated
Restructuring plan in place
Recovery to stakeholders is clear to the market
Management is key
Drive toward exit / emergence from bankruptcy
Inve
stm
ent
Opp
ortu
nity
Situ
atio
n
Identify broader sector issues for future opportunities
Deep value securities
Option value securities
Fulcrum securities New debt financing
Reorganized equity through purchase of pre-petition debt
Equity or debt securities
Evaluate further upside potential
30
Restructuring and Investment Timeline

Senior Secured
50% of Capital Structure (1)
High Yield Bonds (2)
25%
Equity (3)
25%
Senior Secured Loan of $500mm 5x
leveraged
New Equity valued at $100mm a40%
recovery. At 7x TEV investment doubles
Fulcrum Security
Equity – zero recovery
Original Capital Structure
(1) Secured by all assets and capital stock of the company (2) Unsecured debt – sometimes subordinated (3) Residual claim of equity sponsor or public shareholders
Post-Bankruptcy Capital Structure
Distressed funds seek to re-create equity at lower multiples and then turn capitalize on company’s turn around post reorganization
31
Value Creation Process
$1bn TEV @ Face 7x leveraged
Plan Strike TEV $600mm 6x

32
Typical Capital Structure 1990’s HY Issuer
Revolving Loan
Term Loan
Senior Unsecured Bond
E q u i t y Senior Subordinated
Bond

33
Typical Capital Structure 2000’s LBO Deal
E q u i t y
R e v o l v i n g L o a n
Senior Subordinated Bond
Senior Unsecured Bond
Term Loan

34
Typical Capital Structure 2008 Credit Crisis
R e v o l v i n g L o a n
TermLoan Senior Unsecured Bond
E q u i t y
Senior Subordinated Bond
Debtor-in-Possession Loan

Examples of Distressed Transactions
35 Confidential
Oaktree General Maritime - Currently in bankruptcy Oaktree is converting a secured rescue loan to equity
Lehman Brothers – Liquidation done under SIPA and Ch 11 largest BK in history. Highlights structural and gty issues and how critical they are to recovery. Some entities will recover near 100% while GUCs of LBHI are slated to get 20%. Bonds trade above recovery value indicating bullish view on Lehman assets and A&M’s marking BS conservatively
Lyondell – Large global chemical company fell victim to credit crisis in 09 was an overleveraged LBO. Secured creditors used a roll-up DIP strategy to effectively control collateral and obtained majority of post-reorg equity
Lee Enterprises – Regional news paper publisher. Recently effected a pre-packaged bankruptcy. Tronox – Chemical producer went BK in 2009 due. Had large environmental liabilities. Initial POR gave
all equity to secured creditors. Unsecureds challenged plan. Wound up doing rights offering and taking out secured creditors at par +accrued
DBSD – Satellite services company purchased by Charlie Ergen who owns Dish Network. Had his original plan to take control of company through secured debt blocked when his vote was “designated”. Wound up winning bid for company. Also recently purchased Block Buster and Terre Star Networks out of BK. Strategic using BK as an acquisition tool.
Calpine and Mirant – Large merchant power generators went BK in 05-06. Market turn around provided substantial recovery to equity holders. Secured creditors were paid par +accrued
Charter Communications - 2009 Apollo was the lead transaction sponsor along with other unsecured creditors (hybrid of PE and activist distressed). Precedent setting case in regards to reinstating secured creditors (cram-up)

Post-Reorganization Equities
36 Confidential

Post-reorg Equities
Post-reorg equities can often present compelling risk-reward opportunities for a value investor. They have many unique attributes that value investors prefer such as a lack of coverage from the broader investment community, require time and effort studying the company’s bankruptcy filings which most investors are not willing to put in, they have a catalyst in that there is usually a major turnover of the investor base with 12 months of exiting bankruptcy
Returns are hard to measure as there is not a comprehensive database, certainly if one looks at some of the major companies to exit bankruptcy in 2010, they would see returns have greatly exceeded the market
In a 2004 study “A Chapter after Chapter 11”, Lee and Cunney of JP Morgan looked at 117 companies that came out of Chapter 11 between 1988 and 2003. They found that relative outperformance (to the S&P 500) of these companies’ stocks averaged 85% in the first year after emergence. However, the same study showed that volatility of these stocks had been very high, with only 50% of the equities outperforming during the period
Not all post-reorg equities are created equal; some companies emerge from Chapter 11 without accomplishing any substantial operational turnaround or debt restructuring – only to file for Chapter 22 not too long after original emergence (Bally Total Fitness, Foamex, Movie Gallery, Trump Entertainment are just some such examples)
37 Confidential

Post-reorg Equities
Yet, there are a number of reasons for post-reorg equities to be inefficiently priced and such market inefficiency creates opportunities for investors hunting for bargains. Let’s look at some of the reasons why such mispricing can exist and why these stocks can have a potential for generating attractive returns.
Turnover in Shareholder Base: Former creditors have received equity in exchange for discharging their claims. Some
of these newly minted equity-holders are not in the business of managing money and may not even be allowed to hold equities under their mandates.
Banks and insurance companies prefer to receive cash or cash-paying debt as a distribution in bankruptcy rather than common stock for regulatory and economic reasons
Landlords who received shares in the new company in exchange for their lease-rejection claims or vendors of the company who received their shares as a distribution for their trade claims may also be part of this category.
High Yield funds may not be allowed to hold equities by their charters. All these holders can become “motivated sellers” and may be forced to sell the shares in the newly emerged company for noneconomic reasons and without giving consideration to valuation or potential returns – and thus creating mispricing
38 Confidential

Post-reorg Equities
Liquidity and Market Capitalization: Many post-reorg equities are too small for institutional shareholders to invest in.
Additionally, in larger post-reorg situations, there is generally a lag between the time the company exits bankruptcy and is picked up for coverage by the sell-side. This is an opportune time for post-reorg investors to capitalize by investing when there is limited research coverage and the company may not have yet listed on an exchange
Post-reorg equities are often illiquid and there may be a relatively thin trading float. In addition, post-reorg companies have to insure that more than 50% of the stock held by holders of 5% or more of the company does not trade hands in the first three years, which can impact a company’s NOL position. (See Geoeye f/k/a Orbimage.
Since liquidity and size are important considerations for many portfolio managers, these relatively illiquid small cap stocks are quite often simply ignored by many professional investors.
Lack of Coverage by Wall Street Analysts: Since Wall Street generates more commissions from trading larger cap, liquid names,
analysts are not incentivized to spend time and resources to cover post-reorg equities This is why post-reorg equities are often referred to as “orphan equities” – nobody cares to look at them.
39 Confidential

Post-reorg Equities
Information Access: Gathering information on post-reorg equities can be challenging. During the bankruptcy process, companies
generally don’t host conference calls, host conference calls and sometimes do not file 10Ks and 10Qs with the SEC. To understand the company’s post-emergence capital structure and newly issued securities, it is imperative for an
analyst to read the Disclosure Statement filed with the bankruptcy court which includes financial projections, the company’s new capital structure as well as liquidation and valuation analyses.
Conservative Projections in the Plan of Reorganization: The Company and its FAs (Financial Advisors) generally use conservative projections when valuing the business.
FAs may be liable if they company goes into “Chapter 22” and Company management does not want to set too high a bar right out of the gate.
Management often receives a MIP (Management Incentive Plan) including stock options, warrants and or a percentage of the new equity in the reorganized company. This provides and incentive to provide conservative projections in the Plan of Reorganization
Bankruptcy Stigma: One of the indirect bankruptcy costs is a stigma directed towards the companies which have gone through Chapter
11. Oftentimes there is a perception that a firm which is or was in bankruptcy has irreparable damage to its brand name and will have trouble retaining old customers and acquiring new ones, getting good payment terms from its vendors, and keeping its key personnel. While this view might be partially true in some situations, it is not rare to see a company do quite well after Chapter 11. It is especially true if the main reason for bankruptcy was over leverage and not underlying business problems. Moreover, bankruptcy process can often become a positive catalyst for a company – the company can use Chapter 11 to reject leases, renegotiate more favorable contracts with suppliers, rationalize workforce, sell underperforming assets, close unprofitable stores, install new management as well as substantially reduce debt load and in some instances get new capital injection.
40 Confidential

Post-reorg Equities Performance
41 Confidential

Post-reorg Equities Performance
42 Confidential
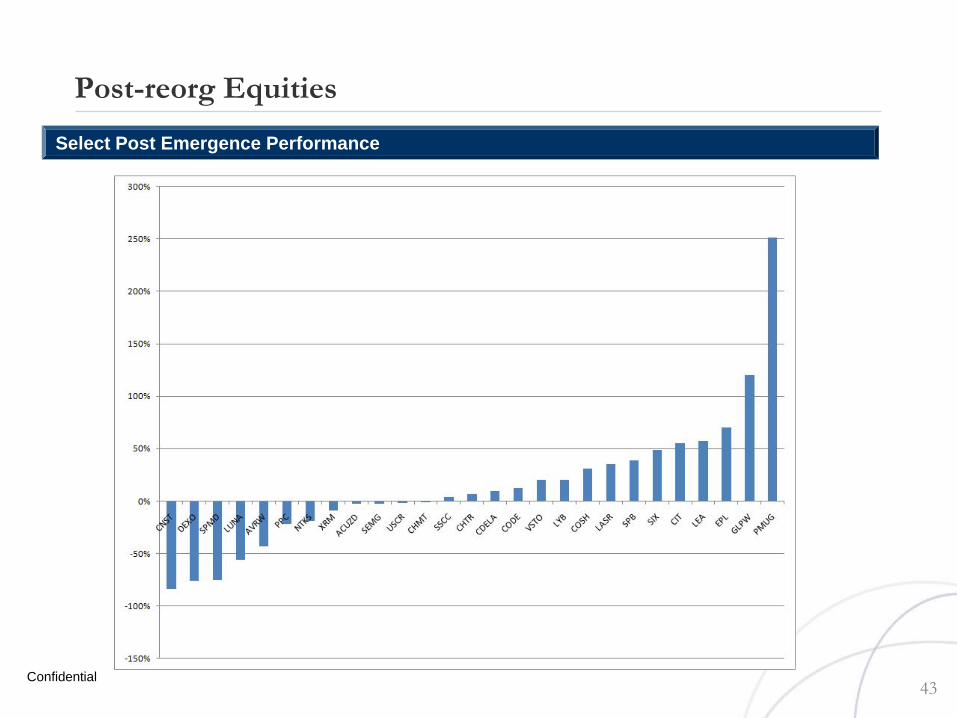
Post-Reorg Stock Outperform Market
JP Morgan compiled the 12-month gains of reorgs by looking at 117 reorgs over a 15-year period. In short, the first 12-month gains of reorgs averaged 84% (relative vs. S&P 500), driven primarily by outlier returns. The chart is duplicated below in Figure 7. The returns over that 12-month period are not concentrated in any particular period, but the 1st month tends to be strong, followed by a subsequent surge in months 6-7. Months 2-5 likely reflect distribution of shares (i.e., selling) by creditors receiving the equity
Post-reorg Equities
43 Confidential
Select Post Emergence Performance
Post-reorg Equities
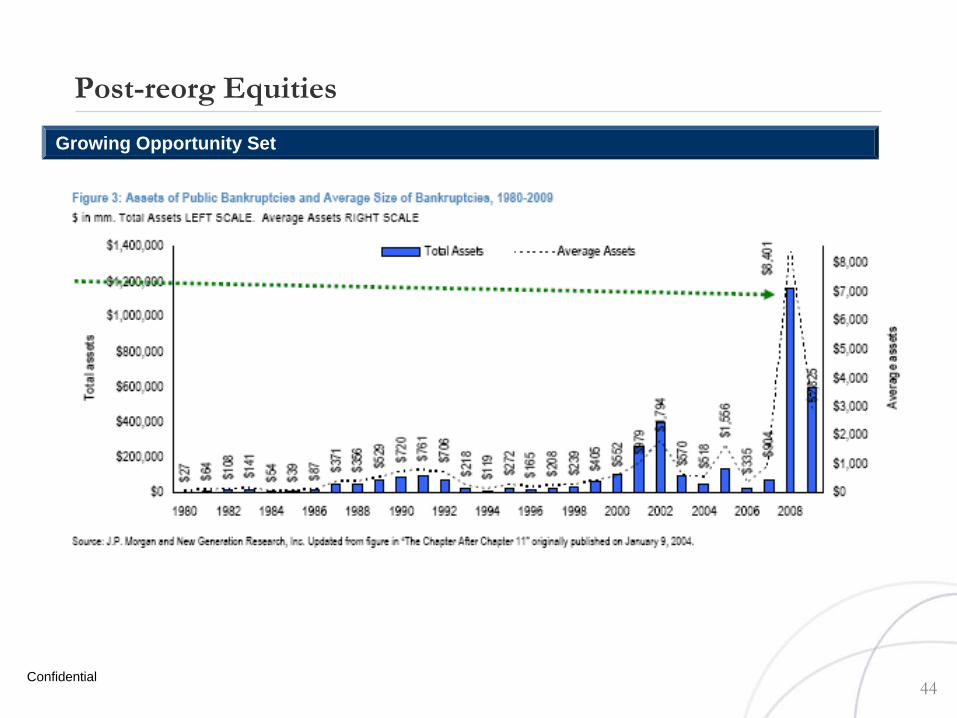
44 Confidential
Growing Opportunity Set

Trade Claims
45 Confidential

Introduction to Trade Claims
Section 101(5) of the Bankruptcy Code defines a “claim” as a right to payment, or rightto equitable remedy for breach of performance if such breach gives rise to a right of payment.
The Code has steadily expanded the scope of “claims” over the years and the legislative history makes clear that “the Code contemplates that all legal obligations of the Debtor, no matter how remote or contingent, will be able to be dealt with in the case.1 Thus, a “trade claim” can be a defined amount of money (e.g. account payable) or a contingent ,unliquidated liability (e.g. asserted claim for breach of contract).
Trade claims are generally evidenced in two ways: (1) via the Debtor’s Schedules of Assets and Liabilities (“Schedules”); or (2) via a valid and timely filed proof of claim (“POC”).
In most instances, a buyer of trade claims can rely on the amounts set forth in the Debtor’s Schedules. This happens via operation of Section 1111(a) which states in relevant part: “A proof of claim or interest is deemed filed under Section 501 of this title for any claim or interest that appears in the Schedules filed under Section 521(1) or 1106(a)(2) of this title, except a claim or interest that is scheduled as disputed, contingent, or unliquidated.”
46 Confidential
Source: Fulcrum Capital

Introduction to Trade Claims
While bank lenders and bondholders generally represent the largest portion of debtor’s pre-petition claims, upon filing there is a large constituency of other creditors who also possess claims against the debtor at various levels of priority within the capital structure.
Because the sale, assignment and transfer of ownership of these claims are not considered securities, securities trading laws do not apply. The lack of uniformity and active market for these claims makes the instruments less liquid and transparent, thereby providing an opportunity for outsize returns for those willing to perform the necessary due diligence and shoulder the liquidity risk.
Vendor claims generally trade at a 10-20% discount to other wise pari passu securities and therefore present a potential arbitrage opportunity for investors. The typical vendor does not wish, or may not be financially able, to wait months or possibly years to receive his money and is usually sufficiently motivated to sell his claim at a discount.
A distressed investors may also purchase trade claims as a way to obtain strategic advantage in a restructuring. By gaining control of a larger share of a company’s General Unsecured Claims (“GUCs”), a sophisticated distressed investor can gain leverage to influence negotiations with the Debtor and other Creditors.
By purchasing trade claims at a discount to the unsecured debt he already owns, the investor also lowers the effective cost basis of his investment (assuming trade and bonds will receive the same consideration in the reorganization). In addition, if the claims pool is large enough an investor can set up a capital structure arbitrage trade by going long a trade claim and short pari passu unsecured bonds of the same company.
47 Confidential

Introduction to Trade Claims
In structuring such a trade, one must ensure that the bond and the claim are at the same entity and that the bond does not have any guarantees or claims on subsidiaries that might make it more valuable.
Often it may not be immediately clear where value flows or their may not be full disclosure on foreign subs. In these cases and one needs to try and apportion the value using information available in the company’s financial statements. If the company has subsidiaries that are not guarantors of its debt then it will segregate the financials of the guarantor and non-guarantor subs.
Also, one may look to segment reporting of revenue and EBITDA and attempt estimate how much value may be attributable to the various entities. In a scenario where the investor faces a great deal of uncertainty over valuation and how it will be attributed amongst various entities, he must bid an appropriate discount to compensate for the risk.
48 Confidential

Introduction to Trade Claims
A “Claim” is a right to payment, whether that right is fixed, liquidated, potential or contingent (i.e., based on the outcome of litigation). Claims can fall into different categories: priority, secured, unsecured, contingent, liquidated, disputed or matured. The most common claim to arise out of a bankruptcy filing is a vendor claim or trade claim as they are more commonly known. Other Types of claims include: Contract Rejection Damage Claims: Damages resulting from the termination of contracts under
Section 365 of the Bankruptcy Code. Deficiency Claims: Secured claims that are under collateralized result in a deficiency claim under
Section 506 of the Bankruptcy Code for the portion of the claim where there is insufficient collateral securing the claim.
Pension/OPEB Claims: Collective Bargaining Agreements (“CBAs”), Defined Benefit Pension Plans and other employee benefits that are terminated pursuant to Sections 1113 and 1114 of the Bankruptcy Code give rise to unsecured claims.
Contingent Claims: Claims that may result from pending lawsuits, environmental damages or other contingent events. Some examples of cases where large contingent claims were involved include the asbestos cases such as Owens Corning, Grace and Armstrong and environmental claims include cases such as Asarco and Tronox.
Priority Claims: Generally include back taxes and unpaid employee wages and benefits, however, can also include lease deposits up to $2,452 and “Gap Claims” which arise when the Debtor is targeted in an Involuntary Bankruptcy Petition filed by one of its Creditors
503(b)9 Claims: These are claims for goods shipped within 20 days of a company filing for bankruptcy. Unlike other trade claims, these claims are accorded administrative status and are paid in full as long as the estate is administratively solvent.
49 Confidential

Introduction to Trade Claims
Reclamation Claims: Reclamation claims allow for the Creditor to reclaim the goods shipped to the Debtor. These claims arise under state law, §2-702(2) of the Uniform Commercial Code (“UCC”). Once the Debtor files for bankruptcy protection, §546(c) of the Bankruptcy Code preserves a creditor’s state law reclamation rights, those rights are enhanced by the code and create additional requirements and defenses. The Bankruptcy Abuse Prevention and Consumer Protection Act of 2005 (“BAPCPA”) expanded the reclamation period from 10 days to 45 days prior to a bankruptcy and to 20 days post-petition from 10 days previously. There are a number of requirements that must be met for these claims as well as potential defenses against such claims.
Proof of Claim In order for the Creditor’s claim to be paid he must file a Proof of Claim (“POC”) with the court.
This is done by filling out Official Form 10 within 90 days from the Section 341 meeting of creditors and filing it with the Bankruptcy Court.
The date past which a claim can no longer be filed is known as the Claims Bar Date, and claims past this date generally will not be paid, although it is possible to appeal. The POC will have a Docket Stamp on it denoting the date of its filing. The POC must be signed by the creditor, include the amount of the claim, whether there is a perfected security interest and have attached to the POC documentation evidencing the claim such as invoices, purchase orders or contracts.
50 Confidential

Introduction to Trade Claims
51 Confidential

Introduction to Trade Claims In examining the schedules it best to bid on an Allowed Claim. Under Section 502(a),
a claim for which a proof of claim has been filed is deemed “Allowed” unless a party of interest (e.g. Bankruptcy Trustee, or the Debtor) objects to the claim, in which case the Bankruptcy Court will conduct a hearing to determine whether, or to what extent, the claim should be allowed.
There are instances where the Debtor marks every claim on the schedule as disputed or contingent. This increases the risk and will required extra due diligence as well as the willingness to litigate if need be.
Once a claim holder willing to sell has been located, the negotiation process for purchasing the claim begins. This process can take anywhere from a few days to several weeks depending on the complexity of the issues involved. Since the seller is not a capital markets participant, he may change his mind several times throughout the negotiation process and also increase his offer based on competing bids.
Moreover, factors may come into play in the due diligence phase that require a re-pricing or cancellation of the trade altogether. If an investor is bidding on a disputed claim he will need to factor the risk that the claim might ultimately be disallowed into his bid price. In addition, he may want to reduce price of his bid to allow him to negotiate with the debtor for a reduction in claim size in exchange for a stipulation that the debtor will treat the claim as an Allowed Claim.
52 Confidential Source: Fulcrum Capital

Introduction to Trade Claims Once an initial bid is agreed upon, the parties enter into a trade confirmation, subject
to final due diligence. This phase again can take a few days to a few weeks depending on the issues involved.
At this stage in the process the buyer will begin examining the documentation supporting the claim. This includes reviewing invoices, purchase orders, or other contracts in order to determine the validity of the claim. It is also necessary to reconcile the amounts on the invoices with what is filed on the POC and the Schedules. The purchaser must also confirm that the entity at which the claim he is purchasing is filed corresponds to the entity listed on the supporting invoices as well as have been filed prior to the Claims Bar Date.
The claims purchase will be executed via a custom tailored contract known as a Purchase Sale Agreement (“PSA”). The PSA will contain provisions governing the transfer of the claim, Representations and Warranties and Indemnification provisions. The PSA will required the seller to provide Reps and Warranties on the ownership, validity and lack of any encumbrances on the claim. In addition, the PSA will contain Indemnification provisions, should the claim be impaired or disallowed .
It is common for the PSA to require disputes to be litigated under New York or Delaware law, courts which routinely handle complex commercial litigation. This also avoids being in the home town court of the seller of the claim.
53 Confidential Source: Fulcrum Capital

Introduction to Trade Claims There are several legal issues that can impact the value of a claim or cause the claim to
be disallowed. The following is a brief summary of some of the major issues that need to be diligenced from a legal perspective before purchasing a claim.
Equitable Subordination. If the seller of the claim aided and abetted fraud, insider trading or breach of fiduciary duty his claim may be equitably subordinated causing the priority of the claim to be moved to the end of the priority chain. This has the effect of the claim being treated as equity, not debt. This risk is heightened when a claim is purchased from an insider and one must have strong reps and warranties from an insider that he has not aided and or abetted any malfeasance.
Avoidance Actions. When a company files for bankruptcy all payments made in the 90 days prior to bankruptcy (1 year for payments to insiders) are investigated as potential Preference Payments. A Preference Payment is the payment of a debt to one creditor rather than dividing the assets equally among all those to whom he/she/it owes money, often by making a payment to a favored creditor just before filing a petition to be declared bankrupt. The Bankruptcy Trustee has the power to Avoid (unwind) any payments that are deemed to be a Preference This is known as an Avoidance Action and the money is reclaimed by the bankruptcy estate
54 Confidential
Source: Fulcrum Capital

Introduction to Trade Claims There are several criteria that are used to evaluate whether a payment was a
Preference: The transfer was "to or for the benefit of a creditor." The transfer was made for or on account of an "antecedent debt"—that is, a debt owed
prior to the time of the transfer. The debtor was insolvent at the time of the transfer. (Fraudulent Conveyance which has 2-
year look-back pursuant to 11 U.S.C. § 548) The transfer was made within 90 days before the date of the filing of the bankruptcy petition
or was made between 90 days and one year before the date of the filing of the petition to an insider who had reasonable cause to believe that the debtor was insolvent at the time of the transfer.
The transfer has the effect of increasing the amount that the transferee would receive in a liquidation proceeding under chapter 7 of the bankruptcy law (11 U.S.C.A. § 701 et seq.). 11 U.S.C.A. § 547
However, Section 547(c) of the Bankruptcy Code contains exceptions for payments made in the ordinary course of business. The prior course of dealings between the parties, including the amount and timing of payments, and circumstances surrounding the payments, should be analyzed
55 Confidential
Source: Fulcrum Capital

Introduction to Trade Claims Closing trades often utilizes a concept from securities trading know as Delivery Versus
Payment, or “DVP”. This occurs when, to complete a trade, there is a simultaneous exchange of securities, in this case they are not securities but the format is the same, for cash that ensures that delivery occurs if, and only if, payment occurs.
Closing can occur anywhere from 10-30 days post initial confirmation of the trade. The standard practice is that once the trade has closed, the Transferee files a Notice of Transfer and Evidence of Transfer (supporting documentation to evidence the transfer of claim) with the Bankruptcy Court pursuant to Bankruptcy Rule 3001(e). Rule 3001(e) reads as follows: Transferees trading on the “scheduled amount” prior to the filing of a POC must file a POC
with court, although “evidence of transfer” is not required it recommend. Rule 3001(e) 1 Assignment of a claim after a POC has been filed requires both a Notice of Transfer and an
Evidence of Transfer to be filed with court. 3001(e)2
The clerk of the court or claims agent has the duty to notify the Transferor. The Transferor has 20 days to object to the transfer. Within 15-30 days post closing buyer follows up with claims agent to ensure claims register properly reflects the new owner of the claims.
56 Confidential
Source: Fulcrum Capital

Litigation Stubs Often one of the most valuable assets of an bankruptcy estate can be the right to
pursue litigation against bad actors, professionals, officers, directors and others for actions that either contributed to the company’s insolvency or deprived the estate of value.
This litigation frequently takes years to go to trial or extract a settlement and since remaining in bankruptcy is both prohibitively expensive and a drag on a company’s ability to move forward, creditors and other stakeholders generally create litigation trusts or escrow receipts (“Stubs”) that are assigned the rights to those recoveries when they are received and can freely traded.
This allows the company exit from bankruptcy and creditors to receive generally a large portion of their recovery while maintaining their exposure to upside from the litigation. Furthermore, since many creditors do not wish to hold these illiquid and opaque instruments, there is an opportunity for distressed investors to get involved.
The estate usually funds the trust at exit to fund the litigation and often times a contingency arrangement with the attorney’s handling the case is established. One problem is the defendants tend to try and wait until that fund is exhausted to gain the most leverage in settlement negotiations.
In instances where fraud is involved such as Madoff, Stanford, Enron, Le Nature et al, litigation may be the most substantial asset of the estate.
57 Confidential

Litigation Stubs
Another aspect of Stubs arises from the fact that a company may wish to exit bankruptcy, but may not have completed the claims process. Often times contingent claims such as litigation against the debtor or other undetermined or objected to claims still remain outstanding.
These claims are reserved for often with post-reorg equity which is held in reserve when a company emerges from bankruptcy. If the claims come in lower than estimated by the reserve, the excess shares are released to creditors still holding the claims. One prominent example of this is GM’s Motors Liquidation (MTLQQ).
Frequently in airline bankruptcies where there are complex tax issues involved with claims for terminated plane leases (TICs), there is a substantial claim reserve. Other cases include American Airlines, Mirant, Calpine, Lyondell, Tribune and Tronox.
One strategy is for an investor to short the post reorg equity and go long the stub. This isolates the litigation and or claims pool aspect of the Stub and allows an investor to speculate on non-market risk.
One reason investors like Stub claims is that the risk is often not correlated to the market and is rather dependent on a smaller claims pool or litigation payoff.
Investing in these instrument requires a detailed understanding of the legal process, fluency with legal briefings and searching the court dockets, as well as the ability to interact with attorney’s and ask intelligent questions.
58 Confidential

Litigation Stubs
Some current Stub trades are Tribune, Lyondell, Tronox, American Airlines, Sem Group, TOUSA and Le Nature.
Tribune and Lyondell are probably two of the most interesting because they involve Fraudulent Conveyance litigation related to the original LBOs. The litigation concerning these issues has been consolidated in the 2nd Circuit.
What makes these cases so interesting is that pre-LBO equity holders may potentially have their gains “clawed back” back the court for the benefit of the estates creditors.
The issues are too complicated to discuss here, however, there are several cases post credit crisis dealing with fraudulent conveyance that have been favorable to creditors. Two rulings in particular in TOUSA and Tronox were closely watched.
In TOUSA proceeds from a refinancing that had gone to repay bondholders in a JV were ordered clawed back by the bankruptcy court. The District Court overturned the decision and finally the Court of Appeals for the 11th Circuit reversed the district court and reinstated most of the bankruptcy courts findings.
In December of 2013, Judge Allan Gropper in the SDNY ruled in Tronox that Anadarko Petroleum Corp.'s Kerr-McGee unit is responsible for between $5 billion and $14.5 billion in environmental cleanup costs and toxic tort liability. As a result of its leveraged spin-off of Tronox in 2005 that left the company highly indebt and with large toxic cleanup liabilities.
59 Confidential

Litigation Stubs
Some current Stub trades are Tribune, Lyondell, Tronox, American Airlines, Sem Group, TOUSA and Le Nature.
Tribune and Lyondell (both SDNY) are probably two of the most interesting because they involve Fraudulent Conveyance litigation under state law related to the original LBOs. The litigation in Lyondell will be likely hinge on a ruling in Tribune and Sem Group which have been consolidated before the 2nd Circuit.
What makes these cases so interesting is that pre-LBO equity holders may potentially have their gains “clawed back” back the court for the benefit of the estates creditors.
The issues are too complicated to discuss here, however, there are several cases post credit crisis dealing with fraudulent conveyance that have been favorable to creditors. Two rulings in particular in TOUSA and Tronox were closely watched.
In TOUSA proceeds from a refinancing that had gone to repay bondholders in a JV were ordered clawed back by the bankruptcy court. The District Court overturned the decision and finally the Court of Appeals for the 11th Circuit reversed the district court and reinstated most of the bankruptcy courts findings.
In December of 2013, Judge Allan Gropper in the SDNY ruled in Tronox that Anadarko Petroleum Corp.'s Kerr-McGee unit is responsible for between $5 billion and $14.5 billion in environmental cleanup costs and toxic tort liability. As a result of its leveraged spin-off of Tronox in 2005 that left the company highly indebt and with large toxic cleanup liabilities.
60 Confidential

Credit Market Overview
61 Confidential

Credit Market Overview – New Issue Bond Volume
62 Confidential
93.7
144.0 143.8
323.6344.8
218.3
287.0
164.0
67.5
$0B
$100B
$200B
$300B
$400B
2005
2006
2007
2008
2009
2010
2011
2012
2013
Secured Unsecured Subordinated
Source: LCD

Credit Market Overview – Leveraged Loan Issuance
63 Confidential Source: LCD
256.0 264.0238.3
201.1 177.2218.8
340.2
448.1
650.5
762.0
233.9
96.7
290.0
434.0
502.4
694.2
$0B
$250B
$500B
$750B
$1000B
1998
1999
2000
2001
2002
2003
2004
2005
2006
2007
2008
2009
2010
2011
2012
2013
US Issuers Non-US Issuers

HY Issuance By Rating
64 Confidential Source: LCD
13.1
54.9
47.3 48.7
72.8
46.1
80.9
87.2
78.0 80.1
24.7
35.6
99.9
51.8
98.294.9
90.4
82.5 82.1
68.6
$0B
$25B
$50B
$75B
$100B
$125B
1Q09
2Q09
3Q09
4Q09
1Q10
2Q10
3Q10
4Q10
1Q11
2Q11
3Q11
4Q11
1Q12
2Q12
3Q12
4Q12
1Q13
2Q13
3Q13
4Q13
Split BBB/BB or higher BB Split BB/B B Split B/CCC CCC NR

CLO Issuance
65 Confidential Source: LCD
$0B
$10B
$20B
$30B
$40B
4Q01
2Q02
4Q02
2Q03
4Q03
2Q04
4Q04
2Q05
4Q05
2Q06
4Q06
2Q07
4Q07
2Q08
4Q08
2Q09
4Q09
2Q10
4Q10
2Q11
4Q11
2Q12
4Q12
2Q13
4Q13

Maturity Wall
66 Confidential Source: LCD
194
389
2541
95
282306
76
186
95
$0B
$100B
$200B
$300B
$400B
$500B
2014
2015
2016
2017
2018
2019
2020
2021
2022
2023
Bonds Institutional Loans

Percent Amount of Leveraged Loans in Default
67 Confidential Source: LCD
0%
1% 1%
4%
7%
10%10%
7%
3%
4%
2%
1%
4%
11%
8%
6% 6%
5%
3% 3% 2% 2%3%
2% 2%1%
1%1% 1%
0%
5%
10%
15%
YE1996
YE1997
YE1998
YE1999
YE2000
YE2001
YE2002
YE2003
YE2004
YE2005
YE2006
YE2007
YE2008
YT 200
9
Mar-10
Jun-1
0
Sep-10
Dec-10
Jun-1
1
Sep-11
Dec-11
Mar-12
Jun-1
2
Sep-12
Dec-12
Mar-13
Jun-1
3
Sep-13
Dec-13

YTM – Loan vs Bonds
68 Confidential Source: LCD
0%
5%
10%
15%
20%
25%
Dec-03
Jun-0
4
Dec-04
Jun-0
5
Dec-05
Jun-0
6
Dec-06
Jun-0
7
Dec-07
Jun-0
8
Dec-08
Jun-0
9
Dec-09
Jun-1
0
Dec-10
Jun-1
1
Dec-11
Jun-1
2
Dec-12
Jun-1
3
Dec-13
Bonds Loans

HY New Issue Yield by Rating
69 Confidential Source: LCD
2.5%
5.0%
7.5%
10.0%
12.5%
15.0%
1Q05
2Q05
3Q05
4Q05
1Q06
2Q06
3Q06
4Q06
1Q072Q
073Q
074Q
071Q
082Q
083Q
084Q
081Q
092Q
093Q
094Q
091Q
102Q
103Q
104Q
101Q
112Q
113Q
114Q
111Q
122Q
123Q
124Q
121Q
132Q
133Q
134Q
13
BB B

Leverage Multiples Corporate Loans
70 Confidential Source: LCD
8.8
7.16.7
5.35.0 5.1 5.3 5.2
5.8 5.65.2
4.54.0
3.7 3.8 3.94.2 4.3 4.4
4.9
3.8 4.0 3.94.3 4.5 4.7 4.5
0x
2x
4x
6x
8x
10x
1987
1988
1989
1990
1992
1993
1994
1995
1996
1997
1998
1999
2000
2001
2002
2003
2004
2005
2006
2007
2008
2009
2010
2011
2012
2013
4Q13
FLD/EBITDA SLD/EBITDA Other Sr Debt/EBITDA Sub Debt/EBITDA

Leverage Multiples LBO Loans
71 Confidential Source: LCD
5.75.4
4.7
4.2 4.1 4.0
4.64.8
5.3 5.4
6.2
4.9
4.0
4.7
5.2 5.3 5.4
6.0
0.0x
2.0x
4.0x
6.0x
8.0x
1997
1998
1999
2000
2001
2002
2003
2004
2005
2006
2007
2008
2009
2010
2011
2012
2013
4Q13
FLD/EBITDA SLD/EBITDA Other Sr Debt/EBITDA Sub Debt/EBITDA

Percent of Deals With Adjustments to EBITDA
72 Confidential Source: LCD
0%
10%
20%
30%
40%
1997
1998
1999
2000
2001
2002
2003
2004
2005
2006
2007
2008
2009
2010
2011
2012
2013
4Q13
M&A LBO All Deals

Percent of Deals With Adjustments to EBITDA >.5x
73 Confidential Source: LCD
0%
10%
20%
30%
1997
1998
1999
2000
2001
2002
2003
2004
2005
2006
2007
2008
2009
2010
2011
2012
2013
4Q13
M&A LBO All Deals

Average Pro Forma Adjusted Credit Stats
74 Confidential Source: LCD
0.0x
1.0x
2.0x
3.0x
4.0x
5.0x
6.0x
Debt/EBITDA Senior SecuredDebt/EBITDA
EBITDA/Cash Interest EBITDA - Mainten.Capex/Cash Interest
EBITDA -Capex/Cash Interest
Large Large LBO MM MM LBO

Sponsor Equity Contribution
75 Confidential Source: LCD
7%10%
13%
21%22%25%26%
24%23%
30%32%36%
38%41%40%39%
35%32%33%33%
43%
51%
44%42%
39%37%
44%
0%
20%
40%
60%
80%
1987
1988
1989
1990
1992
1993
1994
1995
1996
1997
1998
1999
2000
2001
2002
2003
2004
2005
2006
2007
2008
2009
2010
2011
2012
2013
4Q13
Rollover Equity Contributed Equity

Dividend Recaps or Equity Purchase as Use of Proceeds
76 Confidential Source: LCD
1 0 0 1 02 1
0 0
3 32
3
6
11
3
7
1011
5
8
16
12
9
11
26
21
1 1 12
0 0 0 02 1
75
8
16
21
16
8
1616
18
27
14
11
1917
$0B
$10B
$20B
$30B
$40B
4Q00
2Q01
4Q01
2Q02
4Q02
2Q03
4Q03
2Q04
4Q04
2Q05
4Q05
2Q06
4Q06
2Q07
4Q07
2Q08
4Q08
2Q09
4Q09
2Q10
4Q10
2Q11
4Q11
2Q12
4Q12
2Q13
4Q13
Institutional ProRata

First-Lien Leveraged Loan Covenant Statistics
77 Confidential Source: LCD
Average Number
0
1
2
3
4
5
1997
1998
1999
2000
2001
2002
2003
2004
2005
2006
2007
2008
2009
2010
2011
2012
2013
Distribution by Number of Covenants
0%
25%
50%
75%
100%
1997
1998
1999
2000
2001
2002
2003
2004
2005
2006
2007
2008
2009
2010
2011
2012
2013
2 or less 3 4 or more

First-Lien Leveraged Loans with One Covenant
78 Confidential Source: LCD
1% 1% 1% 2% 2% 3% 3% 2%5%
9%
26%
22%
14%
10%
20%
29%
49%
0%
10%
20%
30%
40%
50%
1997
1998
1999
2000
2001
2002
2003
2004
2005
2006
2007
2008
2009
2010
2011
2012
2013

2nd Lien Loan Issuance Volume
79 Confidential Source: LCD
$0M
$5000M
$10000M
$15000M
4Q99
2Q00
4Q00
2Q01
4Q01
2Q02
4Q02
2Q03
4Q03
2Q04
4Q04
2Q05
4Q05
2Q06
4Q06
2Q07
4Q07
2Q08
4Q08
2Q09
4Q09
2Q10
4Q10
2Q11
4Q11
2Q12
4Q12
2Q13
4Q13

New Issue PIK Volume
80 Confidential Source: LCD
1.5
6.4
19.7
13.4
1.4
12.0
0.5
6.7
3.9
$0B
$5B
$10B
$15B
$20B
$25B
2005
2006
2007
2008
2009
2010
2011
2012
2013
PIK Toggle PIK

Leveraged Loans by Broad Investor Type
81 Confidential Source: LCD
0%
25%
50%
75%
100%
1994
1995
1996
1997
1998
1999
2000
2001
2002
2003
2004
2005
2006
2007
2008
2009
2010
2011
2012
2013
1Q-3Q
134Q
13
US Banks Finance Co. Non-US Banks Institutional Investor Securities Firm

Total Loan Funds and Assets Under Management
82 Confidential Source: LCD
1112171716131013
2936
4743
2033
54
7071727476757677798286889196
103110
117122129
138146
154157162
$0B
$20B
$40B
$60B
$80B
$100B
$120B
$140B
$160B
$180B
Dec
-96
Dec-97
Dec-98
Dec-99
Dec-00
Dec-01
Dec-02
Dec-03
Dec-04
Dec-05
Dec-06
Dec-07
Dec-08
Dec-09
Dec-10
Dec-11
Jan-1
2
Feb-12
Mar-12
Apr-12
May-12
Jun-1
2Ju
l-12
Aug-12
Sep-12
Oct-12
Nov-12
Dec-12
Jan-1
3
Feb-13
Mar-13
Apr-13
May-13
Jun-1
3Ju
l-13
Aug-13
Sep-13
Oct-13
Nov-13

Distressed Debt Case Studies
83 Confidential

Tronox Case Study
84 Confidential
Tronox Incorporated (“TRX” or the “Company”) is the fourth largest producer of titanium dioxide (TiO2) pigments (93% of sales) in the world. Titanium dioxide is used in a range of products for its ability to impart whiteness, brightness and opacity. The pigment product is used in coatings for residential and commercial paint, industrial, automotive, specialty market, plastics such as polyolefins, PVC, engineered plastics, and paper and specialty products such as inks, food, cosmetics.
Company Overview Situation Overview
Tronox was spun off from Kerr-McGee Corporation in 2006. At the time of the spin-off, the Company was burdened with substantial legacy liabilities that are not related to its operating TiO2 or Electrolytic businesses Legacy liability costs have consumed substantial cash flow, resulting in an inability to continue to service Tronox’s debt. Due to the continued impact from legacy liabilities, exacerbated by credit market conditions and the resulting tight liquidity situation, certain of Tronox’s U.S. businesses and foreign affiliates filed for protection under Chapter 11 of the United States Code on January 12, 2009
Tronox was set to sell the majority of its assets in a 363 sale to Huntsman for $415mm. An ad hoc bondholder group of the 9.5% Senior Unsecured Noteholders has proposed a plan of reorganization in conjunction with Goldman Sachs as replacement DIP and exit lender and the support of the Debtor. In additon the EPA a major other unsecured creditor has reached an agreement to take $115mm cash and 88% of litigation proceeds against Anadarko Petroleum (purchased Kerr-McGee).
Capital Structure Face Market Market Multiple of
Amount Price Value 2010P EBITDARCash $77.0 77.0New DIP/Exit Facility 425.0 100.0% 425.0 2.2x9.5% Sr. Unsecured Notes 370.4 70.0% 259.3 5.8xEPA Claim 270.0 100.0% 270.0 5.8xOther GUCs 100.0 70.0% 70.0 5.8xEnterprise Value 1,242.4 1,101.3 5.8x
2010P EBITDAR $190.0Normalized EBITDAR $165.0

Tronox Case Study
85 Confidential
The 9.5% Sr Notes trades from 40 prior to filing down to 10 post. Secured creditors were concerned about a liquidation and substantial loss of value. This was exacerbated by the lack of access to capital markets in 2009 and the continuing credit crisis. Chemical maker Huntsman had mae a stalking horse bid to purchase the company for the value of the secured debt.
Tronox was at a cyclical low in the demand and pricing cycle. If unsecured creditors were willing to put in new capital to bridge the company until a trunaround in the pricing environment. Bondholders could capture the equity value.
Tronox bonds traded into the low 70s as a steering committee working with GS prepared to make an offer to finance the company out of bankruptcy. The companies projections were to do $190mm of EBITDAR in 2010 which would create the equity through the Sr Notes at 5.8x.
Investment Opportunity POR Summary
Bondholders agreed to backstop a $170mm rights offering that would fund the EPA settlement and GS committed to finance a $425mm replacemnt DIP facility that converted to an exit facility upon emergence.
In exchange bondholders would receive 16.9% of the re-organized equity as well as 78.4% of the equity in the rights-offering giving them 95% of the equity in the company prior to dilution from MIP
The EPA received $270mm cash and 88% of the proceeds from litigation against Andardko relating to the Tronox spin off
Claim Consideration Amount Plan Reco
DIPRolls into New Exit Facilty $425.0 100%
Class 1 Priority Non-Tax Cash $1.0 100%Class 2 Secured Claims Cash $1.0 100%
Class 3 GUCs16.9% of Equity and 78.4% of Rights $470.6 80%-100%
Class 4 Tort ClaimsCash $12mm 12% Litigation Trust, $4mm Insurance NA NA
Class 5 Environmental$270mm Cash, 88% Litigation trust $50mm Insurance NA NA
Class 6 Equity2-yr Warrants for 5% of Company Strike $3-6mm NA

Tronox Case Study
86 Confidential
Tronox Disclosure Statement Projections
Plan Projections 2009 2010P 2011P 2012P 2013P
Global revenues 1,071.8 1,168.5 1,231.0 1,247.7 1,272.9 % growth -27.8% 9.0% 5.4% 1.4% 2.0%
Gross profit 187.9 248.9 254.0 231.7 235.3 % margin 17.5% 21.3% 20.6% 18.6% 18.5%
EBITDAR 130.6 189.9 181.1 156.3 157.4 % margin 12.2% 16.3% 14.7% 12.5% 12.4%
Interest 31.2 78.0 31.1 27.5 23.8
Rent 5.0 5.0 5.0 5.0
Mandatory Amortization 3.4 3.2 2.8 2.3
Chg WC (99.7) 14.7 (26.2) (17.8) (15.4)
CapEx 22.0 106.0 57.1 49.0 47.5 % of revenues 2.1% 9.1% 4.6% 3.9% 3.7%
Free Cash Flow 177.1 12.3 58.4 54.3 63.5
NWC 258.6 282.0 297.1 301.1 307.2% Of Sales 24.1% 24.1% 24.1% 24.1% 24.1%

Tronox Case Study
87 Confidential
15.75 2.00 9.26 350.0$ 370.4$ 0.54 2.50 100.0$ 190.00$ 438.1$ 16.32 Recovery to 9.5% Sr Unsecured Notes Other GUCs Recovery
TEV
Multiple of 2010P
EBITDAREquity Value
Value per Share
Value of Primary
Shares for Notes
Value of Rights for
Notes
Total Value for
NotesRecovery on Face
Recovery On Claim
Value of Primary
Shares for GUCs
Value of Rights for
GUCs
Total Value for
GUCsRecovery on Claim
950.0$ 5.0x 511.9$ 31.37$ 62.6$ 156.5$ 219.1$ 62.6% 59.2% 16.9$ 42.2$ 59.2$ 59.2%1,000.0 5.3x 561.9$ 34.43$ 68.7 184.9 253.6 72.5% 68.5% 18.6 49.9 68.5 68.5%1,025.0 5.4x 586.9$ 35.96$ 71.8 199.0 270.8 77.4% 73.1% 19.4 53.7 73.1 73.1%1,050.0 5.5x 611.9$ 37.49$ 74.8 213.2 288.1 82.3% 77.8% 20.2 57.6 77.8 77.8%1,075.0 5.7x 636.9$ 39.02$ 77.9 227.4 305.3 87.2% 82.4% 21.0 61.4 82.4 82.4%1,100.0 5.8x 661.9$ 40.56$ 81.0 241.6 322.5 92.2% 87.1% 21.9 65.2 87.1 87.1%1,125.0 5.9x 686.9$ 42.09$ 84.0 255.8 339.8 97.1% 91.7% 22.7 69.0 91.7 91.7%1,150.0 6.1x 711.9$ 43.62$ 87.1 269.9 357.0 102.0% 96.4% 23.5 72.9 96.4 96.4%1,175.0 6.2x 736.9$ 45.15$ 90.1 284.1 374.2 106.9% 101.0% 24.3 76.7 101.0 101.0%1,200.0 6.3x 761.9$ 46.68$ 93.2 298.3 391.5 111.9% 105.7% 25.2 80.5 105.7 105.7%1,225.0 6.4x 786.9$ 48.22$ 96.2 312.5 408.7 116.8% 110.3% 26.0 84.4 110.3 110.3%1,250.0 6.6x 811.9$ 49.75$ 99.3 326.7 426.0 121.7% 115.0% 26.8 88.2 115.0 115.0%1,275.0 6.7x 836.9$ 51.28$ 102.4 340.8 443.2 126.6% 119.7% 27.6 92.0 119.7 119.7%
Note: Does not assume any shares allocated to management. 5% to manangement would shave approximately 4pts off recovery.
Recovery Estimates at Emergence
Rights Strike Price $14.46Cash 30.0Debt 468.1Preferred 15.0

Tronox Case Study
88 Confidential
Tronox Financials Post Emergence
2005A 2006A 2007A 2008A 2009A 2010A 2011A 2012E
Total Revenue 1,375.2 1,421.8 1,426.3 1,245.8 1,070.1 1,217.6 1,651.0 1,816.0 Growth Over Prior Year 5.6% 3.4% 0.3% (12.7%) (14.1%) 13.8% 35.6% 17.7%
Gross Profit 229.9 175.5 121.0 112.4 137.7 221.2 499.7 - Margin % 16.7% 12.3% 8.5% 9.0% 12.9% 18.2% 30.3% -
EBITDA 191.0 171.6 115.9 1.5 119.1 259.4 435.4 594.0 Margin % 13.9% 12.1% 8.1% 0.1% 11.1% 21.3% 26.4% 32.7%
EBIT 87.9 68.6 3.6 (74.2) 66.0 209.3 353.1 504.0 Margin % 6.4% 4.8% 0.3% (6.0%) 6.2% 17.2% 21.4% 27.8%
Earnings from Cont. Ops. 46.4 25.0 (105.1) (145.5) (28.7) 4.6 873.0 - Margin % 3.4% 1.8% (7.4%) (11.7%) (2.7%) 0.4% 52.9% -
Net Income 18.8 (0.2) (106.4) (334.9) (38.5) 5.8 872.8 469.0 Margin % 1.4% (0.0%) (7.5%) (26.9%) (3.6%) 0.5% 52.9% 25.8%
Diluted EPS Excl. Extra Items³ 1.89 0.61 (2.58) (3.55) (0.7) 0.11 49.135 28.95 Growth Over Prior Year NM (67.7%) NM NM NM NM 44,568.3% 87.3%

Tronox Case Study
89 Confidential
15.75 2.00 9.26 350.0$ 370.4$ 0.54 2.50 100.0$ 550.00$ 438.1$ 16.32 Recovery to 9.5% Sr Unsecured Notes Other GUCs Recovery
TEV
Multiple of 2010P
EBITDAREquity Value
Value per Share
Value of Primary
Shares for Notes
Value of Rights for
Notes
Total Value for
NotesRecovery on Face
Recovery On Claim
Value of Primary
Shares for GUCs
Value of Rights for
GUCs
Total Value for
GUCsRecovery on Claim
2,475.0$ 4.5x 2,036.9$ 124.81$ 249.1$ 1,021.5$ 1,270.6$ 363.0% 343.0% 67.3$ 275.8$ 343.0$ 343.0%2,612.5 4.8x 2,174.40 133.23 265.9 1,099.5 1,365.4 390.1% 368.6% 71.8 296.8 368.6 368.6%2,750.0 5.0x 2,311.90 141.66 282.8 1,177.5 1,460.3 417.2% 394.2% 76.3 317.9 394.2 394.2%2,887.5 5.3x 2,449.40 150.08 299.6 1,255.5 1,555.1 444.3% 419.8% 80.9 338.9 419.8 419.8%
3,025.00 5.5x 2,586.90 158.51 316.4 1,333.5 1,649.9 471.4% 445.4% 85.4 360.0 445.4 445.4%3,162.50 5.8x 2,724.40 166.93 333.2 1,411.5 1,744.7 498.5% 471.0% 90.0 381.1 471.0 471.0%3,300.00 6.0x 2,861.90 175.36 350.0 1,489.5 1,839.5 525.6% 496.6% 94.5 402.1 496.6 496.6%3,437.50 6.3x 2,999.40 183.78 366.8 1,567.5 1,934.3 552.7% 522.2% 99.0 423.2 522.2 522.2%3,575.00 6.5x 3,136.90 192.20 383.7 1,645.4 2,029.1 579.7% 547.8% 103.6 444.2 547.8 547.8%3,712.50 6.8x 3,274.40 200.63 400.5 1,723.4 2,123.9 606.8% 573.4% 108.1 465.3 573.4 573.4%
3,850.0 7.0x 3,411.90 209.05 417.3 1,801.4 2,218.7 633.9% 599.0% 112.7 486.3 599.0 599.0%3,987.5 7.3x 3,549.40 217.48 434.1 1,879.4 2,313.5 661.0% 624.6% 117.2 507.4 624.6 624.6%4,125.0 7.5x 3,686.90 225.90 450.9 1,957.4 2,408.4 688.1% 650.2% 121.7 528.4 650.2 650.2%
Recovery Estimates 2 Years Post Emergence
Current Capitalization (Millions of USD)Currency USDShare Price as of Apr-02-2012 $179.0 Shares Out. 15.1
Market Capitalization** 2,698.7 - Cash & Short Term Investments 154.0 + Total Debt 427.3 + Pref. Equity -+ Total Minority Interest -= Total Enterprise Value (TEV) 2,972.0

Tronox Case Study
90 Confidential
Recovery Estimates 2 Years Post Emergence
50.00
70.00
90.00
110.00
130.00
150.00
170.00
190.00
Dec-02-2
010
Dec-22-2
010
Jan-1
2-2011
Feb-02
-2011
Feb-23
-2011
Mar-15
-2011
Apr-04
-2011
Apr-25
-2011
May-13
-2011
Jun-0
3-2011
Jun-2
3-2011
Jul-1
4-201
1
Aug-03
-2011
Aug-23
-2011
Sep-13
-2011
Oct-03
-2011
Oct-21
-2011
Nov-10-2
011
Dec-01-2
011
Dec-21-2
011
Jan-1
2-2012
Feb-02
-2012
Feb-23
-2012
Mar-14
-2012
Tronox Inc. (OTCPK:TROX) - Share Pricing

SemGroup LP
91 Confidential
Prior to filing for Chapter 11 SemGroup was a privately held limited partnership engaged in midstream energy services including pipelines, storage, propane distribution, gas liquids extraction and energy marketing and trading.
These assets included the White Cliff ’s Pipeline, a critical component of the west’s energy infrastructure as the only pipeline from the oil rich DJ Basin in Colorado to the strategic storage hub in Cushing Oklahoma where the company had approximately 3mm barrels of storage capacity
The company’s energy marketing and trading operations were personally controlled by SemGroup’s CEO who entered into naked call options on the belief that crude prices would remain stable. Large trading losses occurd forcing SemGroup to post $2bn in collateral to support the trades putting a sever strain on the company’s liquidity. In July 2008 Barclay’s took over SemGroup’s trading book as the result of substantial losses and liquidity demands. This resulted in a $2.4bn loss. On July 28 the company filed for Chapter 11 bankruptcy protection
Company Overview
Chapter 11 Summary
Pre Petition Capital Structure Face
Amount
Secured Working Capital Agreement 1,740.0Secured Revolver 665.0Series B-2 Loan 200.0SemEuro Credit Agreement 45.0White Cliffs Credit Agreement 120.0
Total 1st Lien Secured Debt 2,770.08.75% Senioir Notes 610.0
Total Debt 3,380.0
SemGroup was able to secure post petition financing and stabilize operations. It had considerable litigation related to contracts with its crude suppliers that utilized the White Cliff ’s Pipeline.
SemGroup sold non-core assets, focused on managing its fee based assets and dramatically curtailed energy marketing activities
As a result the company was able to accumulate approximately $650mm in free cash as well as another $400mm in restricted and subidiary cash as well as $150mm in cash from asset sales. The company was rejected or restructured over 1,600 uneconomical leases and contracts

92
SemCrude SemCrude Strategic Positioning
SemGroup’s assets are strategically located in resource rich geographic areas including the Bakken, Niobara, Duvernay, Montney Shales and the Mississippi Lime formation
In addition, SemGroup is 51% owner of White Cliff’s pipeline, a FERC pipeline and 4.2 mm barrels of oil storage capacity located in Cushing, OK. White Cliff's is an oil pipeline serving the DJ Basin / Wattenberg and Niobrara Shale and is the only pipeline connecting DJ Basin to the strategic storage assets in Cushing, OK
48% was sold during to Plains All American, Anadarko, and Noble Petroleum to help pay down debt. Strategically, these partners are incented to use White Cliffs as much as possible
The majority of the volume for White Cliff’s comes from Watterburg Shale - a stable oil/gas field that is break-even at $50-60 WTI. However, the adjacent Niobrara Shale is a high quality emerging gas/oil shale that has enormous potential and is being compared to the Bakken Shale
The North Dakota System, which consists of the Bakken Shale and Williston Basin, offers growing demand for take-away capacity to provide gathering, storage and processing to the hub in Clearbrook, Minnesota
SemGroup is positioned to potentially increase its capacity on the Enbridge pipeline in the North Dakota System and expand with additional growth in take-away capacity
White Cliff’s Pipeline
SemGroup LP SemGroup LP

93
SemCrude SemCrude Strategic Positioning
The DJ basin is key development area and in February of this year Chesapeake Energy announced an investment from CNOOC for $700mm for a 33% interest in DJ and Powder River Basin leasehold interests
Noble Drilling, Chesapeake, and Anadarko have all spoken favorably of the Niobrara and are increasing their exploration of the area
Noble’s Q1 conference call the company stated . “We've now identified over 2,000 potential drilling locations on our 400,000-acre Wattenberg position are containing unrisk potential of 600 million barrels equivalent net to Noble Energy's interest. We're accelerating the program where we continue to see strong well results in the core and on the edges of the field.”
SemGroup’s Cushing is a critical Hub for oil storage / Nymex delivery and gets the highest oil prices in the region. Therefore, transportation into Cushing is a highly valuable asset
95% of the storage capacity leased to 3rd parties with 3-5 year contracts. SemGroup announced in the 4th quarter of 2010 that it was expanding storage by 1.96mm barrels, all of which has been leased on long term contract
Contango market is bullish for storage
Kansas Oklahoma Gathering System
SemGroup LP

SemGroup LP
94 Confidential
SemGroup’s asset footprint is located in the “Liquids Fairway,” which is the Mid-Continent region stretching from Western Canada to the Gulf Coast. These areas are liquids rich shale plays. SemGroup is well positioned in the large, rich producing-basins of North America, such as the Mississippi Zone, Bakken, Wattenberg, Niobrara, Montney, and Duvernay plays.
Producers are committing significant resources to these opportunities. The flow of hydrocarbons throughout this region creates an opportunity to utilize SemGroup’s assets which are also located near demand centers and connected to liquidity points where the Company can provide customers access to broader markets.
By purchasing SemGroup’s Secured Working Capital Facility at approximately 50% an investor would be creating assets at over a 50% discount to their replacement cost in area of critical energy infrastructure
An investor would also have the benefit of reintroducing the company to the public markets post-reorg in addition to the potential conversion to an MLP post reorg and capitalizing on the higher multiples as a result of their tax efficient pass-thru status
Investment Overview POR Summary
Distributable value in the Estate was $2,446bn and consisted of: $1,111 in Cash $300mm in a new 2nd lien TL $1,035 in Common Stock and warrants
SemGoup’s Secured creditors received in consideration for approximately $2.9bn claims: $524mm in Cash Pro rata share of 9% 2nd lien TL 95% of the equity in the reorganized
company 60% of the interests in the litigation trust
Blackstone valued the reorganized Debtor’s EV at a mid point of $1,500bn or 8x 2010P EBITDA Implied equity value at the mid point was
$1,035 or about $10.35 per share on a fully diluted basis. $24 based on current shares
SemGroup LP
Cash 70.0 $500mm Exit Facility - White Cliffs Financing 100.0 SemEuro Financing 35.0 2nd Lien Term Loan 319.0 Total Debt 454.0 Implied Equity Value 1,035.0 Enterprise Value 1,419.0
Exit Capital Structure

SemGroup LP
95 Confidential
December 2009: SemGroup Emerges From Bankruptcy
October 2010: SemGroup sells 49% interest in White Cliff ’s Pipeline to Noble Energy, Plains Exploration and Anadarko Petroleum for $141mm before purchase price adjustments. Proceeds were used for deleveraging
November 2010: SemGroup lists on the NYSE ticker SEMG
December 2010: SemGroup sells its SemCanadaCrude marketing business for ≈ $60mm
May 2011: SemGroup announces refinancing of its credit facility via RBS
June 2011: Announces formation of MLP structure
Post-Reorg Milestones Refinancing
SemGroup was able to access the capital markets and dramatically lower its cost of debt and increases its capital flexibility
SemGroup LP
Face 2011EAmount EV/EBITDA Rating
Cash(1) $71.0$350mm Revolver L+325 (2) 133.2 B1/B$100mm TLA L+325 100.0 B1/B$200mm TLB L+450 200.0 3.1x B1/BCapital Lease/Other 10.2 3.1x
Total Debt 443.4 3.1xNet Debt 372.4 2.6x
Common Stock (SEMG) $18.28Shares Out 42.2Equity Value 771.4
Enterprise Value 1,143.8 8.0x2011PF EBITDA 142.4
LiquidityCash 71.0
LCs Outstanding (109.0)Revolver 216.8
Total Liquidity 287.8

SemGroup LP
96 Confidential
Share Price Performance Post Emergence