Overview
27
Economic Development Framework for Interpreting Local Housing Markets in Small Town Canada Laura Ryser 1 , Greg Halseth 1 & David Bruce 2 1 University of Northern British Columbia 2 Mount Allison University
-
Upload
reese-morse -
Category
Documents
-
view
18 -
download
0
description
Economic Development Framework for Interpreting Local Housing Markets in Small Town Canada Laura Ryser 1 , Greg Halseth 1 & David Bruce 2 1 University of Northern British Columbia 2 Mount Allison University. Overview. Rural Restructuring and Housing Linkages - PowerPoint PPT Presentation
Transcript of Overview

Economic Development Framework for Interpreting
Local Housing Markets in Small Town Canada
Laura Ryser1, Greg Halseth1 & David Bruce2
1University of Northern British Columbia2Mount Allison University
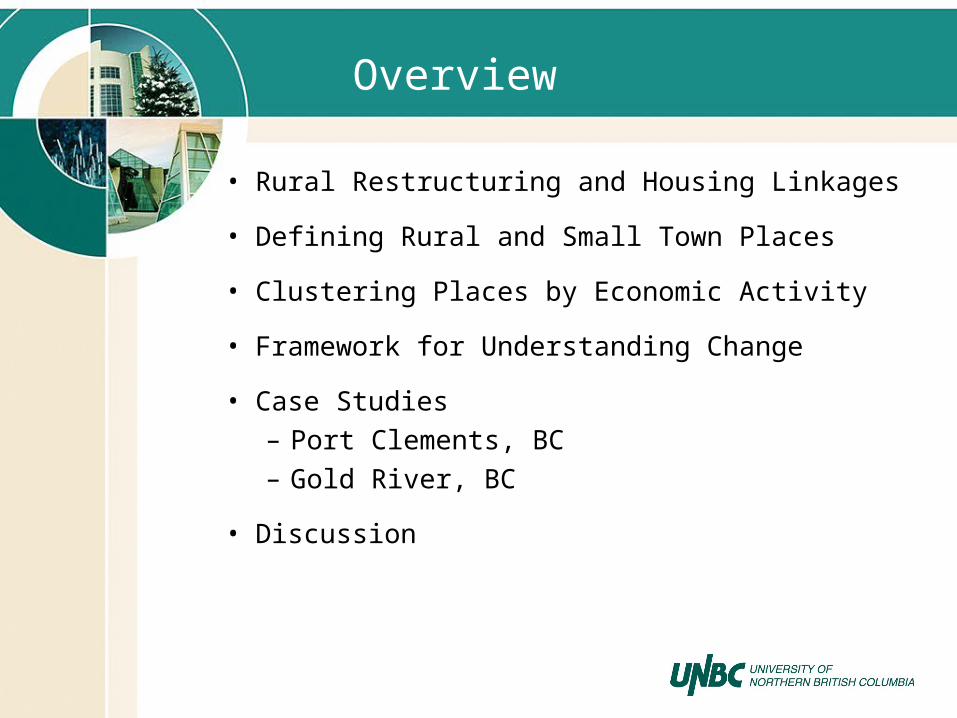
Overview
• Rural Restructuring and Housing Linkages
• Defining Rural and Small Town Places
• Clustering Places by Economic Activity
• Framework for Understanding Change
• Case Studies– Port Clements, BC– Gold River, BC
• Discussion

Rural Restructuring and Housing
• Housing investments based on projected future
• Employers may face difficulty with housing shortages or lack of affordability
• Lenders / insurers concerned about ability to recover losses on property in default

Defining Rural and Small Town Places
• Definitions link to why / what people are exploring in rural and small town places
• Census Subdivisions (CSDs)– Relatively stable– Facilitate comparisons over time
• No MIZ and Weak MIZ used
• Places selected:– Population 50 - 4,999– First Nations reserves excluded

Distribution of Places by MIZ Designation & Population Group
Population Group MIZ Code Total
No MIZ Weak MIZ
2,500-4,999
% within population group 3.7% 96.3%134
50-2,499
% within population group 47.3% 52.7%1,298
Total Count
% within population group 43.2% 56.8%1,432
Source: Derived from Rambeau, S. and K. Todd. 2000. Census Metropolitan Area and Census Agglomeration Influenced Zones (MIZ) with Census Data. Ottawa: Statistics Canada.

Clustering Places by Economic Activity
• Threshold: 25% of labour force employed in a sector or 25% age 65+
• SIC=Standard Industrial Classification 1980
Economic sectors include:– agricultural– fishing– forestry– mining– tourism– manufacturing
1Dynamic services = transportation & storage, communication & utility, wholesale, finance, real estate & business
2Non-market services = government, education, health, and social services
– dynamic services1
– non-market services2
– retirement– dual specialization– non-specialized

Models of Community Development
• Lucas (1971)– Construction– Recruitment– Transition– Maturity
• Bradbury (1988)– Winding down– Closure
• Halseth and Sullivan (2002)– Alternative futures
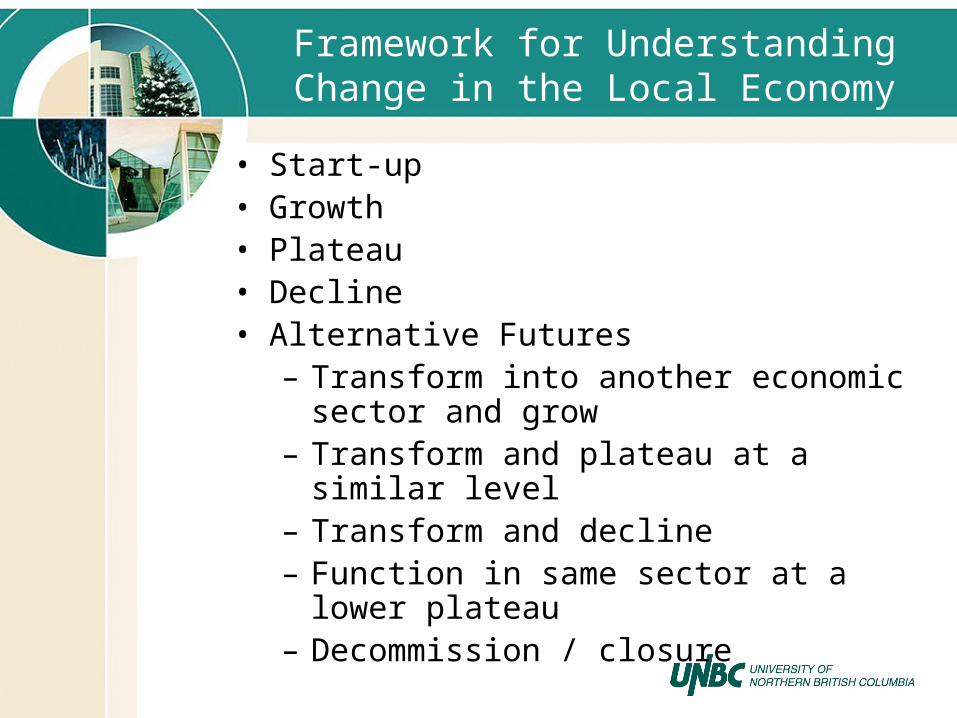
Framework for Understanding Change in the Local Economy
• Start-up• Growth• Plateau• Decline• Alternative Futures
– Transform into another economic sector and grow
– Transform and plateau at a similar level– Transform and decline– Function in same sector at a lower plateau– Decommission / closure

Socio-economic Characteristics to Indicate Change in Community Development
• Population
• Household
• Migration
• Income
• Labour Force Participation
• Housing

Summary of RST Population Change
All Communities with 1991 Population 50-4,999, 1991-2001
Source: Statistics Canada 2001, 1991.
Category Total Lost
% Total Gained
% N=
All communities 954 71.0 388 29.0 1342
Agricultural 236 84.9 42 15.1 278
Fishing 21 95.5 1 4.5 22
Forestry 9 69.2 4 30.8 13
Mining 23 88.5 3 11.5 26
Tourism 6 50.0 6 50.0 12
Manufacturing 90 80.4 22 19.6 112
Dynamic 27 54.0 23 46.0 50
Non-market 143 54.0 122 46.0 265
Retirement 30 71.4 12 28.6 42
Dual specialization 217 72.8 81 27.2 298
Non-specialized 144 65.2 77 34.8 221
Case Studies I
• Purposeful sampling methodology
• 11 case studies reflect the 11 sectors
• Case studies drawn from database
• Triangulation– Newspaper archives, reports, gov’t
publications, community websites, etc.

Case Studies II
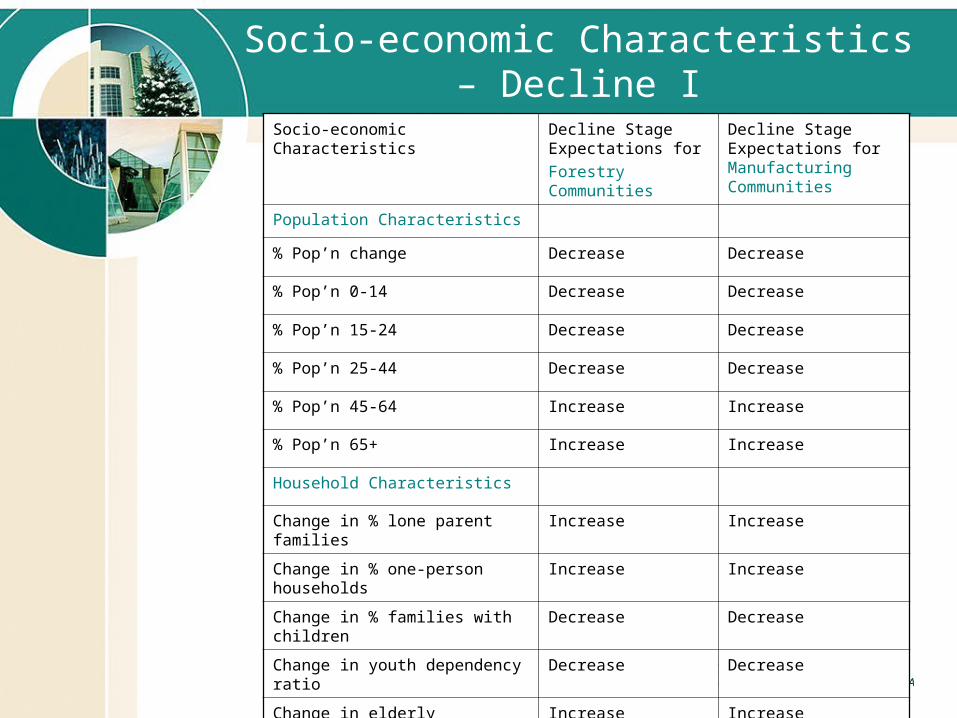
Socio-economic Characteristics – Decline I
Socio-economic Characteristics Decline Stage Expectations for
Forestry Communities
Decline Stage Expectations for Manufacturing Communities
Population Characteristics
% Pop’n change Decrease Decrease
% Pop’n 0-14 Decrease Decrease
% Pop’n 15-24 Decrease Decrease
% Pop’n 25-44 Decrease Decrease
% Pop’n 45-64 Increase Increase
% Pop’n 65+ Increase Increase
Household Characteristics
Change in % lone parent families Increase Increase
Change in % one-person households
Increase Increase
Change in % families with children Decrease Decrease
Change in youth dependency ratio Decrease Decrease
Change in elderly dependency ratio Increase Increase

Socio-economic Characteristics – Decline II
Socio-economic Characteristics Decline Stage Expectations for
Forestry Communities
Decline Stage Expectations for Manufacturing Communities
Income Characteristics
Change in % employment income Decrease Decrease
Change in % gov’t transfer payments Increase Increase
Change in % other income Increase Increase
Labour Force Characteristics
Change in % employed in forestry/manuf Decrease Decrease
Change in LF Participation rate 15+ Decrease Decrease
Change in LF Participation rate Females 15+
Decrease Decrease
Change in % commute outside CSD Increase Increase
Housing Characteristics
Change in % built last 5 years Decrease Decrease
% Change in average dwelling value Decrease Decrease

Forestry: Port Clements
• Decline period: 1996-2001– 1996: 44% employed in forestry– 2001: 33.3% employed in forestry
• No MIZ status– 42 kms to Masset– 6 hour ferry ride to Prince Rupert

Port Clements I: 1996-2001
Socio-economic Characteristics Decline Stage Expectations for Forestry Communities
Port Clements
1996-2001
Population Characteristics
% Pop’n change Decrease -7.5%
% Pop’n 0-14 Decrease -17.9%
% Pop’n 15-24 Decrease -6.7%
% Pop’n 25-44 Decrease -30.0%
% Pop’n 45-64 Increase 12.5%
% Pop’n 65+ Increase 16.7%
Household Characteristics
Change in % lone parent families Increase 14.4%
Change in % one-person households Increase 4.6%
Change in % families with children Decrease -15.2%
Change in youth dependency ratio Decrease -2.1%
Change in elderly dependency ratio Increase 2.5%

Port Clements II: 1996-2001
Socio-economic Characteristics Decline Stage Expectations for Forestry Communities
Port Clements
1996-2001
Income Characteristics
Change in % employment income Decrease 0.9%
Change in % gov’t transfer payments Increase 1.2%
Change in % other income Increase -2.5%
Labour Force Characteristics
Change in % employed in forestry Decrease -11.3%
Change in LF Participation rate 15+ Decrease -1.9%
Change in LF Participation rate Females 15+ Decrease 11.7%
Change in % commute outside CSD Increase -36.5%
Housing Characteristics
Change in % built last 5 years Decrease -16.1%
% Change in average dwelling value Decrease 18.5%

Port Clements: Context for Change
• Challenges
– Isolation
– Softwood Lumber Dispute
– Crown land controlled by large corporations
– Aboriginal land claims
– Regionalization of services in Terrace

Port Clements: Context for Change
• Alternative Futures / Opportunities
– Non-market service sector growing
– Broadband Internet access
– Off-shore oil and gas
– Cinola mine site
– Community forest
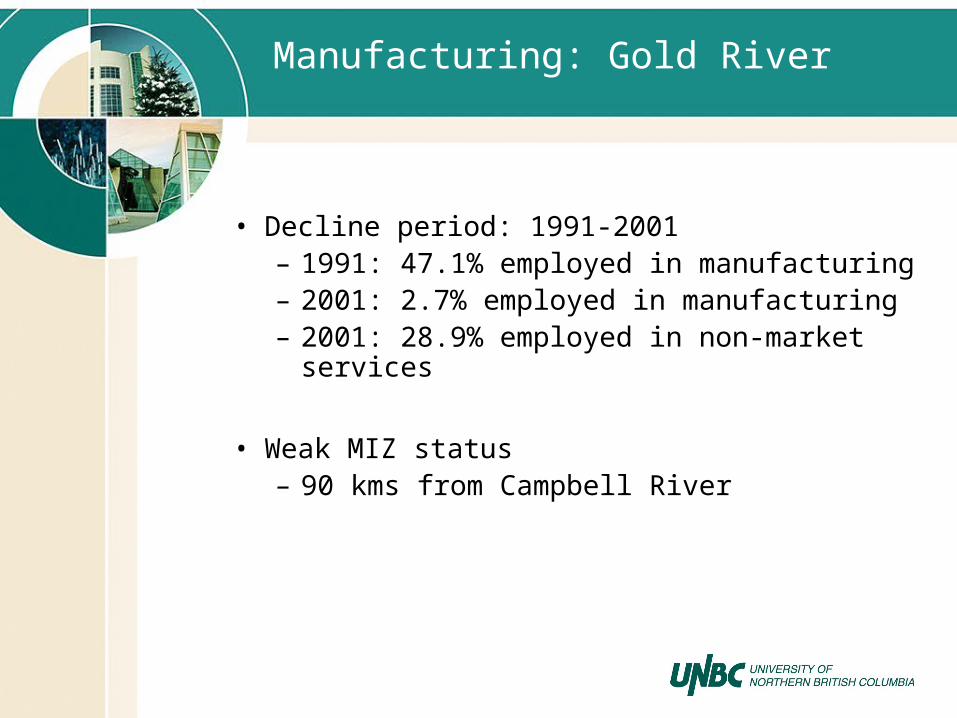
Manufacturing: Gold River
• Decline period: 1991-2001– 1991: 47.1% employed in manufacturing– 2001: 2.7% employed in manufacturing– 2001: 28.9% employed in non-market
services
• Weak MIZ status– 90 kms from Campbell River

Gold River I: 1991-2001
Socio-economic Characteristics Decline Stage Expectations for Manufact. Towns
Gold River
1991-2001
Population Characteristics
% Pop’n change Decrease -37.3%
% Pop’n 0-14 Decrease -52.9%
% Pop’n 15-24 Decrease -52.4%
% Pop’n 25-44 Decrease -56.3%
% Pop’n 45-64 Increase 25.0%
% Pop’n 65+ Increase 600.0%
Household Characteristics
Change in % lone parent families Increase -2.3%
Change in % one-person households Increase 7.1%
Change in % families with children Decrease -26.5%
Change in youth dependency ratio Decrease -10.1%
Change in elderly dependency ratio Increase 9.7%

Gold River II: 1991-2001
Socio-economic Characteristics Decline Stage Expectations for Manufacturing Communities
Gold River
1991-2001
Income Characteristics
Change in % employment income Decrease -15.6%
Change in % gov’t transfer payments Increase 5.8%
Change in % other income Increase 10.0%
Labour Force Characteristics
Change in % employed in manufacturing Decrease -44.4%
Change in LF Participation rate 15+ Decrease -10.2%
Change in LF Participation rate Females 15+ Decrease -0.5%
Change in % commute outside CSD Increase 3.4%
Housing Characteristics
Change in % built last 5 years Decrease 0.0%
% Change in average dwelling value Decrease -13.1%

Gold River: Context for Change
• Challenges– Poor newsprint prices– High fibre, transportation, and energy
costs– High bank interest– Increase in stumpage rates– Economic slump in Asia– Mill closure

Gold River: Context for Change
• Alternative Future / Opportunities
– Commercial / tourism fishing re-opened in 1997
– Gold River Housing Corporation – sale in 1999
– Provincial funding to maintain services / ease burden of lost tax base
– Epcor power plant

Discussion I
• Housing is an important commodity and service
• Decisions must be taken with care and appropriate information
• Mortgage insurance providers, investors, and policy makers need to look beyond the current state of the economy

Discussion II
• Framework to understand trajectory of economic development in RST places
• 11 types of economic sectors• Socio-economic characteristics provide
mechanism for tracking change• Case studies reasonably consistent with
framework• Inconsistencies demonstrate that places
are unique – context matters

3333 University Way, Prince George, BC, Canada
V2N 4Z9http://www.unbc.ca/cdi
Dr. Greg Halseth, Acting Director Phone: (250) 960-5826Fax: (250) 960-6533Email: [email protected]
Community Development Institute (CDI)