
Overseas Study at Indiana University Bloomington: Plans ...
29
Plans, Participation, and Outcomes University Planning, Institutional Research, and Accountability May, 2009 Overseas Study at Indiana University Bloomington
Transcript of Overseas Study at Indiana University Bloomington: Plans ...

Plans, Participation, and Outcomes
University Planning,
Institutional Research, and Accountability
May, 2009
Overseas Study at Indiana University Bloomington

Contents
Introduction ....................................................................................................................................................................... 3
Overview of Findings ......................................................................................................................................................... 3
Section 1: Pre-College Plans to Study Abroad ................................................................................................................... 5
Section 2: First-Year Plans to Study Abroad ...................................................................................................................... 8
Section 3: Participation in Overseas Study ...................................................................................................................... 10
Section 4: Academic Outcomes of Overseas Study ......................................................................................................... 12
Section 5: Developmental Gains Due to Overseas Study ................................................................................................ 14
References ....................................................................................................................................................................... 15
Appendix 1: Methodology ............................................................................................................................................... 16
Appendix 2: Tabled Results ............................................................................................................................................. 20
2

Introduction
This report utilizes data from seven cohorts (2001-2007) of beginning students at Indiana University Bloomington to
examine students’ plans to participate in study abroad, their actual participation in overseas study courses during college,
and the impact of their participation in overseas study on a number of academic and developmental outcomes. The
release of this report is timely, given the university’s approval of its International Strategic Plan (2008) that stresses the
need to expand education abroad. Specifically, the university’s near-term goals for education abroad are to:
1. Increase participation in study abroad programs on all campuses, where this is consistent with campus missions
2. Increase participation in study abroad programs in Asia and other underrepresented areas
3. Provide improved incentives to both faculty and students for participation in study abroad
4. Eliminate or reduce disincentives associated with structural impediments to expanded study-abroad participation
This report may assist the university in moving closer toward several of these goals by establishing a profile for students
who both plan to study abroad and actually participate in overseas study. In creating such a profile, target groups that are
unable to realize their intentions to study abroad are identified, the specific barriers facing these students can be further
studied, and resources dedicated to increasing the number of students who study abroad can be used more efficiently.
The findings presented in this report are based on inferential as opposed to descriptive statistics. The aim of this approach
is to isolate the impact of various factors on students’ study abroad plans, participation, and outcomes by statistically
adjusting for other student characteristics and experiences that are presumed to influences these decisions. As such, the
results presented in this report provide the unique “estimated” differences among groups of students while holding
constant other known characteristics and experiences of these students. This report relies on correlational analyses;
although providing a measure of the strength of association among two or more factors, this approach does not verify and
should not imply causation.
An overview of the reports’ findings is provided below. The main body of the report is divided into sections that follow the
chronology of the student pipeline for overseas study from pre-college intentions to first-year intentions to eventual
participation in college and its associated outcomes. Two appendices to the report provide more detailed information for
interested readers. Appendix 1 provides information on the methodology, including the student samples, data sources and
variable definitions, and analytic techniques employed in this study. Appendix 2 provides detailed information on the
parameter estimates, standard errors, and statistical significance for each model estimated in this study.
Overview of Findings
1. Pre-college plans to study abroad differ by gender, race, residence, parents’ education level, prior academic
achievement, level of high school involvement, and expected college major.
Compared to their peers, females, underrepresented minorities, nonresidents, students with college educated
parents, and students with higher SAT scores all have greater likelihoods of planning to study abroad during
college.
Students who are more involved in high school, especially those students who participate in one or more
multicultural activities, are more likely to plan to study abroad during college.
Students who expect to major in the Arts & Humanities or in the Social Sciences have the highest relative
likelihoods of planning to study abroad during college, whereas students who expect to major in the Biological &
Health Sciences, Education, and Physical Sciences and Mathematics have the lowest relative likelihoods.
3

Overview of Findings (continued)
2. Even after taking into account students’ pre-college plans to study abroad, differences in students’ first-year plans to
study abroad are still evident by gender, race, residency, financial aid status, prior academic achievement, and college
major.
Females, underrepresented minorities, nonresidents, students who do not apply for financial aid or who apply and
have no financial need, and students with higher SAT scores all have greater likelihoods of planning to study
abroad during college than their peers.
Students who select majors within the Biological & Health Sciences, Education, and Physical Sciences and
Mathematics still have the lowest relative likelihoods of planning to study abroad at the end of their first year of
college.
3. Having greater levels of engagement with diverse others and more opportunities to reflect on views and opinions that
are different from one’s own significantly increases the students’ chances of planning to study abroad during the first
year of college, even after taking into account the students’ pre-college plans.
4. Even after taking into account the students’ prior plans to study abroad, students’ participation in overseas study by
the end of their fourth year of college differs significantly by gender, residency, first generation status, financial aid
status, prior academic achievement, and college major,.
Compared to their peers, females, nonresidents, students with college educated parents, students who do not
apply for financial aid, and students with higher SAT scores and higher first semester GPAs all have greater
likelihoods of participating in overseas study.
Students who major in Business & Communications, in the Arts & Humanities, or in the Social Sciences have the
highest relative likelihoods of participating in overseas study, whereas students who major in the Biological &
Health Sciences, Education, and Physical Sciences and Mathematics have the lowest relative likelihoods.
5. Students who participate in one or more overseas study courses by the end of their fourth year of college have
significantly higher cumulative grade point averages than non-participants, even after accounting for prior academic
achievement and college major.
6. Compared to their peers, students who participate in one or more overseas study courses by the end of their fourth
year of college have a greater likelihood of graduating within four years, even after accounting for prior academic
achievement and college major.
7. Seniors’ self-reported gains in general education, practical competence, and personal and social development do not
differ significantly by their participation in overseas study.
4

Section 1: Pre-College Plans to Study Abroad
A recent study from the Wabash National Study of Liberal Arts Education (Salisbury, Umbach,
Paulsen, & Pascarella, 2009) found that students’ pre-disposition to study abroad differs both by
their socioeconomic status and their social and cultural capital. Aside from the Salisbury, et al.
study, very little research has examined entering students’ intentions to study abroad during
college. If measured during the early stages of the college experience, however, information on
the characteristics of students who plan or do not plan to study abroad could assist campus policy-
makers in realigning programs and resources toward maximizing the number of students who
participate in overseas study while in college. This section provides the results of an analysis
predicting pre-college plans to study abroad among 20,839 students who took the SAT Reasoning
Test and entered Indiana University Bloomington as beginning students during a fall semester
between 2004 and 2008. Overall, 24% of these entering students planned to study abroad.
Demographic and Socioeconomic Background
Pre-college plans to study abroad differed significantly by the students’ demographic and
socioeconomic backgrounds (see Table 1.1). Specifically, students were more likely to express pre-
college plans to study abroad if they:
Were female instead of male
Were members of an historically
underrepresented racial/ethnic
minority (i.e., African American,
American Indian, or Hispanic) as
opposed to members of another racial
or ethnic group
Were non-residents instead of Indiana
residents
Had college-educated parents as
opposed to being first-generation
college students
Pre-college plans to study abroad, however, did not differ by the students’ economic background.
In particular, students who filed a FAFSA and were determined to have financial need had roughly
the same pre-college likelihood of planning to study abroad as either students who did not file a
FAFSA or students who filed and were determined to have no financial need.
High School Achievement
Pre-college plans to study abroad also
differed significantly by the students’
level of academic achievement. As seen
in Figure 1.1, the students’ SAT
composite score was positively related to
the students’ study abroad plans.
Students’ pre-college plans to study
abroad, however, were not related to
their high school GPA.
Table 1.1 Estimated Prob. of Pre-College Plans to Study Abroad
by Background Characteristics
Probability
Difference in Prob.
Male 0.15 Female 0.26 0.11
Other Race 0.20 Underrepresented Minority 0.24 0.04
Resident 0.20 Nonresident 0.23 0.03
College-Educated Parents 0.21 First-Generation 0.19 -0.02
0.00
0.20
0.40
0.60
0.80
1.00
800 1000 1200 1400 1600
SAT Composite
Figure 1.1Estimated Prob. of Pre-College Plans to Study Abroad
by SAT Composite Score
Pre-college plans to
study abroad differ
by gender, race,
residency, and
parents’ education,
but not by financial
aid status.
5

0.20
0.49
0.17
0.28
0.200.28
0.16
0.69
0.00
0.20
0.40
0.60
0.80
1.00
No Yes No Yes No Yes None All Three
Figure 1.2Estimated Probability of Pre-College Plans to Study Abroad
by Multicultural High School Activities
Study Abroad
Foreign Lang. Activity
Cross-cultural Activity
Cumulative
Section 1: Pre-College Plans to Study Abroad (continued)
High School Involvement
Student involvement in various multicultural high school activities was also significantly related to
the students’ pre-college plans to study abroad (see Figure 1.2).
Chief among these activities was the students’ participation in study abroad while in high school.
Although only 4% of entering students participated in such foreign exchange or study abroad
activities while in high school, the magnitude of the impact of such participation on students’ pre-
college plans to study abroad was substantial. Specifically, all else being equal, students who
participated in study abroad while in high school had a probability of planning to participate in
study abroad during college of 0.49 (compared to a probability of 0.20 for nonparticipants). This
difference in probability due to participation in high school study abroad is roughly equivalent to
the difference in the probability of planning to study abroad between a student with an 1100 SAT
(at 0.19) and a student with a 1550 SAT (at 0.48) (see Figure 1.1). Significant differences in pre-
college plans to study abroad were also evident by participation in a high school foreign language
activity and by participation in a cross-cultural or ethnic activity. Finally, there is a cumulative
effect of having participated in all three of these activities while in high school. Whereas students
who did not participate in any of these activities had a probability of planning to study abroad
during college of 0.16, the students who participated in all three activities had a probability of
planning to study abroad of 0.69.
Plans to study abroad also differed by
participation in more common high
school activities, such as student
government and community service (see
Table 1.2). Differences in plans to study
abroad by the students’ participation in
an honor society, however, were not
statistically significant. This lack of
statistical significance is likely due to
students’ SAT scores and high school
GPAs also being predictors in the
statistical model.
Table 1.2 Estimated Prob. of Pre-College Plans to Study Abroad
by High School Activities
Probability
Difference in Prob.
Student Government No 0.20
Yes 0.24 0.04
Community Service No 0.17
Yes 0.24 0.07
Participation in one
or more multi-
cultural activity
while in high school
significantly
increases the
students’ pre-college
plans to study
abroad during
college.
6
Section 1: Pre-College Plans to Study Abroad (continued)
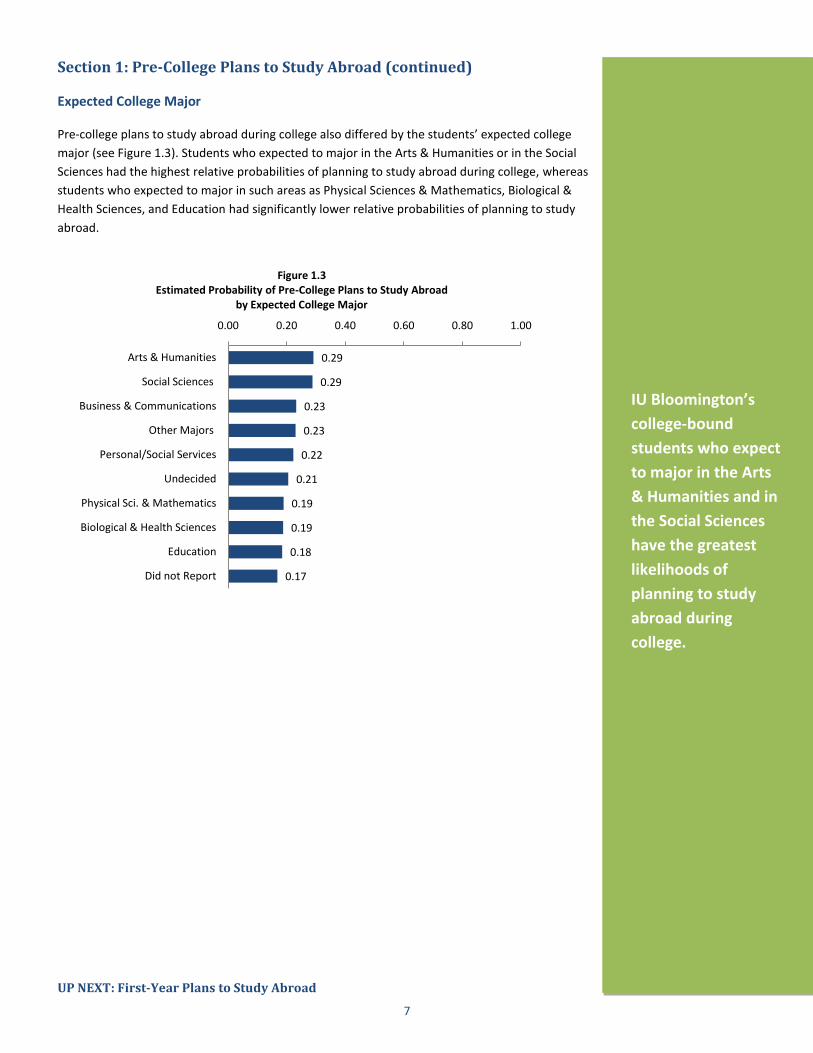
Expected College Major
Pre-college plans to study abroad during college also differed by the students’ expected college
major (see Figure 1.3). Students who expected to major in the Arts & Humanities or in the Social
Sciences had the highest relative probabilities of planning to study abroad during college, whereas
students who expected to major in such areas as Physical Sciences & Mathematics, Biological &
Health Sciences, and Education had significantly lower relative probabilities of planning to study
abroad.
UP NEXT: First-Year Plans to Study Abroad
0.17
0.18
0.19
0.19
0.21
0.22
0.23
0.23
0.29
0.29
0.00 0.20 0.40 0.60 0.80 1.00
Did not Report
Education
Biological & Health Sciences
Physical Sci. & Mathematics
Undecided
Personal/Social Services
Other Majors
Business & Communications
Social Sciences
Arts & Humanities
Figure 1.3Estimated Probability of Pre-College Plans to Study Abroad
by Expected College Major
IU Bloomington’s
college-bound
students who expect
to major in the Arts
& Humanities and in
the Social Sciences
have the greatest
likelihoods of
planning to study
abroad during
college.
7
Section 2: First-Year Plans to Study Abroad
The first year of college is a transitional period in which students identify, evaluate, and make
important choices about their educational goals. Study abroad is one specific educational
objective that can be shaped during this pivotal stage of student development. When Salisbury, et
al. (2009) analyzed first-year students’ interest in study abroad, they concluded that intentions to
participate were mitigated by students’ first-year experiences. The results presented in this
section are based on the analysis of a sample of 1,642 beginning students who took the SAT
Reasoning Test, first entered Indiana University Bloomington during a fall semester between 2004
and 2008, and completed the National Survey of Student Engagement during a subsequent spring
semester. Overall, 55% of these first-year students indicated that they planned to study abroad
during college.
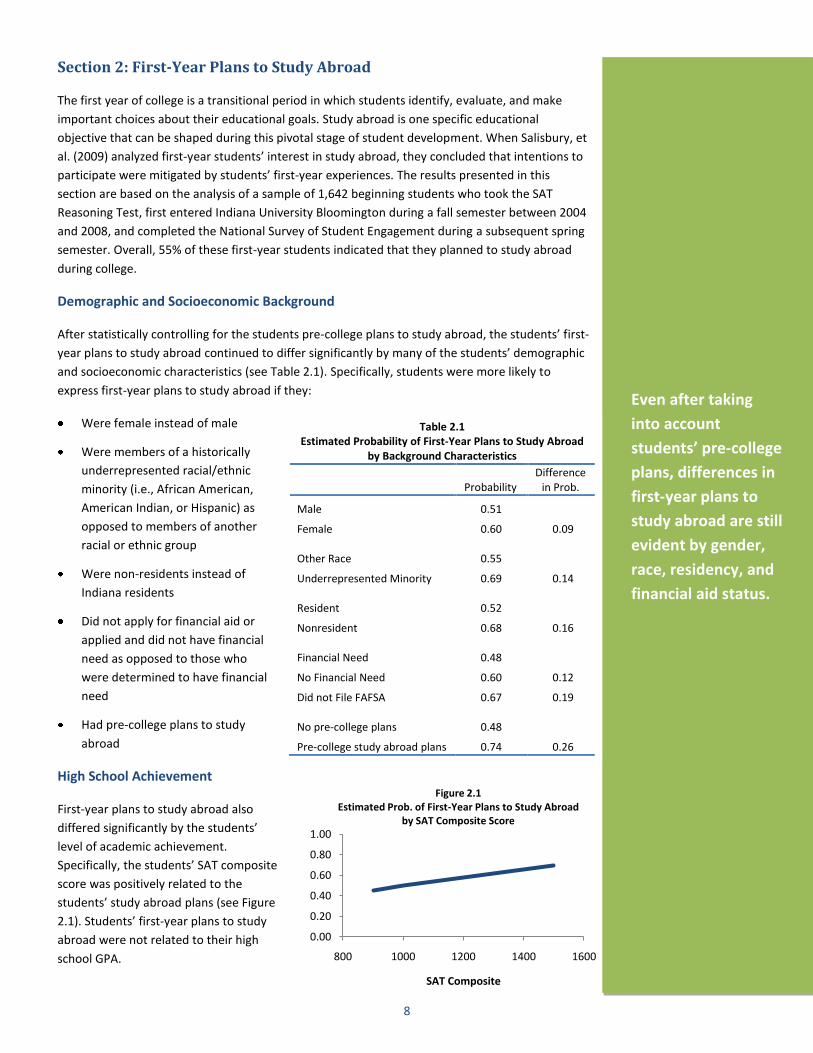
Demographic and Socioeconomic Background
After statistically controlling for the students pre-college plans to study abroad, the students’ first-
year plans to study abroad continued to differ significantly by many of the students’ demographic
and socioeconomic characteristics (see Table 2.1). Specifically, students were more likely to
express first-year plans to study abroad if they:
Were female instead of male
Were members of a historically
underrepresented racial/ethnic
minority (i.e., African American,
American Indian, or Hispanic) as
opposed to members of another
racial or ethnic group
Were non-residents instead of
Indiana residents
Did not apply for financial aid or
applied and did not have financial
need as opposed to those who
were determined to have financial
need
Had pre-college plans to study
abroad
High School Achievement
First-year plans to study abroad also
differed significantly by the students’
level of academic achievement.
Specifically, the students’ SAT composite
score was positively related to the
students’ study abroad plans (see Figure
2.1). Students’ first-year plans to study
abroad were not related to their high
school GPA.
Even after taking
into account
students’ pre-college
plans, differences in
first-year plans to
study abroad are still
evident by gender,
race, residency, and
financial aid status.
Table 2.1 Estimated Probability of First-Year Plans to Study Abroad
by Background Characteristics
Probability
Difference in Prob.
Male 0.51
Female 0.60 0.09 Other Race 0.55
Underrepresented Minority 0.69 0.14 Resident 0.52
Nonresident 0.68 0.16 Financial Need 0.48
No Financial Need 0.60 0.12
Did not File FAFSA 0.67 0.19 No pre-college plans 0.48
Pre-college study abroad plans 0.74 0.26
0.00
0.20
0.40
0.60
0.80
1.00
800 1000 1200 1400 1600
SAT Composite
Figure 2.1Estimated Prob. of First-Year Plans to Study Abroad
by SAT Composite Score
8
Section 2: First-Year Plans to Study Abroad (continued)
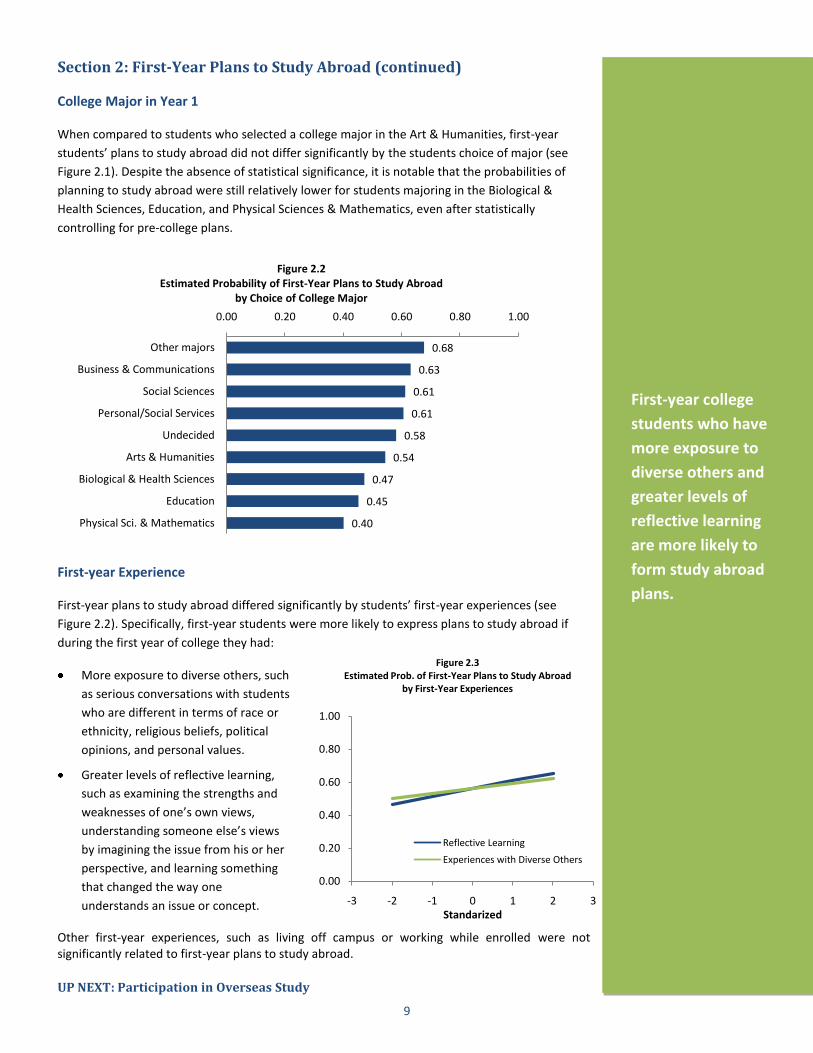
College Major in Year 1
When compared to students who selected a college major in the Art & Humanities, first-year
students’ plans to study abroad did not differ significantly by the students choice of major (see
Figure 2.1). Despite the absence of statistical significance, it is notable that the probabilities of
planning to study abroad were still relatively lower for students majoring in the Biological &
Health Sciences, Education, and Physical Sciences & Mathematics, even after statistically
controlling for pre-college plans.
First-year Experience
First-year plans to study abroad differed significantly by students’ first-year experiences (see
Figure 2.2). Specifically, first-year students were more likely to express plans to study abroad if
during the first year of college they had:
More exposure to diverse others, such
as serious conversations with students
who are different in terms of race or
ethnicity, religious beliefs, political
opinions, and personal values.
Greater levels of reflective learning,
such as examining the strengths and
weaknesses of one’s own views,
understanding someone else’s views
by imagining the issue from his or her
perspective, and learning something
that changed the way one
understands an issue or concept.
Other first-year experiences, such as living off campus or working while enrolled were not significantly related to first-year plans to study abroad.
UP NEXT: Participation in Overseas Study
0.40
0.45
0.47
0.54
0.58
0.61
0.61
0.63
0.68
0.00 0.20 0.40 0.60 0.80 1.00
Physical Sci. & Mathematics
Education
Biological & Health Sciences
Arts & Humanities
Undecided
Personal/Social Services
Social Sciences
Business & Communications
Other majors
Figure 2.2Estimated Probability of First-Year Plans to Study Abroad
by Choice of College Major
0.00
0.20
0.40
0.60
0.80
1.00
-3 -2 -1 0 1 2 3Standarized
Figure 2.3Estimated Prob. of First-Year Plans to Study Abroad
by First-Year Experiences
Reflective Learning
Experiences with Diverse Others
First-year college
students who have
more exposure to
diverse others and
greater levels of
reflective learning
are more likely to
form study abroad
plans.
9

Section 3: Participation in Overseas Study
In a recent report by the Association of American Colleges and Universities (2007), study abroad is
listed among the more effective educational practices in augmenting students’ diversity and
global learning. The National Survey of Student Engagement (2007) has also recently listed study
abroad among a set of “high impact” activities that it recommends students should participate in
before graduating from college. The purpose of this section is to explore the differences in the
characteristics of students who participated in overseas study by the end of their fourth year of
college after statistically controlling for their pre-college plans. In other words, this section
identifies those students who are able from those who are unable to realize their intentions to
study abroad. The results presented in this section are based on the analysis of 7,759 students
who took the SAT Reasoning Test, entered Indiana University Bloomington as beginners during
the fall semesters of 2004 and 2005, and were retained through the fall semester of their third
year of college. Of these students, approximately 23% had pre-college plans to study abroad.
Among students with pre-college plans to study abroad, only 34% had participated in overseas
study by the end of their fourth year of college. Among students with no pre-college plans, 14%
had participated in overseas study by their fourth year of college.
Demographic and Socioeconomic Background
Participation in overseas study differed
significantly by all demographic and
socioeconomic characteristics but
race/ethnicity, even after statistically
controlling for the students’ pre-college
plans to study abroad (see Table 3.1).
Specifically, students were more likely
to participate in overseas study if they:
Were female instead of male
Were non-residents instead of
Indiana residents
Had college-educated parents as
opposed to being first-generation
college students.
Did not apply for financial aid as
opposed to having financial need
Had pre-college plans to study
abroad
Prior Academic Achievement
Both SAT scores and first semester GPA had a
positive impact on student’s participation in
overseas study (see Figure 3.1). After placing
each measure on a standardized scale to
enhance comparability, the impact of first
semester GPA on overseas study appears
greater than the impact of the students’ SAT
scores.
Student participation
in overseas study
differed significantly
by gender, residency,
first generation
status, and financial
aid status, even after
taking into account
the students’ prior
plans to study
abroad.
Table 3.1 Estimated Probability of Participation in Overseas Study
by Background Characteristics
Probability
Difference in Prob.
Male 0.10
Female 0.17 0.07
Resident 0.11
Nonresident 0.21 0.10
College-Educated Parents 0.14
First-Generation 0.10 -0.04
Need 0.11
No Need 0.13 0.02 NS
No Application 0.18 0.07
No pre-college plans 0.11
Pre-college study abroad plans 0.22 0.11
NS = Not Significant
0.00
0.10
0.20
0.30
0.40
0.50
-3 -2 -1 0 1 2 3
Standardized
Figure 3.1Estimated Prob. of Overseas Study
by First Semester GPA and SAT
GPA
SAT
10

Section 3: Participation in Overseas Study (continued)
College Major in Year 3
Participation in overseas study also differed by the students’ choice of major (see Figure 3.3).
Students who majored in Business & Communications, the Social Sciences, or the Arts &
Humanities had the highest relative probabilities of participating in overseas study by the end of
the fourth year of college, whereas those who majored Physical Sciences & Mathematics,
Biological & Health Sciences, and Education had substantially lower relative probabilities of
participating in overseas study.
UP NEXT: Academic Outcomes of Overseas Study
0.05
0.08
0.10
0.10
0.12
0.16
0.18
0.20
0.21
0.00 0.20 0.40 0.60 0.80 1.00
Education
Undecided
Biological & Health Sciences
Physical Sci. & Mathematics
Personal/Social Services
Other majors
Arts & Humanities
Social Sciences
Business & Communications
Figure 3.3Estimated Probability of Particapitating in Study Abroad by End of Year 4
by Choice of College Major
College-bound
students who expect
to major in the arts
& humanities or in
the social sciences
have the greatest
likelihoods of
planning to study
abroad during
college.
Students majoring in
areas such as
Business &
Communications, the
Social Sciences, or
the Arts &
Humanities had the
greatest chances of
participating in
overseas study.
11
Section 4: Academic Outcomes of Overseas Study
Prior research has found that studying abroad enhances students’ academic gains as measured by
overall GPA and graduation rates. Specifically, students who study abroad tend to earn higher
cumulative grade point averages than their peers, particularly among those with lower grades
prior to studying abroad (Clabby & Wright, 2009). Similarly, a recent analysis at the University of
Minnesota (Malmgren & Galvin, 2008) found that studying abroad did not prevent students from
graduating on time; rather, they made greater gains than their peers in terms of degree
attainment. Malmgren & Galvin also found that underrepresented minorities who studied abroad
had higher graduation rates than their peers who did not study abroad.
This section explores the impact of overseas study on cumulative grade point average and on the
students’ status (i.e., graduated, persisted, or departed) at the beginning of what would be their
fifth year of college. The results presented in this section are based on the analysis of 20,030
students who entered Indiana University Bloomington as beginners during a fall semester
between 2001 and 2004 and who were retained at IU Bloomington through the fall semester of
their third year of college. Of this population, approximately 18% had actually participated in
overseas study by the end of their fourth year of college. The average cumulative GPA for this
population was 3.14; 79% had graduated from IU Bloomington within four years, 9% had persisted
at IU Bloomington to the fifth year of college, and 12% had departed IU Bloomington without a
degree.
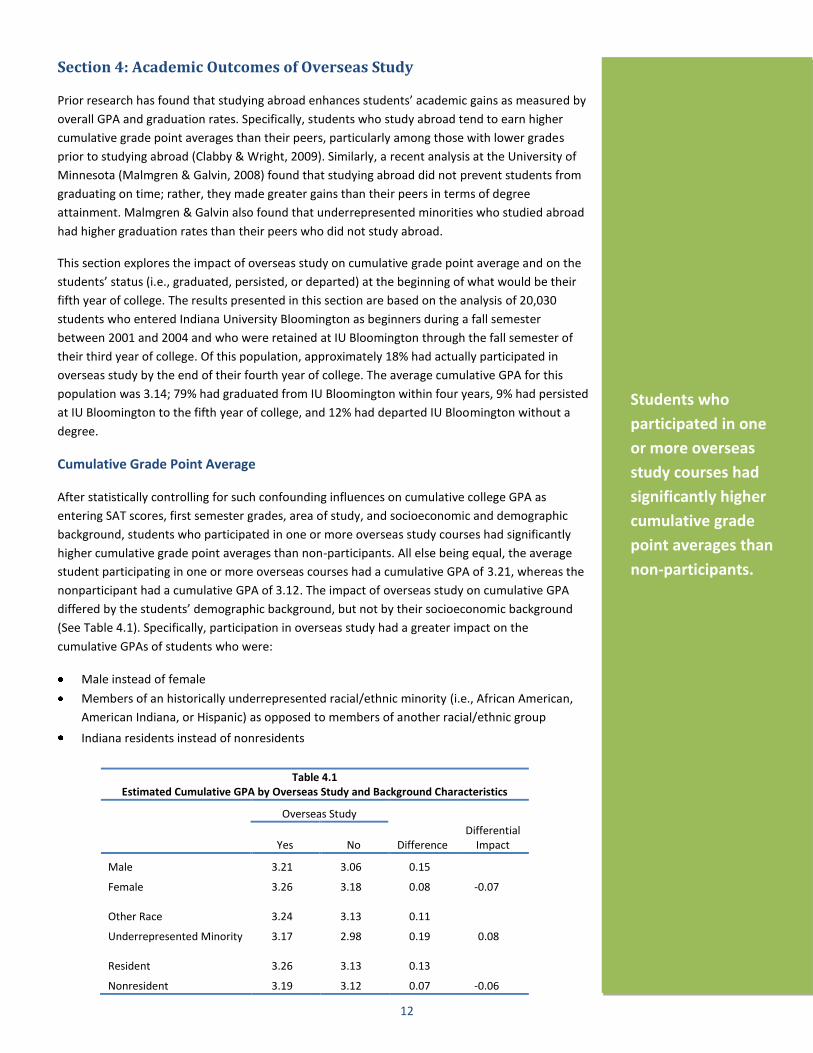
Cumulative Grade Point Average
After statistically controlling for such confounding influences on cumulative college GPA as
entering SAT scores, first semester grades, area of study, and socioeconomic and demographic
background, students who participated in one or more overseas study courses had significantly
higher cumulative grade point averages than non-participants. All else being equal, the average
student participating in one or more overseas courses had a cumulative GPA of 3.21, whereas the
nonparticipant had a cumulative GPA of 3.12. The impact of overseas study on cumulative GPA
differed by the students’ demographic background, but not by their socioeconomic background
(See Table 4.1). Specifically, participation in overseas study had a greater impact on the
cumulative GPAs of students who were:
Male instead of female
Members of an historically underrepresented racial/ethnic minority (i.e., African American,
American Indiana, or Hispanic) as opposed to members of another racial/ethnic group
Indiana residents instead of nonresidents
Students who
participated in one
or more overseas
study courses had
significantly higher
cumulative grade
point averages than
non-participants.
Table 4.1 Estimated Cumulative GPA by Overseas Study and Background Characteristics
Overseas Study
Yes No Difference
Differential Impact
Male 3.21 3.06 0.15
Female 3.26 3.18 0.08 -0.07
Other Race 3.24 3.13 0.11
Underrepresented Minority 3.17 2.98 0.19 0.08
Resident 3.26 3.13 0.13
Nonresident 3.19 3.12 0.07 -0.06
12
Section 4: Academic Outcomes of Overseas Study (continued)
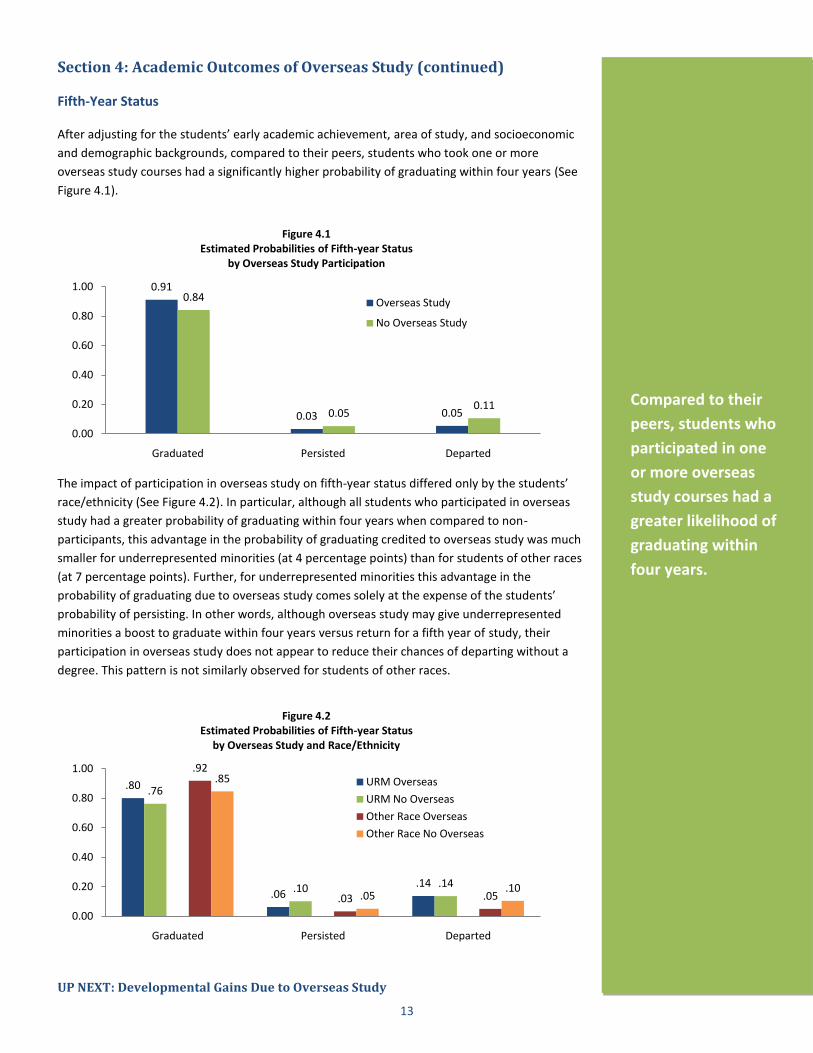
Fifth-Year Status
After adjusting for the students’ early academic achievement, area of study, and socioeconomic
and demographic backgrounds, compared to their peers, students who took one or more
overseas study courses had a significantly higher probability of graduating within four years (See
Figure 4.1).
The impact of participation in overseas study on fifth-year status differed only by the students’
race/ethnicity (See Figure 4.2). In particular, although all students who participated in overseas
study had a greater probability of graduating within four years when compared to non-
participants, this advantage in the probability of graduating credited to overseas study was much
smaller for underrepresented minorities (at 4 percentage points) than for students of other races
(at 7 percentage points). Further, for underrepresented minorities this advantage in the
probability of graduating due to overseas study comes solely at the expense of the students’
probability of persisting. In other words, although overseas study may give underrepresented
minorities a boost to graduate within four years versus return for a fifth year of study, their
participation in overseas study does not appear to reduce their chances of departing without a
degree. This pattern is not similarly observed for students of other races.
UP NEXT: Developmental Gains Due to Overseas Study
0.91
0.03 0.05
0.84
0.050.11
0.00
0.20
0.40
0.60
0.80
1.00
Graduated Persisted Departed
Figure 4.1Estimated Probabilities of Fifth-year Status
by Overseas Study Participation
Overseas Study
No Overseas Study
.80
.06.14
.76
.10 .14
.92
.03 .05
.85
.05.10
0.00
0.20
0.40
0.60
0.80
1.00
Graduated Persisted Departed
Figure 4.2Estimated Probabilities of Fifth-year Status
by Overseas Study and Race/Ethnicity
URM Overseas
URM No Overseas
Other Race Overseas
Other Race No Overseas
Compared to their
peers, students who
participated in one
or more overseas
study courses had a
greater likelihood of
graduating within
four years.
13

Section 5: Developmental Gains Due to Overseas Study
In a recent study of the impacts of study abroad on student engagement during the senior year of
college, Gonyea (2008) found that students who participated in study abroad reported greater
gains in personal and social development than their peers, along with slightly greater gains in their
general education. This section explores the impact of overseas study on students’ self-reported
gains in three developmental areas: personal and social development, general education, and
practical competence. The results presented in this section are based on the analysis of 1,556
students who entered Indiana University Bloomington as beginners during a fall semester
between 2001 and 2004, were retained through the fall semester of the third year of college, and
as seniors were respondents in a spring administrations of the National Survey of Student
Engagement between 2004 and 2008. Of this population, approximately 22% participated in at
least one overseas study course by the end of their fourth year of college.
For all three outcomes of interest—personal and social development, general education, and
practical competence—the difference between participants in overseas study and their
nonparticipant peers was not statistically significant. The models were reestimated without the
covariates to determine if the nonsignificant difference between participants and nonparticipants
was due to the presence of confounding influences in the statistical models. These “total effects”
models also did not yield statistically significant differences in the outcomes among participants
and nonparticipants. There are at least three possible reasons for these nonsignificant findings:
These particular outcomes may not have enough specificity to be unique to overseas study.
For example, the personal and social development of students could be enhanced by any
number of activities within (e.g., team projects) and outside (e.g., community service) the
classroom, and both participants and nonparticipants have similar access to a number of
these experiences.
As students’ assessments of their progress or change over time, self-reported gains are
indirect measures of actual gains. A limitation of this type of measure of change is its absence
of both a start- and an end-value. Although participants and nonparticipants reported rates of
progress that were similar, it might be the case that, both prior to and after the overseas
study experience, participants had higher levels of development than nonparticipants. This
hypothesis, however, cannot be addressed given the limitations of the current data.
As a self-reported assessment of one’s developmental progress, these measures may be
operating as a proxy for the students’ satisfaction with the college experience. In other words,
students who are more satisfied with college may be more inclined to believe (and report)
that they benefited from their experience. If general satisfaction levels are high among all
students, differences in self-reported gains by participation in overseas study may be
negligible.
Students’ reported
gains in general
education, practical
competence, and
personal and social
development did not
differ by overseas
study participation.
14

References
Association of American Colleges and Universities (2007). College learning for the new global century. Report of the National Leadership Council for Liberal Education and America’s Promise. Washington, DC: Author.
Clabby, B.; Wright, N. (2009) Proving that Study Abroad is Worth it - Conclusions from Research on Real Benefits of the Experience. CIBER Short-Term Study Abroad Conference 2009. Provo, UT. Accessed online, April 29, 2009, http://marriottschool.byu.edu/stsa/presentations.cfm.
Gonyea, R. M. (2008, November). The impact of study abroad on senior-year engagement. Paper presented at the annual meeting of the Association for the Study of Higher Education.
Indiana University (2008, March). International Strategic Plan. Bloomington, IN: Author.
Malmgren, J., & Galvin, J. (2008). Effects of study abroad participation on student graduation rates: a study of three incoming freshman cohorts at the University of Minnesota, Twin Cities. NACADA Journal, 28, 29-42
National Survey of Student Engagement (2007). Experiences that matter: Enhancing student learning and success. Annual Report 2007. Bloomington, IN: Author.
Salisbury, M. H., Umbach, P. D., Paulsen, M. B., & Pascarella, E. T. (2009). Going global: Understanding the choice process f the intent to study abroad. Research in Higher Education, 50, 119-143.
15

Appendix 1: Methodology
Sample Selection and Data Sources
The starting population for all analyses in this report was the beginning (or first-time) student cohort at IU Bloomington. Given
the possible introduction of bias in the study results, all students from this population who were designated as “non-resident
alien” were eliminated from the analyses. Final sample size for each set of analyses was determined by the contributing data
sources.
For this study, data collected directly by IU was supplemented by two external data sources: the SAT Score Report, which
captures pre-college information, and the National Survey of Student Engagement (NSSE), which measures engagement during
the first and senior years of college.
Sections 1, 2, and 3 required a measure of the students’ pre-college plans to study abroad. Although the student
questionnaires that accompany the student score reports for both the SAT and ACT have an item asking about pre-college
plans to study abroad, only the item that appears on the SAT student questionnaire is housed in IU’s data warehouse.
Relying only on the SAT Score Report reduced the sample for these three sections to only those students who took the SAT,
which is approximately 75%-81% of the beginning cohorts over the past few academic years.
Sections 2 and 5 relied on the use of NSSE data, which is administered every spring semester to only a random sample of
seniors and first-year students. Given sampling and response rates for NSSE, the use of these data further reduced the
sample size for these sections of the report. In the analysis of first-year students (Section 2), the use of NSSE data reduces
the sample to about 7%-10% of the beginning cohorts, and in the analysis of seniors (Section 5), inclusion of NSSE data
reduces the sample to about 8%-11% of the beginning cohorts who persisted to the third year of college.
Variable Definitions
A number of variables from different sources were introduced into the analyses for this report. All operational definitions of the
study variables and their sources are provided in the following table. Descriptive statistics for these variables are provided in
Appendix 2. Particular definitional issues worth special consideration are mentioned below:
For the purposes of this report, the definitions of persistence and graduation are campus-specific as opposed to university-
wide. In other words, students within a beginning cohort at IU Bloomington who transferred and subsequently received an
IU degree from another IU campus were not counted as having persisted at IU Bloomington or as having graduated from IU
Bloomington. Instead, these intercampus transfers were counted as having departed IU Bloomington without having earned
a degree. Although the definitions used in this report run counter to official reporting practices by the university, defining
persistence and graduation as campus-specific reduces bias in the estimation of the students’ chances of participating in
overseas study (which is largely based at IU-Bloomington) and in the estimation of the impact of overseas study on
persistence and graduation.
In this report, college major was measured at several points in time and by different sources of data. In Section 1 expected
major is measured on the SAT Score Report. In Section 2 college major is measured by IU at time of census during the fall
semester. In Sections 3, 4, and 5, college major is measured by IU at time of census during the fall semester of the students’
third year of college. Given the use of two different sources of college major—the SAT Score Report and IU—both sources
were matched to the Classification of Instructional Program (CIP) codes, and two-digit CIP codes were used to collapse
majors into a reasonable set of broad major categories for analysis.
Indicator variables that measure cohort year were included in all analyses appearing in this report. The purpose of these
cohort year variables within the estimated models is to reduce omitted variable bias by systematically removing the variance
in the outcomes that can be attributed to unknown factors that change over time. These indicator variables are not
discussed in the following table, nor are the parameter estimates and statistical significance levels for these variables
mentioned anywhere in the main body of this report.
16

Appendix 1: Methodology
Definitions and Sources of Study Variables
Female: 1=Female, 0=Male. Source: IU
Underrepresented minority: 1=African American, American Indian, or Hispanic, 0=Other races or ethnicities. Source: IU
Nonresident: 1=Resident of other state, 0=Indiana resident. Source: IU
First generation college student: 1=Neither parent attended college, 0=One or more parents attended college. Source: IU
No FAFSA: 1=Student did not apply for financial aid for the first year of college, 0=Otherwise. Source: IU
No financial need: 1=Student applied for financial aid for the first year of college, but has financial need of $0, 0=Otherwise. Source: IU
Financial need: 1= Student applied for financial aid for the first year of college, and has financial need > $0, 0=Otherwise. Source: IU
SAT composite: Continuous variable representing students’ SAT score or the SAT equivalent of their ACT score. Source: IU
High school GPA: Continuous variable representing students high school GPA or, if missing, the GPA-equivalent of their self-reported grades on the SAT score report. Source: IU, SAT Score Report
First semester college GPA: Continuous variable representing students’ first semester college GPA. Source: IU
High school study abroad: 1=Participated in a study abroad program during high school, 0=Otherwise. Source: SAT Score Report
High school foreign language activity: 1=Participated in a foreign language activity during high school, 0=Otherwise. Source: SAT Score Report
High school cross-cultural activity: 1=Participated in a cross-cultural activity during high school, 0=Otherwise. Source: SAT Score Report
High school student government: 1=Participated in student government during high school, 0=Otherwise. Source: SAT Score Report
High school honor society: 1=Participated in an honor society during high school, 0=Otherwise. Source: SAT Score Report
High school community service: 1=Participated in community service during high school, 0=Otherwise. Source: SAT Score Report
Expected college major: Measured prior to college using SAT score report, recoded to 2-digit CIP code, and clustered by CIP into the following categories: Arts & Humanities major, Business & communications major, Education major, Biological & health sciences major, Personal & social services major, Social sciences major, Physical sciences and mathematics major, Other major, Undecided major, and Did not report major. Source: SAT Score Report
First-semester college major: Measured at fall semester census, recoded to 2-digit CIP code, and clustered by CIP into the following categories: Arts & Humanities major, Business & communications major, Education major, Biological & health sciences major, Personal & social services major, Social sciences major, Physical sciences and mathematics major, Other major, and Undecided major. Source: IU
College major at Year 3: Measured at fall semester census, recoded to 2-digit CIP code, and clustered by CIP into the following categories: Arts & Humanities major, Business & communications major, Education major, Biological & health sciences major, Personal & social services major, Social sciences major, Physical sciences and mathematics major, Other major, and Undecided major. Source: IU
Live on campus: 1=Student lived on campus during first semester of college, 0=Otherwise. Source: IU
17
Appendix 1: Methodology
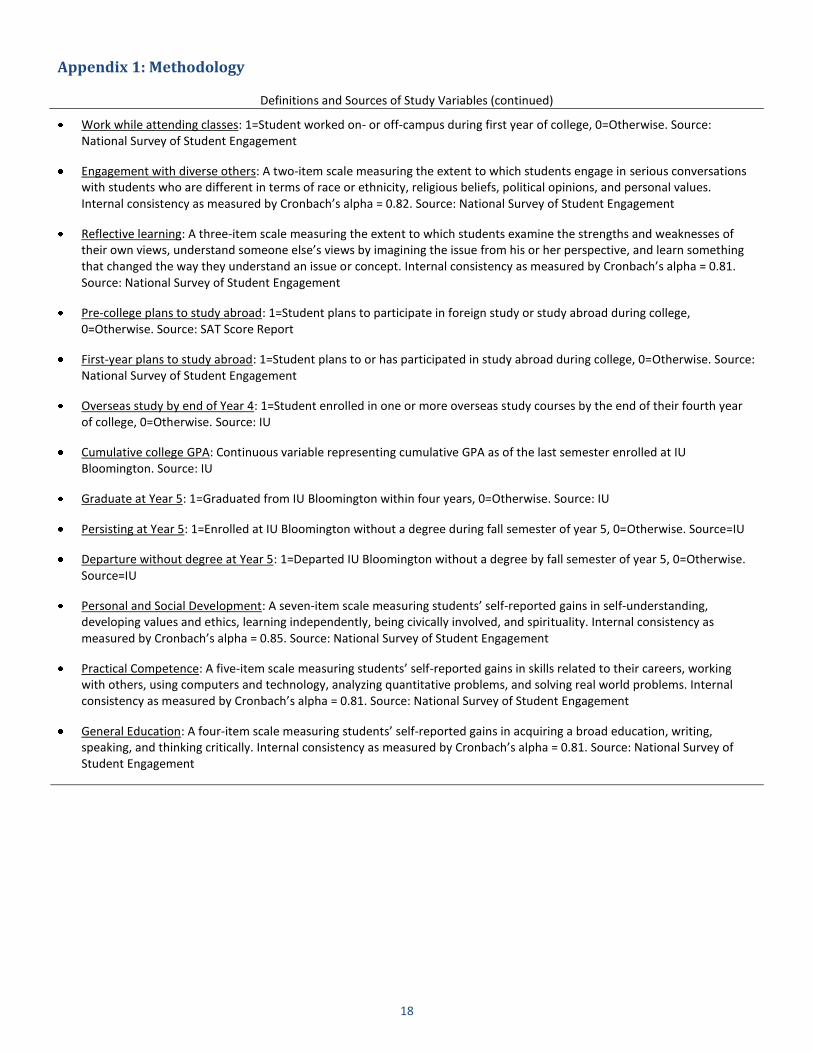
Definitions and Sources of Study Variables (continued)
Work while attending classes: 1=Student worked on- or off-campus during first year of college, 0=Otherwise. Source: National Survey of Student Engagement
Engagement with diverse others: A two-item scale measuring the extent to which students engage in serious conversations with students who are different in terms of race or ethnicity, religious beliefs, political opinions, and personal values. Internal consistency as measured by Cronbach’s alpha = 0.82. Source: National Survey of Student Engagement
Reflective learning: A three-item scale measuring the extent to which students examine the strengths and weaknesses of their own views, understand someone else’s views by imagining the issue from his or her perspective, and learn something that changed the way they understand an issue or concept. Internal consistency as measured by Cronbach’s alpha = 0.81. Source: National Survey of Student Engagement
Pre-college plans to study abroad: 1=Student plans to participate in foreign study or study abroad during college, 0=Otherwise. Source: SAT Score Report
First-year plans to study abroad: 1=Student plans to or has participated in study abroad during college, 0=Otherwise. Source: National Survey of Student Engagement
Overseas study by end of Year 4: 1=Student enrolled in one or more overseas study courses by the end of their fourth year of college, 0=Otherwise. Source: IU
Cumulative college GPA: Continuous variable representing cumulative GPA as of the last semester enrolled at IU Bloomington. Source: IU
Graduate at Year 5: 1=Graduated from IU Bloomington within four years, 0=Otherwise. Source: IU
Persisting at Year 5: 1=Enrolled at IU Bloomington without a degree during fall semester of year 5, 0=Otherwise. Source=IU
Departure without degree at Year 5: 1=Departed IU Bloomington without a degree by fall semester of year 5, 0=Otherwise. Source=IU
Personal and Social Development: A seven-item scale measuring students’ self-reported gains in self-understanding, developing values and ethics, learning independently, being civically involved, and spirituality. Internal consistency as measured by Cronbach’s alpha = 0.85. Source: National Survey of Student Engagement
Practical Competence: A five-item scale measuring students’ self-reported gains in skills related to their careers, working with others, using computers and technology, analyzing quantitative problems, and solving real world problems. Internal consistency as measured by Cronbach’s alpha = 0.81. Source: National Survey of Student Engagement
General Education: A four-item scale measuring students’ self-reported gains in acquiring a broad education, writing, speaking, and thinking critically. Internal consistency as measured by Cronbach’s alpha = 0.81. Source: National Survey of Student Engagement
18

Appendix 1: Methodology
Analytic Approaches
Four statistical methods were employed to produce the findings in this report.
1. A binary logit model was used to predict pre-college plans to study abroad, first-year plans to study abroad, and
participation in overseas study by the end of the fourth year of college. A binary logit model is an appropriate statistical
method when an outcome consists of a decision between two mutually exclusive categories. Both pre-college and first-year
plans to study abroad are defined as a dichotomous outcome where 1=‘Plans to study abroad’ and 0=‘Does not plan to study
abroad.’ Participation in overseas study is defined as a dichotomous outcome where 1=‘Participated in one or more overseas
study courses by the end of year 4’ and 0=‘Did not participate in such a course within four years of study.’ A binary logit
model can be used to compute the impact of the predictors on the students’ estimated chances of planning to or actually
participating in overseas study, and such differences in the students chances are presented as factor changes in odds or as
percentage point changes in probability.
2. A tobit model was used to estimate the impact of overseas study on cumulative GPA. A tobit model is an appropriate
statistical method when a continuous outcome variable is censored at one or more ends of the distribution. Although
students persisting to their third year of college cannot have a GPA of 0, the measure itself is bounded by 0 and 4, providing
both a floor and a ceiling as a measure of academic achievement. As a number of students at IU Bloomington cluster at the
upper end of this GPA distribution, a tobit model takes into account this censoring to provide a better estimate of the impact
of the predictors on academic achievement. As in ordinary least squares regression, the parameter estimates from the tobit
model can be interpreted as factor changes in GPA.
3. A multinomial logit model was used to examine the impact of overseas study on the fifth-year status for students who
persisted to the third year of college. A multinomial logit model is appropriate when the outcome consists of a decision
between three or more mutually exclusive categories. Fift-year status is defined as polytomous outcome where 1=
‘Graduated,’ 2= ‘Persisted,’ and 3= ‘Departed without degree.’ A multinomial logit model can be used to compute the impact
of the predictors on the estimated chances of choosing any of the three outcomes, and such differences in the students
chances are presented as factor changes in odds or as percentage point changes in probability. Across the three outcomes,
estimated probabilities always sum to 1 and percentage point changes always sum to 0.
4. An ordinary least squares model was used to examine the impact of overseas study on the self-reported gains in the
students’ general education, practical competence, and personal and social development. All outcomes were standardized
prior to model estimation so that the parameter estimate for overseas study represents the difference in the outcome in
standard deviation units. This standard-deviation change in the outcome is often interpreted as an effect size.
19
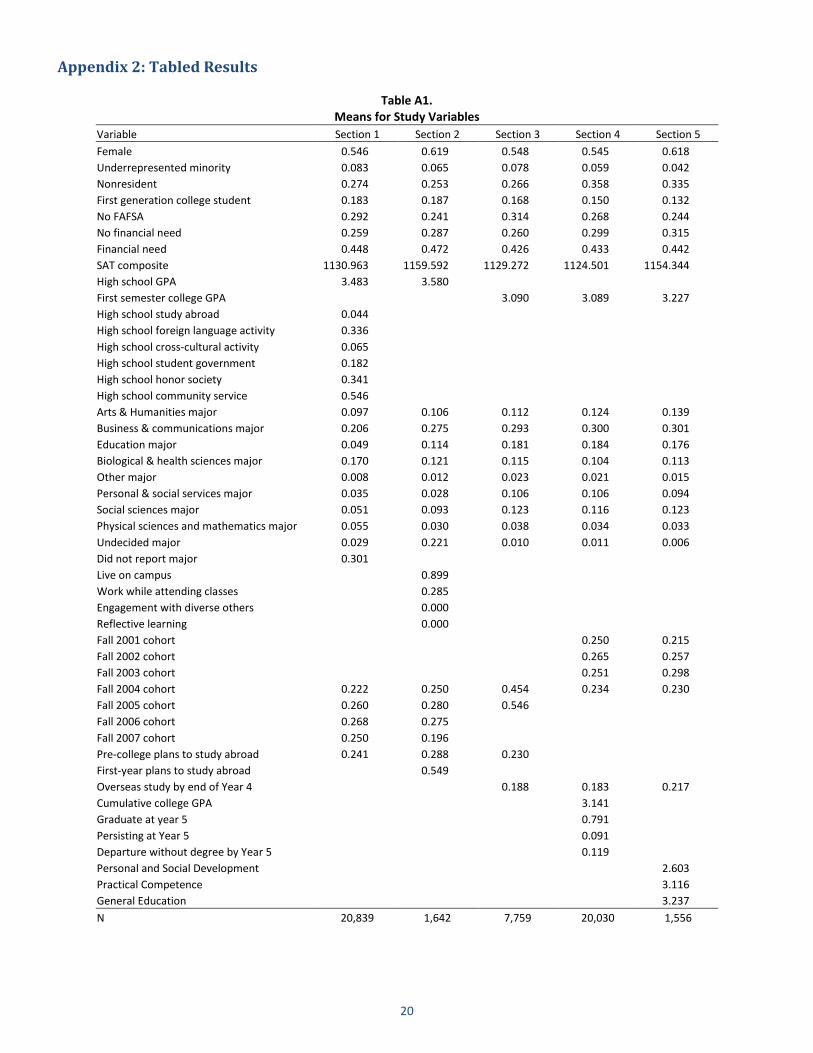
Appendix 2: Tabled Results
Table A1. Means for Study Variables
Variable Section 1 Section 2 Section 3 Section 4 Section 5
Female 0.546 0.619 0.548 0.545 0.618
Underrepresented minority 0.083 0.065 0.078 0.059 0.042
Nonresident 0.274 0.253 0.266 0.358 0.335
First generation college student 0.183 0.187 0.168 0.150 0.132
No FAFSA 0.292 0.241 0.314 0.268 0.244
No financial need 0.259 0.287 0.260 0.299 0.315
Financial need 0.448 0.472 0.426 0.433 0.442
SAT composite 1130.963 1159.592 1129.272 1124.501 1154.344
High school GPA 3.483 3.580 First semester college GPA
3.090 3.089 3.227
High school study abroad 0.044 High school foreign language activity 0.336 High school cross-cultural activity 0.065 High school student government 0.182 High school honor society 0.341 High school community service 0.546 Arts & Humanities major 0.097 0.106 0.112 0.124 0.139
Business & communications major 0.206 0.275 0.293 0.300 0.301
Education major 0.049 0.114 0.181 0.184 0.176
Biological & health sciences major 0.170 0.121 0.115 0.104 0.113
Other major 0.008 0.012 0.023 0.021 0.015
Personal & social services major 0.035 0.028 0.106 0.106 0.094
Social sciences major 0.051 0.093 0.123 0.116 0.123
Physical sciences and mathematics major 0.055 0.030 0.038 0.034 0.033
Undecided major 0.029 0.221 0.010 0.011 0.006
Did not report major 0.301 Live on campus
0.899
Work while attending classes
0.285 Engagement with diverse others
0.000
Reflective learning
0.000 Fall 2001 cohort
0.250 0.215
Fall 2002 cohort
0.265 0.257
Fall 2003 cohort
0.251 0.298
Fall 2004 cohort 0.222 0.250 0.454 0.234 0.230
Fall 2005 cohort 0.260 0.280 0.546 Fall 2006 cohort 0.268 0.275
Fall 2007 cohort 0.250 0.196 Pre-college plans to study abroad 0.241 0.288 0.230
First-year plans to study abroad
0.549 Overseas study by end of Year 4
0.188 0.183 0.217
Cumulative college GPA
3.141 Graduate at year 5
0.791
Persisting at Year 5
0.091 Departure without degree by Year 5
0.119
Personal and Social Development
2.603
Practical Competence
3.116
General Education
3.237
N 20,839 1,642 7,759 20,030 1,556
20

Appendix 2: Tabled Results
Table A2. Results of Logistic Regression Predicting Pre-college Plans to Study Abroad
Predictor B S.E. Sig. Odds Ratio
Female 0.721 0.039 0.000 2.057
Underrepresented minority 0.221 0.070 0.002 1.247
Nonresident 0.177 0.042 0.000 1.193
First generation college student -0.114 0.052 0.030 0.893
No FAFSA 0.052 0.046 0.253 1.054
No financial need -0.011 0.045 0.798 0.989
SAT composite 0.003 0.000 0.000 1.003
High school GPA 0.104 0.058 0.073 1.110
High school study abroad 1.360 0.076 0.000 3.897
High school foreign language activity 0.650 0.037 0.000 1.915
High school cross-cultural activity 0.438 0.065 0.000 1.550
High school student government 0.266 0.043 0.000 1.304
High school honor society 0.075 0.042 0.070 1.078
High school community service 0.431 0.039 0.000 1.538
Biological & health sciences major -0.577 0.067 0.000 0.561
Business & communications major -0.308 0.064 0.000 0.735
Education major -0.599 0.097 0.000 0.549
Personal & social services major -0.363 0.104 0.001 0.695
Physical sciences and mathematics major -0.568 0.096 0.000 0.567
Social sciences major -0.018 0.087 0.836 0.982
Other major -0.319 0.193 0.099 0.727
Undecided major -0.466 0.116 0.000 0.628
Did not report major -0.713 0.062 0.000 0.490
Fall 2004 cohort -0.386 0.053 0.000 0.680
Fall 2005 cohort -0.169 0.050 0.001 0.845
Fall 2006 cohort -0.067 0.048 0.167 0.935
Intercept -5.601 0.217 N = 20,839
21

Appendix 2: Tabled Results
Table A3. Results of Logistic Regression Predicting First-Year Plans to Study Abroad
Predictor B S.E. Sig. Odds Ratio
Female 0.368 0.122 0.002 1.445
Underrepresented minority 0.585 0.234 0.012 1.794
Nonresident 0.656 0.139 0.000 1.927
First generation college student 0.124 0.149 0.404 1.132
No FAFSA 0.813 0.149 0.000 2.255
No financial need 0.503 0.133 0.000 1.653
SAT composite 0.002 0.000 0.000 1.002
High school GPA 0.153 0.181 0.398 1.165
Pre-college plans to study abroad 1.121 0.133 0.000 3.067
Biological & health sciences major -0.287 0.235 0.223 0.751
Business & communications major 0.361 0.203 0.075 1.435
Education major -0.366 0.239 0.127 0.694
Personal & social services major 0.256 0.364 0.482 1.292
Physical sciences and mathematics major -0.575 0.360 0.110 0.563
Social sciences major 0.283 0.251 0.258 1.327
Other major 0.564 0.565 0.318 1.758
Undecided major 0.153 0.208 0.462 1.166
Live on campus -0.056 0.187 0.764 0.945
Work while attending classes 0.015 0.126 0.903 1.015
Engagement with diverse others 0.128 0.063 0.042 1.136
Reflective thinking 0.192 0.063 0.002 1.212
Fall 2004 cohort 0.032 0.169 0.852 1.032
Fall 2005 cohort -0.143 0.164 0.385 0.867
Fall 2006 cohort 0.109 0.164 0.504 1.115
Intercept -3.371 0.697 N = 1,642
22

Appendix 2: Tabled Results
Table A4. Results of Logistic Regression Predicting Overseas Study Participation by End of Year 4
Predictor B S.E. Sig. Odds Ratio
Female 0.639 0.070 0.000 1.895
Underrepresented minority -0.025 0.149 0.867 0.975
Nonresident 0.777 0.070 0.000 2.175
First generation college student -0.384 0.115 0.001 0.681
No FAFSA 0.537 0.080 0.000 1.710
No financial need 0.146 0.085 0.087 1.157
SAT composite 0.001 0.000 0.000 1.001
Pre-college plans to study abroad 0.807 0.070 0.000 2.241
First semester college GPA 0.758 0.068 0.000 2.133
Biological & health sciences major -0.636 0.135 0.000 0.530
Business & communications major 0.186 0.099 0.062 1.204
Education major -1.341 0.144 0.000 0.261
Personal & social services major -0.466 0.150 0.002 0.628
Physical sciences and mathematics major -0.630 0.219 0.004 0.533
Social sciences major 0.169 0.116 0.146 1.184
Other major -0.151 0.216 0.483 0.860
Undecided major -0.904 0.487 0.063 0.405
Fall 2004 cohort -0.147 0.065 0.024 0.864
Intercept -5.903 0.333 N = 7,759
23

Appendix 2: Tabled Results
Table A5. Results of Tobit Regression Predicting Cumulative GPA
Model 1: General effects Model 2: Conditional effects
Predictor B S.E. Sig. B S.E. Sig.
Female 0.100 0.005 0.000 0.111 0.006 0.000
Underrepresented minority -0.151 0.011 0.000 -0.159 0.011 0.000
Nonresident -0.018 0.006 0.001 -0.003 0.006 0.668
First generation college student -0.034 0.007 0.000 -0.032 0.008 0.000
No FAFSA -0.001 0.007 0.936 0.004 0.007 0.538
No financial need 0.004 0.006 0.494 0.007 0.007 0.325
SAT composite 0.001 0.000 0.000 0.001 0.000 0.000
First semester college GPA 0.492 0.004 0.000 0.490 0.004 0.000
Biological & health sciences major -0.012 0.011 0.241 -0.012 0.011 0.265
Business & communications major -0.035 0.008 0.000 -0.034 0.008 0.000
Education major 0.067 0.009 0.000 0.067 0.009 0.000
Personal & social services major 0.015 0.011 0.152 0.016 0.011 0.125
Physical sciences and mathematics major -0.051 0.015 0.001 -0.047 0.015 0.002
Social sciences major -0.001 0.010 0.951 -0.001 0.010 0.952
Other major -0.069 0.019 0.000 -0.067 0.019 0.000
Undecided major -0.153 0.024 0.000 -0.152 0.024 0.000
Fall 2001 cohort 0.049 0.007 0.000 0.050 0.007 0.000
Fall 2002 cohort 0.027 0.007 0.000 0.028 0.007 0.000
Fall 2003 cohort -0.005 0.007 0.519 -0.004 0.007 0.598
Overseas study by end of year 4 0.091 0.007 0.000 0.178 0.016 0.000
Female x Overseas study -0.060 0.013 0.000
Underrep. minority x Overseas study 0.088 0.038 0.020
Nonresident x Overseas study -0.068 0.013 0.000
First generation x Overseas study -0.004 0.027 0.876
No FAFSA x Overseas study -0.030 0.016 0.064
No need x Overseas study -0.020 0.016 0.220
Intercept 0.954 0.025 0.957 0.025
N = 20,030
24

Appendix 2: Tabled Results
Table A6a. Results of Multinomial Logistic Regression Predicting Year 5 Status: General effects
Departure vs. Graduation Persistence vs. Graduation
Predictor B S.E. Sig. Odds Ratio B S.E. Sig.
Odds Ratio
Female -0.129 0.051 0.011 0.879 -0.620 0.059 0.000 0.538
Underrepresented minority 0.417 0.090 0.000 1.517 0.804 0.097 0.000 2.233
Nonresident -0.200 0.056 0.000 0.819 -0.637 0.069 0.000 0.529
First generation college student 0.289 0.065 0.000 1.335 0.258 0.075 0.001 1.295
No FAFSA -0.231 0.064 0.000 0.794 -0.163 0.075 0.029 0.849
No financial need -0.219 0.060 0.000 0.804 -0.240 0.070 0.001 0.786
SAT composite -0.001 0.000 0.004 0.999 -0.001 0.000 0.009 0.999
First semester college GPA -1.155 0.039 0.000 0.315 -1.088 0.046 0.000 0.337
Biological & health sciences major 0.171 0.094 0.070 1.186 0.005 0.113 0.963 1.005
Business & communications major -0.624 0.083 0.000 0.536 -0.654 0.098 0.000 0.520
Education major -0.517 0.088 0.000 0.596 -0.159 0.100 0.112 0.853
Personal & social services major -0.495 0.096 0.000 0.610 -0.728 0.117 0.000 0.483
Physical sciences & math major 0.087 0.134 0.516 1.091 -0.190 0.161 0.239 0.827
Social sciences major -0.295 0.095 0.002 0.745 -0.461 0.115 0.000 0.631
Other major -0.390 0.176 0.027 0.677 -0.386 0.222 0.082 0.680
Undecided major 0.894 0.180 0.000 2.445 0.814 0.216 0.000 2.257
Fall 2001 cohort -1.750 0.069 0.000 0.174 -3.210 0.103 0.000 0.040
Fall 2002 cohort -1.643 0.067 0.000 0.193 -2.688 0.086 0.000 0.068
Fall 2003 cohort -1.386 0.066 0.000 0.250 -1.885 0.072 0.000 0.152
Overseas study by end of year 4 -0.750 0.087 0.000 0.472 -0.532 0.096 0.000 0.587
Intercept 3.864 0.238 4.183 0.276
N = 20,030
25

Appendix 2: Tabled Results
Table A6b. Results of Multinomial Logistic Regression Predicting Year 5 Status: Conditional effects
Departure vs. Graduation Persistence vs. Graduation
Predictor B S.E. Sig. Odds Ratio B S.E. Sig.
Odds Ratio
Female -0.141 0.053 0.007 0.868 -0.645 0.062 0.000 0.525
Underrepresented minority 0.374 0.093 0.000 1.454 0.793 0.100 0.000 2.210
Nonresident -0.202 0.060 0.001 0.817 -0.587 0.073 0.000 0.556
First generation college student 0.295 0.066 0.000 1.343 0.264 0.078 0.001 1.302
No FAFSA -0.232 0.067 0.001 0.793 -0.144 0.079 0.068 0.866
No financial need -0.232 0.062 0.000 0.793 -0.240 0.074 0.001 0.787
SAT composite -0.001 0.000 0.004 0.999 -0.001 0.000 0.005 0.999
First semester college GPA -1.155 0.039 0.000 0.315 -1.088 0.046 0.000 0.337
Biological & health sciences major 0.175 0.094 0.063 1.191 0.020 0.113 0.859 1.020
Business & communications major -0.622 0.083 0.000 0.537 -0.642 0.098 0.000 0.526
Education major -0.516 0.088 0.000 0.597 -0.147 0.100 0.141 0.863
Personal & social services major -0.496 0.096 0.000 0.609 -0.722 0.117 0.000 0.486
Physical sciences & math major 0.088 0.134 0.514 1.092 -0.176 0.162 0.277 0.839
Social sciences major -0.293 0.095 0.002 0.746 -0.452 0.115 0.000 0.636
Other major -0.393 0.176 0.025 0.675 -0.375 0.223 0.092 0.687
Undecided major 0.894 0.181 0.000 2.446 0.821 0.216 0.000 2.272
Fall 2001 cohort -1.751 0.069 0.000 0.174 -3.206 0.103 0.000 0.041
Fall 2002 cohort -1.644 0.067 0.000 0.193 -2.685 0.086 0.000 0.068
Fall 2003 cohort -1.388 0.066 0.000 0.249 -1.883 0.072 0.000 0.152
Overseas study by end of year 4 -0.934 0.206 0.000 0.393 -0.447 0.202 0.027 0.640
Female x Overseas study 0.102 0.175 0.560 1.108 0.239 0.189 0.205 1.270
Underrep. Min. x Overseas study 0.779 0.354 0.027 2.180 -0.011 0.407 0.978 0.989
Nonresident x Overseas study 0.079 0.175 0.652 1.082 -0.375 0.199 0.059 0.687
First generation x Overseas study -0.134 0.329 0.683 0.874 0.008 0.322 0.980 1.008
No FAFSA x Overseas study 0.033 0.209 0.876 1.033 -0.221 0.236 0.350 0.802
No need x Overseas study 0.144 0.205 0.482 1.155 -0.054 0.226 0.811 0.947
Intercept 3.887 0.238 4.211 0.276
N = 20,030
26
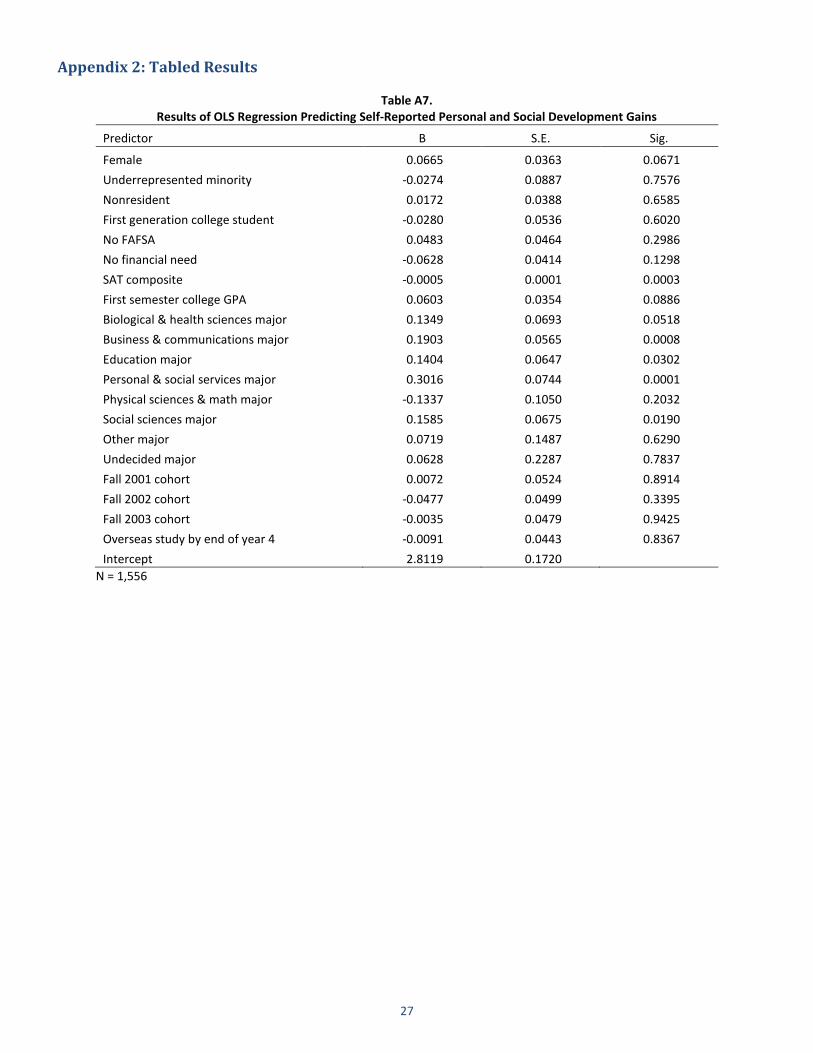
Appendix 2: Tabled Results
Table A7. Results of OLS Regression Predicting Self-Reported Personal and Social Development Gains
Predictor B S.E. Sig.
Female 0.0665 0.0363 0.0671
Underrepresented minority -0.0274 0.0887 0.7576
Nonresident 0.0172 0.0388 0.6585
First generation college student -0.0280 0.0536 0.6020
No FAFSA 0.0483 0.0464 0.2986
No financial need -0.0628 0.0414 0.1298
SAT composite -0.0005 0.0001 0.0003
First semester college GPA 0.0603 0.0354 0.0886
Biological & health sciences major 0.1349 0.0693 0.0518
Business & communications major 0.1903 0.0565 0.0008
Education major 0.1404 0.0647 0.0302
Personal & social services major 0.3016 0.0744 0.0001
Physical sciences & math major -0.1337 0.1050 0.2032
Social sciences major 0.1585 0.0675 0.0190
Other major 0.0719 0.1487 0.6290
Undecided major 0.0628 0.2287 0.7837
Fall 2001 cohort 0.0072 0.0524 0.8914
Fall 2002 cohort -0.0477 0.0499 0.3395
Fall 2003 cohort -0.0035 0.0479 0.9425
Overseas study by end of year 4 -0.0091 0.0443 0.8367
Intercept 2.8119 0.1720
N = 1,556
27
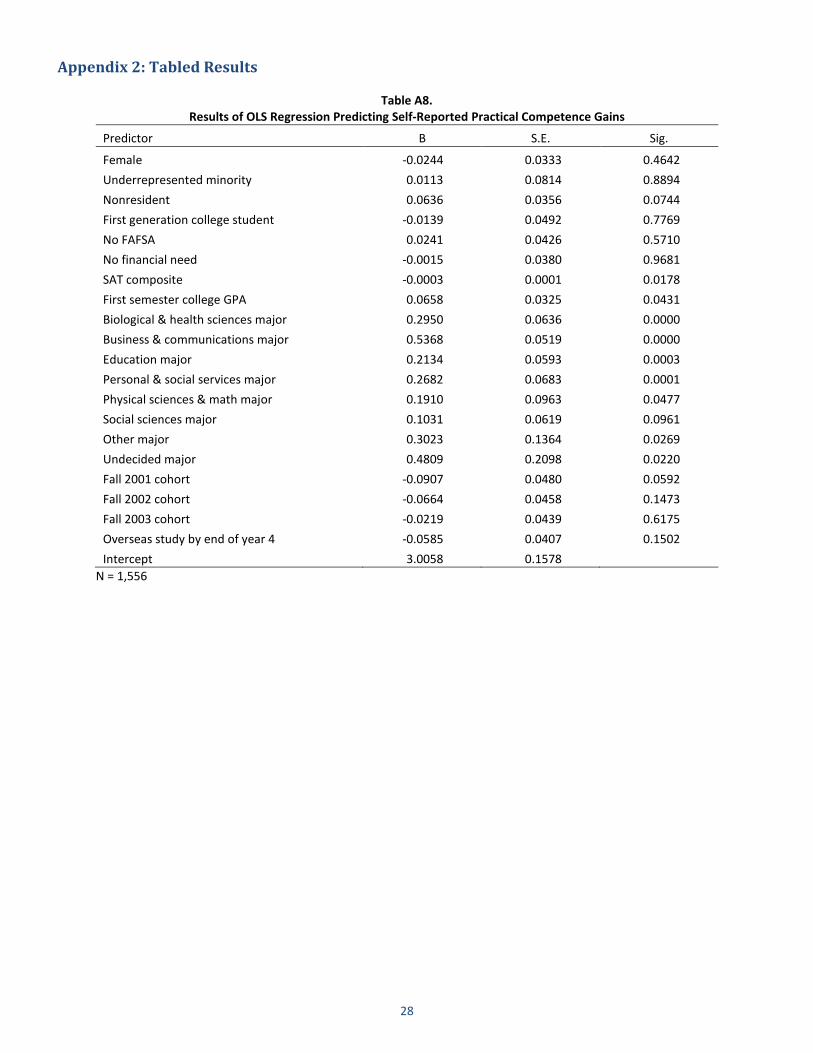
Appendix 2: Tabled Results
Table A8. Results of OLS Regression Predicting Self-Reported Practical Competence Gains
Predictor B S.E. Sig.
Female -0.0244 0.0333 0.4642
Underrepresented minority 0.0113 0.0814 0.8894
Nonresident 0.0636 0.0356 0.0744
First generation college student -0.0139 0.0492 0.7769
No FAFSA 0.0241 0.0426 0.5710
No financial need -0.0015 0.0380 0.9681
SAT composite -0.0003 0.0001 0.0178
First semester college GPA 0.0658 0.0325 0.0431
Biological & health sciences major 0.2950 0.0636 0.0000
Business & communications major 0.5368 0.0519 0.0000
Education major 0.2134 0.0593 0.0003
Personal & social services major 0.2682 0.0683 0.0001
Physical sciences & math major 0.1910 0.0963 0.0477
Social sciences major 0.1031 0.0619 0.0961
Other major 0.3023 0.1364 0.0269
Undecided major 0.4809 0.2098 0.0220
Fall 2001 cohort -0.0907 0.0480 0.0592
Fall 2002 cohort -0.0664 0.0458 0.1473
Fall 2003 cohort -0.0219 0.0439 0.6175
Overseas study by end of year 4 -0.0585 0.0407 0.1502
Intercept 3.0058 0.1578
N = 1,556
28

Appendix 2: Tabled Results
Table A9. Results of OLS Regression Predicting Self-Reported General Education Gains
Predictor B S.E. Sig.
Female 0.0296 0.0343 0.3890
Underrepresented minority -0.0036 0.0839 0.9654
Nonresident -0.0020 0.0367 0.9564
First generation college student 0.0038 0.0507 0.9400
No FAFSA 0.0516 0.0439 0.2399
No financial need -0.0122 0.0392 0.7548
SAT composite -0.0003 0.0001 0.0085
First semester college GPA 0.0629 0.0335 0.0607
Biological & health sciences major 0.0826 0.0656 0.2080
Business & communications major 0.2478 0.0535 0.0000
Education major -0.0006 0.0612 0.9918
Personal & social services major 0.1288 0.0704 0.0675
Physical sciences & math major -0.1278 0.0993 0.1984
Social sciences major 0.1970 0.0638 0.0021
Other major -0.0005 0.1406 0.9974
Undecided major 0.5199 0.2163 0.0163
Fall 2001 cohort -0.0725 0.0495 0.1431
Fall 2002 cohort -0.0827 0.0472 0.0800
Fall 2003 cohort -0.0713 0.0453 0.1156
Overseas study by end of year 4 -0.0024 0.0419 0.9535
Intercept 3.3365 0.1626
N = 1,556
29