Outlook for the Mexican Economy Octubre, 2011. Index I.External Conditions II.Macroeconomic...
33
Outlook for the Mexican Economy Octubre, 2011
-
Upload
kenneth-alexander -
Category
Documents
-
view
213 -
download
0
Transcript of Outlook for the Mexican Economy Octubre, 2011. Index I.External Conditions II.Macroeconomic...

Outlook for the Mexican Economy
Octubre, 2011

Index
I. External Conditions
II. Macroeconomic Environment
III. Mexican Competitiveness

I. External Conditions
80
90
100
110
120
130
140
150
160
170
World Advanced Emerging
Industrial Production
Index Jan-2005 = 100*
-1.0
-0.5
0.0
0.5
1.0
1.5
2.0
2.5
3.0
3.5
4.0
Euro zone Japan U.S.
Real Gross Domestic Product Forecasts for 2011 and 2012 (a)
Percent
*Seasonally adjusted.
Source: CPB Netherlands.
(a) Solid lines refer to the forecast of 2011 and dotted lines correspond to 2012.
Source: Blue Chip.3

Forecast
Forecast
I. External Conditions20
06
2007
2008
2009
2010
2011
2012
2013
2014
2015
-20
-15
-10
-5
0
5
10Brazil ChileU.S. SpainGreece MexicoPortugal Czech Rep.Poland
General Government Balance
Percent of GDP
2006
2007
2008
2009
2010
2011
2012
2013
2014
2015
0
20
40
60
80
100
120
140
160
180
200
220
240Brazil ChileU.S. SpainGreece MexicoPortugal Czech Rep.Poland
Gross Public Debt
Percent of GDP
Source: Fiscal Monitor (IMF) and Mexico’s Ministry of Finance (SHCP).
Source: Fiscal Monitor (IMF) and Mexico’s Ministry of Finance (SHCP).
4

Index
I. External Conditions
II. Macroeconomic Environment
III. Mexican Competitiveness

103
108
113
118
123
128
133Total Industrial production Services
Economic Activity Indicators (a)
Index 2003 = 100*
70
80
90
100
110
120
130
140
150
160
170 Total U.S. Others
Manufacturing Exports
by Destination
Index 2007 = 100*
*Seasonally adjusted.
(a) Industrial production data up to August, 2011. Total and Services data up to July, 2011.
Source: INEGI.
*Seasonally adjusted.
Source: Banco de México.
II. Macroeconomic Environment in Mexico
6

85
87
89
91
93
95
97
99
101
103
105Wholesale
Commercial Establishments’ Sales
Index 2008 = 100*
90
100
110
120
130
140
150Total Construction Machinery and equipment
Gross Fixed Investment and Components
Index 2005 = 100*
*Seasonally adjusted.
Source: INEGI.
*Seasonally adjusted.
Source: INEGI.
7
II. Macroeconomic Environment in Mexico

13.4
13.6
13.8
14.0
14.2
14.4
14.6
14.8
15.0
15.2
15.4
15.6 OriginalSeasonally adjusted
3.0
3.5
4.0
4.5
5.0
5.5
6.0
6.5
7.0
7.5 National Urban
I 200
6
IV 2
006
III 20
07
II 200
8
I 200
9
IV 2
009
III 20
10
II 201
1-2
0
2
4
6
8
10
IMSS-insured Workers (a)
Million workers
Unemployment Rate Percent*
Nominal Average Income per Person Employed (a)
Annual change in percent
(a) Permanent and temporary workers in urban areas. Source: IMSS and seasonally adjusted by Banco de México.
*Seasonally adjusted.
Source: INEGI.
(a) Data for 2011 are preliminary and are based on population projections from INEGI.
Source: Calculated by Banco de México with information from ENOE, INEGI.
8
II. Macroeconomic Environment in Mexico

3.0
3.3
3.6
3.9
4.2
4.5
End 2011: Headline End 2011: Core
End 2012: Headline End 2012: Core
Headline and Core Inflation Expectations
Annual Percent
1.0
1.5
2.0
2.5
3.0
3.5
4.0
4.5
5.0
End 2011 End 2012End 2013 Next 4 yearsNext 5-8 years Inflation targetVariability interval
Headline Inflation Expectations for Different Time Horizons
Annual Percent
Source: Banco de México’s survey. Source: Banco de México’s survey.
9
II. Macroeconomic Environment in Mexico

Jan-
07
Jul-0
7
Jan-
08
Jul-0
8
Jan-
09
Jul-0
9
Jan-
10
Jul-1
0
Jan-
11
Jul-1
19
10
11
12
13
14
15
16
Nominal Exchange Rate
Pesos per dollar
200,000
250,000
300,000
350,000
400,000
450,000
500,000
550,000
600,000
650,000
700,000
0
50,000
100,000
150,000
200,000
250,000
300,000
350,000Bonds CETES
Government Securities Holdings of Foreign Investors
Billions of pesos
Source: Banco de México. Source: Banco de México.
10
II. Macroeconomic Environment in Mexico

Index
I. External Conditions
II. Macroeconomic Environment
III. Mexican Competitiveness

Mexico has a number of comparative advantages that position it as an attractive investment destination:
Excellent location
Market size
Openness
Strong institutions
Competitive infrastructure
Increasingly qualified labor force
Stable macroeconomic environment
III. Competitiveness in Mexico
12

Philip
pine
s
Mex
ico
Mal
aysia
Brazil
Hunga
ry
Turke
y
Argen
tina
Singa
pore
Portu
gal
Taiwan
Hong
Kong
Chile
Thaila
nd
Korea
Polan
d
Indo
nesia
-4
-2
0
2
4
6
8
10
12
Global Competitiveness IndexChange in Ranking Position from 2010 to 2011*
* A positive change represents a better position in the ranking.
Source: World Economic Forum, Global Competitiveness Report 2010-2011, 2011-2012.
III. Competitiveness in Mexico
13

Singa
pore
Hong
Kong
Taiwan
Mal
aysia
Korea
Chile
Thaila
nd
Polan
d
Portu
gal
Indo
nesia
Hunga
ry
Brazil
Mex
ico
Turke
y
Philip
pine
s
Argen
tina
0
10
20
30
40
50
60
70
80
90
100
2010
2011
Global Competitiveness IndexRanking (a)
(a) Rank among 142 countries for 2011 and 139 countries for 2010. A lower value in the rank implies a better position in the ranking. Source: World Economic Forum, Global Competitiveness Report 2010-2011.
III. Competitiveness in Mexico
14

Competitiveness Indicators: Market SizeScore according to World Economic Forum
Source: World Economic Forum, Global Competitiveness Report 2011-2012. Note: Countries are ranked by the WEF according to their score among the 139 evaluated countries. Macroeconomic environment and market size are the two competitiveness pillars (out of 12) in which Mexico performed best. Countries selected in these graphs are those of Mexico's basket of competitors which are Hungary, Thailand, Philippines, South Korea, Turkey, Poland, Portugal, Malaysia, Hong Kong, Taiwan, Indonesia and Singapore. These are the countries with the highest Spearman correlation coefficient of revealed comparative advantage, after dropping China, as calculated in Chiquiar, Fragoso and Ramos-Francia (2007). For comparisson with Latin American countries, Brazil, Chile and Colombia were also included.
III. Competitiveness in Mexico
15
Hunga
ryChi
le
Portu
gal
Singa
pore
Philip
pine
s
Mal
aysia
Hong
Kong
Argen
tina
Thaila
nd
Polan
d
Turke
y
Taiwan
Indo
nesia
Mex
ico
South
Kor
ea
Brasil
China
0
1
2
3
4
5
6
7
8

Free Trade Agreements: *
Mexico is a gateway to more than a billion consumers and 60 percent of world GDP.
Mexico has 11 free trade agreements with 43 countries.
It has 6 Economic Complementation Agreements (ACEs, for its acronym in Spanish), it has signed Promotion and Reciprocal Protection of Investments Agreements (to provide legal protection to productive investments) with 25 countries.
It has Agreements to Avoid Double Taxation with more than 31 countries.
III. Competitiveness in Mexico
16Source: ProMéxico.

III. Competitiveness in Mexico
(a) Since November 19, 2006 only Mexico and Colombia participate in the G3 Free Trade Agreement.
(b) Agreement between Japan and the United Mexican States for the strengthening of the economic partnership. Source: ProMéxico.
Free Trade Agreements
ALADIMercosur(Marco
Agreement)
ALADICuba
ALADIEcuador
ALADIPanama
ALADIParaguay
ALADIPeru
ALADIBrasil
FTA EFTAIceland
LiechtensteinNorway
Switzerland
FTAChile
FTANicaragua
ALADIUruguay
ALADIArgentina
FTAIsrael
FTAEU
AAE
Japan (b)FTA
Uruguay
ALADIMercosur
(Automotive)
FTA NTGuatemalaHonduras
El Salvador
20041999 2000 2001 2002 2005
NAFTAEUA
Canada
WTO
FTACosta Rica
FTA G3
Colombia (a)
199819951994
OECDMexico's entry into
GATT
1986
ALADIChile
1992
APEC
1993
17

Clusters and Technology Centers
The large size of the country contributes to various cities functioning as service providers, which benefits Mexico in comparison with other countries that depend on labor force concentrated in one city.
III. Competitiveness in Mexico
18
Puebla:Automobile industry
Monterrey-Saltillo:Automobile industry
Queretaro:Aeronautics
Baja California:Tourism
Jalisco: Information Technology
Quintana Roo:Tourism
Mexico: AutomobilesAnd others

Chile
Mex
ico
Hunga
ry
Polan
d
Mal
aysia
Portu
gal
Taiwan
Singa
pore
Hong
Kong
Korea
China
Argen
tina
Philip
pine
s
Thaila
nd
Brazil
Turke
y
Indo
nesia
-8
-6
-4
-2
0
2
4
6
8
10
12
Ease of Doing BusinessChange in Ranking Position from 2010 to 2011
Source: Doing Business 2011 IFC.
III. Competitiveness in Mexico
19

2004
2005
2006
2007
2008
2009
2010
2011
5
6
7
8
9
10
9 9 9
8 8
9
8
6
Mexico
Nicaragua
Panama
Peru
Paraguay
Chile
Dominican Republic
El Salvador
Colombia
Uruguay
Costa Rica
Guatemala
Ecuador
Honduras
Argentina
Bolivia
Brazil
Venezuela
6
6
6
6
7
8
8
8
9
11
12
12
13
13
14
15
15
17
Hong Kong
Singapore
Hungary
Mexico
Portugal
Turkey
Taiwan
Poland
Thailand
South Korea
Malaysia
Indonesia
Philippines
3
3
4
6
6
6
6
6
7
8
9
9
15
Mexico
Number of procedures
Latin American Countries,
2011
Number of procedures
Main Competitors of Mexico in International Markets,
2011
Number of procedures
III. Competitiveness in Mexico: Procedures Required to Register a Firm
Note: A procedure is defined as any interaction of the company founders with external parties (for example, government agencies, lawyers, auditors or notaries).Countries selected are those of Mexico's basket of competitors which are Hungary, Thailand, Philippines, South Korea, Turkey, Poland, Portugal, Malaysia, Hong Kong, Taiwan, Indonesia and Singapore. These are the countries with the highest Spearman correlation coefficient of revealed comparative advantage, after dropping China, as calculated in Chiquiar, Fragoso and Ramos-Francia (2007). The observations for 2011 come from the Global Competitiveness Report 2010-2011, and they correspond to June 2010. Source: World Bank. Doing Business 2011. 20

2004
2005
2006
2007
2008
2009
2010
2011
0
10
20
30
40
50
60
70
58 58 58
27 27 28
13
9
Mexico
Panama
Colombia
Honduras
El Salvador
Dominican Republic
Chile
Argentina
Peru
Paraguay
Guatemala
Nicaragua
Bolivia
Ecuador
Costa Rica
Uruguay
Brazil
Venezuela
9
9
14
14
17
19
22
26
27
35
37
39
50
56
60
65
120
141
Singapore
Hungary
Portugal
Turkey
Hong Kong
Mexico
South Korea
Taiwan
Malaysia
Poland
Thailand
Philippines
Indonesia
3
4
6
6
6
9
14
15
17
32
32
38
47
Mexico
Total number of days
Latin American Countries, 2011
Total number of days
Main Competitors of Mexico in International Markets,
2011
Total number of days
III. Competitiveness in Mexico: Days Required to Register a Firm
Note: The measure captures the median duration that incorporation lawyers indicate is necessary to complete a procedure with minimum follow-up with government agencies and no extra payments.Countries selected are those of Mexico's basket of competitors which are Hungary, Thailand, Philippines, South Korea, Turkey, Poland, Portugal, Malaysia, Hong Kong, Taiwan, Indonesia and Singapore. These are the countries with the highest Spearman correlation coefficient of revealed comparative advantage, after dropping China, as calculated in Chiquiar, Fragoso and Ramos-Francia (2007). The observations for 2011 come from the Global Competitiveness Report 2010-2011, and they correspond to June 2010. Source: World Bank. Doing Business 2011. 21

Competitive Infrastructure:
63 International Airports.
16 deep-sea ports.
15,000 miles of railways and 84,000 miles of paved roads, with more than 30,000 miles of federal highways.
Mexico increased its spending in infrastructure from an average of 3% (2001 – 2006) to 5% of its GDP with the National Infrastructure Program 2007-2012.
III. Competitiveness in Mexico
Source: ProMéxico and National Infrastructure Program 2007-2012.
22
0
1
2
3
4
5
6
7
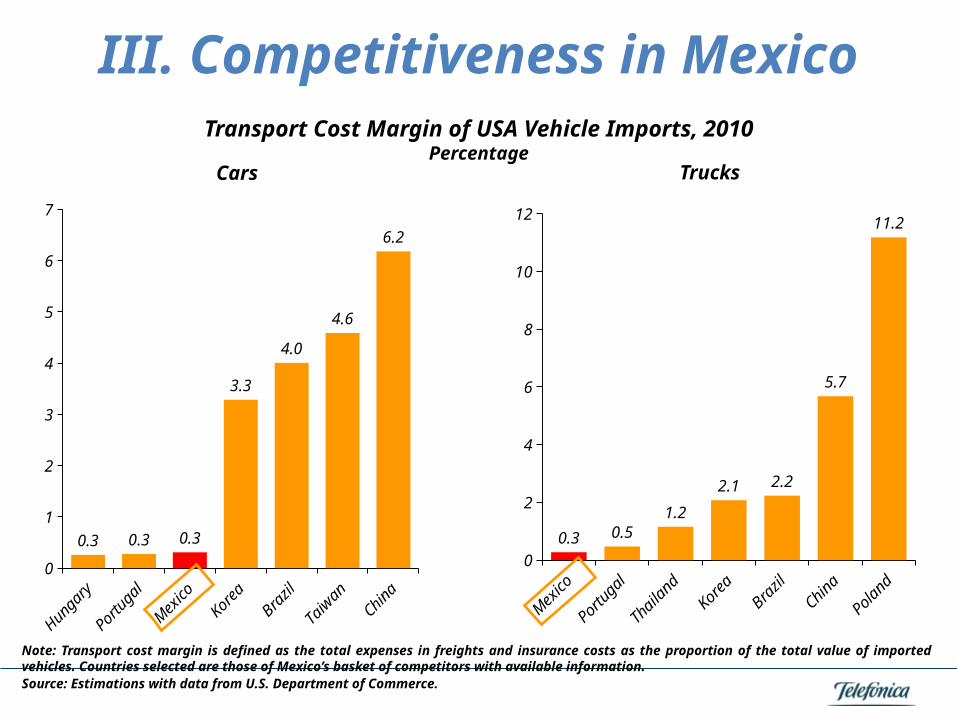
0.3 0.3 0.3
3.3
4.0
4.6
6.2
Mex
ico
Portu
gal
Thaila
nd
Korea
Brazil
China
Polan
d0
2
4
6
8
10
12
0.3 0.51.2
2.1 2.2
5.7
11.2
Cars Trucks
Transport Cost Margin of USA Vehicle Imports, 2010Percentage
Note: Transport cost margin is defined as the total expenses in freights and insurance costs as the proportion of the total value of imported vehicles. Countries selected are those of Mexico’s basket of competitors with available information. Source: Estimations with data from U.S. Department of Commerce.
23
III. Competitiveness in Mexico

U.S.
Mex
ico UK
Turke
y
Portu
gal
Polan
d
Czech
Rep
.
Korea
Hunga
ry0
100
200
300
400
500
600
700
2005
3Q-2009
Natural Gas Prices for IndustryU.S. Dollars (a)
(a) Average price per 107 kcal on a gross calorific value basis.
Source: International Energy Agency.
III. Competitiveness in Mexico
24

Mexico’s labor force has the following advantages:
Population of 112 Million people, with an average age 29 years old.
Demographics Bonus:
• By 2030 Mexico will reach its lowest Dependency ratio (Children and seniors / EAP).
More than 90,000 engineers graduate every year.
• 3 times higher than the US in per capita terms.
9th largest talent pool of Information Technology (IT) Professionals in the World.
III. Competitiveness in Mexico
Source: ProMéxico.
25

Phillip
ines
Mex
ico
Polan
d
Taiwan
Brazil
Hunga
ry
Estoni
a
Argen
tina
Czech
Rep
.
Eslova
quia
Portu
gal
Korea
New Z
eala
nd
Singa
pore
Israe
l
Canad
aU.S
.0
5
10
15
20
25
30
35
40
2000
2009
Hourly Compensation Costs in ManufacturingU.S. Dollars
Source: BLS.
III. Competitiveness in Mexico
26

III. Competitiveness in Mexico
U.S.
Mex
ico
Brazil
Jam
aica
Belize
Colom
bia
Venez
uela
South
Afri
ca
El Sal
vado
r0
10
20
30
40
50
60
70
Homicide Rate 2010Per 100,000 Population
Sources: United Nations Office on Drugs and Crime; FBI, US; Ministry of Security, Mexico; and Secretaria Nal de Seguranca Publica, Brazil.
27

Source: World Economic Forum, Global Competitiveness Report 2011-2012. Note: Countries are ranked by the WEF according to their score among the 139 evaluated countries. Macroeconomic environment and market size are the two competitiveness pillars (out of 12) in which Mexico performed best. Countries selected in these graphs are those of Mexico's basket of competitors which are Hungary, Thailand, Philippines, South Korea, Turkey, Poland, Portugal, Malaysia, Hong Kong, Taiwan, Indonesia and Singapore. These are the countries with the highest Spearman correlation coefficient of revealed comparative advantage, after dropping China, as calculated in Chiquiar, Fragoso and Ramos-Francia (2007). For comparisson with Latin American countries, Brazil, Chile and Colombia were also included.
Competitiveness Indicators: Macroeconomic Environment Score according to World Economic Forum
III. Competitiveness in Mexico
28
Brasil
Portu
gal
Polan
d
Turke
y
Hunga
ry
Argen
tina
Philip
pine
s
Mex
ico
Mal
aysia
Thaila
nd
Indo
nesia
Taiwan
Chile
Singa
pore
China
Hong
Kong
South
Kor
ea0
1
2
3
4
5
6
7

III. Competitiveness in Mexico
Jun-
07
Nov-0
7
Apr-0
8
Sep-0
8
Feb-0
9
Jul-0
9
Dec-0
9
May
-10
Oct-10
Mar
-11
Aug-1
170
80
90
100
110
120
130Argentina Brazil Chile Mexico Peru
Effective Real Exchange Rate (a)
Index June-2007 =100
(a) An increase means a depreciation. For comparison only Latin American countries were selected.
Source: Bank of International Settlements.
Recent Exchange-rate-induced Changes in Competitiveness
29

III. Competitiveness in Mexico
8.4
9.3
9.9
10.4
10.7
11.2
11.5
11.6
11.0
10.6
10.2
10.7
10.8
10.3
11.3
12.0
6.2 6.4 7.
2 7.8 8.
0
8.2 9.0 10
.8
12.1 13
.4 14.5 15
.5 16.4
16.1
19.0
19.1
15.0
13.9
13.9
14.0
13.7
13.7
12.7
12.4
11.7
11.4
10.4
10.1
9.4
8.7 9.2
9.1
ChinaMexican competi-tors without China
Mexico
Mexican, Chinese and other Mexico’s Competitors Exports Share in Total US Imports
Percent
Source: Banco de MéxicoNote: Mexican competitors are Hungary, Thailand, Philippines, South Korea, Turkey, Poland, Portugal, Malaysia, Hong Kong, Taiwan, Indonesia and Singapore. These are the countries with the highest Spearman correlation coefficient of revealed comparative advantage, after dropping China, as calculated in Chiquiar, Fragoso and Ramos-Francia
(2007). 30

III. Competitiveness in Mexico
8.1
9.1
9.7
10.2
10.6
11.0
11.4
11.4
10.7
10.3
9.8
10.3
10.5
10.2
11.3
12.1
6.5
6.7 7.5 8.
1 8.4 8.
8 9.6 11
.5
13.2 14
.7 16.2 17
.6 18.7 19
.1
21.6
22.0
15.8
14.6
14.6
14.5
14.3
14.7
13.6
13.3
12.7
12.5
11.6
11.4
10.7
10.3
10.4
10.
4
Mexico
Mexican competitors wi-thout China
China
Mexican, Chinese and other Mexico’s Competitors Exports Share in Non-oil USA Imports
Percent
Source: Banco de México.
Note: Mexican competitors are Hungary, Thailand, Philippines, South Korea, Turkey, Poland, Portugal, Malaysia, Hong Kong, Taiwan, Indonesia and Singapore. These are the countries with the highest Spearman correlation coefficient of revealed comparative advantage, after dropping China, as calculated in Chiquiar, Fragoso and Ramos-Francia
(2007).
31
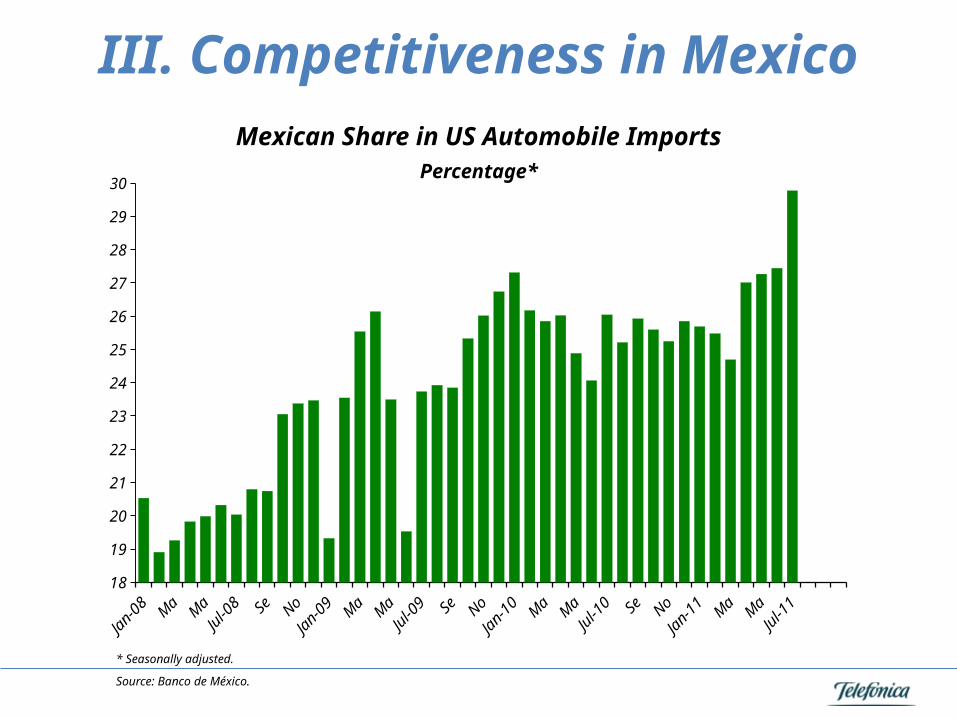
18
19
20
21
22
23
24
25
26
27
28
29
30
Mexican Share in US Automobile ImportsPercentage*
* Seasonally adjusted.
Source: Banco de México.
III. Competitiveness in Mexico
32

III. Competitiveness in Mexico
JPM
X/12/11
July. INEGI gross-fixed inv 9.3% driven by purchases of machinery and equipment. JPM “Even though GFI figure came in lower than expected it continues to reflect investments announced months ago to reallocate from other countries to Mexico. The weaker peso, higher global transport costs, and lower wage differential between Mexico and Asian countries has increased Mexico’s competitiveness. This has created incentives for investors to reallocate production to Mexico or enhance existing operations. Investment continues to expand at a healthy pace, after lagging the externally-driven recovery over the last year. A more promising investment outlook is likely to support better employment conditions in addition to a significant credit expansion.