
Outcome Relationship Models, presentation, Ned Newton, London, 23 June 2016
23
Outcome Relationship Models Ned Newton Atkins
-
Upload
association-for-project-management -
Category
Business
-
view
586 -
download
4
Transcript of Outcome Relationship Models, presentation, Ned Newton, London, 23 June 2016

Outcome Relationship Models
Ned Newton
Atkins

Mapping approaches within:
– benefits management
– International development, social change
– strategy creation
– value management
Outcome Relationship Models (ORMs):
– Government programme ORMs Niteworks rainbow team :
Atkins, BMT Hi-Q Sigma, Rhead (Costain), Serco & independents
– context, notation, layout
– ORM for a capability programme
– outcome analysis
Mapping uses
Topics

MSP Benefits Map
• The standard benefits map
• Completed right to left
• For an emergent programme
completed from both sides
• Good high level summary
Project
Output Capability Outcome Benefit
Corporate
Objective MSP® is a registered trade mark of
AXELOS Limited. All rights reserved.
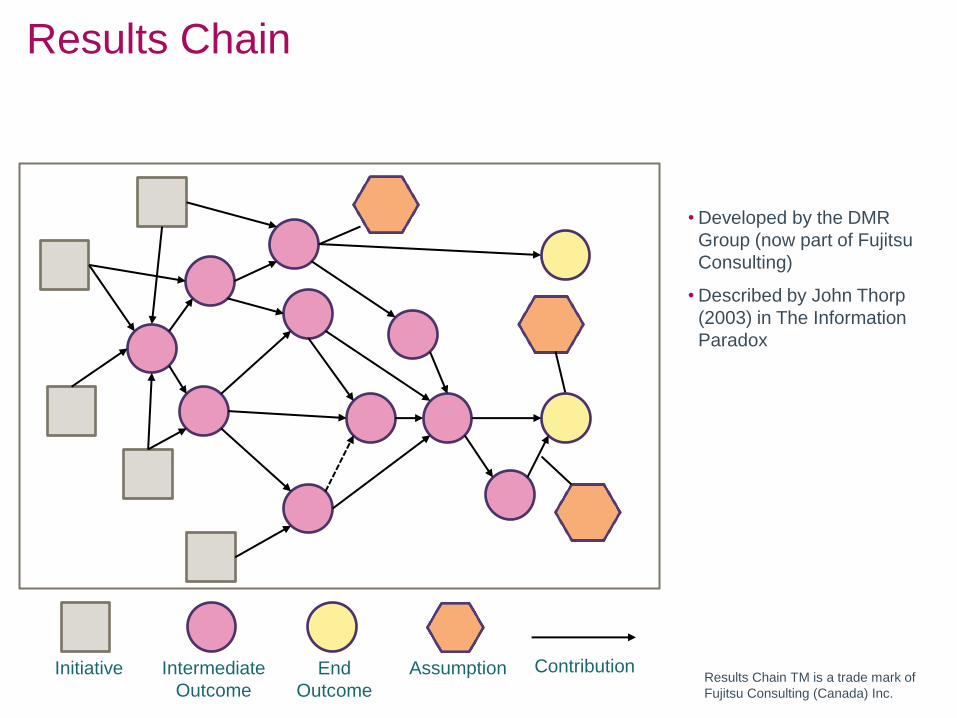
Results Chain
• Developed by the DMR
Group (now part of Fujitsu
Consulting)
• Described by John Thorp
(2003) in The Information
Paradox
Contribution Initiative Assumption Intermediate
Outcome Results Chain TM is a trade mark of
Fujitsu Consulting (Canada) Inc.
End
Outcome

Benefits Dependency Network
• Developed by Cranfield
University’s Information
Systems Research Centre
(Ward and Daniel, 2006)
• Similar to Benefit
Dependency Map described
by Gerald Bradley in Benefit
Realisation Management
(2010)
IT Enabler Enabling
Change
Business
Change
Benefit Investment
Objective
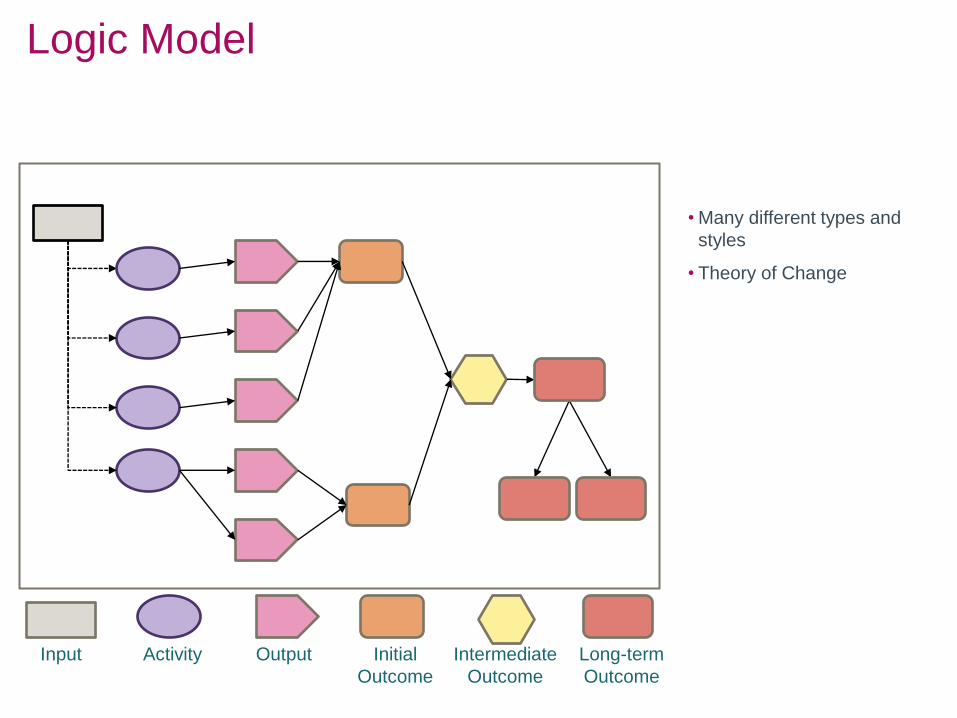
Logic Model
• Many different types and
styles
• Theory of Change
Input Activity Output Initial
Outcome
Intermediate
Outcome
Long-term
Outcome
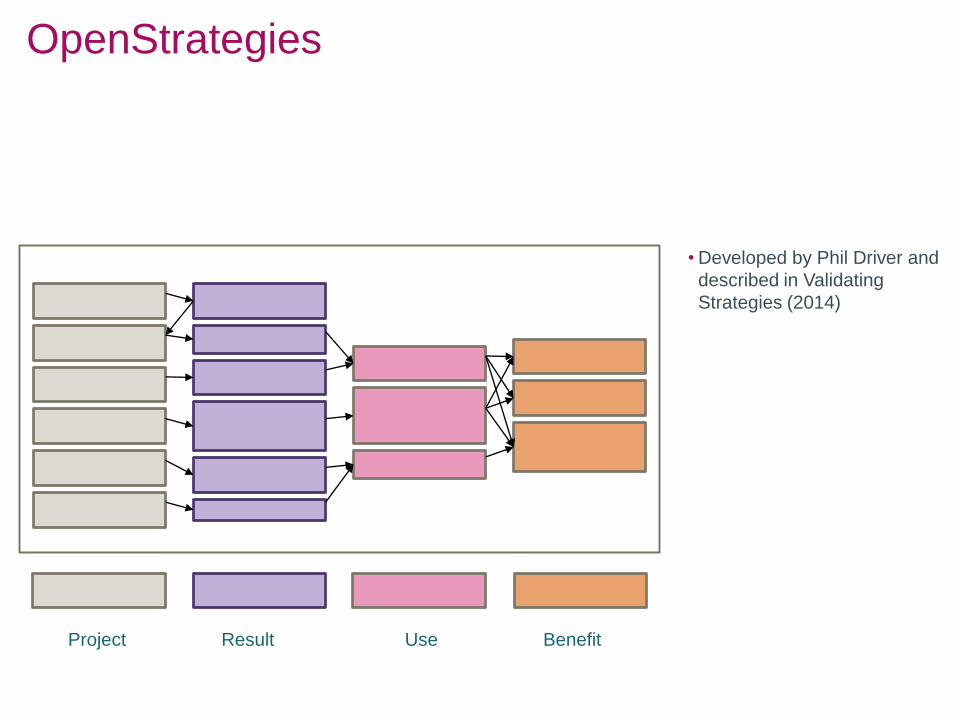
OpenStrategies
• Developed by Phil Driver and
described in Validating
Strategies (2014)
Project Result Use Benefit
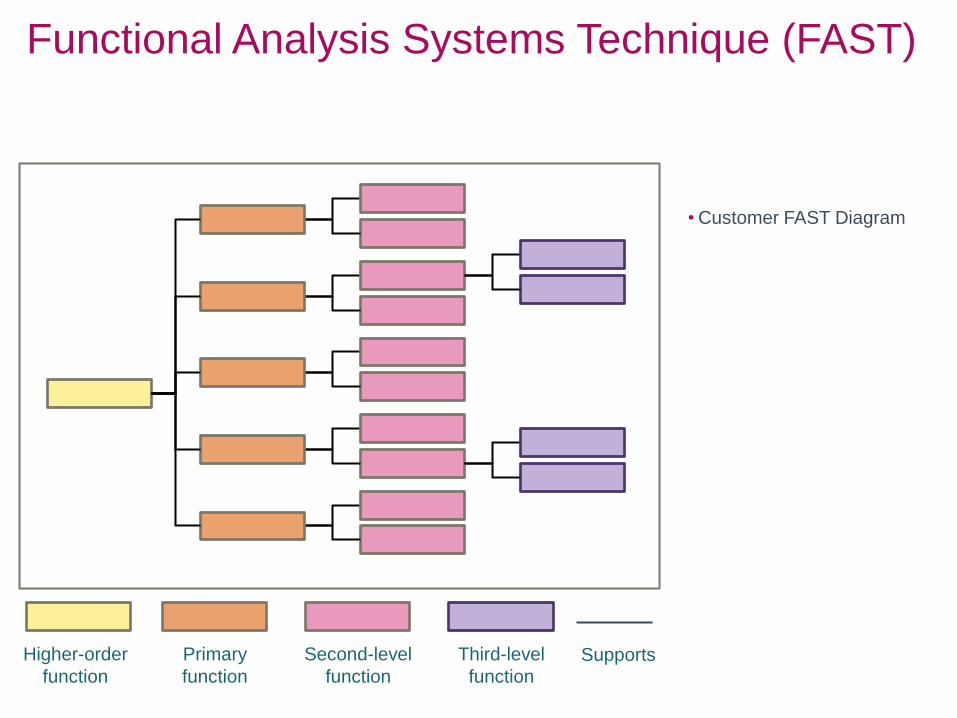
Functional Analysis Systems Technique (FAST)
• Customer FAST Diagram
Higher-order
function
Second-level
function
Primary
function
Third-level
function Supports

Outcome Relationship Model
• Atkins innovation
• Notation aids scaling
• Poster for the programme
• Export for analysis
Positive
Outcome
Negative
Outcome
Benefit Other Strategic
Direction
Intermediate
Outcome
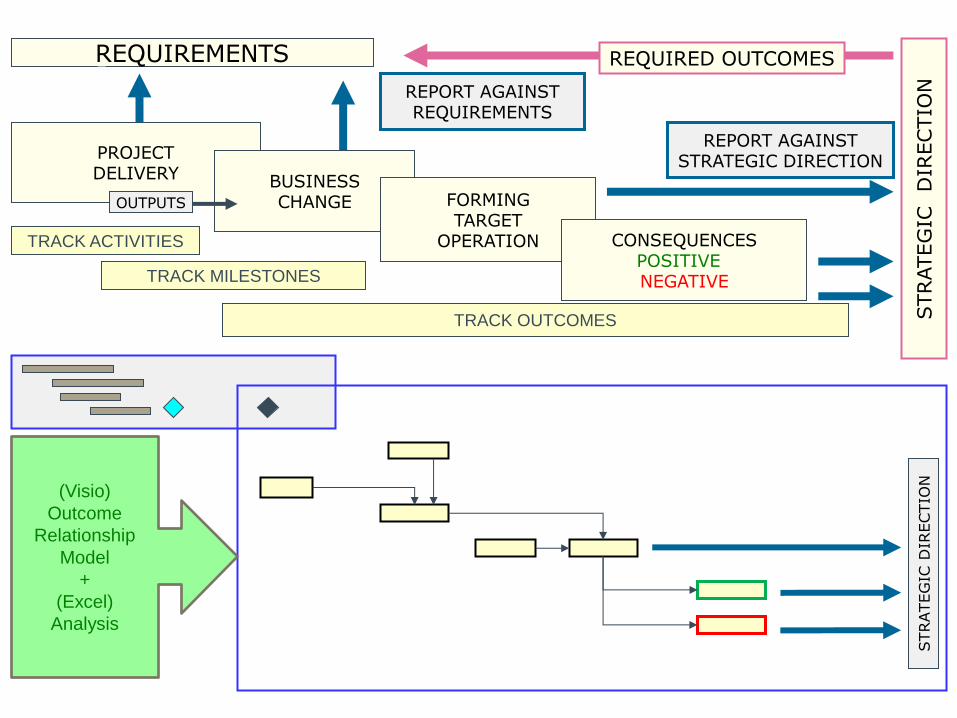
TRACK ACTIVITIES
TRACK MILESTONES
TRACK OUTCOMES
PROJECT DELIVERY
STRATEG
IC
DIR
ECTIO
N
REQUIREMENTS
BUSINESS CHANGE
REPORT AGAINST REQUIREMENTS
REPORT AGAINST STRATEGIC DIRECTION
FORMING TARGET
OPERATION CONSEQUENCES POSITIVE NEGATIVE
OUTPUTS
(Visio)
Outcome
Relationship
Model
+
(Excel)
Analysis
REQUIRED OUTCOMES
STRATEG
IC D
IRECTIO
N

Infrastructure programme
Capability programmes
Recruitment programme
Headquarters reorganisation programme
ORM Examples
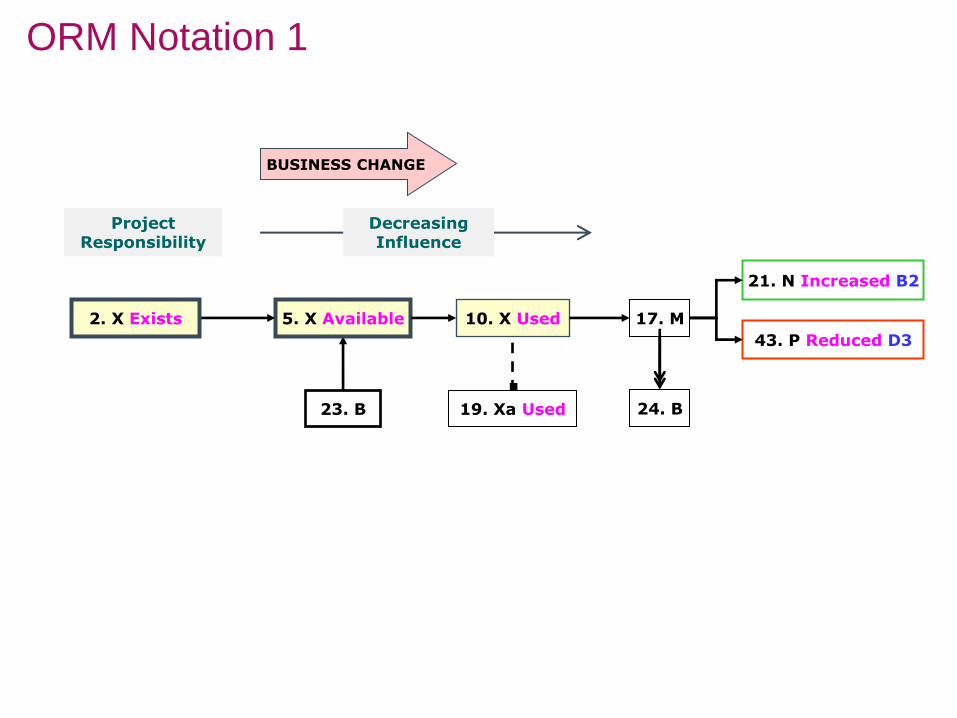
23. B
5. X Available 10. X Used 17. M
43. P Reduced D3
21. N Increased B2
BUSINESS CHANGE
Decreasing Influence
2. X Exists
Project Responsibility
ORM Notation 1
24. B 19. Xa Used
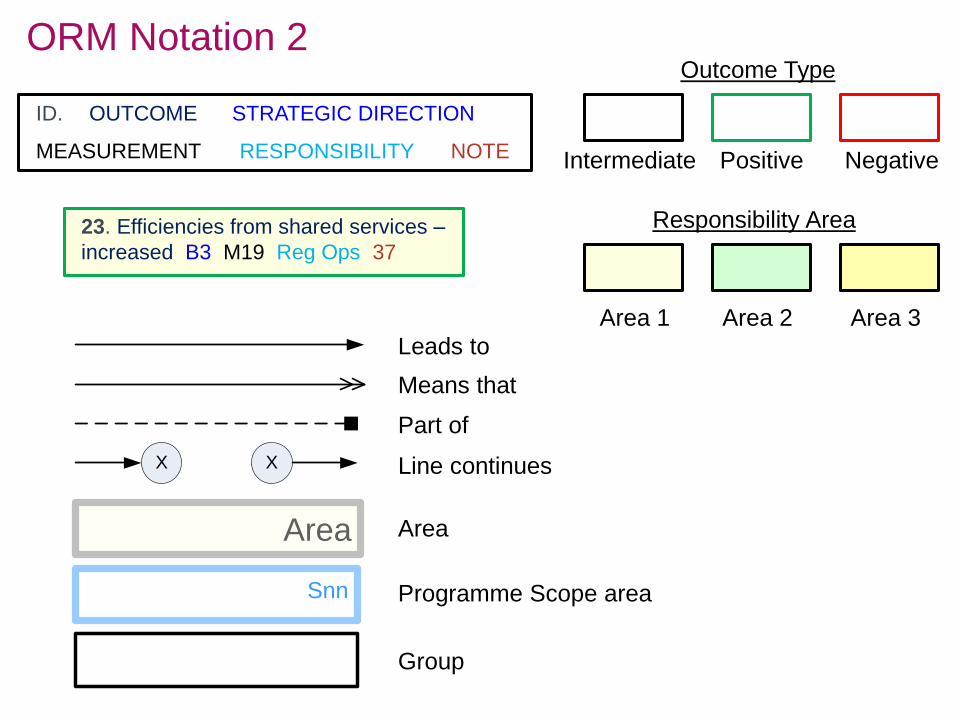
Responsibility Area
Leads to
Means that
Part of
Line continues
Area
Programme Scope area
Group
ORM Notation 2
X X
Area
Snn
ID.
Area 1 Area 2 Area 3
Outcome Type
Positive Negative Intermediate
OUTCOME STRATEGIC DIRECTION
MEASUREMENT RESPONSIBILITY NOTE
23. Efficiencies from shared services –
increased B3 M19 Reg Ops 37

TITLE
STRATEGIC
DIRECTION
DOCUMENT
INFORMATION
NOTATION ABBREVIATIONS, NOTES, MEASURES
PROGRAMME
INFORMATION
OUTCOME MAP
ORM Layout
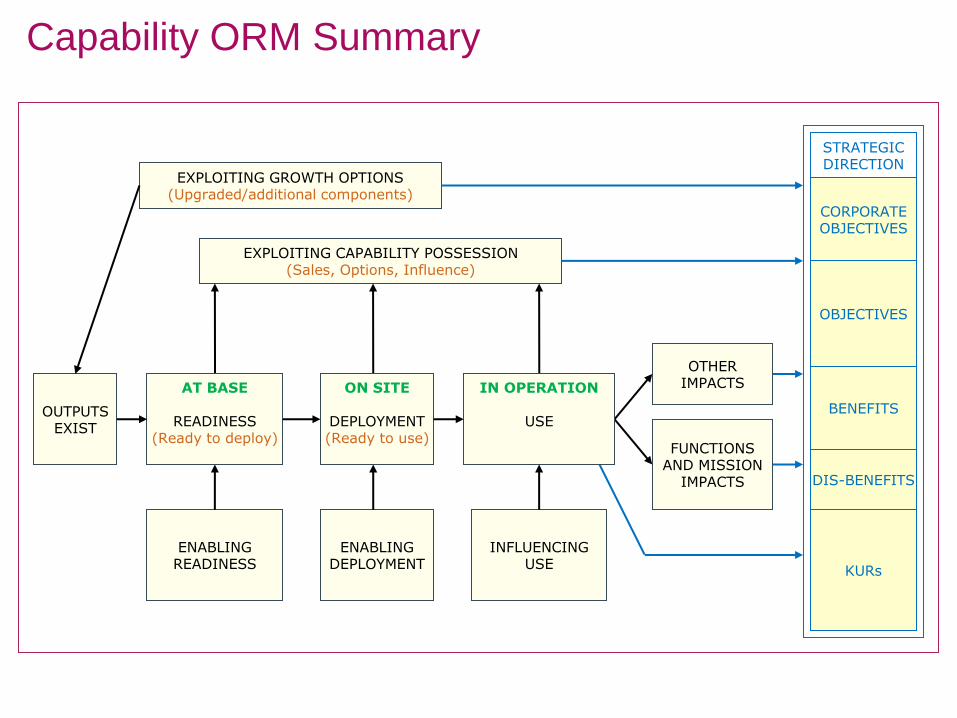
Capability ORM Summary
OUTPUTS EXIST
CORPORATE OBJECTIVES
OBJECTIVES
BENEFITS
DIS-BENEFITS
KURs
EXPLOITING CAPABILITY POSSESSION (Sales, Options, Influence)
ENABLING READINESS
ENABLING DEPLOYMENT
INFLUENCING USE
OTHER IMPACTS
FUNCTIONS AND MISSION
IMPACTS
EXPLOITING GROWTH OPTIONS (Upgraded/additional components)
STRATEGIC DIRECTION
AT BASE
READINESS (Ready to deploy)
ON SITE
DEPLOYMENT (Ready to use)
IN OPERATION
USE
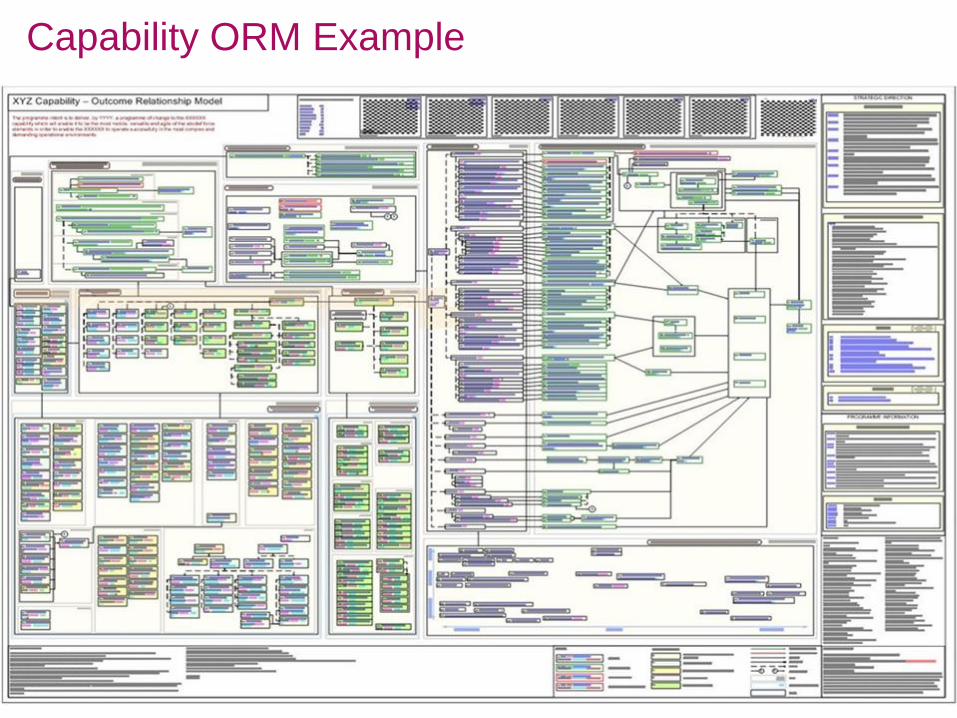
Capability ORM Example
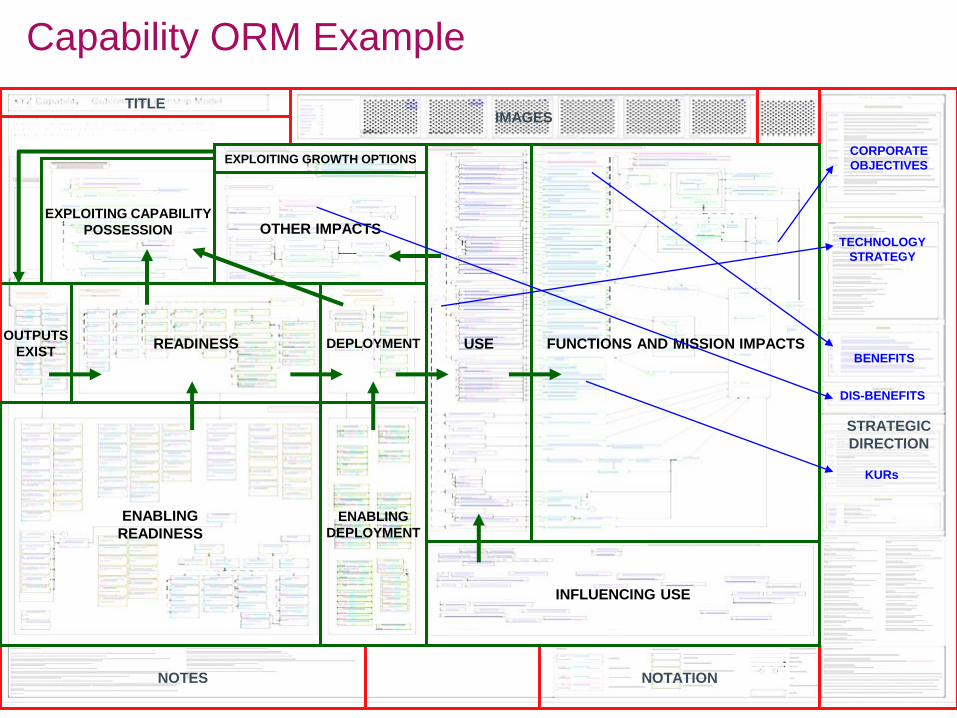
STRATEGIC
DIRECTION
NOTES NOTATION
IMAGES TITLE
OUTPUTS
EXIST READINESS DEPLOYMENT USE FUNCTIONS AND MISSION IMPACTS
ENABLING
READINESS
ENABLING
DEPLOYMENT
INFLUENCING USE
OTHER IMPACTS EXPLOITING CAPABILITY
POSSESSION
EXPLOITING GROWTH OPTIONS CORPORATE
OBJECTIVES
BENEFITS
KURs
DIS-BENEFITS
TECHNOLOGY
STRATEGY
Capability ORM Example
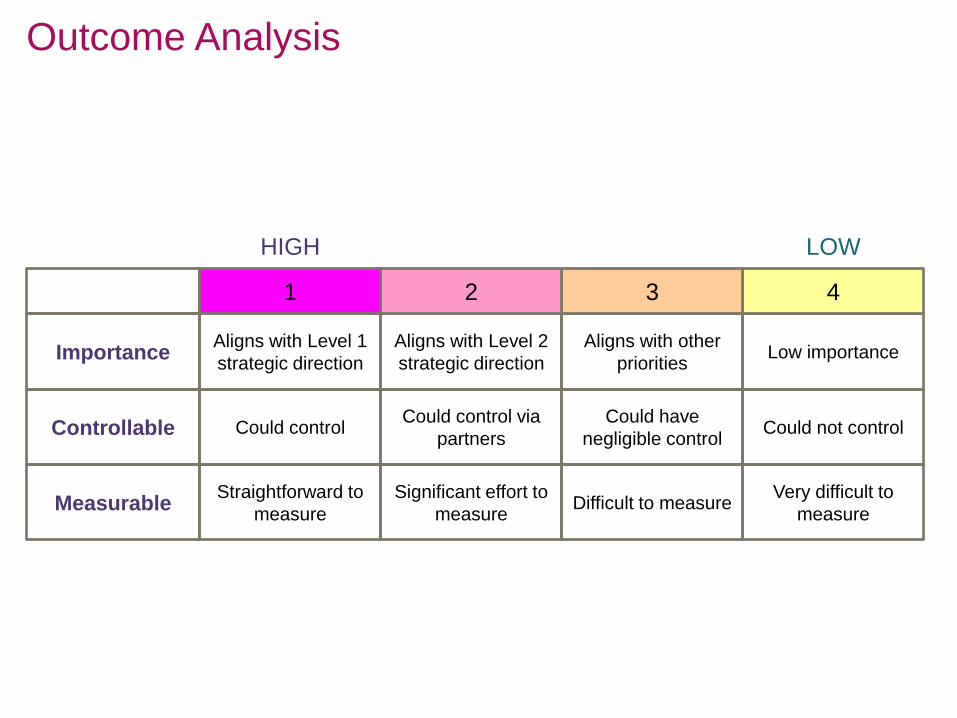
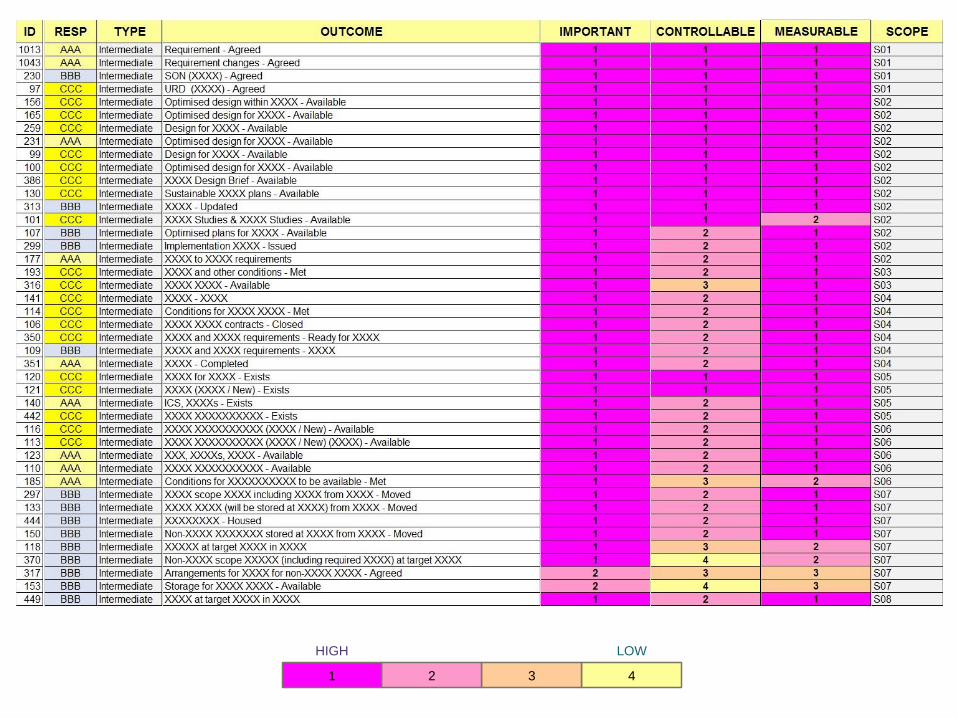
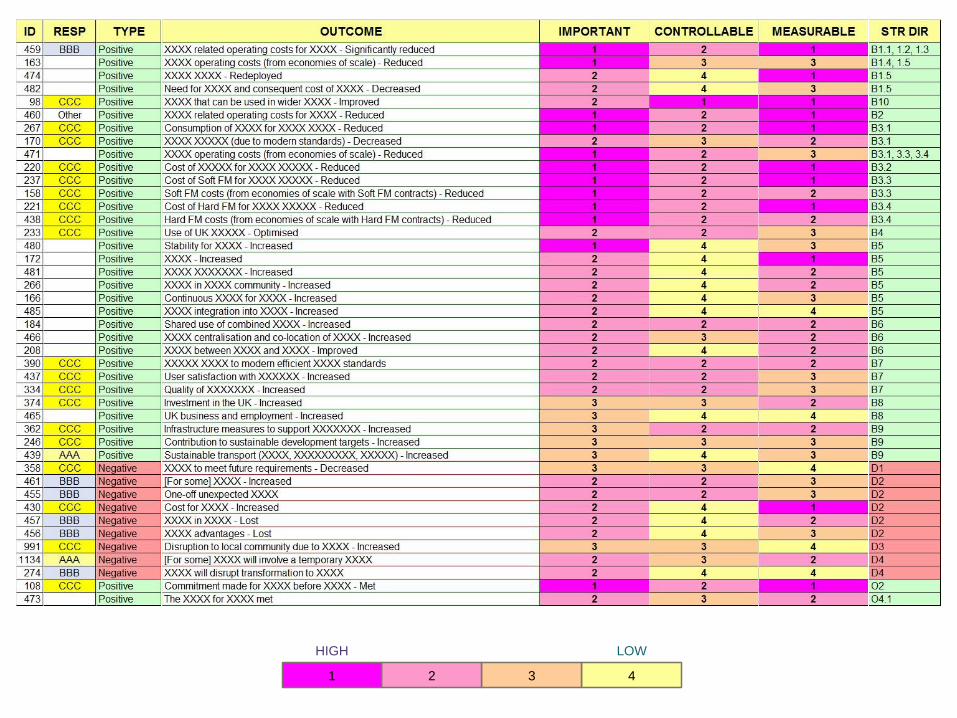
Outcome Analysis
Importance Low importance Aligns with other
priorities
Aligns with Level 2
strategic direction
Aligns with Level 1
strategic direction
Controllable Could not control Could have
negligible control
Could control via
partners Could control
Measurable Very difficult to
measure Difficult to measure
Significant effort to
measure
Straightforward to
measure
4 3 2 1
HIGH LOW
4321
HIGH LOW
4321
HIGH LOW
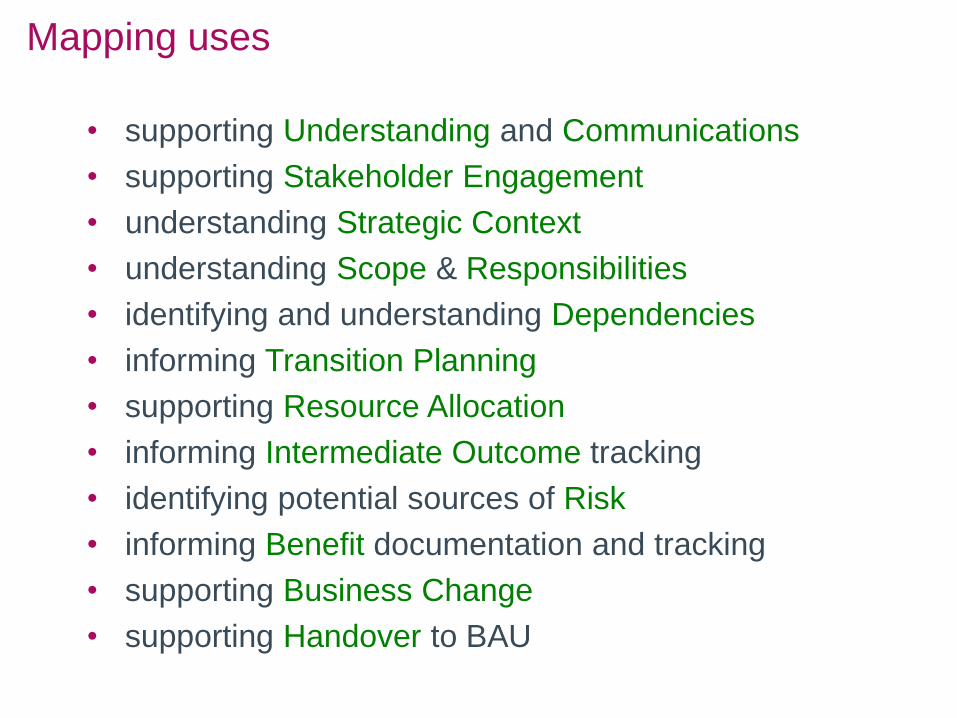
Mapping uses
• supporting Understanding and Communications
• supporting Stakeholder Engagement
• understanding Strategic Context
• understanding Scope & Responsibilities
• identifying and understanding Dependencies
• informing Transition Planning
• supporting Resource Allocation
• informing Intermediate Outcome tracking
• identifying potential sources of Risk
• informing Benefit documentation and tracking
• supporting Business Change
• supporting Handover to BAU
This presentation was delivered
at an APM event
To find out more about
upcoming events please visit our
website www.apm.org.uk/events