Our World Mapping Our World - hmhco.com
20
Mapping Our World
Transcript of Our World Mapping Our World - hmhco.com
IN PARTNERSHIP WITHMap
ping
Our
Wor
ldMapping Our World
Mapping_Our_World_FC.indd 1 2/24/17 9:06 AM
2
UNITED STATES
Pennington
SOUTH DAKOTA
E A R T HY O U R C O N T I N E N T
Y O U R C O U N T R Y
Y O U R S T A T E
Y O U R T O W N
YO U R S T R EET
YOUR HOM
E
YOU
SCHOOL
SCHOOLSCHOOL
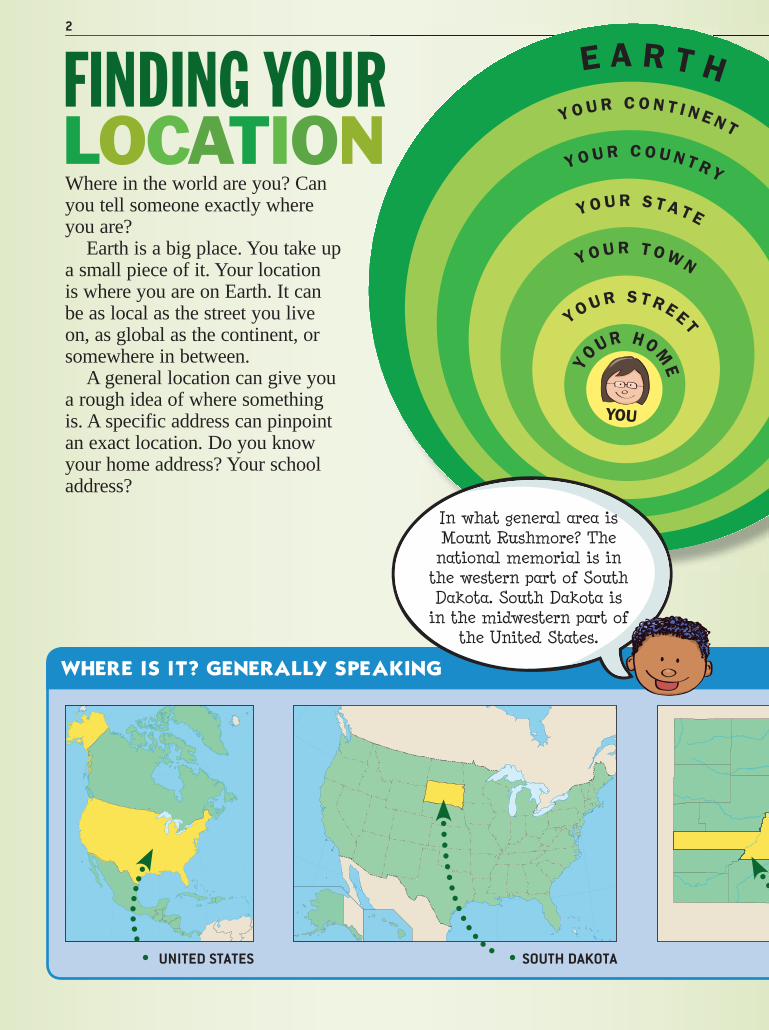
Where in the world are you? Can you tell someone exactly where you are?
Earth is a big place. You take up a small piece of it. Your location is where you are on Earth. It can be as local as the street you live on, as global as the continent, or somewhere in between.
A general location can give you a rough idea of where something is. A specific address can pinpoint an exact location. Do you know your home address? Your school address?
FINDING YOURLOCATION
WHERE IS IT? GENERALLY SPEAKING
In w t general area is ount us more? e
national memorial is in t e western part of out
a ota. out a ota is in t e midwestern part of
t e nited tates.
mapping_our_world_2-3_.indd 2 2/24/17 9:08 AM
3
SCHOOL
Pennington
PENNINGTON COUNTY
Pennington
MOUNT RUSHMORE
E A R T HY O U R C O N T I N E N T
Y O U R C O U N T R Y
Y O U R S T A T E
Y O U R T O W N
YO U R S T R EET
YOUR HOM
E
YOU
SCHOOL
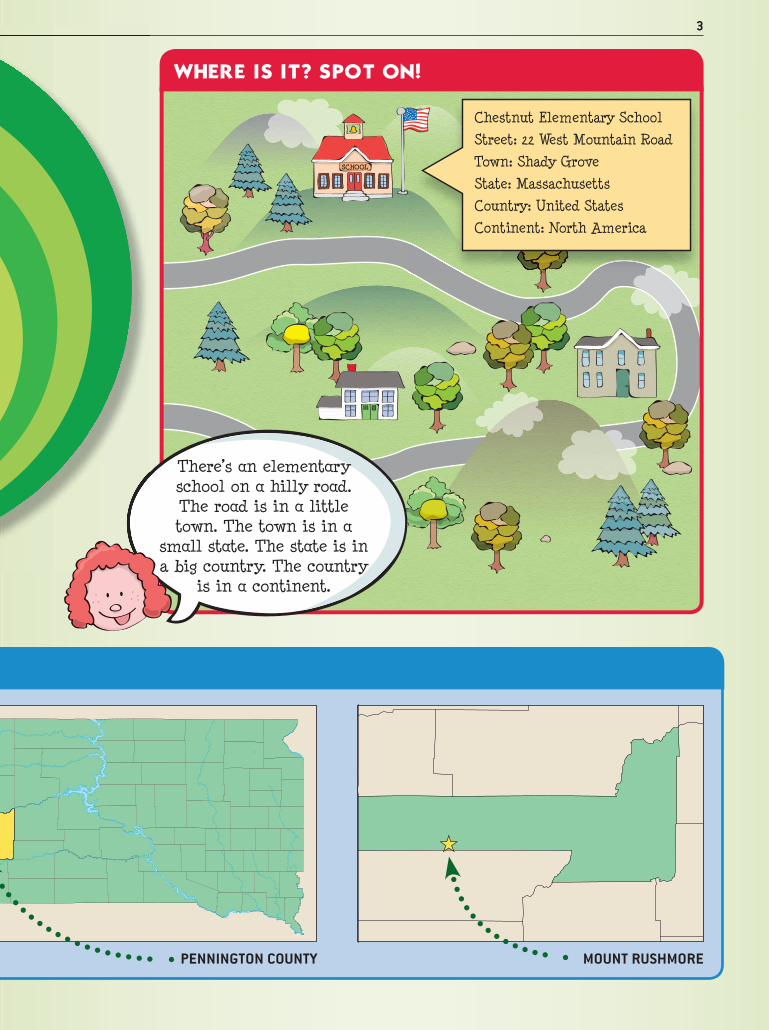
ere’s an elementary sc ool on a illy road.
e road is in a little town. e town is in a
small state. e state is in big country. e country
is in a continent.
WHERE IS IT? SPOT ON!
mapping_our_world_2-3_.indd 3 2/24/17 9:08 AM
4
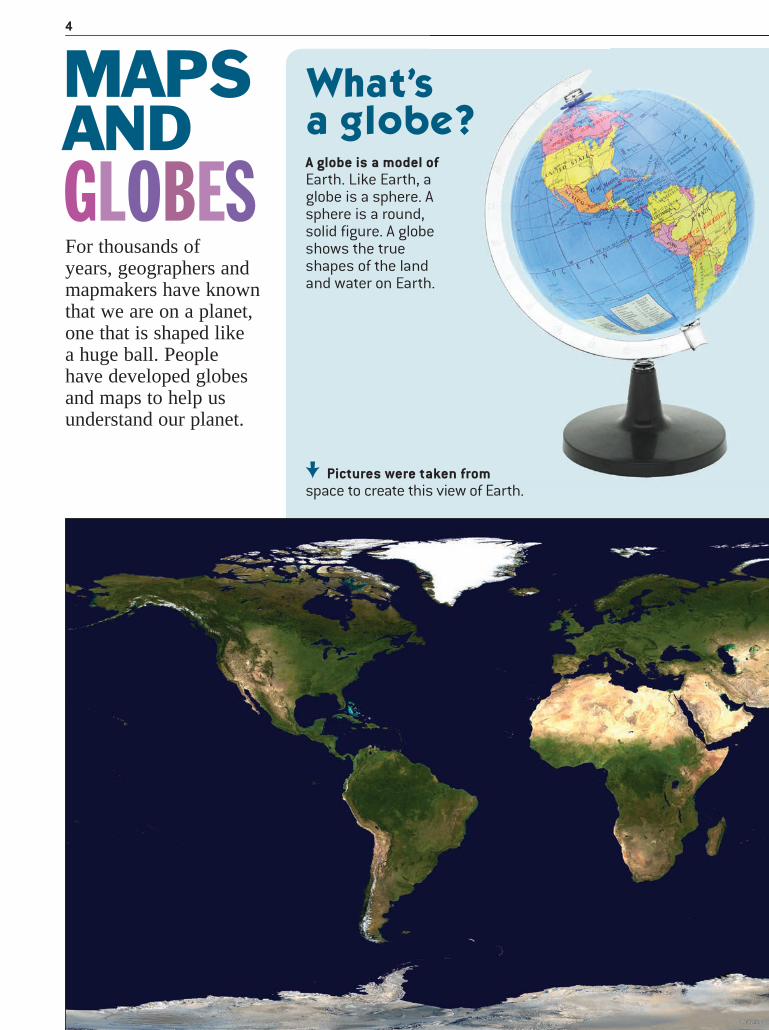
For thousands of years, geographers and mapmakers have known that we are on a planet, one that is shaped like a huge ball. People have developed globes and maps to help us understand our planet.
A globe is a model of Earth. Like Earth, a globe is a sphere. A sphere is a round, solid figure. A globe shows the true shapes of the land and water on Earth.
Pictures were taken from space to create this view of Earth.
What’s a globe?
MAPS ANDGLOBES
mapping_our_world_4-5_v2.indd 2 2/24/17 9:09 AM
5
What’s a map?
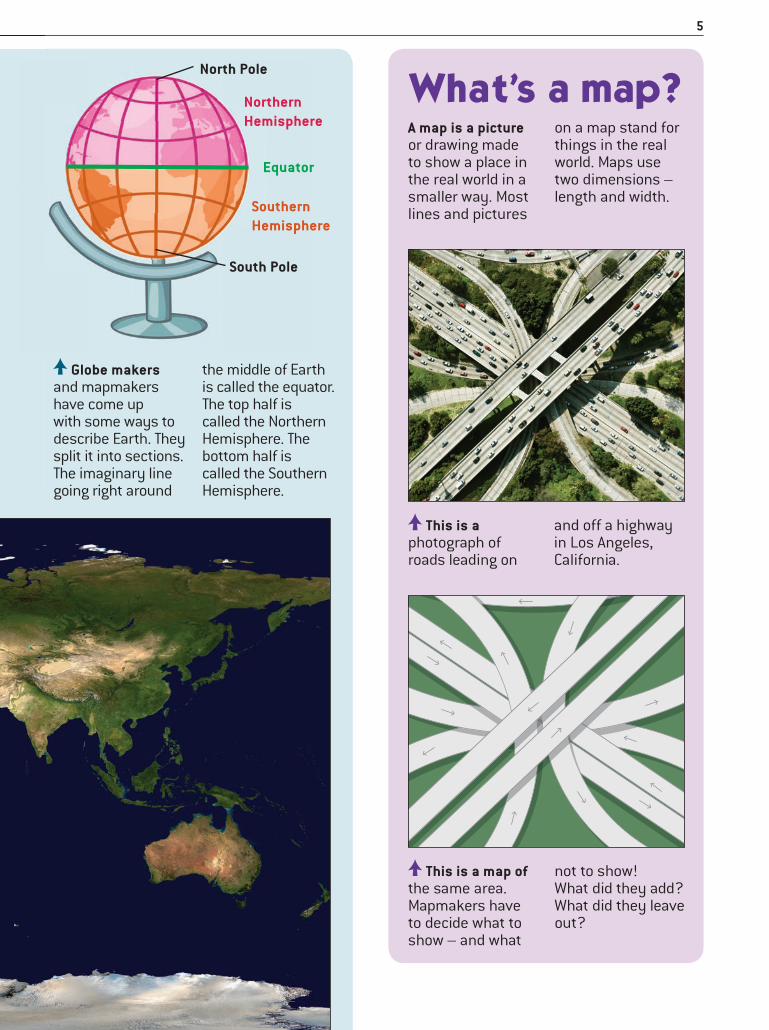
Globe makers and mapmakers have come up with some ways to describe Earth. They split it into sections. The imaginary line going right around
the middle of Earth is called the equator. The top half is called the Northern Hemisphere. The bottom half is called the Southern Hemisphere.
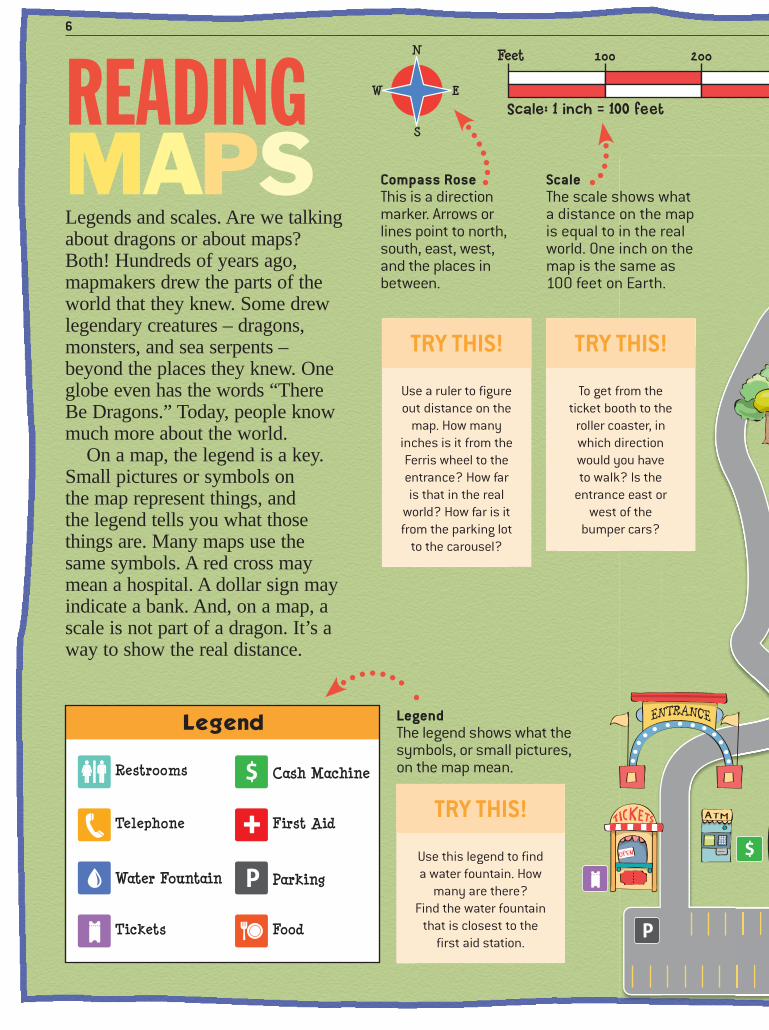
A map is a picture or drawing made to show a place in the real world in a smaller way. Most lines and pictures
on a map stand for things in the real world. Maps use two dimensions – length and width.
This is a photograph of roads leading on
and off a highway in Los Angeles, California.
This is a map of the same area. Mapmakers have to decide what to show – and what
not to show! What did they add? What did they leave out?
Southern Hemisphere
Northern Hemisphere
Equator
South Pole
North Pole
mapping_our_world_4-5_v2.indd 3 2/24/17 9:09 AM
6
Water Fountain
Cash Machine
Parking
Water Fountain
Cash Machine
Parking
Water Fountain
Cash Machine
Parking
Legends and scales. Are we talking about dragons or about maps? Both! Hundreds of years ago, mapmakers drew the parts of the world that they knew. Some drew legendary creatures – dragons, monsters, and sea serpents – beyond the places they knew. One globe even has the words “There Be Dragons.” Today, people know much more about the world.
On a map, the legend is a key. Small pictures or symbols on the map represent things, and the legend tells you what those things are. Many maps use the same symbols. A red cross may mean a hospital. A dollar sign may indicate a bank. And, on a map, a scale is not part of a dragon. It’s a way to show the real distance.
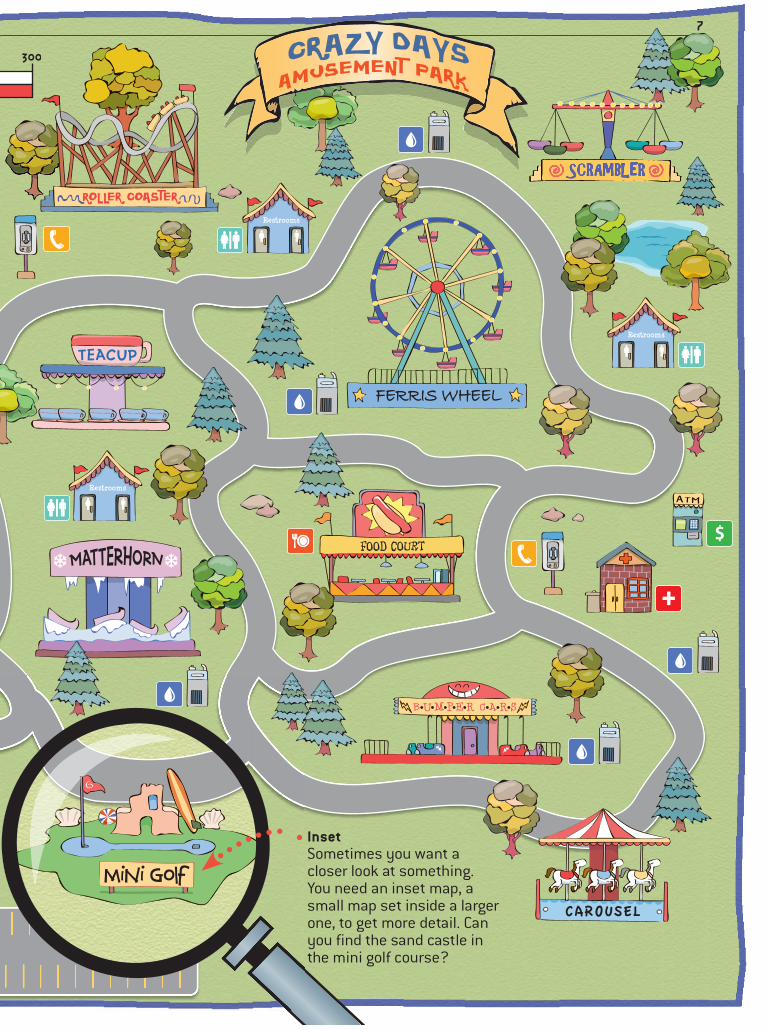
LegendThe legend shows what the symbols, or small pictures, on the map mean.
READING MAPS
Use this legend to find a water fountain. How
many are there? Find the water fountain
that is closest to the first aid station.
TRY THIS!
Compass RoseThis is a direction marker. Arrows or lines point to north, south, east, west, and the places in between.
ScaleThe scale shows what a distance on the map is equal to in the real world. One inch on the map is the same as 100 feet on Earth.
To get from the ticket booth to the
roller coaster, in which direction would you have to walk? Is the
entrance east or west of the
bumper cars?
TRY THIS!
Use a ruler to figure out distance on the
map. How many inches is it from the Ferris wheel to the entrance? How far is that in the real
world? How far is it from the parking lot
to the carousel?
TRY THIS!
Legend
mapping_our_world_6-7_v3.indd 2 2/24/17 9:10 AM
7
Inset Sometimes you want a closer look at something. You need an inset map, a small map set inside a larger one, to get more detail. Can you find the sand castle in the mini golf course?
mapping_our_world_6-7_v3.indd 3 2/24/17 9:11 AM
8
You might know exactly where you are. But how do you explain that to someone else? How can you tell them where your home is, on a map? Think of a football field. It has lines going across the field, marking every five yards. If the referee tells you to line up at the 20-yard line, you know right where to go. Mapmakers use the same idea, using these two common techniques: grids, and latitude and longitude.
Mapmakers put grids – lines that go across and lines that go down, forming boxes – over a map. You can find things on the map by what box they are in. The boxes going across usually have letters. The boxes going up and down usually have numbers.
Look at this grid map. What do you see at B4?
DIVIDING THE EARTH
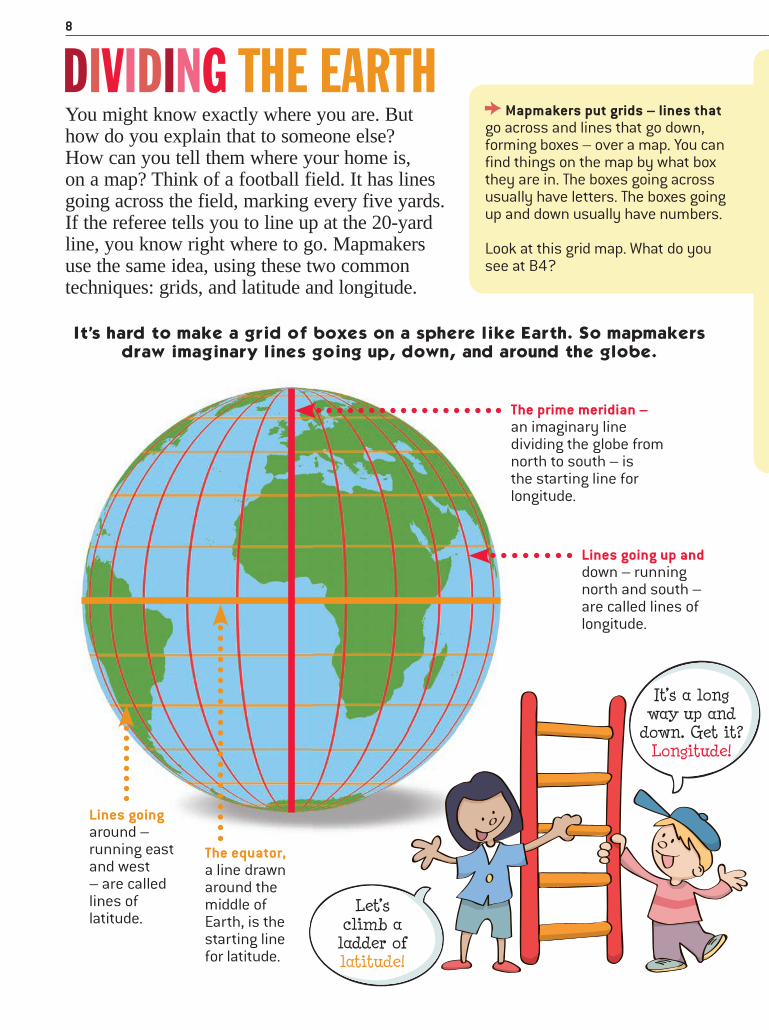
It’s hard to make a grid of boxes on a sphere like Earth. So mapmakers draw imaginary lines going up, down, and around the globe.
Lines going around – running east and west – are called lines of latitude.
Lines going up and down – running north and south – are called lines of longitude.
The equator, a line drawn around the middle of Earth, is the starting line for latitude.
The prime meridian – an imaginary line dividing the globe from north to south – is the starting line for longitude.
Let’s climb a
ladder of latitude!
It’s a long way up and
down. Get it? Longitude!
mapping_our_world_8-9_v2.indd 2 2/24/17 9:49 AM
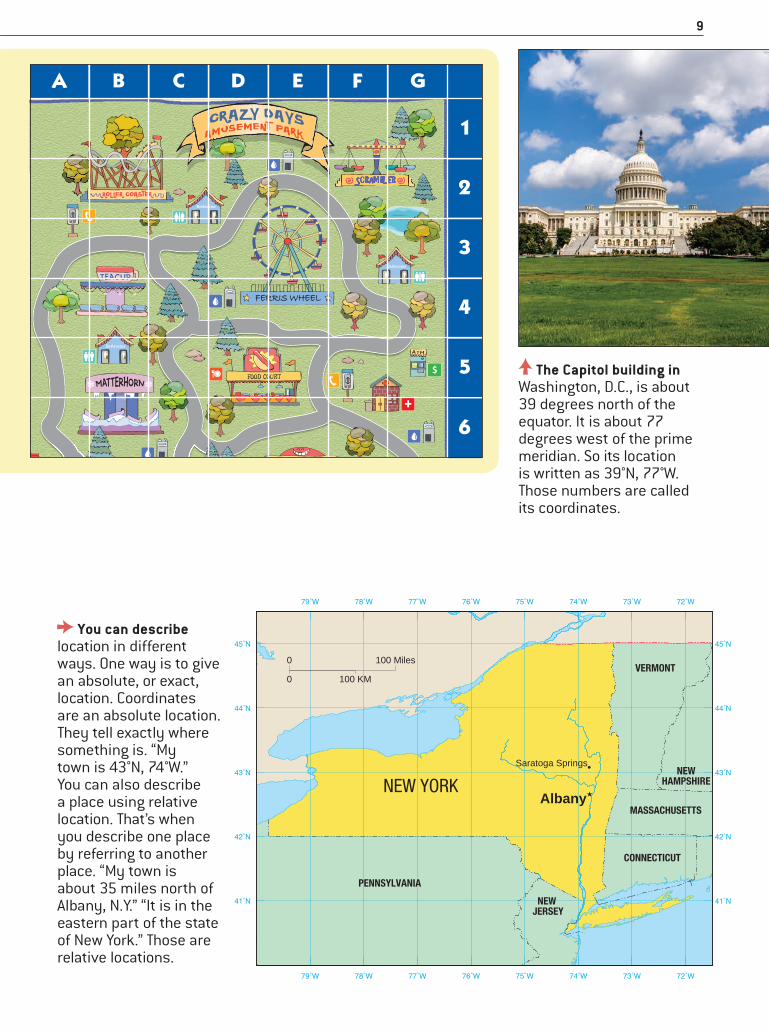
9
A B C D E F G
1
4
2
3
6
5
Albany
Saratoga Springs
CONNECTICUT
MASSACHUSETTS
NEWHAMPSHIRE
NEW JERSEY
PENNSYLVANIA
VERMONT
NEW YORK
41˚N
42˚N
43˚N
44˚N
45˚N
41˚N
42˚N
43˚N
44˚N
45˚N
72˚W73˚W74˚W75˚W76˚W77˚W78˚W79˚W
72˚W73˚W74˚W75˚W76˚W77˚W78˚W79˚W
0
0
100 Miles
100 KM
The Capitol building in Washington, D.C., is about 39 degrees north of the equator. It is about 77 degrees west of the prime meridian. So its location is written as 39°N, 77°W. Those numbers are called its coordinates.
You can describe location in different ways. One way is to give an absolute, or exact, location. Coordinates are an absolute location. They tell exactly where something is. “My town is 43°N, 74°W.” You can also describe a place using relative location. That’s when you describe one place by referring to another place. “My town is about 35 miles north of Albany, N.Y.” “It is in the eastern part of the state of New York.” Those are relative locations.
It’s a long way up and
down. Get it? Longitude!
mapping_our_world_8-9_v2.indd 3 2/24/17 9:50 AM
10
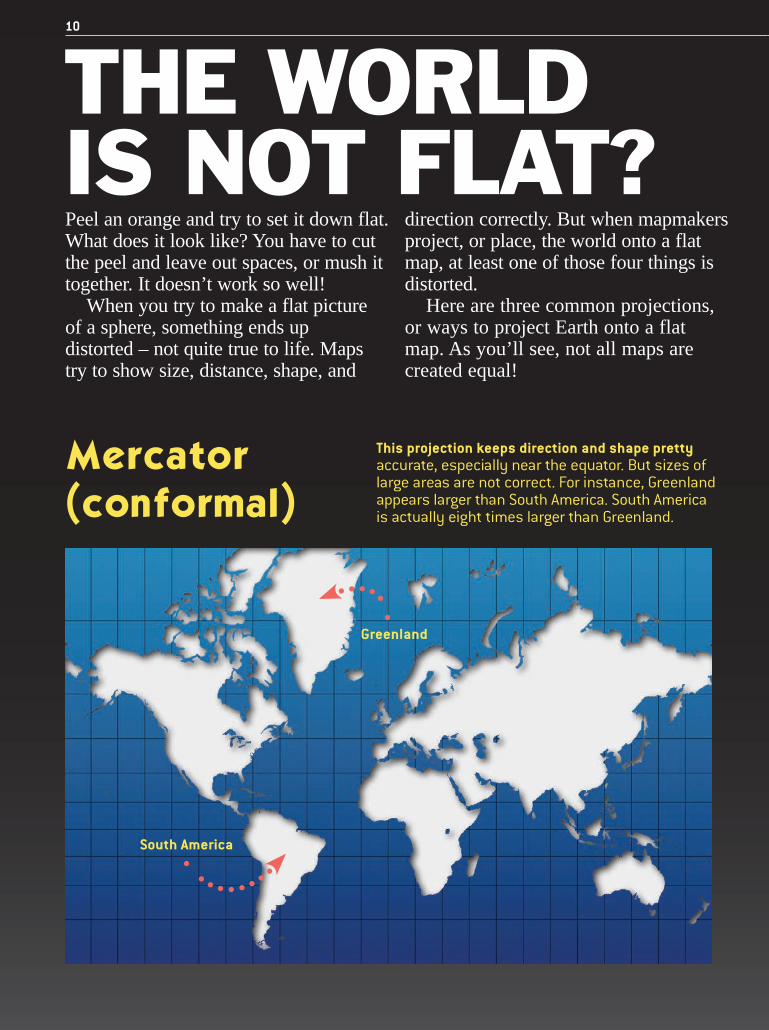
Peel an orange and try to set it down flat. What does it look like? You have to cut the peel and leave out spaces, or mush it together. It doesn’t work so well!
When you try to make a flat picture of a sphere, something ends up distorted – not quite true to life. Maps try to show size, distance, shape, and
direction correctly. But when mapmakers project, or place, the world onto a flat map, at least one of those four things is distorted.
Here are three common projections, or ways to project Earth onto a flat map. As you’ll see, not all maps are created equal!
This projection keeps direction and shape pretty accurate, especially near the equator. But sizes of large areas are not correct. For instance, Greenland appears larger than South America. South America is actually eight times larger than Greenland.
Greenland
South America
Mercator (conformal)
THE WORLD IS NOT FLAT?
mapping_our_world_10-11.indd 2 2/24/17 10:00 AM
11
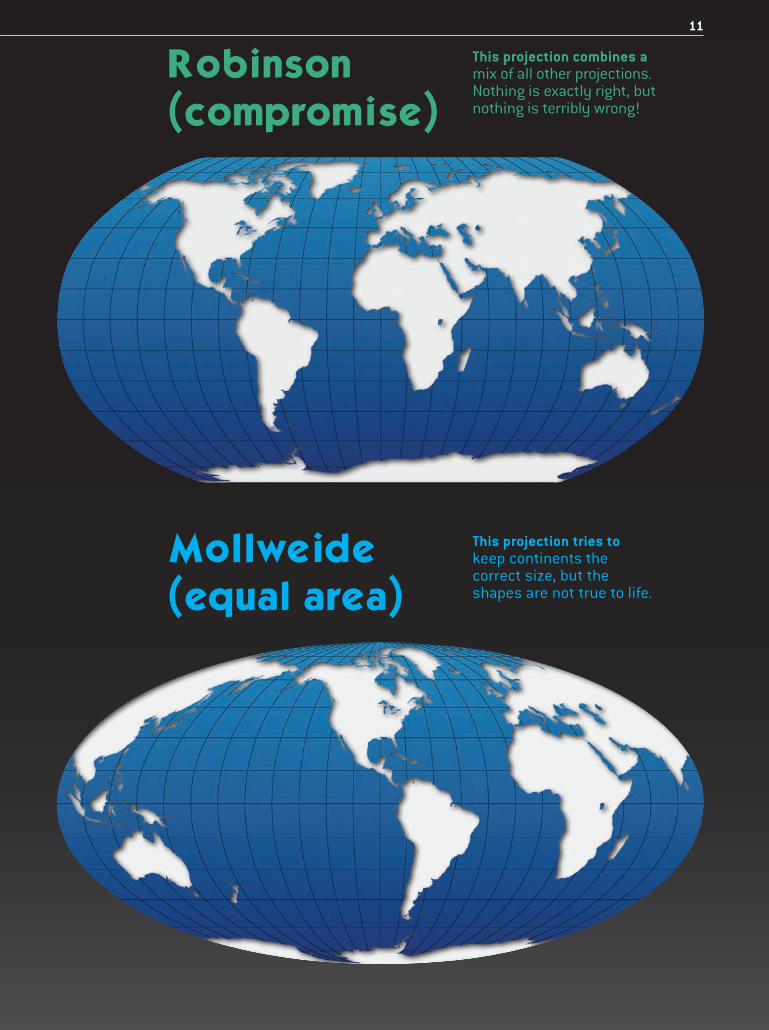
This projection combines a mix of all other projections. Nothing is exactly right, but nothing is terribly wrong!
Robinson (compromise)
This projection tries to keep continents the correct size, but the shapes are not true to life.
Mollweide (equal area)
mapping_our_world_10-11.indd 3 2/24/17 10:00 AM
12
0–7,100
Legend(population by county)
7,101–14,000
14,001–22,000
22,001–34,000
34,001–56,000
56,001–140,000
140,001–9,820,000
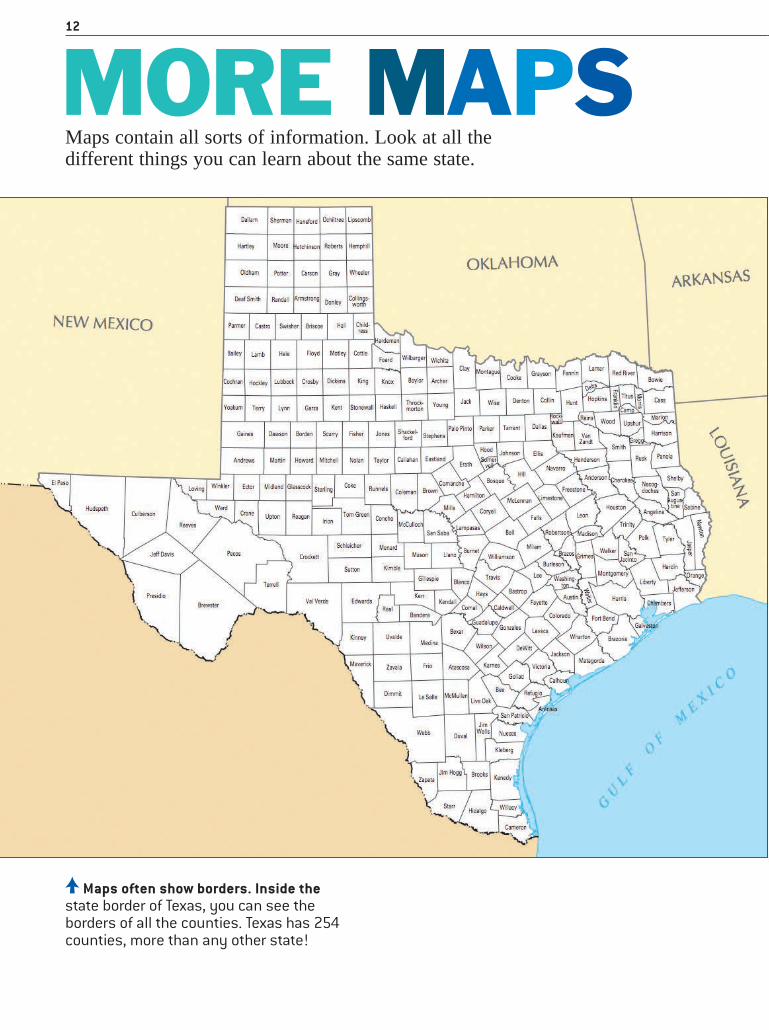
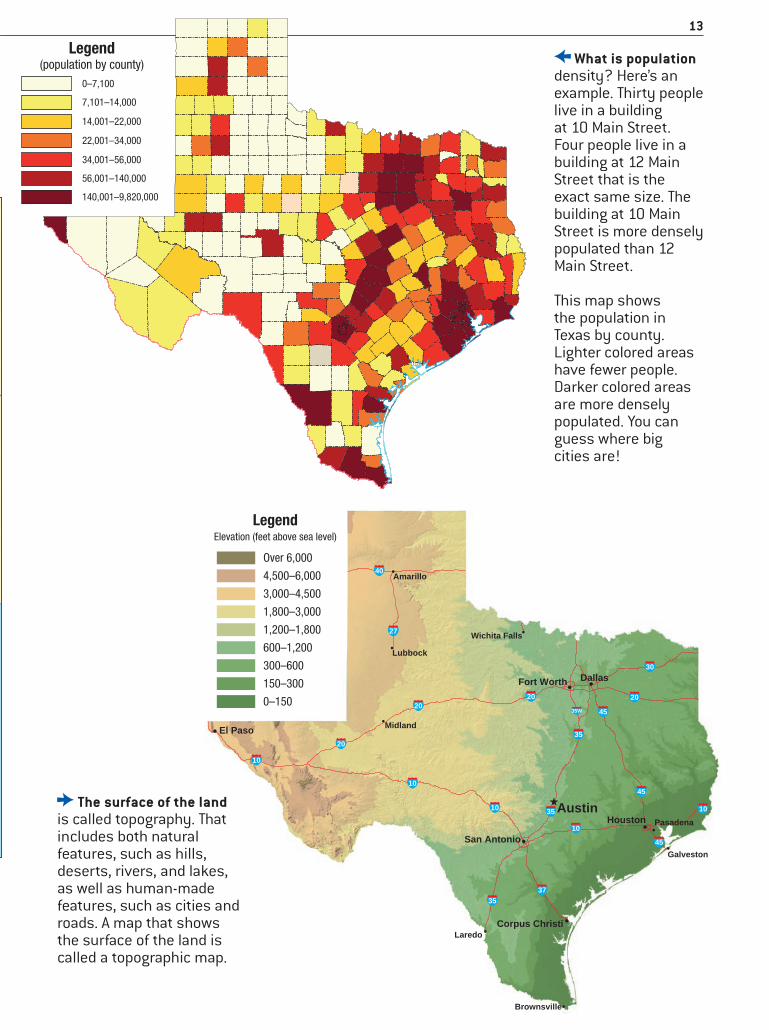
Maps contain all sorts of information. Look at all the different things you can learn about the same state.
Maps often show borders. Inside the state border of Texas, you can see the borders of all the counties. Texas has 254 counties, more than any other state!
MORE MAPS
mapping_our_world_12-13.indd 2 2/24/17 10:01 AM
13
0–7,100
Legend(population by county)
7,101–14,000
14,001–22,000
22,001–34,000
34,001–56,000
56,001–140,000
140,001–9,820,000
0–150
150–300
300–600
600–1,200
1,200–1,800
1,800–3,000
3,000–4,500
4,500–6,000
Over 6,000
Elevation (feet above sea level)
10
10
10
10
20
20 2020
27
30
35
35
35
35W
37
40
45
45
45
10Austin
Corpus Christi
Dallas
El Paso
Fort Worth
Houston
San Antonio
Amarillo
Lubbock
Pasadena
Brownsville
Galveston
Laredo
Midland
Wichita Falls
Legend
The surface of the land is called topography. That includes both natural features, such as hills, deserts, rivers, and lakes, as well as human-made features, such as cities and roads. A map that shows the surface of the land is called a topographic map.
What is populationdensity? Here’s an example. Thirty people live in a building at 10 Main Street. Four people live in a building at 12 Main Street that is the exact same size. The building at 10 Main Street is more densely populated than 12 Main Street.
This map shows the population in Texas by county. Lighter colored areas have fewer people. Darker colored areas are more densely populated. You can guess where big cities are!
mapping_our_world_12-13.indd 3 2/24/17 10:01 AM
14
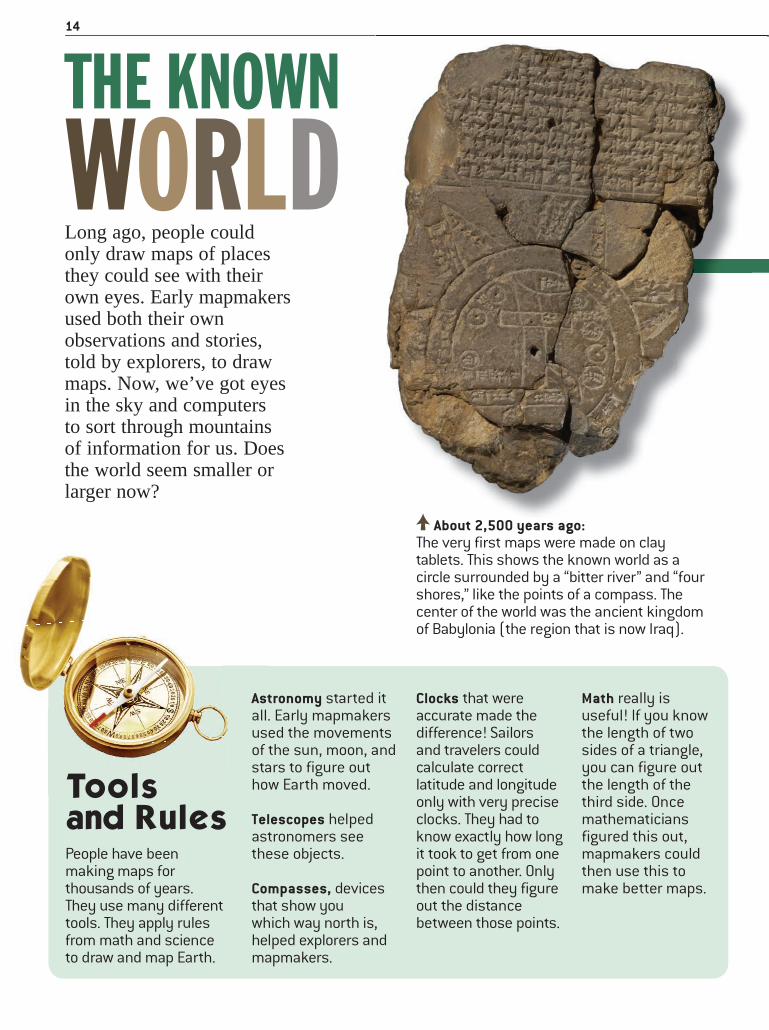
Long ago, people could only draw maps of places they could see with their own eyes. Early mapmakers used both their own observations and stories, told by explorers, to draw maps. Now, we’ve got eyes in the sky and computers to sort through mountains of information for us. Does the world seem smaller or larger now?
About 2,500 years ago: The very first maps were made on clay tablets. This shows the known world as a circle surrounded by a “bitter river” and “four shores,” like the points of a compass. The center of the world was the ancient kingdom of Babylonia (the region that is now Iraq).
Tools and Rules
Astronomy started it all. Early mapmakers used the movements of the sun, moon, and stars to figure out how Earth moved.
Telescopes helped astronomers see these objects.
Compasses, devices that show you which way north is, helped explorers and mapmakers.
Clocks that were accurate made the difference! Sailors and travelers could calculate correct latitude and longitude only with very precise clocks. They had to know exactly how long it took to get from one point to another. Only then could they figure out the distance between those points.
Math really is useful! If you know the length of two sides of a triangle, you can figure out the length of the third side. Once mathematicians figured this out, mapmakers could then use this to make better maps.
People have been making maps for thousands of years. They use many different tools. They apply rules from math and science to draw and map Earth.
THE KNOWN WORLD
mapping_our_world_14-15.indd 2 2/24/17 10:02 AM
15
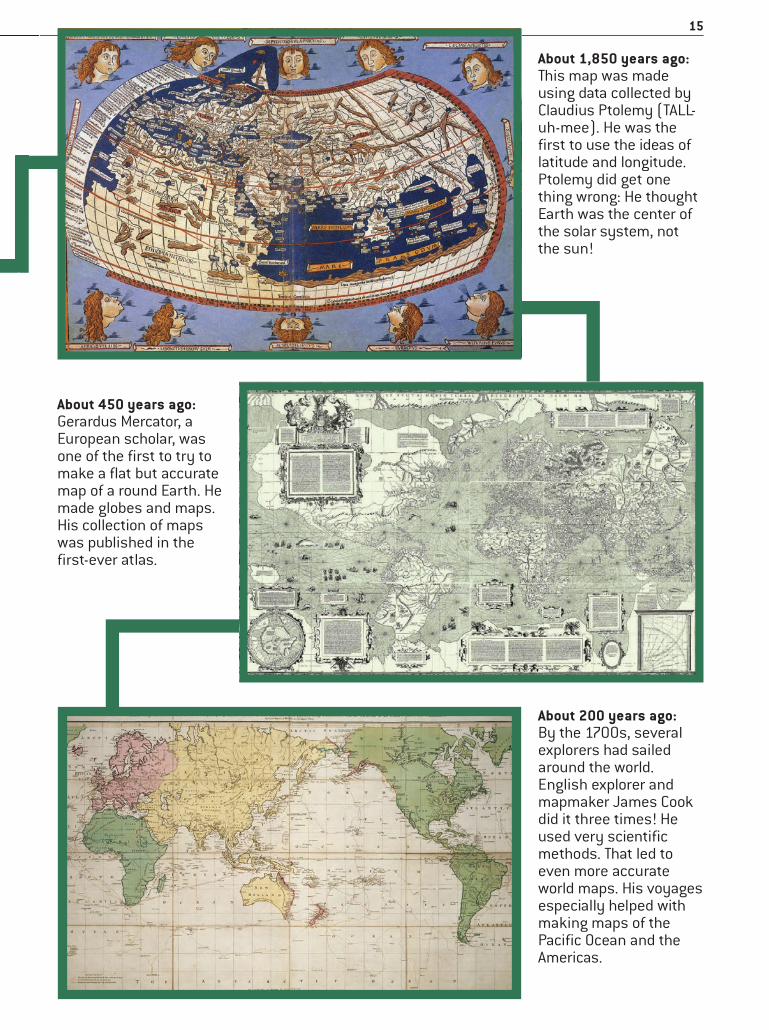
About 1,850 years ago:This map was made using data collected by Claudius Ptolemy (TALL-uh-mee). He was the first to use the ideas of latitude and longitude. Ptolemy did get one thing wrong: He thought Earth was the center of the solar system, not the sun!
About 450 years ago:Gerardus Mercator, a European scholar, was one of the first to try to make a flat but accurate map of a round Earth. He made globes and maps. His collection of maps was published in the first-ever atlas.
About 200 years ago:By the 1700s, several explorers had sailed around the world. English explorer and mapmaker James Cook did it three times! He used very scientific methods. That led to even more accurate world maps. His voyages especially helped with making maps of the Pacific Ocean and the Americas.
mapping_our_world_14-15.indd 3 2/24/17 10:02 AM
16
Lake Mead 1984
Lake Mead 2016
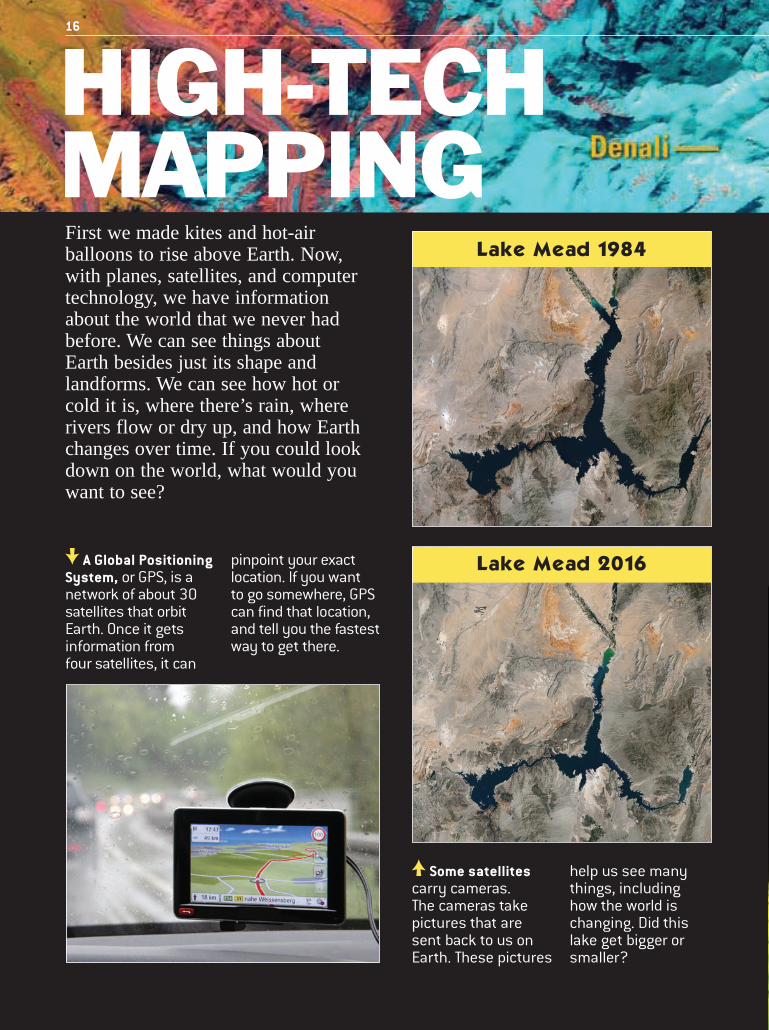
First we made kites and hot-air balloons to rise above Earth. Now, with planes, satellites, and computer technology, we have information about the world that we never had before. We can see things about Earth besides just its shape and landforms. We can see how hot or cold it is, where there’s rain, where rivers flow or dry up, and how Earth changes over time. If you could look down on the world, what would you want to see?
A Global Positioning System, or GPS, is a network of about 30 satellites that orbit Earth. Once it gets information from four satellites, it can
pinpoint your exact location. If you want to go somewhere, GPS can find that location, and tell you the fastest way to get there.
Some satellites carry cameras. The cameras take pictures that are sent back to us on Earth. These pictures
help us see many things, including how the world is changing. Did this lake get bigger or smaller?
HIGH-TECH MAPPING
mapping_our_world_16-17.indd 2 2/24/17 10:04 AM
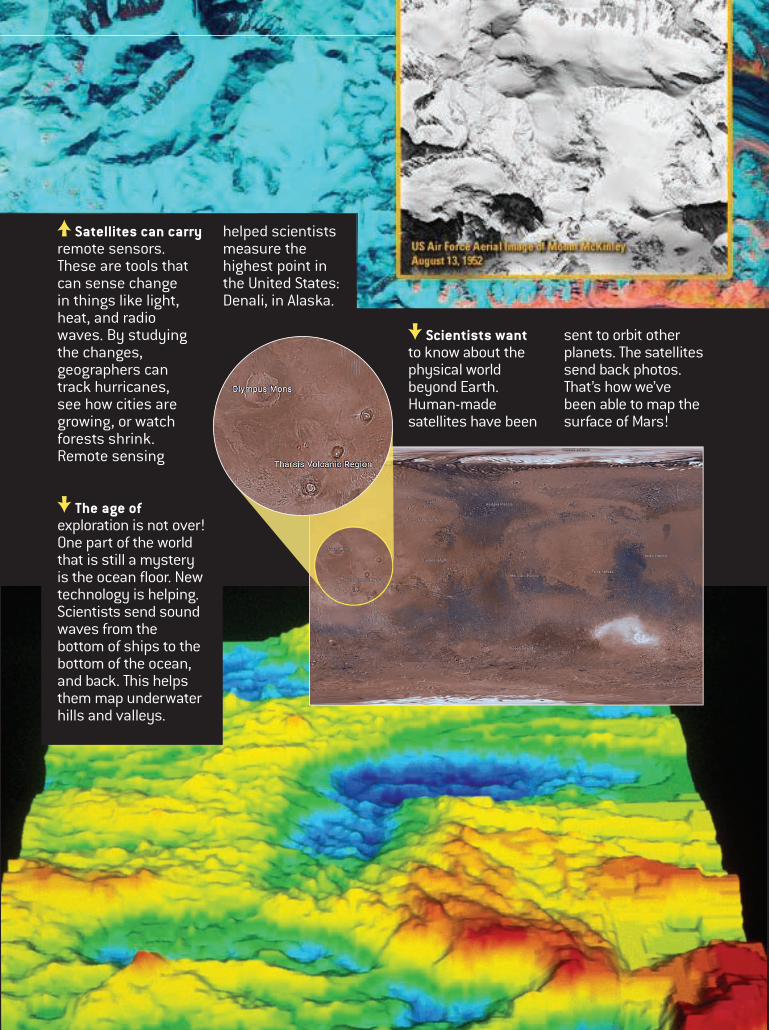
Satellites can carry remote sensors. These are tools that can sense change in things like light, heat, and radio waves. By studying the changes, geographers can track hurricanes, see how cities are growing, or watch forests shrink. Remote sensing
The age ofexploration is not over! One part of the world that is still a mystery is the ocean floor. New technology is helping. Scientists send sound waves from the bottom of ships to the bottom of the ocean, and back. This helps them map underwater hills and valleys.
Scientists wantto know about the physical world beyond Earth. Human-made satellites have been
sent to orbit other planets. The satellites send back photos. That’s how we’ve been able to map the surface of Mars!
helped scientists measure the highest point in the United States: Denali, in Alaska.
mapping_our_world_16-17.indd 3 2/24/17 10:04 AM
18
Activities
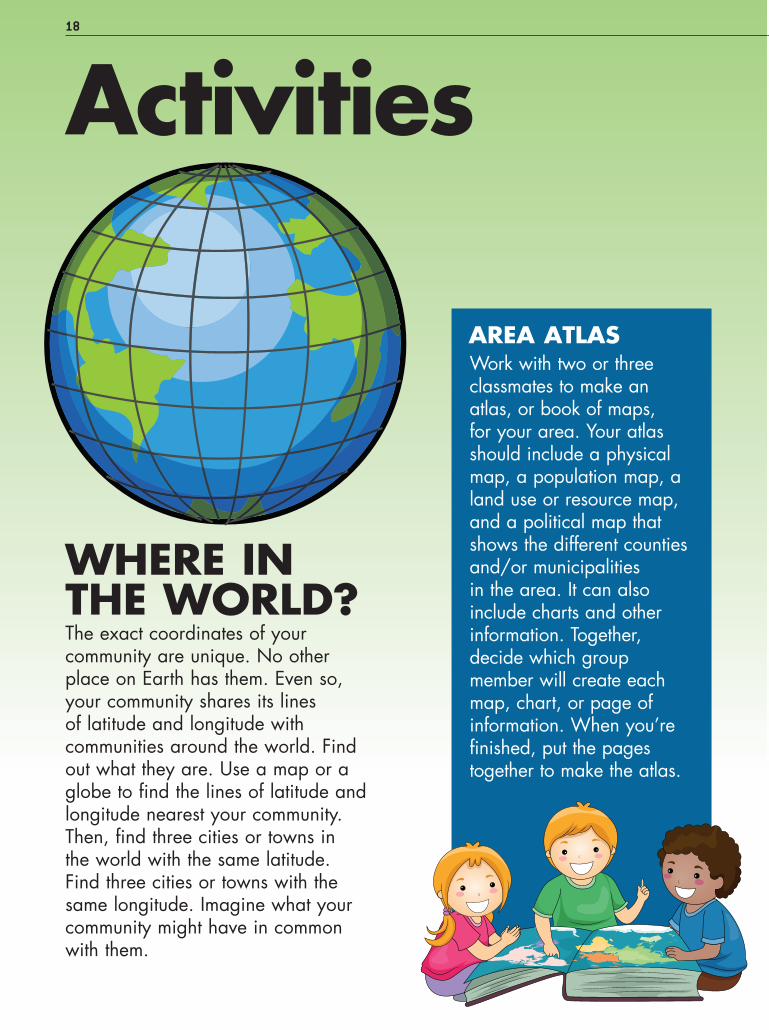
The exact coordinates of your community are unique. No other place on Earth has them. Even so, your community shares its lines of latitude and longitude with communities around the world. Find out what they are. Use a map or a globe to find the lines of latitude and longitude nearest your community. Then, find three cities or towns in the world with the same latitude. Find three cities or towns with the same longitude. Imagine what your community might have in common with them.
Work with two or three classmates to make an atlas, or book of maps, for your area. Your atlas should include a physical map, a population map, a land use or resource map, and a political map that shows the different counties and/or municipalities in the area. It can also include charts and other information. Together, decide which group member will create each map, chart, or page of information. When you’re finished, put the pages together to make the atlas.
WHERE IN THE WORLD?
AREA ATLAS
Mapping_our_World_18-19.indd 18 2/24/17 10:05 AM
19
HSS 3.1 Students describe the physical and human geography and use maps, tables, graphs, photographs, and charts to organize information about people, places, and environ-ments in a spatial context.
Historical and Social Sciences Analysis Skills
Chronological and Spatial Thinking4. Students use map and globe skills to determine the absolute locations of places and interpret information available through a map’s or globe’s legend, scale, and symbolic representations.
Historical Interpretation2. Students identify the human and physical characteristics of the places they are studying and explain how those features form the unique character of those places.
CALIFORNIA STANDARDS
• There are many kinds of maps with many different uses, such as trail maps, weather maps, and physical maps.
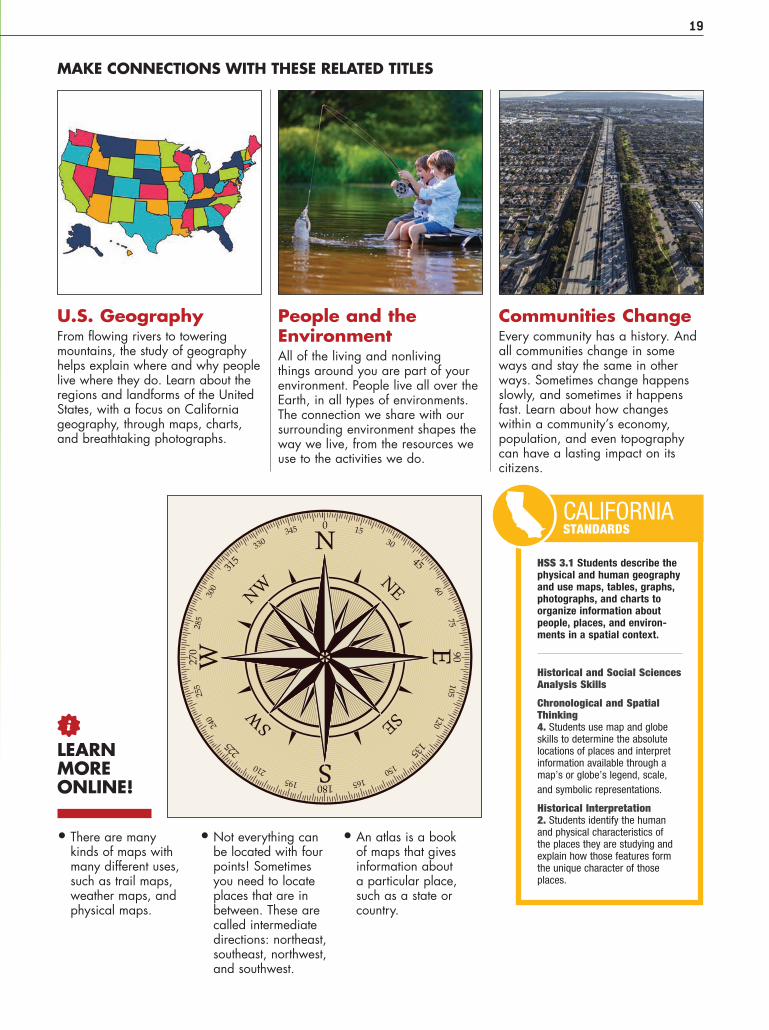
• Not everything can be located with four points! Sometimes you need to locate places that are in between. These are called intermediate directions: northeast, southeast, northwest, and southwest.
• An atlas is a book of maps that gives information about a particular place, such as a state or country.
U.S. GeographyFrom flowing rivers to towering mountains, the study of geography helps explain where and why people live where they do. Learn about the regions and landforms of the United States, with a focus on California geography, through maps, charts, and breathtaking photographs.
People and the EnvironmentAll of the living and nonliving things around you are part of your environment. People live all over the Earth, in all types of environments. The connection we share with our surrounding environment shapes the way we live, from the resources we use to the activities we do.
Communities ChangeEvery community has a history. And all communities change in some ways and stay the same in other ways. Sometimes change happens slowly, and sometimes it happens fast. Learn about how changes within a community’s economy, population, and even topography can have a lasting impact on its citizens.
LEARN MORE ONLINE!
MAKE CONNECTIONS WITH THESE RELATED TITLES
AREA ATLAS
Mapping_our_World_18-19.indd 19 2/24/17 10:05 AM
hmhco.com
GRADE 3 TITLES
3 1686928
Mapping Our World
U.S. Geography
People and the Environment
Protecting Resources
The First People
Settling the Land
Communities Change
Role of Citizens
How America Works
America: Heritage and Culture
Producers and Consumers
Saving and Spending
On the Cover: This spectacular “blue marble” image is the most detailed true-color image of the entire Earth to date. NASA Goddard Space Flight Center: Reto Stöckli.
Picture Credits: Alamy: Natural History Museum, London: p.15 bottom right (Cook world map, 1784). British Museum, London: p.14 top right (Babylonian tablet map). Getty Images: Thinkstock: p.5 top right (Los Angeles freeways). Granger Collection, NYC: p.15 top left (Ptolemy world map). NASA: Earth Observatory: Joshua Stevens: p.16 right (Lake Mead comparison); JPL: p.17 middle right (map of Mars); NASA Goddard Space Flight Center: pp.4–5 (Earth from space). Public Domain: p.15 center (Mercator world map, 1569). Science Source: p.17 bottom right (midocean ridge). Shutterstock: Alpha_7D: p.19 top left (map of United States); Billion Photos: p.14 bottom left (compass); BlueRingMedia: p.18 top (globe); Chris Parypa Photography: p.9 top right (U.S. Capitol); design56: p.4 top right (plastic globe); Lorelyn Medina: p.18 bottom (kids making an atlas); Maleo: p.16 bottom left (GPS navigation); Orgus88: p.19 bottom (vintage compass); Rvector: p.5 top left (simple globe); Tatiana Bobkova: p.19 top center (kids fishing); Trekandshoot: p.19 top right (San Diego freeway). U.S. Geological Survey: pp.16–17 top (Denali, Alaska); The National Atlas of the United States of America: p.12 and p.13 top left (maps of Texas counties).
Original Illustrations:Brobel Design: Maps: Close Enough!, pp.2–3, Los Angeles Freeway, p.5 bottom, Globe, p.8, Map of New York State, p.9, Texas Elevation Map, p.13.
Michael Kline Illustration: Earth to You, p.2; Spot On!, p.3; Cartoon Faces, p.2, p.3; Crazy Days Amusement Park, pp.6–7, p.9, Ladder of Latitude, p.8.
Wood Ronsaville Harlin, Inc.: Maps: Mercator, Robinson, Mollweide, pp.10–11.
Editor: Jennifer DixonArt Direction: Brobel DesignDesigners: Ian Brown, Ed Gabel, David Ricculli, Jeremy RechPhoto Research: Ted Levine, Elisabeth Morgan Activities Writer: Marjorie FrankProofreader: Margaret Mittelbach
Fact-Checker: David Stienecker
Author: Melissa KimAuthor Team Lead: Mary Pearce
President and CEO: Ted LevineChairman and Founder: Mark Levine
If you have received these materials as examination copies free of charge, Houghton Mifflin Harcourt Publishing Company retains title to the materials and they may not be resold. Resale of examination copies is strictly prohibited.
Possession of this publication in print format does not entitle users to convert this publication, or any portion of it, into electronic format.
Copyright © by Kids Discover, LLC
All rights reserved. No part of this work may be reproduced or transmitted in any form or by any means, electronic or mechanical, including photocopying or recording, or by any information storage or retrieval system, without the prior written permission of the copyright owner unless such copying is expressly permitted by federal copyright law. Requests for permission to make copies of any part of the work should be submitted through our Permissions website at https://customercare.hmhco.com/contactus/Permissions.html or mailed to Houghton Mifflin Harcourt Publishing Company, Attn: Intellectual Property Licensing, 9400 Southpark Center Loop, Orlando, Florida 32819-8647.
Printed in the U.S.A.
ISBN 978-1-328-79948-7 1 2 3 4 5 6 7 8 9 10 XXXX 26 25 24 23 22 21 20 19 18 17
4500000000 A B C D E F G
Mapping_our_World_BC.indd 2 2/24/17 9:05 AM