OUR M&A PERSPECTIVE ON THE GLOBAL INFRASTRUCTURE …
17
Contents Introduction 3 Sector Overview 4 Sector Trends 10 Transactions 24 Investor Landscape 30 US Perspective 44 IMAP International M&A Partners IMAP INSIGHTS FEBRUARY 2021 OUR M&A PERSPECTIVE ON THE GLOBAL INFRASTRUCTURE SECTOR
Transcript of OUR M&A PERSPECTIVE ON THE GLOBAL INFRASTRUCTURE …
C o n t e n t s
Introduction 3
Sector Overview 4
Sector Trends 10
Transactions 24
Investor Landscape 30
US Perspective 44IMAP
International M&A Partners
IMAP INSIGHTS F E B R U A R Y 2 0 2 1
OUR M&A PERSPECTIVE ON THE GLOBAL
INFRASTRUCTURE SECTOR

INTRODUCTION
As a result of the COVID pandemic it is highly likely we will see large public
expenditure in infrastructure in the Energy and Transport sub-sectors, which historically have been the most active, yet as they have matured have seen deal growth stall. Nowadays, the big winners are new sub-sectors such as Digital and Social, which are seeing increasing global appetite for infrastructure. Furthermore, transactions involving digital infrastructure are benefitting from tremendous tailwinds amid the continued penetration of cloud service providers, resulting in traditional deals becoming less frequent.
We expect the infrastructure sector to remain vibrant, as governments try to bridge the infra gap that has been generated by the recent global underinvestment in infrastructure. Significant dry powder reserves and strong competition are pushing up asset prices and depressing projected returns, which may be preventing deal flow for more opportunistic investors. Nonetheless, the US and Europe seem to be gearing up to carry out massive infrastructure investments from 2021 onwards to deal with the global pandemic, which can bring new greenfield opportunities to the market.
We have seen little change in investor mix-up, with pension funds retaining their role as the largest investors. Foundations, insurance companies and banks are the next largest categories. We are however, seeing the surge of «Godzilla» sized funds, as well-known fund managers seek to break records by raising close to USD 20 billion for their latest vehicles, with many trying to avoid the trend of LP’s becoming competitors.
SERGIO MILIC
ENRIQUE VARGAS
GONÇALO VAZ BOTELHO
BILL SPRAGUE
IMAP global Infrastructure Sector Leaders: Gonçalo Vaz Botelho, Bill Sprague, Enrique Vargas and Sergio Milic look at the current state of the Infrastructure sector and why it’s necessary for governments to continue to try to bridge the infrastructure gap generated by recent global underinvestment. They detail the trends impacting the M&A landscape now and moving forward and identify the key market players and investors. They also share insights on the unique characteristics of the US Infrastructure market.
32
OUR M&A PERSPECTIVE ON THE GLOBAL INFRASTRUCTURE SECTOR
IMAP
Transportation
Power, Utilities & Networks
Digital Infrastructure
Social Infrastructure
4 SECTOR OVERVIEW
IMAP
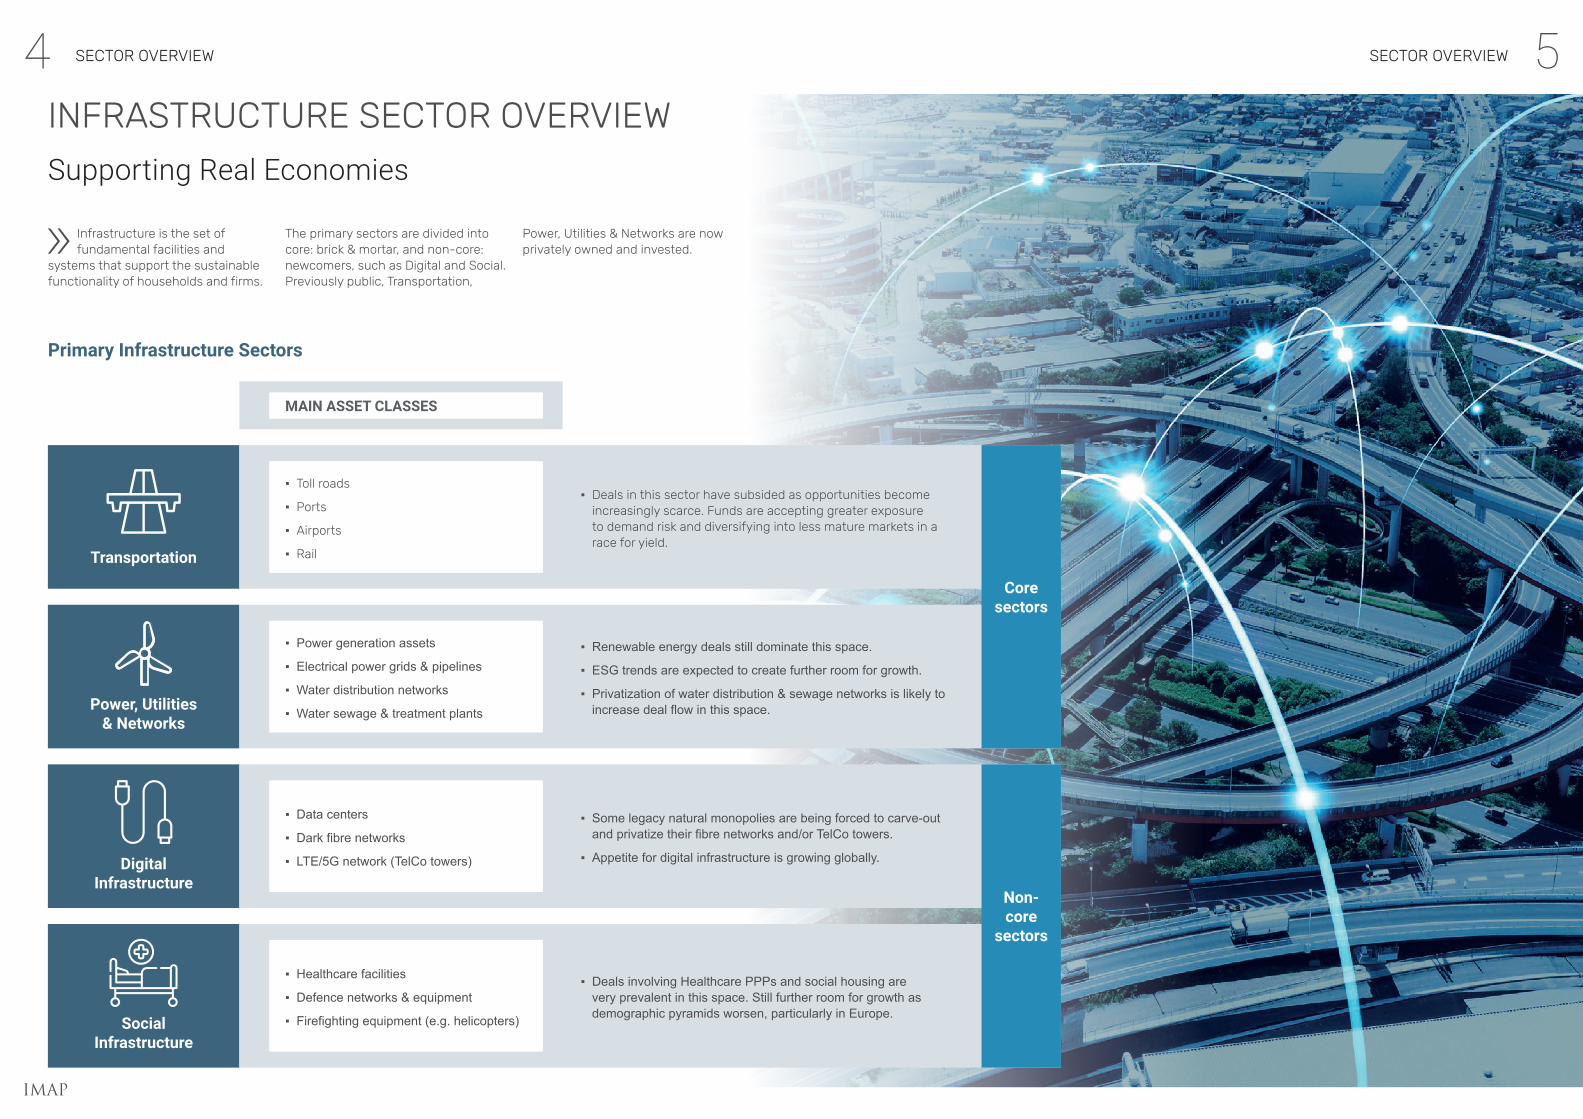
INFRASTRUCTURE SECTOR OVERVIEW
Supporting Real Economies
Infrastructure is the set of fundamental facilities and
systems that support the sustainable functionality of households and firms.
Primary Infrastructure Sectors
The primary sectors are divided into core: brick & mortar, and non-core: newcomers, such as Digital and Social. Previously public, Transportation,
Power, Utilities & Networks are now privately owned and invested.
▪ Deals in this sector have subsided as opportunities become increasingly scarce. Funds are accepting greater exposure to demand risk and diversifying into less mature markets in a race for yield.
▪ Renewable energy deals still dominate this space.
▪ ESG trends are expected to create further room for growth.
▪ Privatization of water distribution & sewage networks is likely to increase deal flow in this space.
▪ Some legacy natural monopolies are being forced to carve-out and privatize their fibre networks and/or TelCo towers.
▪ Appetite for digital infrastructure is growing globally.
▪ Deals involving Healthcare PPPs and social housing are very prevalent in this space. Still further room for growth as demographic pyramids worsen, particularly in Europe.
▪ Toll roads
▪ Ports
▪ Airports
▪ Rail
▪ Power generation assets
▪ Electrical power grids & pipelines
▪ Water distribution networks
▪ Water sewage & treatment plants
▪ Data centers
▪ Dark fibre networks
▪ LTE/5G network (TelCo towers)
▪ Healthcare facilities
▪ Defence networks & equipment
▪ Firefighting equipment (e.g. helicopters)
MAIN ASSET CLASSES
Coresectors
Non-core
sectors
5SECTOR OVERVIEW
76 SECTOR OVERVIEW SECTOR OVERVIEW
IMAP
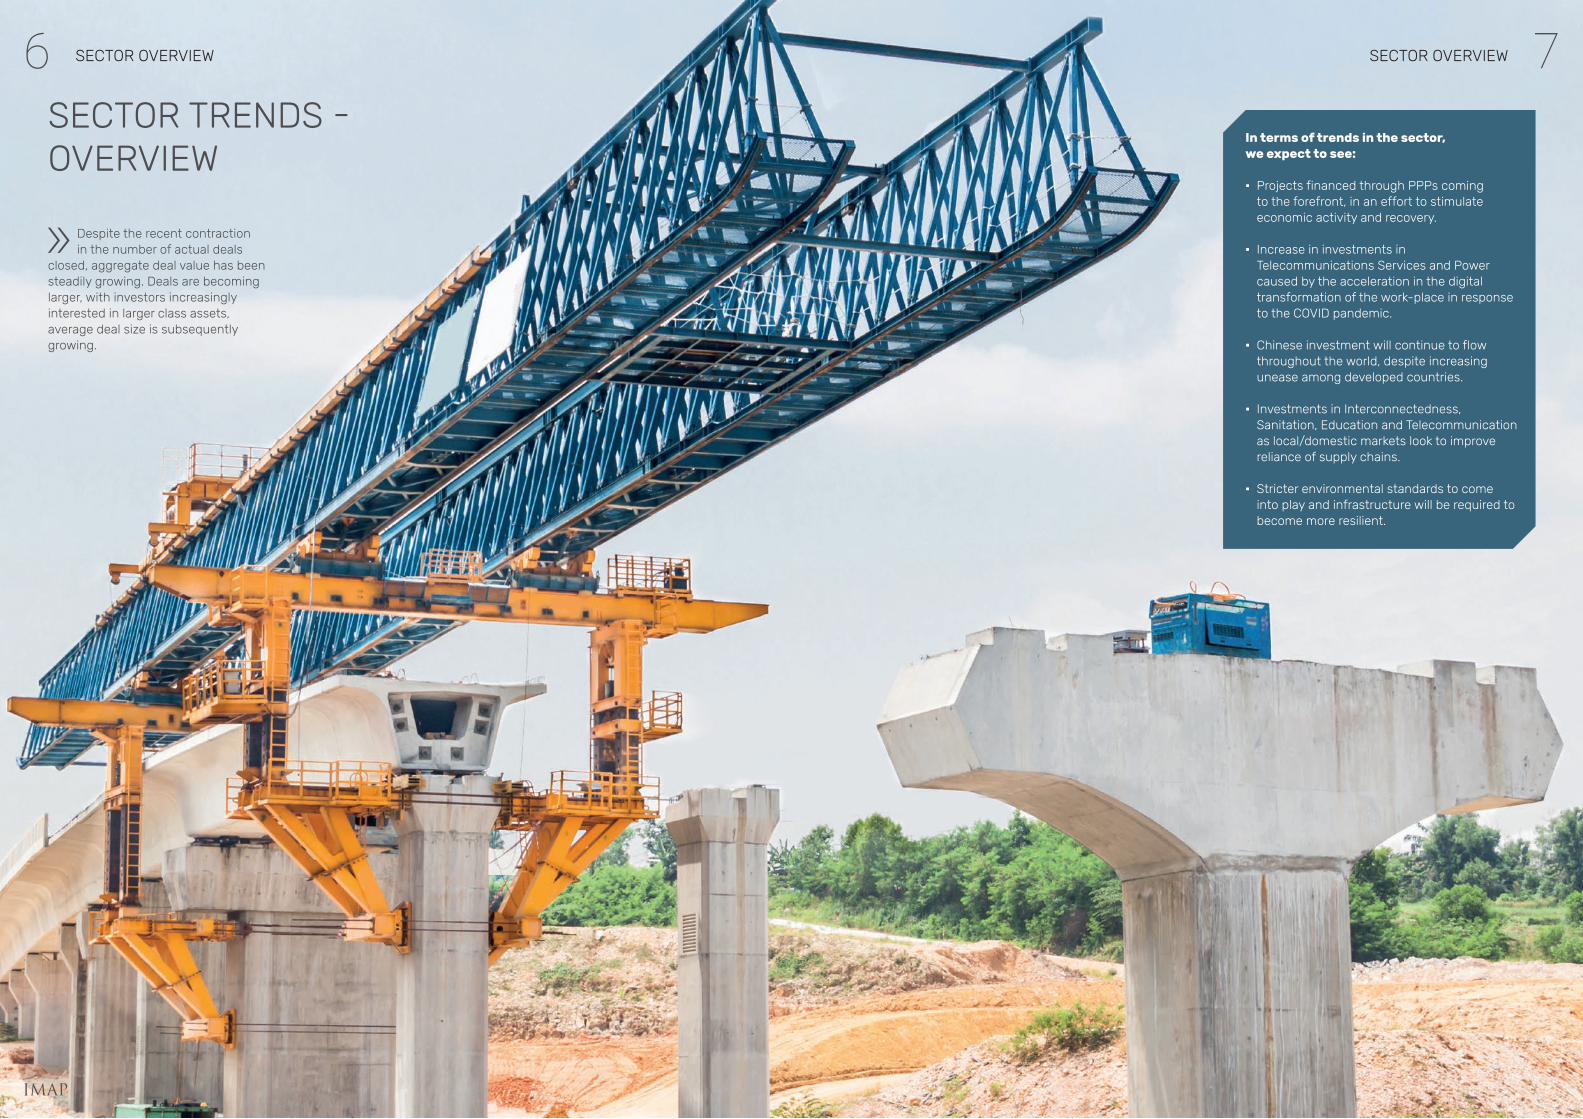
SECTOR TRENDS - OVERVIEW
Despite the recent contraction in the number of actual deals
closed, aggregate deal value has been steadily growing. Deals are becoming larger, with investors increasingly interested in larger class assets, average deal size is subsequently growing.
In terms of trends in the sector, we expect to see:
▪ Projects financed through PPPs coming to the forefront, in an effort to stimulate economic activity and recovery.
▪ Increase in investments in Telecommunications Services and Power caused by the acceleration in the digital transformation of the work-place in response to the COVID pandemic.
▪ Chinese investment will continue to flow throughout the world, despite increasing unease among developed countries.
▪ Investments in Interconnectedness, Sanitation, Education and Telecommunication as local/domestic markets look to improve reliance of supply chains.
▪ Stricter environmental standards to come into play and infrastructure will be required to become more resilient.

98 SECTOR TRENDS SECTOR TRENDS
IMAP
PPPS AS MECHANISM TO STIMULATE ECONOMIC ACTIVITY AND RECOVERY
Projects financed through PPPs will come to the forefront, as a key ingredient in government efforts to use infrastructure as a “recovery” sector.
Mechanism Challenges PPPs in the Future
The current pandemic presents challenges to the 2 alternatives under which PPPs have been traditionally structured
Governments will need to act much more tactically to attract private capital
Infrastructure capital gap will widen
Less leveraged structures
Contingent guarantees
Blended finance
Demand-Based-Projects
TrafficRisk
Difficult to financeNo Government balance
needed
Availability-Based-Projects
Mitigated Traffic-Risk
Reduced financing riskGovernment balance needed
1110 SECTOR TRENDS SECTOR TRENDS
IMAP
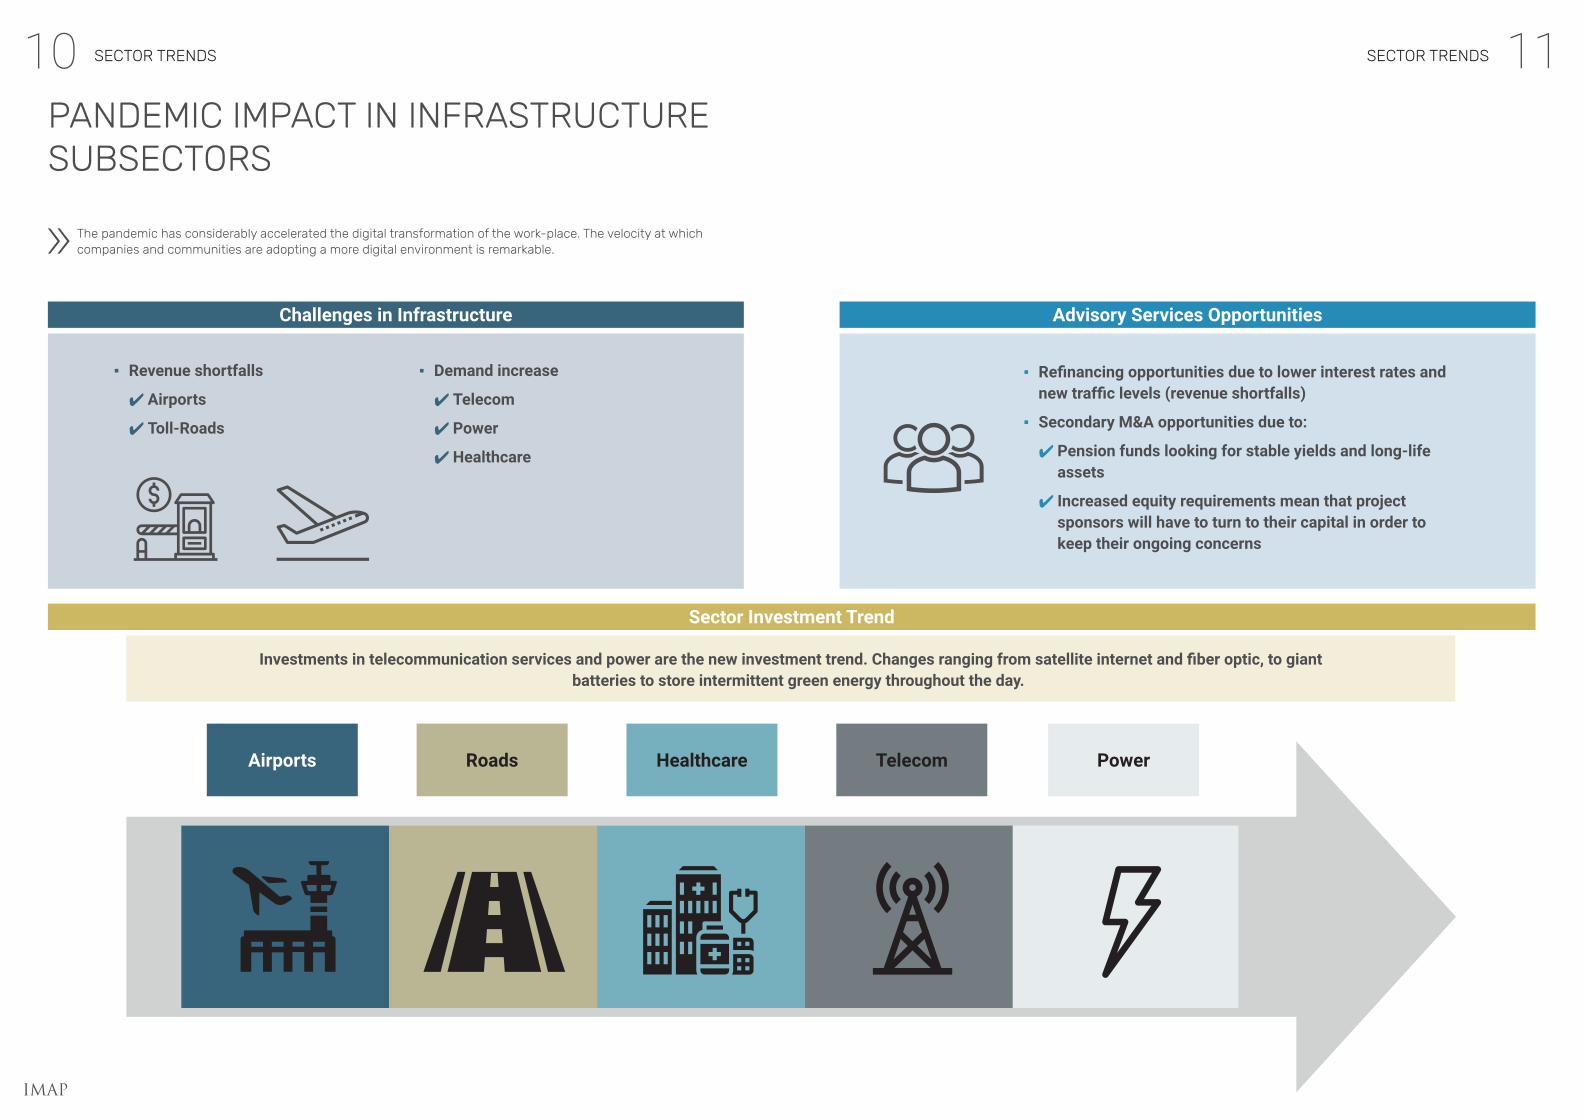
PANDEMIC IMPACT IN INFRASTRUCTURE SUBSECTORS
Airports Roads Healthcare Telecom Power
The pandemic has considerably accelerated the digital transformation of the work-place. The velocity at which companies and communities are adopting a more digital environment is remarkable.
Challenges in Infrastructure Advisory Services Opportunities
Sector Investment Trend
▪ Refinancing opportunities due to lower interest rates and new traffic levels (revenue shortfalls)
▪ Secondary M&A opportunities due to:
4 Pension funds looking for stable yields and long-life assets
4 Increased equity requirements mean that project sponsors will have to turn to their capital in order to keep their ongoing concerns
Investments in telecommunication services and power are the new investment trend. Changes ranging from satellite internet and fiber optic, to giant batteries to store intermittent green energy throughout the day.
▪ Revenue shortfalls
4 Airports
4 Toll-Roads
▪ Demand increase
4 Telecom
4 Power
4 Healthcare

1312 SECTOR TRENDS SECTOR TRENDS
IMAP
CHINESE INVESTMENT WILL CONTINUE TO FLOW THROUGHOUT THE WORLD
Chinese investment, based on the ”Belt and Road” initiative, has been a relevant player in infrastructure investing over the last decade. However, there are increasing sign of uneasiness among developed countries concerning safety
issues, especially for Core+ and Non-Core, so the question is, will this investment be welcome?
SAMPLE OF RECENT CHINESE TRANSACTIONS
Huawei 5G Networks
Europe
Port of Ambarli
(Kumport)
NuclearFacilities
Bogotá’s Subway
Water Utility Company
Compañía General de Electricidad
de Chile
Lagos Light- Rail Mass
Transit
Port of Melbourne
Oil Pipeline
Developed CountriesDeveloping Countries
1514 SECTOR TRENDS SECTOR TRENDS
IMAP
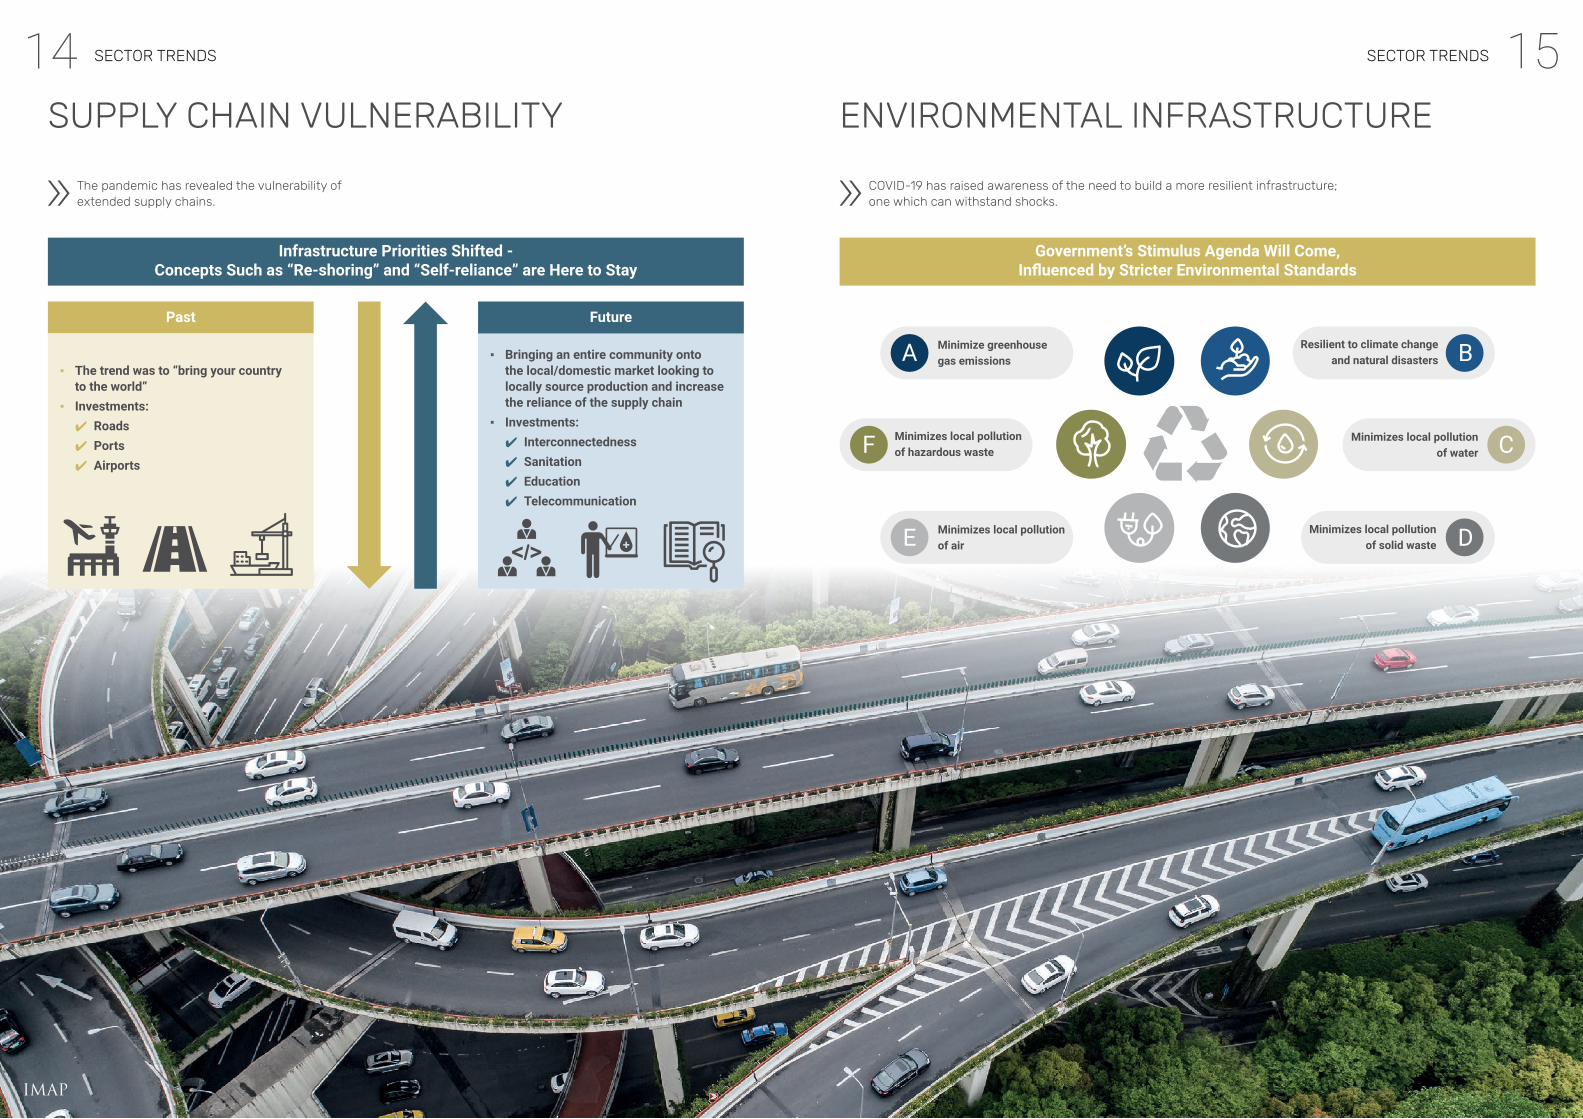
SUPPLY CHAIN VULNERABILITY ENVIRONMENTAL INFRASTRUCTURE
The pandemic has revealed the vulnerability of extended supply chains.
COVID-19 has raised awareness of the need to build a more resilient infrastructure; one which can withstand shocks.
Infrastructure Priorities Shifted - Concepts Such as “Re-shoring” and “Self-reliance” are Here to Stay
Past
▪ The trend was to “bring your country to the world”
▪ Investments:4 Roads4 Ports4 Airports
▪ Bringing an entire community onto the local/domestic market looking to locally source production and increase the reliance of the supply chain
▪ Investments:4 Interconnectedness 4 Sanitation 4 Education 4 Telecommunication
Future
Government’s Stimulus Agenda Will Come, Influenced by Stricter Environmental Standards
Minimize greenhouse gas emissionsA
Minimizes local pollution of hazardous wasteF
Minimizes local pollution of airE
Resilient to climate change and natural disasters B
Minimizes local pollution of water C
Minimizes local pollution of solid waste D

1716 TRANSACTIONS TRANSACTIONS
IMAP
IDIOSYNCRASIES OF AN INFRASTRUCTURE TRANSACTION
MOST COMMON TYPE OF INFRASTRUCTURE DEAL
Historically the most active infrastructure sub-sectors have
been Energy and Transport, but as these sectors mature, deal growth
has stalled in this space and new sectors such as Digital infrastructure are becoming increasingly in vogue. Due to COVID however, it’s highly likely
there will be large public expenditure in infrastructure in the Energy and Transport sectors.
Global Infrastructure Deals by Industry 2015-2019
Source: Preqin Pro and IMAP calculations
▪ Overall deal activity has fallen by 21% since its peak in 2016.
▪ The bulk of investment is still concentrated in the 2 most traditional infra sectors: Transport and Power, Utilities & Networks.
▪ Traditional infra deals are becoming less frequent, as opposed to transactions involving digital infrastructure, which are benefiting from tremendous tailwinds amid the continued penetration of cloud service providers.
77% deals in Power, Utilities & Networks
3500
3000
2500
2000
1500
1000
500
02015 2016 2017 2018 2019
Renewable Energy Conventional Energy Utilities
Transport Telecoms Social
Other
Infrastructure transactions have some particularities that differ slightly from those of a normal M&A transaction.
Clients fall into 3 main categories:
End-investors willing to invest directly in a project/asset.
Infra funds that raise funds from end-investors and pool them into projects/assets.
Strategic sector players that are specialized in a specific infrastructure category.
Recent market trends have seen end-investors developing in-house infra teams and by-passing infra funds, investing directly in projects/assets,
which are typically either greenfields (unbuilt) or brownfields (in operation) and, may or may not, be exposed to market risk.
Publicly-backed projects’ revenues are usually directly related to regulatory regimes, and generally fall into one of multiple contractual frameworks, e.g. PPPs, Concessions, Grants and inter alia - financial models tend to be contractual pieces in PPPs & Concessions. Privately-backed projects on the other hand, usually involve contracted assets, with a significant portion of revenues tied to long-term contracts with blue-chip private companies. These assets
often have a maturity (concession term), which makes the terminal value dependant on the probability of concession renewal and they are normally capital-heavy/intensive.
Given the recent decline in public benchmark debt yields in most OECD countries, current transactions usually involve some sort of refinancing to optimize the financial costs of the asset and infra leverage ratios typically exceed that of other assets, making equity yields heavily sensitive to financing/refinancing outcomes. Furthermore, due to the amount of leverage that these assets accept, advisor fees are usually calculated on an equity basis.
1918 INVESTOR LANDSCAPE INVESTOR LANDSCAPE
IMAP
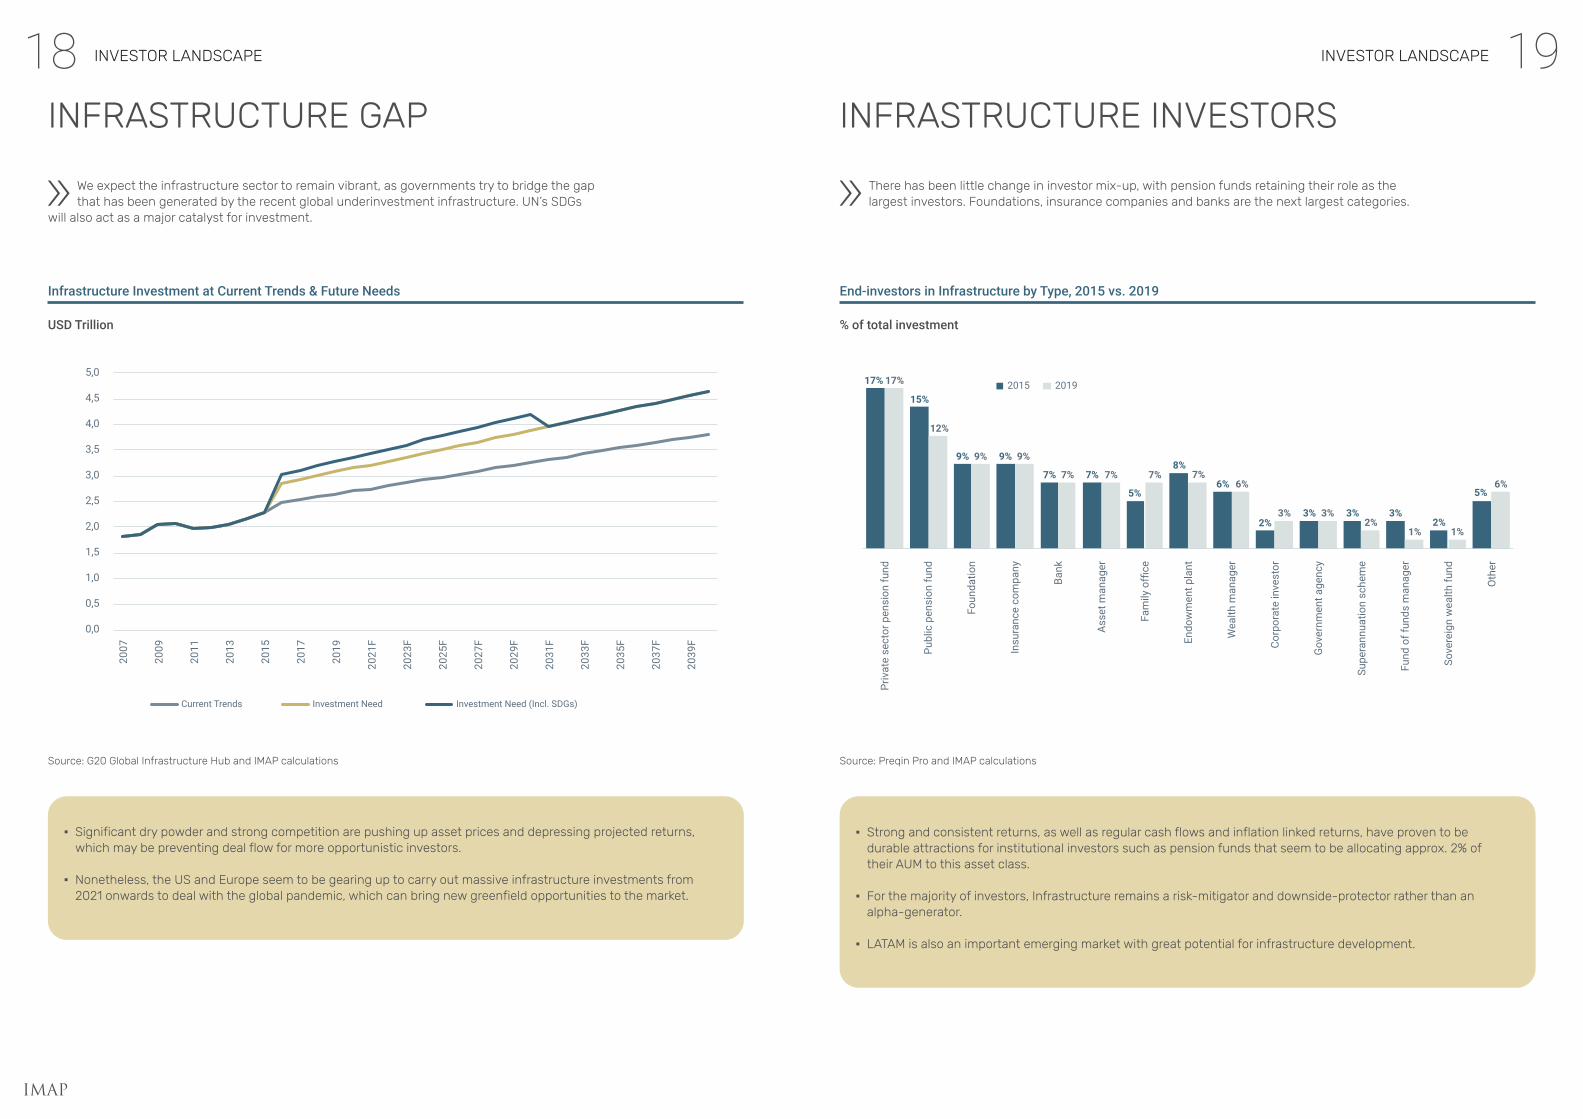
INFRASTRUCTURE GAP INFRASTRUCTURE INVESTORS
We expect the infrastructure sector to remain vibrant, as governments try to bridge the gap that has been generated by the recent global underinvestment infrastructure. UN’s SDGs
will also act as a major catalyst for investment.
There has been little change in investor mix-up, with pension funds retaining their role as the largest investors. Foundations, insurance companies and banks are the next largest categories.
Infrastructure Investment at Current Trends & Future Needs End-investors in Infrastructure by Type, 2015 vs. 2019
USD Trillion % of total investment
Source: G20 Global Infrastructure Hub and IMAP calculations Source: Preqin Pro and IMAP calculations
▪ Significant dry powder and strong competition are pushing up asset prices and depressing projected returns, which may be preventing deal flow for more opportunistic investors.
▪ Nonetheless, the US and Europe seem to be gearing up to carry out massive infrastructure investments from 2021 onwards to deal with the global pandemic, which can bring new greenfield opportunities to the market.
▪ Strong and consistent returns, as well as regular cash flows and inflation linked returns, have proven to be durable attractions for institutional investors such as pension funds that seem to be allocating approx. 2% of their AUM to this asset class.
▪ For the majority of investors, Infrastructure remains a risk-mitigator and downside-protector rather than an alpha-generator.
▪ LATAM is also an important emerging market with great potential for infrastructure development.
Current Trends Investment Need Investment Need (Incl. SDGs)
5,0
4,5
4,0
3,5
3,0
2,5
2,0
1,5
1,0
0,5
0,0
2007
2009
2011
2013
2015
2017
2019
2021
F
2023
F
2025
F
2027
F
2029
F
2031
F
2033
F
2035
F
2037
F
2039
F
201517% 17%
15%
12%
9% 9%9% 9%
7% 7%
5%
8%
6%
2%3% 3% 3%
2%
5%
7% 7% 7% 7%6%
3% 3%2%
1% 1%
6%
2019
Priv
ate
sect
or p
ensi
on fu
nd
Publ
ic p
ensi
on fu
nd
Foun
datio
n
Insu
ranc
e co
mpa
ny
Bank
Asse
t man
ager
Fam
ily o
ffice
Endo
wm
ent p
lant
Wea
lth m
anag
er
Corp
orat
e in
vest
or
Gov
ernm
ent a
genc
y
Supe
rann
uatio
n sc
hem
e
Fund
of f
unds
man
ager
Sove
reig
n w
ealth
fund
Oth
er

2120 INVESTOR LANDSCAPE INVESTOR LANDSCAPE
IMAP
LARGEST INFRASTRUCTURE END-INVESTORS
INFRASTRUCTURE FUNDS – THE ALTERNATIVE TO DIRECT ASSET INVESTMENTS
▪ While allocations to Infrastructure investments are at all-time highs, this capital is largely flowing to a small group of large fund managers.
▪ Open-ended funds have been steadily growing and are the unsung heroes of the Infrastructure fund space, gaining momentum over other fund classes.
End-investors are channelling larger portions of their AUMs to
the infra sector, via a mix of direct project investments and/or capital We are now seeing the surge
of «Godzilla» sized funds, as well-known fund managers seek
calls into infra funds. Direct asset purchases made by end-investors are becoming more common as those long in cash are both willing and have to break records by raising close
to USD 20 billion for their latest vehicles – with many trying to
the capacity to aggressively target and close large deals. With low interest rates, infra investments have become more attractive. avoid the trend of LP’s becoming
competitors.
Source: Infrastructure Investor Global Summit, Mergermarket & IMAP
Source: IPE Real Assets – July 2019 & IMAP
Largest institutional investors by committal
to the asset class
With more than USD 10 billion committed to
infra
Institution Name Country Estimated Infra Allocation (%)
Infra AUM ($M) Main Sector Focus
CPP Investment Board Canada 11.89% 34,928.10Power, utilities & network
(PU&N)
Abu Dhabi Investment Authority UAE 3.00% 24,840.00 Unstated
National Pension Service of Korea South Korea 3.57% 20,452.30 Transportation, PU&N
Allianz Capital Partners GmbH Germany 51.38% 16,718.90 All
CDPQ Canada 7.35% 16,666.90All w/ growing focus on ESG
projects
China Investment Corporation China 1.60% 15,000.00 All
APG Asset Management Netherlands 2.56% 14,371.10 Transportation, PU&N, Social
Ontario Teachers’ Pension Plan Canada 9.50% 13,305.50 Transportation, PU&N, Social
OMERS Canada 18.20% 12,938.70 Transportation, PU&N
PSP Investments Canada 10.00% 12,592.10Power, utilities & network
(PU&N)
BCI Canada 10.37% 11,917.50Power, utilities & network
(PU&N)
Pensioenfonds Zorg en Welzijn Malaysia 4.84% 10,199.00Power, utilities & network
(PU&N)
Largest infra funds
by AUM
Institution Name Country Estimated Infra Allocation (%)
Infra AUM ($M)
Macquarie infrastructure (MIRA) Australia 90% 107,691
Brookfield Asset Management Canada 32% 99,234
M&G Investments UK 17% 51
Global Infra. Partners US 100% 50,285
IFM Investors Australia 52% 37,629
Allianz Global Investors Germany 6% 29,31
The Carlyle Group US 13% 24,066
BlackRock US 0% 20,539
Global Energy Partners US 100% 19,955
AMP Capital Australia 14% 18,55
MetLife Investment Advisors US 3% 18,131
DWS Germany 21% 16,433Examples of some direct investments made by end-investors:
Concessionaire of natural gas regional distribution
networks in Portugal75% stake for €368M
(equity)
UK’s leading port operator, with a unique
network of 21 ports34% stake for £1.62B
(equity)
2322 INVESTOR LANDSCAPE INVESTOR LANDSCAPE
IMAP
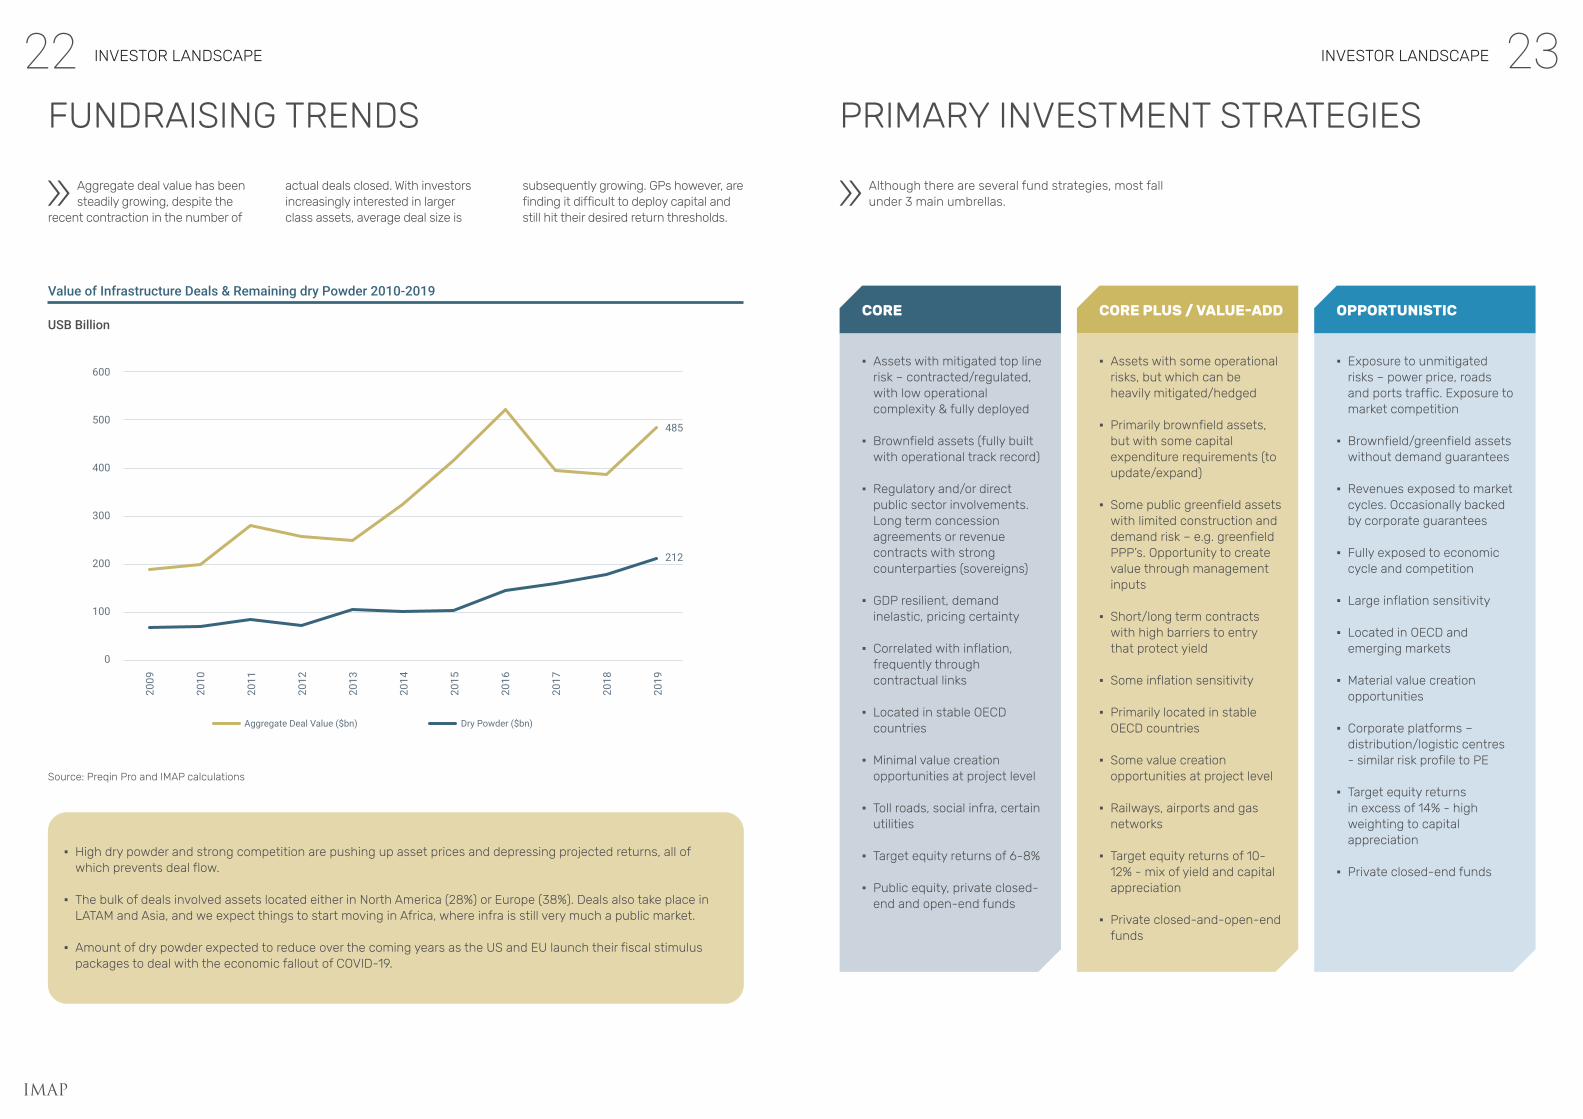
FUNDRAISING TRENDS PRIMARY INVESTMENT STRATEGIES
Aggregate deal value has been steadily growing, despite the
recent contraction in the number of
Although there are several fund strategies, most fall under 3 main umbrellas.
actual deals closed. With investors increasingly interested in larger class assets, average deal size is
subsequently growing. GPs however, are finding it difficult to deploy capital and still hit their desired return thresholds.
Value of Infrastructure Deals & Remaining dry Powder 2010-2019
USB Billion
Source: Preqin Pro and IMAP calculations
▪ High dry powder and strong competition are pushing up asset prices and depressing projected returns, all of which prevents deal flow.
▪ The bulk of deals involved assets located either in North America (28%) or Europe (38%). Deals also take place in LATAM and Asia, and we expect things to start moving in Africa, where infra is still very much a public market.
▪ Amount of dry powder expected to reduce over the coming years as the US and EU launch their fiscal stimulus packages to deal with the economic fallout of COVID-19.
Aggregate Deal Value ($bn) Dry Powder ($bn)
600
500
400
300
200
100
0
2009
2010
2011
2012
2013
2014
2015
2016
2017
2018
2019
485
212
CORE CORE PLUS / VALUE-ADD OPPORTUNISTIC
▪ Assets with mitigated top line risk – contracted/regulated, with low operational complexity & fully deployed
▪ Brownfield assets (fully built with operational track record)
▪ Regulatory and/or direct public sector involvements. Long term concession agreements or revenue contracts with strong counterparties (sovereigns)
▪ GDP resilient, demand inelastic, pricing certainty
▪ Correlated with inflation, frequently through contractual links
▪ Located in stable OECD countries
▪ Minimal value creation opportunities at project level
▪ Toll roads, social infra, certain utilities
▪ Target equity returns of 6-8%
▪ Public equity, private closed-end and open-end funds
▪ Assets with some operational risks, but which can be heavily mitigated/hedged
▪ Primarily brownfield assets, but with some capital expenditure requirements (to update/expand)
▪ Some public greenfield assets with limited construction and demand risk – e.g. greenfield PPP’s. Opportunity to create value through management inputs
▪ Short/long term contracts with high barriers to entry that protect yield
▪ Some inflation sensitivity
▪ Primarily located in stable OECD countries
▪ Some value creation opportunities at project level
▪ Railways, airports and gas networks
▪ Target equity returns of 10-12% - mix of yield and capital appreciation
▪ Private closed-and-open-end funds
▪ Exposure to unmitigated risks – power price, roads and ports traffic. Exposure to market competition
▪ Brownfield/greenfield assets without demand guarantees
▪ Revenues exposed to market cycles. Occasionally backed by corporate guarantees
▪ Fully exposed to economic cycle and competition
▪ Large inflation sensitivity
▪ Located in OECD and emerging markets
▪ Material value creation opportunities
▪ Corporate platforms – distribution/logistic centres - similar risk profile to PE
▪ Target equity returns in excess of 14% - high weighting to capital appreciation
▪ Private closed-end funds

25INVESTOR LANDSCAPE
INFRASTRUCTURE ASSET YIELDS VS COMPETITION
Too much money chasing too few deals has caused a generalized
drop in infra yields. Infra assets are increasingly being sold in organized processes that generally bring lower
returns to new investors. Hence, new investors are increasingly interested in bilateral, as opposed to organized processes – these are primarily secondary transactions in brownfield
assets. Therefore, it is crucial to identify regional brownfield assets that can be transacted far in advance for clients looking to partic ipate in worldwide infra projects with private investors.
Private Capital: Horizon IRRs by Asset Class
Annualized returns
Source: Preqin Pro and IMAP calculations
▪ Infrastructure returns have been generally stable over the last 10 years, whilst recent demand for assets has brought about a drop in yields.
▪ Both capital calls and distributions are likely to decline, as fund managers delay making acquisitions or exits in 2021.
▪ It seems likely that unlisted Infrastructure funds will be among the most insulated from the volatility and disruption that affected global markets in the first half of 2020.
18%
16%
14%
12%
10%
8%
6%
4%
2%
0%
1 Year to Jun-19
Private Capital Private Equity Private Debt Real Estate Infrastructure
3 Year to Jun-19 5 Year to Jun-19 10 Year to Jun-19
24 INVESTOR LANDSCAPE
IMAP

2726 US PERSPECTIVE US PERSPECTIVE
IMAP
UNIQUE CHARACTERISTICS OF THE US INFRASTRUCTURE MARKET
EFFECTIVELY ALIGNING PROJECTS AND CAPITAL
The United States has woefully underinvested in infrastructure
for years, as such, the Congressional Budget Office estimates that in excess of USD 2 trillion is needed by 2025.The US is currently at a record low in terms of annual investment into infrastructure as a % of GDP, and near the bottom of all developed countries.
An integrated Infrastructure Plan was at the core of President Trump’s initial policy proposals, but like most prior Administrations, there were no significant legislative initiatives nor Executive Orders focusing on the Infrastructure needs of the country.
In the US, Government capital will largely focus on projects
that are deemed critical in nature, but do not necessarily generate ongoing cash flow. Private capital will focus on higher revenue generating projects, both critical and non-critical, whereas
In contrast to much of the world, concessions and large PPP projects are not core parts of the US Infrastructure market. More often than not, governments, at all levels, want private capital to bear the financial risk, but are not willing to provide a reasonable return on that capital. Furthermore, every administration for the past 20+ years has included Infrastructure programs in their initial policy initiatives, but very few such programs have had a significant impact on the capital flows into the sector. The most effective policy tools have been tax and related credits, especially in the Energy sector (i.e. LCFS credits, RINs, etc.),
non-critical, low revenue generating projects will not attract any capital, be it public or private.
While prospects are still uncertain at the Federal level, at the State and local levels there are no prospects for
but the lack of long-term certainty surrounding those credits has impacted capital flows.
At this point, the likelihood of meaningful increases in infrastructure spending under the Biden administration remain uncertain.
▪ Biden has proposed a USD 2.4 trillion infrastructure plan, largely focusing on the Energy and Transportation sectors
▪ That bill, or any similar legislation, will face political challenges, even though the Democrats now narrowly control the senate
material infrastructure investments. Both State and local budgets have been decimated by the COVID-19 pandemic, and many are struggling to fund basic needs, which leaves no capital for infrastructure, or any other investments. Given these dynamics, and the current low interest rate environment, well structured infrastructure projects and companies can and will be financed by private equity and debt providers.
INFRASTRUCTURE CAPITAL PROVIDERS ARE BINARY. RISKS MUST BE MITIGATED AND CANNOT BE “PRICED”The key to attracting capital providers is making sure that the investment opportunity can properly address the key transaction criteria that nearly all capital providers adhere to.

2928 IMAP INFRASTRUCTURE DEALS IMAP INFRASTRUCTURE DEALS
Energy assets developer and operatorCANADA
Acquired Majority Control of Business Operations
Energy distributor and commercializerCOLOMBIA
ADVISED ON PURCHASE OF COMPANY
Public utilities companyCOLOMBIA
Acquired 100% of Business Operations
Electricity distributor and commercializerCOLOMBIA
ADVISED ON PURCHASE OF COMPANY
Engineering and infrastructure groupINDIA
Acquired Oil & Gas Divisions from TREVI Group
Design, manufacturing and distribution of drilling and workover rigs
ITALY
ADVISED ON SALE OF COMPANY
Largest biogas producer in Brazil(subsidiary of JMalucelli)
BRAZIL
Acquired Selected Assetsof Seller’s Business
Landfill gas project in Rio de Janeiroand Sao Paulo
BRAZIL
ADVISED ON SALE OF COMPANY
IMAP INFRASTRUCTURE DEALS
Selected IMAP International deals 2018-2020
Constructor of large, complex civil infrastructure
ITALY
Capital increase and debt refinancing
General constructor of public infrastructure
ITALY
FINANCIAL ADVISOR OF SALINI IMPREGILO S.P.A.
Multi-disciplined contractor across road andbridge building, paving, and land development
CANADA
Acquired 100% of Business Operations
Road and bridge maintenance contractorCANADA
ADVISED ON SALE OF COMPANY
Construction company / Port operatorCHILE
Acquired Majority Control of Business Operations
Concession to operate and maintain a port terminalCHILE
ADVISED ON SALE OF COMPANY
Infrastructure fundFRANCE
Acquired Majority Control of Business Operations
Ski resorts managerFRANCE
ADVISED ON SALE OF COMPANY
Global developer, investor and manager of infrastructure
UNITED KINGDOM
Acquired Investment Interest in Seller’s Business
4G PPP toll road concessionCOLOMBIA
ADVISED ON PURCHASE OF COMPANY
IMAP
All-encompassing solar companyFRANCE
Acquired 100% of Business Operations
2 Solar Farms with 2.8 MW installed capacitySPAIN
ADVISED ON ACQUISITION
Auras de Guijo and Aura de Agudo
3130 ABOUT IMAP ABOUT IMAP
IMAP
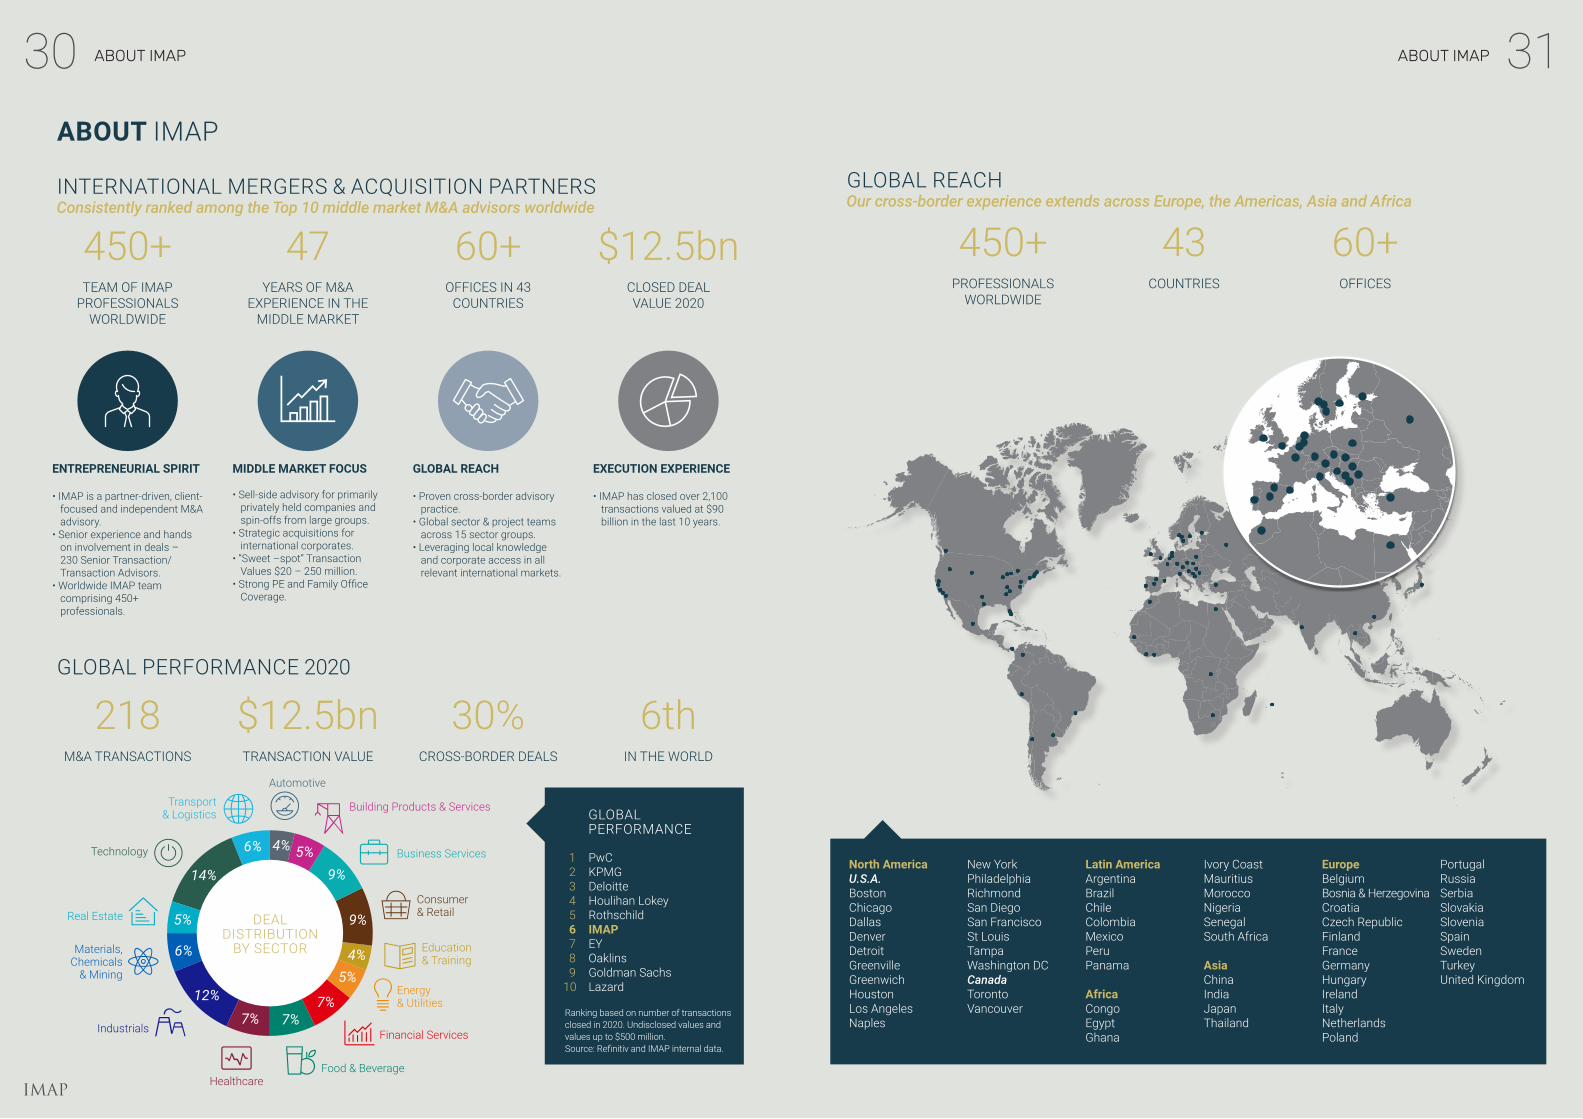
GLOBAL REACHOur cross-border experience extends across Europe, the Americas, Asia and Africa
450+PROFESSIONALS
WORLDWIDE
43COUNTRIES
60+OFFICES
North AmericaU.S.A.BostonChicagoDallasDenverDetroitGreenvilleGreenwichHoustonLos AngelesNaples
New YorkPhiladelphiaRichmondSan DiegoSan Francisco St Louis TampaWashington DCCanadaTorontoVancouver
Latin AmericaArgentinaBrazil ChileColombiaMexicoPeru Panama
AfricaCongo EgyptGhana
Ivory Coast MauritiusMoroccoNigeriaSenegal South Africa
AsiaChina India Japan Thailand
EuropeBelgium Bosnia & HerzegovinaCroatia Czech RepublicFinland France Germany HungaryIrelandItaly NetherlandsPoland
PortugalRussiaSerbiaSlovakiaSloveniaSpainSwedenTurkeyUnited Kingdom
ABOUT IMAP
INTERNATIONAL MERGERS & ACQUISITION PARTNERSConsistently ranked among the Top 10 middle market M&A advisors worldwide
GLOBAL PERFORMANCE 2020
450+TEAM OF IMAP
PROFESSIONALS WORLDWIDE
218M&A TRANSACTIONS
47YEARS OF M&A
EXPERIENCE IN THE MIDDLE MARKET
$12.5bnTRANSACTION VALUE
60+OFFICES IN 43
COUNTRIES
30%CROSS-BORDER DEALS
1 PwC 2 KPMG 3 Deloitte 4 Houlihan Lokey 5 Rothschild 6 IMAP 7 EY 8 Oaklins 9 Goldman Sachs10 Lazard
$12.5bnCLOSED DEAL VALUE 2020
6thIN THE WORLD
GLOBAL PERFORMANCE
ENTREPRENEURIAL SPIRIT
• IMAP is a partner-driven, client-focused and independent M&A advisory.
• Senior experience and hands on involvement in deals – 230 Senior Transaction/Transaction Advisors.
• Worldwide IMAP team comprising 450+ professionals.
MIDDLE MARKET FOCUS
• Sell-side advisory for primarily privately held companies and spin-offs from large groups.
• Strategic acquisitions for international corporates.
• “Sweet –spot” Transaction Values $20 – 250 million.
• Strong PE and Family Office Coverage.
GLOBAL REACH
• Proven cross-border advisory practice.
• Global sector & project teams across 15 sector groups.
• Leveraging local knowledge and corporate access in all relevant international markets.
EXECUTION EXPERIENCE
• IMAP has closed over 2,100 transactions valued at $90 billion in the last 10 years.
Ranking based on number of transactions closed in 2020. Undisclosed values and values up to $500 million.Source: Refinitiv and IMAP internal data.
Building Products & Services
Business Services
Consumer & Retail
Energy & Utilities
Financial Services
Food & BeverageHealthcare
Industrials
Materials, Chemicals
& Mining
Real Estate
Technology
Transport & Logistics
Automotive
Education & Training
4%
9%
9%
7%7%7%
12%
6%
5%
14%
6%
4%
5%
5%
DEAL DISTRIBUTION
BY SECTOR

Report Contributors
IMAP
Contact:
IMAP, Inc.Balmes 151, 1st floor08008 Barcelona - SpainT. +34 936 026 710
www.imap.com
© IMAP, Inc. 2020
International M&A Partners
BILL SPRAGUEManaging DirectorCapstone Headwaters – IMAP [email protected]
GONÇALO VAZ BOTELHOManaging Partner & CEOInvest Corporate Finance – IMAP [email protected]
ENRIQUE VARGASVice PresidentInverlink SA – IMAP ColombiaBogota, [email protected]
SERGIO MILICDirectorSouth Andes Capital – IMAP [email protected]