OULU 2016 ACTA - University of Oulujultika.oulu.fi/files/isbn9789526213200.pdf · 11 Abbreviations...
98
UNIVERSITATIS OULUENSIS ACTA C TECHNICA OULU 2016 C 580 Elisangela Heiderscheidt EVALUATION AND OPTIMISATION OF CHEMICAL TREATMENT FOR NON-POINT SOURCE POLLUTION CONTROL PURIFICATION OF PEAT EXTRACTION RUNOFF WATER UNIVERSITY OF OULU GRADUATE SCHOOL; UNIVERSITY OF OULU, FACULTY OF TECHNOLOGY C 580 ACTA Elisangela Heiderscheidt
-
Upload
duongkhanh -
Category
Documents
-
view
219 -
download
0
Transcript of OULU 2016 ACTA - University of Oulujultika.oulu.fi/files/isbn9789526213200.pdf · 11 Abbreviations...
UNIVERSITY OF OULU P .O. Box 8000 F I -90014 UNIVERSITY OF OULU FINLAND
A C T A U N I V E R S I T A T I S O U L U E N S I S
Professor Esa Hohtola
University Lecturer Santeri Palviainen
Postdoctoral research fellow Sanna Taskila
Professor Olli Vuolteenaho
University Lecturer Veli-Matti Ulvinen
Director Sinikka Eskelinen
Professor Jari Juga
University Lecturer Anu Soikkeli
Professor Olli Vuolteenaho
Publications Editor Kirsti Nurkkala
ISBN 978-952-62-1319-4 (Paperback)ISBN 978-952-62-1320-0 (PDF)ISSN 0355-3213 (Print)ISSN 1796-2226 (Online)
U N I V E R S I TAT I S O U L U E N S I SACTAC
TECHNICA
U N I V E R S I TAT I S O U L U E N S I SACTAC
TECHNICA
OULU 2016
C 580
Elisangela Heiderscheidt
EVALUATION AND OPTIMISATION OF CHEMICAL TREATMENTFOR NON-POINT SOURCE POLLUTION CONTROLPURIFICATION OF PEAT EXTRACTION RUNOFF WATER
UNIVERSITY OF OULU GRADUATE SCHOOL;UNIVERSITY OF OULU,FACULTY OF TECHNOLOGY
C 580
ACTA
Elisangela Heiderscheidt
C580etukansi.kesken.fm Page 1 Wednesday, August 17, 2016 2:31 PM

A C T A U N I V E R S I T A T I S O U L U E N S I SC Te c h n i c a 5 8 0
ELISANGELA HEIDERSCHEIDT
EVALUATION AND OPTIMISATION OF CHEMICAL TREATMENT FOR NON-POINT SOURCE POLLUTION CONTROLPurification of peat extraction runoff water
Academic dissertation to be presented with the assent ofthe Doctoral Training Committee of Technology andNatural Sciences of the University of Oulu for publicdefence in Kuusamonsali (YB210), Linnanmaa, on 21October 2016, at 12 noon
UNIVERSITY OF OULU, OULU 2016
Copyright © 2016Acta Univ. Oul. C 580, 2016
Supervised byProfessor Bjørn Kløve
Reviewed byProfessor Simo O. PehkonenAssociate Professor Annelie Hedström
ISBN 978-952-62-1319-4 (Paperback)ISBN 978-952-62-1320-0 (PDF)
ISSN 0355-3213 (Printed)ISSN 1796-2226 (Online)
Cover DesignRaimo Ahonen
JUVENES PRINTTAMPERE 2016
OpponentProfessor Kenneth M. Persson
Heiderscheidt, Elisangela, Evaluation and optimisation of chemical treatment fornon-point source pollution control. Purification of peat extraction runoff waterUniversity of Oulu Graduate School; University of Oulu, Faculty of TechnologyActa Univ. Oul. C 580, 2016University of Oulu, P.O. Box 8000, FI-90014 University of Oulu, Finland
Abstract
Chemical treatment is considered best available technology for purification of peat extractionrunoff in Finland, due to its capability to remove dissolved organic carbon (DOC), suspendedsolids and nutrients. However, lack of optimisation and adaptation of this method for purificationof diffuse pollution sources, e.g., peat extraction runoff, has led to significant fluctuations inpurification efficiency. This thesis evaluated the suitability of commercially available coagulantsfor the treatment of typically humic water. Inorganic (ferric sulphate, aluminium sulphate and amixed product) and organic (polyDADMAC, polyamine, chitosan and tannin products)coagulants were studied. Investigations included assessment of required dosage and the influenceof process parameters (pollutant concentration, mixing, water pH and temperature) on coagulantperformance. In addition, the process conditions in existing treatment systems were examined infield experiments aimed at identifying possible factors affecting purification.
Ferric sulphate (FS) was the most effective of the coagulants tested. It produced excellent flocsand achieved higher removal efficiency, particularly for DOC, than the other coagulants.However, the dosage required for FS was significantly higher than for e.g., polyDADMAC andchitosan. Moreover, samples treated with FS displayed high iron concentration and acidic pH. Theorganic polymers achieved satisfactory results, but further research is needed before they canbecome viable alternatives to metal salts.
The quality of peat extraction runoff water was found to vary significantly. It was also observedthat variations in DOC concentration, even for particulate rich samples, controlled coagulantdosage and, consequently, treatment efficiency. For inorganic coagulants, mixing provided duringflocculation had a more significant influence on purification than mixing provided duringcoagulation. This is relevant hence in now existing treatment facilities no mixing is employedduring flocculation. Based on the research conducted, suggestions were formulated for processoptimisation aimed at reducing variations in purification efficiency, thus increasing the reliabilityof the method and reducing related environmental impacts.
Keywords: DOC removal, ferric sulphate, organic coagulants, peat extraction, waterquality

Heiderscheidt, Elisangela, Kemiallisen käsittelyn toimivuuden arviointi jaoptimointi hajakuormituksen hallintaan. Turvetuotannon valumavesien puhdistusOulun yliopiston tutkijakoulu; Oulun yliopisto, Teknillinen tiedekuntaActa Univ. Oul. C 580, 2016Oulun yliopisto, PL 8000, 90014 Oulun yliopisto
Tiivistelmä
Turvetuotannon valumavesien käsittelyssä yksi parhaista käyttökelpoisistatekniikoista on kemi-allinen käsittely, koska se pystyy poistamaan valumavedestä liukoista orgaanista hiiltä (DOC),kiintoainetta ja ravinteita. Tästä huolimatta kemiallisen käsittelyn optimointia ei ole tehty haja-kuormitukselle, kuten turvetuotannon valumavesille, minkä seurauksena valumavesien puhdis-tustuloksissa on suurta vaihtelua. Tässä väitöstyössä tutkittiin markkinoilla saatavilla olevienkemikaalien sopivuutta turvetuotannon humuspitoisille valumavesille. Tutkimuksessa testattiinepäorgaanisia (ferrisulfaatti, alumiinisulfaatti ja näiden sekoitus) ja orgaanisia (polyDADMAC,polyamiini, kitosaani ja tanniinipohjaisia polymeerejä) koagulanttikemikaaleja. Tutkimuksessaselvitettiin koagulanttien annostarpeet sekä erilaisten prosessiparametrien (vedenlaatu, sekoitta-minen, pH ja lämpötila) vaikutus koagulanttien toimintaan. Laboratoriotutkimusten lisäksi väi-töstyö sisälsi kenttämittauksia turvetuotannon valumavesien tyypillisten kemiallisen vesienkäsit-telyn prosessiparametrien selvittämiseksi.
Tutkituista koagulanteista rautasulfaatti oli tehokkain. Se tuotti hyvin laskeutuvaa flokkia japoisti parhaiten valumavesien orgaanista ainesta. Rautasulfaatti vaati kuitenkin selkeästi suurem-man annostuksen kuin esimerkiksi polyDADMAC ja kitosaani. Lisäksi puhdistettuun veteen jäipaljon rautaa ja vesi oli hapanta. Orgaanisilla kemikaaleilla saavutettiin myös kohtalainen/mel-ko hyvä puhdistustulos, mutta lisää tutkimusta tarvitaan ennen kuin ne voivat olla vaihtoehtonaepäorgaanisille kemikaaleille.
Turvetuotannon valumaveden laatu vaihteli paljon. Valumaveden orgaanisen aineen määränvaihtelulla oli suurin vaikutus kemikaalin annostukseen ja puhdistustulokseen. Sekoituksistakemiallisen käsittelyn flokkulaatiovaiheen sekoituksella oli suurempi vaikutus puhdistustulok-seen kuin koagulaatiovaiheen sekoituksella. Tutkituilla turvetuotantoalueilla ei kuitenkaan olluttällä hetkellä riittävää sekoitusta flokkulaatiovaiheessa. Tässä väitöstyössä esitetään parannuk-sia kemiallisen käsittelyn optimointiin paremman ja vakaamman puhdistustuloksen aikaansaa-miseksi humuspitoisille vesille.
Asiasanat: DOC:n poisto, orgaaninen koagulantti, rautasulfaatti, turvetuotanto, vedenlaatu


To my family, especially my lovely son and wife and in memory of my father, whom I miss dearly

8
9
Acknowledgements
First and foremost, I would like to express my gratitude to my supervisor, Professor
Bjørn Kløve. Thank you for your support and guidance and the opportunities you
have given me since we first met during my Master’s studies. Thank you also for
allowing me to express myself, my culture and for giving me the freedom to make
my own mistakes, but also to reach my goals. Many thanks to Tiina Leiviskä and
Anna-Kaisa Ronkanen, your advice, support and inputs to the research plan and
manuscripts were crucial to my work and to my motivation to see it completed.
Sincere and special acknowledgement to Pirkko Mustamo, Maarit Hyvärinen, Saila
Pahkakangas and Heini Postila, you have been great colleagues and good friends.
To the staff at the Water Resources and Environmental Engineering Research Unit,
in particular Ali, Hannu, Pekka, Katharina, Shärham, Justice, Tappio, Anna, Leo,
Elina, Riku, Meseret, Ehsan, Anne, Kauko, Tuomo R. and Tuomo P., a big thank
you. To the staff at the Finnish Environmental Institute (Oulu), thank you for your
support in our joint projects.
The research presented in this thesis was made possible by funding from Vapo
Oy and the Aurora doctoral programme. I would like to acknowledge the work and
support of Anneli Wichmann and Jaakko Soikkeli from Vapo Oy, you have been
great partners and collaborators. In addition, I would like to acknowledge financial
support in the form of travel and personal grants from Maa- ja Vesitekniikan Tuki
r.y., Oulun Läänin Talousseuran Maataloussäätiö, Tauno Tönning Foundation, Sven
Hallin Foundation and University of Oulu Graduate School. The grants I received
allowed me to participate in courses, scientific meetings and conferences, which
was crucial in improving the level of my research.
Last but not least, I would like to thank my family and friends in Brazil and in
Finland. To those in Brazil, thank you for understanding my absence and my
decision to pursue my dreams. My mother and sisters Lenemar, Angelita, Cristiane
Kellen and Anne Caroline, you are my best and dearest friends and the foundation
of my world. My Father, Valmir José, we lost you last year and with you a part of
me has died. Thank you for your love, support and the lessons you have taught me,
I miss you. My grandmother, vó branca, you have also departed, you were my rock
and I miss you dearly, but I will be forever grateful for your support. Without it, I
would never have embarked on this journey. Mano my four-legged son, thank you
for everything, I miss you. My most special thank you goes to my beautiful wife
and our son. Tanja, you have been my greatest supporter and I love you deeply.
Lukas my sweet boy, you have brought light and happiness to our lives, I adore you.

10
11
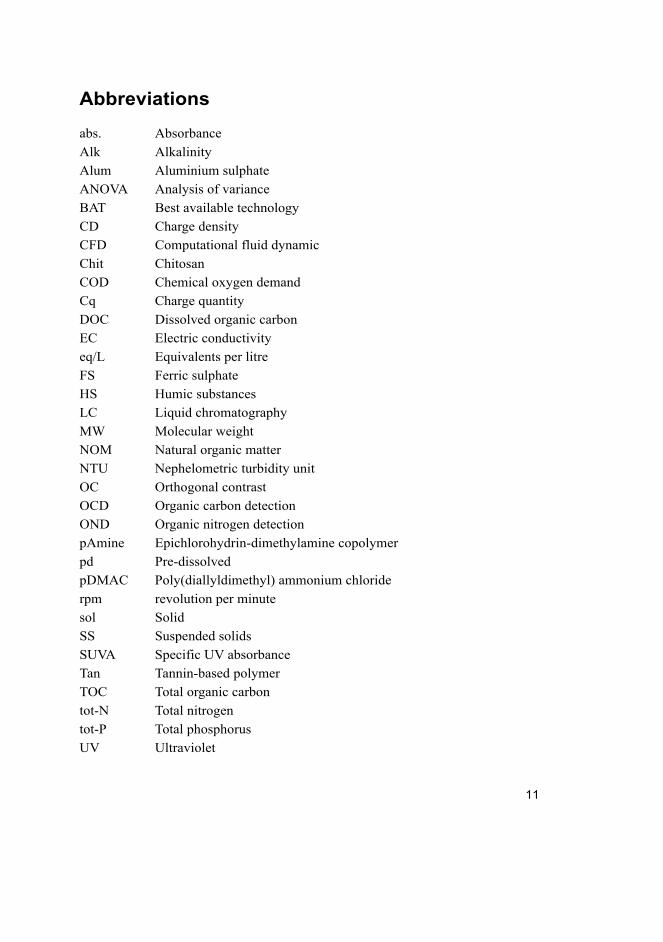
Abbreviations
abs. Absorbance
Alk Alkalinity
Alum Aluminium sulphate
ANOVA Analysis of variance
BAT Best available technology
CD Charge density
CFD Computational fluid dynamic
Chit Chitosan
COD Chemical oxygen demand
Cq Charge quantity
DOC Dissolved organic carbon
EC Electric conductivity
eq/L Equivalents per litre
FS Ferric sulphate
HS Humic substances
LC Liquid chromatography
MW Molecular weight
NOM Natural organic matter
NTU Nephelometric turbidity unit
OC Orthogonal contrast
OCD Organic carbon detection
OND Organic nitrogen detection
pAmine Epichlorohydrin-dimethylamine copolymer
pd Pre-dissolved
pDMAC Poly(diallyldimethyl) ammonium chloride
rpm revolution per minute
sol Solid
SS Suspended solids
SUVA Specific UV absorbance
Tan Tannin-based polymer
TOC Total organic carbon
tot-N Total nitrogen
tot-P Total phosphorus
UV Ultraviolet

12
13
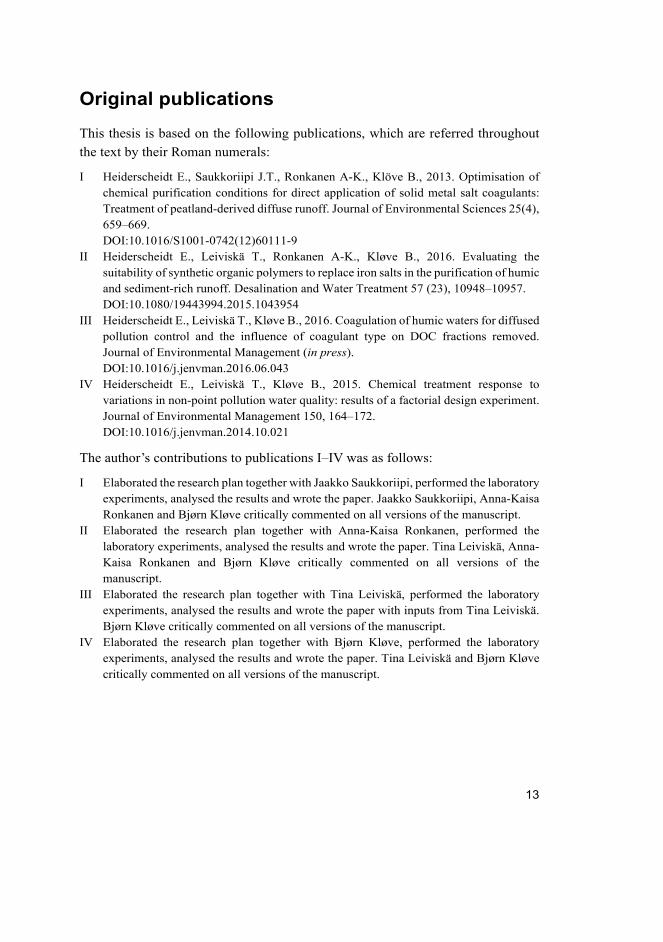
Original publications
This thesis is based on the following publications, which are referred throughout
the text by their Roman numerals:
I Heiderscheidt E., Saukkoriipi J.T., Ronkanen A-K., Klöve B., 2013. Optimisation of chemical purification conditions for direct application of solid metal salt coagulants: Treatment of peatland-derived diffuse runoff. Journal of Environmental Sciences 25(4), 659–669. DOI:10.1016/S1001-0742(12)60111-9
II Heiderscheidt E., Leiviskä T., Ronkanen A-K., Kløve B., 2016. Evaluating the suitability of synthetic organic polymers to replace iron salts in the purification of humic and sediment-rich runoff. Desalination and Water Treatment 57 (23), 10948–10957. DOI:10.1080/19443994.2015.1043954
III Heiderscheidt E., Leiviskä T., Kløve B., 2016. Coagulation of humic waters for diffused pollution control and the influence of coagulant type on DOC fractions removed. Journal of Environmental Management (in press). DOI:10.1016/j.jenvman.2016.06.043
IV Heiderscheidt E., Leiviskä T., Kløve B., 2015. Chemical treatment response to variations in non-point pollution water quality: results of a factorial design experiment. Journal of Environmental Management 150, 164–172. DOI:10.1016/j.jenvman.2014.10.021
The author’s contributions to publications I–IV was as follows:
I Elaborated the research plan together with Jaakko Saukkoriipi, performed the laboratory experiments, analysed the results and wrote the paper. Jaakko Saukkoriipi, Anna-Kaisa Ronkanen and Bjørn Kløve critically commented on all versions of the manuscript.
II Elaborated the research plan together with Anna-Kaisa Ronkanen, performed the laboratory experiments, analysed the results and wrote the paper. Tina Leiviskä, Anna-Kaisa Ronkanen and Bjørn Kløve critically commented on all versions of the manuscript.
III Elaborated the research plan together with Tina Leiviskä, performed the laboratory experiments, analysed the results and wrote the paper with inputs from Tina Leiviskä. Bjørn Kløve critically commented on all versions of the manuscript.
IV Elaborated the research plan together with Bjørn Kløve, performed the laboratory experiments, analysed the results and wrote the paper. Tina Leiviskä and Bjørn Kløve critically commented on all versions of the manuscript.

14
15
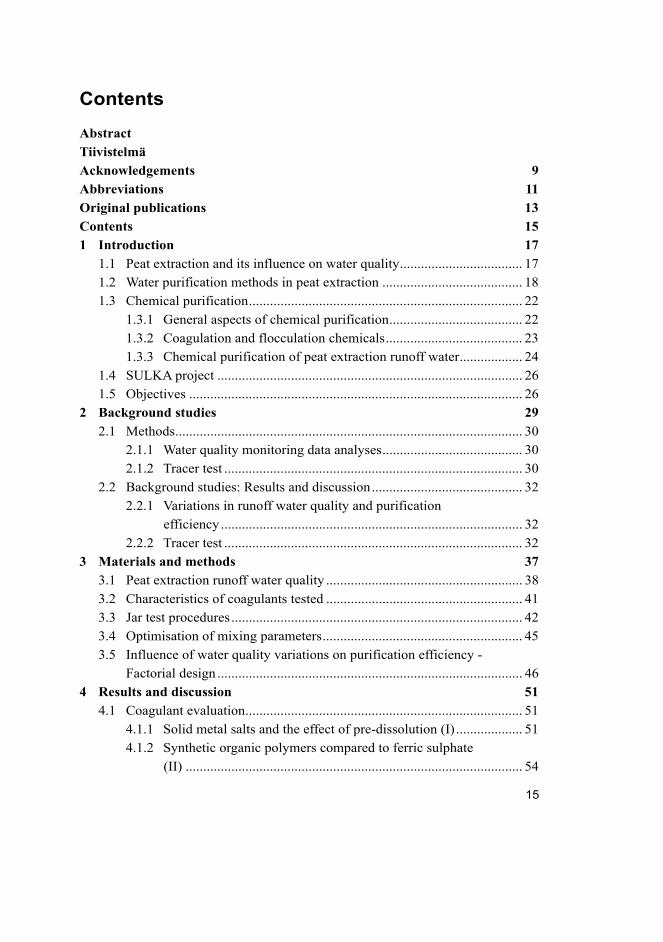
Contents
Abstract
Tiivistelmä
Acknowledgements 9 Abbreviations 11 Original publications 13 Contents 15 1 Introduction 17
1.1 Peat extraction and its influence on water quality ................................... 17 1.2 Water purification methods in peat extraction ........................................ 18 1.3 Chemical purification .............................................................................. 22
1.3.1 General aspects of chemical purification ...................................... 22 1.3.2 Coagulation and flocculation chemicals ....................................... 23 1.3.3 Chemical purification of peat extraction runoff water .................. 24
1.4 SULKA project ....................................................................................... 26 1.5 Objectives ............................................................................................... 26
2 Background studies 29 2.1 Methods ................................................................................................... 30
2.1.1 Water quality monitoring data analyses ........................................ 30 2.1.2 Tracer test ..................................................................................... 30
2.2 Background studies: Results and discussion ........................................... 32 2.2.1 Variations in runoff water quality and purification
efficiency ...................................................................................... 32 2.2.2 Tracer test ..................................................................................... 32
3 Materials and methods 37 3.1 Peat extraction runoff water quality ........................................................ 38 3.2 Characteristics of coagulants tested ........................................................ 41 3.3 Jar test procedures ................................................................................... 42 3.4 Optimisation of mixing parameters ......................................................... 45 3.5 Influence of water quality variations on purification efficiency -
Factorial design ....................................................................................... 46 4 Results and discussion 51
4.1 Coagulant evaluation ............................................................................... 51 4.1.1 Solid metal salts and the effect of pre-dissolution (I) ................... 51 4.1.2 Synthetic organic polymers compared to ferric sulphate
(II) ................................................................................................ 54
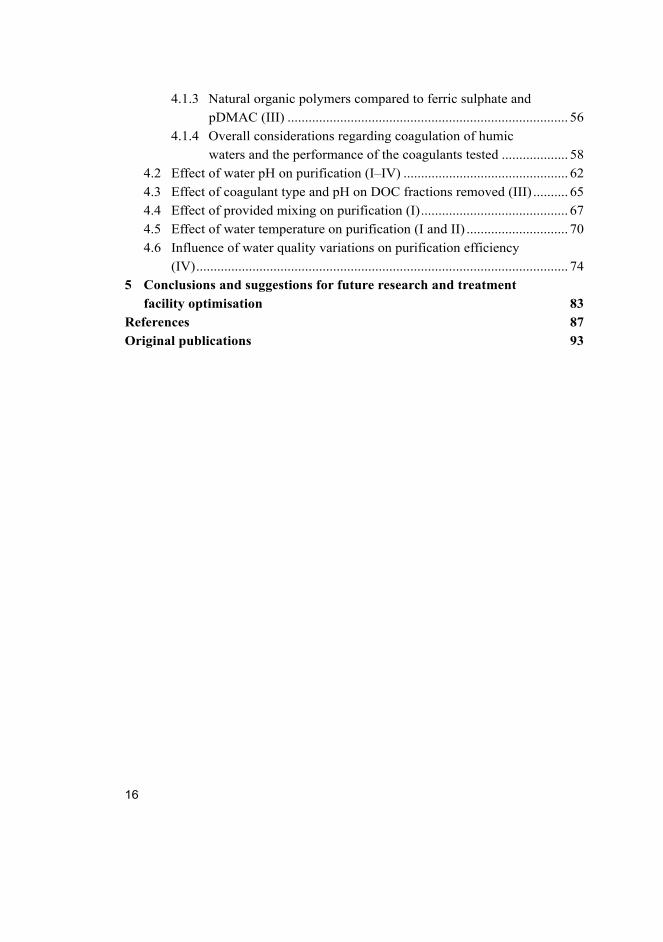
16
4.1.3 Natural organic polymers compared to ferric sulphate and
pDMAC (III) ................................................................................ 56 4.1.4 Overall considerations regarding coagulation of humic
waters and the performance of the coagulants tested ................... 58 4.2 Effect of water pH on purification (I–IV) ............................................... 62 4.3 Effect of coagulant type and pH on DOC fractions removed (III) .......... 65 4.4 Effect of provided mixing on purification (I) .......................................... 67 4.5 Effect of water temperature on purification (I and II) ............................. 70 4.6 Influence of water quality variations on purification efficiency
(IV) .......................................................................................................... 74 5 Conclusions and suggestions for future research and treatment
facility optimisation 83 References 87 Original publications 93
17
1 Introduction
Over recent decades, great efforts have been devoted to improving the quality of
surface water and groundwater sources in Europe. The impact of pollution from
land use activities such as agriculture, forestry and mining has been recognised and
policies have been adopted in a number of countries, with the objective of meeting
the requirements of the European Water Framework Directive (European
Commission, 2015).
Peatlands cover around 9.3 million ha of Finland’s surface area (30%) and,
although 1.2 million ha are technically suitable for peat extraction, less than 1% of
the total peatland area is exploited, mainly for energy production (90%) (Finnish
Ministry of the Environment, 2015). Nevertheless, peat extraction causes a series
of negative impacts on the environment, which can be significant at local scale,
with the most severe impacts being those imposed on water sources (Kettunen et al., 2012; Finnish Ministry of the Environment, 2015). Tightening of environmental
legislation and increased awareness of environmental issues within the peat
extraction industry have led to optimisation of existing water protection measures
and the development of innovative solutions to reduce the contaminant load from
peat extraction areas.
1.1 Peat extraction and its influence on water quality
Activities connected to peat extraction, such as peatland drainage and the exposure
of peat layers, are known to increase the amount of water discharging from
catchment areas (Holden et al., 2006) and also to increase the transport of pollutant
substances such as suspended solids (SS), dissolved organic carbon (DOC), metals
and nutrients into water courses located downstream (Heikkinen, 1990; Heikkinen,
1994; Kløve, 2001; Marttila and Kløve, 2008). Prediction of the contaminant load
imposed by different land use activities is a difficult task due to e.g. temporal and
spatial fluctuations in pollutant concentrations (Heathwaite, 1999). In the case of
peat extraction, significant fluctuations in pollutant concentrations have been
observed at monitored sites (Svahnbäck, 2007). The load dependence has been
linked to drainage intensity, soil geochemistry and runoff rate (Edén et al., 1999;
Åström et al., 2001, Kløve, 2001; Worrall et al., 2003; Marttila and Kløve, 2008;
Tuukkanen et al., 2014).
Among the possible impacts caused by increased loading resulting from peat
extraction activities are those related to higher concentrations of nutrients, SS and
18
DOC in aquatic environments. In Finland, an increasing trend in DOC
concentrations has been observed in rivers and lakes (Vuorenmaa et al., 2006).
High organic load in lakes can result in oxygen depletion due to higher oxygen
consumption, especially during incomplete spring turnover or long winters
(Keskitalo et al., 1999). De-oxygenation can cause internal eutrophication and can
have a significant impact, e.g. on fish populations in the receiving water bodies
(Evans et al., 2005). Higher DOC concentrations not only affect the aquatic
ecosystem, but also the treatability of the water (Worrall and Burt, 2009). In potable
water production, higher DOC concentrations are known e.g. to increase chemical
demand during the coagulation/flocculation stage, cause fouling of membranes and
activated carbon filters, and also to increase the formation of disinfection by-
products etc. (Sillanpää, 2015). Higher particulate and nutrient loads, in particular
of phosphorus, are also cause for concern, especially in regions of sensitive
freshwater systems. Phosphorus is often the growth-limiting factor for plants and
microorganisms in rivers and lakes in Finland (Lamon et al., 2008) and, together
with deposition of SS, is the main factor causing eutrophication, siltation and water
quality deterioration (Finnish Ministry of the Environment, 2015).
1.2 Water purification methods in peat extraction
The peat extraction industry operates under strict environmental controls in Finland.
Water protection measures are defined in environmental permits issued by the
Finnish environmental authorities on a site-by-site basis (Finnish Ministry of the
Environment, 2015). However, there are wide variations in runoff water quality
with time, location and peak discharge occurrence (Kløve, 2001; Svahnbäck, 2007;
Marttila and Kløve, 2008; Tuukkanen et al., 2014), which represents a challenge in
selection of adequate water purification methods. It is important to note that
different sites will require different treatment methods designed to satisfy the
requirements of the peat production process, site hydrology and geology, the
sensitivity of the receiving water bodies and current legislation.
A number of water purification methods have been developed or adapted to the
conditions prevailing at peat extraction sites, with the objective of reducing the
pollutant loads from this land use activity (Kløve, 2001; Turveteollisuusliitto, 2010).
In these methods, existing drainage networks are generally used to direct the flow
of runoff water. Load retention measures are then applied within the ditch network
or at its end point, in a main ditch or channel into which the network discharges. In
the early days, treatment methods referred to as basic methods were used in Finland,
19
e.g. sedimentation ponds and peak runoff control dams. However, with the
tightening of the environmental legislation, additional treatment steps referred to
as enhanced treatment methods are now required at most sites. Such enhanced
treatment methods include overland flow fields (wetland) and chemical purification.
The most widely used basic and enhanced treatment methods at Finnish peat
extraction sites are (Turveteollisuusliitto, 2010):
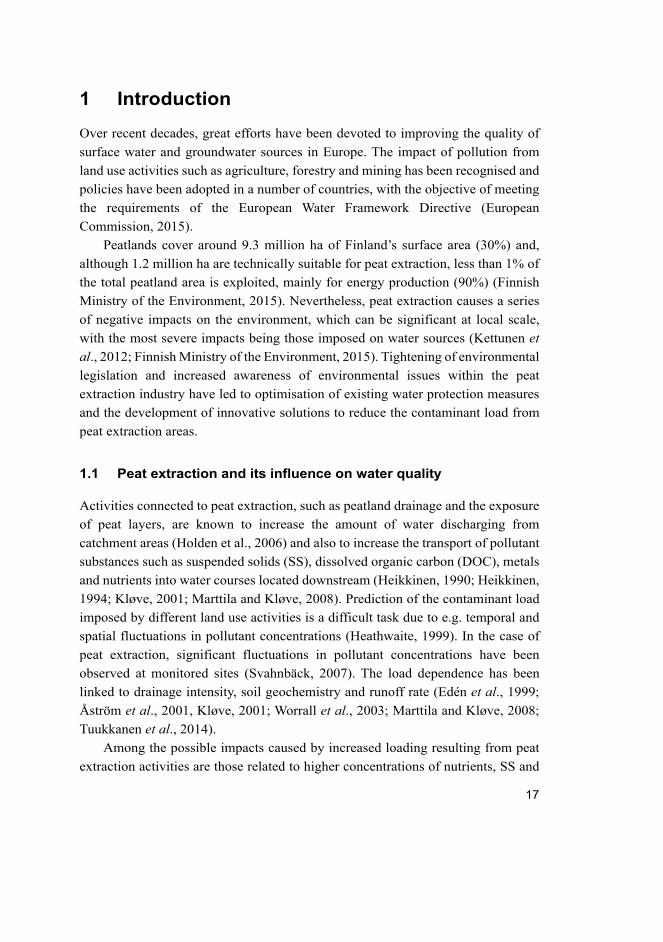
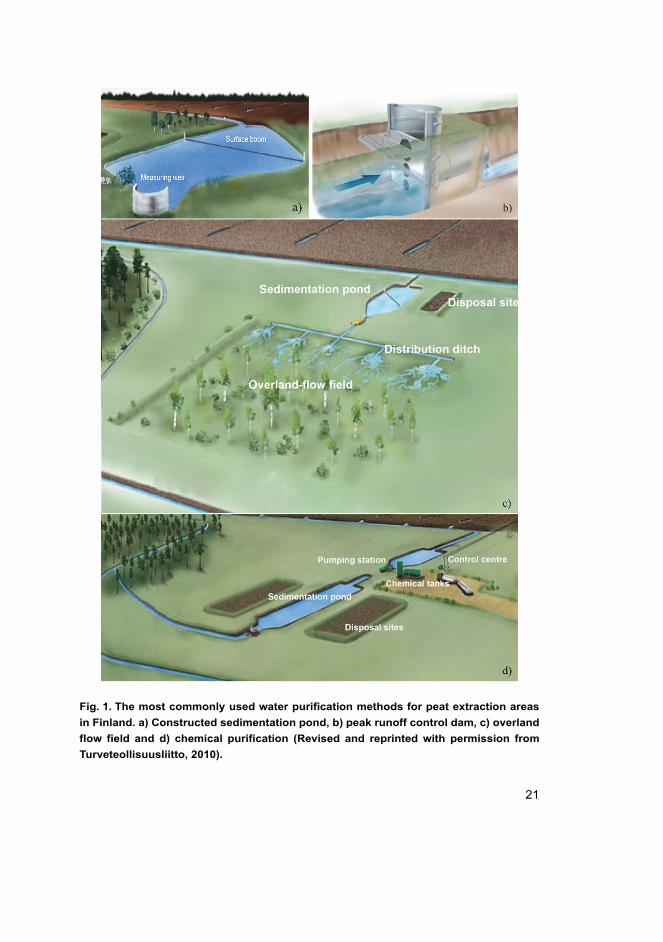
i. Constructed sedimentation pond (Fig. 1a). It consists of a pond
excavated in the proximity of the peat extraction area into which the
runoff water is discharged. The retention time is designed to allow the
removal of SS and associated nutrients from the water. Under normal
discharge conditions, 40% removal of SS can be expected
(Turveteollisuusliitto, 2010).
ii. Peak runoff control dam (Fig. 1b). It consists of a weir structure that
controls the volume of water discharging from a ditch or channel.
While controlling water discharge rates, this structure also traps peat
particles, eroded substances and nutrients, as well as acting as an
auxiliary in ditch erosion reduction. Marttila and Kløve (2009) report
the following load reductions for peak runoff control dams: 61–94%
for SS, 45–91% for total nitrogen (tot-N) and 47–88% for total
phosphorus (tot-P).
iii. Overland flow field (treatment wetlands or constructed wetlands) (Fig.
1c). This involves directing the runoff water into the surface layer of
a pristine or previously drained peatland area. The vegetation of the
surface layer works as a mechanical filter, separating out solids from
the water. Dissolved nutrients are removed in the peat layer as a result
of chemical and biological processes. Average SS removal is around
60%, while around 25% of tot-N and tot-P is retained (Pöyry, 2014).
The overland flow field is considered best available technology (BAT)
for the purification of peat extraction runoff by the Finnish
environmental authorities and is the most widely applied load
reduction measure.
iv. Chemical purification (Fig. 1d). The chemical treatment method
involves addition of coagulant agents normally used in water and
wastewater treatment into runoff water discharging from the main
ditch. The water is then directed to a sedimentation pond (see section
1.3.3). The addition of coagulation chemicals causes precipitation and
20
sedimentation of solids and dissolved substances, which are deposited
in the bottom of the sedimentation pond. Expected load reduction
levels are: 30–90% of SS; 30–60% of tot-N and 75–95% of tot-P
(Turveteollisuusliitto, 2010). Chemical treatment is also considered
BAT for peat extraction runoff in Finland.
Due to their low maintenance requirement and natural credentials, wetlands are the
most widely applied enhanced purification method. For example, the major Finnish
peat extraction company Vapo Oy has built over 500 wetlands and only around 25
chemical treatment systems at its extraction sites since the late 1990s, when
enhanced treatment methods started to be required by the environmental authorities
(Wichmann, 2015)
Although purification requirements are set by authorities on a case-by-case
basis, guidelines released by the Finnish Ministry of the Environment (2015) state
that the removal efficiency to be achieved by treatment methods applied in
conjunction with sedimentation ponds (mostly wetlands) should be: 50% of SS, 40-
50% of tot-P and 20% of tot-N. Requirements for organic matter removal are
normally not imposed, since it is generally recognised that wetlands are not capable
of effectively removing organic substances (Pöyry, 2014). According to Vapo Oy
(Wichmann, 2015), the pollutant removal rates imposed by the authorities via
environmental permits for sites where chemical purification is required are higher
than those imposed at other sites. On a site-by-site basis, the removal rates required
from chemical purification are: 60–80% removal for chemical oxygen demand
(COD), 60–90% for tot-P, 30–50% for tot-N and around 50% for SS.
21
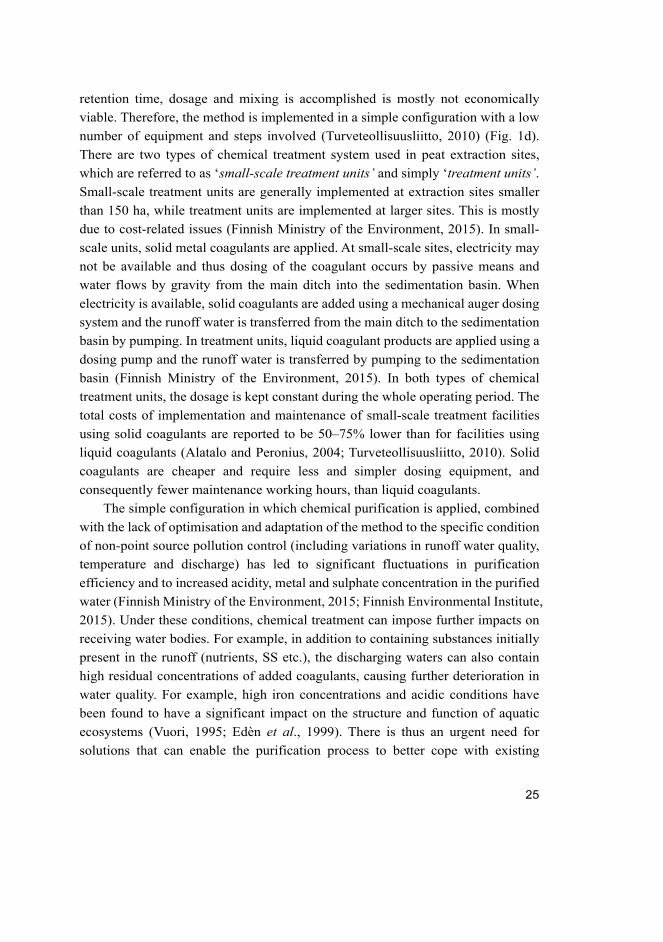
Fig. 1. The most commonly used water purification methods for peat extraction areas
in Finland. a) Constructed sedimentation pond, b) peak runoff control dam, c) overland
flow field and d) chemical purification (Revised and reprinted with permission from
Turveteollisuusliitto, 2010).
22
1.3 Chemical purification
Natural sedimentation can easily remove larger suspended particles present in water.
However, dissolved substances and very fine particles or colloids cannot be
removed by sedimentation alone and their removal is the main objective of
chemical treatment (Koohestanian et al., 2008). Chemical purification by addition
of coagulation and flocculation chemicals is widely used for the treatment of water
and wastewater all over the world. The method consists of two individual but well-
interconnected and somewhat overlapping processes, coagulation and flocculation,
followed by a solid-liquid separation phase, e.g. sedimentation (Bratby, 2006).
1.3.1 General aspects of chemical purification
Coagulation is a chemically induced destabilisation process in colloidal systems
involving addition of counter-ions to the charges contained in the solution or
suspension (Bratby, 2006). In natural waters, due to their acidic nature, most
substances are negatively charged and therefore they repel each other and remain
dispersed in the liquid. During chemical purification, counter-ions are introduced
by addition of chemicals referred to as coagulants (or primary coagulants), which
have the ability to precipitate SS and dissolved substances present in the water,
forming primary particles (Gregory and Duan, 2001; Duan and Gregory, 2003;
Bratby, 2006; Bolto and Gregory, 2007). Flocculation is the agglomeration of
particles due to induced fluid motion. By inducing gentle motion and creating
velocity gradients within the water, the primary particles formed during coagulation
are encouraged to make contact and form larger agglomerates referred to as flocs
(Bratby, 2006). These larger particles can then be easily removed by a solid liquid
separation process such as sedimentation or flotation. Flocculants are chemicals
(normally organic polymers) added to help the destabilisation process and
accelerate the rate of flocculation or to strengthen the flocs formed (Bratby, 2006).
The efficiency of chemical treatment is known to be strongly dependent on
water quality characteristics such as temperature, alkalinity, pH and the
concentration and type of pollutant substances (e.g. Volk et al., 2000; Franceschi et al., 2002; Sharp et al., 2006; Xiao et al., 2008; Slavik et al., 2012). Furthermore,
process parameters such as coagulant/flocculant type and dosage (e.g. Guibal et al., 2006; Liu and Chin, 2009; Wei et al., 2009; Libecki, 2010) and mixing during and
after chemical addition (Yan et al., 2009; Zhan et al., 2011; Slavik et al., 2012) are
known to have a significant impact on the results obtained. Several complex
23
interactions occur between substances present in the water, added chemicals and
other process parameters (inclusion of mixing, retention time etc.). Optimum
purification conditions are generally water- and coagulant/flocculant agent-specific
and are normally identified using the jar test and/or other pilot test methods (Bratby,
2006).
1.3.2 Coagulation and flocculation chemicals
Due to their effectiveness, availability and low cost, metal salts of iron and
aluminium (sulphate and chloride as counter-ions) are the most commonly used
primary coagulants in water and wastewater treatment all over the world. When
metal salts are added to water, they dissociate and undergo a series of metal-ion
hydrolysis reactions. The species produced and their characteristics are
significantly dependent on dosage, mixing and water pH (Gregory and Duan, 2001;
Duan and Gregory, 2003; Bratby, 2006). The efficacy of these inorganic coagulants
is related to their ability to form multi-charged polynuclear species with high
adsorption capacity and an amorphous precipitate (Bratby, 2006). Pre-hydrolysed
metal salt coagulants have been developed by controlled metal-ion hydrolysis
reactions, with the objective of producing the most effective species for
destabilisation irrespective of process conditions. Pre-hydrolysed salts have been
found to be required in lower doses and to be less sensitive to the pH and
temperature of the water (Cheng, 2002; Jiang and Wang, 2009; Liu and Chin, 2009).
Synthetic organic polymers have been employed for decades in the treatment
of water and wastewater, as flocculants and sludge dewatering chemicals (Bolto,
1999; Bratby, 2006; Gregory and Bolto, 2007). Although their use as primary
coagulants is not widespread, it is expected to increase as the technology for their
production advances and tailor-made products with varying molecular weight
(MW), charge density (CD) and lower residual monomers are produced (Gregory
and Bolto, 2007). For example, cationic polymers such as poly(diallyldimethyl)
ammonium chloride (pDMAC) with high CD have been successfully applied as
primary coagulants in water treatment (Nozaic et al., 2001). Some advantages of
synthetic organic polymers over metal salt coagulants are that they do not consume
alkalinity, have been found to display lower sensitivity to variations in water quality,
require lower dosages and produce less sludge with better dewatering
characteristics (Nozaic et al., 2001; Gregory and Bolto, 2007). However, some
concerns have arisen regarding their low degradability, high costs and toxicity, with
24
potential harmful impacts on human health (Letterman and Pero, 1990) and on
aquatic ecosystems (Harford et al., 2011).
The need for less toxic and more environmentally friendly water treatment
products has directed research into naturally produced polymers (biopolymers).
Biopolymers are extracted from animals, plant tissues or microorganisms and have
benefits such as non-toxicity and high biodegradability (Gregory and Bolto, 2007;
Yin, 2010; Oladoja, 2015). Among the currently developed and commercially
available biopolymers are chitosan and tannin-based products. Chitosan is
produced from chitin, a biopolymer extracted from shellfish sources, and it is
virtually insoluble in water under neutral conditions, but it can be dissolved in acid
solutions such as acetic and hydrochloric acid (Renault et al., 2009). Water-soluble
modified chitosan polymers have been developed by e.g. controlled deacetylation
and chemical modification methods (Kurita, 1991; Holme and Perlin, 1997).
Several studies have evaluated the use of chitosan for the removal of turbidity and
natural organic matter (NOM) (Bratskaya et al., 2004; Guibal et al., 2006; Renault
et al., 2009; Yang et al., 2011; Chen et al., 2015). Overall, they report advantages
such as lower required dosage, lower metal residuals and lower (less toxic) sludge
production compared with metal salts (Guibal et al., 2006; Renault et al., 2009;
Chen et al., 2015). Tannin is a general name given to large polyphenol compounds
obtained from natural materials, such as organic extracts from tree bark and wood.
Tannin-based coagulants have also been successfully tested for turbidity and
organic matter removal (Graham et al., 2008; Sánchez-Martín et al., 2010).
1.3.3 Chemical purification of peat extraction runoff water
In the purification of peat extraction runoff water, chemical treatment is mostly
employed at sites surrounded by sensitive ecosystems, where high removal rates
are required, or at sites where suitable space for wetlands is not available. Metal
salts of iron (sulphate as counter-ion) are the coagulant agents normally applied.
The limiting factor for their application is generally the higher cost of
implementation and maintenance and the higher need for process control compared
with other purification measures (Turveteollisuusliitto, 2010; Finnish Ministry of
the Environment, 2015; Finnish Environmental Institute, 2015). Furthermore,
technical issues such as freezing of liquid coagulants during cold periods can result
in seasonal application of the method (Turveteollisuusliitto, 2010).
Cost effectiveness is a significant problem for chemical purification of diffuse
pollution. Implementation of treatment facilities where effective control of e.g.
25
retention time, dosage and mixing is accomplished is mostly not economically
viable. Therefore, the method is implemented in a simple configuration with a low
number of equipment and steps involved (Turveteollisuusliitto, 2010) (Fig. 1d).
There are two types of chemical treatment system used in peat extraction sites,
which are referred to as ‘small-scale treatment units’ and simply ‘treatment units’. Small-scale treatment units are generally implemented at extraction sites smaller
than 150 ha, while treatment units are implemented at larger sites. This is mostly
due to cost-related issues (Finnish Ministry of the Environment, 2015). In small-
scale units, solid metal coagulants are applied. At small-scale sites, electricity may
not be available and thus dosing of the coagulant occurs by passive means and
water flows by gravity from the main ditch into the sedimentation basin. When
electricity is available, solid coagulants are added using a mechanical auger dosing
system and the runoff water is transferred from the main ditch to the sedimentation
basin by pumping. In treatment units, liquid coagulant products are applied using a
dosing pump and the runoff water is transferred by pumping to the sedimentation
basin (Finnish Ministry of the Environment, 2015). In both types of chemical
treatment units, the dosage is kept constant during the whole operating period. The
total costs of implementation and maintenance of small-scale treatment facilities
using solid coagulants are reported to be 50–75% lower than for facilities using
liquid coagulants (Alatalo and Peronius, 2004; Turveteollisuusliitto, 2010). Solid
coagulants are cheaper and require less and simpler dosing equipment, and
consequently fewer maintenance working hours, than liquid coagulants.
The simple configuration in which chemical purification is applied, combined
with the lack of optimisation and adaptation of the method to the specific condition
of non-point source pollution control (including variations in runoff water quality,
temperature and discharge) has led to significant fluctuations in purification
efficiency and to increased acidity, metal and sulphate concentration in the purified
water (Finnish Ministry of the Environment, 2015; Finnish Environmental Institute,
2015). Under these conditions, chemical treatment can impose further impacts on
receiving water bodies. For example, in addition to containing substances initially
present in the runoff (nutrients, SS etc.), the discharging waters can also contain
high residual concentrations of added coagulants, causing further deterioration in
water quality. For example, high iron concentrations and acidic conditions have
been found to have a significant impact on the structure and function of aquatic
ecosystems (Vuori, 1995; Edèn et al., 1999). There is thus an urgent need for
solutions that can enable the purification process to better cope with existing
26
conditions, while also decreasing performance variability and the negative
environmental impacts associated with existing chemical treatment systems.
1.4 SULKA project
The SULKA (New and innovative methods of water purification to reduce loading
from peat extraction) research project ran from 2011 to 2014, with a budget of
around 1 million Euros. The project was mainly funded by Vapo Oy and was
implemented by the Water Resources and Environmental Engineering research
group (University of Oulu) in partnership with the Finish Environmental Institute
– SYKE. Vapo Oy is the world’s leading supplier of peat. The company is owned
jointly by the Finnish state (50.1%) and Suomen Energiavarat Oy, a consortium of
Finnish energy companies (49.9%).
The main objectives of the SULKA project were: i) to increase available
knowledge regarding load formation and transport in peat extraction areas; ii) to
identify suitable preventive measures to reduce load discharge; iii) to evaluate
factors affecting purification efficiency in treatment wetlands; and iv) to identify
factors affecting the chemical purification process. The overall aim was to develop
solutions to minimise the inconsistency in purification results, while also increasing
the cost-effectiveness.
The majority of the studies on which this thesis is based (Papers I–IV and
background studies) were part of the SULKA project research. A summary of all
results obtained in the project can be found in the final report (Finnish
Environmental Institute, 2015). Additional investigations (e.g. that described in III)
were planned and executed to expand the knowledge obtained within the project
tasks.
1.5 Objectives
The focus of this thesis work was evaluation and optimisation of the chemical
purification process for the purification of non-point source pollution, specifically
for the treatment of peat extraction runoff water. The main goal was to gain new
knowledge about the significance of process parameters and water quality
characteristics for the purification efficiency achieved under field or real conditions.
The work involved studying the applicability and reproducibility of the method for
purifying runoff with varying water quality characteristics and developing tools and
guidelines for the optimisation and effective use of this pollution control measure
27
in order to decrease variations in purification efficiency and related impacts. In
addition, existing treatment facilities and processes were studied with the aim of
identifying possible factors affecting purification efficiency and of applying the
information acquired in the design of optimisation studies conducted under
laboratory conditions. Specific objectives of these optimisation studies were:
i. To examine the effectiveness of solid inorganic coagulants as
purification agents in the treatment of peatland-derived runoff water
and the influence of coagulant dissolution on treatment efficiency and
process parameters.
ii. To evaluate the suitability of natural and synthetic organic polymers
as alternative coagulants for the purification of peat extraction runoff,
by comparing their performance to that achieved by the normally used
metal salt coagulant.
iii. To investigate the influence of water pH, temperature and process
parameters, such as mixing and settling time, on coagulant
performance.
iv. To identify coagulant-specific optimum process parameters (dosage,
mixing, retention time etc.) for effective purification.
v. To study the influence of coagulant type on the removal of designated
pollutants such as SS, nutrients and DOC.
vi. To investigate the characteristics of DOC contained in peat extraction
runoff water using fractionation analysis and determine its influence
on the purification efficiency achieved by different coagulants.
vii. To evaluate the response of the chemical purification process to
fluctuations in water quality that are typical of peatland-derived runoff.
In order to achieve these general and specific objectives, a research plan involving
field and laboratory work was devised. The field studies included e.g. evaluation
of water quality monitoring data, site observations and experiments. Field studies
are referred to in this thesis as background studies and are described in order to
support the work performed in the laboratory or optimisation phase of the research.
The core of this thesis is the research conducted under laboratory conditions, which
is referred to as optimisation studies. The results of these optimisation studies are
reported in full in Papers I–IV.
During the optimisation studies, natural runoff water samples were used and
experimental procedures based on jar test methodology were designed to
investigate the suitability of different coagulants and the influence of process and
28
water quality parameters on purification efficiency. Papers I–III report the results
from evaluation of different types of coagulants (metal salts, synthetic polymers
and natural polymers), including the influence of process and water quality
parameters on overall coagulant performance. Paper IV describes the influence of
variations in water quality on the coagulation-flocculation process when ferric
sulphate is the coagulant added.
29
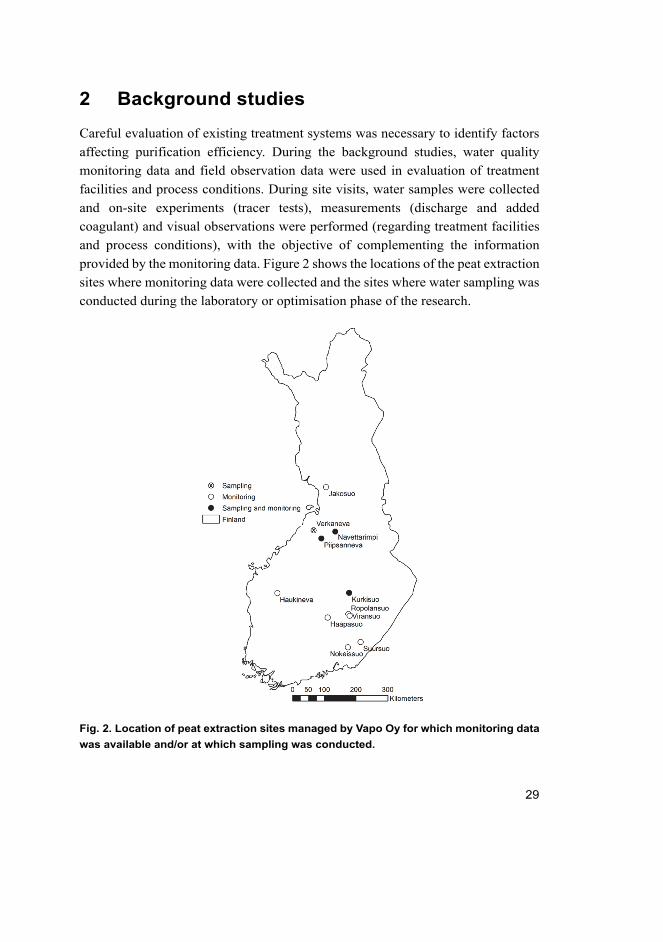
2 Background studies
Careful evaluation of existing treatment systems was necessary to identify factors
affecting purification efficiency. During the background studies, water quality
monitoring data and field observation data were used in evaluation of treatment
facilities and process conditions. During site visits, water samples were collected
and on-site experiments (tracer tests), measurements (discharge and added
coagulant) and visual observations were performed (regarding treatment facilities
and process conditions), with the objective of complementing the information
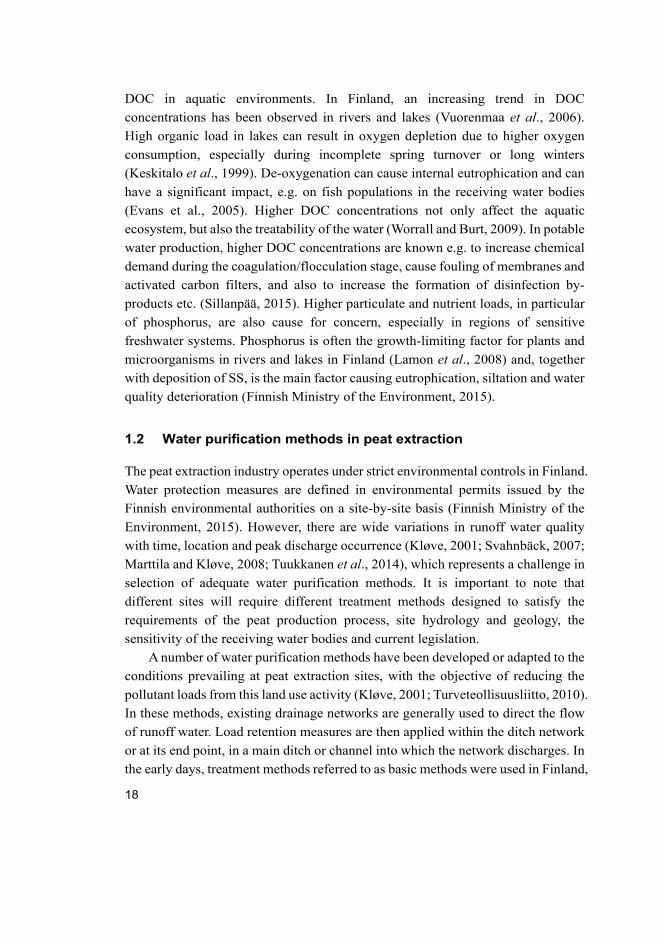
provided by the monitoring data. Figure 2 shows the locations of the peat extraction
sites where monitoring data were collected and the sites where water sampling was
conducted during the laboratory or optimisation phase of the research.
Fig. 2. Location of peat extraction sites managed by Vapo Oy for which monitoring data
was available and/or at which sampling was conducted.
30
2.1 Methods
2.1.1 Water quality monitoring data analyses
Water quality monitoring data from for 10 peat extraction sites where at which
chemical purification was is applied (taken over a 2–8 years monitoring period with
either biweekly or monthly recordings between 2003 and 2011) were provided by
Vapo Oy. The data sets included pollutant load (SS, COD, pH, nutrients, etc.) and
purification efficiency values. Properties Components of the data sets, such as mean,
variance and percentiles, were utilised in the evaluation of the quality of the
collected water samples used during the optimisation studies and for thein
assessment of variations in runoff water quality and purification efficiency
achieved under field (or real) conditions.
2.1.2 Tracer test
The use of a conservative tracer is a quick, simple and effective way to measure
discharge, retention time and flow pathways within a system (AWWA, 1996).
Sodium chloride (NaCl) is a commonly used tracer due to its conservative nature
and low related environmental impacts. The addition of NaCl increases the ionic
strength of the water, increasing electric conductivity (EC). The magnitude of the
increase in EC, which can easily be monitored by suitable sensors, is related to the
amount of NaCl added to the water (AWWA, 1996).
A tracer experiment using NaCl was conducted at Navettarimpi peat extraction
site, located in Vaala, Finland (Fig. 2), to identify the hydraulic conditions within
the sedimentation basin. The site contains a typical small-scale treatment unit that
shows fluctuations in purification efficiency. Another factor taken into
consideration in selection of the site was its proximity to the University of Oulu.
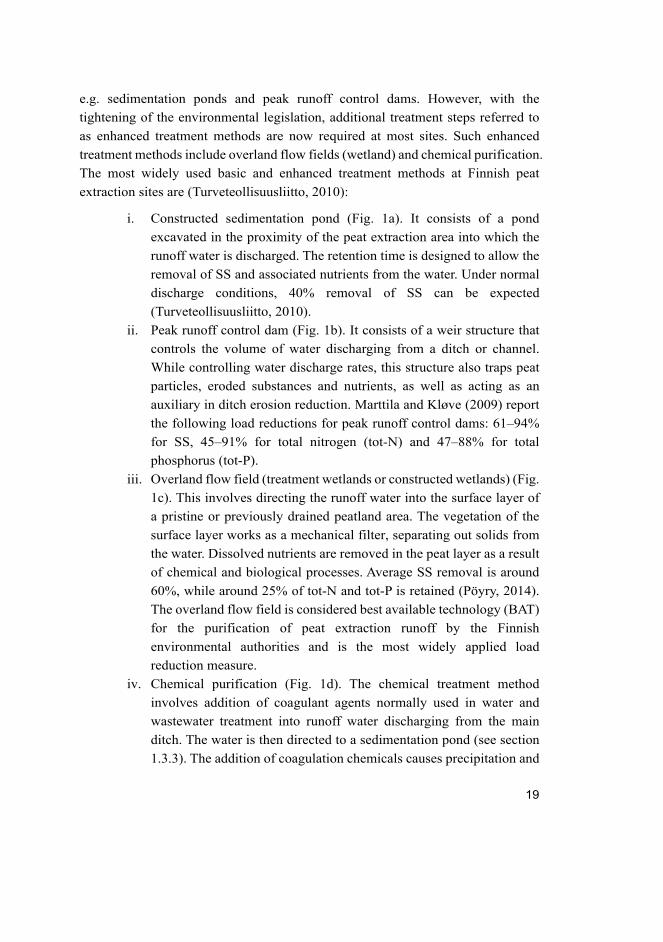
Ten electric conductivity sensors were placed within the Navettarimpi
sedimentation basin (Fig. 3) and connected to a central unit data logger, which
enabled continuous monitoring of EC values. For determination of the required
amount of tracer to be added, information on the background EC of the runoff water
was required. Therefore, the sensors were installed two weeks before the tracer was
added, to allow monitoring of background EC values. The amount of NaCl that
needed to be added so that the concentration of tracer in the basin resulted in an
increase in EC values exceeding the background EC variations (observed during
the two-week monitoring period) was then determined. Calibration curves (NaCl
31
[mg/L] plotted against EC [mS/cm]) were created for each sensor, using water
samples collected from the Navettarimpi site. The mass (m) of NaCl to be added
was calculated based on the estimated volume (V) of the sedimentation basin and
the required tracer concentration (Equation 1):
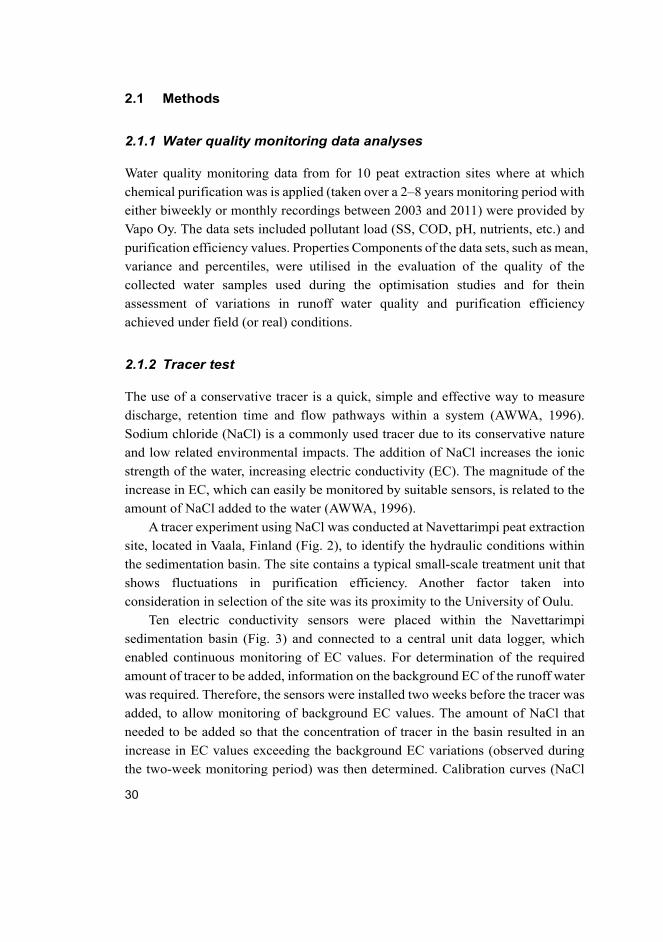
( ) = ( ) ∗ . ( ) (1)The pulse method of addition was utilised, where the whole tracer amount was
added in one step. The NaCl (3 kg) was first diluted in a 60-L bucket and then the
contents of the bucket were discharged into the dosing well (volume 1600 L). The
pump (discharge Q = 160 L/s) was then activated, resulting in a 10-s pulse duration.
Based on EC values measured in installed sensors, a map of the flow conditions
within the basin was created. Using the data collected by the sensor installed in the
basin outflow weir, the mean residence time was estimated using Equation 2 and
the mass of tracer recovered was estimated using Equation 3:
= ∑ ∗ ∗∆∑ ∗∆ (2) = ∗ ∑ ∗ ∆ (3)where Q is the discharge, ci is the tracer concentration at time ti, ∆ti is the constant
time interval (5 s) and n is the total number of data points collected.
Fig. 3. Schematic diagram of the sedimentation basin at Navettarimpi site and
placement of electric conductivity (EC) sensors during the tracer experiment.
32
2.2 Background studies: Results and discussion
Analyses of monitoring data and assessment of process conditions within existing
treatment facilities emphasised the challenges of effective purification of peat
extraction runoff water by chemical treatment. As mentioned in the introduction to
this thesis, achieving cost-effectiveness in the use of chemical treatment is a
difficult balance. While the simple structures and equipment used offer a somewhat
reliable operational routine, they do not provide the level of control necessary for
effective treatment. This, coupled with significant variations in water quality, can
result in significant fluctuations in purification efficiency.
2.2.1 Variations in runoff water quality and purification efficiency
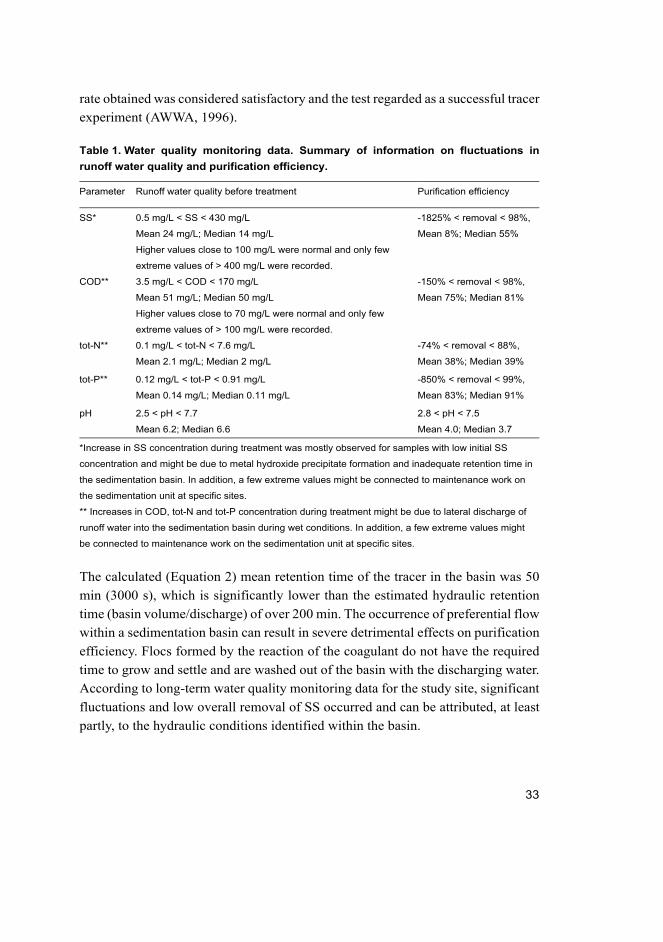
Analysis of water quality monitoring data revealed significant fluctuations in runoff
water quality and purification results (Table 1). It is important to highlight that the
values presented are a summary of data from 10 peat extraction sites where
different treatment facilities, coagulant types and dosage and process parameters
are used. Moreover, the data were collected between 2003 and 2011 and continuous
improvement of treatment facilities has been pursued since then, so the information
provided regarding purification results might not represent the current conditions.
Nevertheless, the information obtained confirms that there are significant
fluctuations in runoff water quality and that these should be taken into account
during the design and maintenance of chemical treatment facilities. Furthermore,
variations were observed in purification efficiency, highlighting the need for
innovative solutions to improve the reliability of the chemical purification method.
2.2.2 Tracer test
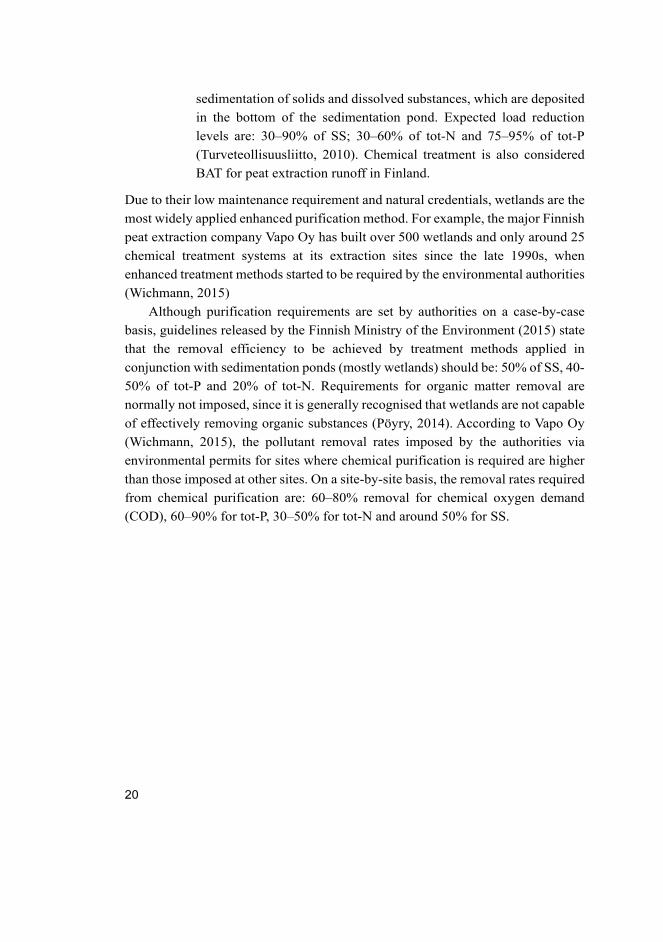
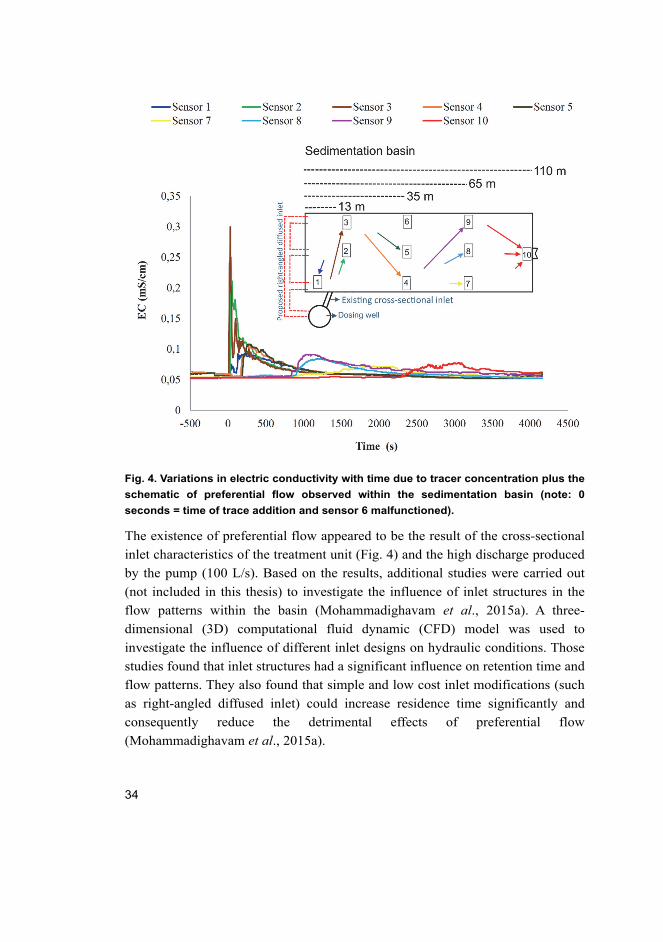
The magnitude of the observed peaks in EC values and the difference in timing of
the peaks measured by the different sensors revealed the existence of preferential
flow within the Navettarimpi sedimentation basin (Fig. 4). The tracer experiment
was interrupted after 4160 s (69.3 min) of tracer addition due to unpredicted lack
of incoming water. At the time of test interruption, the EC values measured by
sensor number 10 (discharge weir - outlet) had peaked and returned to the same
magnitude as the measured background values. However, only around 70% (2.13
kg) of the added mass of tracer was recovered (Equation 3). This might be the result
of back-mixing and dead zones within the basin. Nevertheless, the 70% recovery
33
rate obtained was considered satisfactory and the test regarded as a successful tracer
experiment (AWWA, 1996).
Table 1. Water quality monitoring data. Summary of information on fluctuations in
runoff water quality and purification efficiency.
Parameter Runoff water quality before treatment Purification efficiency
SS* 0.5 mg/L < SS < 430 mg/L
Mean 24 mg/L; Median 14 mg/L
Higher values close to 100 mg/L were normal and only few
extreme values of > 400 mg/L were recorded.
-1825% < removal < 98%,
Mean 8%; Median 55%
COD** 3.5 mg/L < COD < 170 mg/L
Mean 51 mg/L; Median 50 mg/L
Higher values close to 70 mg/L were normal and only few
extreme values of > 100 mg/L were recorded.
-150% < removal < 98%,
Mean 75%; Median 81%
tot-N** 0.1 mg/L < tot-N < 7.6 mg/L
Mean 2.1 mg/L; Median 2 mg/L
-74% < removal < 88%,
Mean 38%; Median 39%
tot-P** 0.12 mg/L < tot-P < 0.91 mg/L
Mean 0.14 mg/L; Median 0.11 mg/L
-850% < removal < 99%,
Mean 83%; Median 91%
pH 2.5 < pH < 7.7
Mean 6.2; Median 6.6
2.8 < pH < 7.5
Mean 4.0; Median 3.7
*Increase in SS concentration during treatment was mostly observed for samples with low initial SS
concentration and might be due to metal hydroxide precipitate formation and inadequate retention time in
the sedimentation basin. In addition, a few extreme values might be connected to maintenance work on
the sedimentation unit at specific sites.
** Increases in COD, tot-N and tot-P concentration during treatment might be due to lateral discharge of
runoff water into the sedimentation basin during wet conditions. In addition, a few extreme values might
be connected to maintenance work on the sedimentation unit at specific sites.
The calculated (Equation 2) mean retention time of the tracer in the basin was 50
min (3000 s), which is significantly lower than the estimated hydraulic retention
time (basin volume/discharge) of over 200 min. The occurrence of preferential flow
within a sedimentation basin can result in severe detrimental effects on purification
efficiency. Flocs formed by the reaction of the coagulant do not have the required
time to grow and settle and are washed out of the basin with the discharging water.
According to long-term water quality monitoring data for the study site, significant
fluctuations and low overall removal of SS occurred and can be attributed, at least
partly, to the hydraulic conditions identified within the basin.
34
Fig. 4. Variations in electric conductivity with time due to tracer concentration plus the
schematic of preferential flow observed within the sedimentation basin (note: 0
seconds = time of trace addition and sensor 6 malfunctioned).
The existence of preferential flow appeared to be the result of the cross-sectional
inlet characteristics of the treatment unit (Fig. 4) and the high discharge produced
by the pump (100 L/s). Based on the results, additional studies were carried out
(not included in this thesis) to investigate the influence of inlet structures in the
flow patterns within the basin (Mohammadighavam et al., 2015a). A three-
dimensional (3D) computational fluid dynamic (CFD) model was used to
investigate the influence of different inlet designs on hydraulic conditions. Those
studies found that inlet structures had a significant influence on retention time and
flow patterns. They also found that simple and low cost inlet modifications (such
as right-angled diffused inlet) could increase residence time significantly and
consequently reduce the detrimental effects of preferential flow
(Mohammadighavam et al., 2015a).
35
Another issue was detected during site visits through visual observations and
the tracer experiment, namely lack of appropriate slow mixing for an effective
flocculation process. As previously described, in normal treatment facilities, high
turbulence for the spread of coagulant is provided by the pumping system. The
runoff water is transferred from the ditch network into the dosing well, which
discharges into the sedimentation basin (Fig. 3). Although the flow of water
throughout the basin provides some fluid motion and therefore the opportunity for
flocculation to occur, the lack of adequate mixing for effective flocculation
presumably had a significant effect on the purification levels observed. The
influence of mixing on coagulation/flocculation with solid metal salts as the
coagulant was thus evaluated under laboratory conditions during the optimisation
studies (section 4.4).

36
37
3 Materials and methods
In the development and optimisation of coagulation-flocculation processes, some
of the most important steps are to identify: (i) the most suitable coagulant(s) for the
type of water in question, (ii) the required dosage of coagulant(s) and (iii) the
influence of process conditions (water pH and temperature, mixing etc.) on
coagulant performance (Bratby, 2006). These steps were followed in the
optimisation studies in this thesis, the results of which are reported in Papers IIV.
The methods applied during these optimisation studies are briefly summarised here
and are described in detail in the original publications (I–V). All tests were
performed under laboratory conditions and the research was conducted in
sequential phases, each resulting in an article.
Phase 1 (Paper I): The suitability of different solid metal salt coagulants for the
purification of peat extraction runoff water was studied by evaluation of dosage
requirements and purification efficiency (removal of target substances and settling
characteristics of flocs formed). Furthermore, the influence of process and water
quality parameters (pH, temperature and mixing) on coagulant performance was
investigated, as was the effect of pre-dissolution of the solid products on treatment
efficiency and process requirements such as mixing and settling time.
Phase 2 (Paper II): The ability of synthetic organic polymers to act as primary
coagulants in the purification of peat extraction runoff was evaluated. The best
performing metal salt coagulant from phase 1 was selected and its performance
(removal efficiency and settling characteristics) compared to that of selected
synthetic organic polymers. The influence of water pH and temperature on
purification results was also investigated.
Phase 3 (Paper III): The efficiency of the best performing metal salt (phase 1)
and synthetic organic polymer (phase 2) tested was compared to that of natural
organic polymers. Particular attention was paid to removal of organic matter by the
test coagulants. Organic matter fractionation analysis (size-exclusion liquid
chromatography coupled with organic carbon and organic nitrogen detection, LC-
OCD-OND) was performed on the raw water and treated samples, in order to
evaluate the effect of coagulant type on the removal of different dissolved organic
fractions. The influence of water pH on coagulant performance was also studied.
Phase 4 (Paper IV): Ferric sulphate was selected as the coagulant agent for this
phase of the tests, since it is the metal salt normally used at peat extraction sites.
The influence of variations in water quality (typical in peat extraction runoff) on
purification efficiency was investigated. A factorial design was used in the
38
experimental procedure and the results were evaluated using statistical methods
(Analysis of Variance (ANOVA) and orthogonal contrast (OC) calculations).
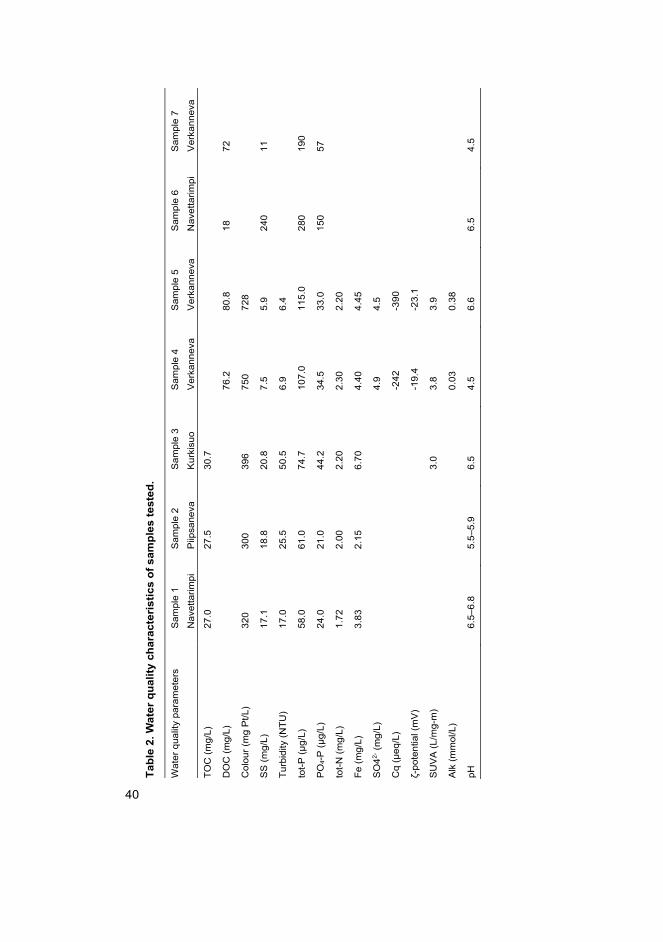
3.1 Peat extraction runoff water quality
Throughout the optimisation studies, samples were collected in 35-L containers
from different peat extraction sites in Finland (Fig. 2) and stored at 5–10 °C for the
duration of the test period (I–IV). A series of water quality analyses were conducted
on each sample at in-house facilities and by outsourced laboratories. General
characteristics of the runoff water samples are presented in Table 2, where samples
1 (Navettarimpi) and 2 (Piipsaneva) are from Paper I, sample 3 (Kurkisuo) is from
Paper II, samples 4 and 5 (Verkanneva) are from Paper III and samples 6
(Navettarimpi) and 7 (Verkanneva) are from Paper IV.
For evaluation of the influence of variations in water quality on purification
efficiency (Paper IV), samples 6 and 7 were combined and manipulated to produce
eight sub-samples for testing. The procedures used during the sample manipulation
process and the characteristics of the subsamples created are described in section
3.5. In general, water quality analyses (Table 2) were performed in each 35-L
container ‘as is’, in order to ensure accurate initial conditions and to evaluate
possible changes in water quality during the storage period. Constant monitoring
of pH, turbidity, colour and temperature of the samples was conducted before each
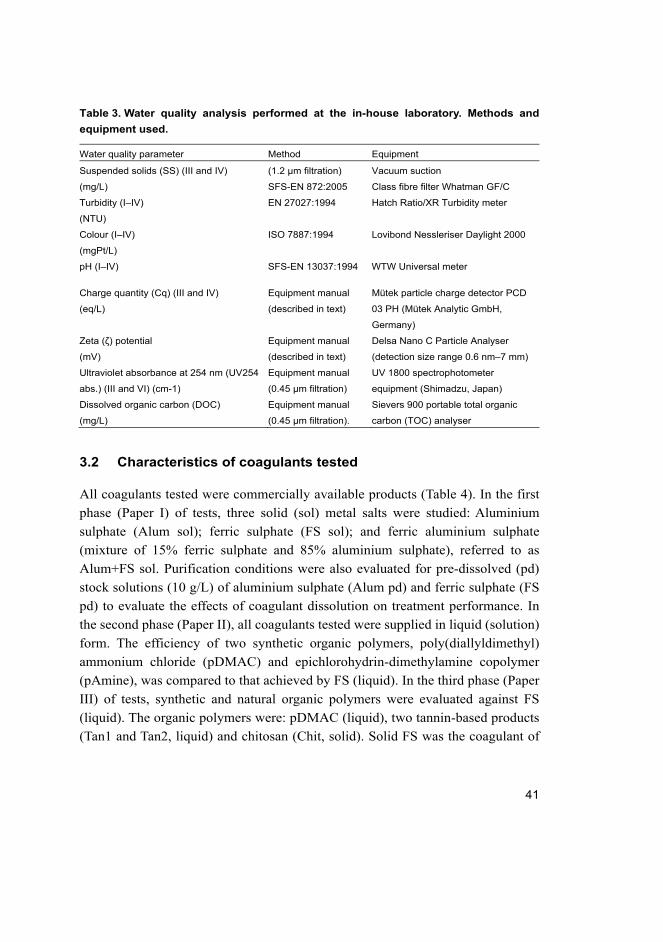
jar test experiment. Water quality analyses (raw water and treated samples)
conducted at the in-house laboratory and standard methods used are presented in
Table 3.
Charge quantity (Cq) measurements were performed using the Mütek particle
charge detector PCD 03 PH following the equipment manual. The method
measures the total surface charge contained in the suspension using the streaming
current principle. The samples were titrated using either cationic or anionic
polyelectrolyte (0.001 eq/L) until the charge of the sample was neutralised. The Cq
value (eq/L) of the sample was then determined based on the concentration and
amount of polymer required for neutralisation of fixed-volume samples. Zeta (ζ)
potential measurements were performed using a Delsa Nano C Particle Analyser
(detection range 0.6 nm-7 mm). The performance of the equipment was checked
using a mobility control (Otsuka Electronics Co, Ltd.) containing polystyrene latex
particles. Specific UV absorbance (SUVA) was determined as (Papers III and IV):
SUVA = UV254 abs./DOC (L/mg-m).
39
Water quality analyses (raw water and treated samples) were performed by the
certified Finnish Environment Institute laboratory, Oulu, Finland (for SFS-EN and
ISO standard methods used, please refer to Papers I–IV). These included: Total
phosphorus (tot-P) (Papers I–IV), phosphate-phosphorus (PO4-P) (Papers I–IV),
total iron (Fe) (Papers I–IV), sulphate (SO42-) (Papers III and IV), total nitrogen
(tot-N) (Papers I–IV), alkalinity (Alk) (Paper III), total organic carbon (TOC)
(Papers I and II), DOC (Paper IV); pH (I) and SS (Papers I, II and IV).
Organic matter fractionation analyses (Papers III) were performed by DOC-
Labor (Eisenbahnstrasse, Germany) using the LC-OCD-OND technique as fully
described in Huber et al. (2011). The method separates DOC into hydrophobic
organic carbon (HOC) and chromatographic dissolved organic carbon (CDOC).
HOC is determined as the difference between DOC and CDOC and thus all organic
carbon retained in the chromatography column is, in this context, defined as
‘hydrophobic’. The CDOC fraction (described as having a hydrophilic nature) is
further segregated into the following fractions: biopolymers (polysaccharides,
proteins and amino sugars, MW>10000 g/mol); humic substances (HS; MW 500–
1000 g/mol); building blocks (breakdown products of HS; MW 300–500 g/mol);
low MW (LMW) neutrals such as alcohols, aldehydes, ketones, sugars (MW<350
g/mol); and LMW acids (MW<350 g/mol) (Huber et al., 2011). Jar test experiments
were performed in which the optimum dosage of selected coagulants was applied.
Raw water (samples 4 and 5) and treated samples (two replicates) were stored in
50-mL plastic bottles and individually packed following the instructions of the
receiving laboratory (DOC-Labor). Samples were dispatched, received and
analysed within 72 hours.
40
Ta
ble
2. W
ate
r q
uali
ty c
ha
rac
teri
sti
cs o
f s
am
ple
s t
este
d.
Wat
er q
ualit
y pa
ram
eter
s S
ampl
e 1
Nav
etta
rimpi
Sam
ple
2
Piip
sane
va
Sam
ple
3
Kur
kisu
o
Sam
ple
4
Ver
kann
eva
Sam
ple
5
Ver
kann
eva
Sam
ple
6
Nav
etta
rimpi
Sam
ple
7
Ver
kann
eva
TOC
(mg/
L)
27.0
27
.5
30.7
DO
C (m
g/L)
76.2
80
.8
18
72
Col
our (
mg
Pt/L
) 32
0 30
0 39
6 75
0 72
8
SS
(mg/
L)
17.1
18
.8
20.8
7.
5 5.
9 24
0 11
Turb
idity
(NTU
) 17
.0
25.5
50
.5
6.9
6.4
tot-P
(µg/
L)
58.0
61
.0
74.7
10
7.0
115.
0 28
0 19
0
PO
4-P
(µg/
L)
24.0
21
.0
44.2
34
.5
33.0
15
0 57
tot-N
(mg/
L)
1.72
2.
00
2.20
2.
30
2.20
Fe (m
g/L)
3.
83
2.15
6.
70
4.40
4.
45
SO
42- (m
g/L)
4.9
4.5
Cq
(µeq
/L)
-2
42
-390
ζ-po
tent
ial (
mV
)
-19.
4 -2
3.1
SU
VA
(L/m
g-m
)
3.
0 3.
8 3.
9
Alk
(mm
ol/L
)
0.03
0.
38
pH
6.5–
6.8
5.5–
5.9
6.5
4.5
6.6
6.5
4.5
41
Table 3. Water quality analysis performed at the in-house laboratory. Methods and
equipment used.
Water quality parameter Method Equipment
Suspended solids (SS) (III and IV)
(mg/L)
(1.2 µm filtration)
SFS-EN 872:2005
Vacuum suction
Class fibre filter Whatman GF/C
Turbidity (I–IV)
(NTU)
EN 27027:1994 Hatch Ratio/XR Turbidity meter
Colour (I–IV)
(mgPt/L)
ISO 7887:1994 Lovibond Nessleriser Daylight 2000
pH (I–IV) SFS-EN 13037:1994 WTW Universal meter
Charge quantity (Cq) (III and IV)
(eq/L)
Equipment manual
(described in text)
Mütek particle charge detector PCD
03 PH (Mütek Analytic GmbH,
Germany)
Zeta (ζ) potential
(mV)
Equipment manual
(described in text)
Delsa Nano C Particle Analyser
(detection size range 0.6 nm–7 mm)
Ultraviolet absorbance at 254 nm (UV254
abs.) (III and VI) (cm-1)
Equipment manual
(0.45 µm filtration)
UV 1800 spectrophotometer
equipment (Shimadzu, Japan)
Dissolved organic carbon (DOC)
(mg/L)
Equipment manual
(0.45 µm filtration).
Sievers 900 portable total organic
carbon (TOC) analyser
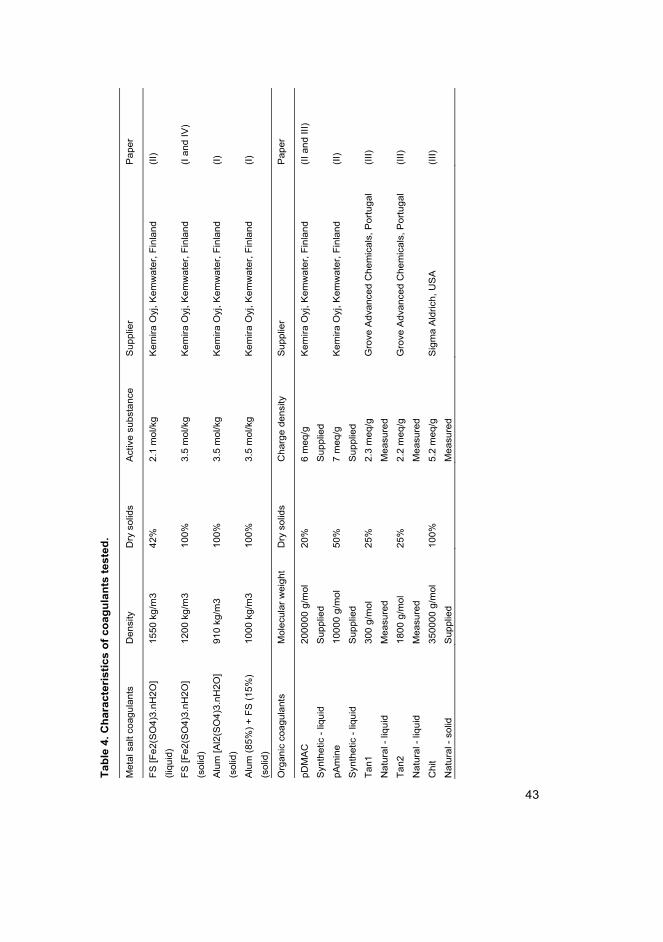
3.2 Characteristics of coagulants tested
All coagulants tested were commercially available products (Table 4). In the first
phase (Paper I) of tests, three solid (sol) metal salts were studied: Aluminium
sulphate (Alum sol); ferric sulphate (FS sol); and ferric aluminium sulphate
(mixture of 15% ferric sulphate and 85% aluminium sulphate), referred to as
Alum+FS sol. Purification conditions were also evaluated for pre-dissolved (pd)
stock solutions (10 g/L) of aluminium sulphate (Alum pd) and ferric sulphate (FS
pd) to evaluate the effects of coagulant dissolution on treatment performance. In
the second phase (Paper II), all coagulants tested were supplied in liquid (solution)
form. The efficiency of two synthetic organic polymers, poly(diallyldimethyl)
ammonium chloride (pDMAC) and epichlorohydrin-dimethylamine copolymer
(pAmine), was compared to that achieved by FS (liquid). In the third phase (Paper
III) of tests, synthetic and natural organic polymers were evaluated against FS
(liquid). The organic polymers were: pDMAC (liquid), two tannin-based products
(Tan1 and Tan2, liquid) and chitosan (Chit, solid). Solid FS was the coagulant of
42
choice in the fourth and final testing phase (Paper IV), in which the coagulant was
pre-dissolved prior to addition, i.e. the coagulant was dosed as a stock solution.
When applicable, stock solutions were prepared by dilution of the
commercially supplied products with deionised water. The only exception was
chitosan, the stock solution of which was prepared by dissolving the solid product
(2.5 g) in a solution containing acetic acid 100% (5 mL) and deionised water (492.5
mL). Reported dosages refer to the ‘effective dosage’ of the coagulant, calculated
from the volume or mass dosed and the percentage of dry solids (active ingredient)
contained in the products supplied (Table 4).
Data on the MW of pDMAC and Chit (Table 4) were provided by the suppliers.
The average MW of the tannin-based polymers was determined by an out-sourced
laboratory at Åbo Academy University, Turku, Finland. A full description of the
methodology used is provided in Song et al. (2008). Data on the CD (Table 4) of
pDMAC and pAmine was supplied by the manufacturer, while the CD of the
natural polymers was determined at the in-house laboratory using the Mütek
particle charge detector PCD 03 PH. Polymer solutions of varying concentrations
were prepared and Cq measurements were performed following the methodology
previously described. The CD of the polymers (eq/g) was calculated based on the
concentration of the coagulant solutions.
3.3 Jar test procedures
Coagulation-flocculation studies were performed using the jar test methodology. A
six (1-L) jar programmable paddle stirrer of model Flocculator 2000 (Kemira
Kemwater) was used (Fig. 5). During the evaluation of dosage requirements,
increasing doses of coagulant were added sequentially to 1-L samples (2–3
replicates). Mixing parameters applied were: (Paper I) pd/sol coagulants: 300/400
rpm for 10/60 s, 50/70 rpm for 25/15 min followed by 30 minutes of sedimentation;
(Papers II–IV) 300 rpm for 10 s followed by 50 rpm for 25 min and 30 min of
sedimentation. Supernatant water samples were collected (200–400 mL) and
purification efficiency was first evaluated by measurements of colour (Papers I-IV),
turbidity (Papers I–IV), pH (Papers I–IV), temperature (Papers I–IV), Cq (Paper
III) and ζ-potential (Paper III). Dosage requirement curves were then constructed,
as shown in Figure 6 using the example of dosage curves from phase 3 of tests
(Paper III). The dose which provided the best removal of colour and turbidity, with
low variation among experimental replicates, was identified as the optimum dosage
rate of the coagulants.
43
Ta
ble
4. C
ha
rac
teri
sti
cs o
f co
ag
ula
nts
te
ste
d.
Met
al s
alt c
oagu
lant
s D
ensi
ty
Dry
sol
ids
Act
ive
subs
tanc
e S
uppl
ier
Pap
er
FS [F
e2(S
O4)
3.nH
2O]
(liqu
id)
1550
kg/
m3
42%
2.
1 m
ol/k
g K
emira
Oyj
, Kem
wat
er, F
inla
nd
(II)
FS [F
e2(S
O4)
3.nH
2O]
(sol
id)
1200
kg/
m3
100%
3.
5 m
ol/k
g K
emira
Oyj
, Kem
wat
er, F
inla
nd
(I an
d IV
)
Alu
m [A
l2(S
O4)
3.nH
2O]
(sol
id)
910
kg/m
3 10
0%
3.5
mol
/kg
Kem
ira O
yj, K
emw
ater
, Fin
land
(I)
Alu
m (8
5%) +
FS
(15%
)
(sol
id)
1000
kg/
m3
100%
3.
5 m
ol/k
g K
emira
Oyj
, Kem
wat
er, F
inla
nd
(I)
Org
anic
coa
gula
nts
Mol
ecul
ar w
eigh
t D
ry s
olid
s C
harg
e de
nsity
S
uppl
ier
Pap
er
pDM
AC
Syn
thet
ic -
liqui
d
2000
00 g
/mol
Sup
plie
d
20%
6
meq
/g
Sup
plie
d
Kem
ira O
yj, K
emw
ater
, Fin
land
(II
and
III)
pAm
ine
Syn
thet
ic -
liqui
d
1000
0 g/
mol
Sup
plie
d
50%
7
meq
/g
Sup
plie
d
Kem
ira O
yj, K
emw
ater
, Fin
land
(II
)
Tan1
Nat
ural
- liq
uid
300
g/m
ol
Mea
sure
d
25%
2.
3 m
eq/g
Mea
sure
d
Gro
ve A
dvan
ced
Che
mic
als,
Por
tuga
l (II
I)
Tan2
Nat
ural
- liq
uid
1800
g/m
ol
Mea
sure
d
25%
2.
2 m
eq/g
Mea
sure
d
Gro
ve A
dvan
ced
Che
mic
als,
Por
tuga
l (II
I)
Chi
t
Nat
ural
- so
lid
3500
00 g
/mol
Sup
plie
d
100%
5.
2 m
eq/g
Mea
sure
d
Sig
ma
Ald
rich,
US
A
(III)
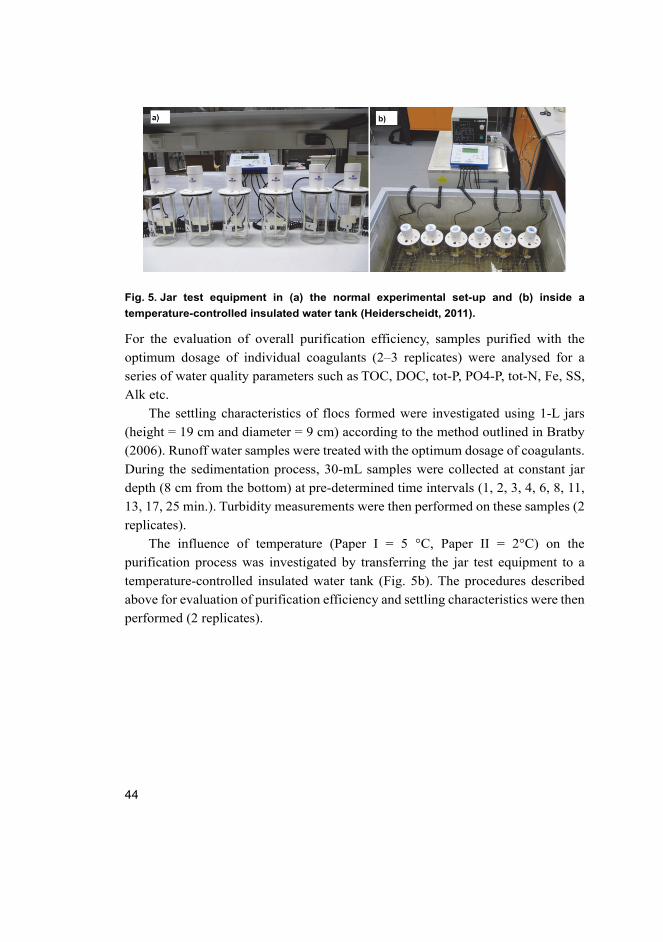
44
Fig. 5. Jar test equipment in (a) the normal experimental set-up and (b) inside a
temperature-controlled insulated water tank (Heiderscheidt, 2011).
For the evaluation of overall purification efficiency, samples purified with the
optimum dosage of individual coagulants (2–3 replicates) were analysed for a
series of water quality parameters such as TOC, DOC, tot-P, PO4-P, tot-N, Fe, SS,
Alk etc.
The settling characteristics of flocs formed were investigated using 1-L jars
(height = 19 cm and diameter = 9 cm) according to the method outlined in Bratby
(2006). Runoff water samples were treated with the optimum dosage of coagulants.
During the sedimentation process, 30-mL samples were collected at constant jar
depth (8 cm from the bottom) at pre-determined time intervals (1, 2, 3, 4, 6, 8, 11,
13, 17, 25 min.). Turbidity measurements were then performed on these samples (2
replicates).
The influence of temperature (Paper I = 5 °C, Paper II = 2°C) on the
purification process was investigated by transferring the jar test equipment to a
temperature-controlled insulated water tank (Fig. 5b). The procedures described
above for evaluation of purification efficiency and settling characteristics were then
performed (2 replicates).
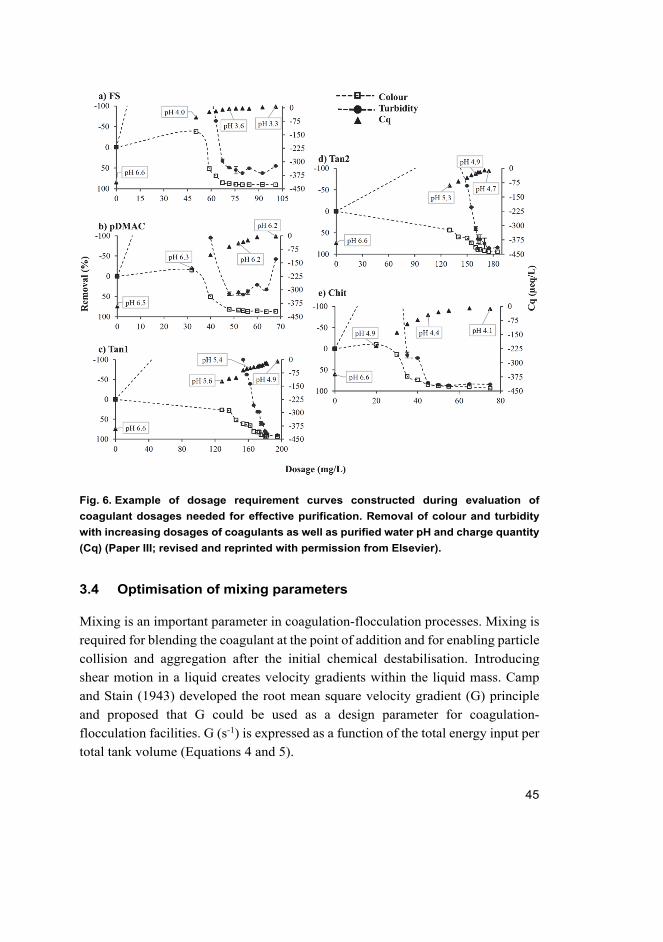
45
Fig. 6. Example of dosage requirement curves constructed during evaluation of
coagulant dosages needed for effective purification. Removal of colour and turbidity
with increasing dosages of coagulants as well as purified water pH and charge quantity
(Cq) (Paper III; revised and reprinted with permission from Elsevier).
3.4 Optimisation of mixing parameters
Mixing is an important parameter in coagulation-flocculation processes. Mixing is
required for blending the coagulant at the point of addition and for enabling particle
collision and aggregation after the initial chemical destabilisation. Introducing
shear motion in a liquid creates velocity gradients within the liquid mass. Camp
and Stain (1943) developed the root mean square velocity gradient (G) principle
and proposed that G could be used as a design parameter for coagulation-
flocculation facilities. G (s-1) is expressed as a function of the total energy input per
total tank volume (Equations 4 and 5).
46
= (4) = (5)where W is the power dissipation function, P (Nm/s) is the power drawn by the
mixing device, V (m3) is the volume of the tank (vessel, container etc.) and µ
(Ns/m2) is the absolute viscosity of water.
The one factor-at-a-time method was used in the design of experiments to
investigate the influence of mixing parameters on purification results of solid and
pre-dissolved metal salt coagulants (paper I). Optimum coagulants dosages were
applied and the jar-test procedure utilized. Four mixing parameters were evaluated:
slow mixing time (5, 10, 15 and 25 min), slow mixing speed (20, 50, 70 and 90
rpm), fast mixing time (10, 60 and 120 s) and fast mixing speed (100, 200, 300 and
400 rpm). The tests were performed in sequential stages where in each stage three
parameters were kept constant while the fourth parameter was systematically varied.
Two replicate runs of each test were executed in which turbidity and colour
measurements were performed. Samples from the replicate runs with the highest
and lowest removal of turbidity were then further analysed for SS, tot-P, PO4-P,
tot-N and TOC.
The root mean square velocity gradient (G s-1) induced in the fluid mass was
determined using Equations 4 and 5. In the jar test equipment used (Fig. 5), mixing
was provided by a mechanical mixer with rotating blades. The power (P) drawn by
a mechanical mixer with rotating blades is given by Equation 6.
= ∗ ∗ ∗ (6)where ϕ (3.5) is a dimensionless power number related to mixing device and
container geometry (extracted from Bratby, 2006), n is the mixer rotational speed
in revolutions per second, ρ (kg/m3) is water density; and D is the diameter (m) of
the mixer impeller.
3.5 Influence of water quality variations on purification efficiency -
Factorial design
For evaluation of the influence of water quality variations on purification efficiency
(Paper IV), a 24 factorial design was applied in the jar test experiment. The study
investigated how the variation in four selected factors between two levels (high and
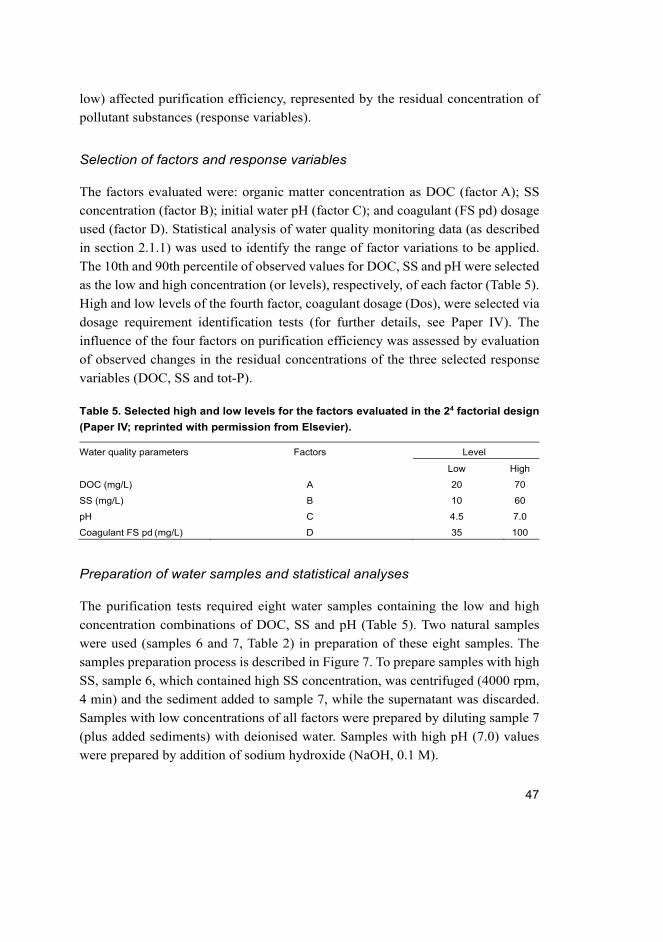
47
low) affected purification efficiency, represented by the residual concentration of
pollutant substances (response variables).
Selection of factors and response variables
The factors evaluated were: organic matter concentration as DOC (factor A); SS
concentration (factor B); initial water pH (factor C); and coagulant (FS pd) dosage
used (factor D). Statistical analysis of water quality monitoring data (as described
in section 2.1.1) was used to identify the range of factor variations to be applied.
The 10th and 90th percentile of observed values for DOC, SS and pH were selected
as the low and high concentration (or levels), respectively, of each factor (Table 5).
High and low levels of the fourth factor, coagulant dosage (Dos), were selected via
dosage requirement identification tests (for further details, see Paper IV). The
influence of the four factors on purification efficiency was assessed by evaluation
of observed changes in the residual concentrations of the three selected response
variables (DOC, SS and tot-P).
Table 5. Selected high and low levels for the factors evaluated in the 24 factorial design
(Paper IV; reprinted with permission from Elsevier).
Water quality parameters Factors Level
Low High
DOC (mg/L) A 20 70
SS (mg/L) B 10 60
pH C 4.5 7.0
Coagulant FS pd (mg/L) D 35 100
Preparation of water samples and statistical analyses
The purification tests required eight water samples containing the low and high
concentration combinations of DOC, SS and pH (Table 5). Two natural samples
were used (samples 6 and 7, Table 2) in preparation of these eight samples. The
samples preparation process is described in Figure 7. To prepare samples with high
SS, sample 6, which contained high SS concentration, was centrifuged (4000 rpm,
4 min) and the sediment added to sample 7, while the supernatant was discarded.
Samples with low concentrations of all factors were prepared by diluting sample 7
(plus added sediments) with deionised water. Samples with high pH (7.0) values
were prepared by addition of sodium hydroxide (NaOH, 0.1 M).
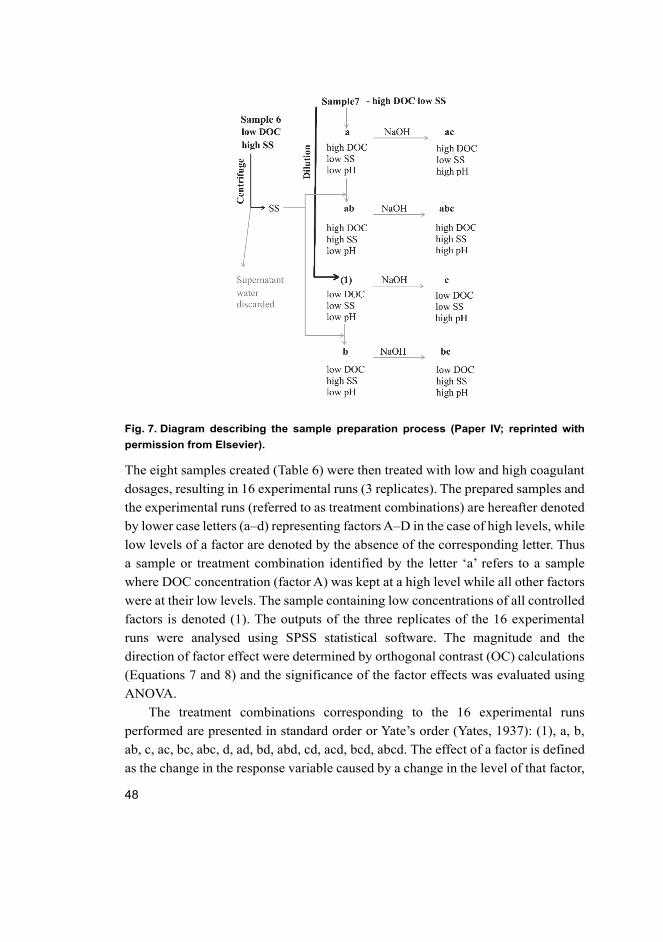
48
Fig. 7. Diagram describing the sample preparation process (Paper IV; reprinted with
permission from Elsevier).
The eight samples created (Table 6) were then treated with low and high coagulant
dosages, resulting in 16 experimental runs (3 replicates). The prepared samples and
the experimental runs (referred to as treatment combinations) are hereafter denoted
by lower case letters (a–d) representing factors A–D in the case of high levels, while
low levels of a factor are denoted by the absence of the corresponding letter. Thus
a sample or treatment combination identified by the letter ‘a’ refers to a sample
where DOC concentration (factor A) was kept at a high level while all other factors
were at their low levels. The sample containing low concentrations of all controlled
factors is denoted (1). The outputs of the three replicates of the 16 experimental
runs were analysed using SPSS statistical software. The magnitude and the
direction of factor effect were determined by orthogonal contrast (OC) calculations
(Equations 7 and 8) and the significance of the factor effects was evaluated using
ANOVA.
The treatment combinations corresponding to the 16 experimental runs
performed are presented in standard order or Yate’s order (Yates, 1937): (1), a, b,
ab, c, ac, bc, abc, d, ad, bd, abd, cd, acd, bcd, abcd. The effect of a factor is defined
as the change in the response variable caused by a change in the level of that factor,
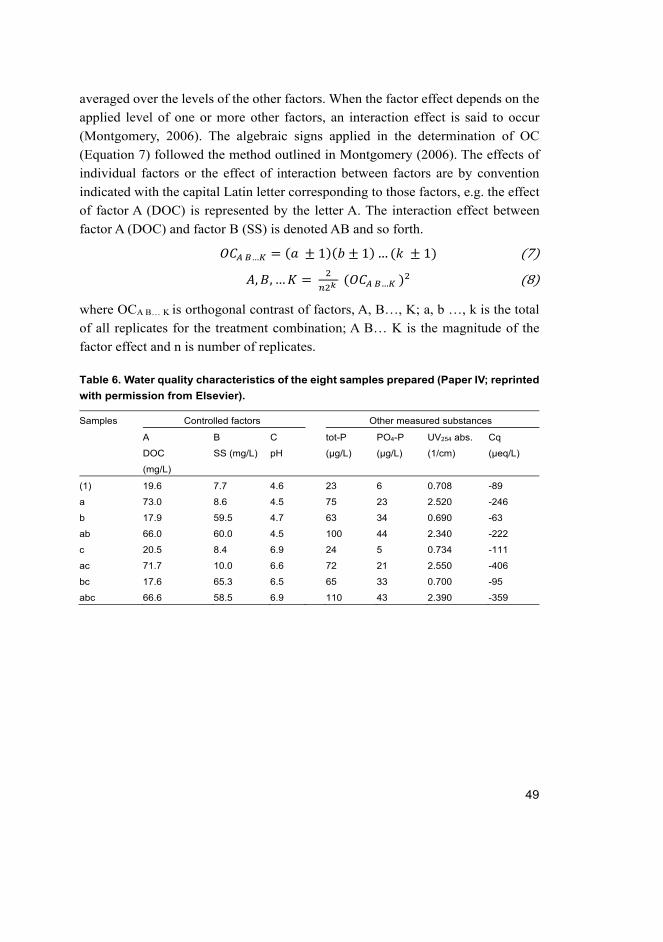
49
averaged over the levels of the other factors. When the factor effect depends on the
applied level of one or more other factors, an interaction effect is said to occur
(Montgomery, 2006). The algebraic signs applied in the determination of OC
(Equation 7) followed the method outlined in Montgomery (2006). The effects of
individual factors or the effect of interaction between factors are by convention
indicated with the capital Latin letter corresponding to those factors, e.g. the effect
of factor A (DOC) is represented by the letter A. The interaction effect between
factor A (DOC) and factor B (SS) is denoted AB and so forth.
… = ( ± 1)( ± 1)…( ± 1) (7) , , … = ( … ) (8)where OCA B… K is orthogonal contrast of factors, A, B…, K; a, b …, k is the total
of all replicates for the treatment combination; A B… K is the magnitude of the
factor effect and n is number of replicates.
Table 6. Water quality characteristics of the eight samples prepared (Paper IV; reprinted
with permission from Elsevier).
Samples Controlled factors Other measured substances
A
DOC
(mg/L)
B
SS (mg/L)
C
pH
tot-P
(µg/L)
PO4-P
(µg/L)
UV254 abs.
(1/cm)
Cq
(µeq/L)
(1) 19.6 7.7 4.6 23 6 0.708 -89
a 73.0 8.6 4.5 75 23 2.520 -246
b 17.9 59.5 4.7 63 34 0.690 -63
ab 66.0 60.0 4.5 100 44 2.340 -222
c 20.5 8.4 6.9 24 5 0.734 -111
ac 71.7 10.0 6.6 72 21 2.550 -406
bc 17.6 65.3 6.5 65 33 0.700 -95
abc 66.6 58.5 6.9 110 43 2.390 -359

50
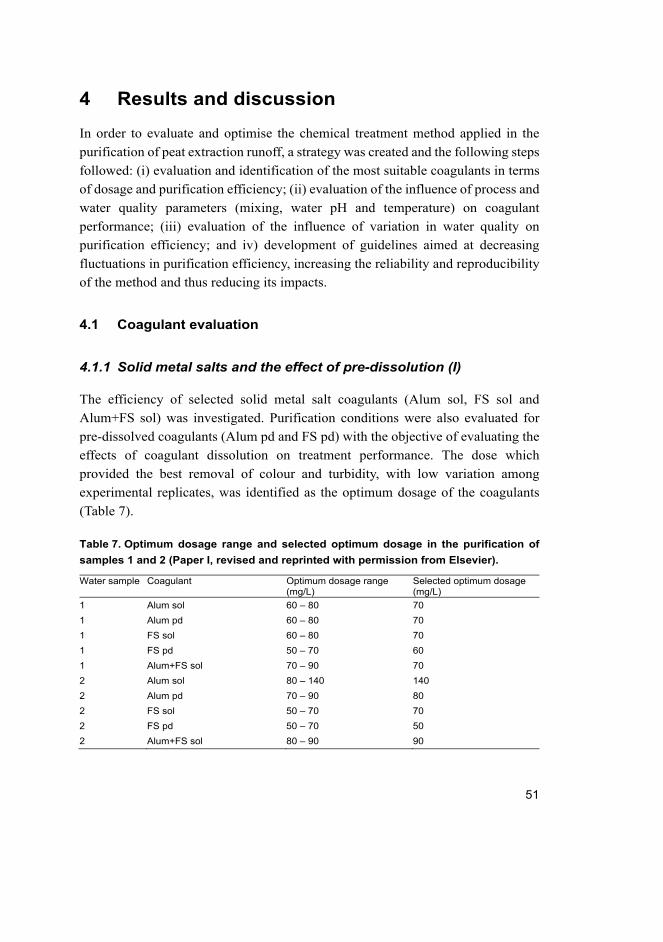
51
4 Results and discussion
In order to evaluate and optimise the chemical treatment method applied in the
purification of peat extraction runoff, a strategy was created and the following steps
followed: (i) evaluation and identification of the most suitable coagulants in terms
of dosage and purification efficiency; (ii) evaluation of the influence of process and
water quality parameters (mixing, water pH and temperature) on coagulant
performance; (iii) evaluation of the influence of variation in water quality on
purification efficiency; and iv) development of guidelines aimed at decreasing
fluctuations in purification efficiency, increasing the reliability and reproducibility
of the method and thus reducing its impacts.
4.1 Coagulant evaluation
4.1.1 Solid metal salts and the effect of pre-dissolution (I)
The efficiency of selected solid metal salt coagulants (Alum sol, FS sol and
Alum+FS sol) was investigated. Purification conditions were also evaluated for
pre-dissolved coagulants (Alum pd and FS pd) with the objective of evaluating the
effects of coagulant dissolution on treatment performance. The dose which
provided the best removal of colour and turbidity, with low variation among
experimental replicates, was identified as the optimum dosage of the coagulants
(Table 7).
Table 7. Optimum dosage range and selected optimum dosage in the purification of
samples 1 and 2 (Paper I, revised and reprinted with permission from Elsevier).
Water sample Coagulant Optimum dosage range (mg/L)
Selected optimum dosage (mg/L)
1 Alum sol 60 – 80 70 1 Alum pd 60 – 80 70 1 FS sol 60 – 80 70 1 FS pd 50 – 70 60 1 Alum+FS sol 70 – 90 70 2 Alum sol 80 – 140 140 2 Alum pd 70 – 90 80 2 FS sol 50 – 70 70 2 FS pd 50 – 70 50 2 Alum+FS sol 80 – 90 90
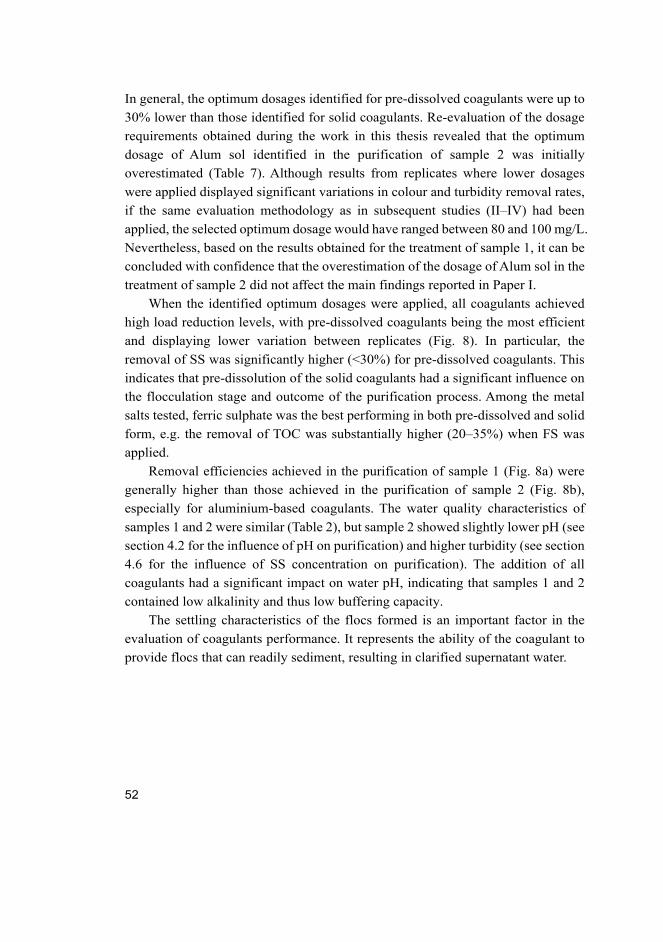
52
In general, the optimum dosages identified for pre-dissolved coagulants were up to
30% lower than those identified for solid coagulants. Re-evaluation of the dosage
requirements obtained during the work in this thesis revealed that the optimum
dosage of Alum sol identified in the purification of sample 2 was initially
overestimated (Table 7). Although results from replicates where lower dosages
were applied displayed significant variations in colour and turbidity removal rates,
if the same evaluation methodology as in subsequent studies (II–IV) had been
applied, the selected optimum dosage would have ranged between 80 and 100 mg/L.
Nevertheless, based on the results obtained for the treatment of sample 1, it can be
concluded with confidence that the overestimation of the dosage of Alum sol in the
treatment of sample 2 did not affect the main findings reported in Paper I.
When the identified optimum dosages were applied, all coagulants achieved
high load reduction levels, with pre-dissolved coagulants being the most efficient
and displaying lower variation between replicates (Fig. 8). In particular, the
removal of SS was significantly higher (<30%) for pre-dissolved coagulants. This
indicates that pre-dissolution of the solid coagulants had a significant influence on
the flocculation stage and outcome of the purification process. Among the metal
salts tested, ferric sulphate was the best performing in both pre-dissolved and solid
form, e.g. the removal of TOC was substantially higher (20–35%) when FS was
applied.
Removal efficiencies achieved in the purification of sample 1 (Fig. 8a) were
generally higher than those achieved in the purification of sample 2 (Fig. 8b),
especially for aluminium-based coagulants. The water quality characteristics of
samples 1 and 2 were similar (Table 2), but sample 2 showed slightly lower pH (see
section 4.2 for the influence of pH on purification) and higher turbidity (see section
4.6 for the influence of SS concentration on purification). The addition of all
coagulants had a significant impact on water pH, indicating that samples 1 and 2
contained low alkalinity and thus low buffering capacity.
The settling characteristics of the flocs formed is an important factor in the
evaluation of coagulants performance. It represents the ability of the coagulant to
provide flocs that can readily sediment, resulting in clarified supernatant water.
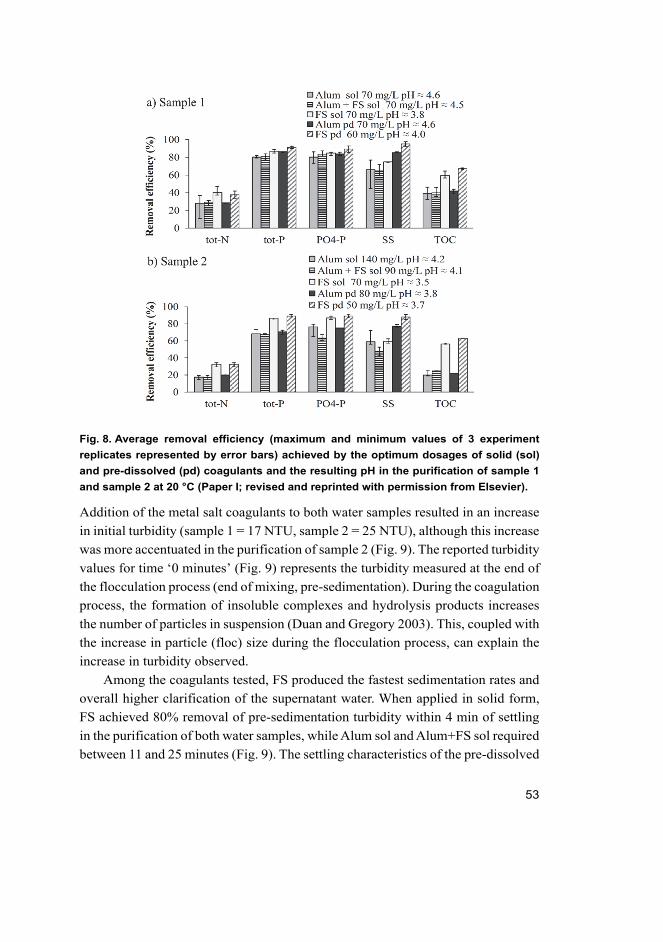
53
Fig. 8. Average removal efficiency (maximum and minimum values of 3 experiment
replicates represented by error bars) achieved by the optimum dosages of solid (sol)
and pre-dissolved (pd) coagulants and the resulting pH in the purification of sample 1
and sample 2 at 20 °C (Paper I; revised and reprinted with permission from Elsevier).
Addition of the metal salt coagulants to both water samples resulted in an increase
in initial turbidity (sample 1 = 17 NTU, sample 2 = 25 NTU), although this increase
was more accentuated in the purification of sample 2 (Fig. 9). The reported turbidity
values for time ‘0 minutes’ (Fig. 9) represents the turbidity measured at the end of
the flocculation process (end of mixing, pre-sedimentation). During the coagulation
process, the formation of insoluble complexes and hydrolysis products increases
the number of particles in suspension (Duan and Gregory 2003). This, coupled with
the increase in particle (floc) size during the flocculation process, can explain the
increase in turbidity observed.
Among the coagulants tested, FS produced the fastest sedimentation rates and
overall higher clarification of the supernatant water. When applied in solid form,
FS achieved 80% removal of pre-sedimentation turbidity within 4 min of settling
in the purification of both water samples, while Alum sol and Alum+FS sol required
between 11 and 25 minutes (Fig. 9). The settling characteristics of the pre-dissolved
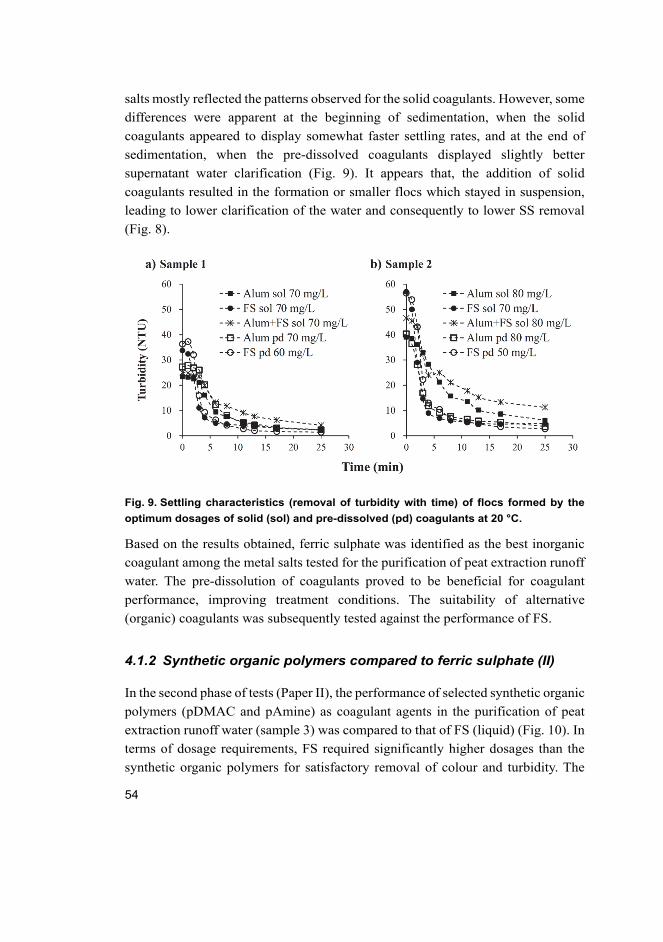
54
salts mostly reflected the patterns observed for the solid coagulants. However, some
differences were apparent at the beginning of sedimentation, when the solid
coagulants appeared to display somewhat faster settling rates, and at the end of
sedimentation, when the pre-dissolved coagulants displayed slightly better
supernatant water clarification (Fig. 9). It appears that, the addition of solid
coagulants resulted in the formation or smaller flocs which stayed in suspension,
leading to lower clarification of the water and consequently to lower SS removal
(Fig. 8).
Fig. 9. Settling characteristics (removal of turbidity with time) of flocs formed by the
optimum dosages of solid (sol) and pre-dissolved (pd) coagulants at 20 °C.
Based on the results obtained, ferric sulphate was identified as the best inorganic
coagulant among the metal salts tested for the purification of peat extraction runoff
water. The pre-dissolution of coagulants proved to be beneficial for coagulant
performance, improving treatment conditions. The suitability of alternative
(organic) coagulants was subsequently tested against the performance of FS.
4.1.2 Synthetic organic polymers compared to ferric sulphate (II)
In the second phase of tests (Paper II), the performance of selected synthetic organic
polymers (pDMAC and pAmine) as coagulant agents in the purification of peat
extraction runoff water (sample 3) was compared to that of FS (liquid) (Fig. 10). In
terms of dosage requirements, FS required significantly higher dosages than the
synthetic organic polymers for satisfactory removal of colour and turbidity. The
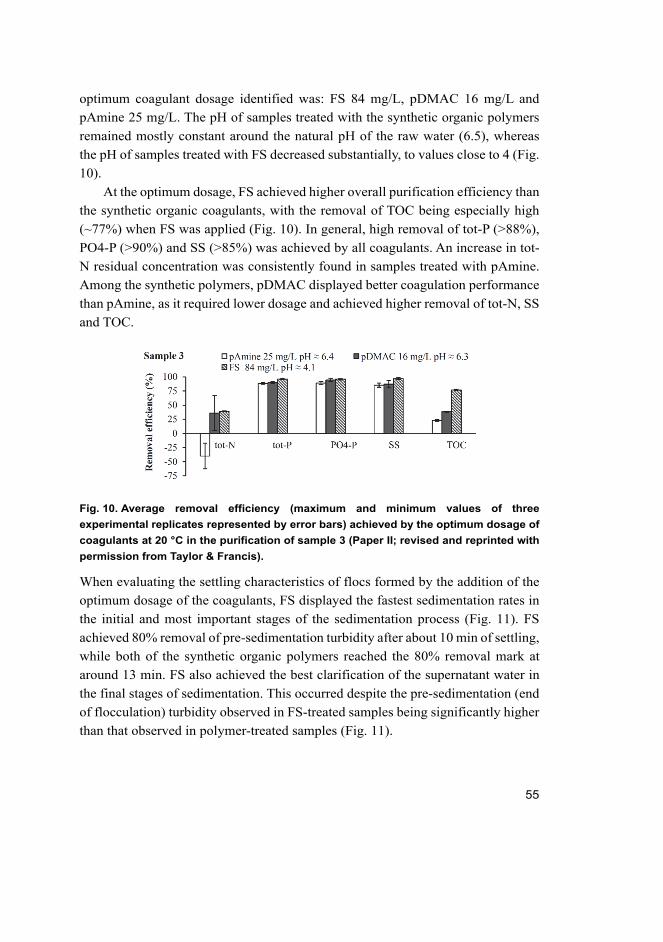
55
optimum coagulant dosage identified was: FS 84 mg/L, pDMAC 16 mg/L and
pAmine 25 mg/L. The pH of samples treated with the synthetic organic polymers
remained mostly constant around the natural pH of the raw water (6.5), whereas
the pH of samples treated with FS decreased substantially, to values close to 4 (Fig.
10).
At the optimum dosage, FS achieved higher overall purification efficiency than
the synthetic organic coagulants, with the removal of TOC being especially high
(~77%) when FS was applied (Fig. 10). In general, high removal of tot-P (>88%),
PO4-P (>90%) and SS (>85%) was achieved by all coagulants. An increase in tot-
N residual concentration was consistently found in samples treated with pAmine.
Among the synthetic polymers, pDMAC displayed better coagulation performance
than pAmine, as it required lower dosage and achieved higher removal of tot-N, SS
and TOC.
Fig. 10. Average removal efficiency (maximum and minimum values of three
experimental replicates represented by error bars) achieved by the optimum dosage of
coagulants at 20 °C in the purification of sample 3 (Paper II; revised and reprinted with
permission from Taylor & Francis).
When evaluating the settling characteristics of flocs formed by the addition of the
optimum dosage of the coagulants, FS displayed the fastest sedimentation rates in
the initial and most important stages of the sedimentation process (Fig. 11). FS
achieved 80% removal of pre-sedimentation turbidity after about 10 min of settling,
while both of the synthetic organic polymers reached the 80% removal mark at
around 13 min. FS also achieved the best clarification of the supernatant water in
the final stages of sedimentation. This occurred despite the pre-sedimentation (end
of flocculation) turbidity observed in FS-treated samples being significantly higher
than that observed in polymer-treated samples (Fig. 11).
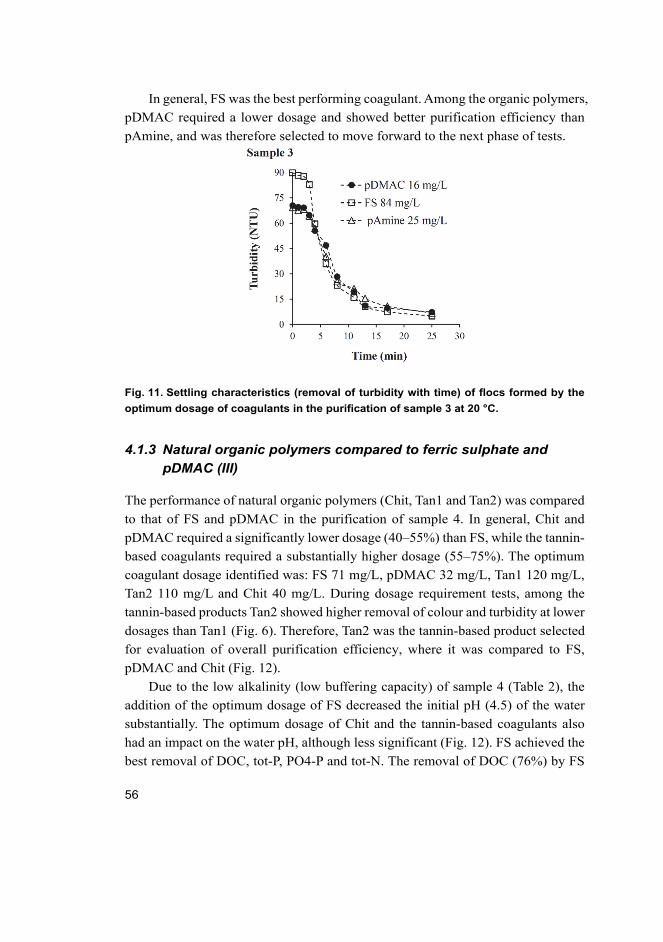
56
In general, FS was the best performing coagulant. Among the organic polymers,
pDMAC required a lower dosage and showed better purification efficiency than
pAmine, and was therefore selected to move forward to the next phase of tests.
Fig. 11. Settling characteristics (removal of turbidity with time) of flocs formed by the
optimum dosage of coagulants in the purification of sample 3 at 20 °C.
4.1.3 Natural organic polymers compared to ferric sulphate and
pDMAC (III)
The performance of natural organic polymers (Chit, Tan1 and Tan2) was compared
to that of FS and pDMAC in the purification of sample 4. In general, Chit and
pDMAC required a significantly lower dosage (40–55%) than FS, while the tannin-
based coagulants required a substantially higher dosage (55–75%). The optimum
coagulant dosage identified was: FS 71 mg/L, pDMAC 32 mg/L, Tan1 120 mg/L,
Tan2 110 mg/L and Chit 40 mg/L. During dosage requirement tests, among the
tannin-based products Tan2 showed higher removal of colour and turbidity at lower
dosages than Tan1 (Fig. 6). Therefore, Tan2 was the tannin-based product selected
for evaluation of overall purification efficiency, where it was compared to FS,
pDMAC and Chit (Fig. 12).
Due to the low alkalinity (low buffering capacity) of sample 4 (Table 2), the
addition of the optimum dosage of FS decreased the initial pH (4.5) of the water
substantially. The optimum dosage of Chit and the tannin-based coagulants also
had an impact on the water pH, although less significant (Fig. 12). FS achieved the
best removal of DOC, tot-P, PO4-P and tot-N. The removal of DOC (76%) by FS
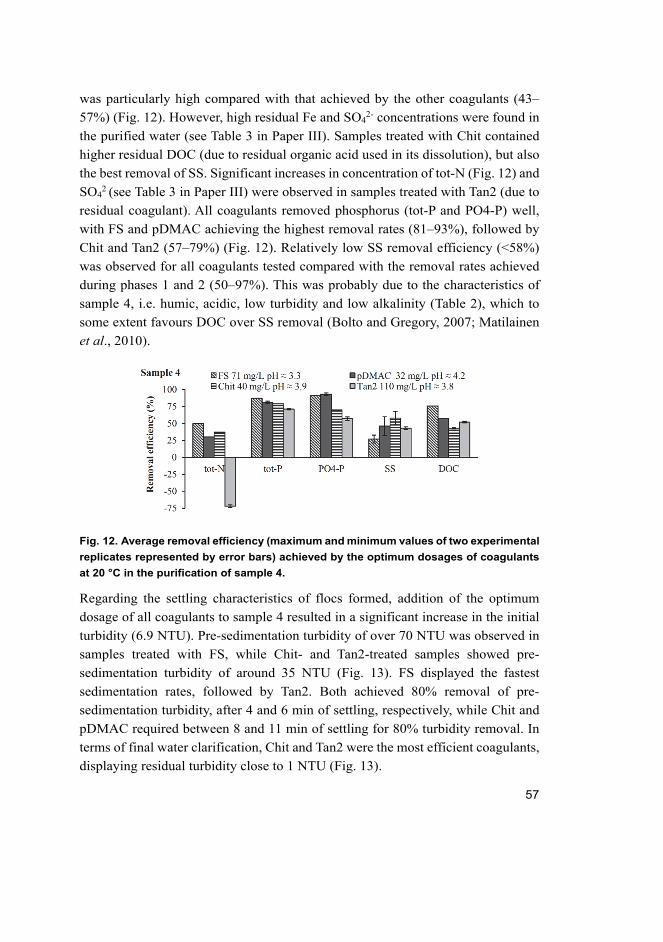
57
was particularly high compared with that achieved by the other coagulants (43–
57%) (Fig. 12). However, high residual Fe and SO42- concentrations were found in
the purified water (see Table 3 in Paper III). Samples treated with Chit contained
higher residual DOC (due to residual organic acid used in its dissolution), but also
the best removal of SS. Significant increases in concentration of tot-N (Fig. 12) and
SO42 (see Table 3 in Paper III) were observed in samples treated with Tan2 (due to
residual coagulant). All coagulants removed phosphorus (tot-P and PO4-P) well,
with FS and pDMAC achieving the highest removal rates (81–93%), followed by
Chit and Tan2 (57–79%) (Fig. 12). Relatively low SS removal efficiency (<58%)
was observed for all coagulants tested compared with the removal rates achieved
during phases 1 and 2 (50–97%). This was probably due to the characteristics of
sample 4, i.e. humic, acidic, low turbidity and low alkalinity (Table 2), which to
some extent favours DOC over SS removal (Bolto and Gregory, 2007; Matilainen
et al., 2010).
Fig. 12. Average removal efficiency (maximum and minimum values of two experimental
replicates represented by error bars) achieved by the optimum dosages of coagulants
at 20 °C in the purification of sample 4.
Regarding the settling characteristics of flocs formed, addition of the optimum
dosage of all coagulants to sample 4 resulted in a significant increase in the initial
turbidity (6.9 NTU). Pre-sedimentation turbidity of over 70 NTU was observed in
samples treated with FS, while Chit- and Tan2-treated samples showed pre-
sedimentation turbidity of around 35 NTU (Fig. 13). FS displayed the fastest
sedimentation rates, followed by Tan2. Both achieved 80% removal of pre-
sedimentation turbidity, after 4 and 6 min of settling, respectively, while Chit and
pDMAC required between 8 and 11 min of settling for 80% turbidity removal. In
terms of final water clarification, Chit and Tan2 were the most efficient coagulants,
displaying residual turbidity close to 1 NTU (Fig. 13).
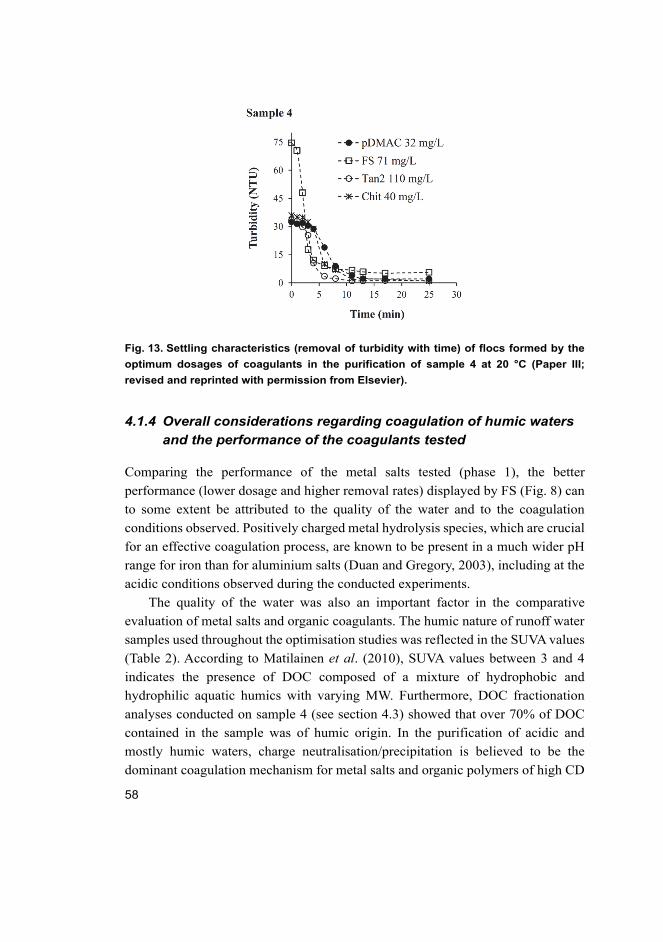
58
Fig. 13. Settling characteristics (removal of turbidity with time) of flocs formed by the
optimum dosages of coagulants in the purification of sample 4 at 20 °C (Paper III;
revised and reprinted with permission from Elsevier).
4.1.4 Overall considerations regarding coagulation of humic waters
and the performance of the coagulants tested
Comparing the performance of the metal salts tested (phase 1), the better
performance (lower dosage and higher removal rates) displayed by FS (Fig. 8) can
to some extent be attributed to the quality of the water and to the coagulation
conditions observed. Positively charged metal hydrolysis species, which are crucial
for an effective coagulation process, are known to be present in a much wider pH
range for iron than for aluminium salts (Duan and Gregory, 2003), including at the
acidic conditions observed during the conducted experiments.
The quality of the water was also an important factor in the comparative
evaluation of metal salts and organic coagulants. The humic nature of runoff water
samples used throughout the optimisation studies was reflected in the SUVA values
(Table 2). According to Matilainen et al. (2010), SUVA values between 3 and 4
indicates the presence of DOC composed of a mixture of hydrophobic and
hydrophilic aquatic humics with varying MW. Furthermore, DOC fractionation
analyses conducted on sample 4 (see section 4.3) showed that over 70% of DOC
contained in the sample was of humic origin. In the purification of acidic and
mostly humic waters, charge neutralisation/precipitation is believed to be the
dominant coagulation mechanism for metal salts and organic polymers of high CD
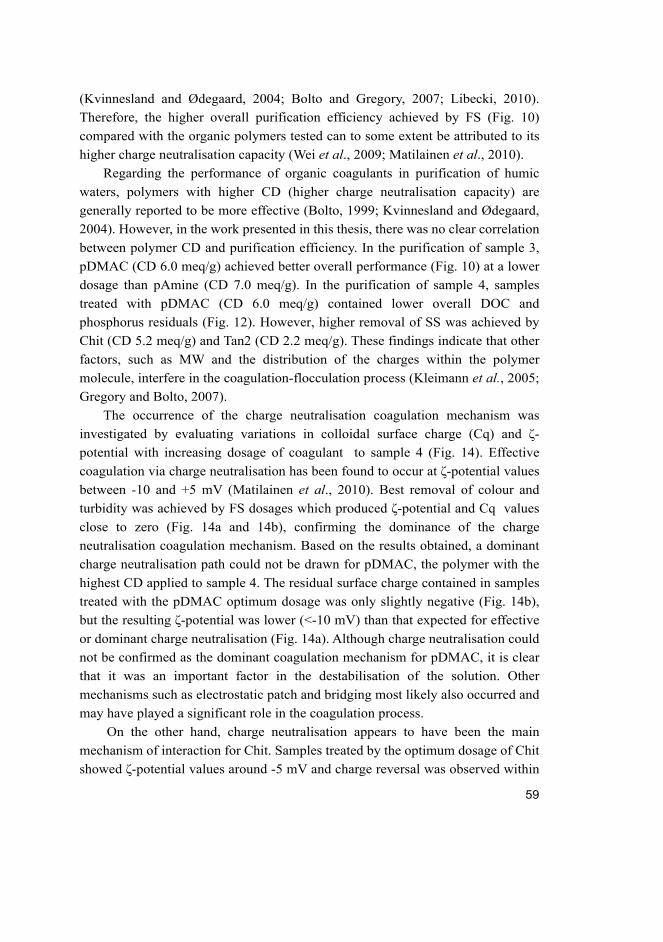
59
(Kvinnesland and Ødegaard, 2004; Bolto and Gregory, 2007; Libecki, 2010).
Therefore, the higher overall purification efficiency achieved by FS (Fig. 10)
compared with the organic polymers tested can to some extent be attributed to its
higher charge neutralisation capacity (Wei et al., 2009; Matilainen et al., 2010).
Regarding the performance of organic coagulants in purification of humic
waters, polymers with higher CD (higher charge neutralisation capacity) are
generally reported to be more effective (Bolto, 1999; Kvinnesland and Ødegaard,
2004). However, in the work presented in this thesis, there was no clear correlation
between polymer CD and purification efficiency. In the purification of sample 3,
pDMAC (CD 6.0 meq/g) achieved better overall performance (Fig. 10) at a lower
dosage than pAmine (CD 7.0 meq/g). In the purification of sample 4, samples
treated with pDMAC (CD 6.0 meq/g) contained lower overall DOC and
phosphorus residuals (Fig. 12). However, higher removal of SS was achieved by
Chit (CD 5.2 meq/g) and Tan2 (CD 2.2 meq/g). These findings indicate that other
factors, such as MW and the distribution of the charges within the polymer
molecule, interfere in the coagulation-flocculation process (Kleimann et al., 2005;
Gregory and Bolto, 2007).
The occurrence of the charge neutralisation coagulation mechanism was
investigated by evaluating variations in colloidal surface charge (Cq) and ζ-
potential with increasing dosage of coagulant to sample 4 (Fig. 14). Effective
coagulation via charge neutralisation has been found to occur at ζ-potential values
between -10 and +5 mV (Matilainen et al., 2010). Best removal of colour and
turbidity was achieved by FS dosages which produced ζ-potential and Cq values
close to zero (Fig. 14a and 14b), confirming the dominance of the charge
neutralisation coagulation mechanism. Based on the results obtained, a dominant
charge neutralisation path could not be drawn for pDMAC, the polymer with the
highest CD applied to sample 4. The residual surface charge contained in samples
treated with the pDMAC optimum dosage was only slightly negative (Fig. 14b),
but the resulting ζ-potential was lower (<-10 mV) than that expected for effective
or dominant charge neutralisation (Fig. 14a). Although charge neutralisation could
not be confirmed as the dominant coagulation mechanism for pDMAC, it is clear
that it was an important factor in the destabilisation of the solution. Other
mechanisms such as electrostatic patch and bridging most likely also occurred and
may have played a significant role in the coagulation process.
On the other hand, charge neutralisation appears to have been the main
mechanism of interaction for Chit. Samples treated by the optimum dosage of Chit
showed ζ-potential values around -5 mV and charge reversal was observed within
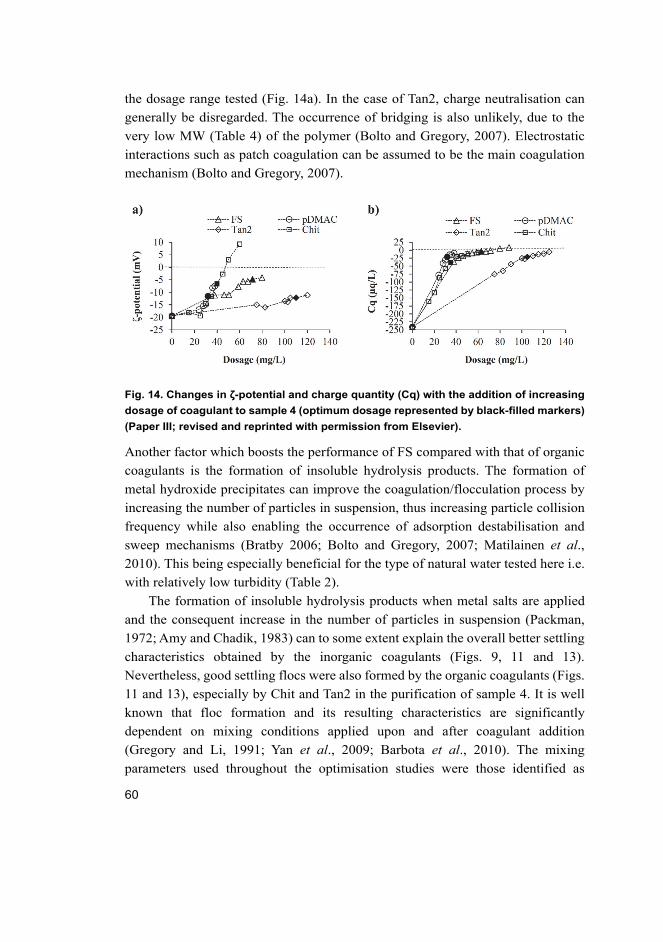
60
the dosage range tested (Fig. 14a). In the case of Tan2, charge neutralisation can
generally be disregarded. The occurrence of bridging is also unlikely, due to the
very low MW (Table 4) of the polymer (Bolto and Gregory, 2007). Electrostatic
interactions such as patch coagulation can be assumed to be the main coagulation
mechanism (Bolto and Gregory, 2007).
Fig. 14. Changes in ζ-potential and charge quantity (Cq) with the addition of increasing
dosage of coagulant to sample 4 (optimum dosage represented by black-filled markers)
(Paper III; revised and reprinted with permission from Elsevier).
Another factor which boosts the performance of FS compared with that of organic
coagulants is the formation of insoluble hydrolysis products. The formation of
metal hydroxide precipitates can improve the coagulation/flocculation process by
increasing the number of particles in suspension, thus increasing particle collision
frequency while also enabling the occurrence of adsorption destabilisation and
sweep mechanisms (Bratby 2006; Bolto and Gregory, 2007; Matilainen et al., 2010). This being especially beneficial for the type of natural water tested here i.e.
with relatively low turbidity (Table 2).
The formation of insoluble hydrolysis products when metal salts are applied
and the consequent increase in the number of particles in suspension (Packman,
1972; Amy and Chadik, 1983) can to some extent explain the overall better settling
characteristics obtained by the inorganic coagulants (Figs. 9, 11 and 13).
Nevertheless, good settling flocs were also formed by the organic coagulants (Figs.
11 and 13), especially by Chit and Tan2 in the purification of sample 4. It is well
known that floc formation and its resulting characteristics are significantly
dependent on mixing conditions applied upon and after coagulant addition
(Gregory and Li, 1991; Yan et al., 2009; Barbota et al., 2010). The mixing
parameters used throughout the optimisation studies were those identified as
61
optimum mixing conditions for FS (pd) during phase 1 of tests (see section 4.4).
Thus, it can be assumed that the mixing conditions applied to some extent favoured
FS performance. Optimisation of mixing parameters to the specific requirements
of the organic polymers is suggested. This could result in flocs with improved
settling characteristics and an overall improvement in polymer performance. The
settling rates achieved by the organic polymers were nevertheless satisfactory, and
would enable good clarification results if the recommended design parameters for
sedimentation units in peat extraction sites, such as surface load of 0.2–0.4 m/h,
were to be applied (Turveteollisuusliitto, 2010).
An important issue regarding the chemical purification process is the
environmental impacts of the residual concentrations of the added coagulants and
their effect on water quality. The high dosage of FS required resulted in purified
water with pH values between 3 and 4 and high residual iron concentrations (1.2–
5.5 mgFe/L, see Papers I–IV). High iron concentrations (> 1 mg/L) and acidic
conditions have been found to have a significant impact on the structure and
function of aquatic ecosystems (Vuori, 1995; Edèn et al., 1999). Evaluation of
water quality monitoring data during the background study phase in this thesis work
found that 75–100% of added sulphate was normally released with the purified
water. Thus, for a dosage of 84 mg/L of Fe2(SO4)3, between 45 and 60 mg/L of
sulphate can potentially be released into downstream water bodies. Elevated
sulphate concentrations are known to increase the mobilisation of nutrients from
sediments and increase the risk of eutrophication of surface waters (Zak et al., 2006).
An increase in tot-N residual concentration was consistently found in samples
treated with pAmine during phase 2 of tests, which might be due to its lower
molecular weight compared with pDMAC and consequently higher solubility.
During phase 3 of tests, high DOC residuals were found in Chit-treated samples
due to residual acetic acid used in product dissolution. This might be avoided by
the dissolution of Chit in other acids, e.g. hydrochloric or glutamic acid (Bratskaya
et al., 2004). Chemically modified water-soluble chitosan products have also been
successfully studied (Yang et al., 2011). During phase 3, high residual coagulant
levels were also found in Tan2-treated samples, most likely as a result of over-
dosing in terms of colour removal. Throughout the optimisation studies, a
combined requirement of colour and turbidity removal was imposed. During
dosage requirement evaluations for Tan2 (Fig. 6), satisfactory colour removal was
obtained at a substantially lower dosage than turbidity removal.
62
Further research is required to determine the residual concentrations resulting
from the use of synthetic and natural organic polymers as primary coagulants and
their potential impact on the environment. Existing studies mostly report impacts
related to residual concentrations resulting from the lower dosage required when
polymers are used as flocculant aid chemicals (Harford et al., 2011).
Overall, FS was the best performing coagulant. Nevertheless, the organic
polymers tested demonstrated satisfactory overall performance, with purification
rates mostly inside the required range for chemical purification of peat extraction
runoff (COD 60–80%, SS 50%, tot-N 30–50% and tot-P 60–90%; Wichmann,
2015). Furthermore, Chit and the synthetic organic polymers required substantially
lower dosages than FS and had small or no effects on the pH of the water.
4.2 Effect of water pH on purification (I–IV)
The pH of peat extraction runoff water mainly fluctuates within between 4.5 and
7.0 (Table 5). Thus, the pH variations tested (4.5–6.5) reflected real operating
conditions. The influence of pH on purification efficiency was evaluated for all test
coagulants (see Papers I–IV). The results presented here show the influence of pH
on the performance of (i) synthetic polymers and FS in the purification of sample
3 and (ii) natural and synthetic polymers and FS in the purification of samples 4
and 5.
To evaluate the influence of water pH on the performance of FS and synthetic
organic polymers, the pH of sample 3 was increased from its natural value of 4.5
to 5.5 and subsequently to 6.5 (phase 2 of tests). The following dosages were
selected from the optimum range identified for each coagulant at different pH,
taking into consideration the removal of colour and turbidity:
– pH 6.5: pAmine 25 mg/L, pDMAC 16 mg/L, FS 84 mg/L.
– pH 5.5: pAmine 20 mg/L, pDMAC 16 mg/L, FS 59 mg/L.
– pH 4.5: pAmine 15 mg/L, pDMAC 10 mg/L, FS 50 mg/L.
Significant lower dosages were required for equivalent removal of colour and
turbidity in the purification of lower pH samples. When the identified optimum
dosage of synthetic organic polymers and FS was applied to sample 3 (pH 4.5, 5.5
and 6.5), comparable removal rates of TOC, SS, tot-P, PO4-P and tot-N were
achieved at all pH levels (Fig. 15). However, as mentioned, significantly lower
dosages were applied in the purification of samples with lower initial pH.
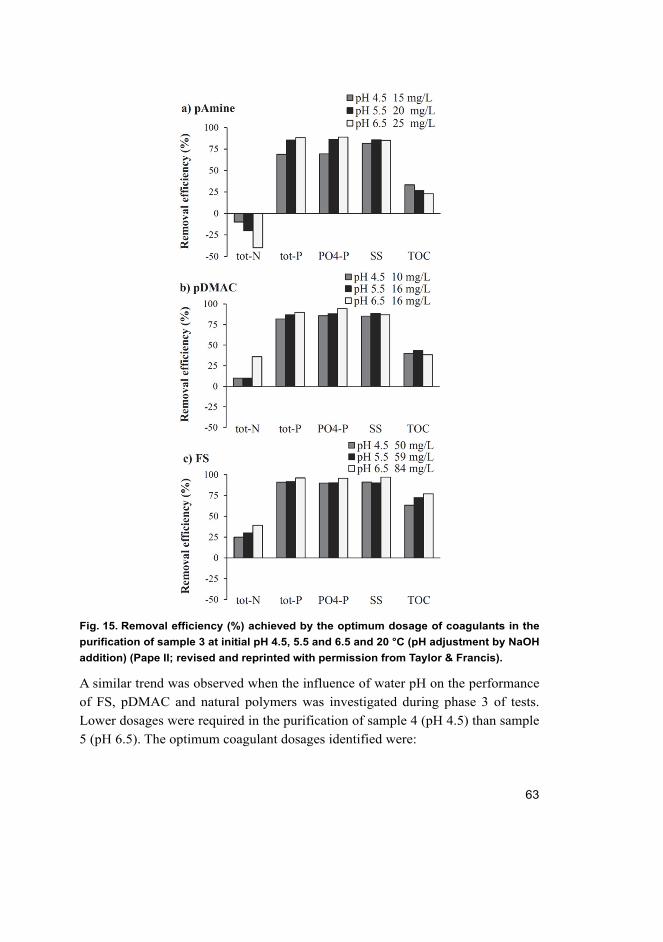
63
Fig. 15. Removal efficiency (%) achieved by the optimum dosage of coagulants in the
purification of sample 3 at initial pH 4.5, 5.5 and 6.5 and 20 °C (pH adjustment by NaOH
addition) (Pape II; revised and reprinted with permission from Taylor & Francis).
A similar trend was observed when the influence of water pH on the performance
of FS, pDMAC and natural polymers was investigated during phase 3 of tests.
Lower dosages were required in the purification of sample 4 (pH 4.5) than sample
5 (pH 6.5). The optimum coagulant dosages identified were:
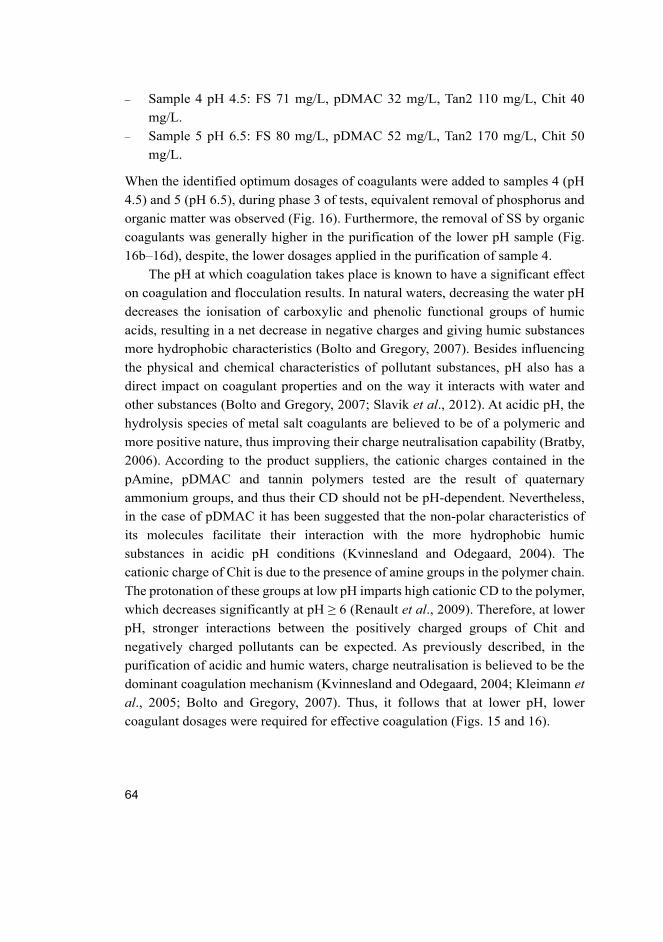
64
– Sample 4 pH 4.5: FS 71 mg/L, pDMAC 32 mg/L, Tan2 110 mg/L, Chit 40
mg/L.
– Sample 5 pH 6.5: FS 80 mg/L, pDMAC 52 mg/L, Tan2 170 mg/L, Chit 50
mg/L.
When the identified optimum dosages of coagulants were added to samples 4 (pH
4.5) and 5 (pH 6.5), during phase 3 of tests, equivalent removal of phosphorus and
organic matter was observed (Fig. 16). Furthermore, the removal of SS by organic
coagulants was generally higher in the purification of the lower pH sample (Fig.
16b–16d), despite, the lower dosages applied in the purification of sample 4.
The pH at which coagulation takes place is known to have a significant effect
on coagulation and flocculation results. In natural waters, decreasing the water pH
decreases the ionisation of carboxylic and phenolic functional groups of humic
acids, resulting in a net decrease in negative charges and giving humic substances
more hydrophobic characteristics (Bolto and Gregory, 2007). Besides influencing
the physical and chemical characteristics of pollutant substances, pH also has a
direct impact on coagulant properties and on the way it interacts with water and
other substances (Bolto and Gregory, 2007; Slavik et al., 2012). At acidic pH, the
hydrolysis species of metal salt coagulants are believed to be of a polymeric and
more positive nature, thus improving their charge neutralisation capability (Bratby,
2006). According to the product suppliers, the cationic charges contained in the
pAmine, pDMAC and tannin polymers tested are the result of quaternary
ammonium groups, and thus their CD should not be pH-dependent. Nevertheless,
in the case of pDMAC it has been suggested that the non-polar characteristics of
its molecules facilitate their interaction with the more hydrophobic humic
substances in acidic pH conditions (Kvinnesland and Odegaard, 2004). The
cationic charge of Chit is due to the presence of amine groups in the polymer chain.
The protonation of these groups at low pH imparts high cationic CD to the polymer,
which decreases significantly at pH ≥ 6 (Renault et al., 2009). Therefore, at lower
pH, stronger interactions between the positively charged groups of Chit and
negatively charged pollutants can be expected. As previously described, in the
purification of acidic and humic waters, charge neutralisation is believed to be the
dominant coagulation mechanism (Kvinnesland and Odegaard, 2004; Kleimann et al., 2005; Bolto and Gregory, 2007). Thus, it follows that at lower pH, lower
coagulant dosages were required for effective coagulation (Figs. 15 and 16).
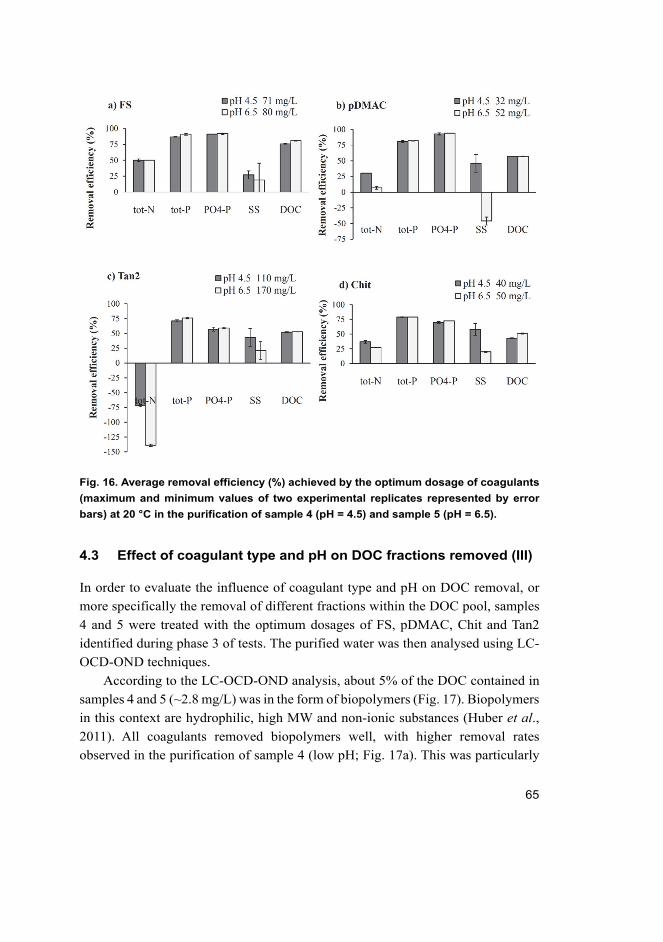
65
Fig. 16. Average removal efficiency (%) achieved by the optimum dosage of coagulants
(maximum and minimum values of two experimental replicates represented by error
bars) at 20 °C in the purification of sample 4 (pH = 4.5) and sample 5 (pH = 6.5).
4.3 Effect of coagulant type and pH on DOC fractions removed (III)
In order to evaluate the influence of coagulant type and pH on DOC removal, or
more specifically the removal of different fractions within the DOC pool, samples
4 and 5 were treated with the optimum dosages of FS, pDMAC, Chit and Tan2
identified during phase 3 of tests. The purified water was then analysed using LC-
OCD-OND techniques.
According to the LC-OCD-OND analysis, about 5% of the DOC contained in
samples 4 and 5 (~2.8 mg/L) was in the form of biopolymers (Fig. 17). Biopolymers
in this context are hydrophilic, high MW and non-ionic substances (Huber et al., 2011). All coagulants removed biopolymers well, with higher removal rates
observed in the purification of sample 4 (low pH; Fig. 17a). This was particularly
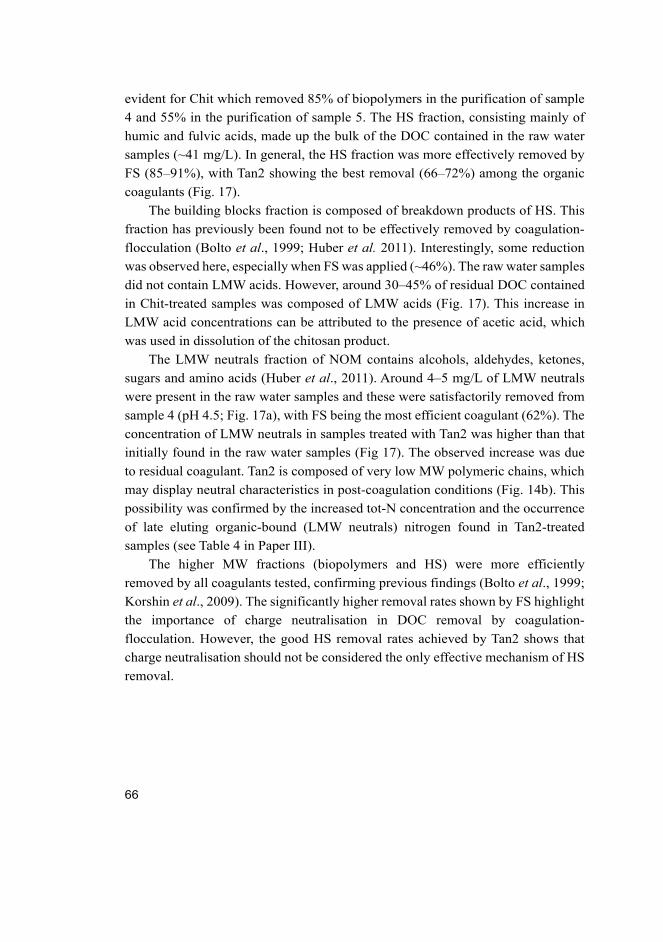
66
evident for Chit which removed 85% of biopolymers in the purification of sample
4 and 55% in the purification of sample 5. The HS fraction, consisting mainly of
humic and fulvic acids, made up the bulk of the DOC contained in the raw water
samples (~41 mg/L). In general, the HS fraction was more effectively removed by
FS (85–91%), with Tan2 showing the best removal (66–72%) among the organic
coagulants (Fig. 17).
The building blocks fraction is composed of breakdown products of HS. This
fraction has previously been found not to be effectively removed by coagulation-
flocculation (Bolto et al., 1999; Huber et al. 2011). Interestingly, some reduction
was observed here, especially when FS was applied (~46%). The raw water samples
did not contain LMW acids. However, around 30–45% of residual DOC contained
in Chit-treated samples was composed of LMW acids (Fig. 17). This increase in
LMW acid concentrations can be attributed to the presence of acetic acid, which
was used in dissolution of the chitosan product.
The LMW neutrals fraction of NOM contains alcohols, aldehydes, ketones,
sugars and amino acids (Huber et al., 2011). Around 4–5 mg/L of LMW neutrals
were present in the raw water samples and these were satisfactorily removed from
sample 4 (pH 4.5; Fig. 17a), with FS being the most efficient coagulant (62%). The
concentration of LMW neutrals in samples treated with Tan2 was higher than that
initially found in the raw water samples (Fig 17). The observed increase was due
to residual coagulant. Tan2 is composed of very low MW polymeric chains, which
may display neutral characteristics in post-coagulation conditions (Fig. 14b). This
possibility was confirmed by the increased tot-N concentration and the occurrence
of late eluting organic-bound (LMW neutrals) nitrogen found in Tan2-treated
samples (see Table 4 in Paper III).
The higher MW fractions (biopolymers and HS) were more efficiently
removed by all coagulants tested, confirming previous findings (Bolto et al., 1999;
Korshin et al., 2009). The significantly higher removal rates shown by FS highlight
the importance of charge neutralisation in DOC removal by coagulation-
flocculation. However, the good HS removal rates achieved by Tan2 shows that
charge neutralisation should not be considered the only effective mechanism of HS
removal.
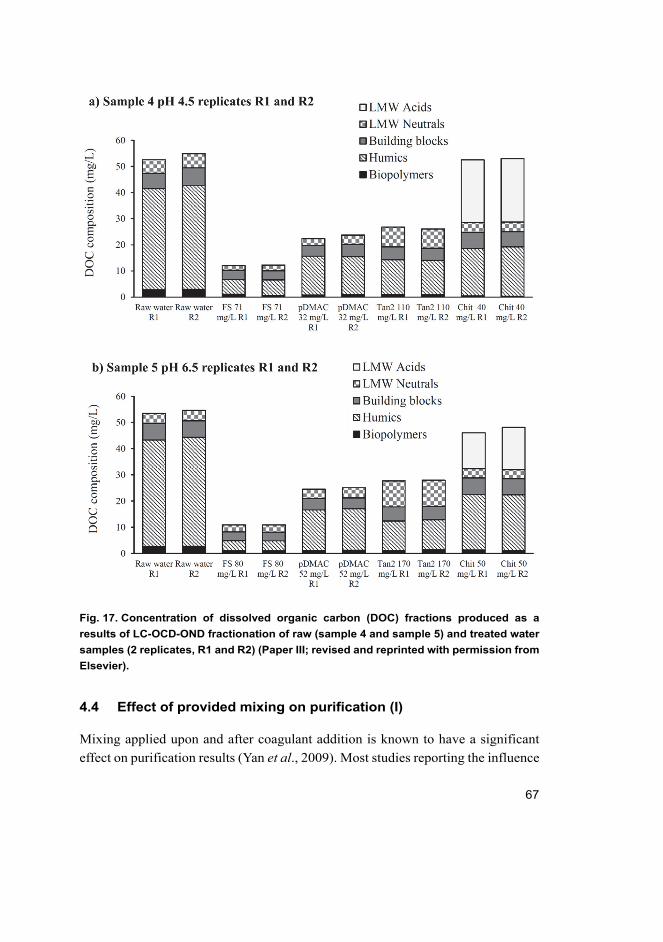
67
Fig. 17. Concentration of dissolved organic carbon (DOC) fractions produced as a
results of LC-OCD-OND fractionation of raw (sample 4 and sample 5) and treated water
samples (2 replicates, R1 and R2) (Paper III; revised and reprinted with permission from
Elsevier).
4.4 Effect of provided mixing on purification (I)
Mixing applied upon and after coagulant addition is known to have a significant
effect on purification results (Yan et al., 2009). Most studies reporting the influence
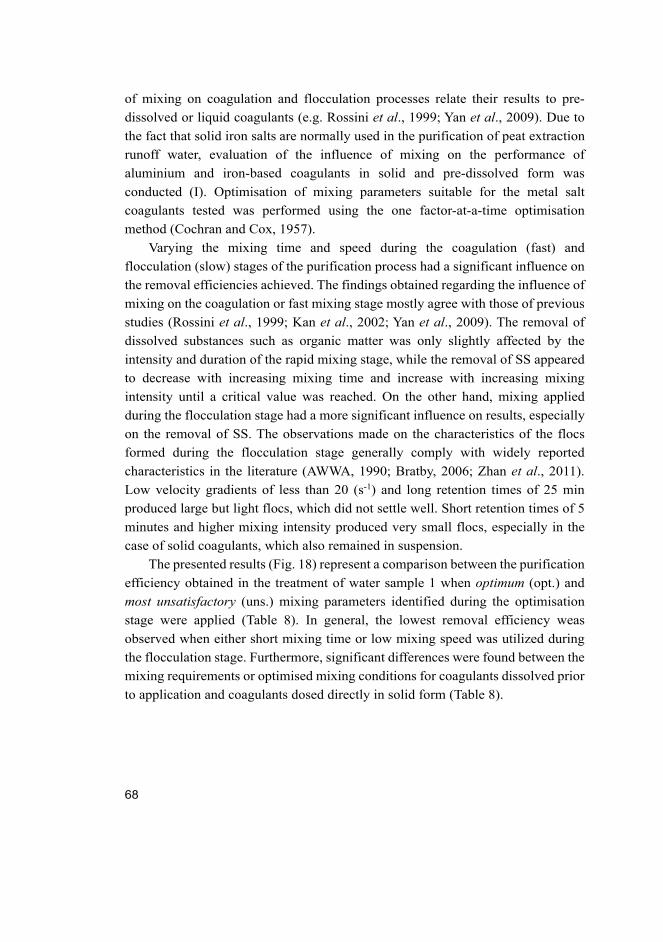
68
of mixing on coagulation and flocculation processes relate their results to pre-
dissolved or liquid coagulants (e.g. Rossini et al., 1999; Yan et al., 2009). Due to
the fact that solid iron salts are normally used in the purification of peat extraction
runoff water, evaluation of the influence of mixing on the performance of
aluminium and iron-based coagulants in solid and pre-dissolved form was
conducted (I). Optimisation of mixing parameters suitable for the metal salt
coagulants tested was performed using the one factor-at-a-time optimisation
method (Cochran and Cox, 1957).
Varying the mixing time and speed during the coagulation (fast) and
flocculation (slow) stages of the purification process had a significant influence on
the removal efficiencies achieved. The findings obtained regarding the influence of
mixing on the coagulation or fast mixing stage mostly agree with those of previous
studies (Rossini et al., 1999; Kan et al., 2002; Yan et al., 2009). The removal of
dissolved substances such as organic matter was only slightly affected by the
intensity and duration of the rapid mixing stage, while the removal of SS appeared
to decrease with increasing mixing time and increase with increasing mixing
intensity until a critical value was reached. On the other hand, mixing applied
during the flocculation stage had a more significant influence on results, especially
on the removal of SS. The observations made on the characteristics of the flocs
formed during the flocculation stage generally comply with widely reported
characteristics in the literature (AWWA, 1990; Bratby, 2006; Zhan et al., 2011).
Low velocity gradients of less than 20 (s-1) and long retention times of 25 min
produced large but light flocs, which did not settle well. Short retention times of 5
minutes and higher mixing intensity produced very small flocs, especially in the
case of solid coagulants, which also remained in suspension.
The presented results (Fig. 18) represent a comparison between the purification
efficiency obtained in the treatment of water sample 1 when optimum (opt.) and
most unsatisfactory (uns.) mixing parameters identified during the optimisation
stage were applied (Table 8). In general, the lowest removal efficiency weas
observed when either short mixing time or low mixing speed was utilized during
the flocculation stage. Furthermore, significant differences were found between the
mixing requirements or optimised mixing conditions for coagulants dissolved prior
to application and coagulants dosed directly in solid form (Table 8).
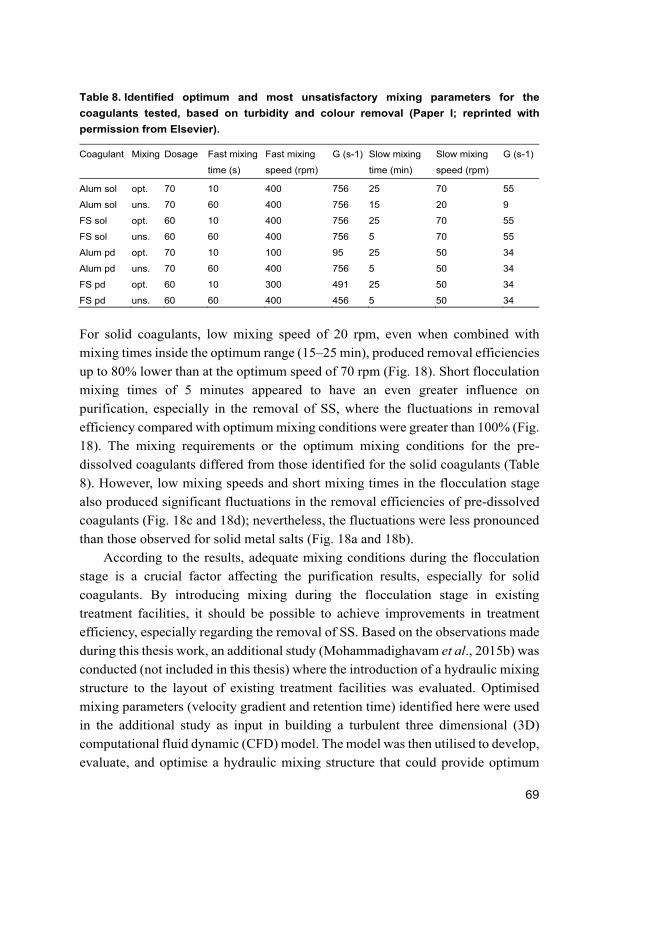
69
Table 8. Identified optimum and most unsatisfactory mixing parameters for the
coagulants tested, based on turbidity and colour removal (Paper I; reprinted with
permission from Elsevier).
Coagulant Mixing Dosage Fast mixing
time (s)
Fast mixing
speed (rpm)
G (s-1) Slow mixing
time (min)
Slow mixing
speed (rpm)
G (s-1)
Alum sol opt. 70 10 400 756 25 70 55
Alum sol uns. 70 60 400 756 15 20 9
FS sol opt. 60 10 400 756 25 70 55
FS sol uns. 60 60 400 756 5 70 55
Alum pd opt. 70 10 100 95 25 50 34
Alum pd uns. 70 60 400 756 5 50 34
FS pd opt. 60 10 300 491 25 50 34
FS pd uns. 60 60 400 456 5 50 34
For solid coagulants, low mixing speed of 20 rpm, even when combined with
mixing times inside the optimum range (15–25 min), produced removal efficiencies
up to 80% lower than at the optimum speed of 70 rpm (Fig. 18). Short flocculation
mixing times of 5 minutes appeared to have an even greater influence on
purification, especially in the removal of SS, where the fluctuations in removal
efficiency compared with optimum mixing conditions were greater than 100% (Fig.
18). The mixing requirements or the optimum mixing conditions for the pre-
dissolved coagulants differed from those identified for the solid coagulants (Table
8). However, low mixing speeds and short mixing times in the flocculation stage
also produced significant fluctuations in the removal efficiencies of pre-dissolved
coagulants (Fig. 18c and 18d); nevertheless, the fluctuations were less pronounced
than those observed for solid metal salts (Fig. 18a and 18b).
According to the results, adequate mixing conditions during the flocculation
stage is a crucial factor affecting the purification results, especially for solid
coagulants. By introducing mixing during the flocculation stage in existing
treatment facilities, it should be possible to achieve improvements in treatment
efficiency, especially regarding the removal of SS. Based on the observations made
during this thesis work, an additional study (Mohammadighavam et al., 2015b) was
conducted (not included in this thesis) where the introduction of a hydraulic mixing
structure to the layout of existing treatment facilities was evaluated. Optimised
mixing parameters (velocity gradient and retention time) identified here were used
in the additional study as input in building a turbulent three dimensional (3D)
computational fluid dynamic (CFD) model. The model was then utilised to develop,
evaluate, and optimise a hydraulic mixing structure that could provide optimum
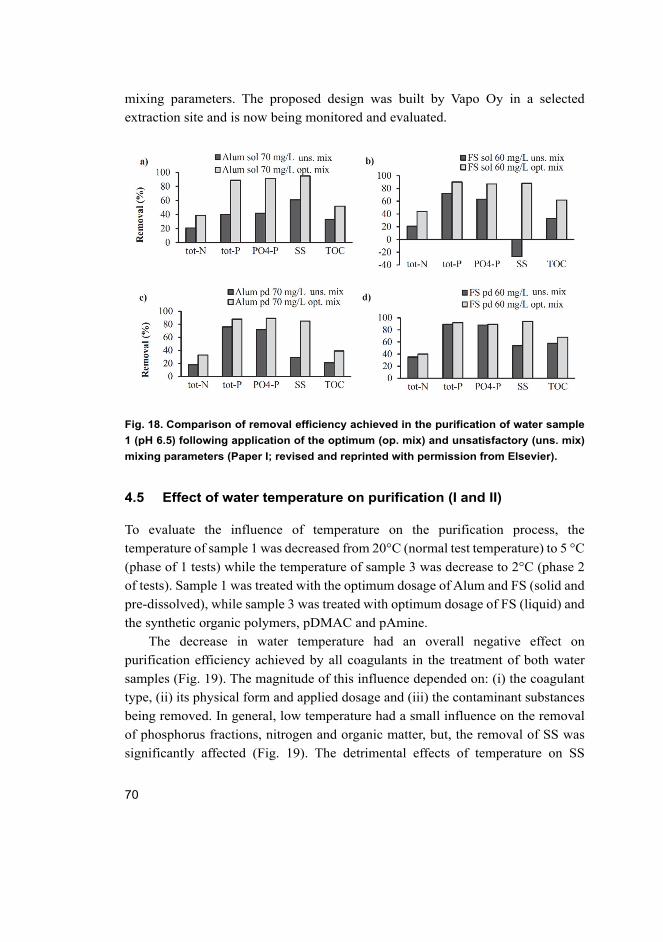
70
mixing parameters. The proposed design was built by Vapo Oy in a selected
extraction site and is now being monitored and evaluated.
Fig. 18. Comparison of removal efficiency achieved in the purification of water sample
1 (pH 6.5) following application of the optimum (op. mix) and unsatisfactory (uns. mix)
mixing parameters (Paper I; revised and reprinted with permission from Elsevier).
4.5 Effect of water temperature on purification (I and II)
To evaluate the influence of temperature on the purification process, the
temperature of sample 1 was decreased from 20°C (normal test temperature) to 5 °C
(phase of 1 tests) while the temperature of sample 3 was decrease to 2°C (phase 2
of tests). Sample 1 was treated with the optimum dosage of Alum and FS (solid and
pre-dissolved), while sample 3 was treated with optimum dosage of FS (liquid) and
the synthetic organic polymers, pDMAC and pAmine.
The decrease in water temperature had an overall negative effect on
purification efficiency achieved by all coagulants in the treatment of both water
samples (Fig. 19). The magnitude of this influence depended on: (i) the coagulant
type, (ii) its physical form and applied dosage and (iii) the contaminant substances
being removed. In general, low temperature had a small influence on the removal
of phosphorus fractions, nitrogen and organic matter, but, the removal of SS was
significantly affected (Fig. 19). The detrimental effects of temperature on SS
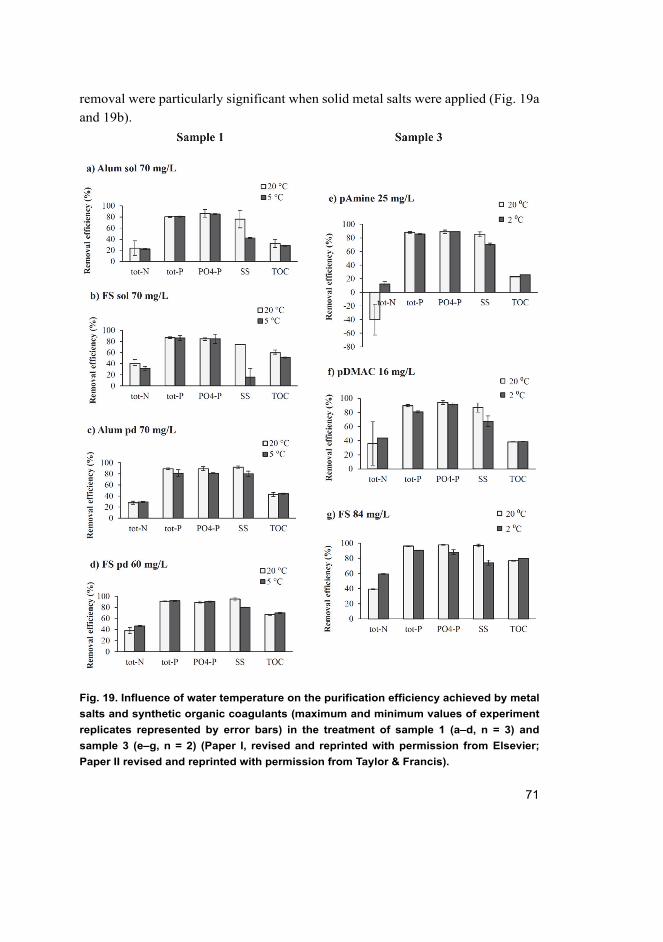
71
removal were particularly significant when solid metal salts were applied (Fig. 19a
and 19b).
Fig. 19. Influence of water temperature on the purification efficiency achieved by metal
salts and synthetic organic coagulants (maximum and minimum values of experiment
replicates represented by error bars) in the treatment of sample 1 (a–d, n = 3) and
sample 3 (e–g, n = 2) (Paper I, revised and reprinted with permission from Elsevier;
Paper II revised and reprinted with permission from Taylor & Francis).
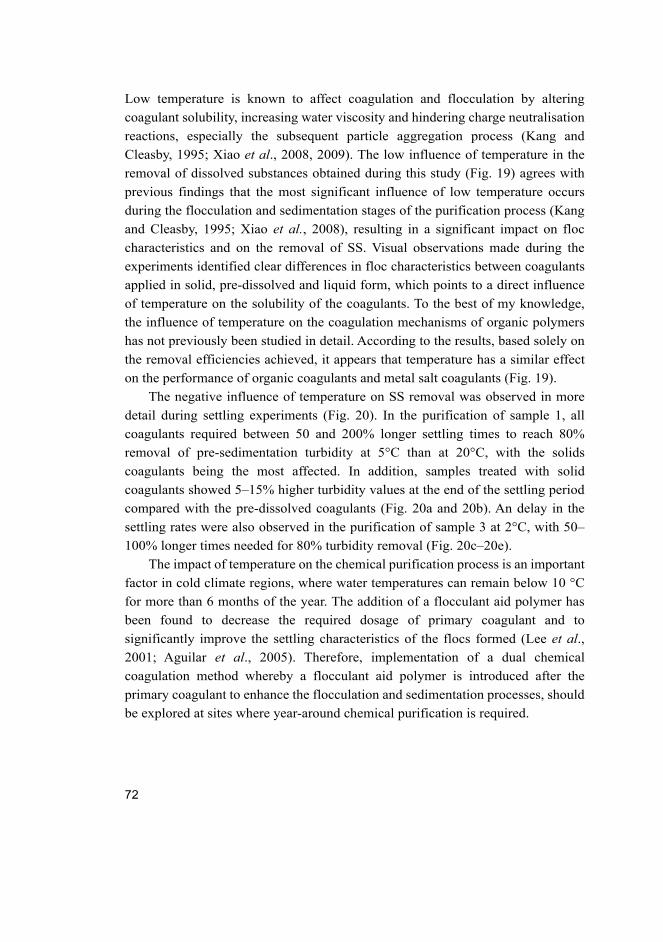
72
Low temperature is known to affect coagulation and flocculation by altering
coagulant solubility, increasing water viscosity and hindering charge neutralisation
reactions, especially the subsequent particle aggregation process (Kang and
Cleasby, 1995; Xiao et al., 2008, 2009). The low influence of temperature in the
removal of dissolved substances obtained during this study (Fig. 19) agrees with
previous findings that the most significant influence of low temperature occurs
during the flocculation and sedimentation stages of the purification process (Kang
and Cleasby, 1995; Xiao et al., 2008), resulting in a significant impact on floc
characteristics and on the removal of SS. Visual observations made during the
experiments identified clear differences in floc characteristics between coagulants
applied in solid, pre-dissolved and liquid form, which points to a direct influence
of temperature on the solubility of the coagulants. To the best of my knowledge,
the influence of temperature on the coagulation mechanisms of organic polymers
has not previously been studied in detail. According to the results, based solely on
the removal efficiencies achieved, it appears that temperature has a similar effect
on the performance of organic coagulants and metal salt coagulants (Fig. 19).
The negative influence of temperature on SS removal was observed in more
detail during settling experiments (Fig. 20). In the purification of sample 1, all
coagulants required between 50 and 200% longer settling times to reach 80%
removal of pre-sedimentation turbidity at 5°C than at 20°C, with the solids
coagulants being the most affected. In addition, samples treated with solid
coagulants showed 5–15% higher turbidity values at the end of the settling period
compared with the pre-dissolved coagulants (Fig. 20a and 20b). An delay in the
settling rates were also observed in the purification of sample 3 at 2°C, with 50–
100% longer times needed for 80% turbidity removal (Fig. 20c–20e).
The impact of temperature on the chemical purification process is an important
factor in cold climate regions, where water temperatures can remain below 10 °C
for more than 6 months of the year. The addition of a flocculant aid polymer has
been found to decrease the required dosage of primary coagulant and to
significantly improve the settling characteristics of the flocs formed (Lee et al., 2001; Aguilar et al., 2005). Therefore, implementation of a dual chemical
coagulation method whereby a flocculant aid polymer is introduced after the
primary coagulant to enhance the flocculation and sedimentation processes, should
be explored at sites where year-around chemical purification is required.
73
Fig. 20. Influence of water temperature on the settling characteristics of flocs formed
(removal of turbidity with time) in the purification of sample 1 (a, b) and sample 3 (c–e).
74
4.6 Influence of water quality variations on purification efficiency
(IV)
To evaluate the influence of variations in water quality on purification efficiency,
water quality monitoring data were used to determine typical ranges of
concentration fluctuations in water quality indicators, referred to here as ‘factors’
(DOC, SS and pH; Table 5). A 24 factorial design was applied in the design of the
laboratory experiments. Natural water samples were used to create eight sub-
samples containing the combination of identified low and high concentration levels
of the water quality factors (Fig. 7). Dosage requirement tests revealed the high and
low FS dosages needed to treat such samples. The eight sub-samples were then
treated using high and low coagulant dosages resulting in 16 experimental runs
which were conducted in triplicates.
Overall purification results
Residual concentrations of a series of water quality parameters found in the treated
samples are presented in Table 9. The focus is on the selected response variables of
the experimental design, i.e. the DOC, SS and tot-P concentrations, which were
used in the evaluation of results using ANOVA and factor effect calculations.
In general, the residual concentrations of DOC, SS and tot-P found in the
treated samples were substantially influenced by the initial DOC concentration of
the water (Table 9). For samples with high initial DOC (70 mg/L) and to which a
low coagulant dosage (35 mg/L) was applied (Table 9; samples a, ab, ac, abc),
distinct signs of under-dosing such as highly negative Cq values and high residual
concentrations of DOC, SS and tot-P were observed. Satisfactory purification
levels were achieved for samples treated with a high coagulant dosage (100 mg/L).
Dosage requirement was therefore clearly dependent on the initial DOC
concentration of the samples.
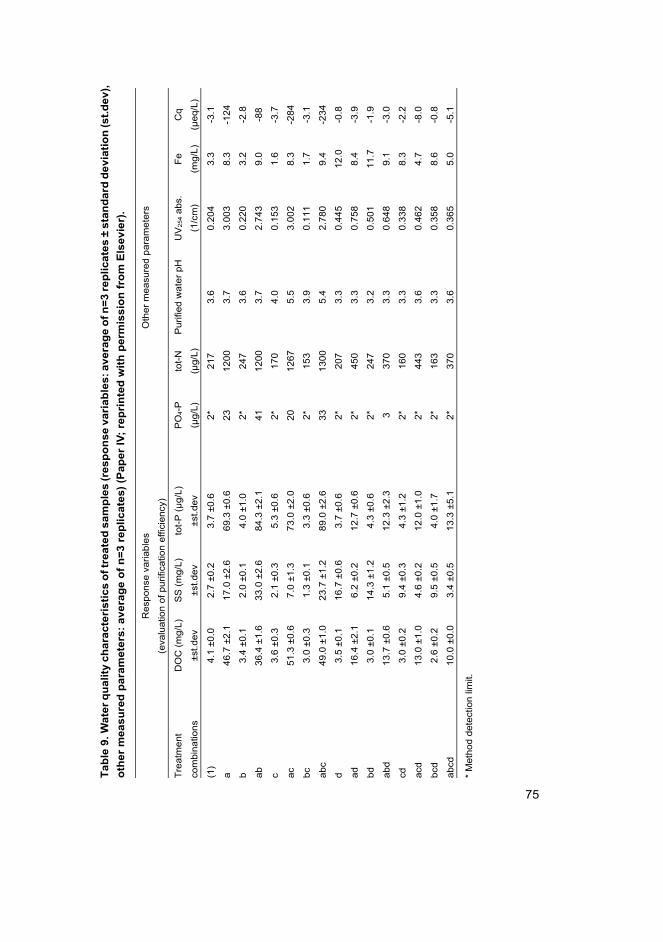
75
Ta
ble
9. W
ate
r q
ua
lity
ch
ara
cte
ris
tic
s o
f tr
ea
ted
sa
mp
les
(re
sp
on
se
va
ria
ble
s: a
ve
rag
e o
f n
=3
re
pli
ca
tes
± s
tan
da
rd d
ev
iati
on
(s
t.d
ev
),
oth
er
me
as
ure
d p
ara
mete
rs:
av
era
ge
of
n=
3 r
ep
lic
ate
s)
(Pap
er
IV;
rep
rin
ted
wit
h p
erm
iss
ion
fro
m E
lse
vie
r).
R
espo
nse
varia
bles
(eva
luat
ion
of p
urifi
catio
n ef
ficie
ncy)
O
ther
mea
sure
d pa
ram
eter
s
Trea
tmen
t
com
bina
tions
DO
C (m
g/L)
±st.d
ev
SS
(mg/
L)
±st.d
ev
tot-P
(µg/
L)
±st.d
ev
P
O4-
P
(µg/
L)
tot-N
(µg/
L)
Pur
ified
wat
er p
H
UV
254 a
bs.
(1/c
m)
Fe
(mg/
L)
Cq
(µeq
/L)
(1)
4.1
±0.0
2.
7 ±0
.2
3.7
±0.6
2*
217
3.6
0.20
4 3.
3 -3
.1
a 46
.7 ±
2.1
17.0
±2.
6 69
.3 ±
0.6
23
12
00
3.7
3.00
3 8.
3 -1
24
b 3.
4 ±0
.1
2.0
±0.1
4.
0 ±1
.0
2*
24
7 3.
6 0.
220
3.2
-2.8
ab
36.4
±1.
6 33
.0 ±
2.6
84.3
±2.
1
41
1200
3.
7 2.
743
9.0
-88
c 3.
6 ±0
.3
2.1
±0.3
5.
3 ±0
.6
2*
17
0 4.
0 0.
153
1.6
-3.7
ac
51.3
±0.
6 7.
0 ±1
.3
73.0
±2.
0
20
1267
5.
5 3.
002
8.3
-284
bc
3.0
±0.3
1.
3 ±0
.1
3.3
±0.6
2*
153
3.9
0.11
1 1.
7 -3
.1
abc
49.0
±1.
0 23
.7 ±
1.2
89.0
±2.
6
33
1300
5.
4 2.
780
9.4
-234
d 3.
5 ±0
.1
16.7
±0.
6 3.
7 ±0
.6
2*
20
7 3.
3 0.
445
12.0
-0
.8
ad
16.4
±2.
1 6.
2 ±0
.2
12.7
±0.
6
2*
450
3.3
0.75
8 8.
4 -3
.9
bd
3.0
±0.1
14
.3 ±
1.2
4.3
±0.6
2*
247
3.2
0.50
1 11
.7
-1.9
abd
13.7
±0.
6 5.
1 ±0
.5
12.3
±2.
3
3 37
0 3.
3 0.
648
9.1
-3.0
cd
3.0
±0.2
9.
4 ±0
.3
4.3
±1.2
2*
160
3.3
0.33
8 8.
3 -2
.2
acd
13.0
±1.
0 4.
6 ±0
.2
12.0
±1.
0
2*
443
3.6
0.46
2 4.
7 -8
.0
bcd
2.6
±0.2
9.
5 ±0
.5
4.0
±1.7
2*
163
3.3
0.35
8 8.
6 -0
.8
abcd
10
.0 ±
0.0
3.4
±0.5
13
.3 ±
5.1
2*
37
0 3.
6 0.
365
5.0
-5.1
* M
etho
d de
tect
ion
limit.
76
Evaluation of factor effects – Statistical analysis
The results of factors effect calculations and F-statistics of the ANOVA evaluations
for the response variables DOC, SS and tot-P are presented in Table 10.
DOC residuals: The magnitude of factor A (DOC) effect (26) on DOC residual
concentration was strong and in the positive direction (Table 10), meaning that, the
residual DOC concentration in the treated samples generally increased as factor A
varied from its low to its high level. The factor D (Dos) effect was also strong (-17)
but in the negative direction. As factor D varied from its low to its high level, the
residual DOC concentration generally decreased. A strong interaction effect AD (-
16) between initial DOC concentration and applied dosage was also observed. The
F-statistics from ANOVA confirmed the significant influence of factor A, factor D
and the interaction effect AD on DOC residuals. However, ANOVA also showed
that the influence of all other factors and factor interactions was statistically
significant at the 95% confidence interval (Table 10).
SS residuals: The SS residual concentrations found in the treated samples were
mostly influenced by the interaction effect AD between the initial DOC
concentration of the water and the coagulant dosage applied (Table 10). F-statistics
from ANOVA revealed that, while most individual factor effects were significant,
the interactions BC, CD, ABC, BCD and ABCD were not significant at 95%
confidence interval (Table 10).
tot-P residuals: The influence of the individual factors A and D and the
interaction between these two factors was critical for the tot-P residual
concentration. The magnitude of the factor A effect (42), factor D effect (-33) and
the interaction effect AD (-33) was very strong. According to the magnitude of
factor effects and p-values from the F-statistics (ANOVA), factor C (pH) had the
least significant influence on tot-P residual concentration (Table 10). Furthermore,
regarding tot-P residual concentration, all interaction effects containing factor C
were not significant at 95% confidence interval (Table 10).
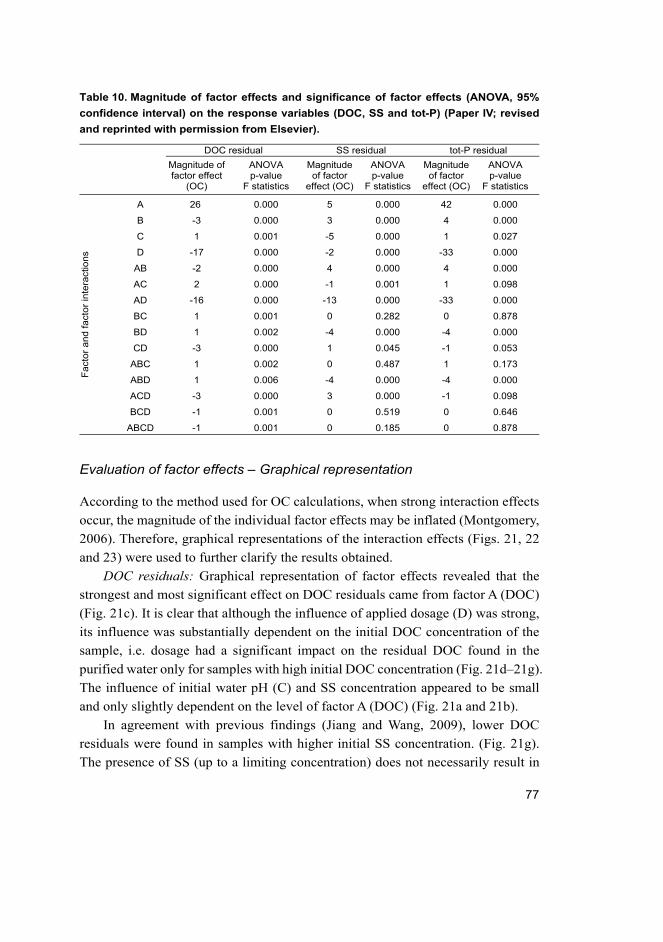
77
Table 10. Magnitude of factor effects and significance of factor effects (ANOVA, 95%
confidence interval) on the response variables (DOC, SS and tot-P) (Paper IV; revised
and reprinted with permission from Elsevier).
DOC residual SS residual tot-P residual
Magnitude of factor effect
(OC)
ANOVA p-value
F statistics
Magnitude of factor
effect (OC)
ANOVA p-value
F statistics
Magnitude of factor
effect (OC)
ANOVA p-value
F statistics
Fact
or a
nd fa
ctor
inte
ract
ions
A 26 0.000 5 0.000 42 0.000
B -3 0.000 3 0.000 4 0.000
C 1 0.001 -5 0.000 1 0.027
D -17 0.000 -2 0.000 -33 0.000
AB -2 0.000 4 0.000 4 0.000
AC 2 0.000 -1 0.001 1 0.098
AD -16 0.000 -13 0.000 -33 0.000
BC 1 0.001 0 0.282 0 0.878
BD 1 0.002 -4 0.000 -4 0.000
CD -3 0.000 1 0.045 -1 0.053
ABC 1 0.002 0 0.487 1 0.173
ABD 1 0.006 -4 0.000 -4 0.000
ACD -3 0.000 3 0.000 -1 0.098
BCD -1 0.001 0 0.519 0 0.646
ABCD -1 0.001 0 0.185 0 0.878
Evaluation of factor effects – Graphical representation
According to the method used for OC calculations, when strong interaction effects
occur, the magnitude of the individual factor effects may be inflated (Montgomery,
2006). Therefore, graphical representations of the interaction effects (Figs. 21, 22
and 23) were used to further clarify the results obtained.
DOC residuals: Graphical representation of factor effects revealed that the
strongest and most significant effect on DOC residuals came from factor A (DOC)
(Fig. 21c). It is clear that although the influence of applied dosage (D) was strong,
its influence was substantially dependent on the initial DOC concentration of the
sample, i.e. dosage had a significant impact on the residual DOC found in the
purified water only for samples with high initial DOC concentration (Fig. 21d–21g).
The influence of initial water pH (C) and SS concentration appeared to be small
and only slightly dependent on the level of factor A (DOC) (Fig. 21a and 21b).
In agreement with previous findings (Jiang and Wang, 2009), lower DOC
residuals were found in samples with higher initial SS concentration. (Fig. 21g).
The presence of SS (up to a limiting concentration) does not necessarily result in
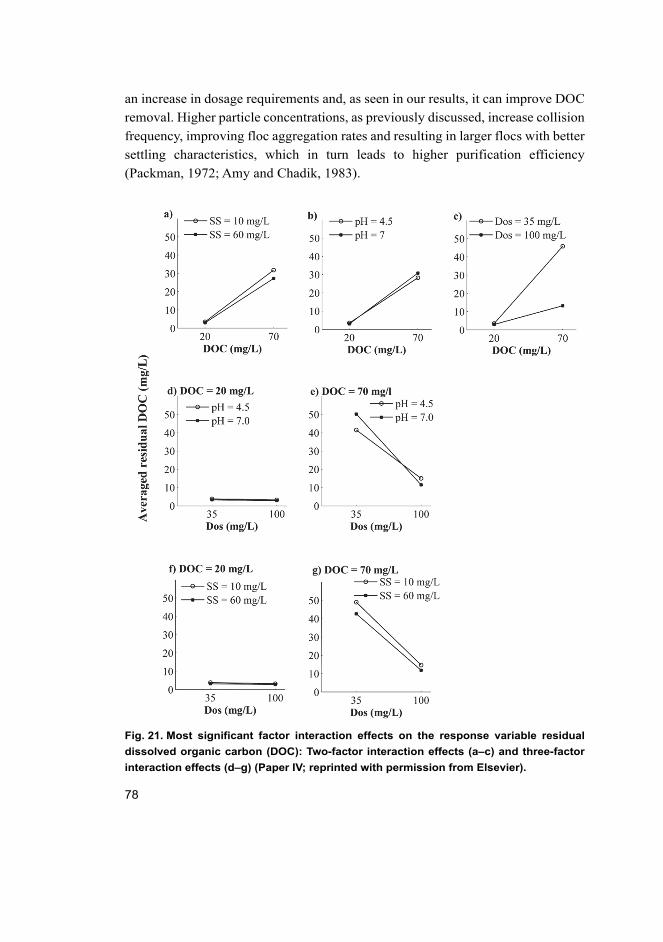
78
an increase in dosage requirements and, as seen in our results, it can improve DOC
removal. Higher particle concentrations, as previously discussed, increase collision
frequency, improving floc aggregation rates and resulting in larger flocs with better
settling characteristics, which in turn leads to higher purification efficiency
(Packman, 1972; Amy and Chadik, 1983).
Fig. 21. Most significant factor interaction effects on the response variable residual
dissolved organic carbon (DOC): Two-factor interaction effects (a–c) and three-factor
interaction effects (d–g) (Paper IV; reprinted with permission from Elsevier).
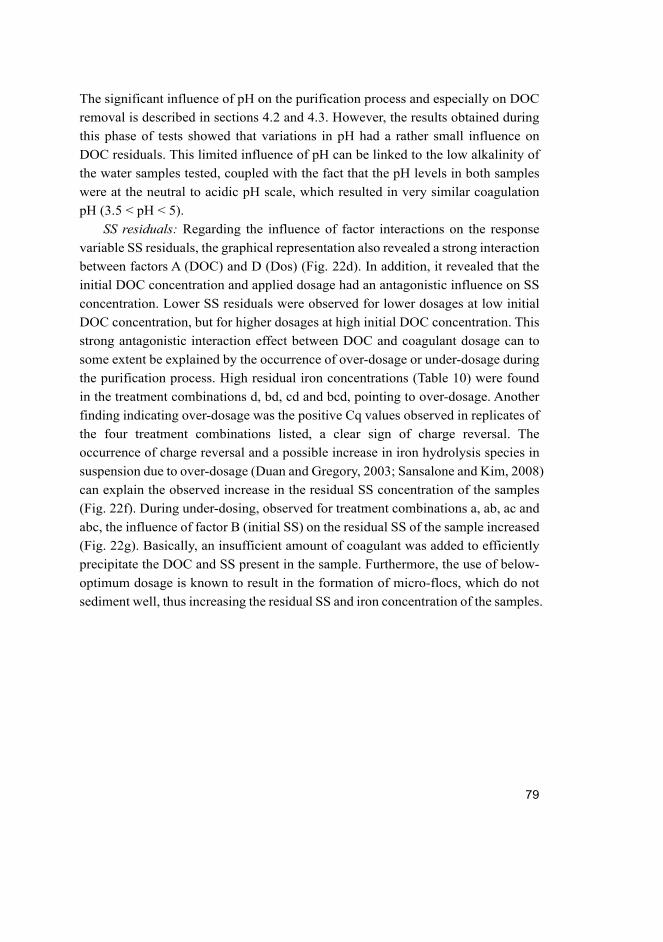
79
The significant influence of pH on the purification process and especially on DOC
removal is described in sections 4.2 and 4.3. However, the results obtained during
this phase of tests showed that variations in pH had a rather small influence on
DOC residuals. This limited influence of pH can be linked to the low alkalinity of
the water samples tested, coupled with the fact that the pH levels in both samples
were at the neutral to acidic pH scale, which resulted in very similar coagulation
pH (3.5 < pH < 5).
SS residuals: Regarding the influence of factor interactions on the response
variable SS residuals, the graphical representation also revealed a strong interaction
between factors A (DOC) and D (Dos) (Fig. 22d). In addition, it revealed that the
initial DOC concentration and applied dosage had an antagonistic influence on SS
concentration. Lower SS residuals were observed for lower dosages at low initial
DOC concentration, but for higher dosages at high initial DOC concentration. This
strong antagonistic interaction effect between DOC and coagulant dosage can to
some extent be explained by the occurrence of over-dosage or under-dosage during
the purification process. High residual iron concentrations (Table 10) were found
in the treatment combinations d, bd, cd and bcd, pointing to over-dosage. Another
finding indicating over-dosage was the positive Cq values observed in replicates of
the four treatment combinations listed, a clear sign of charge reversal. The
occurrence of charge reversal and a possible increase in iron hydrolysis species in
suspension due to over-dosage (Duan and Gregory, 2003; Sansalone and Kim, 2008)
can explain the observed increase in the residual SS concentration of the samples
(Fig. 22f). During under-dosing, observed for treatment combinations a, ab, ac and
abc, the influence of factor B (initial SS) on the residual SS of the sample increased
(Fig. 22g). Basically, an insufficient amount of coagulant was added to efficiently
precipitate the DOC and SS present in the sample. Furthermore, the use of below-
optimum dosage is known to result in the formation of micro-flocs, which do not
sediment well, thus increasing the residual SS and iron concentration of the samples.
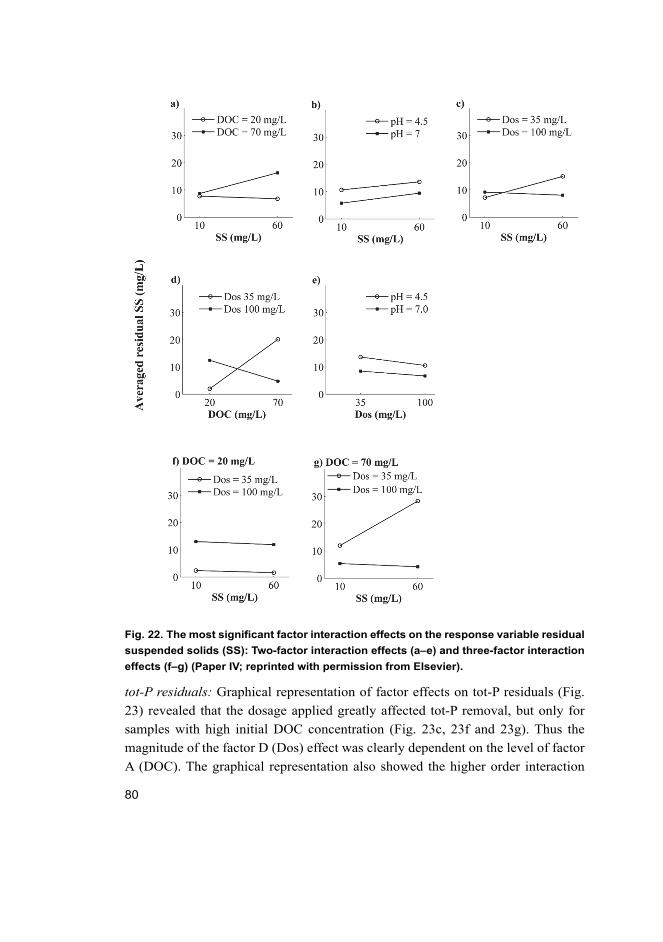
80
Fig. 22. The most significant factor interaction effects on the response variable residual
suspended solids (SS): Two-factor interaction effects (a–e) and three-factor interaction
effects (f–g) (Paper IV; reprinted with permission from Elsevier).
tot-P residuals: Graphical representation of factor effects on tot-P residuals (Fig.
23) revealed that the dosage applied greatly affected tot-P removal, but only for
samples with high initial DOC concentration (Fig. 23c, 23f and 23g). Thus the
magnitude of the factor D (Dos) effect was clearly dependent on the level of factor
A (DOC). The graphical representation also showed the higher order interaction
81
between factors A, B and D. Higher tot-P residual concentration was found in
samples with higher initial SS (B), but only for the treatment combinations where
a low dosage (D) was applied to samples with a high initial DOC (A) (Fig. 23f and
23g).
Regarding the effect of factor B (the initial SS concentration of the samples),
it can be assumed that it was mainly due to the effect it had on the initial tot-P
concentration of the water. Higher initial SS resulted in higher initial tot-P
concentration (Table 6). Higher SS concentrations led to higher residual SS at low
coagulant dosages, which consequently resulted in higher particulate phosphorus
in the treated samples. As for the low influence of pH on the residual concentration
of tot-P, it can also be explained (as can the influence of pH on the DOC residuals
observed) by the similarly acid pH characteristics of treated samples (Table 10),
which resulted in coagulation pH of a similar nature. The removal of phosphorus
from humic waters is said to be enhanced at acidic (<5) pH values and is linked to
the formation of humic acid-metal-phosphate complexes (Cheng et al., 2004). For
the 16 experimental runs performed in this thesis, treated samples which contained
low residual DOC also contained very low residual PO4-P concentration (Table 10),
which further explains the relationship between DOC and tot-P removal.
Overall, it can be concluded that the initial DOC concentration of the raw water
samples and its interactions with the coagulant dosage exerted the most significant
influence on the residual concentrations of DOC, SS and tot-P. However, the
influence of coagulant dosage was only significant for samples with high initial
DOC concentration. The variations applied to the factors SS and pH appeared to
affect the removal of DOC, SS and tot-P only slightly. Nevertheless, high SS
concentration led to lower DOC residuals at all dosages applied and lower DOC
residuals were observed in samples with high initial pH when high coagulant
dosages were applied. For this type of diffuse runoff, i.e. of a humic and acidic
nature, coagulant dosage should be adjusted according to variations in DOC
concentration to ensure an efficient purification process where other substances of
concern, such as SS, tot-P, etc., are also efficiently removed.
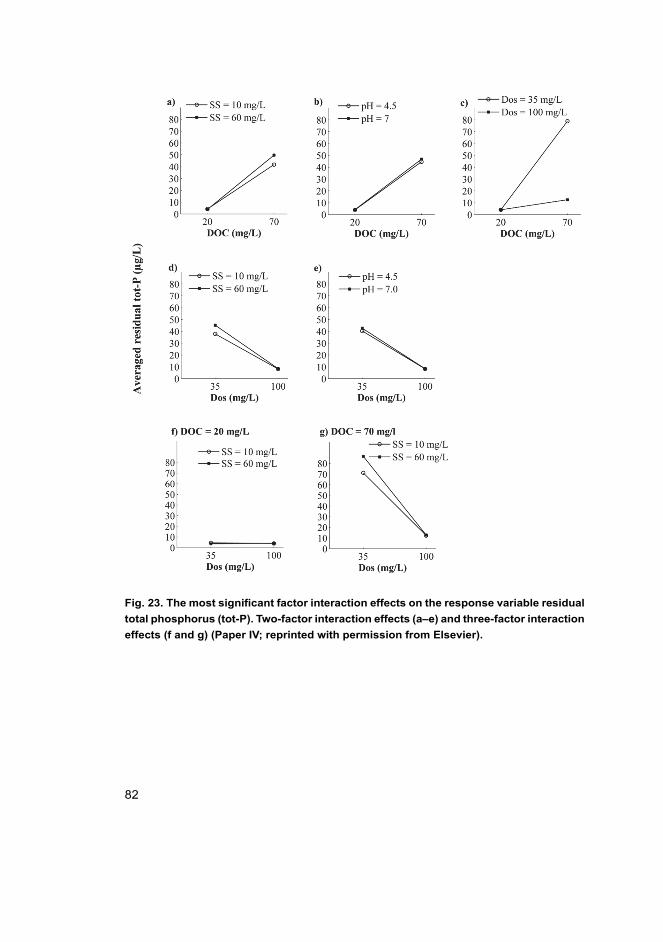
82
Fig. 23. The most significant factor interaction effects on the response variable residual
total phosphorus (tot-P). Two-factor interaction effects (a–e) and three-factor interaction
effects (f and g) (Paper IV; reprinted with permission from Elsevier).
83
5 Conclusions and suggestions for future research and treatment facility optimisation
Significant fluctuations in peat extraction runoff water quality are common and,
together with issues related to process control and the design of chemical treatment
facilities, contribute to the variations in water purification efficiency reported at
commercial extraction sites. The laboratory studies conducted in this thesis work
revealed that, among the inorganic and organic products tested, FS was the overall
best performing coagulant. It achieved the best removal efficiencies, being
particularly more effective in the removal of organic matter than the other products.
However, this effective purification performance was obtained under optimum
conditions. For these results to be replicated under field or real conditions,
improvements to purification systems, including e.g. adjusting coagulant dosage
according to water quality, introduction of slow mixing and provision of adequate
retention time are needed.
Conclusions and suggestions for future research
A comparison of the observed advantages and disadvantages of all coagulants
tested is presented in Table 11. In general, the data support the following
conclusions and suggestions:
- Lower performance and higher dosage requirement were generally
observed for solid metal salts than for products pre-dissolved prior to
addition. The detrimental effects of low temperature, inadequate mixing
and fluctuations in water pH were also significantly more evident in the
purification levels achieved by solid coagulants.
- Although FS was the best performing coagulant, the synthetic and natural
organic coagulants tested achieved satisfactory purification levels. Further
investigations are required to determine the influence of factors such as
mixing on the performance of organic polymers. Evaluation of products
with varying MW and CD is suggested. Investigation of coagulant
performance in terms of purification of particulate-rich humic samples is
also recommended.
- Mixing during the flocculation stage had a more significant influence on
purification by metal salt coagulants than mixing during coagulation;
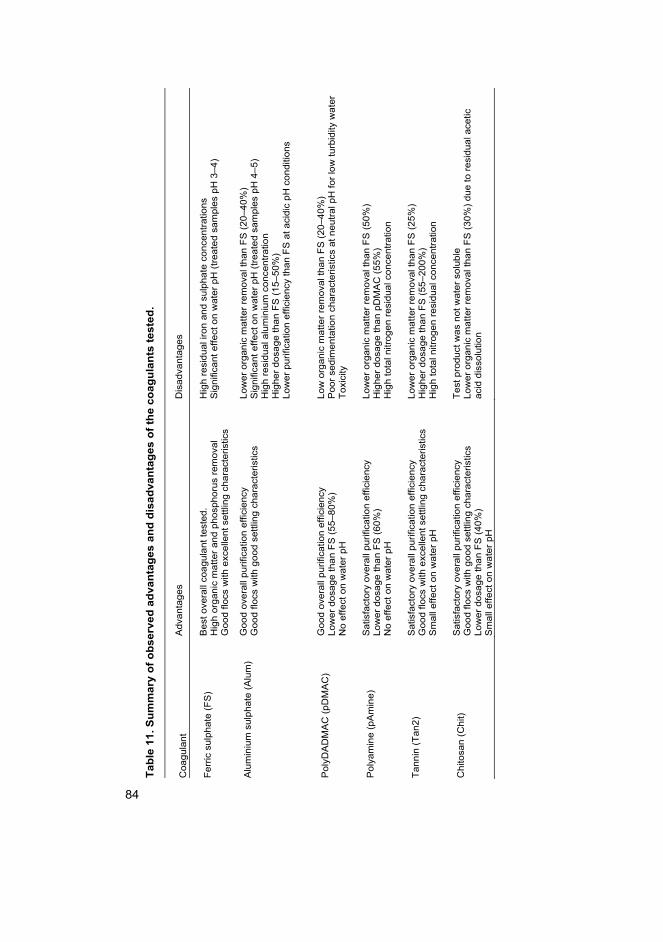
84
Ta
ble
11
. S
um
ma
ry o
f o
bs
erv
ed
ad
va
nta
ge
s a
nd
dis
ad
va
nta
ge
s o
f th
e c
oa
gu
lan
ts t
este
d.
Coa
gula
nt
Adv
anta
ges
Dis
adva
ntag
es
Ferr
ic s
ulph
ate
(FS
) B
est o
vera
ll co
agul
ant t
este
d.
Hig
h or
gani
c m
atte
r and
pho
spho
rus
rem
oval
G
ood
flocs
with
exc
elle
nt s
ettli
ng c
hara
cter
istic
s
Hig
h re
sidu
al ir
on a
nd s
ulph
ate
conc
entra
tions
Sig
nific
ant e
ffect
on
wat
er p
H (t
reat
ed s
ampl
es p
H 3
–4)
Alu
min
ium
sul
phat
e (A
lum
) G
ood
over
all p
urifi
catio
n ef
ficie
ncy
Goo
d flo
cs w
ith g
ood
settl
ing
char
acte
ristic
s
Low
er o
rgan
ic m
atte
r rem
oval
than
FS
(20–
40%
) S
igni
fican
t effe
ct o
n w
ater
pH
(tre
ated
sam
ples
pH
4–5
) H
igh
resi
dual
alu
min
ium
con
cent
ratio
n H
ighe
r dos
age
than
FS
(15–
50%
) Lo
wer
pur
ifica
tion
effic
ienc
y th
an F
S a
t aci
dic
pH c
ondi
tions
Pol
yDA
DM
AC
(pD
MA
C)
Goo
d ov
eral
l pur
ifica
tion
effic
ienc
y Lo
wer
dos
age
than
FS
(55–
80%
) N
o ef
fect
on
wat
er p
H
Low
org
anic
mat
ter r
emov
al th
an F
S (2
0–40
%)
Poo
r sed
imen
tatio
n ch
arac
teris
tics
at n
eutra
l pH
for l
ow tu
rbid
ity w
ater
To
xici
ty
Pol
yam
ine
(pA
min
e)
Sat
isfa
ctor
y ov
eral
l pur
ifica
tion
effic
ienc
y Lo
wer
dos
age
than
FS
(60%
) N
o ef
fect
on
wat
er p
H
Low
er o
rgan
ic m
atte
r rem
oval
than
FS
(50%
) H
ighe
r dos
age
than
pD
MA
C (5
5%)
Hig
h to
tal n
itrog
en re
sidu
al c
once
ntra
tion
Tann
in (T
an2)
S
atis
fact
ory
over
all p
urifi
catio
n ef
ficie
ncy
G
ood
flocs
with
exc
elle
nt s
ettli
ng c
hara
cter
istic
s S
mal
l effe
ct o
n w
ater
pH
Low
er o
rgan
ic m
atte
r rem
oval
than
FS
(25%
) H
ighe
r dos
age
than
FS
(55–
200%
) H
igh
tota
l nitr
ogen
resi
dual
con
cent
ratio
n
Chi
tosa
n (C
hit)
Sat
isfa
ctor
y ov
eral
l pur
ifica
tion
effic
ienc
y G
ood
flocs
with
goo
d se
ttlin
g ch
arac
teris
tics
Low
er d
osag
e th
an F
S (4
0%)
Sm
all e
ffect
on
wat
er p
H
Test
pro
duct
was
not
wat
er s
olub
le
Low
er o
rgan
ic m
atte
r rem
oval
than
FS
(30%
) due
to re
sidu
al a
cetic
ac
id d
isso
lutio
n
85
– Due to characteristics of the water samples tested (i.e. humic, low alkalinity,
relatively low turbidity etc.), lower dosages were required for satisfactory
purification in the treatment of samples with lower initial pH.
– Low water temperature (2–5 °C) had an overall negative effect on purification
efficiency, especially on the removal of SS (<25%). All coagulants required
between 50 and 200% longer settling times to reach 80% removal of turbidity
at low water temperature.
– The higher molecular weight DOC fractions (biopolymers and humic
substances) were more efficiently removed by all coagulants, with FS being
the most efficient. Good removal rates were achieved by Tan2 (lowest CD
polymer), indicating that charge neutralisation should not be considered as the
only effective mechanism of HS removal. Further investigations to evaluate
the influence of organic coagulant properties such as molecular weight and
charge distribution on the removal of DOC fractions are suggested.
– The initial DOC concentration of the raw water samples and its interactions
with coagulant dosage exerted the most significant influence on the
purification efficiency achieved by FS. Thus, coagulant dosage should be
adjusted according to variations in DOC concentration to ensure an efficient
purification process where other pollutants of concern, such as SS, tot-P etc.,
are also efficiently removed.
Recommendations for optimisation of treatment facilities
– Cost/benefit evaluation of on-site pre-dissolution of solid coagulant is
suggested.
– Coagulant dosage (FS) should not be kept constant, but adjusted according to
variations in DOC concentration. Site-specific monitoring can be used to
estimate organic matter concentration in different periods and pre-adjust the
dosage accordingly. More effective dosage optimisation measures could result
from continuous monitoring of organic matter concentration via on-line
measurements of DOC or indicators such as UV254 absorption, and correlating
this to automated adjustment of coagulant dosage.
– Preferential flow, leading to a decrease in retention time and poor purification
results, was observed in the sedimentation basin studied. This appeared to be
the result of inlet characteristics, thus inlet design for sedimentation basins
should be carefully revised.
86
– Introduction of a slow mixing stage within or prior to the sedimentation basin
is recommended to improve floc aggregation and the subsequent sedimentation
process.
– Complete cost/benefit evaluation regarding the use of metal salts and organic
coagulants is recommended. In addition to the cost of product used, this should
include e.g. the costs of product transport, possible pH adjustment of purified
water, equipment and energy used, sludge handling etc.
– The impact of temperature on the chemical purification process must be taken
into consideration during the design or optimisation of treatment facilities.
Longer sedimentation times should be allowed in sedimentation basins to
ensure satisfactory SS retention.
– pH adjustments, when necessary, should be conducted at the outflow of
chemical purification (prior discharge). This should lead to lower coagulant
consumption.
Overall, due to its capability for removing nutrients, organic matter and SS,
chemical purification has the potential to be an effective method to reduce pollutant
loads not only from peat extraction, but also from land use activities such as
agriculture and forestry. It could become an appropriate method for application in
areas with sensitive ecosystems where high removal rates are required. The use of
bio-coagulants can also improve the possibilities of nutrient recovery by recycling
the sludge obtained on-site to e.g. agriculture as a soil amendment. However, an
adequate level of process control is needed for effective results to be obtained and
to ensure low variability and satisfactory purification levels.
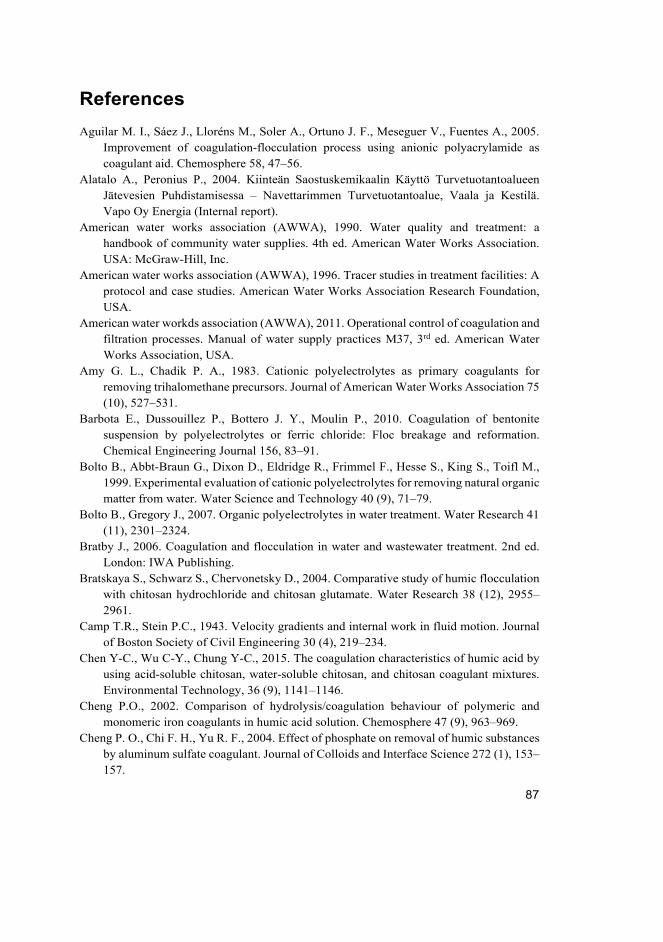
87
References
Aguilar M. I., Sáez J., Lloréns M., Soler A., Ortuno J. F., Meseguer V., Fuentes A., 2005. Improvement of coagulation-flocculation process using anionic polyacrylamide as coagulant aid. Chemosphere 58, 47–56.
Alatalo A., Peronius P., 2004. Kiinteän Saostuskemikaalin Käyttö Turvetuotantoalueen Jätevesien Puhdistamisessa – Navettarimmen Turvetuotantoalue, Vaala ja Kestilä. Vapo Oy Energia (Internal report).
American water works association (AWWA), 1990. Water quality and treatment: a handbook of community water supplies. 4th ed. American Water Works Association. USA: McGraw-Hill, Inc.
American water works association (AWWA), 1996. Tracer studies in treatment facilities: A protocol and case studies. American Water Works Association Research Foundation, USA.
American water workds association (AWWA), 2011. Operational control of coagulation and filtration processes. Manual of water supply practices M37, 3rd ed. American Water Works Association, USA.
Amy G. L., Chadik P. A., 1983. Cationic polyelectrolytes as primary coagulants for removing trihalomethane precursors. Journal of American Water Works Association 75 (10), 527–531.
Barbota E., Dussouillez P., Bottero J. Y., Moulin P., 2010. Coagulation of bentonite suspension by polyelectrolytes or ferric chloride: Floc breakage and reformation. Chemical Engineering Journal 156, 83–91.
Bolto B., Abbt-Braun G., Dixon D., Eldridge R., Frimmel F., Hesse S., King S., Toifl M., 1999. Experimental evaluation of cationic polyelectrolytes for removing natural organic matter from water. Water Science and Technology 40 (9), 71–79.
Bolto B., Gregory J., 2007. Organic polyelectrolytes in water treatment. Water Research 41 (11), 2301–2324.
Bratby J., 2006. Coagulation and flocculation in water and wastewater treatment. 2nd ed. London: IWA Publishing.
Bratskaya S., Schwarz S., Chervonetsky D., 2004. Comparative study of humic flocculation with chitosan hydrochloride and chitosan glutamate. Water Research 38 (12), 2955–2961.
Camp T.R., Stein P.C., 1943. Velocity gradients and internal work in fluid motion. Journal of Boston Society of Civil Engineering 30 (4), 219–234.
Chen Y-C., Wu C-Y., Chung Y-C., 2015. The coagulation characteristics of humic acid by using acid-soluble chitosan, water-soluble chitosan, and chitosan coagulant mixtures. Environmental Technology, 36 (9), 1141–1146.
Cheng P.O., 2002. Comparison of hydrolysis/coagulation behaviour of polymeric and monomeric iron coagulants in humic acid solution. Chemosphere 47 (9), 963–969.
Cheng P. O., Chi F. H., Yu R. F., 2004. Effect of phosphate on removal of humic substances by aluminum sulfate coagulant. Journal of Colloids and Interface Science 272 (1), 153–157.
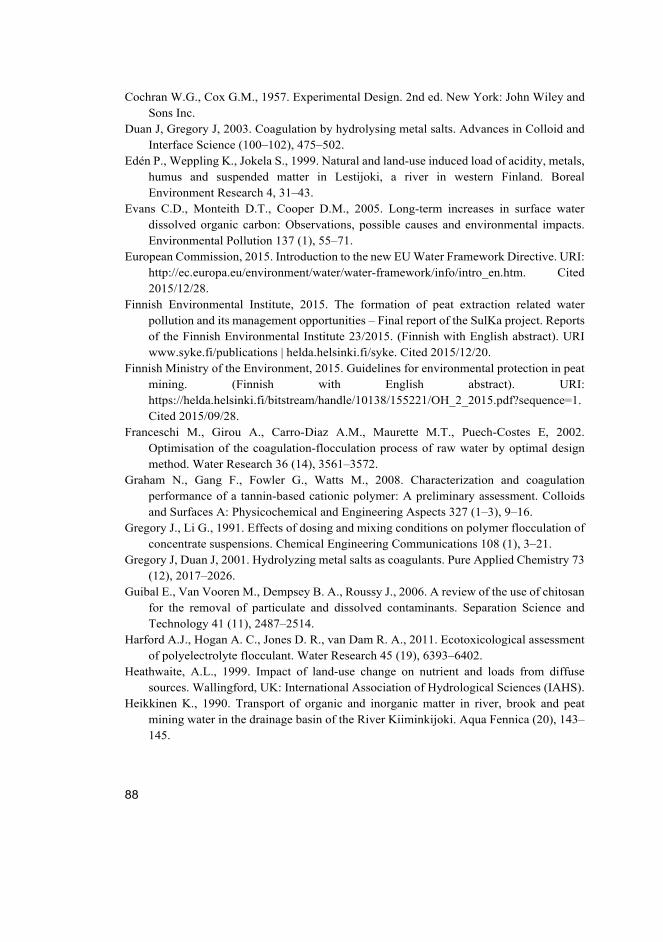
88
Cochran W.G., Cox G.M., 1957. Experimental Design. 2nd ed. New York: John Wiley and Sons Inc.
Duan J, Gregory J, 2003. Coagulation by hydrolysing metal salts. Advances in Colloid and Interface Science (100–102), 475–502.
Edén P., Weppling K., Jokela S., 1999. Natural and land-use induced load of acidity, metals, humus and suspended matter in Lestijoki, a river in western Finland. Boreal Environment Research 4, 31–43.
Evans C.D., Monteith D.T., Cooper D.M., 2005. Long-term increases in surface water dissolved organic carbon: Observations, possible causes and environmental impacts. Environmental Pollution 137 (1), 55–71.
European Commission, 2015. Introduction to the new EU Water Framework Directive. URI: http://ec.europa.eu/environment/water/water-framework/info/intro_en.htm. Cited 2015/12/28.
Finnish Environmental Institute, 2015. The formation of peat extraction related water pollution and its management opportunities – Final report of the SulKa project. Reports of the Finnish Environmental Institute 23/2015. (Finnish with English abstract). URI www.syke.fi/publications | helda.helsinki.fi/syke. Cited 2015/12/20.
Finnish Ministry of the Environment, 2015. Guidelines for environmental protection in peat mining. (Finnish with English abstract). URI: https://helda.helsinki.fi/bitstream/handle/10138/155221/OH_2_2015.pdf?sequence=1. Cited 2015/09/28.
Franceschi M., Girou A., Carro-Diaz A.M., Maurette M.T., Puech-Costes E, 2002. Optimisation of the coagulation-flocculation process of raw water by optimal design method. Water Research 36 (14), 3561–3572.
Graham N., Gang F., Fowler G., Watts M., 2008. Characterization and coagulation performance of a tannin-based cationic polymer: A preliminary assessment. Colloids and Surfaces A: Physicochemical and Engineering Aspects 327 (1–3), 9–16.
Gregory J., Li G., 1991. Effects of dosing and mixing conditions on polymer flocculation of concentrate suspensions. Chemical Engineering Communications 108 (1), 3–21.
Gregory J, Duan J, 2001. Hydrolyzing metal salts as coagulants. Pure Applied Chemistry 73 (12), 2017–2026.
Guibal E., Van Vooren M., Dempsey B. A., Roussy J., 2006. A review of the use of chitosan for the removal of particulate and dissolved contaminants. Separation Science and Technology 41 (11), 2487–2514.
Harford A.J., Hogan A. C., Jones D. R., van Dam R. A., 2011. Ecotoxicological assessment of polyelectrolyte flocculant. Water Research 45 (19), 6393–6402.
Heathwaite, A.L., 1999. Impact of land-use change on nutrient and loads from diffuse sources. Wallingford, UK: International Association of Hydrological Sciences (IAHS).
Heikkinen K., 1990. Transport of organic and inorganic matter in river, brook and peat mining water in the drainage basin of the River Kiiminkijoki. Aqua Fennica (20), 143–145.
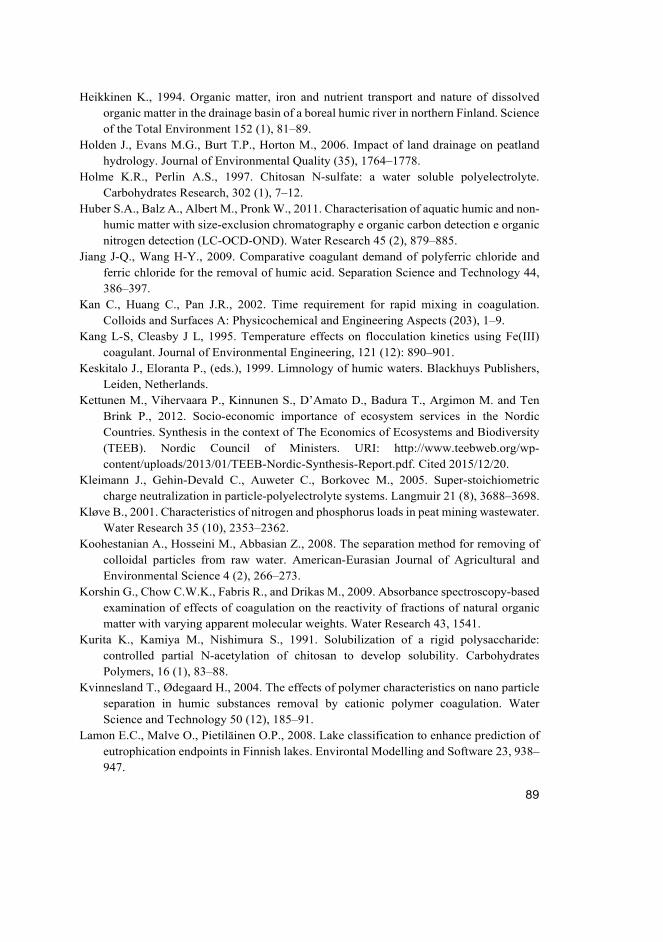
89
Heikkinen K., 1994. Organic matter, iron and nutrient transport and nature of dissolved organic matter in the drainage basin of a boreal humic river in northern Finland. Science of the Total Environment 152 (1), 81–89.
Holden J., Evans M.G., Burt T.P., Horton M., 2006. Impact of land drainage on peatland hydrology. Journal of Environmental Quality (35), 1764–1778.
Holme K.R., Perlin A.S., 1997. Chitosan N-sulfate: a water soluble polyelectrolyte. Carbohydrates Research, 302 (1), 7–12.
Huber S.A., Balz A., Albert M., Pronk W., 2011. Characterisation of aquatic humic and non-humic matter with size-exclusion chromatography e organic carbon detection e organic nitrogen detection (LC-OCD-OND). Water Research 45 (2), 879–885.
Jiang J-Q., Wang H-Y., 2009. Comparative coagulant demand of polyferric chloride and ferric chloride for the removal of humic acid. Separation Science and Technology 44, 386–397.
Kan C., Huang C., Pan J.R., 2002. Time requirement for rapid mixing in coagulation. Colloids and Surfaces A: Physicochemical and Engineering Aspects (203), 1–9.
Kang L-S, Cleasby J L, 1995. Temperature effects on flocculation kinetics using Fe(III) coagulant. Journal of Environmental Engineering, 121 (12): 890–901.
Keskitalo J., Eloranta P., (eds.), 1999. Limnology of humic waters. Blackhuys Publishers, Leiden, Netherlands.
Kettunen M., Vihervaara P., Kinnunen S., D’Amato D., Badura T., Argimon M. and Ten Brink P., 2012. Socio-economic importance of ecosystem services in the Nordic Countries. Synthesis in the context of The Economics of Ecosystems and Biodiversity (TEEB). Nordic Council of Ministers. URI: http://www.teebweb.org/wp-content/uploads/2013/01/TEEB-Nordic-Synthesis-Report.pdf. Cited 2015/12/20.
Kleimann J., Gehin-Devald C., Auweter C., Borkovec M., 2005. Super-stoichiometric charge neutralization in particle-polyelectrolyte systems. Langmuir 21 (8), 3688–3698.
Kløve B., 2001. Characteristics of nitrogen and phosphorus loads in peat mining wastewater. Water Research 35 (10), 2353–2362.
Koohestanian A., Hosseini M., Abbasian Z., 2008. The separation method for removing of colloidal particles from raw water. American-Eurasian Journal of Agricultural and Environmental Science 4 (2), 266–273.
Korshin G., Chow C.W.K., Fabris R., and Drikas M., 2009. Absorbance spectroscopy-based examination of effects of coagulation on the reactivity of fractions of natural organic matter with varying apparent molecular weights. Water Research 43, 1541.
Kurita K., Kamiya M., Nishimura S., 1991. Solubilization of a rigid polysaccharide: controlled partial N-acetylation of chitosan to develop solubility. Carbohydrates Polymers, 16 (1), 83–88.
Kvinnesland T., Ødegaard H., 2004. The effects of polymer characteristics on nano particle separation in humic substances removal by cationic polymer coagulation. Water Science and Technology 50 (12), 185–91.
Lamon E.C., Malve O., Pietiläinen O.P., 2008. Lake classification to enhance prediction of eutrophication endpoints in Finnish lakes. Environtal Modelling and Software 23, 938–947.
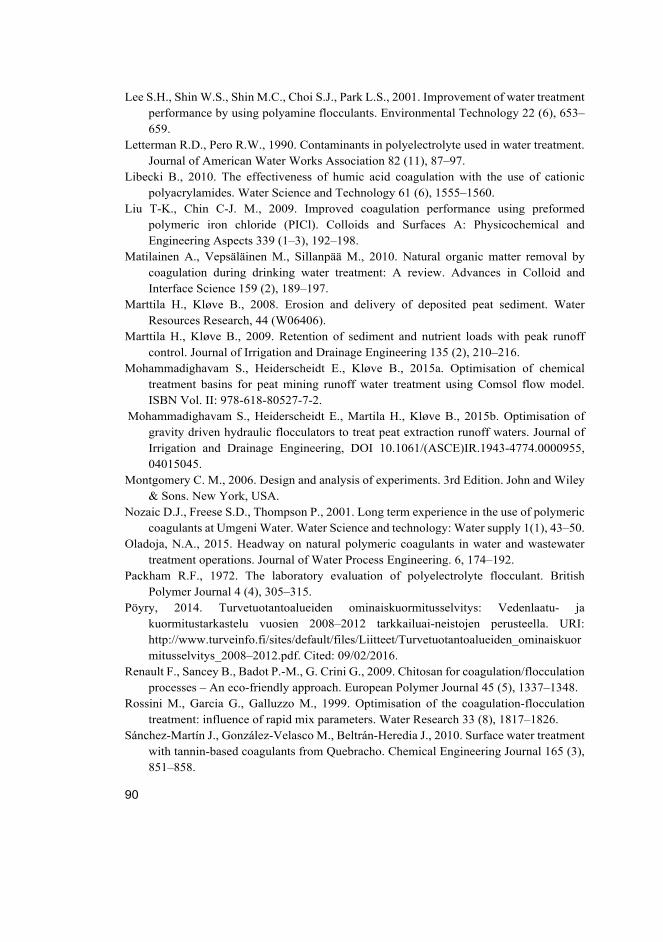
90
Lee S.H., Shin W.S., Shin M.C., Choi S.J., Park L.S., 2001. Improvement of water treatment performance by using polyamine flocculants. Environmental Technology 22 (6), 653–659.
Letterman R.D., Pero R.W., 1990. Contaminants in polyelectrolyte used in water treatment. Journal of American Water Works Association 82 (11), 87–97.
Libecki B., 2010. The effectiveness of humic acid coagulation with the use of cationic polyacrylamides. Water Science and Technology 61 (6), 1555–1560.
Liu T-K., Chin C-J. M., 2009. Improved coagulation performance using preformed polymeric iron chloride (PICl). Colloids and Surfaces A: Physicochemical and Engineering Aspects 339 (1–3), 192–198.
Matilainen A., Vepsäläinen M., Sillanpää M., 2010. Natural organic matter removal by coagulation during drinking water treatment: A review. Advances in Colloid and Interface Science 159 (2), 189–197.
Marttila H., Kløve B., 2008. Erosion and delivery of deposited peat sediment. Water Resources Research, 44 (W06406).
Marttila H., Kløve B., 2009. Retention of sediment and nutrient loads with peak runoff control. Journal of Irrigation and Drainage Engineering 135 (2), 210–216.
Mohammadighavam S., Heiderscheidt E., Kløve B., 2015a. Optimisation of chemical treatment basins for peat mining runoff water treatment using Comsol flow model. ISBN Vol. II: 978-618-80527-7-2.
Mohammadighavam S., Heiderscheidt E., Martila H., Kløve B., 2015b. Optimisation of gravity driven hydraulic flocculators to treat peat extraction runoff waters. Journal of Irrigation and Drainage Engineering, DOI 10.1061/(ASCE)IR.1943-4774.0000955, 04015045.
Montgomery C. M., 2006. Design and analysis of experiments. 3rd Edition. John and Wiley & Sons. New York, USA.
Nozaic D.J., Freese S.D., Thompson P., 2001. Long term experience in the use of polymeric coagulants at Umgeni Water. Water Science and technology: Water supply 1(1), 43–50.
Oladoja, N.A., 2015. Headway on natural polymeric coagulants in water and wastewater treatment operations. Journal of Water Process Engineering. 6, 174–192.
Packham R.F., 1972. The laboratory evaluation of polyelectrolyte flocculant. British Polymer Journal 4 (4), 305–315.
Pöyry, 2014. Turvetuotantoalueiden ominaiskuormitusselvitys: Vedenlaatu- ja kuormitustarkastelu vuosien 2008–2012 tarkkailuai-neistojen perusteella. URI: http://www.turveinfo.fi/sites/default/files/Liitteet/Turvetuotantoalueiden_ominaiskuormitusselvitys_2008–2012.pdf. Cited: 09/02/2016.
Renault F., Sancey B., Badot P.-M., G. Crini G., 2009. Chitosan for coagulation/flocculation processes – An eco-friendly approach. European Polymer Journal 45 (5), 1337–1348.
Rossini M., Garcia G., Galluzzo M., 1999. Optimisation of the coagulation-flocculation treatment: influence of rapid mix parameters. Water Research 33 (8), 1817–1826.
Sánchez-Martín J., González-Velasco M., Beltrán-Heredia J., 2010. Surface water treatment with tannin-based coagulants from Quebracho. Chemical Engineering Journal 165 (3), 851–858.
91
Sansalone J.J., Kim J-Y., 2008. Suspended particle destabilization in retained urban storm water as function of coagulant dosage and redox conditions. Water Research 42 (4–5), 909–922.
Sharp E. L., Jarvis P., Parsons S.A., Jefferson B., 2006. Impact of fractional character on the coagulation of NOM. Colloids and Surfaces A: Physicochemical and Engineering Aspects 286 (1–3), 104–111.
Sillanpää M., 2015. Natural organic matter in water: Characterization and treatment methods. 1st Ed. IWA Publishing, Butterworth-Heinemann, Oxford, UK.
Slavik I., Muller S., Mokosch R., Azongbilla A., Uhl W., 2012. Impact of shear stress and pH changes on floc size and removal of dissolved organic matter (DOM). Water Research 46, 6543–6553.
Song T., Pranovich A., Sumerskiy I., Holbom B., 2008. Extraction of galactoglucomannan from spruce wood with pressurised hot water. Holzforschung, 62 (6), 659-666.
Svahnbäck, L., 2007. Precipitation-induced runoff and leaching from milled peat mining mires by peat types: a comparative method for estimating the loading of water bodies during peat production. Doctoral Thesis. University of Helsinki, Department of Geology.
Tuukkanen T., Marttila H., Kløve B., 2014. Effect of soil properties on peat erosion and suspended sediment delivery in drained peatlands. Water Resources Research, 50, 3523-3535.
Turveteollisuusliitto (Association of Finnish Peat Industries), 2010. Water treatment methods in peat production. URI: http://old.peatsociety.org/user_files/files/jkl%20seminars%202010/technology/vayrynen_water_treatment11%206%202010.pdf. Cited 2015/06/20.
Volk C., Bell K., Ibrahim E., Verges D., Amy G., Lechevallier M., 2000. Impact of enhanced and optimized coagulation on removal of organic matter and its biodegradable fraction in drinking water. Water Resources 34 (12), 3247–3257.
Vuorenmaa J., Forsius M., Mannio J., 2006. Increasing trends of total organic carbon concentrations in small forest lakes in Finland from 1987 to 2003. Science of the Total Environment 365 (1–3), 47–65.
Vuori K., 1995. Direct and indirect effects of iron on river ecosystems. Annales Zoologici Fennici, 32 (3), 317–329.
Wichmann A., 2015. Vapo Oy. VS: SULKA data and some help needed [private email]. Sent: 17/07/2015 10:38 o’clock (GMT + 0200)
Worrall F., Swank W.T., Burt T.P., 2003. Changes in nitrate concentrations due to land management, ecological succession and climate: Developing a systems approach to integrated catchment response. Water Resources Research 39 (7), 1–14.
Worrall F., Burt T.P., 2009. Changes in DOC treatability: Indications of compositional changes in DOC trends. Journal of Hydrology 366, 1–8.
Wei J., Gao B., Yue Q., Wang Y., Li W., Zhu X., 2009. Comparison of coagulation behaviour and floc structure characteristic of different polyferric-cationic polymer dual-coagulants in humic acid solution. Water Research 43 (3), 724–732.
92
Yan M., Liu H., Wang D., Ni J., Qu J., 2009. Natural organic matter removal by coagulation: effect of kinetics and hydraulic power. Water Science and Technology: Water Supply 9 (1), 21–30.
Yang Z., Shang Y., Lu Y., Chen Y., Huang X., Chen A., Jiang,Y., Gu W., Qian X., Yang H., Cheng H., 2011. Flocculation properties of biodegradable amphoteric chitosan-based flocculants. Chemical Engineering Journal 172 (1), 287–295.
Yates F., 1937. Design and analysis of factorial experiments. Technical Communications 35. London: Imperial Bureau of Soil Sciences.
Yin C-Y., 2010. Emerging usage of plant-based coagulants for water and wastewater treatment. Process Biochemistry 45, 1437–1444.
Xiao F., Ma J., Yi P., Huang J-C.H., 2008. Effects of low temperature on coagulation of kaolinite suspension. Water Research (42), 2983–2992.
Xiao F., Huang J.H., Zhang B., Cui C., 2009. Effects of low temperature on coagulation kinetics and floc surface morphology using alum. Desalination 237 (1/3), 201–213.
Zak D., Kleeberg A., & Hupfer M., 2006. Sulphate-mediated phosphorus mobilization in riverine sediments at increasing sulphate concentration, river spree, NE Germany. Biogeochemistry 80 (2), 109–119.
Zhan X., Gao B., Wang Y., Yue Q., 2011. Influence of velocity gradient on aluminium m and iron floc property for NOM removal from low organic matter surface water by coagulation. Chemical Engineering Journal, (166), 116–121.
Åström M., Aaltonen E., Koivusaari J., 2001. Impact of ditching in a small forested catchment on concentrations of suspended material, organic carbon, hydrogen ions and metals in stream water. Aquatic Geochemistry 57, 57–73.
93
Original publications
I Heiderscheidt E., Saukkoriipi J.T., Ronkanen A-K., Klöve B., 2013. Optimisation of chemical purification conditions for direct application of solid metal salt coagulants: Treatment of peatland-derived diffuse runoff. Journal of Environmental Sciences 25(4), 659–669. DOI:10.1016/S1001-0742(12)60111-9
II Heiderscheidt E., Leiviskä T., Ronkanen A-K., Kløve B., 2016. Evaluating the suitability of synthetic organic polymers to replace iron salts in the purification of humic and sediment-rich runoff. Desalination and Water Treatment 57 (23), 10948–10957. DOI:10.1080/19443994.2015.1043954
III Heiderscheidt E., Leiviskä T., Kløve B., 2016. Coagulation of humic waters for diffused pollution control and the influence of coagulant type on DOC fractions removed. Journal of Environmental Management (in press). DOI:10.1016/j.jenvman.2016.06.043
IV Heiderscheidt E., Leiviskä T., Kløve B., 2015. Chemical treatment response to variations in non-point pollution water quality: results of a factorial design experiment. Journal of Environmental Management 150, 164–172. DOI:10.1016/j.jenvman.2014.10.021
Reprinted with permission from Elsevier (I, III and IV) and Taylor & Francis (II).
Original publications are not included in the electronic version of this thesis.

94
A C T A U N I V E R S I T A T I S O U L U E N S I S
Book orders:Granum: Virtual book storehttp://granum.uta.fi/granum/
S E R I E S C T E C H N I C A
564. Nguyen, Vu Thuy Dan (2016) Transmission strategies for full-duplex multiuserMIMO communications systems
565. Keränen, Pekka (2016) High precision time-to-digital converters for applicationsrequiring a wide measurement range
566. Koivuranta, Elisa (2016) Optical monitoring of flocs and filaments in the activatedsludge process
567. Lohikoski, Päivi (2016) Information processing in global virtual NPD projects
568. Kauppila, Osmo (2016) Integrated quality evaluation in higher education
569. Kisko, Anna (2016) Microstructure and properties of reversion treated low-Nihigh-Mn austenitic stainless steels
570. Postila, Heini (2016) Peat extraction runoff water purification in treatmentwetlands constructed on drained peatlands in a cold climate
571. Happonen, Tuomas (2016) Reliability studies on printed conductors on flexiblesubstrates under cyclic bending
572. Soderi, Simone (2016) Evaluation of industrial wireless communications systems’security
573. Harjula, Erkki (2016) Energy-efficient peer-to-peer networking for constrained-capacity mobile environments
574. Tolonen, Arto (2016) Product portfolio management over horizontal and verticalportfolios
575. Suliman, Isameldin Mohammed (2016) Performance analysis of cognitive radionetworks and radio resource allocation
576. Karjalainen, Satu Maaria (2016) Identification of processes leading to long-termwastewater purification in northern treatment wetlands
577. Ohenoja, Markku (2016) Computational methods for exploiting image-based datain paper web profile control
578. Väliheikki, Ari (2016) Resistance of catalytic materials towards chemicalimpurities : the effect of sulphur and biomaterial-based compounds on theperformance of DOC and SCR catalysts
579. Kinnunen, Tuomo (2016) Product management perspectives on stakeholder andbusiness opportunity analyses in the front-end of product creation
C580etukansi.kesken.fm Page 2 Wednesday, August 17, 2016 2:31 PM
UNIVERSITY OF OULU P .O. Box 8000 F I -90014 UNIVERSITY OF OULU FINLAND
A C T A U N I V E R S I T A T I S O U L U E N S I S
Professor Esa Hohtola
University Lecturer Santeri Palviainen
Postdoctoral research fellow Sanna Taskila
Professor Olli Vuolteenaho
University Lecturer Veli-Matti Ulvinen
Director Sinikka Eskelinen
Professor Jari Juga
University Lecturer Anu Soikkeli
Professor Olli Vuolteenaho
Publications Editor Kirsti Nurkkala
ISBN 978-952-62-1319-4 (Paperback)ISBN 978-952-62-1320-0 (PDF)ISSN 0355-3213 (Print)ISSN 1796-2226 (Online)
U N I V E R S I TAT I S O U L U E N S I SACTAC
TECHNICA
U N I V E R S I TAT I S O U L U E N S I SACTAC
TECHNICA
OULU 2016
C 580
Elisangela Heiderscheidt
EVALUATION AND OPTIMISATION OF CHEMICAL TREATMENTFOR NON-POINT SOURCE POLLUTION CONTROLPURIFICATION OF PEAT EXTRACTION RUNOFF WATER
UNIVERSITY OF OULU GRADUATE SCHOOL;UNIVERSITY OF OULU,FACULTY OF TECHNOLOGY
C 580
ACTA
Elisangela Heiderscheidt
C580etukansi.kesken.fm Page 1 Wednesday, August 17, 2016 2:31 PM


![Research Article EVALUATION OF ANTI-INFLAMMATORY … · Percentage inhibition= [(absorbance of blank – absorbance of sample)/(absorbance of blank)]×100 1 In-vitro anti-inflammatory](https://static.fdocuments.us/doc/165x107/5e832a1607bd17145979ab05/research-article-evaluation-of-anti-inflammatory-percentage-inhibition-absorbance.jpg)