
Original Article - KoreaMed Synapse · 2015-08-11 · If governments or health insurance entities...
7
I. Introduction If governments or health insurance entities could monitor daily healthcare utilization or outbreaks of infectious dis- eases at the national level in real time, this would provide a great opportunity to manage healthcare and those diseases [1]. Healthcare policy makers and the managers of insurance companies could predict the best way of effectively manag- ing serious diseases by monitoring healthcare utilization and diseases. For an example, the Republic of Korea (ROK) recently ex- perienced an outbreak of Middle East Respiratory Syndrome (MERS) [2]. It was very difficult to identify the number of Healthcare Utilization Monitoring System in Korea Hyun Chul Shin, PhD 1 , Young-Taek Park, PhD 1 , Youn Tae Lee, PhD 1 , Emmanuel C. Jo, BSc 2 1 Research Institute for Health Insurance Review & Assessment, Health Insurance Review & Assessment Service (HIRA), Seoul, Korea; 2 Ministry of Health, Wel- lington, New Zealand Objectives: It is important to monitor the healthcare utilization of patients at the national level to make evidence-based pol- icy decisions and manage the nation’s healthcare sector. e Health Insurance Review & Assessment Service (HIRA) has run a Healthcare Utilization Monitoring System (HUMS) since 2008. e objective of this paper is to introduce HIRA’s HUMS. Methods: This study described the HUMS’s system structure, capacity, functionalities, and output formats run by HIRA in the Republic of Korea. Regarding output formats, this study extracted diabetes related health insurance claims through the HUMS from August 1, 2014 to May 31, 2015. Results: e HUMS has kept records of health insurance claim data for 4 years. It has a 14-terabyte hardware capacity and employs several easy-to-use programs for maintenance of the system, such as MSTR, SAS, etc. Regarding functionalities, users should input diseases codes, target periods, facility types, and types of attributes, such as the number of healthcare utilizations or healthcare costs. It also has a functionality to predict healthcare utilization and costs. When this study extracted diabetes related data, it was found that the trend of healthcare costs for the treatment of diabetes and the number of patients with diabetes were increasing. Conclusions: HIRA’s HUMS works well to monitor healthcare utilization of patients at the national level. e HUMS has a high-capacity hardware infrastructure and several operational programs that allows easy access to summaries as well as details to identify contributing factors for abnor- mality, but it has a limitation in that there is oſten a time lag between the provision of healthcare to patients and the filing of health claims. Keywords: Health Care Costs, Health Services Research, Informatics, Medical Informatics Healthc Inform Res. 2015 July;21(3):184-190. http://dx.doi.org/10.4258/hir.2015.21.3.184 pISSN 2093-3681 • eISSN 2093-369X Original Article Submitted: June 14, 2015 Revised: June 28, 2015 Accepted: June 30, 2015 Corresponding Author Young-Taek Park, PhD Research Institute for Health Insurance Review & Assessment, Health Insurance Review & Assessment Service (HIRA), 22 Banpo- daero, Seocho-gu, Seoul 137-927, Korea. Tel: +82-2-2182-2522, Fax: +82-2-6710-5834, E-mail: [email protected] This is an Open Access article distributed under the terms of the Creative Com- mons Attribution Non-Commercial License (http://creativecommons.org/licenses/by- nc/4.0/) which permits unrestricted non-commercial use, distribution, and reproduc- tion in any medium, provided the original work is properly cited. ⓒ 2015 The Korean Society of Medical Informatics
Transcript of Original Article - KoreaMed Synapse · 2015-08-11 · If governments or health insurance entities...

I. Introduction
If governments or health insurance entities could monitor daily healthcare utilization or outbreaks of infectious dis-eases at the national level in real time, this would provide a great opportunity to manage healthcare and those diseases [1]. Healthcare policy makers and the managers of insurance companies could predict the best way of effectively manag-ing serious diseases by monitoring healthcare utilization and diseases. For an example, the Republic of Korea (ROK) recently ex-perienced an outbreak of Middle East Respiratory Syndrome (MERS) [2]. It was very difficult to identify the number of
Healthcare Utilization Monitoring System in Korea Hyun Chul Shin, PhD1, Young-Taek Park, PhD1, Youn Tae Lee, PhD1, Emmanuel C. Jo, BSc2 1Research Institute for Health Insurance Review & Assessment, Health Insurance Review & Assessment Service (HIRA), Seoul, Korea; 2Ministry of Health, Wel-lington, New Zealand
Objectives: It is important to monitor the healthcare utilization of patients at the national level to make evidence-based pol-icy decisions and manage the nation’s healthcare sector. The Health Insurance Review & Assessment Service (HIRA) has run a Healthcare Utilization Monitoring System (HUMS) since 2008. The objective of this paper is to introduce HIRA’s HUMS. Methods: This study described the HUMS’s system structure, capacity, functionalities, and output formats run by HIRA in the Republic of Korea. Regarding output formats, this study extracted diabetes related health insurance claims through the HUMS from August 1, 2014 to May 31, 2015. Results: The HUMS has kept records of health insurance claim data for 4 years. It has a 14-terabyte hardware capacity and employs several easy-to-use programs for maintenance of the system, such as MSTR, SAS, etc. Regarding functionalities, users should input diseases codes, target periods, facility types, and types of attributes, such as the number of healthcare utilizations or healthcare costs. It also has a functionality to predict healthcare utilization and costs. When this study extracted diabetes related data, it was found that the trend of healthcare costs for the treatment of diabetes and the number of patients with diabetes were increasing. Conclusions: HIRA’s HUMS works well to monitor healthcare utilization of patients at the national level. The HUMS has a high-capacity hardware infrastructure and several operational programs that allows easy access to summaries as well as details to identify contributing factors for abnor-mality, but it has a limitation in that there is often a time lag between the provision of healthcare to patients and the filing of health claims.
Keywords: Health Care Costs, Health Services Research, Informatics, Medical Informatics
Healthc Inform Res. 2015 July;21(3):184-190. http://dx.doi.org/10.4258/hir.2015.21.3.184pISSN 2093-3681 • eISSN 2093-369X
Original Article
Submitted: June 14, 2015Revised: June 28, 2015Accepted: June 30, 2015
Corresponding Author Young-Taek Park, PhDResearch Institute for Health Insurance Review & Assessment, Health Insurance Review & Assessment Service (HIRA), 22 Banpo-daero, Seocho-gu, Seoul 137-927, Korea. Tel: +82-2-2182-2522, Fax: +82-2-6710-5834, E-mail: [email protected]
This is an Open Access article distributed under the terms of the Creative Com-mons Attribution Non-Commercial License (http://creativecommons.org/licenses/by-nc/4.0/) which permits unrestricted non-commercial use, distribution, and reproduc-tion in any medium, provided the original work is properly cited.
ⓒ 2015 The Korean Society of Medical Informatics
185Vol. 21 • No. 3 • July 2015 www.e-hir.org
Healthcare Utilization Monitoring System
MERS-infected patients and the infection pathway of the disease at the national level. If the government has a system that could have monitored the occurrence of MERS, the gov-ernment could have more effectively managed the situation and prevented secondary infections. Thus, it is important to construct systems to monitor healthcare utilization and the occurrence of diseases on a daily basis at the national level. The Health Insurance Review & Assessment Service (HIRA) has a similar system with limited functionalities. The HIRA is a governmental agency that provides professional health insurance claims review and quality assessment services, and it makes benefit guidelines for the national health insurance program in the ROK [3]. For these tasks, the HIRA collects national health insurance claims from all healthcare orga-nizations, including hospitals, local clinics, and community pharmacies. In the reimbursement process in the ROK, a healthcare organization must send their bills for healthcare treatment to the HIRA to get reimbursement from the Na-tional Health Insurance Corporation (NHIC). Using this claims data, the HIRA developed a system involving func-tionalities of monitoring healthcare utilization. There was a dramatic increase in surgical operations re-garding urinary incontinence (UI) in 2007 in the ROK. Al-though HIRA collected all the health insurance claims in the ROK, the increase was not noticed by the HIRA until several months later. The HIRA realized that there was a dramatic increase in UI surgery through several field inspections of the medical providers [4]. The reason behind it was that there was discrepancy between payment from private health insurance companies and the new coverage expansion of the National Health Insurance (NHI) program as the NHI program was much less than the payment made by private health insurance companies. Many people who had private insurance policies that covered UI received medical care
that included UI surgery. This episode enabled the HIRA to realize the necessity of a monitoring system for healthcare utilization of people for systematic maintenance of the NHI system in the ROK. The HIRA has run the Healthcare Utilization Monitor-ing System (HUMS) since 2008. The HUMS has a simple structure that quickly uploads users’ requests regarding specific diseases. Many governmental agencies and insur-ance companies in other countries may have similar systems. However, those systems are mainly related to drugs, alcohol, and narcotics [5-8]. Moreover, there have been few studies exploring healthcare utilization monitoring systems, how they work, and what specific functionalities they have. The objective of this paper is to introduce HIRA’s HUMS focusing on the system capacity, structure, and functionality, and output results. This study will provide an opportunity to share benchmarking ideas for the monitoring of health-care utilization at the national level with funding by other international agencies or the direct provision of healthcare services.
II. Methods
To introduce the HUMS, the method section will describe the system capacity, structure, and functionality of HUMS. As an example, we placed a data request regarding healthcare utilization related to diabetes from June 1 to December 31, 2014, and the output format is shown in the results section.
1. Introduction of a Healthcare Utilization Monitoring System in Korea
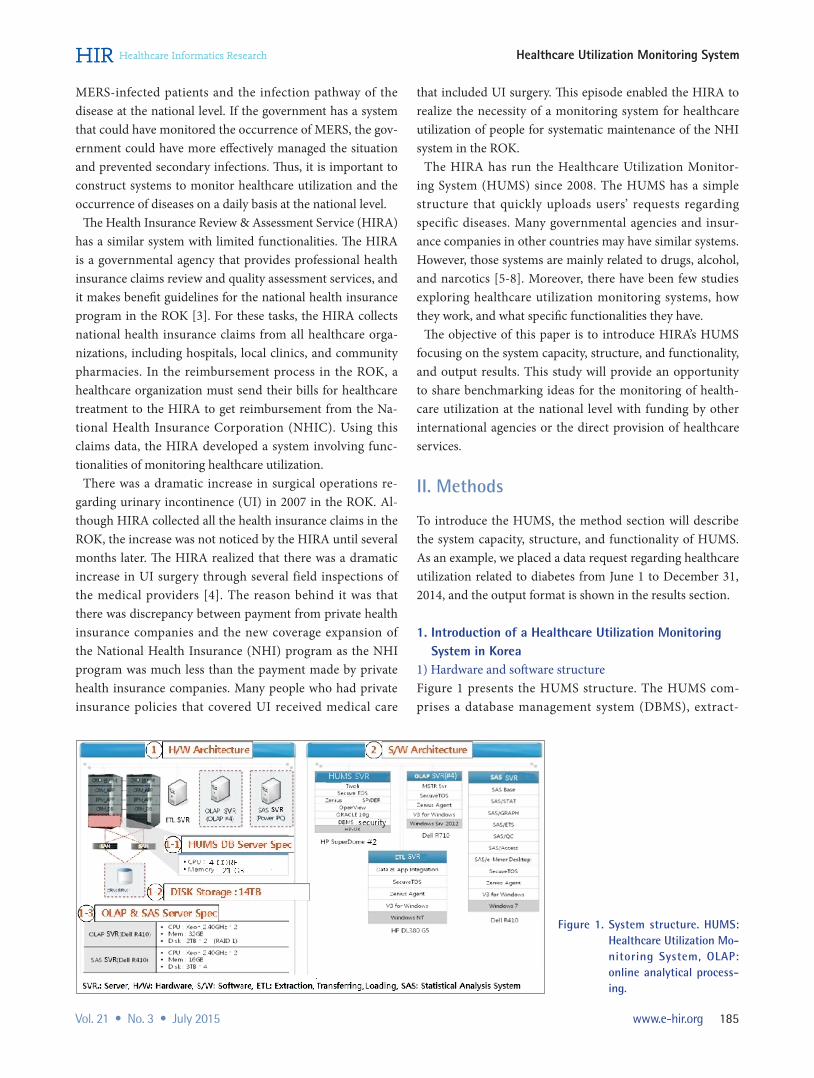
1) Hardware and software structure Figure 1 presents the HUMS structure. The HUMS com-prises a database management system (DBMS), extract-
Figure 1. System structure. HUMS: Healthcare Utilization Mo-ni toring System, OLAP: online analytical process-ing.

186 www.e-hir.org
Hyun Chul Shin et al
http://dx.doi.org/10.4258/hir.2015.21.3.184
transfer-load (ETL), and online analytical processing (OLAP) severs. Each server has Oracle, the Pentaho Spoon ETL tool, MicroStrategy software, and SAS software for statisti-cal analysis. The DBMS of the HUMS is operated on an HP-UX operating system, and the other servers use Window NT and Window 7. One features of the HUMS is that it has an independently operated SAS server. The HUMS has servers for data mining to detect abnormal signs of healthcare utili-zation and to produce utilization predictions. Data produced through this process are stored at the DBMS server. The HUMS has been redesigned since 2013. Raw data loading and data loading for data mining take two days and at least five days, respectively.
2) Information flow and data structureThe HUMS is a mini data warehouse (DW) system. Original data comes from the claim review support system [3] and the main DW system has all of the healthcare claims data reviewed and healthcare organization information. Those data are transferred to the HUMS DB server through the ETL server using ETL tools, such as extracting, transferring, and loading procedures. There are two types of data areas in the HUMS: specific detailed data and summary data. The detailed data area has application data, bills, the contents of care services, pharmacy prescription contents, and so on. The summary data area has a unified data analysis, showing increase trends such as unusual rapid increases in specific diseases or rates of utilization of a specific type of healthcare and so on. Users can extract data using a power PC and OLAP server (Figure 2).
3) Data storage structureThe HUMS has 14 terabyte data storage space. It includes storage space for ETL process, storage for producing data after data mining, and final data storage after ETL and data mining. The HUMS can now pile up the volume of data for a four-year of health insurance claims reviewed and assessed and it will be upgraded to the volume of data for a five-year period. For this, the storage size of the HUMS will increase to 30 terabyte data storage space
4) Main search screenFigure 3 shows the main search screen of the HUMS. The system does not provide English version. Language format in the Figure 3 was graphically modified from Korean to Eng-lish for the convenience of the readers. The HUMS monitors healthcare utilization and the volume of healthcare costs by diseases (ICD-10), types of services (e.g., diagnosis, lab test, long-term care, etc.), types of drugs, medical supply materi-als in order to detect abnormal signs of healthcare utiliza-tion. These data are produced through data mining process. The five types of the data mining models are applied in order to detect whether there is any abnormal signs of health care utilization. In addition, the HUMS uses a filtering process in order to produce two indices which are the percentage increase oscillator (PIO) and the relative strength index (RSI) values showing items that are out of specific data ranges. Items showing abnormal signs of health care utilization can be produced by the type of health care services such as the medical care, the dental care, the oriental medicine, and the pharmacies. Figure 3 is an example for health care costs with more than KRW 100,000,000 (approximately US$100,000)
Figure 2. Network structure. HUMS: Healthcare Utilization Mo-ni toring System, OLAP: online analytical process-ing.

187Vol. 21 • No. 3 • July 2015 www.e-hir.org
Healthcare Utilization Monitoring System
and filters them with PIO (≥20) and RSI (≥70) in order to detect abnormal sign of healthcare utilization.
2. Data Collection MethodsThis study analyzed the health insurance claim data submit-ted to HIRA between August 1, 2014 and May 31, 2015. Data was for monitoring abnormal signs of the healthcare utilization, which was processed through data mining, for the statistical analysis. This study pulled out monthly health-care costs, recent trends of hospital days, and prediction for the next one-year period based on these data. These data are shown by the three-digit (ICD-10) disease diagnosis codes, services types (inpatient/outpatient), type of healthcare facil-ities such as tertiary hospitals, clinics, local area, age groups, and medical specialties. In addition, the monthly data are presented by diseases, type of services, pharmacies, medi-cal supply materials in order to detect abnormal signs of the healthcare utilization.
III. Results
1. Main Screen of HUMSFigure 4 shows the main screen of the HUMS when users log into the system. The screen is composed of four sections. The first section is the current status on health insurance claims shown as daily and monthly amount of healthcare costs and the number of claims. This section provides useful information for the directors and the managers of the HIRA to make decisions on the health insurance claims reviews and the overall health insurance budgets. The second sec-tion shows information on the total amount of healthcare costs and the proportion of healthcare costs assumed by the insurer (NHIC). This section helps decision-makers to figure out whether there are enough funds available compared to the total budget. The third section shows the cumulative amount of health-care costs and its proportion by healthcare facility and ser-
Figure 3. Main search screen format of Healthcare Utilization Monitoring System (HUMS).
Figure 4. A main screen of Health-care Utilization Monitor-ing System (HUMS).
188 www.e-hir.org
Hyun Chul Shin et al
http://dx.doi.org/10.4258/hir.2015.21.3.184
vices (inpatient/outpatient) types. The last section presents the healthcare costs associated with several important gov-ernmental initiatives. This is shown monthly for one year. These sections provide important information to healthcare policy makers in making decisions regarding which govern-mental healthcare project developments or system opera-tions require attention.
2. Screen for Healthcare Costs Trend by a Three-Digit Disease Code
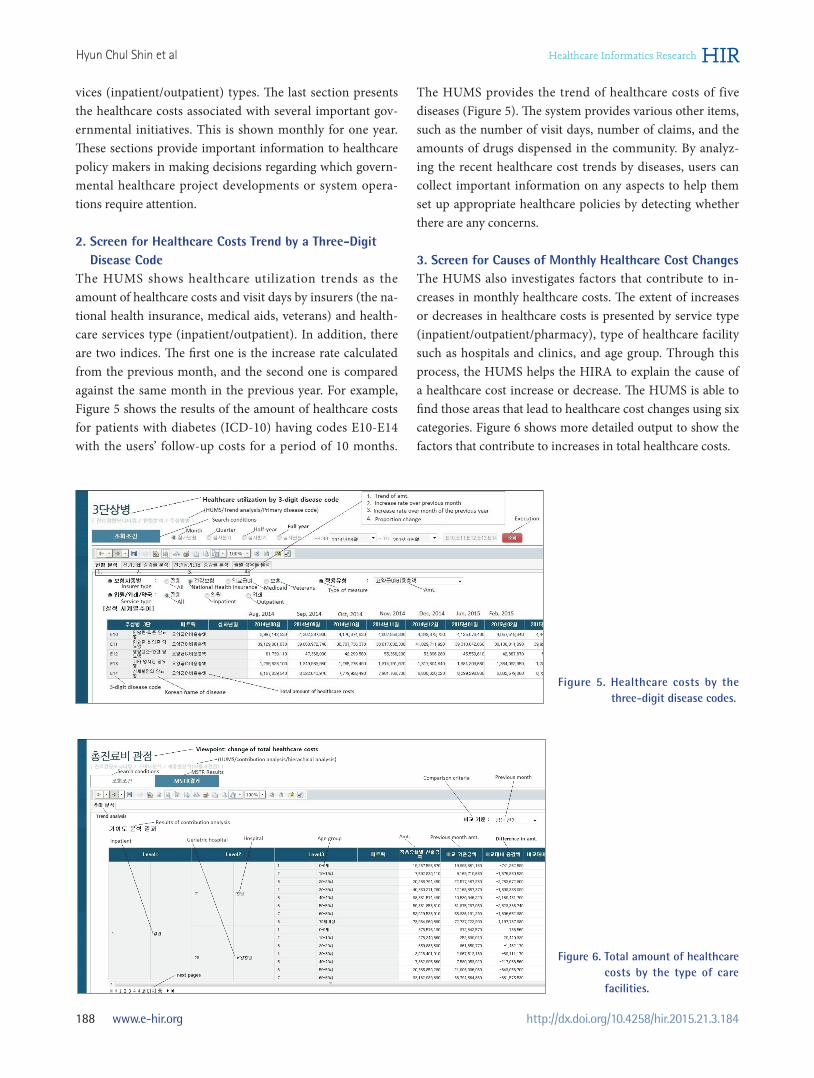
The HUMS shows healthcare utilization trends as the amount of healthcare costs and visit days by insurers (the na-tional health insurance, medical aids, veterans) and health-care services type (inpatient/outpatient). In addition, there are two indices. The first one is the increase rate calculated from the previous month, and the second one is compared against the same month in the previous year. For example, Figure 5 shows the results of the amount of healthcare costs for patients with diabetes (ICD-10) having codes E10-E14 with the users’ follow-up costs for a period of 10 months.
The HUMS provides the trend of healthcare costs of five diseases (Figure 5). The system provides various other items, such as the number of visit days, number of claims, and the amounts of drugs dispensed in the community. By analyz-ing the recent healthcare cost trends by diseases, users can collect important information on any aspects to help them set up appropriate healthcare policies by detecting whether there are any concerns.
3. Screen for Causes of Monthly Healthcare Cost ChangesThe HUMS also investigates factors that contribute to in-creases in monthly healthcare costs. The extent of increases or decreases in healthcare costs is presented by service type (inpatient/outpatient/pharmacy), type of healthcare facility such as hospitals and clinics, and age group. Through this process, the HUMS helps the HIRA to explain the cause of a healthcare cost increase or decrease. The HUMS is able to find those areas that lead to healthcare cost changes using six categories. Figure 6 shows more detailed output to show the factors that contribute to increases in total healthcare costs.
Figure 5. Healthcare costs by the three-digit disease codes.
Figure 6. Total amount of healthcare costs by the type of care facilities.

189Vol. 21 • No. 3 • July 2015 www.e-hir.org
Healthcare Utilization Monitoring System
4. Computer Screen for Detecting Abnormal Sign of Healthcare Utilization
Figure 7 shows the output results ordered by users request-ing abnormal healthcare utilization data. The HUMS shows the results by disease, type of services (e.g., diagnosis, lab test, long-term care, etc.), pharmacies, and medical supplies and materials in order to detect abnormalities. Among those cases, the HUMS shows the results after processing the five data mining models. For an example, cases having the disease code (ICD-10) T80 showed sign of abnormal healthcare utilization when this study requested the cases by disease submitted in May. If users click this disease code, the screen shows monthly data and trends so that users can easily understand the trends of healthcare utilization of this disease. Users of the HUMS can verify whether there has been any increase in healthcare costs per claim with this disease code in May through fur-ther analysis of the main DW system.
5. Limitations of the SystemOne of limitations of the system is that there is time lag between actualization of data into the system and actual oc-currence of healthcare services. The reason is that medical providers usually file health insurance claims into the HIRA’s system one or two months after the actual provision of healthcare. Therefore, the HUMS is not a real-time system, even though it appears to be real-time. Another limitation is that the databases of the HUMS are composed of many tables to enable fast data loading, which is called structured data. If users want to see more detailed results or other infor-mation, they have to run a separate analysis from the main DW system. Lastly, as mentioned in the previous section, the HUMS is composed of various server systems, which inevitably makes the system more complex and difficult to maintain. These three factors are the main limitations of the HUMS.
IV. Discussion
This paper introduced the HUMS of the HIRA, which was developed for monitoring abnormal healthcare utilization of the national health insurance system by the general popu-lation based on health insurance claims data. This paper presented the system’s hardware capacity, diverse structure, functionalities, and output format. Additionally, this paper looked at several fundamental limitations of the HUMS. This study found that the HUMS has a 14 terabyte hardware storage capacity with various statistical tools, such as SAS, MSTR, OLAP. The monitoring of abnormal healthcare utili-zation is based on health insurance claim data. The system is well spread out over the past history of healthcare utilizations and provides future predictions based on past history and data mining approaches. However, users should input the contents of categories that they want to investigate through the system. Although the system was designed to monitor the abnormal utilization of healthcare, the actualization of the data set was based on the past history of healthcare, and there is a time lag of 2 to 3 months because hospitals and clinics tend to file health insurance claims a little late. One limitation of this investigation was that we only ob-served the system, and we simply introduced the functional-ity of the HUMS. There was no testing of the system capacity of operation, measurement of the uploading results requested by users, or a time-motion study. Secondly, this research did not consider similar systems that are used in other countries. However, it is expected that there will be many social con-nections among various systems for the healthcare utilization monitoring of healthcare organizations in the near future. Based on this study, several suggestions can be made to improve the monitoring system. First, it is necessary for the HIRA to develop a healthcare utilization monitoring system for the national level. This system should have real-time func-tionality. The current system is based on the review of health
Figure 7. Output results of total healthcare monitoring screen of Healthcare Utilization Monitoring System (HUMS).

190 www.e-hir.org
Hyun Chul Shin et al
http://dx.doi.org/10.4258/hir.2015.21.3.184
insurance claims data, so there is some lag-time between the actual provision of healthcare and the results being available for monitoring by the HUMS. Therefore, a new system should be structured like the HIRA’s drug utilization review (DUR) system, which provides possibilities of contraindication of drugs for drug-drug interaction, drug-age interaction, etc. Whenever medical doctors and pharmacists want to check whether there is any possibility of contraindication when they prescribe or dispense drugs to patients, they can obtain confirmation through the HIRA’s DUR system by connecting the system. This can be used in a real-time manner. When medical doctors complete their treatment for patients, some important information, such as the patients’ identification and disease codes should be able to be transferred to HIRA’s new data system specializing in healthcare utilization moni-toring. Through such a system, the HIRA would be able to monitor healthcare utilization at the national level. This kind of system could certainly help the government make timely decisions to stop contagion outbreaks, such as the recent spread of MERS, and prevent secondary infections. In conclusion, the HUMS has a user-friendly interface to quickly analyze large-scale health utilization for monitor-ing and supporting decision-making processes. This is a good example of linking health information with informa-tion technology [9]. If we use human resources to manually identify the abnormal utilization of healthcare services at the national level, it could be impossible to deliver due to the manual process involving billions of claims containing various patients’ information. To improve the managerial ef-ficiency of analysis, we have to use information technologies in the health sector as well [10,11]. This study has empiri-cally shown how the HIRA uses information technology, namely, the HUMS, to monitor and identify healthcare utilization showing abnormal healthcare. This introduc-tion of the HUMS will provide some opportunities to share benchmarking ideas regarding the use of information tech-nologies with other international communities in the health informatics field.
Conflict of Interest
No potential conflict of interest relevant to this article was reported.
References
1. Milinovich GJ, Williams GM, Clements AC, Hu W. Internet-based surveillance systems for monitoring emerging infectious diseases. Lancet Infect Dis 2014; 14(2):160-8.
2. Gale A, Jun K. Korea’s MERS outbreak highlights SARS lessons [Internet]. New York (NY): The Wall Street Jour-nal; 2015 [cited at 2015 Jul 15]. Available from: http://www.wsj.com/articles/mers-outbreak-lax-quarantines-hurt-south-korea-1433832955.
3. Park YT, Yoon JS, Speedie SM, Yoon H, Lee J. Health insurance claim review using information technologies. Healthc Inform Res 2012;18(3):215-24.
4. Shin HC. Healthcare utilization monitoring system: user guidance manual. Seoul, Korea: Health Insurance Re-view & Assessment Service; 2015.
5. Rotondi NK, Rush B. Monitoring utilization of a large scale addiction treatment system: the Drug and Alcohol Treatment Information System (DATIS). Subst Abuse 2012;6:73-84.
6. Coloma PM, Schuemie MJ, Trifiro G, Gini R, Herings R, Hippisley-Cox J, et al. Combining electronic healthcare databases in Europe to allow for large-scale drug safety monitoring: the EU-ADR Project. Pharmacoepidemiol Drug Saf 2011;20(1):1-11.
7. Ontario Ministry of Health and Long-Term Care. Nar-cotics Monitoring System (NMS): pharmacy reference manual. Toronto, Canada: Ontario Ministry of Health and Long-Term Care; 2012.
8. Clark T, Eadie J, Kreiner P, Strickler G. Prescription drug monitoring programs: an assessment of the evi-dence for best practice [Internet]. Philadelphia (PA): The Pew Charitable Trusts; 2012 [cited at 2015 Jul 15]. Available from: http://www.pewtrusts.org/~/media/As-sets/0001/PDMP_Update_1312013.pdf.
9. Ortiz E, Clancy CM; AHRQ. Use of information tech-nology to improve the quality of health care in the United States. Health Serv Res 2003;38(2):xi-xxii.
10. Park YT. HIRA’s health insurance claim data and use of information and communication technology. HIRA Policy Trends 2013;7(6):42-51.
11. Buntin MB, Burke MF, Hoaglin MC, Blumenthal D. The benefits of health information technology: a review of the recent literature shows predominantly positive re-sults. Health Aff (Millwood) 2011;30(3):464-71.


![ORIGINAL aaps ARTICLE - KoreaMed Synapse€¦ · · 2014-07-16ORIGINAL ARTICLE ... poor functional or aesthetic outcomes and are the major short comings of this procedure [2]. ...](https://static.fdocuments.us/doc/165x107/5ac82f557f8b9a6b578bdb8f/original-aaps-article-koreamed-synapse-2014-07-16original-article-poor-functional.jpg)


