Introduction - KoreaMed Synapse · 2016-06-15 · epigenetically altered signaling pathway of this...
9
TCP 96 Transl Clin Pharmacol Vol. 24, No.2, Jun 15, 2016 http://dx.doi.org/10.12793/tcp.2016.24.2.96 2016;24(2):96-104 Population pharmacokinetics of imatinib mesylate in healthy Korean subjects Gab-jin Park 1,2 , Wan-Su Park 2 , Soohyun Bae 2 , Sung-min Park 2 , Seunghoon Han 1,2 and Dong-Seok Yim 1,2 * 1 Department of Clinical Pharmacology and erapeutics, Seoul St. Mary’s Hospital, 2 PIPET (Pharmacometrics Institute for Practical Education and Training), College of Medicine, e Catholic University of Korea, Seoul 06591, Korea *Correspondence: D. S. Yim; Tel: +82-2-2258-7327, Fax: +82-2-2258-7876, E-mail: [email protected] Imatinib (Gleevec TM ; Novartis Pharmaceuticals) is an orally administered protein-tyrosine kinase in- hibitor. e goal of this study was to investigate the population pharmacokinetics (PK) of imatinib (as imatinib mesylate) in healthy male Koreans. A total of 1,773 plasma samples from 112 healthy male volunteers enrolled in three phase I clinical studies were used. Among the subjects, 76 received 400 mg and 36 received 100 mg as single oral doses. Peripheral blood sampling for PK analysis was done at 0, 0.5, 1, 1.5, 2, 2.5, 3, 3.5, 4, 6, 8, 12, 24, 48, 60 and 72 (at 400 mg group) h aſter dosing. e first- order conditional estimation with interaction method of NONMEM® (ver. 7.3) was used to build the population PK model. A two-compartment model with Weibull absorption and elimination gave the best fit to the data. e estimates of clearance (CL/F), volume of central compartment (Vc/F), inter- compartmental clearance (Q/F), peripheral volume (Vp/F) and their interindividual variabily (%CV) were 13.6 L/h (23.4%), 153 L (29.2%), 8.64 L/h (35.9%) and 64 L (67%), respectively. Introduction Targeted therapies have expanded therapeutic options against cancer with less toxicity. There are multiple types of targeted therapies available, including monoclonal antibodies, antisense inhibitors of growth factor receptors and inhibitors of tyrosine kinase.[1] Tyrosine kinases are pivotal mediators of signal trans- duction process leading to cell proliferation, differentiation, mi- gration, metabolism and programmed cell death. Genetically or epigenetically altered signaling pathway of this enzyme brought to effect in several steps of neoplastic development and progres- sion.[2] Tyrosine kinases well-defined as anticancer drug targets include BCR-ABL tyrosine kinase,[3] c-KIT tyrosine kinase,[4] PDGFR kinase for imatinib, EGFR tyrosine kinase[5] for gefi- tinib, erlotinib, FLT-3kinase[6] for sunitinib and B-Raf kinase[7] for sorafenib. Imatinib (Gleevec TM ) is a highly selective inhibitor of BCR-ABL oncogene, and also platelet-derived growth factor receptors, and c-KIT receptor tyrosine kinase.[8, 9] It was first approved for the treatment of Philadelphia chomosome-positive chonic myelogenous leukemia (CML) and, shortly thereafter, for c-KIT-positive metastatic and unresectable gastrointestinal stromal tumor.[10,11] It competitively inhibits the ATP binding of the enzyme, thereby restricting the phosphorylation of pro- tein substrates involved in signal transduction and consequent CML cell growth.[12] Other cancers known to be responsive to imatinib are mast-cell tumors, neuroblastoma, germ-cell tumors, melanoma, small-cell lung cancer, breast and ovarian cancers, and AML.[4] It has been reported that imatinib pharmacokinetics (PK) fol- lows a one-compartment model with first-order absorption and elimination.[13,14] On the other hand, Schmidli et al have reported that its absorption is best described by a zero-order ab- sorption model.[15] Because nothing is reported on the popula- tion PK of imatinib in Korean subjects we aimed to explore the population PK using PK data in healthy male Koreans. Methods Study design and data Data from 112 healthy male subjects, providing 1,773 blood samples in three different clinical trials, were merged for popu- lation PK analysis. e three comparative PK (reference versus test formulation) studies with open-labelled, randomized, 2×2 crossover design were conducted at the clinical trial center of Seoul St. Mary's hospital. Imatinib was administered orally at a single dose of 100 mg for 36 subjects in one study and 400 mg Copyright © 2016 Translational and Clinical Pharmacology It is identical to the Creative Commons Attribution Non-Commercial License (http://creativecommons.org/licenses/by-nc/3.0/). This paper meets the requirement of KS X ISO 9706, ISO 9706-1994 and ANSI/NISO Z.39.48-1992 (Permanence of Paper). Received 18 May 2016 Revised 30 May 2016 Accepted 31 May 2016 Keywords Imatinib, population pharmacokinetics, NONMEM, Weibull pISSN: 2289-0882 eISSN: 2383-5427 ORIGINAL ARTICLE
Transcript of Introduction - KoreaMed Synapse · 2016-06-15 · epigenetically altered signaling pathway of this...

TCP
96
Transl Clin Pharmacol
Vol. 24, No.2, Jun 15, 2016
http://dx.doi.org/10.12793/tcp.2016.24.2.96
2016;24(2):96-104
Population pharmacokinetics of imatinib mesylate in healthy Korean subjectsGab-jin Park1,2, Wan-Su Park2, Soohyun Bae2, Sung-min Park2, Seunghoon Han1,2 and Dong-Seok Yim1,2* 1Department of Clinical Pharmacology and Therapeutics, Seoul St. Mary’s Hospital, 2PIPET (Pharmacometrics Institute for Practical Education and Training), College of Medicine, The Catholic University of Korea, Seoul 06591, Korea*Correspondence: D. S. Yim; Tel: +82-2-2258-7327, Fax: +82-2-2258-7876, E-mail: [email protected]
Imatinib (GleevecTM; Novartis Pharmaceuticals) is an orally administered protein-tyrosine kinase in-hibitor. The goal of this study was to investigate the population pharmacokinetics (PK) of imatinib (as imatinib mesylate) in healthy male Koreans. A total of 1,773 plasma samples from 112 healthy male volunteers enrolled in three phase I clinical studies were used. Among the subjects, 76 received 400 mg and 36 received 100 mg as single oral doses. Peripheral blood sampling for PK analysis was done at 0, 0.5, 1, 1.5, 2, 2.5, 3, 3.5, 4, 6, 8, 12, 24, 48, 60 and 72 (at 400 mg group) h after dosing. The first-order conditional estimation with interaction method of NONMEM® (ver. 7.3) was used to build the population PK model. A two-compartment model with Weibull absorption and elimination gave the best fit to the data. The estimates of clearance (CL/F), volume of central compartment (Vc/F), inter-compartmental clearance (Q/F), peripheral volume (Vp/F) and their interindividual variabily (%CV) were 13.6 L/h (23.4%), 153 L (29.2%), 8.64 L/h (35.9%) and 64 L (67%), respectively.
Introduction Targeted therapies have expanded therapeutic options against cancer with less toxicity. There are multiple types of targeted therapies available, including monoclonal antibodies, antisense inhibitors of growth factor receptors and inhibitors of tyrosine kinase.[1] Tyrosine kinases are pivotal mediators of signal trans-duction process leading to cell proliferation, differentiation, mi-gration, metabolism and programmed cell death. Genetically or epigenetically altered signaling pathway of this enzyme brought to effect in several steps of neoplastic development and progres-sion.[2] Tyrosine kinases well-defined as anticancer drug targets include BCR-ABL tyrosine kinase,[3] c-KIT tyrosine kinase,[4] PDGFR kinase for imatinib, EGFR tyrosine kinase[5] for gefi-tinib, erlotinib, FLT-3kinase[6] for sunitinib and B-Raf kinase[7] for sorafenib. Imatinib (GleevecTM) is a highly selective inhibitor of BCR-ABL oncogene, and also platelet-derived growth factor receptors, and c-KIT receptor tyrosine kinase.[8, 9] It was first approved for the treatment of Philadelphia chomosome-positive chonic myelogenous leukemia (CML) and, shortly thereafter, for c-KIT-positive metastatic and unresectable gastrointestinal
stromal tumor.[10,11] It competitively inhibits the ATP binding of the enzyme, thereby restricting the phosphorylation of pro-tein substrates involved in signal transduction and consequent CML cell growth.[12] Other cancers known to be responsive to imatinib are mast-cell tumors, neuroblastoma, germ-cell tumors, melanoma, small-cell lung cancer, breast and ovarian cancers, and AML.[4] It has been reported that imatinib pharmacokinetics (PK) fol-lows a one-compartment model with first-order absorption and elimination.[13,14] On the other hand, Schmidli et al have reported that its absorption is best described by a zero-order ab-sorption model.[15] Because nothing is reported on the popula-tion PK of imatinib in Korean subjects we aimed to explore the population PK using PK data in healthy male Koreans.
Methods
Study design and data Data from 112 healthy male subjects, providing 1,773 blood samples in three different clinical trials, were merged for popu-lation PK analysis. The three comparative PK (reference versus test formulation) studies with open-labelled, randomized, 2×2 crossover design were conducted at the clinical trial center of Seoul St. Mary's hospital. Imatinib was administered orally at a single dose of 100 mg for 36 subjects in one study and 400 mg
Copyright © 2016 Translational and Clinical Pharmacology It is identical to the Creative Commons Attribution Non-Commercial License
(http://creativecommons.org/licenses/by-nc/3.0/). This paper meets the requirement of KS X ISO 9706, ISO 9706-1994 and
ANSI/NISO Z.39.48-1992 (Permanence of Paper).
Received 18 May 2016
Revised 30 May 2016
Accepted 31 May 2016
KeywordsImatinib,
population pharmacokinetics,
NONMEM,
Weibull
pISSN: 2289-0882
eISSN: 2383-5427
OR
IGIN
AL A
RTICLE
Vol. 24, No.2, Jun 15, 201697
TCP Transl Clin Pharmacol
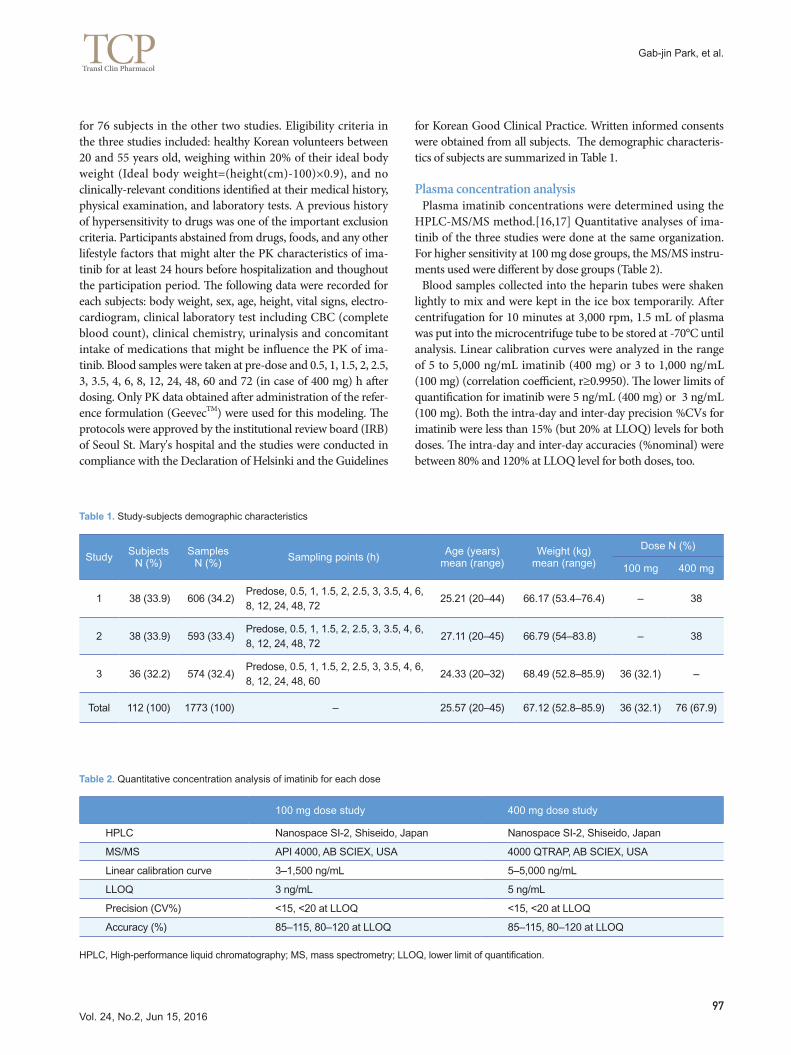
for 76 subjects in the other two studies. Eligibility criteria in the three studies included: healthy Korean volunteers between 20 and 55 years old, weighing within 20% of their ideal body weight (Ideal body weight=(height(cm)-100)×0.9), and no clinically-relevant conditions identified at their medical history, physical examination, and laboratory tests. A previous history of hypersensitivity to drugs was one of the important exclusion criteria. Participants abstained from drugs, foods, and any other lifestyle factors that might alter the PK characteristics of ima-tinib for at least 24 hours before hospitalization and thoughout the participation period. The following data were recorded for each subjects: body weight, sex, age, height, vital signs, electro-cardiogram, clinical laboratory test including CBC (complete blood count), clinical chemistry, urinalysis and concomitant intake of medications that might be influence the PK of ima-tinib. Blood samples were taken at pre-dose and 0.5, 1, 1.5, 2, 2.5, 3, 3.5, 4, 6, 8, 12, 24, 48, 60 and 72 (in case of 400 mg) h after dosing. Only PK data obtained after administration of the refer-ence formulation (GeevecTM) were used for this modeling. The protocols were approved by the institutional review board (IRB) of Seoul St. Mary's hospital and the studies were conducted in compliance with the Declaration of Helsinki and the Guidelines
for Korean Good Clinical Practice. Written informed consents were obtained from all subjects. The demographic characteris-tics of subjects are summarized in Table 1.
Plasma concentration analysis Plasma imatinib concentrations were determined using the HPLC-MS/MS method.[16,17] Quantitative analyses of ima-tinib of the three studies were done at the same organization. For higher sensitivity at 100 mg dose groups, the MS/MS instru-ments used were different by dose groups (Table 2). Blood samples collected into the heparin tubes were shaken lightly to mix and were kept in the ice box temporarily. After centrifugation for 10 minutes at 3,000 rpm, 1.5 mL of plasma was put into the microcentrifuge tube to be stored at -70°C until analysis. Linear calibration curves were analyzed in the range of 5 to 5,000 ng/mL imatinib (400 mg) or 3 to 1,000 ng/mL (100 mg) (correlation coefficient, r≥0.9950). The lower limits of quantification for imatinib were 5 ng/mL (400 mg) or 3 ng/mL (100 mg). Both the intra-day and inter-day precision %CVs for imatinib were less than 15% (but 20% at LLOQ) levels for both doses. The intra-day and inter-day accuracies (%nominal) were between 80% and 120% at LLOQ level for both doses, too.
Table 1. Study-subjects demographic characteristics
Study SubjectsN (%)
SamplesN (%) Sampling points (h) Age (years)
mean (range)Weight (kg)
mean (range)
Dose N (%)
100 mg 400 mg
1 38 (33.9) 606 (34.2)Predose, 0.5, 1, 1.5, 2, 2.5, 3, 3.5, 4, 6, 8, 12, 24, 48, 72
25.21 (20–44) 66.17 (53.4–76.4) – 38
2 38 (33.9) 593 (33.4)Predose, 0.5, 1, 1.5, 2, 2.5, 3, 3.5, 4, 6, 8, 12, 24, 48, 72
27.11 (20–45) 66.79 (54–83.8) – 38
3 36 (32.2) 574 (32.4)Predose, 0.5, 1, 1.5, 2, 2.5, 3, 3.5, 4, 6, 8, 12, 24, 48, 60
24.33 (20–32) 68.49 (52.8–85.9) 36 (32.1) –
Total 112 (100) 1773 (100) – 25.57 (20–45) 67.12 (52.8–85.9) 36 (32.1) 76 (67.9)
Table 2. Quantitative concentration analysis of imatinib for each dose
100 mg dose study 400 mg dose study
HPLC Nanospace SI-2, Shiseido, Japan Nanospace SI-2, Shiseido, Japan
MS/MS API 4000, AB SCIEX, USA 4000 QTRAP, AB SCIEX, USA
Linear calibration curve 3–1,500 ng/mL 5–5,000 ng/mL
LLOQ 3 ng/mL 5 ng/mL
Precision (CV%) <15, <20 at LLOQ <15, <20 at LLOQ
Accuracy (%) 85–115, 80–120 at LLOQ 85–115, 80–120 at LLOQ
HPLC, High-performance liquid chromatography; MS, mass spectrometry; LLOQ, lower limit of quantification.
Gab-jin Park, et al.

Vol. 24, No.2, Jun 15, 201698
TCP Transl Clin Pharmacol
Population pharmacokinetic analysis NONMEM (Ver. 7.3.0, Icon development solutions, Ellicott City, MD) was used with R (version 3.2.3)[18] and Xpose4 (ver-sion 4.5.3)[19] for the population PK analysis of imatinib. The first-order conditional estimation with interaction (FOCE-I) method was used throughout the modeling process. Because data from 100 mg and 400 mg studies were merged for PK modeling, VPCs (visual predictive check) were performed sepa-rately to explore dose-related differences if any. A two-compartment model was selected for imatinib distribu-tion after comparison of one- and two-compartment models. To select the best absorption model, models such as first-order absorption with or without a lag-time, zero-order absorption with or without a lag-time (previously reported for imatinib, [13-15]) and Weibull absorption using the following equation was tested:
ka(t) = 1 – e–(k∙t)γ
where ka(t) is time dependent absorption rate constant, k is ap-parent absorption rate constant,[20] and γ is shape factor.
PK parameters of the jth subjects (Pj) were described as follow-ing:
Pj = TVP × exp(ηj)
where TVP represents the typical population value of PK pa-rameters, such as clearance (CL/F), central volume of distribu-tion (Vc/F) etc. The inter-individual variability (ηi) for each pa-rameter was assumed to follow a normal distribution with the mean of 0 and variance of ω2. The combined residual error form was used, as follows:
DVij = DVipred,ij × (1 + εprop,ij) + εadd,ij
where DVij is the jth measured concentration in the ith individ-ual, DVipred,ij is the jth predicted value in the ith individual, and εprop,ij and εadd,ij are the residual variability with means of 0 and the variance of σprop
2 and σadd2, respectively. Possible correlation
between the interindividual variability was explored using the correlation coefficient as follows:
Models were selected based on decrease in the objective func-tion value (OFV) > 3.84 (P=0.05, df=1) and visual exploration of the diagnostic scatterplots. The residual-based model di-agnosis was performed using conditional weighted residuals. Considering the covariance between the corresponding vari-ance terms, The OMEGA block structure was applied to ETAs which showed higher correlation coefficients (r>0.7) between
two elements of OMEGA after covariate selection. The covari-ate screening process was performed using visual exploration (parameter versus variable scatter plots) and numerical GAM (generalized additive modeling, version 1.12)[21] implemented by Xpose4 approaches. Influences of the covariates that passed the screening (study, age and body weight) on PK parameters were examined using linear, power, or exponential equations. During the covariate model-building process, stepwise forward selection and backward elimination were performed. Variables that decreased the OFV by >3.84 (p<0.05) and decreased the inter-individual variabilities were selected at forward selection and those failed to increase the OFV by >6.63 (p<0.01) at back-ward elimination were removed from the model. The final model was then evaluated using visual predictive checks (VPCs) by overlaying observed data points with 5th, 50th, and 95th percentile curves of 1,000 simulated data from the final model for 100 mg and 400 mg dose, respectively. The bootstrap resampling method (Wings for NONMEM, version 740)[22] was utilized to assess the solidity and robustness of the final PK model. Resampling generated 1,000 bootstrap data sets, and the final population PK model structure was repeatedly run using each of the resampled dataset. Medians and ninety-five percent confidence intervals (CI) were acquired from the bootstrap rep-lications.
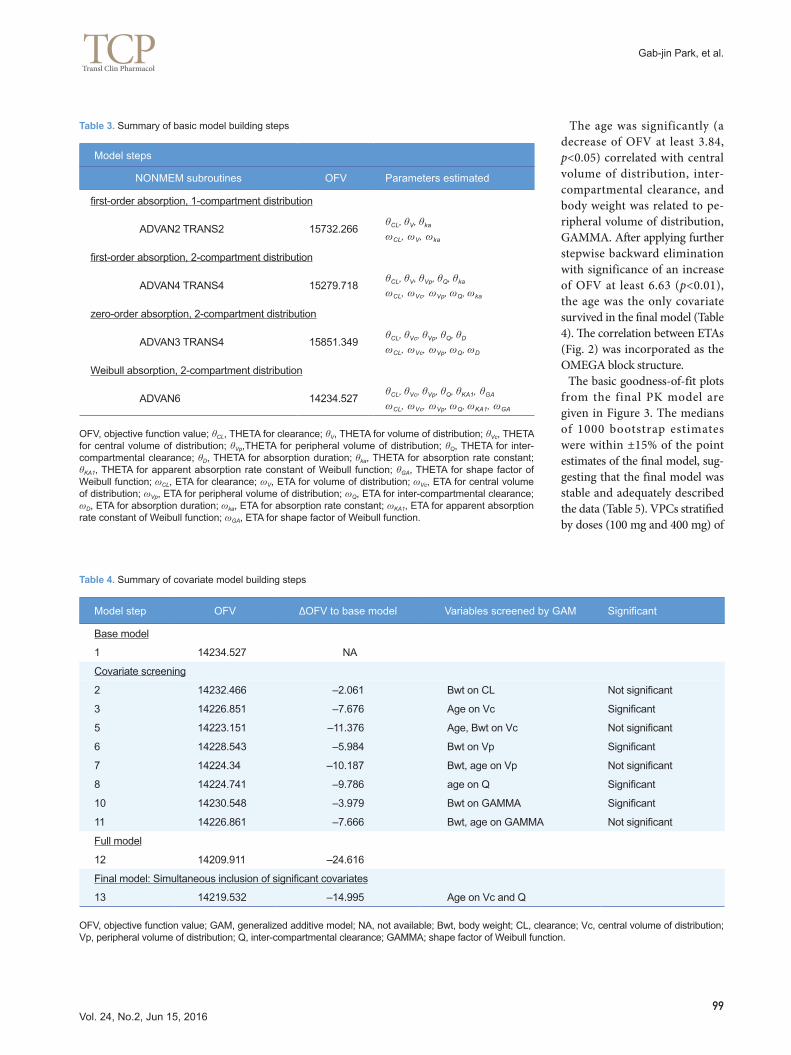
Results Development of the basic model and covariate model was based on the OFV and basic goodness-of-fit plots as well as individual plots. A two-compartment model with Weibull ab-sorption and first-order elimination best described the observed data of imatinib (Fig. 1). The process of base model selection is summarized in Table 3. The PK variables used in the model were CL/F, Vc/F, Vp/F (peripheral volume), Q/F (inter-compart-mental clearance), KA1 (scale parameter of Weibull function; apparent absorption rate constant[20]) and GAMMA (shape parameter of Weibull function). Details of the final structural model and parameter estimates are shown in Table 5.
Figure 1. Pharmacokinetic model for imatinib.
Imatinib pharmacokinetics in healthy Koreans
Vol. 24, No.2, Jun 15, 201699
TCP Transl Clin Pharmacol
Gab-jin Park, et al.
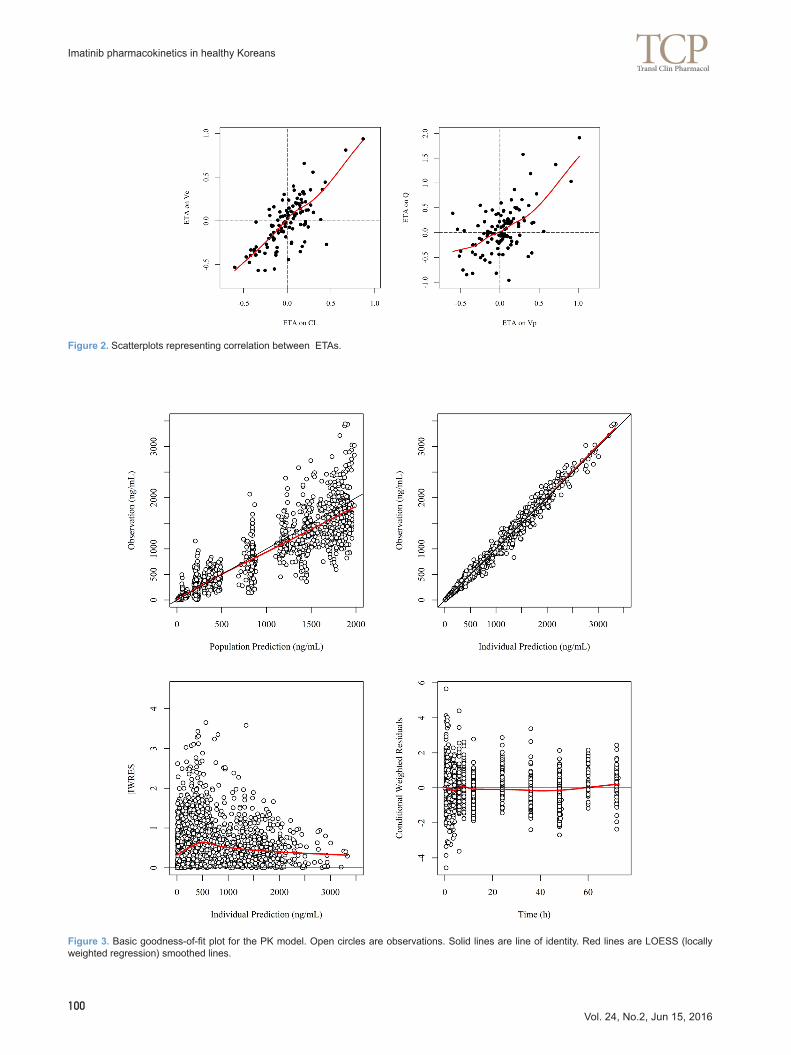
The age was significantly (a decrease of OFV at least 3.84, p<0.05) correlated with central volume of distribution, inter-compartmental clearance, and body weight was related to pe-ripheral volume of distribution, GAMMA. After applying further stepwise backward elimination with significance of an increase of OFV at least 6.63 (p<0.01), the age was the only covariate survived in the final model (Table 4). The correlation between ETAs (Fig. 2) was incorporated as the OMEGA block structure. The basic goodness-of-fit plots from the final PK model are given in Figure 3. The medians of 1000 bootstrap estimates were within ±15% of the point estimates of the final model, sug-gesting that the final model was stable and adequately described the data (Table 5). VPCs stratified by doses (100 mg and 400 mg) of
Table 3. Summary of basic model building steps
Model steps
NONMEM subroutines OFV Parameters estimated
first-order absorption, 1-compartment distribution
ADVAN2 TRANS2 15732.266θCL, θV, θka
ωCL, ωV, ωka
first-order absorption, 2-compartment distribution
ADVAN4 TRANS4 15279.718θCL, θV, θVp, θQ, θka
ωCL, ωVc, ωVp, ωQ, ωka
zero-order absorption, 2-compartment distribution
ADVAN3 TRANS4 15851.349θCL, θVc, θVp, θQ, θD
ωCL, ωVc, ωVp, ωQ, ωD
Weibull absorption, 2-compartment distribution
ADVAN6 14234.527θCL, θVc, θVp, θQ, θKA1, θGA
ωCL, ωVc, ωVp, ωQ, ωKA1, ωGA
OFV, objective function value; θCL, THETA for clearance; θV, THETA for volume of distribution; θVc, THETA for central volume of distribution; θVp,THETA for peripheral volume of distribution; θQ, THETA for inter-compartmental clearance; θD, THETA for absorption duration; θka, THETA for absorption rate constant; θKA1, THETA for apparent absorption rate constant of Weibull function; θGA, THETA for shape factor of Weibull function; ωCL, ETA for clearance; ωV, ETA for volume of distribution; ωVc, ETA for central volume of distribution; ωVp, ETA for peripheral volume of distribution; ωQ, ETA for inter-compartmental clearance; ωD, ETA for absorption duration; ωka, ETA for absorption rate constant; ωKA1, ETA for apparent absorption rate constant of Weibull function; ωGA, ETA for shape factor of Weibull function.
Table 4. Summary of covariate model building steps
Model step OFV ∆OFV to base model Variables screened by GAM Significant
Base model
1 14234.527 NA
Covariate screening
2 14232.466 –2.061 Bwt on CL Not significant
3 14226.851 –7.676 Age on Vc Significant
5 14223.151 –11.376 Age, Bwt on Vc Not significant
6 14228.543 –5.984 Bwt on Vp Significant
7 14224.34 –10.187 Bwt, age on Vp Not significant
8 14224.741 –9.786 age on Q Significant
10 14230.548 –3.979 Bwt on GAMMA Significant
11 14226.861 –7.666 Bwt, age on GAMMA Not significant
Full model
12 14209.911 –24.616
Final model: Simultaneous inclusion of significant covariates
13 14219.532 –14.995 Age on Vc and Q
OFV, objective function value; GAM, generalized additive model; NA, not available; Bwt, body weight; CL, clearance; Vc, central volume of distribution; Vp, peripheral volume of distribution; Q, inter-compartmental clearance; GAMMA; shape factor of Weibull function.
Vol. 24, No.2, Jun 15, 2016100
TCP Transl Clin Pharmacol
Figure 2. Scatterplots representing correlation between ETAs.
Figure 3. Basic goodness-of-fit plot for the PK model. Open circles are observations. Solid lines are line of identity. Red lines are LOESS (locally weighted regression) smoothed lines.
Imatinib pharmacokinetics in healthy Koreans

Vol. 24, No.2, Jun 15, 2016101
TCP Transl Clin Pharmacol
Gab-jin Park, et al.
Table 5. Population pharmacokinetic parameters of imatinib
Parameter (unit) Estimate SE (% RSE) Bootstrap median (95% CI)
Fixed effects
Apparent clearance model (CL/F)
CL = θ1
θ1 CL/F (L/h) 13.6 0.379 (2.79) 13.6 (13.572–13.611)
Apparent central volume model (Vc/F)
Vc = θ2 × (Age/24)θ9
θ2 Vc/F (L) 153 5.55 (3.63) 153 (152.750–153.366)
θ9 Age on Vc 0.312 0.147 (47.12) 0.309 (0.297–0.312)
Apparent peripheral volume model (Vp/F)
Vp = θ3
θ3 Vp (L) 64 3.58 (5.59) 63.5 (63.356–63.811)
Inter-compartmental clearance (Q/F)
Q = θ4 × (Age/24)θ10
θ4 Q (L/h) 8.64 0.898 (10.39) 8.455 (8.443–8.567)
θ10 Age on Q 0.531 0.342 (64.41) 0.539 (0.554–0.593)
Scale parameter
KA1 = θ5
θ5 Scale parameter 0.998 0.0751 (7.53) 1.01 (1.007–1.014)
Shape parameter
GAMMA = θ6
θ6 Shape parameter 2.24 0.212 (9.46) 2.26 (2.249–2.270)
Random effects
Interindividual variability (Exponential model)
ω211 IIV on CL 0.0548 0.0067 (12.3) 0.0538 (0.0536–0.0547)
ω222 IIV on Vc 0.0852 0.0141 (16.55) 0.0835 (0.0824–0.0841)
ω212 Cov (CL, Vc) 0.0519 0.0075 (14.45) 0.5837 (0.5631–0.5765)
ω233 IIV on Vp 0.129 0.0284 (22.02) 0.1253 (0.1237–0.1282)
ω244 IIV on Q 0.448 0.0884 (19.73) 0.4238 (0.4093–0.4292)
ω234 Cov (Vp, Q) 0.212 0.0485 (22.88) 0.8028 (0.7924–0.8045)
ω255 IIV on scale parameter 0.362 0.0576 (15.91) 0.3624 (0.3620–0.3706)
ω266 IIV on shape parameter 0.483 0.102 (21.12) 0.4624 (0.4573–0.4693)
Residual error (Combined model)
σ21 Additive part, fixed 0.0001 – –
σ22 Proportional part 0.108 0.00175 (1.64) 0.108 (0.1074–0.1079)
SE, standard error; RSE, relative standard error; CI, confidence interval.

Vol. 24, No.2, Jun 15, 2016102
TCP Transl Clin Pharmacol
Tab
le 6
. Sum
mar
y of
PP
K s
tudi
es r
evie
wed
Ref
eren
ces
Abs
orpt
ion
mod
elD
istr
ibut
ion
mod
elS
ubje
ct
num
ber
Sub
ject
s ch
arac
teris
tics
PK
sam
plin
gD
ose
(mg/
m2 )
Adm
inis
t-ra
tion
rout
e
CL/
F
estim
ate
(SE
)(L
/h)
V/F
es
timat
es
(SE
)(L
)
[23]
Zer
o-or
der
One
-34
GIS
TP
re-d
ose,
1–3
h, 6
–9 h
, 24
h (d
ay 1
),
day
30, d
ay 6
040
0–60
0P
O7.
9716
8
[27]
Zer
o-or
der
One
-73
GIS
TP
re-d
ose,
1–3
h, 6
–9 h
, 24
h (d
ay 1
),
day
2940
0–60
0IM
8.1
816
8 +
58.
5 (d
ay
28)
[24]
(M
odel
1)Z
ero-
orde
r O
ne-
43G
IST
Sof
t tis
sue
sarc
oma
Pre
-dos
e, 1
, 2, 3
, 4, 8
, 12,
14, 2
4 h
(day
1)
300,
400
, 50
0–
9.33
(0.
98)
184
(14)
[24]
(M
odel
2)Z
ero-
orde
r O
ne-
42G
IST
Sof
t tis
sue
sarc
oma
Pre
-dos
e, 2
, 8, 2
4h (
day2
9)P
re-d
ose,
2, 4
h (e
xten
sion
pha
se)
300,
400
, 50
0–
10.6
(1.
16)
183
(16)
[25]
Zer
o-or
der
One
-31
CM
LO
steo
sarc
oma
Ew
ing
sarc
oma
Des
mop
last
ic s
mal
l rou
nd c
ell
tum
orS
ynov
ial c
ell s
arco
ma
GIS
Tof
you
ng a
dult
and
child
ren
Pre
-dos
e, 1
–3 h
, 6–9
h, 1
2 h,
24
h ov
er 2
4-48
h (
day1
, 8, 1
8)2
60
–57
0
PO
10
.32
51
[13]
Firs
t-or
der
One
-67
GIS
Tof
adu
lt an
d ch
ildre
n
Adu
lt:P
re-d
ose,
1–3
h, 6
–9 h
, 24
h (d
ay 1
),da
y 30
, day
60
Chi
ldre
n:P
re-d
ose,
1, 3
, 5, 7
, 13,
24
h (d
ay 1
)P
re-d
ose,
2–4
h (
day
30, 6
0)
400,
600
PO
7.2
92
02
[15]
Zer
o-or
der
One
-55
3C
ML
Pre
-dos
e, 1
–3 h
, 6–9
h, 2
4 h
(day
1, 2
9)4
00
PO
13
.82
52
[14]
Firs
t-or
der
One
-59
GIS
TC
ML
ALL
Pre
-dos
e, 2
, 4, 6
, 8 h
150–
800
–1
4.3
34
7
[26]
Firs
t-or
der
One
-34
CM
L0–
1 h,
0–8
h, 8
–16
h, 1
6–30
.5 h
100–
600
–8
.7(5
.3)
43
0
(9.9
)
Our
res
ults
Wei
bull
func
tion
Two-
112
Hea
lthy
volu
ntee
rsP
redo
se, 0
.5, 1
, 1.5
, 2, 2
.5, 3
, 3.5
, 4, 6
, 8,
12,
24,
48,
60
and
72 h
(at
400
mg
grou
p on
ly)
100,
400
PO
13.6
(0
.379
)15
3 (5
.55)
*64
(3.
58)†
*Cen
tral
com
part
men
t vo
lum
e, † P
erip
hera
l co
mpa
rtm
ent
volu
me.
One
-, o
ne-c
ompa
rtm
ent;
Two-
, tw
o-co
mpa
rtm
ent;
GIS
T, g
astr
oint
estin
al s
trom
al t
umor
; C
ML,
chr
onic
mye
loid
leu
kem
ia;
AM
L; a
cute
mye
loid
leuk
emia
.
Imatinib pharmacokinetics in healthy Koreans

Vol. 24, No.2, Jun 15, 2016103
TCP Transl Clin Pharmacol
Gab-jin Park, et al.
the final population PK model are shown in Figure 4.
Discussion The objective of this study was to characterize the population PK of imatinib in healthy Koreans. A two-compartment model with Weibull absorption successfully described the data from three studies conducted in healthy Koreans while most of previ-ous modeling reports[13-15,23-26] supported a single compart-ment with zero-order or first-order absorption (Table 6). The estimated parameters in this study were comparable to those reported elsewhere. From pathophysiological changes by disease, patients with CML or GIST may show imatinib PK characteristics substan-tially different from those of healthy volunteers. Except one study,[15] the population PK analysis was conducted at steady state, while our study was done with single dose data. The pres-ent study suggested a two-compartment model for disposition in contrast to one-compartment models in their reports. Such a difference in the distribution model structure may have been caused by rather sparse and/or short (i.e., less than 24 h) sam-pling schemes at daily dosing situation in patients. Although many other reports employed zero-order absorption[15,23-25, 27] or first-order absorption models,[13,14,26] we tried Weibull function[28] to describe the absorption pattern more precisely. Because of the flexibilities of the Weibull function, it may be applied in cases where the absorption model involves the first-order, zero-order absorption, or a combination of both.[29] Laboratory markers such as α1-acid glycoprotein (AAG) al-bumin, hemoglobin, WBC count, as well as body weight, were identified as significant covariates for CL, V in previous reports. [13-15,24,25,27] Age was correlated with central volume (Vc), inter-compartmental clearance (Q) in this study, but its implica-tion is not clear because the number of subjects or the range of age was not large enough. Although the PK data used were from
healthy subjects only, this is the first report on the population PK of imatinib in Koreans.
Acknowledgements This research was supported by a grant of the Korea Health Technology R&D Project through the Korea Health Indus-try Development Institute (KHIDI), funded by the Minis-try of Health & Welfare, Republic of Korea (grant number: HI14C2116).
Conflict of interest The authors declared no conflict of interest.
References 1. Arora A, Scholar EM. Role of tyrosine kinase inhibitors in cancer therapy. J
Pharmacol Exp Ther 2005;315:971-979.
2. Paul MK, Mukhopadhyay AK. Tyrosine kinase - Role and significance in Cancer. Int J Med Sci 2004;1:101-115.
3. Druker BJ. Imatinib as a paradigm of targeted therapies. Adv Cancer Res 2004;91:1-30.
4. Savage DG, Antman KH. Imatinib mesylate—a new oral targeted therapy. N Engl J Med 2002;346:683-693.
5. Pao W, Miller VA. Epidermal growth factor receptor mutations, small-mole-cule kinase inhibitors, and non–small-cell lung cancer: Current knowledge and future directions. J Clin Oncol 2005;23:2556-2568.
6. Gilliland DG, Griffin JD. The roles of FLT3 in hematopoiesis and leukemia. Blood 2002;100:1532-1542.
7. Sharma A, Trivedi NR, Zimmerman MA, Tuveson DA, Smith CD, Robert-son GP. Mutant V599EB-Raf regulates growth and vascular development of malignant melanoma tumors. Cancer Res 2005;65:2412-2421.
8. Buchdunger E, Zimmermann J, Mett H, Meyer T, Müller M, Druker BJ, et al. Inhibition of the Abl protein-tyrosine kinase in vitro and in vivo by a 2-phenylaminopyrimidine derivative. Cancer Res 1996;56:100-104.
9. Heinrich MC, Griffith DJ, Druker BJ, Wait CL, Ott KA, Zigler AJ. Inhibition of c-kit receptor tyrosine kinase activity by STI 571, a selective tyrosine kinase inhibitor. Blood 2000;96:925-932.
10. Cohen MH, Williams G, Johnson JR, Duan J, Gobburu J, Rahman A, et al. Approval Summary for Imatinib Mesylate Capsules in the Treatment of Chronic Myelogenous Leukemia. Clin Cancer Res 2002;8:935-942.
Figure 4. Visual predictive checks of the final PK model classified by dose of 100 mg and 400 mg.

Vol. 24, No.2, Jun 15, 2016104
TCP Transl Clin Pharmacol
11. Dagher R, Cohen M, Williams G, Rothmann M, Gobburu J, Robbie G, et al. Approval summary: imatinib mesylate in the treatment of metastatic and/or unresectable malignant gastrointestinal stromal tumors. Clin Can-cer Res 2002;8:3034-3038.
12. Capdeville R, Silberman S, Dimitrijevic S. Imatinib: the first 3 years. Eur J Cancer 2002;38:S77-S82.
13. Petain A, Kattygnarath D, Azard J, Chatelut E, Delbaldo C, Geoerger B, et al. Population pharmacokinetics and pharmacogenetics of imatinib in chil-dren and adults. Clin Cancer Res 2008;14:7102-7109.
14. Widmer N, Decosterd LA, Csajka C, Leyvraz S, Duchosal MA, Rosselet A, et al. Population pharmacokinetics of imatinib and the role of α1-acid gly-coprotein. Br J Clin Pharmacol 2006;62:97-112.
15. Schmidli H, Peng B, Riviere GJ, Capdeville R, Hensley M, Gathmann I, et al. Population pharmacokinetics of imatinib mesylate in patients with chronic-phase chronic myeloid leukaemia: results of a phase III study. Br J Clin Pharmacol 2005;60:35-44.
16. Titier K, Picard S, Ducint D, Teilhet E, Moore N, Berthaud P, et al. Quanti-fication of imatinib in human plasma by high-performance liquid chroma-tography-tandem mass spectrometry. Ther Drug Monit 2005;27:634-640.
17. Parise RA, Ramanathan RK, Hayes MJ, Egorin MJ. Liquid chromato-graphic-mass spectrometric assay for quantitation of imatinib and its main metabolite (CGP 74588) in plasma. J Chromatogr B Analyt Technol Biomed Life Sci 2003;791:39-44.
18. Team RC. R: A language and environment for statistical computing. 2015.
19. Jonsson EN, Karlsson MO. Xpose—an S-PLUS based population phar-macokinetic/pharmacodynamic model building aid for NONMEM. Comput Methods Programs Biomed 1998;58:51-64.
20. Zhou H. Pharmacokinetic strategies in deciphering atypical drug absorp-tion profiles. J Clin Pharmacol 2003;43:211-227.
21. Hastie T. gam: Generalized additive models. https://cran.r-project.org/web/
packages/gam/gam.pdf Accessed May 1 2016
22. Holford N. Wings for NONMEM. http://wfn.sourceforge.net/ Accessed Jan 10 2016
23. Delbaldo C, Chatelut E, Ré M, Deroussent A, Séronie-Vivien S, Jambu A, et al. Pharmacokinetic-pharmacodynamic relationships of imatinib and its main metabolite in patients with advanced gastrointestinal stromal tumors. Clin Cancer Res 2006;12:6073-6078.
24. Judson I, Ma P, Peng B, Verweij J, Racine A, di Paola ED, et al. Imatinib pharmacokinetics in patients with gastrointestinal stromal tumour: a retro-spective population pharmacokinetic study over time. EORTC Soft Tissue and Bone Sarcoma Group. Cancer Chemother Pharmacol 2005;55:379-386.
25. Menon-Andersen D, Mondick JT, Jayaraman B, Thompson PA, Blaney SM, Bernstein M, et al. Population pharmacokinetics of imatinib mesylate and its metabolite in children and young adults. Cancer Chemother Phar-macol 2009;63:229-238.
26. Yamakawa Y, Hamada A, Nakashima R, Yuki M, Hirayama C, Kawaguchi T, et al. Association of genetic polymorphisms in the influx transporter SL-CO1B3 and the efflux transporter ABCB1 with imatinib pharmacokinetics in patients with chronic myeloid leukemia. Ther Drug Monit 2011;33:244-250.
27. Demetri GD, Wang Y, Wehrle E, Racine A, Nikolova Z, Blanke CD, et al. Imatinib plasma levels are correlated with clinical benefit in patients with unresectable/metastatic gastrointestinal stromal tumors. J Clin Oncol 20 09;27:3141-3147.
28. Piotrovskii VK. The use of Weibull distribution to describe thein vivo ab-sorption kinetics. J Pharmacokinet Biopharm 1987;15:681-686.
29. Piotrovskii VK. Pharmacokinetic stochastic model with Weibull-distributed residence times of drug molecules in the body. Eur J Clin Pharmacol 1987;32:515-523.
Imatinib pharmacokinetics in healthy Koreans