Original Article Deciphering groundwater quality for ... · Water quality secondary parameters name...
7
How to site this article: P V Kathane, K R Aher Watershed, Buldhana District, Vidharbha region 2015; 17(2): 69-75. http://www.statperson.com Original Article Deciphering grou and agricultural p Buldhana District P V Kathane 1* , K R Aher 2 1 Senior Geologist, Department of Groundwater S 2 Junior Geologist, Groundwater Survey and Devel Email: [email protected] Abstract Abstract: The present hydro District, Vidharbha region, I purposes. For this study, sam samples were analyzed for t chemical parameters of grou Mg2+, Cl-, CO3−, H CO3−, RSC, MAR, CR and KR hav According to these parameter drinking suitability standard fluoride. Groundwater of the quality of groundwater get de Keywords Groundwater qual * Address for Correspondence: Dr. P V Kathane, Senior Geologist, Department o Email: [email protected] Received Date: 01/12/2015 Revised Date: 01/12 INTRODUCTION Groundwater is the purest form of wate natural resources and meets the overall d and semi-urban people. But the developm societies and industry result in bi problems; pollution puts the water, air and at risk (Milovanovic, 2007). Assessmen chemical characteristics of water and aq properties is important for groundwater management in the study area. It is not need for human existence but also a vit Access this article online Quick Response Code: Website: www.statperso DOI: 10 Dec 2015 r. Deciphering groundwater quality for domestic and agricultural n, India. International Journal of Recent Trends in Science and T (accessed 12 December 2015). undwater quality for do purposes in PTW-1 Wa t, Vidharbha region, In Survey and Development Agency, Buldhana, Maharashtra, INDI elopment Agency, Aurangabad, Maharashtra, INDIA. o-geochemical study of groundwater samples from the in PT India was carried out to assess their suitability for agricultu mples were collected from 25 locations during the post-mon their physical and chemical properties using standard labora undwater such as pH, electrical conductivity, and total dissolv SO42−, NO−3 and F− were determined. Various water quality ve been calculated for each water sample to identify the agri ers, the groundwater has been found suitable for agricultural u of groundwater, three parameters have been considered is tota present study area has been found to be good for domestic use eteriorated. lity; agricultural and domestic suitability; PTW-1 watershed of Groundwater Survey and Development Agency, Buldhana, M 2/2015 Accepted Date: 01/12/2015 er sourced from demand of rural ment of human ioenvironmental d soil resources nt of the hydro quifer hydraulic r planning and only the basic tal input for all development activities (Das and agricultural activities have incr groundwater in India. Water q natural and anthropogenic effects geology and irrigation practic constituents enter the ground, it is dissolution. The chemical charac play an important role in classify quality. Geochemical studies of better understanding of possible c naturally occurring major, mino drinking water can have a signi health either through deficienc (Frengstad, et al, 2001). Hence, t processes that control the water one can speak or act intelligen water-quality control and impr SubbaRao, et al, 2006.). Adv increase the investment in irrigati decrease agricultural production 2015). This in turn, reduces agrar improvement in the living con (Deshpande and Aher, 2011). S on.com cember 5 l purposes in PTW-1 Technology. December omestic atershed, ndia IA. TW-1 Watershed, Buldhana ural, domestic and drinking nsoon sessions. Groundwater atory methods. Physical and ved solids, Na+, K+, Ca2+, y indices like SAR, SSP, PI, icultural suitability standard. use. For determination of the al hardness (TH), nitrate and e except few locations where Maharashtra, INDIA. d Nag, 2015). Intensive reased the demand for quality is influenced by s including local climate, ces. Once undesirable s difficult to control their cteristics of groundwater ying and assessing water groundwater provide a changes in quality. Many or and trace elements in ificant effect on human cy or excessive intake the understanding of the quality is needed before ntly towards the aim of rovement (Hem, 1991; verse quality conditions ion and health, as well as (Aher and Deshpande, rian economy and retard nditions of rural people ince groundwater is the
Transcript of Original Article Deciphering groundwater quality for ... · Water quality secondary parameters name...
How to site this article: P V Kathane, K R AherWatershed, Buldhana District, Vidharbha region, India2015; 17(2): 69-75. http://www.statperson.com
Original Article
Deciphering groundwater quality for domestic and agricultural purposes in PTWBuldhana District, Vidharbha region, India
P V Kathane1*
, K R Aher2
1
Senior Geologist, Department of Groundwater Survey an2Junior Geologist, Groundwater Survey and Development Agency, Aurangabad, Maharashtra, INDIA.
Email: [email protected]
Abstract Abstract: The present hydroDistrict, Vidharbha region, India was carried out to assess their suitability for agricultural, domestic and drinking purposes. For this study, samples were collected from 25 locations dsamples were analyzed for their physical and chemical properties using standard laboratory methods. Physical and chemical parameters of groundwater such as pH, electrical conductivity, and total dissolved solidsMg2+, Cl-, CO3−, H CO3−, SO42−, NO−3 and F− were determined.RSC, MAR, CR and KR have been calculated for each water sample to identify the agricultural suitability standard. According to these parameters, the groundwater has been found suitable for agricultural use. For determination of the drinking suitability standard of groundwater, three parameters have been considered is total hardness (TH), nitrate and fluoride. Groundwater of the presquality of groundwater get deteriorated.Keywords Groundwater quality; agricultural and domestic suitability; PTW
*Address for Correspondence: Dr. P V Kathane, Senior Geologist, Department of Groundwater Survey and Development Agency, Buldhana, Maharashtra, INDIA.Email: [email protected] Received Date: 01/12/2015 Revised Date: 01/12
INTRODUCTION Groundwater is the purest form of water sourced from natural resources and meets the overall demand of rural and semi-urban people. But the development of human societies and industry result in bioenvironmental problems; pollution puts the water, air and soil resources at risk (Milovanovic, 2007). Assessment of the hydrochemical characteristics of water and aquifer hydraulic properties is important for groundwater planning and management in the study area. It is not need for human existence but also a vital input for all
Access this article online
Quick Response Code: Website:
www.statperson.com
DOI: 10 December
2015
Aher. Deciphering groundwater quality for domestic and agricultural purposes in PTWWatershed, Buldhana District, Vidharbha region, India. International Journal of Recent Trends in Science and Technology
(accessed 12 December 2015).
Deciphering groundwater quality for domestic and agricultural purposes in PTW-1 Watershed, Buldhana District, Vidharbha region, India
Groundwater Survey and Development Agency, Buldhana, Maharashtra, INDIA.
Survey and Development Agency, Aurangabad, Maharashtra, INDIA.
The present hydro-geochemical study of groundwater samples from the in PTWDistrict, Vidharbha region, India was carried out to assess their suitability for agricultural, domestic and drinking purposes. For this study, samples were collected from 25 locations during the post-monsoon sessions. Groundwater samples were analyzed for their physical and chemical properties using standard laboratory methods. Physical and chemical parameters of groundwater such as pH, electrical conductivity, and total dissolved solids
−, H CO3−, SO42−, NO−3 and F− were determined. Various water quality indices like SAR, SSP, PI, RSC, MAR, CR and KR have been calculated for each water sample to identify the agricultural suitability standard.
ese parameters, the groundwater has been found suitable for agricultural use. For determination of the drinking suitability standard of groundwater, three parameters have been considered is total hardness (TH), nitrate and fluoride. Groundwater of the present study area has been found to be good for domestic use except few locations where quality of groundwater get deteriorated.
Groundwater quality; agricultural and domestic suitability; PTW-1 watershed
Senior Geologist, Department of Groundwater Survey and Development Agency, Buldhana, Maharashtra, INDIA.
2/2015 Accepted Date: 01/12/2015
Groundwater is the purest form of water sourced from natural resources and meets the overall demand of rural
urban people. But the development of human societies and industry result in bioenvironmental
ems; pollution puts the water, air and soil resources at risk (Milovanovic, 2007). Assessment of the hydro chemical characteristics of water and aquifer hydraulic properties is important for groundwater planning and management in the study area. It is not only the basic need for human existence but also a vital input for all
development activities (Das and Nag, 2015). Intensive agricultural activities have increased the demand for groundwater in India. Water quality is influenced by natural and anthropogenic effects including local climate, geology and irrigation practices. Once undesirable constituents enter the ground, it is difficult to control their dissolution. The chemical characteristics of groundwater play an important role in classifying and assessiquality. Geochemical studies of groundwater provide a better understanding of possible changes in quality. Many naturally occurring major, minor and trace elements in drinking water can have a significant effect on human health either through deficiency or excessive intake (Frengstad, et al, 2001). Hence, the understanding of the processes that control the water quality is needed before one can speak or act intelligently towards the aim of water-quality control and improvement (Hem,SubbaRao, et al, 2006.). Adverse quality conditions increase the investment in irrigation and health, as well as decrease agricultural production (Aher and Deshpande, 2015). This in turn, reduces agrarian economy and retard improvement in the living conditions of r(Deshpande and Aher, 2011). Since groundwater is the
www.statperson.com
December
2015
Deciphering groundwater quality for domestic and agricultural purposes in PTW-1 nd Technology. December
Deciphering groundwater quality for domestic 1 Watershed,
Buldhana District, Vidharbha region, India
INDIA.
al study of groundwater samples from the in PTW-1 Watershed, Buldhana District, Vidharbha region, India was carried out to assess their suitability for agricultural, domestic and drinking
monsoon sessions. Groundwater samples were analyzed for their physical and chemical properties using standard laboratory methods. Physical and chemical parameters of groundwater such as pH, electrical conductivity, and total dissolved solids, Na+, K+, Ca2+,
Various water quality indices like SAR, SSP, PI, RSC, MAR, CR and KR have been calculated for each water sample to identify the agricultural suitability standard.
ese parameters, the groundwater has been found suitable for agricultural use. For determination of the drinking suitability standard of groundwater, three parameters have been considered is total hardness (TH), nitrate and
ent study area has been found to be good for domestic use except few locations where
Senior Geologist, Department of Groundwater Survey and Development Agency, Buldhana, Maharashtra, INDIA.
development activities (Das and Nag, 2015). Intensive agricultural activities have increased the demand for groundwater in India. Water quality is influenced by
c effects including local climate, geology and irrigation practices. Once undesirable constituents enter the ground, it is difficult to control their dissolution. The chemical characteristics of groundwater play an important role in classifying and assessing water quality. Geochemical studies of groundwater provide a better understanding of possible changes in quality. Many naturally occurring major, minor and trace elements in drinking water can have a significant effect on human
ciency or excessive intake Hence, the understanding of the
processes that control the water quality is needed before one can speak or act intelligently towards the aim of
quality control and improvement (Hem, 1991; Adverse quality conditions
increase the investment in irrigation and health, as well as decrease agricultural production (Aher and Deshpande, 2015). This in turn, reduces agrarian economy and retard improvement in the living conditions of rural people (Deshpande and Aher, 2011). Since groundwater is the

International Journal of Recent Trends in Science And Technology, ISSN 2277-2812 E-ISSN 2249-8109, Volume 17, Issue 2, 2015 pp 69-75
International Journal of Recent Trends in Science And Technology, ISSN 2277-2812 E-ISSN 2249-8109, Volume 17, Issue 2, 2015 Page 70
primary source of water for domestic, agricultural and industrial uses in many countries and its contamination has been recognized as one of the most serious problems in India. Due to rapid growth of population, urbanization, industrialization and agriculture activities, ground water quality is depleted; it is also influenced by a contribution from the atmosphere and surface water bodies (Singh, et al, 2015). The objective of this study is to deciphering groundwater quality for domestic and agricultural purposes of in PTW-1 Watershed Study area The present study has been carried out in watershed PTW-1 included in part of the taluka Motala and Malkapur district Buldhana, Vidharba region, Maharashtra, India. Watershed area is lies in between 20043’ and 21059’N Latitudes and 75056’ and 76015’E Longitudes (Fig.1.) The climate of the area is characterized by a hot summer and general dryness throughout the year except during the south-west monsoon season, i.e., June to September. Summer temperatures soar to a maximum of 42.3°C whereas in winter, temperatures dip to around 13°C. The rainy season starts in June and lasts till the September. The area receives rainfall from southwest monsoon. The area falls in assured rain fall zone. This area receives an average annual rainfall of 675 mm. The annual rainfall is distributed in 40 rainy days during June to October. While since last 2 years deficit rainfall has occurred and the deficiency is from 0% to 35% to average annual rain fall. The area is containing hard rock terrain towards the southwest part while alluvium thickness is increasing towards the north. The area is divided into three structural cum physical units i.e. run off Zone (a), Recharge zone (b) and Storage zone(c). These zones indicate the area of recharge i.e. ground water potential. Total area of this watershed is 16293 hectare. Topographically southeast part is situated on high elevation i.e. 360m from mean sea level at village Sonbardi in taluka Motala while low elevation i.e. 260m is encountered at village Nimbhari of taluka – Malkapur nearer to Jalgaon district of Khandesh area (Kathane et al, 2015).
Figure 1: Location map of PTW-1 Watershed, dist. Buldhana
Drainage
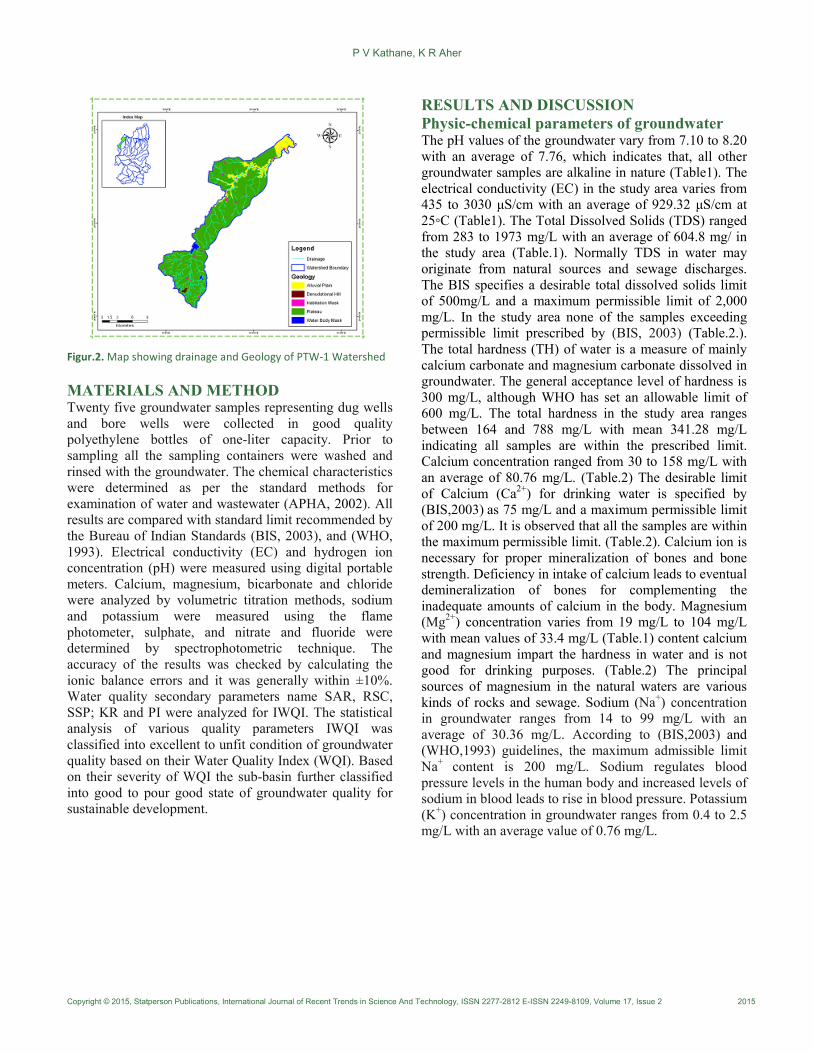
The watershed PTW-1 is drained by the major river Wyaghra and its tributary. Wyaghra River is flowing from southwest to northeast direction. It is in mature stage. The main drainage is topographically controlled which exhibits meandering in various places like nearby the bridge on Malkapur– Devdabha road and due west corner of village Hingana Kazi. Various 2nd to 3rd order stream flowing from northwest to southeast direction. Most of it originates at high elevation part towards south east of studied area. Widths of the nallas are approx 10–15 m., while depth is around 2 – 3.5 m. All the drainages in the area are flowing along the principle slope direction. The drainage exhibits typical Deccan trap pattern i.e. dendritic drainage pattern. Width of river in study area is varies from 30 -35 m. and depth range is about 3.0 to 5.0 m. The width of Wyaghra river is increasing from South to North while its depth is decrease in same direction (Kathane et al, 2015). Depending on width and depth of river, the southern area in the village is more favour able to recharge rather than the northern area. Sand thickness in river bed is about 1.5 – 2.00 m in watershed PTW-1, Vyaghra is major drainage flowing from southwest to northeast, in some patches along the bank of Vyaghra river local alluvium formation is observed, total thickness of local alluvium varies from 2.5 m to 7.5m. this alluvium contain Sand, pebbles and sandy loam which is followed by tiny yellow colour clay or mud upghto the depth of 8 m to 12 m and its thickness is goes on increases towards north where Wyaghra meets the Purna river (Fig.2). Geology and Hydrogeology Deccan Trap lava flows and Purna Alluvium are the major water bearing formations of PTW-1 watershed (Fig.2) Major part of the area is covered by basaltic lava flows of upper Cretaceous to lower Eocene age. The Deccan lava sequence is grouped under Satpura group. Deccan Trap Basalt forms an important water bearing formation. The disposition of vesicular unit and massive unit of different lava flows has given rise to multi layered aquifer system. The water bearing capacity of Vesicular Basalt largely depends upon size and shape of vesicles, density of vesicles and the degree of inter connection of vesicles. Massive Basalt generally does not possess primary porosity. However, Massive Basalt, which is fractured, jointed and weathered posses’ water bearing capacity (CGWB, 2007). The northern part of the area on either side of Purna River is underlain by thick alluvial deposits of Pleistocene to Recent age. In Alluvial deposits, inter pore spaces in sand and gravel renders them a high degree of porosity and permeability to make them a good ground water reservoir. However litho logical variation results in variable water yielding capacity depending upon the sand-clay ratio.
P V Kathane, K R Aher
Copyright © 2015, Statperson Publications, International Journal of Recent Trends in Science And Technology, ISSN 2277-2812 E-ISSN 2249-8109, Volume 17, Issue 2 2015
Figur.2. Map showing drainage and Geology of PTW-1 Watershed
MATERIALS AND METHOD Twenty five groundwater samples representing dug wells and bore wells were collected in good quality polyethylene bottles of one-liter capacity. Prior to sampling all the sampling containers were washed and rinsed with the groundwater. The chemical characteristics were determined as per the standard methods for examination of water and wastewater (APHA, 2002). All results are compared with standard limit recommended by the Bureau of Indian Standards (BIS, 2003), and (WHO, 1993). Electrical conductivity (EC) and hydrogen ion concentration (pH) were measured using digital portable meters. Calcium, magnesium, bicarbonate and chloride were analyzed by volumetric titration methods, sodium and potassium were measured using the flame photometer, sulphate, and nitrate and fluoride were determined by spectrophotometric technique. The accuracy of the results was checked by calculating the ionic balance errors and it was generally within ±10%. Water quality secondary parameters name SAR, RSC, SSP; KR and PI were analyzed for IWQI. The statistical analysis of various quality parameters IWQI was classified into excellent to unfit condition of groundwater quality based on their Water Quality Index (WQI). Based on their severity of WQI the sub-basin further classified into good to pour good state of groundwater quality for sustainable development.
RESULTS AND DISCUSSION
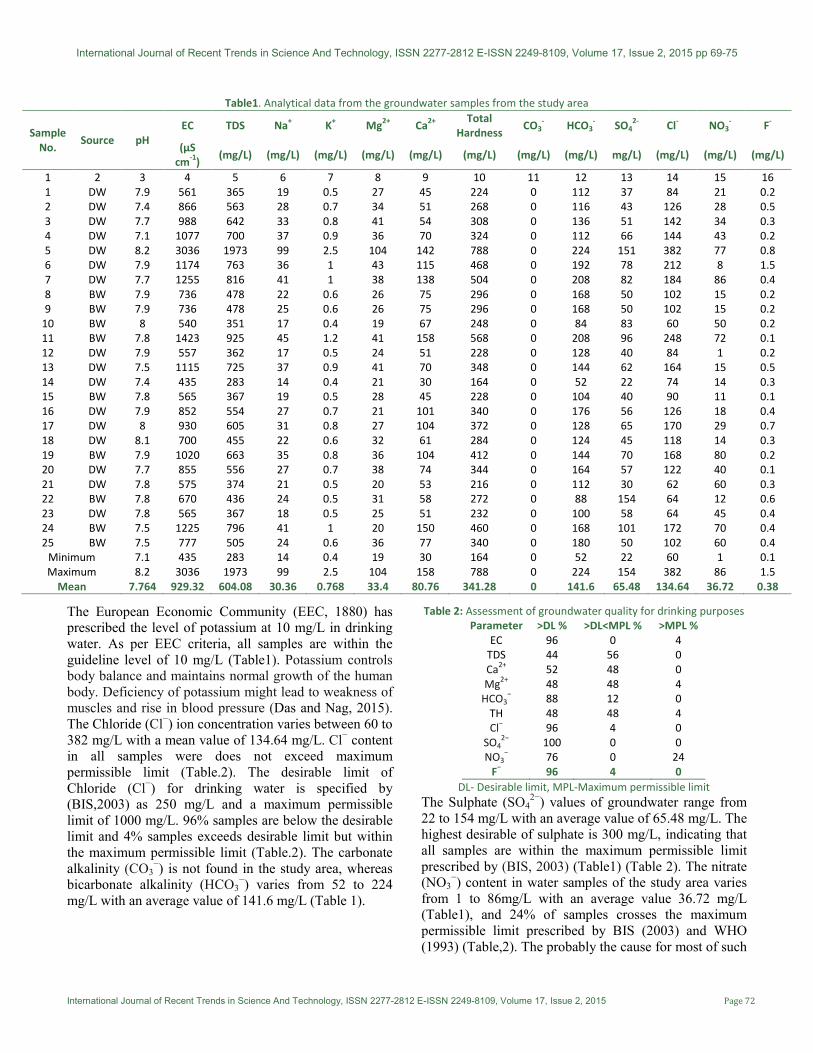
Physic-chemical parameters of groundwater The pH values of the groundwater vary from 7.10 to 8.20 with an average of 7.76, which indicates that, all other groundwater samples are alkaline in nature (Table1). The electrical conductivity (EC) in the study area varies from 435 to 3030 µS/cm with an average of 929.32 µS/cm at 25◦C (Table1). The Total Dissolved Solids (TDS) ranged from 283 to 1973 mg/L with an average of 604.8 mg/ in the study area (Table.1). Normally TDS in water may originate from natural sources and sewage discharges. The BIS specifies a desirable total dissolved solids limit of 500mg/L and a maximum permissible limit of 2,000 mg/L. In the study area none of the samples exceeding permissible limit prescribed by (BIS, 2003) (Table.2.). The total hardness (TH) of water is a measure of mainly calcium carbonate and magnesium carbonate dissolved in groundwater. The general acceptance level of hardness is 300 mg/L, although WHO has set an allowable limit of 600 mg/L. The total hardness in the study area ranges between 164 and 788 mg/L with mean 341.28 mg/L indicating all samples are within the prescribed limit. Calcium concentration ranged from 30 to 158 mg/L with an average of 80.76 mg/L. (Table.2) The desirable limit of Calcium (Ca2+) for drinking water is specified by (BIS,2003) as 75 mg/L and a maximum permissible limit of 200 mg/L. It is observed that all the samples are within the maximum permissible limit. (Table.2). Calcium ion is necessary for proper mineralization of bones and bone strength. Deficiency in intake of calcium leads to eventual demineralization of bones for complementing the inadequate amounts of calcium in the body. Magnesium (Mg2+) concentration varies from 19 mg/L to 104 mg/L with mean values of 33.4 mg/L (Table.1) content calcium and magnesium impart the hardness in water and is not good for drinking purposes. (Table.2) The principal sources of magnesium in the natural waters are various kinds of rocks and sewage. Sodium (Na+) concentration in groundwater ranges from 14 to 99 mg/L with an average of 30.36 mg/L. According to (BIS,2003) and (WHO,1993) guidelines, the maximum admissible limit Na+ content is 200 mg/L. Sodium regulates blood pressure levels in the human body and increased levels of sodium in blood leads to rise in blood pressure. Potassium (K+) concentration in groundwater ranges from 0.4 to 2.5 mg/L with an average value of 0.76 mg/L.
International Journal of Recent Trends in Science And Technology, ISSN 2277-2812 E-ISSN 2249-8109, Volume 17, Issue 2, 2015 pp 69-75
International Journal of Recent Trends in Science And Technology, ISSN 2277-2812 E-ISSN 2249-8109, Volume 17, Issue 2, 2015 Page 72
Table1. Analytical data from the groundwater samples from the study area
Sample
No. Source pH
EC TDS Na+ K
+ Mg
2+ Ca
2+
Total
Hardness CO3
- HCO3
- SO4
2- Cl
- NO3
- F
-
(μS
cm-1
) (mg/L) (mg/L) (mg/L) (mg/L) (mg/L) (mg/L) (mg/L) (mg/L) mg/L) (mg/L) (mg/L) (mg/L)
1 2 3 4 5 6 7 8 9 10 11 12 13 14 15 16
1 DW 7.9 561 365 19 0.5 27 45 224 0 112 37 84 21 0.2
2 DW 7.4 866 563 28 0.7 34 51 268 0 116 43 126 28 0.5
3 DW 7.7 988 642 33 0.8 41 54 308 0 136 51 142 34 0.3
4 DW 7.1 1077 700 37 0.9 36 70 324 0 112 66 144 43 0.2
5 DW 8.2 3036 1973 99 2.5 104 142 788 0 224 151 382 77 0.8
6 DW 7.9 1174 763 36 1 43 115 468 0 192 78 212 8 1.5
7 DW 7.7 1255 816 41 1 38 138 504 0 208 82 184 86 0.4
8 BW 7.9 736 478 22 0.6 26 75 296 0 168 50 102 15 0.2
9 BW 7.9 736 478 25 0.6 26 75 296 0 168 50 102 15 0.2
10 BW 8 540 351 17 0.4 19 67 248 0 84 83 60 50 0.2
11 BW 7.8 1423 925 45 1.2 41 158 568 0 208 96 248 72 0.1
12 DW 7.9 557 362 17 0.5 24 51 228 0 128 40 84 1 0.2
13 DW 7.5 1115 725 37 0.9 41 70 348 0 144 62 164 15 0.5
14 DW 7.4 435 283 14 0.4 21 30 164 0 52 22 74 14 0.3
15 BW 7.8 565 367 19 0.5 28 45 228 0 104 40 90 11 0.1
16 DW 7.9 852 554 27 0.7 21 101 340 0 176 56 126 18 0.4
17 DW 8 930 605 31 0.8 27 104 372 0 128 65 170 29 0.7
18 DW 8.1 700 455 22 0.6 32 61 284 0 124 45 118 14 0.3
19 BW 7.9 1020 663 35 0.8 36 104 412 0 144 70 168 80 0.2
20 DW 7.7 855 556 27 0.7 38 74 344 0 164 57 122 40 0.1
21 DW 7.8 575 374 21 0.5 20 53 216 0 112 30 62 60 0.3
22 BW 7.8 670 436 24 0.5 31 58 272 0 88 154 64 12 0.6
23 DW 7.8 565 367 18 0.5 25 51 232 0 100 58 64 45 0.4
24 BW 7.5 1225 796 41 1 20 150 460 0 168 101 172 70 0.4
25 BW 7.5 777 505 24 0.6 36 77 340 0 180 50 102 60 0.4
Minimum 7.1 435 283 14 0.4 19 30 164 0 52 22 60 1 0.1
Maximum 8.2 3036 1973 99 2.5 104 158 788 0 224 154 382 86 1.5
Mean 7.764 929.32 604.08 30.36 0.768 33.4 80.76 341.28 0 141.6 65.48 134.64 36.72 0.38
The European Economic Community (EEC, 1880) has prescribed the level of potassium at 10 mg/L in drinking water. As per EEC criteria, all samples are within the guideline level of 10 mg/L (Table1). Potassium controls body balance and maintains normal growth of the human body. Deficiency of potassium might lead to weakness of muscles and rise in blood pressure (Das and Nag, 2015). The Chloride (Cl−) ion concentration varies between 60 to 382 mg/L with a mean value of 134.64 mg/L. Cl− content in all samples were does not exceed maximum permissible limit (Table.2). The desirable limit of Chloride (Cl−) for drinking water is specified by (BIS,2003) as 250 mg/L and a maximum permissible limit of 1000 mg/L. 96% samples are below the desirable limit and 4% samples exceeds desirable limit but within the maximum permissible limit (Table.2). The carbonate alkalinity (CO3
−) is not found in the study area, whereas bicarbonate alkalinity (HCO3
−) varies from 52 to 224 mg/L with an average value of 141.6 mg/L (Table 1).
Table 2: Assessment of groundwater quality for drinking purposes
Parameter >DL % >DL<MPL % >MPL %
EC 96 0 4
TDS 44 56 0
Ca2+
52 48 0
Mg2+
48 48 4
HCO3− 88 12 0
TH 48 48 4
Cl− 96 4 0
SO42−
100 0 0
NO3− 76 0 24
F− 96 4 0
DL- Desirable limit, MPL-Maximum permissible limit
The Sulphate (SO42−) values of groundwater range from
22 to 154 mg/L with an average value of 65.48 mg/L. The highest desirable of sulphate is 300 mg/L, indicating that all samples are within the maximum permissible limit prescribed by (BIS, 2003) (Table1) (Table 2). The nitrate (NO3
−) content in water samples of the study area varies from 1 to 86mg/L with an average value 36.72 mg/L (Table1), and 24% of samples crosses the maximum permissible limit prescribed by BIS (2003) and WHO (1993) (Table,2). The probably the cause for most of such

P V Kathane, K R Aher
Copyright © 2015, Statperson Publications, International Journal of Recent Trends in Science And Technology, ISSN 2277-2812 E-ISSN 2249-8109, Volume 17, Issue 2 2015
occurrences, which can be assigned fairly definitely to drainage of water through soil containing domestic wastes, vegetable and animal matter. The fluoride content in the groundwater varies from 0.1 to 1.5 mg/L with an average value of 0.38 mg/L (Table 1). The desirable limit of Fluoride (F-) for drinking water is specified by (BIS, 2003) as 1 mg/L and a maximum permissible limit of 1.5 mg/L. It is observed that all samples are within the maximum permissible limit Table2. Water quality for irrigation purposes To assess the overall agricultural water quality of the samples collected, water quality parameters have been considered; namely, Sodium Adsorption Ratio (SAR), Soluble Sodium Percentage (SSP), Permeability Index (PI), Residual Sodium Carbonate (RSC), Magnesium Adsorption Ratio and Kelly’s Ratio. Table 3 represents evaluated values of these parameters for all 25 sampling locations. Table 4 shows classification of samples according to standards specified for different water quality parameters. Sodium adsorption ratio (SAR) Sodium adsorption ratio (SAR) is significant factor for determining the suitability of ground water for agriculture because it is a measure of alkali hazard to crops (Richard, 1954). SAR is calculated using the following formula where the concentration of all ions is in meq L-l. Sodium adsorption ratio (SAR) = Na+/ ( √ Ca2++Mg2+)/2) SAR classified into four categories as S1 (SAR<10), S2 (10-18), S3 (18-26) and S4 (>26), and in present study all the samples fall in excellent (S1) category (Table 3and4), indicating that these groundwater sources are suitable for agricultural purpose. Soluble sodium percentage (SSP) Wilcox (1955) has proposed classification scheme for rating irrigation water for agricultural on the basis of soluble sodium percentage (SSP). The SSP was calculated by using following formula where the concentration of all ions is in meq L-l. Soluble sodium percentage (SSP) = Na++K+ / (Ca2++Mg2++ Na++K+) X100 in the present study SSP varies from 0.61 to 4.30 meq/L. The SSP < 60 represents safe water while it is unsafe if > 60. As per these criteria the groundwater is safe for agricultural use (Table 3 and 4). Residual sodium carbonate (RSC) The HCO3
- and CO3 – in the irrigation water tend to
precipitate calcium and magnesium ions in the soil resulting in an increase in the proportion of the sodium ions. The Residual sodium carbonate (RSC) was calculated by using following formula where the concentration of all ions is in meq L-l. Residual sodium carbonate (RSC) = (CO3
- + HCO3-) – (Ca2+ + Mg2+) Table
2 and 3 indicate that the calculated RSC dicating that in general groundwater is suitable for irrigation purposes. Permeability index (PI) The soil permeability is persuading by long term put into practice of groundwater for irrigation and supplementary reason. Calcium, magnesium bicarbonate and sodium, material of the groundwater are noteworthy donor which have an effect the soil permeability (Mohan et al, 2000;Aher, 2014). Permeability index is calculated by using the following formula: Permeability index (PI) = (Na+ + √ HCO3-) x 100/ Ca2++Mg2++ Na+ Where, all the values are in meq-1. The PI values >75 indicate excellent quality of water for irrigation. If the PI values fall in between 25 and 75, they indicate good quality of water for irrigation. However, if the PI values are <25, they reflect unsuitable nature of water for irrigation, indicating that all samples are suitable for irrigation.
Table 3: Water Quality Classification Based on Water Quality Index
Value
Sample
No. SAR RSC KR SSP PI MAR CR IWQI
1 0.55 -2.63 0.19 0.83 41.24 49.59 0.07 89.83
2 0.75 -3.44 0.23 1.22 39.61 52.22 0.10 90.69
3 0.82 -3.83 0.24 1.43 39.06 55.45 0.12 93.30
4 0.90 -4.61 0.25 1.61 36.77 45.74 0.12 80.78
5 1.54 -11.95 0.28 4.30 31.21 54.56 0.31 80.25
6 0.73 -6.13 0.17 1.57 30.81 38.00 0.17 65.32
7 0.80 -6.60 0.18 1.78 30.76 31.10 0.15 58.17
8 0.56 -3.13 0.16 0.96 38.26 36.24 0.08 73.13
9 0.63 -3.13 0.18 1.09 39.42 36.24 0.08 74.52
10 0.47 -3.53 0.15 0.74 33.87 31.74 0.06 63.50
11 0.82 -7.85 0.17 1.96 28.77 29.84 0.20 53.93
12 0.49 -2.42 0.16 0.74 41.62 43.55 0.07 84.22
13 0.87 -4.50 0.23 1.61 37.14 48.98 0.14 84.47
14 0.48 -2.37 0.19 0.61 40.00 53.44 0.06 92.41
15 0.55 -2.84 0.18 0.83 39.69 50.50 0.08 88.98
16 0.64 -3.89 0.17 1.17 36.15 25.42 0.10 59.78
17 0.70 -5.31 0.18 1.35 31.92 29.85 0.14 58.83
18 0.57 -3.64 0.17 0.96 35.93 46.24 0.10 80.32
19 0.75 -5.79 0.19 1.52 31.62 36.20 0.14 64.63
20 0.64 -4.13 0.17 1.17 35.22 45.71 0.10 78.88
21 0.62 -2.45 0.21 0.91 43.60 38.22 0.05 81.16
22 0.63 -4.00 0.19 1.04 34.61 46.70 0.07 79.26
23 0.52 -2.96 0.17 0.78 38.33 44.56 0.06 81.46
24 0.83 -6.39 0.20 1.78 31.52 17.94 0.14 46.02
25 0.57 -3.85 0.15 1.04 35.20 43.39 0.08 76.59
Minimum 0.47 -11.95 0.15 0.61 28.77 17.94 0.05 46.02
Maximum 1.54 -2.37 0.28 4.30 43.60 55.45 0.31 93.30
Mean 0.70 -4.45 0.19 1.32 36.09 41.26 0.11 75.22
Magnesium adsorption ratio (MAR) Szobolces and Darab (1968), had given the equation to calculate Magnesium adsorption ratio (MAR) is as follows, Magnesium adsorption ratio (MAR) = Mg2+X

International Journal of Recent Trends in Science And Technology, ISSN 2277-2812 E-ISSN 2249-8109, Volume 17, Issue 2, 2015 pp 69-75
International Journal of Recent Trends in Science And Technology, ISSN 2277-2812 E-ISSN 2249-8109, Volume 17, Issue 2, 2015 Page 74
100/ Ca2++Mg2+ MAR ratio of the groundwater varied from 17.94 to 55.45, with mean of 41.26 meq L-l.(Table-3). High MAR affects the soil unfavourably, a harmful effect on soils (Shirazi et al, 2011; Aher et al, 2015) appear when MAR exceeds 50. In the present study, most of the samples (80%) had MAR less than 50 which would cause no harm to soil and the rest were above 20 which might cause harm to soil.
Table 4: Classification of groundwater on the basis of SAR, SSP, KI
and RSC.
Parameter Range Water Class No. of
Samples
Samples in
(%)
SAR
<10 Excellent (S1) 25 100
10-18 Good (S2) - -
18-26 Doubtful (S3) - -
>26 Unsuitable (S4) - -
RSC
<1.25 Good 25 100
1.25-2.50 Doubtful - -
>2.5 Unsuitable - -
SSP <60 Good 25 100
>60 Bad - -
KR <1 Suitable 25 100
>1 Unsuitable - -
Kelly’s ratio (KR) Kelly’s ratio or Kelly’s index was calculated by using the following expression Kelley index (KI) = a+/(Ca2++Mg2+) Where, concentrations are expressed in meq L-1. The Kelly’s ratio or Kelly’s index of unity or less than one is indicative of good quality of water for irrigation where as above one is suggestive of unsuitability for agricultural purpose due to alkali hazards (Karanth, 1987). Kelly’s index the groundwater varied from 0.15 to 0.28, with mean of 0.19 meq L-l indicating that all samples are good for irrigation or agricultural use.
Corrosively ratio index (CRI) The degree of the corrosiveness of groundwater know how to be assessed by using a perimeter known as corrosively ratio (CR) or corrositivity ratio Index (CRI), which can be determined by using the following formula.CR= [(Cl/25.5+2SO4)/ 2(CO2+(HCO3/100 ) ] The water having the corrositivity ratio less than one is safe and non corrosive. Corrositivity ratio greater than two is suggestive of corrosiveness, and all samples are safe Table.3. In order to assess the irrigation groundwater quality in the study area, an attempt has been made to develop a model on Irrigation Water Quality Index (IWQI), (Anbazaghan, 2014; shashi et al, 2015). The assorted irrigation groundwater quality indices for instance SAR, SSP, RSC, PI, and KR are considered to assess the groundwater quality for irrigation. The indices value summed, then classified into excellent to unfit groundwater quality (Table,5) As per Irrigation Water Quality Index (IWQI) all samples falls in excellent to good quality of water and are sustainable for irrigation.
Table 5: Groundwater quality classification based on WQI Value
Groundwater
Value Range
Groundwater
quality
No.of Samples
(IWQA)
Percentages
(%) Sustainable state
<50 Excellent 1 4 Sustainable
51-100 Good 24 96 Sustainable
101-200 Poor Nil Nil Slightly unsustainable
201-300 Very poor Nil Nil Unsustainable
>300 Very bad Nil Nil Highly unsustainable
CONCLUSION The groundwater quality of PTW-1 watershed has been assessed for its agricultural and domestic suitability purposes. The pH of water, both indicates that groundwater in the area is of alkaline nature. The electrical conductivity, total dissolved solids, calcium, magnesium, bicarbonate, chloride, sulphate, and fluoride of groundwater samples are all found to be within acceptable limits. The total hardness (4%) and nitrate (24%) of samples are exceeding maximum permissible limit indicating not suitability for their drinking uses. Due to this quality deterioration of some locations, an
immediate attestation requires for sustainable development. Based on the water quality parameters analyzed like SAR, SSP, MAR, PI and KR, the groundwater samples are suitable for agricultural use. The results have shown that the groundwater of study area has been in excellent to good in IWQI. Overall quality of PTW-1 watershed is suitable for agricultural uses.
ACKNOWLEDGEMENT The authors thankful to Director, Groundwater survey and Development Agency to providing necessary facility for conducting this research work.
P V Kathane, K R Aher
Copyright © 2015, Statperson Publications, International Journal of Recent Trends in Science And Technology, ISSN 2277-2812 E-ISSN 2249-8109, Volume 17, Issue 2 2015
REFERENCES 1. Aher K.R.and Deshpande S. M., Hydrogeochemical
characteristics and assessment of water quality in Dheku basin, Aurangabad, India, Journal of Applied Geochemistry, 2015; 17 (1) No. 1: 41-49.
2. Aher, K.R. Patil, S.M. and Mane, V.P., Preliminary study in Irrigational quality of Groundwater sources in parts of Soygaon block, District Aurangabad, India, International Research Journal of Earth Sciences, 2015; 3(2):7-12,
3. Aher, K.R., Geochemistry of Groundwater in Basaltic aquifer of Phulambri taluka, District Aurangabad, India, Res. J. Chem. Sci., Volume 1, Special issue of NCCICR-2014, 1-124,
4. Anbazhagan, S., Das, M.K., Balamurugan, G., Hydro geo-chemical studies in hard rock aquifer system, Hosur, India. Indian Journal of Geochemistry, 2014; 22 (2): 519-535
5. APHA, Standard methods for the examination of water and wastewater (20ndEd.). Washington D.C.: American Public and Health Association. 2002: 6-187.
6. BIS, Bureau of Indian Standards Specification for drinking water. IS: 10500:91. Revised 2003, Bureau of Indian Standards, New Delhi, 2003.
7. CGWB., Ground water information Buldhana district Maharashtra, ministry of water resources Central Ground Water Board, Central Region Nagpur, Government of India, Technival Report,2007; 1565/OTH/2007,pp1-25.
8. Das Shreya and Nag S K., Deciphering groundwater quality for irrigation and domestic purposes – a case study in Suri I and II blocks, Birbhum District, West Bengal, India, J. Earth Syst. Sci.,2015;124 (5):965–992.
9. Deshpande S.M.and Aher K.R., Quality of Groundwater from Tribakeswar-Peth area of Nashik District and its Suitability for Domestic and Irrigation Purpose, Gond. Geol. Mag., 2011; 26 (2):157-162.
10. Frengstad, B., Banks, D., and Siewers, U., The chemistry of Norwegian groundwater: IV. The pH dependence of element concentrations in crystalline bedrock groundwaters. Science of the Total Environment, 2001; 227, 101–117.
11. Hem, J. D., Study and interpretation of the chemical characteristics of natural waters (263). USGS Water Survey Paper, 1991; 2254.
12. Karanth, K. R., Groundwater assessment, development and management, Tata-McGraw Hill Publishing Company Limited, New Delhi, 1987.
13. Kathane, P.V., Patil S.M. and Aher, K.R., A statistical analysis of static water level trend and rainfall data in PTW-1 watershed, Buldhana district India. Int. J. Recent Trends Sci. Technol., 2015; 13: 519-525.
14. Milovanovic M., Water quality assessment and determination of pollution sources along the Axios/Vardar River, southeast Europe; Desalination, 2007; 213 159–173.
15. Mohan R., Singh A.K., Tripathi J.K. and Choudhry G.C., Hydrochemistry and quality assessment of groundwater in Naini industrial area Allahabad District, Uttar Pradesh. Journal of the Geological Society of India, 2000; 55:77–89.
16. Richards, L.A. Diagnosis and improvement of saline and alkali soils. Agri. Handbook 60, U.S. Dept of Agriculture, Washington. D.C., 1954; 160.
17. Shashi Kant., Singh, Y. V., Jat, L. K., Meena, R., and Singh, S. N., Assessment of ground water quality of lahar block, Bhind district in Madhya Pradesh. International Journal of Advanced Geosciences, 2015; 3(2):38-41.
18. Subba Rao, N., John Devadas, D., and Srinivasa Rao, K. V., Interpretation of groundwater quality using principal component analysis from Ananthapur district, Andhra Pradesh, India. Environmental Geosciences, 2006; 13:1–21.
19. Szobolces I and Darab K., In Irrigation, Drainage and Salinity, Int. Source Book, Hutchinson and Co., London,1968: 510.
20. WHO. Guidelines to drinking water quality. World Health Organization, Geneva, 1993; 2:989.
21. Wilcox, L.V., Classification and use of irrigation waters, US Dept of Agriculture Cir, Washington DC, 1955: 969.
Source of Support: None Declared
Conflict of Interest: None Declared