Deciphering India's Demographic Puzzle
6
Page 1 of 6 STRATEGIC MANAGEMENT GROUP STRATEGIC MANAGEMENT GROUP Deciphering India’s Demographic Puzzle: A Consumer & Retail Perspec tive The projected shift in age groups, emergence of large distinct income groups, increasing relevance of urban India and growing share of large cities within urban India are important triggers for companies in consumer facing industries to revisit their strategies, else risk being caught off guard, say Pankaj Gupta, Practice Head - Consumer & Retail and Rajiv Subramanian of Tata Strategic Management Group. Between 2006 and 2016, India’s increase in population is expected to be 157 Mn, which is a little greater than the current population of Russia. Within this addition, demographic shifts like a larger working population, increasing urbanization and a burgeoning middle class have been topics of extensive discussion. However, certain other trends like the decrease in the <14 years age group, increase in >60 years age group, greater concentration of urban India and rapid increase in the number of high income households may have been overlooked. These trends could be crucial for companies in the consumer centric products and services domain in identifying future opportunities and threats. India’s Changing Age Mix Projections indicate a 35 Mn increase in the old age population (>60 years) between 2006 and 2016. This is facilitated by the anticipated improvement in the life expectancy levels from 68.1 in 2006 to 71.1 in 2016. States like Tamil Nadu, Andhra Pradesh, West Bengal, Maharashtra and Uttar Pradesh are the m ajor contributors of this addition. • 118 Mn old age population (>60 years) by 2016 • 17 Mn reduction in the <14 years age population • U.P, Maharashtra, Bihar, Rajasthan and M.P contribute to >50% of the addition in working age(15-59 years) population <14 years 27% 15-59 years 64% >60 years 9% >60 years 8% <14 years 32% 15-59 years 60% 2006 2016 Table 2: Shifting Age Mix Proportion (Percentage) 669 811 83 118 ~356 ~340 2006 2016 Table 1:Shiftin g Age Mix (Mn Persons) <14 years 15-59 years >60 years 1108 1269 Source: Population Projections 2001-2026 (Census Commissioner), Analysis by Tata Strategic <14 years 27% 15-59 years 64% >60 years 9% >60 years 8% <14 years 32% 15-59 years 60% 2006 2016 Table 2: Shifting Age Mix Proportion (Percentage) 669 811 83 118 ~356 ~340 2006 2016 Table 1:Shiftin g Age Mix (Mn Persons) <14 years 15-59 years >60 years 1108 1269 <14 years 27% 15-59 years 64% >60 years 9% >60 years 8% <14 years 32% 15-59 years 60% 2006 2016 Table 2: Shifting Age Mix Proportion (Percentage) 669 811 83 118 ~356 ~340 2006 2016 Table 1:Shiftin g Age Mix (Mn Persons) <14 years 15-59 years >60 years 1108 1269 Source: Population Projections 2001-2026 (Census Commissioner), Analysis by Tata Strategic
Transcript of Deciphering India's Demographic Puzzle
8/8/2019 Deciphering India's Demographic Puzzle
http://slidepdf.com/reader/full/deciphering-indias-demographic-puzzle 1/6
Page 1 of 6
STRATEGIC MANAGEMENT GROUPSTRATEGIC MANAGEMENT GROUP
Deciphering India’s Demographic Puzzle: A Consumer & Retail Perspective
The projected shift in age groups, emergence of large distinct income groups, increasing
relevance of urban India and growing share of large cities within urban India areimportant triggers for companies in consumer facing industries to revisit their strategies,
else risk being caught off guard, say Pankaj Gupta, Practice Head - Consumer & Retail
and Rajiv Subramanian of Tata Strategic Management Group. Between 2006 and 2016, India’s increase in population is expected to be 157 Mn, which
is a little greater than the current population of Russia. Within this addition, demographic
shifts like a larger working population, increasing urbanization and a burgeoning middle
class have been topics of extensive discussion. However, certain other trends like the
decrease in the <14 years age group, increase in >60 years age group, greater
concentration of urban India and rapid increase in the number of high income
households may have been overlooked. These trends could be crucial for companies in
the consumer centric products and services domain in identifying future opportunities
and threats.
India’s Changing Age Mix
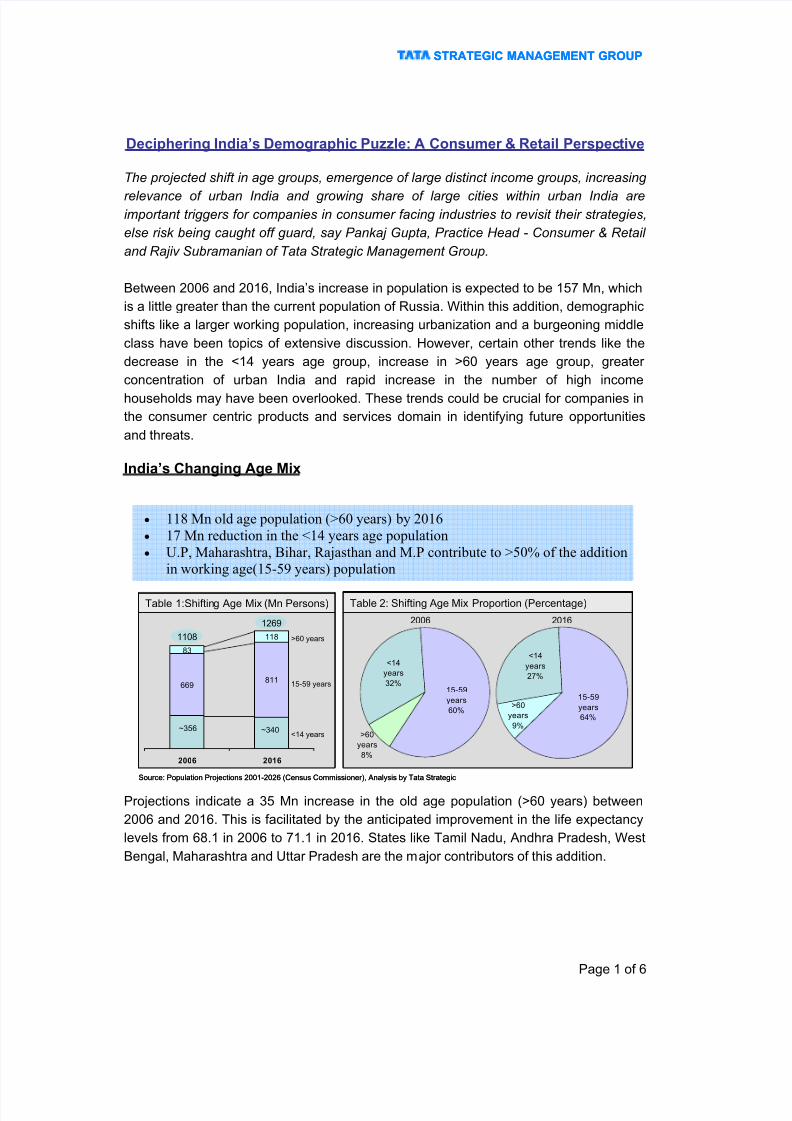
Projections indicate a 35 Mn increase in the old age population (>60 years) between
2006 and 2016. This is facilitated by the anticipated improvement in the life expectancy
levels from 68.1 in 2006 to 71.1 in 2016. States like Tamil Nadu, Andhra Pradesh, West
Bengal, Maharashtra and Uttar Pradesh are the major contributors of this addition.
• 118 Mn old age population (>60 years) by 2016
• 17 Mn reduction in the <14 years age population
• U.P, Maharashtra, Bihar, Rajasthan and M.P contribute to >50% of the addition
in working age(15-59 years) population
<14
years
27%
15-59
years
64%
>60
years
9%>60
years
8%
<14
years
32%15-59
years
60%
2006 2016
Table 2: Shifting Age Mix Proportion (Percentage)
669811
83
118
~356 ~340
2006 2016
Table 1:Shifting Age Mix (Mn Persons)
<14 years
15-59 years
>60 years1108
1269
Source: Population Projections 2001-2026 (Census Commissioner), Analysis by Tata Strategic
<14
years
27%
15-59
years
64%
>60
years
9%>60
years
8%
<14
years
32%15-59
years
60%
2006 2016
Table 2: Shifting Age Mix Proportion (Percentage)
669811
83
118
~356 ~340
2006 2016
Table 1:Shifting Age Mix (Mn Persons)
<14 years
15-59 years
>60 years1108
1269
<14
years
27%
15-59
years
64%
>60
years
9%>60
years
8%
<14
years
32%15-59
years
60%
2006 2016
Table 2: Shifting Age Mix Proportion (Percentage)
669811
83
118
~356 ~340
2006 2016
Table 1:Shifting Age Mix (Mn Persons)
<14 years
15-59 years
>60 years1108
1269
Source: Population Projections 2001-2026 (Census Commissioner), Analysis by Tata Strategic

8/8/2019 Deciphering India's Demographic Puzzle
http://slidepdf.com/reader/full/deciphering-indias-demographic-puzzle 2/6
Page 2 of 6
STRATEGIC MANAGEMENT GROUPSTRATEGIC MANAGEMENT GROUP
In the 0-14 years age group, a 17 Mn population reduction is expected in the 2006-16
period (Table 1), of which the 10-14 years age group will be the major contributor. This
trend is expected across all states with the exception of Uttar Pradesh and Delhi.
The projected increase in working age population (15-59 years) has been repeatedly
cited as the foundation for India’s future positive economic direction. Uttar Pradesh,
Maharashtra, Bihar, Madhya Pradesh and Rajasthan are expected to contribute more
than 50% of the 142 Mn increase in the labor pool between 2006 and 2016.
Emergence of Large, Distinct Consumer Income Segments
Between 2005-06 and 2013-14, the number of households with annual income greater
than Rs 12 Lakh (USD 30,000) will grow nearly four fold. Within this band, there are 3.4
Mn households with an income in excess of Rs 24 Lakh (~USD 60,000) at 2005-06
prices. This segment is likely to include more than 15 Mn people, greater than the
population of Denmark, Finland and Ireland put together.
By 2014, the middle-high income band will consist of a substantial 11 Mn households. At
a median income of USD 22500, this segment represents a total income pool of nearly
USD 250 Bn. With spending patterns similar to the high income group; this segment
represents a very significant chunk of the consuming base.
• Four fold increase in households with annual income >Rs 12 Lakhs
• 3.4 Mn households in the highest annual income band (>Rs 24 Lakhs)
• 4 Mn reduction in low income households (Annual income< Rs 2.4 Lakhs)
2005-06 2013-14E
No of Households in Mn (2005-06 Prices)
Annual Income
>24 (>60)
12-24 ( 30-60)
6-12 (15-30)
2.4-6 (6-15)
<2.4 (<6)
Total
High
Middle High
Low
Income Level
Table 3: Income Pyramid
Middle Low
Rs. Lakhs
(USD ‘000s)
185.5
1.13.2
13.8
1.1
~205
181.3
4.9
11.4
35.4
3.4
~237
Source: NCAER, Tata Strategic
2005-06 2013-14E
No of Households in Mn (2005-06 Prices)
Annual Income
>24 (>60)
12-24 ( 30-60)
6-12 (15-30)
2.4-6 (6-15)
<2.4 (<6)
Total
High
Middle High
Low
Income Level
Table 3: Income Pyramid
Middle Low
Rs. Lakhs
(USD ‘000s)
185.5
1.13.2
13.8
1.1
~205
181.3
4.9
11.4
35.4
3.4
~237
2005-06 2013-14E
No of Households in Mn (2005-06 Prices)
Annual Income
>24 (>60)
12-24 ( 30-60)
6-12 (15-30)
2.4-6 (6-15)
<2.4 (<6)
Total
High
Middle High
Low
Income Level
Table 3: Income Pyramid
Middle Low
Rs. Lakhs
(USD ‘000s)
185.5
1.13.2
13.8
1.1
~205
181.3
4.9
11.4
35.4
3.4
~237
Source: NCAER, Tata Strategic

8/8/2019 Deciphering India's Demographic Puzzle
http://slidepdf.com/reader/full/deciphering-indias-demographic-puzzle 3/6
Page 3 of 6
STRATEGIC MANAGEMENT GROUPSTRATEGIC MANAGEMENT GROUP
A positive trend is seen in the middle-low band as well, where the number of households
is likely to increase from ~14 Mn in 2006 to over 35 Mn in 2014. While low income
households will remain the largest segment, their numbers are expected to decrease byabout 4 Mn (0.3% CAGR) in the same period. While these households are largely rural,
a substantial portion would be in urban India as well.
Increasing Relevance of Urban India
While public memory is constantly refreshed that India lives in villages, with urbanization
levels slated to cross 31% by 2016, the urban population will be ~400 Mn. Tamil Nadu
and Maharashtra with a population of 63 and 81 Mn respectively in 2001 are expected to
cross the 50% urbanization mark in 2007 and 2020 respectively.
• Urban population in India ~400 Mn (2016)
• Highly urbanized states have higher incomes and urbanize faster
• 75 cities with population greater than one million will contribute ~63% of India’s
urban population (2026)
• Urban NDP to contribute 61% of total NDP (2011)
Source: Population Projections 2001-2026 (Census Commissioner), Analysis by Tata Strategic
2001 2016
Urbanized population as % of total population
0-20%
Low
> 35%
High
20%-35%
Medium
Tamil Nadu, Karnataka
Maharashtra, Gujarat
Haryana, Punjab, Delhi
Table 3: Changing Urbanization Map Of India
Source: Population Projections 2001-2026 (Census Commissioner), Analysis by Tata Strategic
2001 2016
Urbanized population as % of total population
0-20%
Low
> 35%
High
20%-35%
Medium
Tamil Nadu, Karnataka
Maharashtra, Gujarat
Haryana, Punjab, Delhi
Table 3: Changing Urbanization Map Of India

8/8/2019 Deciphering India's Demographic Puzzle
http://slidepdf.com/reader/full/deciphering-indias-demographic-puzzle 4/6
Page 4 of 6
STRATEGIC MANAGEMENT GROUPSTRATEGIC MANAGEMENT GROUP
Urbanization trends across geographies indicate that states with high urbanization have
higher income levels and tend to urbanize faster than others. Thus, current high income-
high urbanization states like Delhi, Tamil Nadu, Karnataka, Punjab, Haryana,
Maharashtra and Gujarat assume greater importance for marketers in future (Table 5).
By 2026, the number of million plus cities is expected to increase from a current 35 to
75. The contribution of these 75 cities to the total urban population is likely to go up from
48% in 2001 to ~63% in 2026. Most likely their contribution to the total urban spend
would be much higher resulting in higher concentration of spending power.
Expected change in urbanization % (2001-2026)
Source: Population Projections 2001-2026 (Census Commissioner), Analysis by Tata Strategic
Bihar
AP
HP
Orissa
Uttaranchal
Gujarat
Chhattisgarh
Karnataka Punjab
Haryana
A&N Isl.
Nagaland
West Bengal
Rajasthan
Jharkhand
Meghalaya
UP
MP
J & K
INDIA
Assam
Sikkim
0%
5%
10%
15%
20%
25%
30%
35%
40%
0% 2% 4% 6% 8% 10% 12% 14% 16% 18% 20%
100%
100%
Delhi
Note: (Urbanization: Expected change in urbanization) Manipur-26.7%:-2.4% Lakshwadeep-42..7%:-23.6% Daman & Diu-33.8:-18.3%
Tamil NaduMaharashtra
Kerala
U r b a n i z a t i o n % ( 2
0 0 1 )
Table 5: Current vs Projected Urbanization
46
52
57
61
1993-94 1999-00 2004-05 2010-11 U r b a n N D P a s % o f
T o t a l N D P
50%
Table 7:Ratio of Urban to Rural NDP
2.38
2.84
3.333.65
1993-94 1999-00 2004-05 2010-11
U r b a n t o R u r a l
P C I R a t i o
Table 6:Ratio of Urban to Rural PCI
Source: Analysis by Tata Strategic
46
52
57
61
1993-94 1999-00 2004-05 2010-11 U r b a n N D P a s % o f
T o t a l N D P
50%
Table 7:Ratio of Urban to Rural NDP
2.38
2.84
3.333.65
1993-94 1999-00 2004-05 2010-11
U r b a n t o R u r a l
P C I R a t i o
Table 6:Ratio of Urban to Rural PCI
46
52
57
61
1993-94 1999-00 2004-05 2010-11 U r b a n N D P a s % o f
T o t a l N D P
50%
46
52
57
61
1993-94 1999-00 2004-05 2010-11 U r b a n N D P a s % o f
T o t a l N D P
50%
Table 7:Ratio of Urban to Rural NDP
2.38
2.84
3.333.65
1993-94 1999-00 2004-05 2010-11
U r b a n t o R u r a l
P C I R a t i o
Table 6:Ratio of Urban to Rural PCI
Source: Analysis by Tata Strategic

8/8/2019 Deciphering India's Demographic Puzzle
http://slidepdf.com/reader/full/deciphering-indias-demographic-puzzle 5/6
Page 5 of 6
STRATEGIC MANAGEMENT GROUPSTRATEGIC MANAGEMENT GROUP
Incomes are slated to increase faster in urban India than in rural India. The ratio of per
capita incomes in urban to rural India is expected to go up from 3.3 in 2004-05 to 3.7 in
2010-11 (Table 6). Expectedly, share of urban India in the country’s net domesticproduct would go up from 52% in 2000 to over 60% in 2011 (Table 7).
Increasing Marginal Utility Of Time
Lack of time is fast becoming the basis for many consumer preferences in urban India.Smaller trends listed below are contributory factors to this shift in consumer behaviour.
Indians have been typically referred to as hard workers. This perception has been
strengthened by a recent study which revealed that Indian business leaders typically put
in the maximum number of working hours (57 hours) per week as compared to their
counterparts from 31 other countries.
The non-working time available to an urban Indian has been gradually eroded by the
increased travel time caused by the increase in traffic on the roads. Sales of two
wheelers and passenger cars put together have increased from 42 Lakhs in 2000-01 to
~70 Lakhs in 2004. With a less than proportionate increase in the length of roads, trafficon the road is bound to go up resulting in increased travel times.
Indian women traditionally stayed back at home to look after the kitchen and the
household. There has been a gradual but steady increase in the working urban women
in India. This has led to an increased realization of lack of time in double income
households in urban India. This need is more likely to be felt in the southern states of
Andhra Pradesh, Kerala, Karnataka and Tamil Nadu which have a higher urban working
women proportion of 16% as against a national average of less than 12%.
These factors contribute to the increase in marginal utility of time in urban India with
lesser number of hours available for the same or more number of tasks.
• Lack of time is increasingly shaping consumer preferences in urban India
• Rise in urban working women has amplified the trend

8/8/2019 Deciphering India's Demographic Puzzle
http://slidepdf.com/reader/full/deciphering-indias-demographic-puzzle 6/6
Page 6 of 6
STRATEGIC MANAGEMENT GROUPSTRATEGIC MANAGEMENT GROUP
Implications
To understand the implications of the above discussed trends, let us analyze their broad
impact on the food sector. While the projected economic prosperity is likely to reduce
share of food in overall consumption expenditure, processed food will take a bigger
share within the food pie. The increase in the population of the 15-59 years age group
will aid this shift towards processed food with increasing demand for convenience from
this consumer set.
While health and wellness food segments are likely gainers from the increase in the old
age segment, a projected decrease in the <14 years population might hinder the growth
story of companies in children focused food categories.
With distinct income groups emerging, companies will need to look at a differentiated
portfolio in order to leverage the increase in willingness to pay. The need for
differentiation can be better understood by taking the case of the drinking water
category. Some of the possible product offerings are tap water, bottled tap water,
mineral water, sparkling mineral water and enhanced water. While tap water satisfies the
basic need at the bottom of the income pyramid, enhanced water which is expensive
would be an apt offering for the sizeable high income group in India.
Also, companies might need to review their route-to-market to maximize efficiencies
while targeting these different income groups. For example, traditional retail outlets
catering to predominantly high income and low income households may require different
‘Route-To-Market’ approaches by companies.
With Indians expected to become ‘Time Poor–Money Rich’, product segments
answering the need for convenience are likely to exhibit higher growth. Urban India is
likely to spearhead these demand shifts with faster growing incomes and favourable
consumer preferences.
Throughout the 90s and the early part of this decade, marketers were taught that the key
to growth lay in increasing rural penetration. However, with greater urbanization and
faster increase in urban incomes, the urban consumer is gradually regaining centre
stage.
With such fundamental shifts taking place in their consumer base, companies in sectors
like food, financial products, healthcare, consumer durables, personal care, household
products and apparel need to revisit their strategies, else risk being caught off guard.
______________________________________________________________________
Tata Strategic Management Group. No part of it may be circulated or reproduced for distribution without prior written
approval from Tata Strategic Management Group.