Legal Regime and Business's Organizational Choice: A Comparison

Discussion Paper SeriesB No. 38
Organizational Innovation and KnowledgeUse Practice: Cross-Country Comparison(Hungarian versus Slovak Business Service Sector)
Interim Report of the Hungary-Japan Joint Research Project
"Multinationals and Local Resources"
Csaba Makó, Péter Csizmadia, Miklós IlléssyInstitute of Sociology
Hungarian Academy of Sciences (HAS), Budapest&
Ichiro IwasakiInstitute of Economic Research
Hitotsubashi University, Tokyo, Japan&
Miklós SzanyiInstitute for World Economics, HAS, Budapest
January 2011
INSTITUTE OF ECONOMIC RESEARCH HITOTSUBASHI UNIVERSITY
IER Discussion Paper Series (B)
Organizational Innovation and Knowledge Use Practice: Cross-Country Comparison (Hungarian versus Slovak Business Service Sector)
Interim Report of the Hungary-Japan Joint Research Project
“Multinationals and Local Resources”
Csaba Makó, Péter Csizmadia, Miklós Illéssy Institute of Sociology
Hungarian Academy of Sciences (HAS), Budapest &
Ichiro Iwasaki Institute of Economic Research
Hitotsubashi University, Tokyo, Japan &
Miklós Szanyi Institute for World Economics, HAS, Budapest
Institute of Economic Research Hitotsubashi University
Tokyo, Japan January 2011

ii
Institute of Economic Research, Hitotsubashi University Naka 2-1, Kunitachi City, Tokyo 186-8603, JAPAN
http://www.ier.hit-u.ac.jp
Copyright © 2011 by the Institute of Economic Research All rights reserved
Printed in Tokyo, Japan

iii
Contents
Acknowledgments .................................................................................... v Notes on the Authors .............................................................................. vi List of Abbreviations ............................................................................. viii Executive Summary ................................................................................. ix Foreword: Historical shift in economic structure and growing importance of the services ........................................................................................ 1
i. Great challenges in services .............................................................. 1 ii. Heterogeneous character of services and innovation ........................ 5 Traditional services .............................................................................. 6 System firms ........................................................................................ 8 iii. A brief overview on the distribution of learning/innovative organization in Europe ....................................................................... 11 iv. Share and Changes in the KIBS Sector Employment in Europe: Special Focus on Hungary and Slovakia .............................................. 15
1. Research design, sampling, and research method ............................. 25 1.1. Need to better understand innovation in the KIBS sector ............. 25 1.2. Sample of the company survey and sampling method ................. 27 1.3. Structure of the questionnaire and characteristics of the data Collection .......................................................................................... 30
2. Organizational architecture, management, and business practice transfer ................................................................................................. 34
2.1. Ownership, size, market structure, and source of the firm’s competitiveness ................................................................................. 34
2.1.1. Incorporation and ownership structure of surveyed firms ..... 34 2.1.2. Size and Organizational Architecture of Firms: Dominance of Small and Flat Organizations .......................................................... 37 2.1.3. Market structure: The Slovak KIBS firms are more involved in the Global Value Chain (GVC) .......................................................... 39 2.1.4. Source of the firms’ competitiveness: reliability, quality, and flexibility with slight country variation ............................................ 40

iv
2.2. Composition of company management and transferring business practices ............................................................................................ 41
2.2.1. Dominance of local managers with visible country differences. Expatriates in high value-added business functions ....................... 41 2.2.2. Hybridization as a common pattern in transferring business practices ......................................................................................... 42
3. Diffusion and drivers of organizational innovation and the ICT use ... 47 3.1. Developing typology of organizational innovation: A brief theoretical overview ........................................................................... 47 3.2. Diffusion and drivers of organizational innovation ...................... 51
4. Skill requirements and knowledge development practice in the firm . 63 4.1. Differences in skill development and the key role of experience-based learning ................................................................................... 63 4.2. Company training practice: more training and stronger reliance on the external knowledge sources in Slovakia than Hungary ............ 66
References ............................................................................................ 73 Appendix 1. .......................................................................................... 77 Appendix 2. .......................................................................................... 79 Appendix 3. .......................................................................................... 80 Appendix 4. .......................................................................................... 81 Appendix 5. .......................................................................................... 82 Appendix 6. .......................................................................................... 83 Appendix 7. .......................................................................................... 84 Appendix 8. .......................................................................................... 85 Appendix 9. Survey questionnaire in English ......................................... 86 Appendix 10. Survey questionnaire in Slovak ...................................... 121 Appendix 11. Survey questionnaire in Hungarian ................................ 140 Appendix 12. Cross tables .................................................................. 157

v
Acknowledgments
In this book we present the interim report of a Hungary-Japan joint research project titled “Multinationals and Local Resources” launched by the Institute of Economic Research, Hitotsubashi University, the Institute of Sociology, Hungarian Academy of Sciences (HAS), and the Institute for World Economics, HAS. The project was financially supported by a grant-in-aid for scientific research from the Ministry of Education and Sciences in Japan (No. 19402023), the Nomura Foundation for Academic Promotion, the Tokyo Maritime Kagami Memorial Foundation, and the Hungarian Academy of Sciences. The authors also thank Tomoko Habu and Jim Treadway for their assistance with the publication of this book.

vi
Notes on the Authors
PÉTER CSIZMADIA is a researcher at the Institute of Sociology of the Hungarian Academy of Sciences. In the last few years he has been participated in several international research projects. His research activities focus on various aspects of workplace innovations, organisational learning and knowledge-intensive business services.
MIKLÓS ILLÉSSY is a researcher at the Institute of Sociology of the Hungarian Academy of Sciences. In the last few years he has been participated in several international research projects. His research activities focus on organisational innovation, flexicurity and knowledge-intensive business services.
ICHIRO IWASAKI is a professor of economics at Institute of Economic Research, Hitotsubashi University. He received his doctoral degree in economics at Hitotsubashi University in 2001. His research interests are focused upon transition economies, comparative economic systems, and financial and organizational economics. He is the author and editor of numerous books and international journal articles, including: Comparative Economic Analysis: Transition to a Market Economy and the Role of the State, published by the Minerva Press (Kyoto, Japan, 2010); and Organization and Development of Russian Business: A Firm-level Analysis (co-edited with Tatiana G. Dolgopyatova and Andrei A. Yakovlev), published by Palgrave Macmillan (Basingstoke, UK, 2009).
MAKÓ CSABA is specialized in organizational changes (innovations), in learning organizations and in their institutional (e.g. labour relations system) contexts in an international perspective. He is a research director at the Institute of Sociology of the Hungarian Academy of Sciences and is involved in numerous national and international projects (e.g. “Work Organization and Restructuring the Knowledge Society” 2005-2009,

vii
“Measuring the Dynamics of Organization and Work” (MEADOW 2007-2010). He is also a professor and Director at the PhD School, Debrecen University - Faculty of Economics and Business Administration. Major recent publications: Changes in Work in Transformation Economies’ (The Case of the New Member States), (2009), Leuven: Catholique University Leuvan – Institute for Advanced Labour Studies (HIVA) (Co-authors: Illéssy, M., Csizmadia, P., Kirov, V., Galev, T.), Work and Employee Representation, Tokyo: Chuo University, (2006) (Co-authors: Ishikawa, A., Warhurst, Ch.).
MIKLÓS SZANYI is a research adviser of the Institute of World Economy of the Hungarian Academy of Sciences, and a professor of the University of Debrecen. His main research interest is comparative analysis of market economic institutions of transition economies as well as corporate performance and the role of multinational corporate networks int he modernization process of these countries. He is author of two books, several book chapters and over 150 scientific publications in leading Hungarian and foreign journals.

viii
List of Abbreviations
BPO Business Process Outsourcing
CEE Central and Eastern European Countries
EIS European Innovation Scoreboard
EWCS European Working Condition Survey
HRM Human resources management
GDP Gross Domestic Product
GVC Global Value Chain
ICT Information and Communication Technology
KIS Knowledge-Intensive Services
KIBS Knowledge-Intensive Business Service
KIHTS Knowledge-Intensive High-technology Services
KIMS Knowledge-Intensive Market Services (excluding financial intermediation and high-tech services)
KIFS Knowledge-Intensive Financial Services
KPO Knowledge Process Outsourcing
MNCs Multinational Corporations
NMS New Member States
PBF Project-Based Firm
OKIS Other Knowledge-Intensive Services
OJT On-the-Job Training
STSD Socio-Technical System Design
TPS Toyota Production System

ix
Executive Summary
Since the last decades of the 20th Century, we have witnessed the
specific growth of the service sector at the expense of manufacturing.
Some scholars qualify this change as a historical shift in the structure of
economic activities, and others refer to it as a ‘service sector revolution.’
In a rather simplistic way, the wealth of nations can be attributed to
agriculture two centuries ago, to manufacturing a century ago, and to the
service sector now, producing 70-80 % of GDP in developed economies.
There is a noticeable variety in the share of the service sectors of the GDP
within the OECD countries. For example, in the USA, the share represents
80 %, while, in South-Korea, it represents 60 %, and, in Hungary, similarly
to Finland, it takes almost two thirds of the GDP. The share of the
Hungarian service sector in the GDP is higher than that in both Slovakia
and the Czech Republic; however, it lags behind that in the Nordic
countries, the Benelux states, and some Mediterranean countries, in
which tourism is a key sector in the economy.
Before presenting the main results of the cross-country
comparison of the Hungarian and Slovak knowledge-intensive business
services (KIBS), we briefly describe the procedure used for data collection
and the timing of the field work. In the first quarter of 2008 (according to
the National Register of Economic Organizations compiled by the
Hungarian Central Statistical Office), 4,049 companies with 10 or more
employees were registered in the field of business services, while 2,714
were registered in Slovakia (Slovak Statistical Office). To statistically
represent the organizational population, 200 companies were selected
from the Hungarian firm population, and 100 companies in Slovakia,

x
from the business service sectors based on a multi-stage stratified
sampling method. Here, the basic economic activity of the firms captured
by the NACE code was used as the stratification variable. This sampling
method ensured equal chances to all companies belonging to the
population surveyed to be selected in the sample and reflected the
heterogeneity of the organizational population as well. The fieldwork
took place between June and October 2009 in Hungary and between
October 2008 and January 2009 in Slovakia.
Results on the establishment of firms indicate that, in both
countries participating in the comparison, the so-called de novo firms
(Martin, 2008) dominate in the KIBS sector. The overwhelming majority of
firms surveyed were established following the collapse of the state-
socialist political and economic system. Only a tiny minority of the firms
(7 %) existed before the 1990s. In addition to this common pattern of a
firm’s establishment, in all other structural features, in spite of some
similarities, the differences dominated in the comparison of the
Hungarian and Slovak business service firms.
The domestic (national) ownership represents the largest group of
the firms in both countries (H: 78 % and Sl.: 53 %). However, within the
sample of Slovak business service firms, the share of foreign ownership
is more than twice that in Hungary (26.8 % versus 9.5 %). Even the rate of
mixed ownership is higher in Slovakia than in Hungary (H: 13.0 % versus
Sl.: 21 %).
In relation with the company group membership, or company
networking, we found visible differences between the two countries.
Almost three times as many firms are members of a company group in
Slovakia than in Hungary (Sl.: 51 % versus H: 18 %). In addition, more than

xi
three quarters of Slovak firms are members of the international network
(company group headquarters located abroad); the largest share of
foreign headquarters (28.6 %) is in the USA. Hungarian business service
firms, belonging to the company group, are supervised mainly by the
Hungarian headquarters. In relation with the company group membership,
it is noteworthy that the company group membership is an important
facilitator of knowledge transfer, learning, and the development of
innovation capacity in the member company. Group -especially global
network- members are better performers in both product and service
innovations than ‘isolated firms,’ according to the other international
research experiences (Nielsen, 2006: 42).
Regarding the company size and organizational architecture of the
firms, we may say that small firms with lean organizationi are dominant.
Concerning the size of business service firms, almost four-fifths of the
Hungarian (79 %) and almost of two-thirds of the Slovak (57 %) firms are
in the small category. Beside the size of the firms, we found clear
differences in the other size categories of business service firms. In the
medium-size (H: 17 % versus Sl.: 27 %) and, especially, in the large-size
categories, a significantly higher number of Slovak (17 %) than Hungarian
(5 %) firms were noted. This means that the organizational morphology of
the Slovak business service sector is more balanced than the Hungarian
one.
i The term ‘lean organization’ in our research indicates the minimal hierarchical layers between managers and the rank-and-file workers or, briefly, a less hierarchical organization. This type of organization is often characterized by a ‘controlled autonomy’ in work, reflecting the concern of employers to balance the needs of exercising control over employees and, at the same time, encouraging their creativity (Edwards-Geary-Sisson, 2002).

xii
In relation with the organizational architecture of the firms
surveyed, we may say that, in both countries, the so-called lean
organization dominates (H: 56.8 % versus Sl.: 56.6 %) the business service
sector: more than every second firm has none or only one organizational
layer. The share of firms with 2 or 3 hierarchical levels is slightly higher
in Slovakia than in Hungary (Sl.: 38 % versus H: 30 %); similarly, the share
of firms with 4 or more hierarchical levels is slightly higher in Slovakia
than in Hungary (Sl.: 13 % versus H: 10 %). These differences in
hierarchical levels are attributed to the differences in the size of the firms
participating in the comparison.
Noticeable differences were identified in the importance of
international versus internal (home) markets that we found in the two
countries. The KIBS firms operating in Slovakia have more balanced
market structure in comparison with Hungary. Every second (55 %)
Slovak business service firm operates primarily in the domestic market;
however, the Hungarian firms almost exclusively focus (95 %) on the
domestic market. In other words, the Slovak KIBS sector surveyed is
integrated more strongly in the global value chain (GVC): almost half of
these firms offer services on the international market. In this sense, it is
noteworthy that one fourth of them are present in the USA and one fifth,
in the EU-15 countries, while one tenth are offering services to Asia and
to Russia, Ukraine, and Kazakhstan.
In relation with the types of services, both similarities and
differences are present in the KIBS sectors of both countries. Assessing
the value-added content and degree of standardization of services, the
high-value-added and customer tailored services are dominant in both
countries at the scale of services. However, in Hungarian firms,

xiii
‘customer-tailored solutions’ in services are present at a visibly higher
rate than in Slovakia (88 % versus 66 %). Comparing the value-added
content of services, its share in the Slovak firms is slightly higher than in
the Hungarian business service firms (71 % versus 66 %).
Results on the sources of competitiveness highlight the following
patterns. Among the 11 factors assessed by the employers interviewed,
the first five factors were rather similar among the firms of both
countries with regard to responding to market requirements:: reliability,
quality, customer orientation, flexibility and speed to respond to market
requirements, experience. A noticeable difference was observed in the
variety of products and services, and this was attributed to the factors
shaping the firm’s competitiveness, which were visibly more important in
Hungary than in Slovakia (68 % versus 30 %).
The survey results with regard to the composition of company
management and the patterns of transferring business practices indicate
differences in the management of firms in the two countries. The
presence of foreign managers (or expatriates) was visibly higher in all
business functions surveyed, especially in accounting and finance, in the
Slovak business service firms than in Hungarian ones. This pattern
accurately reflects the deeper integration of Slovak business service firms
in the GVC.
The dominant pattern of transferring business practices from the
parent company into the subsidiary firm operating in the host-country is
the so-called ‘creative adaptation’ (or the hybridization of the mother
and host country practices). The following differences were identified: the
Hungarian business service firms have more autonomy in transferring
business practices than the Slovaks (22 % versus 16 %). Similarly, the

xiv
share of firms copying (mechanically adopting) the business practices of
mother company is higher in the Slovak than in the Hungarian KIBS sector
(14 % versus 9 %). These patterns of transferring business practices are
not surprising knowing the visibly higher share of foreign firms and
foreign company group memberships in the Slovak KIBS sector.
According to international evidence in the field of Human resources
management (HRM) practices, host country managers (staff members)
generally have more autonomy to develop their practices.ii This pattern is
reflected in the dominant pattern of the creative adaptation of HRM
practices in both countries. However, noticeable differences were found
between the two countries. For example, the share of firms
autonomously developing their HRM practices was significantly (more
than three times) higher in Hungary than in Slovakia, and the rate of
firms mechanically copying the mother firm’s HRM practice was almost
three times higher in Slovak firms than in the Hungarian ones. These
differences may reflect the stronger involvement of the Slovak KIBS firms
in international company networking than in the Hungarian ones.
During the company survey, attention was given to the diffusion
and drivers of organizational innovation. Identifying the diffusion of
organizational innovation, we made a distinction between radical
(structural) and incremental (procedural) organizational innovations.
Strong country differences characterize the diffusion of organizational
innovation. Such forms of radical/structural organizational innovation as
ii Adler, P. (1999) Hybridization: Human resources management at Two Toyota Transplants, In: Liker – Fruin – Adler (eds.) Remade in America, (Transplanting and Transforming Japanese Management Systems), New York – Oxford: Oxford University Press, pp. 75-116.

xv
‘project-based work,’ ‘lean organization,’ and ‘inter-disciplinary working
groups’ are more widely diffused in the Slovak than in the Hungarian
company practice. However, in the fields of incremental/procedural
organizational innovation, the company practices are more varied.
‘Team-work,’ ‘Quality Assurance and Auditing,’ and, especially, ‘Job
Rotation’ are more widely used in Slovak than in Hungarian company
practices, where ‘Delegating Quality Supervision,’ ‘Benchmarking,’ and
‘Collection of Employee Suggestions’ were more popular than in the
neighboring country’s firms.
In addition to the item-focused analysis of organizational
innovation, the employers were asked to assess the following four larger
classes of organizational innovation: a) new business practices, b) new
methods of knowledge management, c) new methods of work
organization, and d) new styles of external relations. The share of firms
implementing new methods of work organization and new styles of
external relations is similar in both countries. However, the share of firms
implementing new business practices and new methods of knowledge
management is higher in Slovakia than in Hungary (44 % versus 26 % and
33 % versus 18 %, respectively).
In the context of the current economic slowdown following 2008,
we were especially interested in knowing more about the diffusion of
workplace innovation, which may contribute through the improved
flexibility of manpower/knowledge use to the sustainable competitivity of
the firms and to the better work-life balance of employees, too. In this
relation, the importance of such work-place innovation was assessed by
the firm managers as ‘mobile work,’ ‘home-based telework,’ ‘part-time
work’ and ‘flexible working time arrangement.’ These forms of workplace

xvi
innovation, without exception, are more widely implemented in the
working and employment practice of the Slovak business service firms
than in the Hungarian ones. In addition, it is noteworthy that these forms
of workpace innovation are more widely used in both countries in the
KIBS sector than in the national economy.
In contrast to previous technological changes (e.g., automation)
and due to its integrative character, Information and Communication
Technology (ICT) represents such ‘organizational technology,’ which
opens for the actors of the labor process more opportunities to shape the
division of labor, designing a working system (job design) and the
practice of knowledge use and development. ICT can be employed in
rather flexible ways in firms: from routing information processing to
supporting research and development activities. In general, ICT is used
more widely and in a greater variety of ways in Hungarian than in Slovak
companies, both in such routine functions as ‘information processing
and communication’ (Hungary: 69 % versus Slovakia 43 %) and in more
complex and creative tasks of ‘development activities’ (Hungary: 45 %
versus Slovakia: 28 %).
Assessing the drivers of organizational innovation, we found more
similarities than differences between Hungarian and Slovak business
service firms. In both countries, firms operate under continuous pressure
for cost and knowledge efficiency in the context of global competition.
The key drivers of the organizational innovations are as follows:
improving daily efficiency of work, quality, customer service, and
response to environmental changes. In relation with the factors
responsible for the lack of organizational innovation, in addition to their
identical character, visible differences were found in the degree of their

xvii
importance. For example, such factors as ‘there was no need for it’ or
‘organizational innovation was introduced before 2005’ were more often
mentioned by the Hungarian than the Slovak managers interviewed (33 %
versus 10 % or 43 % versus 12 %, respectively). This may indicate the
‘higher awareness’ of the need to implement organizational innovations
among Slovak than Hungarians managers.iii Finally, it is interesting to
note that ‘the shortage of skilled manpower’ or ‘the resistance of
employees or managers’ -well-known complaints for the difficulties of
the organizational changes in the management literature- were rarely
mentioned during the company survey.
The dynamic capabilities of the firms indicate the firms’ absorptive
capacity to integrate and reconfigure internal and external knowledge
sources to cope efficiently with the rapidly changing environment.
Regarding the internal learning capacity of the firms, we make a
distinction between formal education and competence or experienced- iii In this relation, it is worth noting that, according to the latest ‘European innovation scoreboard 2008, Comparative analysis of innovation performance’ (2009), which uses 29 indicators to measure innovation, the EU Member States were classified into the following four country groups: (1) Innovation leaders, with innovation performance well above that of the EU average (Sweden, Finland, Germany, Denmark, and the UK), (2) Innovation followers, with innovation performance below that of the innovation leaders but above the EU average (Ireland and Austria), (3) Moderate innovators, with innovation performance below the EU average (Cyprus, Portugal, Spain, and Italy), and (4) Catching-up countries, with innovation performance well below the EU average (Malta, Hungary, Slovakia, Poland, Lithuania, Romania, Latvia, and Bulgaria). All of these countries have been catching up, with the exception of Lithuania, Bulgaria, and Romania, which have been improving their performce faster. Hungary and Slovakia belong to the country group characterized by the lowest innovation activities and labeled as ‘catching-up countries.’ Unfortunately, even in this group, these two countries do not improve their innovation performance as fast as other countries with weak innovation capacity (e.g., Lithuania, Bulgaria, and Romania) p. 6.
xviii
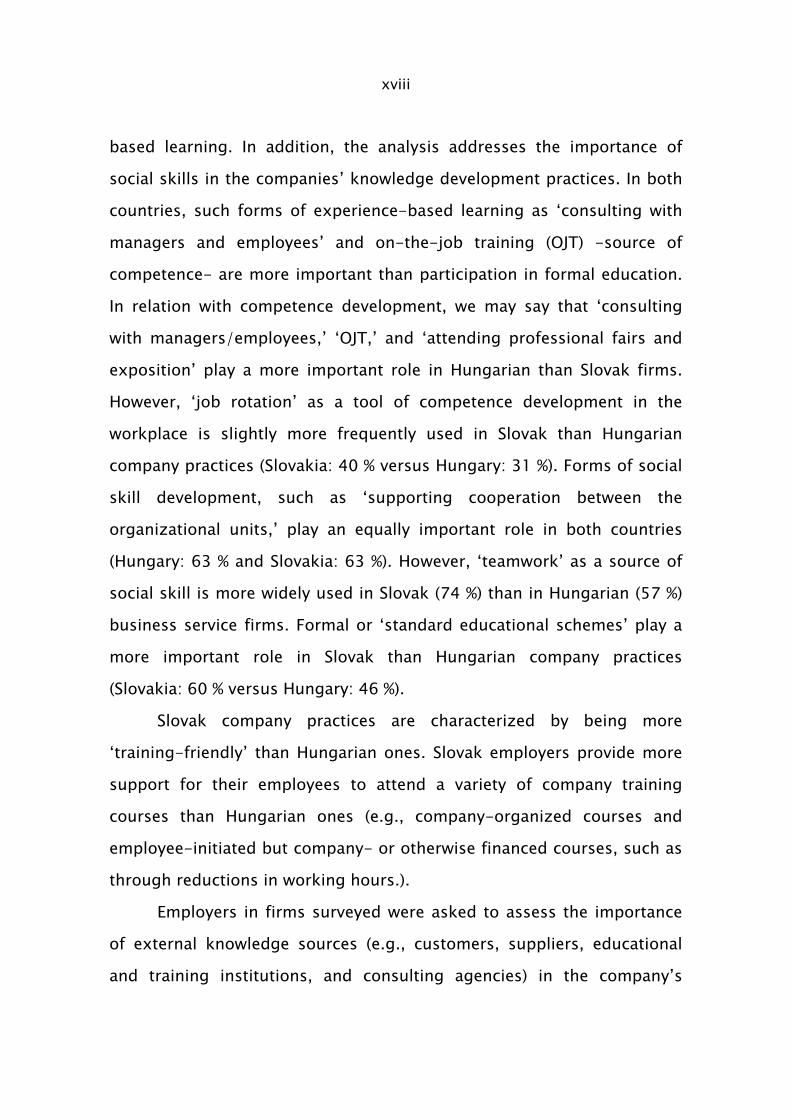
based learning. In addition, the analysis addresses the importance of
social skills in the companies’ knowledge development practices. In both
countries, such forms of experience-based learning as ‘consulting with
managers and employees’ and on-the-job training (OJT) -source of
competence- are more important than participation in formal education.
In relation with competence development, we may say that ‘consulting
with managers/employees,’ ‘OJT,’ and ‘attending professional fairs and
exposition’ play a more important role in Hungarian than Slovak firms.
However, ‘job rotation’ as a tool of competence development in the
workplace is slightly more frequently used in Slovak than Hungarian
company practices (Slovakia: 40 % versus Hungary: 31 %). Forms of social
skill development, such as ‘supporting cooperation between the
organizational units,’ play an equally important role in both countries
(Hungary: 63 % and Slovakia: 63 %). However, ‘teamwork’ as a source of
social skill is more widely used in Slovak (74 %) than in Hungarian (57 %)
business service firms. Formal or ‘standard educational schemes’ play a
more important role in Slovak than Hungarian company practices
(Slovakia: 60 % versus Hungary: 46 %).
Slovak company practices are characterized by being more
‘training-friendly’ than Hungarian ones. Slovak employers provide more
support for their employees to attend a variety of company training
courses than Hungarian ones (e.g., company-organized courses and
employee-initiated but company- or otherwise financed courses, such as
through reductions in working hours.).
Employers in firms surveyed were asked to assess the importance
of external knowledge sources (e.g., customers, suppliers, educational
and training institutions, and consulting agencies) in the company’s

xix
knowledge-generating process. In both countries, such external actors as
customers, suppliers, and consulting agencies are important knowledge
sources. In addition to this common pattern, Slovak KIBS sector’s firms
rely more often on educational/research institutions and labor market
organizations for the development of their internal knowledge sources
than Hungarian business service firms.
This book is structured as follows: The section ‘Foreword’ reviews
some features of the services sector in the changing context of the
economic activities. Section 1 describes the main characteristics of the
methodology of the project (e.g., sampling design and research tools).
Section 2 provides a review of the architectural characteristics (i.e.,
consolidation, size, ownership, management structure, and business
practice transfer) of the firms surveyed. In Section 3, the analysis turns to
the cross-country differences of the company surveys, considering the
diffusions and drivers of the organizational innovation. In Section 4,
differences between the two countries in ‘dynamic capabilities’ or the
learning and integrative abilities of the companies surveyed are
discussed.iv
iv ‘Dynamic capabilities relate to the enterprise’s ability to sense, seize, and adapt, in order to generate and exploit internal and external enterprise-specific competences and to address the enterprise’s changing environment’ (Augier – Teece, 2008:1190, in: The MEADOW Guidelines, 2010:29.

xx

Foreword: Historical shift in economic structure and growing importance of the services
i. Great challenges in services
Since the last decades of the 20th Century, we have witnessed an unprecedented
growth of the service sector at the expense of manufacturing and agriculture. In
this relation, some scholars are labeling this change a ‘service sector revolution’
(Chesbrough – Shphrer, 2006). In a rather simplistic way, the wealth of nations can
be attributed to agriculture two centuries ago, to manufacturing a century ago, and
to the service sector now, producing 70-80 % of GDP in developed economies. In
contrast, the share of the service sector in the GDP in developing countries is 52 %,
and that in the Central and Eastern European Post-Socialist countries ranges from
58.4 % to 62.9 %. Another noticeable feature of these changes is the rather different
development dynamics in the manufacturing and the service sectors. For example,
in the UK, between 1998 and 2004, the Knowledge-intensive Business Service (KIBS)
sector experienced 23.6 % productivity growth accompanying a 20.2 % employment
increase. On the other hand, 28.8 % productivity growth and 22.8 % employment
decline were reported in the manufacturing sector (Sako, 2006: 500).
With regard to the unbundling of corporate functions relative to support
activities in a firm’s infrastructure and administration, globalization of the service
sector is a rather new phenomenon driven by the following factors:
(1) Globalization of the labor marke or the Great doubling in the international labor
market. After 1989, instead of 1.48 billion people, 2.93 are competing and
intensifying the wage competition globally (Freeman, 2005).

2
(2) General use (due to radical cost reduction) of the ICT in company practices
speeded up the delocalization (outsourcing/off shoring) of not only the ‘primary
activities’ (e.g., production) in the global value chain (GVC) but also the ‘support
activities’ in the administrative functions (Gospel – Sako, 2008: 2-4).
(3) In the emerging markets, the social and economic actors (governments) are
looking for new development strategies (a new path of the economic development)
aimed to improve their position in GVC in supplying higher-value-added products
and services. With the help of this new policy orientation, the CEE countries,
including Hungary, intend to get rid of the situation of ‘locking (…) into economic
activities with low-value-added/productivity growth and, thus, undermining future
sustainable growth’ (Kattel – Reinert – Suurnal, 2009: 2).
(4) Fast development of ‘modularization’ or ‘networking’ via various types of
organizational and managerial innovations in global corporations is continuing. This
process is driven by both the cost-reduction and the transformation of the firms
(e.g., the focus on the core competences in both the ‘primary’ and the ‘support’
activities).1
Radical changes in the nature of the global labor market are regarded as a
key factor for the high speed of internationalization of services. As a result of the
participation of China, India, and former Soviet-bloc countries in the global labor
market, today, 2.93 billion people are in competition, while only 1.46 billion
workers were active in the global labor market before these historical changes.
Richard B. Freeman (2005) labeled this enormous shift in the global labor market as
a ‘great doubling’ with a far reaching impact on labor in both the developed and
1 According to Sako (2009), in the ‘modular corporation,’ the labor process in practically every large corporate department can be delocalized (either by outsouring or offshoring) and driven both by cost- and knowledge efficiences, using ‘using new locations with a talent pool’ (p. 4.).

3
developing economies. The countries noted above before the collapse of the state-
socialist political-economic system and before ending their economic isolations
(e.g., India), the workforce in these countries rarely competed directly with those in
the developed countries. One of the most important impacts of this historical
change on the global labor market is increased wage competition not only in the
low-level blue-collar jobs in the manufacturing sector but also in the best- and
worst-paid white-collar jobs. Contrary to widespread public belief, these
developing (or emerging) economies are increasing their highly skilled labor force
rather fast with the future aspiration to improve their present position in the GVC of
both manufacturing and services. In this regard, it is important to stress the
following: even before the 2008 global financial and economic crisis, China
launched various initiatives to increase the share of high-value-added products in
total exports and made remarkable progress in R&D (e.g., nanotechnology; more
than 750 MNCs created R&D capacity). In addition, by 2010, the number of Chinese
PhD students in engineering and natural sciences will outstrip that of similar
categories in the U.S.A. Finally, it is noteworthy that, besides China, Indonesia and
Brazil had doubled the number of university graduates between 1980 and 1990.
ICT and modularization (or networking) of business organizations are
important drivers and/or enablers of delocalization (outsourcing/off shoring) of
services. The dramatic decline in the telecommunication costs, decreasing
importance of the physical distance (‘death of distance’), and extensive use of ICT
assist in the geographical redistribution of data storage and processing (e.g.,
outsourcing the data processing activities of accounting and wage departments,
medical diagnosis, and logistical activities). Finally, ICT facilitates the
standardization of services. This is the process of ‘productizing services’ in the
service sector. However, the infiltration of servicing is also evident in the

4
manufacturing sector. For example, among such globally well-known
manufacturers as the American IBM or the German Siemens, the fastest growing
aspect of their turnover is generated from service activities. This process is often
called ‘servicing products.’
In spite of the fact that the service sector covers a greater variety of activities
than the manufacturing one, only 10 % of the service sector is involved in
international trade, while it is more than 50 % in the case of manufacturing
(UNCTAD, 2004: 97). The smaller share of the service sector in international trade
may be explained by the special characteristics of its products. In the majority of
cases, it is difficult to store a significant part of the service sector’s product due to
the fact that the production and consumption of services take place simultaneously.
This feature of the service sector results in weak tradability; therefore, at the
beginning of the 21st Century (2003), despite the heavy reliance on the use of ICT,
services represented only 1.8 billion USD in the work trade, in contrast to the 7.4
billion USD share of the manufacturing sector (WTO, 2005). Despite these
difficulties, the share of Foreign Direct Investments (FDI) in the service activities
increased in the last decades of the 20th Century. For example, in the 1970s, the
sector represented only 25 % of the total inward FDI; in 2002, this share increased
to 60 % (UNCTAD, 2004). The role of FDI is especially important in the field of
business services (e.g., in such sub-sectors as transportation, telecommunications,
real estate, catering, and hotels).
Governments in the emerging markets are designing new development
(modernization) strategies aimed at moving up on the GVC and shifting from the
‘low-skill’ to the ‘high-skill’ equilibrium growth model in the CEE countries. The
following table accurately illustrates the possible steps of moving up in the GVC in
the field of business service activities.

5
Table 1. Moving of the value chain of business services
IT Services - BPO KPO
IT infrastructure Software applications
development Hosting
Data entry and conversion
Call centers Horizontal back-office processes (e.g., payroll
administration, accounts payable) Vertical business
process (e.g., claims handling in insurance)
Research & Development
Engineering design Data analytics and
data mining Advanced processes
in legal, medical, biotechnical, and pharmaceutical
sectors
Source: Sako, 2009: 17. Note: BPO= Business Process Outsourcing, KPO= Knowledge Process Outsourcing
It is quite probable that the radical changes in the global labor market and
the impact of the global financial and economic crisis in spite of the temptation of
‘economic nationalism’ in some countries may result in only a temporary slowdown
and stronger competition and not a reversal of the trend of delocalization of
business services. In this context, the organizational innovations and the knowledge
development practice in the KIBS firms are playing a key role in improving the
competitiveness and moving up the GVC of business services.
ii. Heterogeneous character of services and innovation
Characterizing the service activities in general, Korczynski (2002) (cited by Flecker-
Holtgrewe-Schönauer-Dunkel-Meil, 2008: 103) identifies the following basic
features of services:
‘intangibility’ – the product of service work is not or is only partly of a tangible
nature,
‘perishability’ – the product is ‘temporary’ and, thus, can not be stored,
6
‘variability’ – the product is not homogeneous, for it can vary according to the
persons involved (for instance, through the perception of the services on the
part of a customer),
‘simultaneous production and consumption’ – the product is produced and
consumed in one and the same situation (‘uno-actu’ principle),
‘inseparability’ – the product is produced by both a service provider and a
receiver (co-production).
Due to the great variety in the form and content of services, it is extremely
difficult to identify and assess the innovations in the field of service activities. To
overcome the problems related with the heterogeneity of service sector, Salter and
Tether (2006: 9-17), instead of using a universally accepted definition of service,
made a distinction among the following main clusters of services:
Traditional services
Systems firms
Knowledge-intensive business service (KIBS) firms
Traditional services
According to Selter and Tether (2006: 9 -11), these types of services ‘ … occupy
the ’top and bottom’ of the knowledge economy – the best and the worst jobs in
services, and the growth of services has been characterised by growing inequalities
in advanced economies … Because of their nature, many services … are provided
locally. This local-provisions to serve local-needs has arguably led to a form of
low-quality lock-in, which Finegold-Soskice (1988: 22) identified as the ‘low-skill
equilibrium’ – in which the majority of enterprises staffed by poorly trained
managers and workers produce low quality goods and services.’
Small traditional service firms are dominating the modern economy, and the
following statement is generally accepted among experts dealing with service

7
innovation: ‘… Few of these firms employ professional staff, and, therefore, they
often lack the absorption capacity necessary for successful innovation’ (Selter-
Tether, 2006: 9). However, not only the necessary professional-technical skills as
social preconditions of innovation are missing in small traditional service firms but
also the necessary social skills (e.g., ability to perform teamwork, capacity to solve
workplace conflicts, and communication skills).
To overcome the problems related to knowledge shortage in small traditional
service firms, it is necessary to call attention to the role of the franchise and
company networking in speeding up the knowledge transfer and development. The
‘franchise contracts’ may enlarge the available knowledge pool and speed up the
diffusion of the new working practices as well as help identify the conditions of
brand use, including the methods and routines of the new firm establishment.
Another important facilitator of knowledge transfer is the networking or company
group membership. Organizations operating as a company group member (e.g.,
convenience store chains) may disseminate knowledge faster and improve their
innovation performance better than a single firm operating alone (Nielsen – Lundvall,
2007: 74).
According to the review of relevant company surveys, the innovation
performance of the micro- and small firms is lagging behind that of medium-sized
and, especially, large companies. In this relation, it is necessary to report that we
have rather modest systematic knowledge on the social innovation performance of
the micro- and small firms operating in the traditional service sector. An
overwhelming majority of innovation research is focusing on the growth potential of
the start-ups in the high-tech sectors (e.g., software development and bio-
technology). Few scholars are interested in better understanding the innovation

8
activities of the low-tech (‘technology users’) small firms in the traditional service
sector.
To better understand the complexity of the innovation process, since 2008,
the European Innovation Scoreboard (EIS) survey has been focused on the particular
social segment of firms labeled as ‘neglected innovators.’ According to the EIS
(2009) report, R & D is not the only method of innovating. Other methods include
technology adaptation, incremental changes, imitation, and combining existing
knowledge in new ways. With the possible exception of technology adoption, all of
these methods require creative efforts on the part of a firm’s employees and,
consequently, lead to a better development of the firm’s in-house innovative
capabilities (EIS, 2009: 23). In comparison to a firm’s in-house R & D, a higher rate
of non-R&D innovators use fewer than 50 employees and operate in a low-
technology service sector and ‘… are located in European countries with below
average innovative performance’ (op. cit., p. 23).
In spite of the difficulties raised above on the low innovation capacity of
traditional service firms, some of them are able to create a new path of
development and break with the practice of the low-cost and low-quality service
(‘low quality lock-in’). For such firms, the benefit margin of innovation activities
could be rather high.
System firms
Previously, we insisted that many services are dominated by micro- and small firms
that satisfy the needs of the local market and belong to a class of firms called
‘neglected innovators.’ However, ‘system firms’ operating in the service sector are
using both high-tech and advanced organizational and managerial practices. As
Selter-Tether (2006: 13) reported, ‘These services include banking and insurance,
super market-retailing and airlines … these industries typically involve very highly

9
developed division of labor, sophisticated technologies including ICT and complex
organizational forms.’ System firms represent two bureaucratic forms of
organization. Both are characterized by varying degrees of innovation and learning
capacity. Mintzberg (1979, 1983) labeled these forms of organization as a
‘mechanistic’ and ‘professional bureaucracy.’
According to the latest survey data comparing the models of work
organization in Europe, work in a ‘mechanistic’ bureaucracy is standardized
through the use of formal job descriptions and rules imposed by management. The
labor process is characterized by a higher degree of centralization and limited
autonomy of employees over how to carry out their tasks and over the pace of their
work. On the other hand, in the case of a ‘professional’ bureaucracy, centralization
is lower ‘… and behavior is regulated and standardized through the acquisition of
standardized skills and the internalization of professional norms and standards of
conduct. As a result, operating procedures are rather stable and routine, in spite of
the considerable autonomy in the work’ (Valeyre et al., 2009: 9).
Professional service firms or knowledge-intensive business service (KIBS)
KIBS service firms are playing a key role in developing innovation and knowledge at
the national, regional, and firm (or firm network) levels. This type of service is in the
core interest of our analysis. According to Toivonen (2006: 5),2 professional service
firms can improve the innovation activities in the following ways:
2 According to Salther and Tether (2006), the fundamental characteristics of innovation activities in the knowledge-intensive and professional service firms are as follows: ‘(1) the role of highly skilled labor in the creation and exploitation of new solutions; (2) the importance of new organizational practices, such as the use of knowledge management systems (KM) in supporting the realization of new innovative opportunites; (3) the ‘generative dance’ between clients and producers as new solutions are negotiated and co-produced between different actors; (4) the

10
‘direct transfer of expert knowledge, i.e., the traditional model of consulting
practice, experience sharing, and carrying experiences and ideas from one
context to another,
benchmarking, where the process of identifying and focusing on ‘good practice’
can be established through an intermediary,
brokering, putting different sources and users in contact,
diagnosis and problem clarification, helping users articulate and define the
particular needs in innovation in such a way that external resources and
opportunities can be effectively used,
change agency, where organizational development can be undertaken with help
from a neutral outside perspective.’
Beside the key role of fast development of information and communication
technologies (ICT), which has tremendously improved knowledge management in
general (e.g., handling, storing, and transferring information did not question the
importance of the ‘proximity principle).’ In this relation, Toivonen reported the
following: ‘The empirical studies made until now indicate that even though there is
growing potential for the electronic delivery of graphic, numerical, and text-based
information, no part of the KIBS transactions can be carried out without local
presence of face-to-face contact’ (op. cit.: 9).
key role of social networks in generating and supporting knowlegde creation and exchange through brokerage and closure; (5) the ‘ad hoc’ or ‘informal’ ogranizational form of most knowledge-intensive service firms.’ (Salther-Tether, 2006: 17)

11
iii. A brief overview on the distribution of learning/innovative organization in Europe
Before outlining the results on the organizational innovation and knowledge
development practices in Hungarian and Slovak KIBS firms, a brief overview is
presented on the presence of innovative-learning organizations in the European
economy with special focus on Hungary and Slovakia.
The European economy is characterized by a visible variety in the forms of
work organization, reflecting the various degrees of learning and innovation
capacity of the firms surveyed. The findings of the 4th European Working Conditions
Survey (EWCS-2005) in the EU-27 countries (Valeyre et al., 2009) indicate that
almost two fifths (38 %) of the European employees surveyed are working in the
‘discretionary learning organization’ (innovative organization). In this class of work
organization, job structure is characterized by a high level of autonomy in work,
need to learn and problem-solving, task complexity, and self-assessment of quality
of work. Such characteristics of work as monotony, repetitiveness, and work pace
constraints are under-represented. 3 The discretionary learning forms of work
organization are highly developed in such sectors of the national economies as the
service sectors, mainly in financial and insurance activities (63 % of employees),
3 The discretionary learning form of work organization is comparable to the ‘operating adhocracy’ models of Minztberg (1979, 1983) and has many of the common features of the ‘Social-Technical System Design’ (STSD) model. Nielsen (2007) makes a distinction between the traditional social-technical approach of the Tavistock Institute and the Scandinavian Social-Technical System Design (STSd): ‘in the early socio-technical studies attention was mainly focused on the improvement the quality of working life at the level of work groups in the organization. In the modern socio-technical system design (STSD), the attention shifts from working group to the organizatoin as a whole. Thereby formulate a set of design rules for structure of division of labor that have positive effect on the quality of working life as well as the performance of the ogranization.’ (Nielsen, 2007: 67).

12
business services (50 %), community, recreational, cultural, and personal services
(49 %), and in the gas, electricity, and water sector (56 %). (This type of organization
is used less in manufacturing; however, there is a concern with the large share of
employees in the mechanical engineering sector (44 %), which is characterized by
complex production processes and important research–development activities.)
Another type of organization, referred to as ‘lean organization,’ is typified by
good learning and innovation potential.4. This class of work organization, which
accounts for more than one fourth (26%) of the employees, is defined primarily by
an overrepresentation of teamwork (autonomous or not) and job rotation
(particularly multi-skilling), autonomy in quality supervision (self assessment of
quality of work and quality norms), and various factors constraining the speed of
work or work pace. However, autonomy in work is only slightly higher than the
average and limited by the importance of work pace constraints linked to the
collective nature of the work and the requirement of respecting strict quantitative
production norms. Thus, this model of work organization has much in common
with what is described as a ‘controlled autonomy’ in work, reflecting employers’
contradictory concern to balance the needs of exercising control over employees
while, at the same time, encouraging their creativity.
The lean production forms of work organization are most prevalent in the
manufacturing industries (31 %), with small disparities in the various sectors and
the construction sector, but significant numbers of employees (20 %) are in other
4 The ‘lean wave,’ the lean principle have become popular since the 1990s, and ‘The practical use of lean strategies includes issues of cost reductions, employee empowerment, value chain orientation, customer foucs and product innovation’ (The MEADOW Guidelines, 2010: 26. In our use, lean organization indicates the importance of the ‘employee empowerment’ from the various features of the lean production. The original descripton of the lean principles or lean waves is related to the work of Womack and Jones (2003).

13
service sectors. Taylorist forms of work organization (or the organization of work
for mass production) occur most frequently in manufacturing (28 %), especially in
such mature industries as textiles, clothing, and leather (47 %) but to a much lesser
degree in the mechanical, electrical, and electronic engineering industries (17 % and
19 %). These forms are generally less present in the service sectors, except in hotels
and restaurants (26 %), and post and telecommunications (22 %), with a higher level
than the average (16.4 %). Finally, the traditional or simple structure of work
organization grouped in the fourth class is prevalent in the service sectors, mainly
in transport (27 %), wholesale and retail trade (25 %), community, recreational,
cultural, and personal services (22 %), and hotels and restaurants (21 %), but is also
diffused, higher than the average rate (16.4 %), in the food and beverage industries
(19 %). Table 2 indicates the distribution of forms or models of work organization
and is a comparison of the ‘old’ and ‘new member states’ in the European Union.
The positions of Hungary and Slovakia within the EU-27 countries are rather
unbalanced. For example, on the one hand, among such New Member State (NMS)
countries as Hungary, Estonia, and Cyprus, the share of ‘learning’ or ‘innovative’
organization’ is among the highest. However, on the other hand, the Taylorist
model of mass production is near or exceeds the EU average.. The same pattern of
distribution of forms of work organization is true for Slovakia. This country belongs
to the country cluster in which a ‘lean organization’ has a higher rate than the EU
average. At the same time in Slovakia, the share of Taylorist work organizations
exceeds the EU average. Assessing the learning and innovative capacity of both the
‘learning’ and ‘lean’ organizations, Hungary has a slightly better position than
Slovakia at the cross-country level and a higher share of learning organizations
than lean organizations.

14
Table 2. Share of work organization models in the EU-27 countries (EWCS-2005).
Models of work organization NMS+2 EU-15
Discretionary learning
organization (post-Fordism)
Hungary, Estonia, and
Malta
Austria, Belgium, Germany,
Sweden, Denmark, Netherlands,
France, Luxemburg, and Finland
Lean organization (Neo-
Fordist work organization)
Estonia, Latvia, Lithuania,
Czech Republic, Poland,
Romania, Slovenia,
Slovakia, and Cyprus
Belgium, Luxemburg, UK,
Ireland, Spain, Denmark,
Finland, Malta, Portugal, and
Greece
Taylorist/Fordist work
organization (mass
production)
Bulgaria, Czech Republic,
Hungary, Lithuania,
Romania, Slovakia,
Cyprus
Cyprus, Greece, Spain, Italy, and
Portugal
Traditional or non-coded
work organization
Bulgaria, Czech Republic,
Hungary, Lithuania,
Slovakia, and Cyprus
Cyprus, Ireland, Greece, UK,
Portugal, and Spain
Source: Makó – Illéssy – Csizmadia (2008:1080)
Unfortunately, these aggregated country-level data do not provide
information about the distribution of various forms of work organization (‘learning,’

15
‘lean,’ ‘Taylorist,’ and ‘simple’ versions) by sectors within the countries surveyed.
The core motif in designing and carrying out a comparative company survey in the
Hungarian and Slovak KIBS sector was to overcome and map ‘knowledge deficiency’
in that field.
iv. Share and Changes in the KIBS Sector Employment in Europe: Special Focus on Hungary and Slovakia
Following a brief presentation of the distribution of the forms of work organization
in Europe, an explanation of the position occupied by the various branches of the
KIBS sector within the European employment structure is presented according to the
latest statistical data (see Table 3 for details) and the development of this sector in
Hungary and Slovakia in comparison with the EU-27 average over the last decade
(2000-2007)
In Hungary and other post-socialist countries, the share of KIBS in
employment is below the EU-27 average (33 %), and these economies are lagging
considerably behind such countries as Sweden (48 %), the UK (43 %), and Finland
(41 %). Among the post-socialist economies of the NMS countries, in a comparison
of the knowledge-intensive (business) services (KIS or KIBS), the highest level of
employment was registered in Hungary (28.2 %). When evaluating the employment
shares in the sub-sectors of the KIBS (e.g., KIHTS and KIMS), visible variations were
registered within this country group. In the case of the ‘Knowledge-intensive High-
Tech Services’ (KIHTS), the Hungarian employment share is the highest (3.28 %)
among the post-socialist countries, followed by the Czech Republic (3.99 %),
Slovakia (2.89 %), and Slovenia (2.80 %), and the lowest in Romania (1.52 %). In the
case of the ‘Knowledge-intensive Market Services,’ Estonia (7.03 %) and Latvia
(6.17 %) occupy the first two positions, and Hungary is the third in rank (5.91 %),
followed by the Czech Republic (5.86 %), Slovenia (5.64 %), Poland (5.38 %), and

16
Slovakia (4.95 %). Identifying the share of employment in the ‘Knowledge-intensive
Financial Services’ (KIFS), Slovenia has a leading position (2.45 %), followed by
Poland (2.38 %), Hungary (2.16 %), the Czech Republic (2.07 %), and Slovakia
(2.02 %). Concerning the ‘Other knowledge-intensive services’ (OKIS), Lithuania has
the leading position (17.78 %), and Hungary occupies the second position (16.85 %),
followed by Estonia (16.83 %), Slovenia (15.38 %), and then Slovakia (14.86 %).
Romania has the weakest position among the post-socialist countries.5
In a dynamic perspective (from 2000 to 2008), looking at the growth rates of
employment in the total service sector and in both the ‘knowledge-intensive’ and
‘less knowledge-intensive’ service sectors, the following patterns were identified.
As shown in Figure 1, the share and the growth rates of the total service sector were
the highest in the EU-27 countries, followed by Hungary, and Slovakia has a visibly
weaker position.
5 In relation to the ‘less-knowledge-intensive services,’ Hungary has a higher share of employment (34.67 %) than Slovakia (31.78%). In addition, the Hungarian share of employment in this type of service (34.67 %) was higher than the EU-27 average (33.7 %) in 2007.

17
Table 3. Share of knowledge-intensive service sectors in employment in some EU countries in 2007
Knowledge-intensive
High-technology
services (KIHTS)
(1)
Knowledge-intensive Market services (KIMS)
(2)
Knowledge-Intensive Financial Services (KIFS)
(3)
Other Knowledge-
intensive services (OKIS)
(4)
Knowledge-intensive Services
Total (KIS) Total)(1+2+3+4)
European Union (EU-27) 3.29 8.27 2.97 18.43 32.96
Bulgaria 2.54 4.46 1.35 13.31 21.66 Czech Republic 2.99 5.86 2.07 14.74 25.66 Estonia 2.55 7.03 1.43 (u) 16.83 27.84 Hungary 3.28 5.91 2.16 16.85 28.20 Latvia 2.47 6.17 1.93 14.16 24.72 Lithuania 2.10 4.64 1.45 17.78 25.97 Poland 2.57 5.38 2.38 14.49 24.81 Romania 1.52 2.70 1.04 9.15 14.40 Slovenia 2.80 5.64 2.45 15.38 26.27 Slovakia 2.89 4.95 2.02 14.87 24.74 Finland 4.56 9.92 2.01 24.24 40.73 Sweden 5.07 11.43 1.95 29.38 47.83 France 3.40 9.24 3.09 21.16 36.89 Germany 3.44 8.64 3.50 19.21 34.79 United Kingdom 4.36 10.02 4.35 24.12 42.85 Ireland 3.70 7.92 4.43 19.43 35.48 Spain 2.95 8.87 2.40 13.98 28.19 Italy 3.12 9.58 2.87 15.11 30.67
Source: Eurostat Data Explorer (http://epp.eurostat.ec.europa.eu/portal/page/portal/statistics/themes)
For the relevant NACE codes of each category see Appendix 1.

18
Figure 1. Share of Total service sector in employment in Hungary, Slovakia, and EU-27 countries, 2000-2008
Source: Eurostat Data Explorer (http://epp.eurostat.ec.europa.eu/portal/page/portal/statistics/themes) Figure 2. Share of Knowledge-intensive service sector in employment in Hungary, Slovakia, and the EU-27, 2000-2008
Source: Eurostat Data Explorer (http://epp.eurostat.ec.europa.eu/portal/page/portal/statistics/themes)
50525456586062646668
2000 2005 2008
Hungary
Slovakia
EU-27
0
5
10
15
20
25
30
35
2000 2005 2008
Hungary
Slovakia
EU-27

19
In the case of the employment share and growth rate of the ‘knowledge-
intensive service sector,’ again the EU-27 country group has the leading position,
followed by Hungary and then Slovakia (see Figure 2).
In the case of the ‘less-knowledge-intensive services,’ from the early 2000,
Hungary has been producing higher share and growth rates in employment,
followed by the EU-27 country group and then Slovakia (see Figure 3).
Figure 3. Share of Less Knowledge-intensive service sector in employment in Hungary, Slovakia, and the EU-27, 2000-2008
Source: Eurostat Data Explorer (http://epp,eurostat,ec,europa,eu/portal/page/portal/statistics/themes)
Assessment of the aggregated data of the ‘total service sector,’ ‘knowledge-
intensive service’ (KIS), and ‘less knowledge-intensive service’ (LNIS) shows that
Hungary has both a static and a dynamic perspective, which is a better position
than that held by Slovakia. In addition, it is of value to map the employment share
and its growth by sub-sectors of the KIS. In other words, our focus is on country
29
30
31
32
33
34
35
2000 2005 2008
Hungary
Slovakia
EU-27

20
contrasts in employment share and employment growth by such sub-sectors as
KIHTS, KIMS, KIFS, and LNIS. Tables 4 and 5 provide information about these
differentials between the two post-socialist Central European countries in
comparison to the EU-27.
Table 4. Share of Knowledge-intensive service sectors in employment in Hungary, Slovakia, and the EU: 2000-2008 (2007) (%)
Types of services Hungary Slovakia EU-27 average6
2000 2005 2008 2000 2005 2008 2000 2005 2007 Knowledge-intensive high-technology services (KIHTS)
3.09 3.15 3.28 2.97 2.67 2.77 3.21 3.28 3.29
Knowledge-intensive market services (excluding financial intermediation and high-tech services) (KIMS)
4.68 5.95 6.45 3.31 4.72 5.44 6.81 7.79 8.27
Knowledge-intensive financial services (KIFS)
2.23 2.06 2.44 1.77 2.17 2.27 3.11 2.96 2.97
Other knowledge-intensive services (OKIS)
16.50 17.07 16.55 16.43 15.87 14.24 17.22 18.45 18.43
Knowledge-intensive services total
26.5 28.22 28.73 24.48 25.43 24.71 30.36 32.47 32.96
Less-knowledge- intensive services (LNIS)
33.27 34.44 34.67 31.35 31.08 31.78 33.45 33.89 33.77
Service sector total
59.77 62.66 63.40 55.83 56.51 56.49 63.81 66.36 66.73
Source: Eurostat Data Explorer (http://epp.eurostat.ec.europa.eu/portal/page/portal/statistics/themes)
6 As there is no data on the EU average available for 2008, the data in the last column refer to 2007.

21
The share of the service sector total (KIBS + LNIS) in the two post-socialist
countries was weaker than that of the EU-27 average in both 2000 and 2008 or
2007. However, there were differences. In the case of Hungary, the differences in
the service sector employment share between 2000 and 2008 (or 2007) decreased
(from 4.04 % in 2000 to 3.33 % in 2008 (2007)). In the case of Slovakia, the
differences were more visible and increased more than the EU-27 average (form
7.98 % in 2000 to 10.24 % in 2008 (2007)).
The picture is clearly different in a comparison of the growth potential of the
service sector in general and, especially, in its sub-sectors (see Table 5).
Table 5. Growth rate of overall and sub-sector service sector employment between 2000 and 2008 (2007) in Hungary, Slovakia, and the EU-27 average (%)
Types of services Hungary
(2008/2000) Slovakia
(2008/2000) EU-27 average (2007/2000)
KIHS + 6.1 % - 6.7 % + 2.5 %
KIMS + 37.8 % + 64.4 % + 21.4 %
KIFS + 9.4 % + 28.2 % - 4.5 %
ONIS + 0.3 % - 13.3 % + 7.0 %
KIS total + 6.4 % + 0.9 % + 8.6 %
Service total + 6.1 % + 1.4 % + 1.0 %
Source: Eurostat Data Explorer (http://epp.eurostat.ec.europa.eu/portal/page/portal/statistics/themes)
Looking at the growth rates of the overall service employment, we may say
that, in both post-socialist countries, but particularly in Hungary (+6.1 %) and, to a
22
lesser extent, in Slovakia (+1.4 %), the growth rate between 2000 and 2008 (2007)
was stronger than the EU-27 average (+ 1 %).
By evaluating the employment growth between 2000 and 2008 by sub-
sectors of KIS (or KIBS) services, a more nuanced picture may be obtained. The
growth rate of the overall KIS in Hungary (+ 8.4 %) was close to the EU-27 average
(+ 8.6 %), but it was much weaker in Slovakia (+ 0.9 %). The employment growth in
the KIHS was higher in Hungary (+ 6.1 %) than the EU-27 average (+ 2.5 %) and
declined in Slovakia (- 6.7 %). In the KIMS, the employment growth rates in Hungary
(+ 37.8 %) and, especially, in Slovakia (+64.4 %) were higher than the EU-27
average (+ 21.4 %). Similarly, the employment growth rates in the KIFS, in Hungary
(+9.4 %), and, again, especially, in Slovakia (+ 28.2 %) were significant, while, in the
EU-27 (- 4.5 %), there was a reduction in employment. In the case of the ONIS, the
employment growth rate was stronger in the EU-27 countries (+ 7.0 %) and very
weak in Hungary (+ 0.3 %), and a significant decline was observed in Slovakia (-
13.3 %).
Similarly to the international trend, the economic performance of the service
sector increased significantly in the last decade in Hungary and Slovakia. In 2007,
as Table 6 indicates, almost two-thirds of the GDP was generated by the service
sector in both countries. These findings bolster the previous analysis on the
importance of the service sector in both countries.
In addition, it is noteworthy that, in the case of Hungary, between 1992 and
2006, the productivity growth in the service sector (measured by the share of the
gross value added/capital) was higher than that in manufacturing. In addition, the
service sector played a crucial role in employment generation. Between 1995 and
2006, every second new job (46 %) was created in the service sector, and,

23
interestingly enough, more than every second new job (57 %) was established in the
knowledge-intensive business services (KIBS)7 (ERM Report, 2008).
The improvement of economic performance was rather unequal in the very
heterogeneous service sector. For example, such firm level performance indicators
as gross value-added per capita, turnover, export, profitability, and employment
growth were higher than the average in the KIBS (Hamar, 2005) in comparison to
the traditional and system firms.
Table 6. Contributions of economic sectors in the GDP: comparing some CEE economies to various groups of EU countries (1995-2005) (%)
Country
1995 2000 2007
Agriculture Industry Service Agricul
ture Industry Service Agriculture Industry Service
EU-27 8.4 28.6 63.0 7.1 26.9 66.0 5.8 24.9 69.2
EU-15 5.0 27.5 67.5 4.2 25.8 70.1 3.4 23.5 73.1
Czech Republic
6.4 40.5 53.1 4.8 39.1 56.0 3.5 38.1 58.4
Hungary 8.2 33.1 58.7 6.6 33.8 59.6 4.7 32.5 62.8
Poland 26.9 29.7 43.5 27.5 26.3 46.2 n.d. n.d. n.d.
Slovakia 9.3 37.1 53.9 5.7 34.8 59.4 3.6 34.3 62.1
Source: EUROSTAT 2008, Labor Force Survey (LFS).
Note: n.d. = no data
Now, we turn to the analyses of the empirical data collected during the
company surveys in the Hungarian (2008) and Slovak (2008-2009) KIBS sectors on
the diffusion of organizational innovations and the knowledge-development
practices. 7 The composition of the KIBS is presented in detail in Section 1.2.

24
The remainder of this report is structured as follows. Section 1 reviews the
research design, sampling, and research methods. Section 2 compares the
structural (demographic, ownership, and market) characteristics of the firms and
the composition of management. Section 3 is a discussion of the empirical results
of the drivers and diffusion of organizational innovation. Section 4 is a comparison
of company practice of knowledge development in both countries.

25
1. Research design, sampling, and research method
1.1. Need to better understand innovation in the KIBS sector
In relation with the innovation performance of the economy, we have an abundance
of knowledge on technologically related product and process innovation, especially,
in the manufacturing sector (Schienstock - Hamalainen, 2001). From the 1980s,
renewed interest has been registered to better understand, from both the
theoretical and empirical perspectives, the complex, dynamic, and multi-level
relationship between organizational development and innovation, especially in the
KIBS sector (Salter - Tether, 2006; Lam, 2005). In this context, it is necessary to call
attention to the similarities and differences of organizational innovation and
patterns of knowledge use between the KIBS and manufacturing firms. The
literature dealing with service sector innovation can be classified into two
contrasting schools of thinking: the first theoretical strand stresses the particular
character of the innovation in the service sector (e.g., the key role of organizational
development, extensive use of external knowledge source, higher priority of
training, collective practice of knowledge development, interactive working
practices, client-specific specialization, and generalization of consultative way of
working) in comparison with the manufacturing sector (Leiponen, 2004, 2003;
Salter - Tether, 2006; Toivonen, 2006). The second approach emphasizes the
similarity of innovation in the service and manufacturing sectors and refuses black-
and-white views (Pavitt, 1984; Evangelista, 2000; Evangelista - Savona, 2003;
Miozzo - Soete, 2001) on the sector’s character of innovation.
In the Hungarian academic community, there is a scarcity of systematic
research on organizational innovation in general and, especially, with regard to the
KIBS sector. To overcome this knowledge deficiency, the Research Group of

26
Sociology of Organization and Work at the Institute of Sociology Hungarian
Academy of Sciences (Budapest) recently initiated desk-top screening of literature
on the diffusion of organizational innovation and gathered empirical materials
learned from its strong involvement in several EU-funded projects.8
This paper provides the first analysis of systematically collected company-level
data with the objective of better understanding the diffusion and drivers of
organizational innovation and the practice of knowledge development by comparing
the KIBS sectors in Hungary (2008) and Slovakia (2008-2009). The company surveys
were co-financed by the Ministry of Education of Japan (Grant No. 19402023), the
Nomura Research Fund and the Tokyo Maritime Research Fund, and the Hungarian
Academy of Sciences. The international research consortium included the following
institutes: the Institute of Sociology of the Hungarian Academy of Sciences (HAS)
(Budapest), the Institute for the World Economics, HAS (Budapest), the Institute of
Economics of Hitotsubashi University (Tokyo), and Comenius University – Faculty of
Management (Bratislava).9
8 In this respect, it is worth mentioning our involvement in the following projects: EU-funded projects: ‘Work Organization and Restructuring in the Knowledge Society’ (WORKS, Integrating and Strengthening the European Research Area – CIT3/CT/2005-006193, 6th FP, 2005/2009, ‘Measuring the Dynamics of Organization and Work (MEADOW – Priority 7: Citizens and Governance in a Knowledge-based Society – 028336, 6th FP, 2007-2010). 9We would like to express our gratitute to the Slovak team members, especially, Prof. Lubica Bajzikova, the team coordinator for Slovak data collection and analysis (Lubica Bajuzikova, Helena Sajgalikova, Emil Wojcak, and Michaela Polakova (2008) ‘Multinationl and Local Resources – Business Services (Report for Slovakia), Bratislava: Comenius University in Bratislava – Faculty of Management, Slovac Republic, May 2009. p. 25).

27
1.2. Sample of the company survey and sampling method The cross-country company survey was designed to collect systematic information
on the working practices of business service firms operating in Hungary and
Slovakia.10 There is no generally accepted definition for ‘business service;’ this
category covers rather heterogeneous economic activities. In our study, based on
screening of the literature and with the intention to produce internationally
comparable data, the knowledge-intensive professional services offered for other
companies are defined as ‘business services,’ such as IT services (both software and
hardware), administrative and legal services, financial services, and R&D.11 Table 7
contains the activities selected for the purpose of the company surveys in both
Hungary and Slovakia.
In the first quarter of 2008, according to the National Register of Economic
Organizations compiled by the Hungarian Central Statistical Office (HCSO), 4,049
companies with 10 or more employees were registered in the field of business
services, while 2,714 were registered in Slovakia.12 In order to design a statistically
representative sample of firms, 200 companies were selected from Hungary and
100 companies from Slovakia using a multi-stage stratified sampling method. The
basic economic activity of the firms classified by the NACE code was used as the
stratification variable. This sampling method ensured equal chances for all
companies belonging to the population surveyed to be selected in the sample and
reflected in the heterogeneity of the organizational population as well. In other
words, the sampling structure reflects the composition of the companies operating 10 Regarding the service sector, the following classifications were often used (Salter-Tether, 2006): (1) traditional service (e.g., personal service), (2) system service (e.g., airlines and banking), and (3) knowledge-intensive business service (KIBS). The main focus of our research is on activities classified under the KIBS. 11 For more details, see Makó-Illéssy-Csizmadia (2008). 12 Bajzikova-Sajgalikova-Wojcak-Polakova, 2009: 5-6.

28
in various (e.g., ‘new’ and ‘mature’) economic activity branches. For instance, there
are more IT companies within the field of IT services than facility management
providers or more clothing companies within the ‘mature’ manufacturing than the
pharmaceutical industry. The sampling frame was restricted for companies
employing at least 10 persons. Firms with 0 to 9 employees were excluded because,
according to previous research experiences, these firms are hardly available for
surveys and also because the division of labor within these firms is rather
underdeveloped, making it difficult to find and compare the forms of organizational
innovation with other size categories of firms (Valeyre et al., 2009).
Here, it is noteworthy that, in Hungary, the research covered both the
manufacturing and the KIBS sectors. Partly due to the lack of available resources
and for the sake of an international comparison, the sample in manufacturing was
limited to the following sub-sectors: textile and clothing products, machinery, and
the automotive, pharmaceutical, and electrical industries. These sub-sectors
represent different ‘maturity cycles’ with respect to the technology used, work
organization, and knowledge-use practices. The so-called ‘mature’ industrial
sectors are the textile and clothing industries, machinery, and car industries, and
the ‘new’ sectors are the pharmaceutical and electrical industries, together with
computer equipment producers.
We may summarize the empirical findings concerning the manufacturing
sector as follows: the largest segment of the Hungarian manufacturing firms was
created at the beginning of the 1990s. Within the group of manufacturing firms, the
share of foreign ownership is twice higher than that in the KIBS sector, and, while
multinational KIBS firms are supervised by the Hungarian headquarters, the
manufacturing firms’ headquarters are located primarily in foreign countries, such
as Germany, Austria, and Japan. A very important distinctive feature of the

29
manufacturing sector compared to the KIBS is that the KIBS firms are focused
almost exclusively (94.7 %) on the Hungarian market, while the manufacturing firms
have a more balanced distribution between the Hungarian and foreign markets and
the manufacturing firms are more active in both the domestic and foreign markets.
By and large, the diffusion of less radical or incremental innovation characterizes
both sectors. However, the ‘interdisciplinary working groups’ are more widely
diffused in the manufacturing sector.
Table 7. Share of KIBS firms by types of activities (NACE13 codes) in Hungary and Slovakia (%)
Activity Hungary Slovakia Accounting, finance, and legal services (NACE codes: K 66.1, Activities auxiliary to financial services, except insurance and pension funding; K 66.2, Activities auxiliary to insurance and pension funding; K 64.9, Other financial service activities, except insurance and pension funding; M 69, Legal and accounting activities; M 70, Activities of head offices; management consultancy activities)
20.9 22.7
Human resources management (NACE codes: N 78, Employment activities; P 85.5, Other education) 19.4 20.7
Technical engineering, consultancy (NACE codes: M71, Architectural and engineering activities; technical testing and analysis; M 72, Scientific research and development)
25.2 18.5
Information- and computer-related activities (NACE codes: J62, Computer programming, consultancy, and related activities; J 63, Information service activities)
21.9 21.6
Advertising, marketing, customer service, other services (NACE codes: M 73, Advertising, market research; M 74.3, Translation and interpretation activities; N 77.3, Renting and leasing of other machinery, equipment, and tangible goods; N 81.1, Combined facilities support activities; N81.2.2, Other building and industrial cleaning activities; N 82.2, Activities of call centers)
12.6 16.5
Total 100 100
13 NACE: ‘Statistical Classification of Economic Activities’ – an international statistical systems for the classification and registration of economic activities. Source: http://ec.europa.eu/competition/mergers/cases/index/nace_all.html

30
1.3. Structure of the questionnaire and characteristics of the data Collection
The fieldwork took place in 2008 in Hungary, and the survey was divided into two
stages as a result of the summer holiday season. The Slovak survey was carried out
between October 2008 and January 2009 in a rather unfriendly climate for social
research in the context of the global financial and economic downturn.
To ensure the quality of data collection, specific steps were taken. In
addition to the 200-element sample in both countries, additional address lists of
400 companies in Hungary and 200 companies in Slovakia were used to reduce the
expected refusal rate of the selected population (managers and/or owners). To
guarantee good quality of data, personal interviews were conducted with top
managers of the firms surveyed. Before starting the fieldwork, the interviewers and
their coordinators were trained by the designers of the project at the Institute of
Sociology of the Hungarian Academy of Sciences. In addition, project designers and
coordinators randomly supervised the interviewers by follow-up phone calls to
respondents. The quality assurance covered the data recording and the compilation
of the database as well. During data recording, an automatic control system and
internal logical investigations were applied by using special algorithms to minimize
the chances of any possible failures. In designing the questionnaire, a pilot survey
was conducted to test the possible cognitive contradictions of the planned
questions. As a result of the multi-level monitoring of data collection, the final
database in the Hungarian business services was restricted to 196 cases and, in the
Slovak business services, to 97 cases, ensuring the validity and internal coherence
of data. To guarantee the statistical representativeness of the survey, the data sets
were weighted. The final database is statistically representative of the firm
population surveyed, i.e., the 4,094 companies operating with at least 10

31
employees in Hungarian business services and the 2,714 companies operating with
at least 10 employees in the Slovak business service sectors investigated.
In designing the questionnaire, we made a ‘benchmarking exercise’ to review
the Hungarian and international surveys dealing with various features of
organizational innovation. Among other things, we have been learning extensively
from such projects as the Danish DISKO (Danish Innovation System in Comparative
Perspective) survey carried out five times between 1993 and 2006 by the Aalborg
University Business School, the Community Innovation Surveys (CIS) carried out six
times by Eurostat, the Continuous Vocational Training (CVTS) survey carried out in
1999 and in 2006 by Eurostat, and several Europe-wide surveys organized by the
European Foundation for the Improvement of Living and Working Conditions
(Dublin). Finally, in designing our organizational survey methods, the members of
the international research team relied substantially on ‘The MEADOW Guidelines’
(EU 6th FP Project, which ‘… set out guidelines for collecting and interpreting
information on both organizational states and organizational change. The
Guidelines are concerned with collecting data at the workplace and employee level
providing relevant definitions and indicators for capturing general characteristics of
organizations, such as the nature of authority relations and the method of
coordination and control.’14
In addition, designing the research tools of the Hungarian and Slovak
company surveys, in 2007, the Research Group of Sociology of Organization and
Work (Institute of Sociology) of the Hungarian Academy of Sciences launched a
national survey to test concepts and questions measuring the diffusion of new
14 The Measuring the Dynamics of Organization and Work (MEADOW) Project funded within the 6th Framework Program of the European Comission DG Research (http://www.meadow-project.eu/).
32
organizational values or institutional standards in more than 500 industrial firms
(Makó-Illéssy-Csizmadia, 2007).
The questionnaire used in the company survey in both countries in the KIBS
sectors was finalized after the pilot study, which aimed to test the validity of the
questionnaire within the cluster of firms (n=36) belonging to the ‘Magyar
Outsourcing Szövetség’ (Hungarian Outsourcing Association) comprising ‘leading-
edge’ firms in the KIBS sector. The finalized questionnaire, composed of 43
questions, has the following four thematic sections:
1. General characteristics of firms. This section contains a description of the
architecture of the organization (e.g., length of operation and size), ownership,
market structure, types of activities, and type of technology employed.
2. Composition of Management and Institutional Transfer of Business Practices. This
section includes a report of firms in which foreign managers are employed and an
examination of the share of foreign versus local managers, the recruitment practice
of foreign managers, and the generic business functions occupied by them. In
addition, this section indicates the degree of autonomy in the local subsidiaries in
developing their business practices.
3. Diffusion and Drivers of Organizational Innovation. In addition to mapping the
differences and/or similarities of forms of organizational innovation, this section
contains an examination of the degree of embeddedness of the ICT in the business
practices in the sectors surveyed. Regarding the forms of organizational innovation,
the drivers of innovation are also identified.
4. Characteristics of Knowledge Development Practice in the Firm. In this section,
the dominant combination of the required skills or competencies is identified. In
assessing the training practices of the firms surveyed, we tried to understand not
only the roles of the formal training and education in the skill formation of

33
employees but the importance of the so-called on-site (in situ) learning. In addition,
particular attention was given to the role of the various external knowledge sources
in skill development.

34
2. Organizational architecture, management, and business practice transfer
The empirical outcomes are based on data collected during 2008 and 2009
company surveys that involved firms employing more than 10 persons in the KIBS
sector in both Hungary and Slovakia. The report presents a preliminary descriptive
statistical analysis of the survey results using variables such as ownership, company
size, year of consolidation, market structure, and company group membership
(networking). In addition, this section shows the composition of the management
and the patterns of transferring business practices.
2.1. Ownership, size, market structure, and source of the firm’s competitiveness
2.1.1. Incorporation and ownership structure of surveyed firms
One-fifth (21.1 %) of the firms in the Hungarian KIBS sector were incorporated
(established) in the last four years, and one-fourth (24.7 %), from 2000 to 2003.
Only a tiny minority of the firms (6.5 %) were established in the period of state
socialism (i.e., before 1990). The peak year of the company establishment in the
KIBS sector was at the beginning of the new millennium, when the growth rates of
the firms were as follows: 9.8 % in 2004, 7.2 % in 2003, and 7.9 % in 2000. A similar
pattern of company creation was identified in Slovakia as well. The overwhelming
majority of business service companies in Slovakia were established after 1990, and,
as in Hungary, only a share of them (6.5 %) existed during the period of state
socialism.

35
With regard to the ownership structure of the surveyed firms, in both
countries, namely, in Hungary (87.5 %) and Slovakia (52.6 %), the domestically
owned firms dominate. However, the share of foreign-owned firms is almost three
times higher in Slovakia than in Hungary (26.8 % versus 9.5 %). Similarly, the share
of mixed ownership is visibly higher in the Slovakia than in Hungary. The
composition of firm ownership is shown in Table 8.
Table 8. Ownership composition of firms in the KIBS sectors
Types of ownership Hungary n=196
Slovakia n=97
Domestic or national ownership 77.5 % 52.6 % Foreign ownership 9.5 % 26.8 % Mixed ownership 13.0 % 20.6 %
The KIBS firms are very young and dominated by domestically owned firms.
However, in Slovakia, the share of foreign or mixed ownership is significantly higher
than in Hungarian business service sector firms. In summary, the majority of the
surveyed firms, especially in Hungary, belong to the de novo segment (Martin,
2008) of the economy in both countries. They were created following the collapse of
the state-socialist economy and are domestically owned.
Membership in a company group or company networking plays an important
role in the learning and innovation capacity of business organizations due to access
to a greater knowledge pool and smoother knowledge sharing and transferring
practices. Firms belonging to a company group tend to be more innovative than
single firms. In this field, we found visible differences in the two countries.
Company group or network firms represent the minority of the Hungarian business
service firms (18.2 %), while, in Slovakia, every second firm surveyed (50.5 %)
belongs to this category. In addition, looking at the headquarters ownership, again,
the differences are striking. More than three quarters of the Slovak business service

36
firms belong to groups located in 10 countries, the USA being the most frequent
location (28.6 %); the remaining 30 % of firms have headquarters in Germany, UK,
and the Czech Republic. An important percentage of the business service firms’
headquarters (14.3 %) were located in such countries as Austria, Ireland, France,
Netherlands, and Slovenia. In the case of the Hungarian KIBS sector, domestically (or
Hungarian) based headquarters dominate. The foreign headquarters are dispersed
in 10 countries, and Austria is the dominant location for the company headquarters.
In relation with the important innovation generating impacts of company
networking, the following empirical example is noteworthy. The results of the
Danish innovation surveys (DISKO) empirically confirm this view: manufacturing
firms operating as a member of company groups, especially foreign owned groups,
have visibly higher innovation activity than single firms (see Table 9 for details.).
Table 9. Product or service innovation in 1993-95 and/or 1998-2000 ownership/company group membership P/S innovation
1993-1995 and 1998-2000
P/S innovation 1993-1995 or
1998-2000
Not P/S innovative (N)
Danish group member 33.1 % 39.6 % 27.2 % 169
Foreign group member 51.0 % 27.5 % 21.6 % 102
Single firm 22.2 % 32.9 % 44.9 % 216 All firms 32.0 % 34.1 % 33.9 % 487 Note: P=product innovation, S=service innovation Source: Nielsen, P. ( 2006: 42)
Nielsen (2006: 42) emphasizes ‘… single firms have the largest group of the firms
with no product innovation in the periods surveyed. Danish group firms have the

37
largest share of one-time innovators and foreign group firms have the largest
proportion of firms with innovation in both periods. This distribution may be an
indication of the importance of economic resources or international influence, and
not least of the importance of the international or global dimension, on the
propensity to innovate among firms.’
2.1.2. Size and Organizational Architecture of Firms: Dominance of Small and Flat Organizations
The next table shows the size distribution of the surveyed firms. In both the
Hungarian and the Slovak business service sectors, the share of small firms (i.e.,
those with 9 to 49 employees) is rather high: almost four-fifths (78.7 %) of the
Hungarian KIBS firms belong to this category, but, in the Slovak case, slightly more
than every second firm (56.7 %) belongs to this class. It is also noteworthy that
there are three times as many large firms in the Slovak KIBS sector (16.5 %) than in
Hungary (4.6 %). In addition, there are more Slovak companies in the medium
category than in Hungary (26.8 % versus 16.6 %). Briefly, the size of the Slovak KIBS
firms is more balanced than that of the Hungarian ones.
Table 10. Size of the firms in the KIBS sector
Size of the firms Hungary n=196
Slovakia n=97
Small firm (9 – 49 persons) 78.7 % 56.7 % Medium firm (50 – 249 persons) 16.6 % 26.8 % Large firm (250 and over) 4.6 % 16.5 %
In addition to the size category, we examined the organizational architecture
of the firm. The consensus among organization and management scientists is that
the organizational levels separating the highest and lowest positions in the

38
occupational/job hierarchy influence the flexibility and learning capacity of the firm.
In both countries, slightly more than every second business service firm (Hungary:
56.8 % and Slovakia: 56.6 %) has only one or no separate hierarchical level. Besides
this similarity in the organizational architecture, the share of Hungarian firms with 2
or 3 hierarchical levels is slightly higher than that in Slovakia (38.1 % versus 29.9 %).
However, firms having 4 or more hierarchical levels represent a slightly higher share
in the Slovak than the Hungarian KIBS sector (10.5 % versus 13.4 %), which can be
explained by the significant share of larger firms in the Slovak KIBS (16.5 %) than
the Hungarian one (4.6 %).
Table 11. Types of business services by value-added content
Characteristics of services Hungary n=196
Slovakia n=97
Customer-tailored 83.7 % 66.3 % Standardized 32.4 % 33.7 % High value-added 65.8 % 70.8 % Low value-added 32.8 % 29.2 %
Comparing the types of business services, basically, similar patterns were
identified. In relation with the scale of services, ‘customer-tailored’ solutions are
dominant in both countries. However, in Hungary, they represent a visibly higher
share of the services than in Slovakia (83.7 % versus 66.3 %). The standard solutions
score minimally and have a roughly similar share in both countries (Hungary: 32.4 %
and Slovakia: 33.7 %). Similarly, the high value-added content of services is
dominant in both Hungary and Slovakia, although it has a slightly higher share in
Slovakia (65.8 % versus 70.8 %). The low value-added services represent less than
one third of all services in both countries (Hungary: 32.8 % and Slovakia: 29.2 %). In
addition, it is noteworthy that almost one third of the Hungarian (28.6 %) and Slovak
firms (29.9 %) exclusively produce high value-added services. However, 14.4 % of

39
the Hungarian and only 3.1 % of the Slovak firms in the KIBS do not offer high
value-added services. The composition of services by degree of standardization and
value-added content is illustrated in the Table 11.
Table 12. Market distribution: primary and secondary markets
Types of markets
Hungary n=196
Slovakia n=97
Primary market Secondary market Primary market Secondary
market National market 94.7 % 3.4 % 55.4 % 39.9 %
EU-15 countries 10.5 % 4.8 % 22.8 % 38.6 %
New Member States (NMS) 6.5 % 8.0 % 23.3 % 46.7 %
North America 2.4 % 1.5 % 25.6 % 16.3 % Russia and Ukraine 1.5 % 1.5 % 12.8 % 29.8 %
Asia 1.9 % 2.3 % 11.6 % 25.6 % Others 1.5 % - 16.7 % 12.5 %
2.1.3. Market structure: The Slovak KIBS firms are more involved in the Global Value Chain (GVC)
During the survey, managers/owners were asked to locate their market share in
relation to their primary and secondary markets. Although to a significantly
different degree, the domestic product market is playing a crucial role in both
countries. However, the domestic market as the primary market is playing a more
important role for Hungary (94.7 %) than for Slovakia (55.4 %). The market structure
is more balanced in the Slovak KIBS sector, where the international market (both
primary and secondary) is playing a more important role than in Hungary. A higher
share of firms is focusing on both the North American (25.6 %) and the EU-15
(22.8 %) markets than in Hungary. In other words, we may say that the Slovak firms
are more integrated into the global value chain (GVC) of business services than the

40
Hungarian ones. Table 12 illustrates the market composition and its relative
importance for the firms surveyed.
Table 13. Sources of competitiveness: Hungarian versus Slovak KIBS sector (ranking)
Factors of competitiveness Hungary n=196
Slovakia n=97
Reliability 92.4 % 85.7 % Quality 90.5 % 83.5 % Experience 88.2 % 81.9 % Flexibility and speed 88.8 % 83.1 % Skilled labor force 85.7 % 81.8 % Customer orientation 82.7 % 83.7 % Price 78.6 % 73.8 % Variety of products and services 67.4 % 29.9 % Image and brand 60.4 % 73.2 % Continuous development of products and services 67.6 % 70.9 %
Lobbying 45.0 % 39.0 %
Note: Factors of competitiveness were measured by managers on a 5-point scale, where 1 is the least important factor and 5, the most important one.
2.1.4. Source of the firms’ competitiveness: reliability, quality, and flexibility with slight country variation
During the survey, company managers were asked to assess the role of 11 factors
shaping the competitiveness of their firms. As shown in Table 13, in both countries,
the following four factors play a similarly decisive role: (1) reliability, (2) quality, (3)
flexibility/speed, and (4) experience. The variety of products and services
represents the only noticeable difference between factors of competitiveness. In the
case of Hungary, more than two thirds of the company managers stressed their
importance (67.4 %), compared with less than one third (29.9 %) of their Slovak

41
counterparts. Surprisingly, price, continuous development of services, branding,
and lobbying are also less important.
2.2. Composition of company management and transferring business practices
In this section, we outline the composition of management and the autonomy of the
local managers to develop business practices in the subsidiary units of foreign-
owned companies. According to previous research (Adler, 1999; Makó-Nemes,
2003: 105-142), the presence of foreign managers (expatriates) played a key role in
transferring managerial competence and methods during the acquisition of
Hungarian firms by multinational corporations (MNCs), especially in the catch-up
phase of the merging market economy in post-socialist countries. Some scholars
dealing with transformation economies characterized this early period with the term
‘knowledge deficiency,’ indicating that the managers socialized in the period of
state socialism most often did not possess market economy-consistent competence
(Thompson, 1993). However, in the last two decades, local managers successfully
acquired the necessary competence to manage their firms. In spite of the progress
to diminish the so-called ‘knowledge deficiency’ syndrome, foreign managers
(expatriates) still play crucial roles in assisting their local colleagues in the fields of
such high value-added activities as research and innovation.
2.2.1. Dominance of local managers with visible country differences. Expatriates in high value-added business functions
Table 14 shows the composition of managers (foreign and host country national) by
the type of generic business functions (services) assigned to them. The general
trend in the KIBS sector of the two countries is that the majority of the managerial
positions were filled by locals; however, in the Slovak case, the presence of foreign

42
managers or expatriates is much more visible than in the Hungarian one. In the
Slovak KIBS firms, expats are dominant in the fields of accounting and finance. In
addition to these functions, their presence is higher than in the Hungarian firms in
such functions as production management (41.3 % versus 16.4 %), quality control
(QC) (43.5 % versus 27.7 %), sales and marketing (30.3 % versus 17.4 %), customer
service (34.8 % versus 5.9 %), ICT (40.4 % versus 6.9 %), and R & D (36.2 % versus
23.0 %).
Table 14. Share of foreign managers and locals in the various business services – greater presence of expats in the Slovak KIBS
Business functions
Hungary n=196
Slovakia n=97
Foreign managers
Hungarian managers
Foreign managers
Slovak managers
R&D 23.0 % 63.9 % 36.2 % 63.8 Sales and marketing 17.4 % 72.6 % 30.3 % 69.7 %
ICT 6.9 % 80.8 % 40.4 % 59.6 % Production management 16.4 % 70.5 % 41.3 % 58.7 %
Customer service 5.9 % 83.6 % 34.8 % 65.2 %
HRM 22.4 % 72.5 % 23.9 % 76.1 % Quality Control 27.7 % 60.0 % 43.5 % 56.5 % Accounting and finance 19.3 % 80.7 % 52.2 % 47.8 %
2.2.2. Hybridization as a common pattern in transferring business practices
In the 1990s, there was intense debate in the literature of Human resources
management (HRM) concerning the degree of autonomy of subsidiaries of foreign
firms (e.g., Japanese automobile plants in the U.S.A.) in developing their business

43
practices. The concept and practice of hybridization are generally interpreted as a
mixture of the host and foreign countries’ (e.g., the mother country of the MNCs)
business practices.
During the survey, we asked our respondents working in foreign-owned
company groups about their degree of autonomy in developing business practices
in general and, in particular, to assess their autonomy in creating their HRM system.
Local managers in the KIBS sector are not free to operate their business processes.
In both countries, the great majority of firms are using the strategy of ‘creative
adaptation’ or ‘hybridization’ in developing their business practices (Hungary:
69.4 % and Slovakia: 69.5 %). This means that, in Hungarian and Slovak foreign-
owned firms, the ‘working standards’ or the ‘guiding principle’ of the headquarters
plays an important norm setting or ‘benchmarking’ role in creating local business
practices. Local managers, however, still have a certain degree of autonomy in
developing the management methods and organizational structure of the firm. In
more than one fifth (21.9 %) of the Hungarian firms, local managers are still free to
develop their business practices. In Slovak practices, autonomous development of
business practice occurs in less than one fifth of the firms (16.2 %).
However, only a minority of firms is copying the business practices of their
mother company. The share of firms mechanically adopting the mother company
business practice is smaller in Hungary than in Slovakia (8.7 % versus 14.3 %).
Finally, it is noteworthy that the role of customer experience is less important for
the development of original business practices in both countries (Hungary: 8.3 %
versus Slovakia: 7.6 %). The degree of autonomy enjoyed by local managers in the
development of their own business practices is shown in Table 15.

44
Table 15. Autonomy of local managers in creating business practices in subsidiary firms of foreign companies
Sector (Sample size) Hungary n=32
Slovakia n=38
A) The method of developing business practices a) Autonomously but within the framework of the company group guidelines
39.1 % 24.8 %
b) Adapting to the local conditions of the mother company standards 22.1 % 22.9 %
c) Using the standard of the mother company and further development 8.1 % 21.9 %
d) Adopting mechanically (copying) the standards of the mother company 8.7 % 14.3 %
e) Learning from the customer 8.3 % 7.6 %
f) Independently creating business practices 13.6 % 8.6 %
B) Pattern of developing business practices
a) Creative adaptation: Hybridization 69.3 % 69.5 %
b) Copying 8.7 % 14.3 %
c) Original development 21.9 % 16.2 %
Looking at the creation of HRM practices,15 the great majority of subsidiary
firms of foreign-owned companies significantly respect the local institutional and
15 In relation to the hybridization of Human Resources Management (HRM), Adler (1999: 75-80) made a distinction among the following five theoretical strands: 1) The ‘rational design view,’ in which the type of activity or technology of firm shapes the optimal organizational framework for HRM; 2) The ‘culturalist approach,’ in which adaptation is necessary only in the cases in which the cultural differences between the host and mother countries are significant; 3) The ‘strategic strand,’ in which the firm indicates that the foreign firm is following a diverse strategy (e.g., geocentric, ethnocentric, and administrative heritage) in controlling the local actitivity of its subsidiary firm; 4) The ‘institutional approach,’ in which the HRM practice in the subsidiary firm is shaped by ‘identical structures’ in the subsidiary and mother firms or by the forces of ‘isomorphism;’ and 5) The HRM practice, which,

45
labor market regulatory system. This means that the hybridization process is
dominant. According to several studies dealing with the institutional transfer of
organizational and management practices (e.g., Ishikawa, Makó, Warhurst, 2006;
Koike, 1998; Kennedy, Florida, 1991), in the case of the HRM, firms, independently
of their economic sector, have greater autonomy than they do in transferring other
areas of business practices (e.g., production methods, quality assessment, and
auditing). From this viewpoint, the remark of former President Fujio Cho of the
Toyota Motor Manufacturing Company in Kentucky (U.S.A.) (Adler, 1999: 86) is
revealing:
‘I told people here that the (Japanese) coordinators were teachers on production
issues and TPS (Toyota Production System), but that they were the students on the
office areas, such as Legal, Human Resources, and Public Affairs.’
It is not at all surprising that the number of firms that are copying the
mother company Headquarters’ system in the KIBS is lower in the field of HRM than
that of firms that are copying business practices in general. However, the following
contrasting differences were found between the Hungarian and Slovak business
service companies. The percentage of firms developing a hybrid version of or
mechanically copying the headquarters HRM practices is higher in the Slovak
according to the ‘resource-dependent strand,’ in the local subsidiary is the result of the following three forces: mother company, subsidiary firms, and other local institutions. These approaches explain the hybridization of business practice (e.g., HRM) in a rather different way. For instance, in the logic of an ‘institutional view,’ Scott (1991) notes that, in the case of the HRM practice, the pressure to legitimate is much stronger than the pressure for efficiency. In the argument of the ‘resource-dependency strand,’ the production practice is less dependent on external actors than it is in the field of HRM, and, according to the ‘strategic explanation’ for the headquarters of the MNCs, the financial performance of the subsidiaries is more important than the tools or methods used.

46
(78.4 % and 11.8 %) than the Hungarian firms (58 % and 5.8 %). It is noteworthy that
the share of firms autonomously creating their HRM practice is significantly higher
in Hungary than in Slovakia (Hungary: 36.2 % versus Slovakia: 9.8 %) (see Table 16.).
Table 16. Patterns of transferring HRM practices into subsidiary firms of foreign companies
Sector (Sample size) Hungary Slovakia
Modes of Transfer
a) Consistent with the local and the headquarters’ requirements 30.4 % 45.1 %
b) Local practice created independently from the headquarters of the mother company
36.2 % 9.8 %
c) Adapting the headquarters’ HRM system to the local conditions 27.6 % 33.3 %
d) Mechanically copying the HRM practices of the headquarters of the mother company
5.8 % 11.8 %

47
3. Diffusion and drivers of organizational innovation and the ICT use
3.1. Developing typology of organizational innovation: A brief theoretical overview
Organizational and technological innovations are in interaction, and, even before
the Second World War, Schumpeter (1934) recognized the interrelatedness of
various forms of innovation and went beyond that to focus exclusively on the
technical side of innovation. In his view, technological and organizational
innovations were interrelated, and Lam wrote that Schumpeter ‘...saw organizational
changes, alongside new products and processes, as well as markets as factors of
‘creative destruction’ (Lam, 2005: 115). Schumpeter made a distinction among the
five following types of innovation:
1. New product ;
2. New production methods;
3. New markets;
4. New sources of supply;
5. New forms of organization.
Other innovation researchers, following the Schumpeterian intellectual
heritage, are looking at the innovation as ‘... a complex phenomena including
technical (e.g., new products and new production methods) and non-technical
aspects (e.g., new markets and new forms of organization) as well as product
innovation (e.g., new products or services) and process innovation (e.g., new
production methods or new forms of organization).’ 16 Based on these
16 See Armbruster et al. (2008: 644-645).

48
considerations, the authors distinguished four different types of innovation: (1)
technical product innovation, (2) non-technical service innovation, (3) technical
process innovation, and (4) non-technical process innovation, understood to be
organizational innovation.
Unfortunately, in spite of the abundance of literature on organizational
innovation, there is no consensus among innovation researchers regarding the
definition of ‘organizational innovation.’ In this respect, Lam (2005: 116)
categorized the literature as follows, representing the different interests and issues
and to identify and assess organizational innovation:
(1) Organizational design theories deal primarily with relationships between
structural forms and the capacity of an organization to innovate (Mintzberg, 1979;
Teece, 1998).
(2) The organizational change and adaptation (development) theory is used to
understand the ability of an organization to overcome the forces of stability (inertia)
and adaptation/change in the context of a radical shift in its environment and
technological setting. Innovation represents the capacity to answer or respond to
the challenges created by radical shifts in an organization’s external environment
(Hannan–Freeman, 1984; Child, 1997).
(3) The third theoretical stream focuses on the micro-process level of how an
organization understands the characteristics of knowledge creation and learning
within an organization. This organizational cognitive approach explains the
interplay between learning and organizational innovation (Nonaka–Takeuchi, 1995;
Senge, 1990; Amiable, 1988; Argyris–Schön, 1978).
In addition to this effort (Lam, 2005) to classify the various theoretical
streams, the Schienstock (2004) innovation matrix intends to integrate key
comprehensive organizational innovation. His approach goes beyond dualistic

49
theoretical strands that made a distinction between isolated (cumulative) and
integrative (holistic) innovation (Alasoini, 2003). In Schienstocks’ classification
attempt, one dimension of classification relates to the ‘core’ components of an
organization, and the other refers to the changes in the ‘relations’ of the core
components. Using these two dimensions, the matrix shown in Table 17 describes
the possible types of organizational innovation from both a static and a dynamic
perspective.
In this perspective, the cumulative or incremental type of organizational
innovation does not produce changes in the core elements and in their relations
within an organization. For example, job rotation and job enrichment, which remain
in the scope of an individual workplace, are the organizational methods belonging
to this type of organizational innovation. According to Schienstock (2004), a
modular version of organizational innovation, such as a cross-functional project
team, changes the content of the core element of an organization but does not
modify the relations among them. Contrary to the incremental and modular types of
organizational changes, architectural innovation, such as the decentralization of
responsibilities and decisions within an organization, may result in a shift in the
existing balance of interest and power relations. Similarly, such radical innovation
as the creation of project-based firms (PBF) may modify both the core elements and
their relations within the firms. In translating these major forms of innovation into
the language of organizational learning, the incremental or modular forms of
innovations require a single-loop or first-level mode of learning, and radical
innovation represents a double-loop or second level (holistic) form of
organizational learning.
Armbruster et al. (2008), implicitly adopting Schienstock’s (2004) theoretical
classification of organizational innovation, are developing an item-oriented

50
typology of organizational innovation. In their definition of ‘organizational
innovation as the use of new managerial and working concepts and practices’
(Armbruster et al., 2008: 646), the item-oriented typology of organizational
innovation makes a distinction between structural and procedural organizational
innovations and their intra-organizational and inter-organizational dimensions
(using Schienstock’s categories, the incremental and modular innovations are
classified into the category of process innovation, and the architectural and radical
innovations belong to the category of structural organizational innovation).
Table 17. Typology of organizational innovation*
Relations between the core components of the organization
Core components of the organization
Not changing Changing
Not changing Incremental innovation (e.g., participation of
employees in quality control)
Modular innovation (e.g., cross-functional or interdisciplinary project
team)
Changing Architectural innovation (e.g., lean organizations)
Radical innovation (e.g., project-based firms,
PBF)17
Source: Shienstock (2004: 18)
An item-oriented typology of organizational innovation, developed by
Armbruster at al. (2008), is convenient to empirically measure (monitor)
organizational innovation using the tool of organizational surveys.
The groups of an ‘item-oriented typology of organizational innovation’ are
as follows:
1. Structural organizational innovation, which may modify the divisional structure
of organizational functions, hierarchical levels, and information flow, or, in general,
17 See Whitley (2004).

51
the organizational architecture of the firm. This type of innovation requires changes
in the existing status quo (and the related interest) and power relations within the
organization.
2. Procedural organizational innovation, which may change the process and
operation routines within the firms, such as improving the flexibility of manpower
and the use of knowledge through the implementation of team work, just-in-time
production systems (Kan-Ban in Japanese), or quality circles.
3. Intra-organizational innovation that is taking place within an organization.
4. Inter-organizational aspects of innovation, which refer to new organizational
forms and processes that exist beyond the organizational border of the firm.
3.2. Diffusion and drivers of organizational innovation
Our company survey was designed to focus exclusively on intra-organizational
innovation, and it was not our intention to cover new organizational forms (e.g.,
project-based firms), which are beyond the scope of the individual firm’s
organization. Regarding the various forms of intra-organizational innovation, the
diffusion of both structural and procedural organizational innovation was our
primary interest. The following forms of structural and procedural organizational
innovation were assessed by a representative of the firms surveyed:
a) Structural organizational innovation:
- Project-based work;
- Lean or flat organization;
- Inter-professional (functional) working groups.
b) Procedural organizational innovation:
- Quality-assurance or continuous improvement process (e.g., ISO, TQM);
- Collecting suggestions from workers;

52
- Teamwork;18
- Benchmarking;
- Job rotation;
- Delegation of quality assurance to workers (decentralization).
Among the above-listed new organizational or managerial practices,
‘structural organizational innovation’ is less often used than its ‘procedural’ version.
This is not by chance, because structural organizational innovation affects both the
‘core’ components and their relationships within the organization. These types of
changes require significant modification in the existing interest and power relations
and some participation in the collective learning of various actors. On the other
hand, successful procedural innovation can be carried out without a radical shift in
the core components and their relationships within an organization and requires
rather limited learning activity from the actors concerned.
It is clear from the empirical data collected from the company surveys that
strong differences are characterizing the diffusion of organizational innovations in
the Hungarian and Slovak KIBS sectors. For example, such forms of structural (or
radical) organizational innovation as project-based work, lean organization, and
inter-professional working groups are more widely used in Slovak than Hungarian
KIBS company practices.
In the case of the diffusion of procedural organizational innovation, the
contrast diminishes. Teamwork (89.6 % versus 41.7 %), quality management (33.0 %
versus 21.9 %), and, particularly, job rotation (28.9 % versus 9.7 %) are more often
used in Slovak than Hungarian firms. However, in Hungarian firms, in comparison 18 Both teamwork and job rotation are key components of the lean production and ‘high-performance work systems,’ and the use of teams, in particular, has been the subject of many studies concerned with the impact of new managerial practices on enterprise performance and on the quality of work, including worker satisfaction (Kyzlinková, Dokulilová, and Kroupa, 2007).

53
with the Slovak practice, the quality circles (23.7 % versus 14.4 %), benchmarking
(37.3 % versus 21.6 %), and collecting suggestions of employees (49.7 % versus
41.2 %) were more prevalent (see Table 18 for more details).
Table 18. Diffusion of new (‘leading edge’) managerial practices in the KIBS sector
Types of Organizational Innovation* Hungary n=196
Slovakian=97
I. Structural organizational innovation:
Project-based work 34.8 % 69.1 % Flat or lean organization 10.7 % 13.4 % Inter-professional (inter-disciplinary) working groups 13.4 % 36.1 %
II. Procedural organizational innovation:
Quality Assurance and Auditing Systems (e.g., ISO and TQM) 21.9 % 33.0 % Collecting suggestions from employees 49.7 % 41.2 % Team work 41.7 % 89.6 % Benchmarking 37.3 % 21.6 % Quality control carried out by rank-and-file employees 23.7 % 14.4 % Job rotation 9.7 % 28.9 %
Note: Attempts to classify different types of organizational innovation based on the approach of Armbruster et al. (2008: 646-647).
In mapping the diffusion of organizational innovation, besides grouping nine
forms of organizational innovations into the categories of ‘structural’ and
‘procedural’ innovations, we used the four larger classes of organizational
innovations listed below:
1. New methods in organizing work (i.e., collecting suggestions from employees,
team work, job rotation, and lean organization);

54
2. Creating new methods to renew external relations (networking)19 with other firms
and public institutions;
3. Implementing new business practices20 that have an impact on the organizational
and labor process; and
4. Introducing new knowledge management methods to improve the quality of
information processing and facilitate knowledge sharing.
According to the survey results, there are visible differences in the
Hungarian and Slovak company practices in the KIBS sectors. In Slovak business
service practices, the share of firms implementing new business practices and new
methods of knowledge management is rather high in comparison to the Hungarian
case (Slovakia: 44.3 % versus Hungary: 26.1 % and Slovakia: 33.0 % versus 18.0 %).
In this relation, it is necessary to mention that one of the key challenges for the
high-quality knowledge management (KM) in the KIBS firms is how to
codify/formalize the working experiences of project-level learning into
organizational knowledge.
In this relation, several options are available. As Salter-Tether (2006:16) reported,
‘In order to help ameliorate some of these problems and to increase the
effectiveness of their project performance and knowledge sharing between projects,
professional service firms have invested considerable resources in knowledge
management (KM). This approach to KM varies, with some organizations investing
heavily in technology to capture knowledge through documentation and data, and
19 The content of external relations or networking was as follows: alliances,
partnerships, and delocalization of business functions. 20 The new business practices covered such activities as supply change
management, reengineering business process, learning organization, renewal education, and training system.

55
others introducing cultural change initiatives to encourage knowledge sharing
within organization. These KM systems include electronic networks of practice,
expert yellow pages, communities of practice, project repositories, searchable
internal records, images libraries and mentoring. They are an important part of the
infrastructure supporting innovation in professional service firms, allowing them to
capture knowledge from past projects and use this knowledge in the future
projects.’
The rate of diffusion of new methods of organizing work and creating new
methods to renew external relations of the firms are similar in both countries
(Hungary: 39.3 % versus Slovakia: 40.2 % and Hungary: 29.9 % versus Slovakia:
29.9 %). Table 19 includes more details of the survey results on this matter.
Table 19. Diffusion of bundles of organizational innovation (multiple answers) in the KIBS sector
Groups of organizational innovation Hungary n=196
Slovakia n=97
New methods in organizing work (i.e., system for suggestions, team work, and job rotation) 39.3 % 40.3 %
Creating a new method to renew external relations 29.9 % 29.9 %
Implementing new business practices (i.e., reengineering business process and supply-chain management)
26.1 % 44.3 %
Introducing new knowledge management methods 18.0 % 33.0 %
After identifying various forms of organizational innovation, our respondents
were asked to assess the drivers of implementation of the new organizational
concepts and practices. In both countries, the most important driver is the
improvement of the efficiency of daily operations. This factor is followed by the

56
motives to renew the existing knowledge base, adapting to the environmental
changes, strengthening cooperation within an organization, improving quality and
customer service, and increasing the size of the firms. Surprisingly enough, the
outsourcing or delocalizing business services received the lowest assessment
among the driver of organizational changes in both countries. It is noteworthy that
such drivers of organizational changes as the renewal of product and services, the
renewal of existing knowledge, the increasing size of the firm, and, especially, the
outsourcing of business functions play weaker roles in Slovak company practices
than in Hungarian ones (see Table 20 for more details).
Table 20. Driving forces behind important organizational changes in the KIBS sector*
Drivers of Organizational Changes Hungary n=196
Slovakia n=97
Improving daily efficiency of work 73.9 % 67.0 % Strengthening cooperation within the firm 61.5 % 53.6 % Adapting to the environmental changes 62.8 % 62.9 % Renewal of product and services 54.3 % 36.0 % Renewal of the existing knowledge base 63.5 % 33.0 % Outsourcing business functions 36.8 % 16.5 % Improving quality and customer service 65.9 % 44.4 % Increasing size of the firm 42.5 % 37.2 %
Note: Drivers of organizational changes were assessed by managers on a 5 point-scale, where 1 = the least important and 5 = the most important factor.
Finally, regarding the drivers of organizational innovation, Table 21 presents
the main reasons for the lack of organizational innovation. In the case of Hungary,
especially, an important segment of the firms (43 % and 12.4 % in Slovakia) carried
out organizational changes before the reference period (2005-2007); therefore, no

57
further efforts were necessary to modernize the organizational practice. In addition,
one third of the Hungarian and only one tenth of the Slovak firms’ representatives
said that, even in the reference period (2005-2007), there was no need for
organizational innovation.
In the literature dealing with technological and organizational changes,
resistance of employees/managers and skill shortage are frequently reported as
constraints of these changes. It is noteworthy that, in the present study, such
factors were reported by a tiny minority of respondents and in conjunction with a
lack of financial resources.
Table 21. Reasons for the absence of organizational innovation in the KIBS sector*
Factors responsible for the lack of organizational innovation
Hungary n=196
Slovakia n=97
No need for organizational innovation from 2005 to 2007 33.0 % 10.3 %
Implementation of organizational innovation before 2005-2007; since then, no need for further changes 43.0 % 12.4 %
Lack of financial resources 6.9 % 6.2 % Skill shortage 6.9 % 6.2 % Resistance of employees and managers to change 5.4 % 7.3 %
Note: Employers interviewed assessed these factors on a 5 point-scale, where 1 = least important and 5 = most important with regard to the absence of organizational innovation.
Comparing organizational innovations on a wider or European perspective, it
is worth using some results from the international establishment-level surveys
carried out just before our company surveys in Hungary and Slovakia. For example,
flexible working time arrangement, mobile work, and home-based telework are
among the new organizational (working) practices aimed at improving flexibility in
the use of manpower and knowledge within the firm. According to the latest
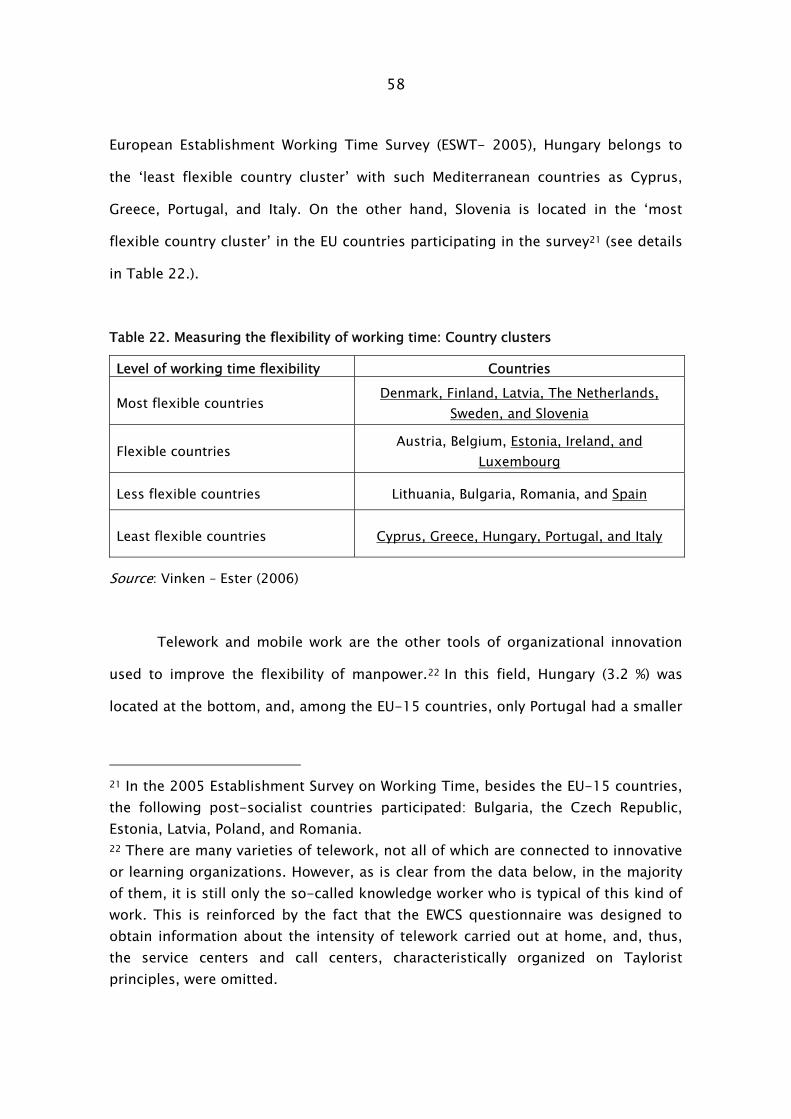
58
European Establishment Working Time Survey (ESWT- 2005), Hungary belongs to
the ‘least flexible country cluster’ with such Mediterranean countries as Cyprus,
Greece, Portugal, and Italy. On the other hand, Slovenia is located in the ‘most
flexible country cluster’ in the EU countries participating in the survey21 (see details
in Table 22.).
Table 22. Measuring the flexibility of working time: Country clusters
Level of working time flexibility Countries
Most flexible countries Denmark, Finland, Latvia, The Netherlands, Sweden, and Slovenia
Flexible countries Austria, Belgium, Estonia, Ireland, and Luxembourg
Less flexible countries Lithuania, Bulgaria, Romania, and Spain
Least flexible countries Cyprus, Greece, Hungary, Portugal, and Italy
Source: Vinken – Ester (2006)
Telework and mobile work are the other tools of organizational innovation
used to improve the flexibility of manpower.22 In this field, Hungary (3.2 %) was
located at the bottom, and, among the EU-15 countries, only Portugal had a smaller
21 In the 2005 Establishment Survey on Working Time, besides the EU-15 countries, the following post-socialist countries participated: Bulgaria, the Czech Republic, Estonia, Latvia, Poland, and Romania. 22 There are many varieties of telework, not all of which are connected to innovative or learning organizations. However, as is clear from the data below, in the majority of them, it is still only the so-called knowledge worker who is typical of this kind of work. This is reinforced by the fact that the EWCS questionnaire was designed to obtain information about the intensity of telework carried out at home, and, thus, the service centers and call centers, characteristically organized on Taylorist principles, were omitted.
59
share of teleworkers (1.8 %).23 Within the group of other post-socialist countries of
Central and Eastern Europe (CEE), the highest rate of teleworkers was found in the
Czech Republic (16.1 %), but, even in Slovakia (11.7 %), the share of teleworkers was
three times higher than that in Hungary.
Due to the fact that the KIBS service sector was characterized by one of the
most important concentrations of the so-called ‘knowledge workers,’ in the
company survey, particular attention was given to the sector-level distribution of
such forms of organizational and contractual innovations as ‘part-time
employment,’ ‘working time flexibility,’ ‘mobile work,’ and ‘home-based telework.’
The data summarized in Table 23 indicate that these forms of organizational
innovation are more integrated into Slovakian than Hungarian employment and
working practices.24
23 To analyze the data, it is important to know that the EWCS dealt with the general characteristics of the working conditions of European employees. In this sense, it was primarily health and safety at work, working hours, general conditions of employment, and the criteria of tasks that were featured in the questionnaire (The Foundation is based in Dublin and supported by the European Commission and by employer and employee organizations coordinated at a European Union-level). It is, thus, understandable that teleworking (not being a central theme in the survey) was only referred to in one request: ‘Please evaluate on the scale below how typical it is of your work that you work at home with the help of a PC.’ The 7-point scale ranged from ‘Always’ to ‘Never,’ and the options offered to respondents were as follows: ‘Always,’ ‘Nearly always,’ ‘About ¾ of my working time,’ ‘About ½ of my working time,’ ‘About ¼ of my working time,’ ‘Almost never,’ and ‘Never.’ In our analysis, we interpreted these values to mean that ‘Almost never’ and ‘Never’ referred to those not involved in teleworking, while all other responses referred to teleworkers. 24 Comparing the business sector level data to the national one, the following patterns could be identified. In the case of Hungary, the share of mobile workers or home-based teleworkers was several times that reported on the national level.

60
Table 23. Tools to improve the flexibility of manpower and knowledge use in the KIBS sector Forms of organizational and
contractual innovation
Hungary
n=196
Slovakia
n=97
Part-time employment 36.1 % 58.8 %
Flexible working time arrangement 26.1 % 76.3 %
Mobile work 15.6 % 39.2 %
Home-based telework 15.4 % 51.5 %
3.3. The practice of ICT use in the firm
It is a commonly shared view among scholars of organizational innovation that,
since the last decades of the 20th century, the term ‘knowledge economy’ has
become a catch word for identifying new trends of development. This shift was
attributed to the forces of globalization and the growing use of information and
communication technology (ICT). According to Ramioul et al. (2006), in contrast to
previous technological changes (e.g., automatization) and due to its integrative
character, ICT represents an ‘organizational technology’ that offers to the actors
concerned specific opportunities to shape the division of labor and the practices of
knowledge use. In this sense, Nielsen (2006: 15-16) added that, during the so-
called ‘take-off’ period of the ICT in the mid-1980s, ‘the more narrow
rationalization phase dominated up to the end of eighties; than in the early nineties
a more organic, pervasive and information-oriented approach to the use of ICT
started to emerge. The importance of thinking new ICT into, as an integrative part
of, new managerial and organization forms became more widely recognized. Even
though rationalization was still an important function, information and
communication came to be seen as more and more important functions. This
development of ICT from pure rationalization towards information and

61
communication functions is in line with the view held by Zuboff (1985); the phases,
however, are not ‘clean’ ... we still empirically presume rationalization to be an
important function in the use of ICT.’
Using the extensive quotation from Nielsen (2006), we intend to call
attention to the various degrees of embeddedness of ICT in the everyday working
and management practice of the firm. It is widely known that ICT plays various
crucial roles in the everyday life of a firm, especially in the service sector. 25
According to our experience, ICT is more intensively used in the KIBS than in the
manufacturing sector. This could be explained by the fact that ‘... ICT process
innovation is often a necessary prerequisite for the service innovation in this
industry’ (Nielsen, 2006: 56).
ICT can be implemented and used in a multitude of functions, such as
information processing and communication, and in different fields of activity of
firms, such as routine production, research, and development within the business
process. Our survey aimed to identify the functions in which ICT is employed in KIBS
firms in both countries. A crucial role of ICT in the organizational changes or, more
precisely, in the diffusion of organizational innovation is widely supported by the
results of a recent international study on the restructuring of the value chain in both
the manufacturing and service sectors (Flecker – Holtgrewe – Schönauer – Dunkel -
Meil, 2008).
As shown in Table 24, ICT is used more extensively in the Hungarian than in
Slovakian company practices. This is especially true in such basic functions as
information processing and communication (Hungary: 68.7 % versus Slovkia: 25 For example, in the U.S.A., more than 70 % of the ICT equipment is purchased by
service companies. The selection, implementation, and integration of this technology are key factors in their business success (Chesborough - Shphrer, 2006).

62
42.9 %). In addition, in the development activities, which are emblematic fields for
the deeper and more intensive use of ICT, Hungarian firms are again in a better
position than Slovakian business service firms (Hungary: 44.9 % versus Slovakia:
27.8 %).
Table 24. Use of ICT by function and location in the business process in the KIBS sector Function/location of business process
Hungary n=192
Slovakia n=97
Information processing and communication 68.7 % 42.9 %
Rationalization of labor process and reengineering company development
34.3 % 29.3 %
Development activities (e.g., development of knowledge base)
44.9 % 27.8 %

63
4. Skill requirements and knowledge development practice in the firm
4.1. Differences in skill development and the key role of experience-based learning
Chapter 4 is a report on the issue of knowledge development practices within a firm,
and, in this relation, organizational learning indicates ‘… the capacity (or process)
within an organization to maintain or improve performance based on experience.
This activity involves knowledge acquisition (the development or creation of skills,
insights, relationships), knowledge sharing (the dissemination to others of what has
been acquired by some), and knowledge utilization (integration of the learning so
that it is assimilated, broadly available, and can also be generalized to new
situations’ (DiBella – Nevis – Gould, 1996: 363). There is a strong interplay between
innovation and the learning process within the organization, and, in this respect, it
is noteworthy that the complementary character of the formal education and
experience-based learning as Nielsen (2006: 117) summarized:
‘To make learning complete and sufficient, with the innovative mode in focus, it
is necessary to combine experience-based and reflective learning with the new
knowledge achieved from formal training and education. Only in this way does
learning become both knowledge-based and experience-based, and may evolve
dynamically in the context of the organization ... Competence development and
continuous vocational training must form the two sides of the same coin in the
learning organization`s employment system, and be complementary to its
production strategies.’

64
Skills development and formal training are important preconditions for
innovation. However, an individual’s ability to perform within a specific job situation
is extremely important. ‘While qualifications are individually adopted characteristics,
built into and carried out by a person, competence as a concept has to do with
specific job situations and assignments, and concerns the capacity of an employee
to use his or her qualifications in the job situation ... the potential possibilities to
act in a specific assignment, situation or context. In line with this definition,
competence development as a concept in this context will be defined as continuous
development of experiences, skills, influence, possibilities and responsibilities,
related to the job situation, tasks and context of the employees’ (Nielsen, 2006:
124).
Prior to describing the knowledge development practices of the firms surveyed,
we identified the types of knowledge and skills required by the employers. The
most important knowledge evaluated by the employers interviewed in both
countries is described as follows:
1. Professional-technical skills (Hungary: 93.7 % and Slovakia: 98.1 %);
2. Reliability on the job (Hungary: 97.5 % and Slovakia: 89.1 %);
3. Customer-centered attitude (Hungary: 90.3 % and Slovakia: 86.5 %).
Evaluating the importance of the various methods of knowledge development in
the firm, the following classification was used:
(1) Participation in formal education;
(2) Competence development;
(3) Improving social skills.26 26 Besides the briefly presented classifications of knowledge preconditions for learning or innovative organization, another strand of the labor process school makes a disctintion between ‘learning as acquisition’ and ‘learning as participation.’ Quoting Felstead et al. (2008: 5), ‘The former refers to a conceptualization, which views learning as a product with a visible, identifiable outcome, often accompanied

65
In both countries, forms of experience-based (‘on-site’) knowledge or
competence development, such as ‘consulting with management/other employees’
and ‘on-the-job training (OJT),’ are playing a more important role than participation
in formal education (e.g., participation in courses/educational schemes and
involvement in further training tailored for the needs of the firm).27 In spite of this
common pattern, it is noteworthy that the formal training (e.g., standard
educational schemes, further training) is playing a relatively more significant role in
Slovakian business service firms than in Hungarian ones.
Table 25. Methods of knowledge development in the KIBS sector*
Methods of knowledge development Hungary n=196
Slovakia n=97
I. Participation in formal education Standard courses/educational schemes 45.5 % 60.4 % Further training designed according to the needs of the firm 64.3 % 69.6 %
II. Experience-based learning or competence development Consulting with management/other employees 80.3 % 75.5 %
On-the-job training (OJT) 74.1 % 70.3 % Attending professional fairs and expositions 67.5 % 44.3 % Job rotation 31.1 % 40.1 %
III. Improving social skills Supporting cooperation between organizational units 62.6 % 63.3 % Teamwork 57.1 % 74.0 %
by certification or proof of attendance. The latter perspective, on the other hand, views learning as a process in which learners improve their work performance by carrying out daily activities.’ This distinction is similar to the distinction of ‘formal education’ and ‘competence development.’ 27 According to the experiences of a European-wide project carried out in 13 countries on outsourcing software development in a leading IT firms, only 10 % of training activities were based on training programs, and the remaining 90 % represented on-the-job training (OJT) (Flecker-Holtgrewe-Shönauer-Dünkel-Meil, 2008: 57).

66
The importance of training aimed at improving the social skills of employees
(e.g., motivation of cooperation between various organizational units and job
rotation) is located between the ‘competence development’ and ‘participation in
formal education.’
In both countries, ‘consulting with managers and other employees’ and ‘on-
the-job training’ (or ‘learning by participation’) were more often used as tools of
knowledge development than ‘participation in the formal training’ (or ‘learning by
acquisition’). In addition to this common pattern of knowledge development, we
identified slight differences, too. Such sources of experience-based learning as
‘attending professional fairs and expositions’ are playing a more important role in
Hungary than in Slovakia, (67.5 % versus 44.3 %); however, ‘job rotation’ is
organized more frequently in Slovakian than Hungarian business firms (40.1 %
versus 31.1 %). In relation with the development of social skills, the cooperation
between organizational units has similarly important roles in both countries
(Hungary: 62.6 % and Slovakia: 63.3 %), but team-work as a widely recognized
source of social skill development 28 is more widely used in Slovakian than
Hungarian business service firms (74.0 % versus 57.1 %). Table 25 illustrates the
methods of knowledge development employed in company practices.
4.2. Company training practice: more training and stronger reliance on the external knowledge sources in Slovakia than Hungary
While the former section focused on the identification of various forms of
knowledge development (i.e., participation in formal education, experience-based
learning, and improving social skills), this section deals with the issue of company
training practice and the role of external knowledge sources.
28 Kyzlinková, R., Dokulilová, L., Kroupa, A. (2007).

67
According to the data stemming from the latest wave (2005) of the European
Continuing Vocational Survey29 (CVTS), European countries vary remarkably in terms
of their company training practices.
As shown in Figure 4, an average of 60 % of the European companies
provided formal and/or informal training courses to employees in 2005. The UK,
the Nordic countries (Norway, Denmark, Sweden, and Finland), and some
continental countries (Austria and the Netherlands) have the largest proportion of
training providers. Among the post-socialist countries, Slovenia, the Czech Republic,
and Estonia are in a better position than the EU average. Romania, Latvia, Poland,
Italy, Bulgaria, and Greece are lagging far behind the EU average. Slovakia performs
around the average, while Hungary is in a weaker position (49 %). It is noteworthy,
however, that country differences can be partly explained by the various
institutional settings of the different vocational training systems (e.g., in UK firms,
specific company training plays an important role in the vocational training system,
which is not the case in most post-socialist countries).
If we broaden the scope and take not just the proportion of companies that
provide training but also the percentage of the employees participating in training
activities, the picture becomes more complex. Approximately every third employee
participated in company training in Europe in 2005. There are, however, remarkable
differences among the European countries. In the Czech Republic, almost 60 % of all
employees participated in training courses, and Slovenia, Ireland, Luxembourg,
France, and Sweden also performed far above the average in this respect. Romania,
Hungary, Bulgaria, Latvia, Lithuania, and Greece are in the worst position within the
29 The Continuing Vocational Training Survey (CVTS) is a European Union-wide representative employer survey on vocational training practices of the European enterprises carried out by the Eurostat.

68
EU-27. In Slovakia, 38 % of all employees took part in formal and/or informal
company training, while this proportion in Hungary was only 16 %, far below the
European average. These data indicate that there are rather large inequalities
among Hungarian employees in terms of the access to new knowledge. The low
participation rate indicates that the access to and transfer of knowledge within
companies, which are prerequisites of innovation and high-value-added economic
activities, are limited.
Figure 4. Distribution of enterprises providing training courses* in the percentage of all enterprises by European countries30 in 2005
Source: CVTS 2005 * Both formal and informal training
The findings of the joint survey provide broader insight into the company
practices of the Hungarian and Slovakian KIBS firms. Empirical outcomes indicate
visible differences in the company practices of the two countries. As shown in Table
30 EU-27 + Norway
9086 85
8178 77
75 74 73 72 7269
67 6763
60 60
5149
47 46 4644
4036 35
3229
21
UK NO DK AT SE FI NL FR SL CZ LU DE EE IE BE EU-27
SK CY HU ES LT MT PT RO LV PL IT BG EL

69
26, in Slovakian business service firms, in 2007, every second employee (50.7 %)
participated in a training course organized and financed by the firms. In the case of
Hungary, less than one third of the firms organized and financed training of their
employees (31.2 %). Employee autonomy in participating in training, again, is
stronger in Slovakia than in Hungary (Slovakia: 24.5 % versus Hungary: 16.1 %). Even
in the case of training supported by non-financial means (e.g., working time
reduction), Slovakian firms are doing visibly better than their Hungarian
counterparts (10.8 % versus 5.4 %).
Figure 5. Percentage of employees participating in CVT courses* in 2005 by European countries in 2005
Source: CVTS 2005 * Both formal and informal training
Finally, dealing with the knowledge development practices of the firms,
special attention was given to the role of external knowledge resources. Scholarly
consensus among those dealing with innovation is that organizational differences in
59
50 49 4946 46
40 39 3835 34 33 33 33 33 32
30 30 29 29 28
2421
17 16 15 15 15 14
CZ SL IE LU FR SE BE FI SK DK NL EU-27
ES AT UK MT DE CY IT NO PT EE PL RO HU BG LV LT EL

70
generating innovation are intimately related to ‘absorption’ or to the dynamic
capabilities of companies. The dynamic capabilities indicate the ‘firms’ ability to
integrate, build and reconfigure internal and external competences to address
rapidly changing environments’ (Lazonick, 2006: 33). In relation to the particular
importance of external knowledge in the radical innovation generation process
within the KIBS sector, Salter and Tether (2006: 13) stressed that:
Table 26. The rates of company-supported training
Forms of training and support Hungary n=196
Slovakia n=97
Courses organized and financed by the firm 31.2 % 50.7 %
Courses selected by an employee but financed by the firm 16.1 % 24.5 %
Courses supported by working time reduction 5.4 % 10.8 %
With respect to the content of the training, we found that, in both countries, almost
half of the training courses aimed to improve job-related specific knowledge and
two-fifths of the employees were involved in the job-specific + general training. In
both sectors, less than 10 % of employees had a chance to participate in training
activities improving their generic knowledge and competencies (e.g., language and
communication skills).
‘Radical innovations in these industries will typically involve changes more
than one of the triumvirate of the employees’ division of labor, technologies, and
organization, as their complex intertwining can create powerful barriers to
innovation amongst incumbents. Outsiders and newcomers are therefore the main
source of more radical innovation. When incumbents do initiate the change (… ) this
is typically through a new and separate organization.’

71
Table 27. External sources of knowledge development (multiple answers) in the KIBS sector
External knowledge sources Hungary n=196
Slovakia n=97
Customers 79.2 % 61.9 %
Suppliers, service providers 62.1 % 59.8 % External consulting 54.2 % 68.0 % Higher educational institutions 27.4 % 55.7 % Educational (training) institutions 29.0 % 66.0 % Research institutes 19.7 % 28.9 %
Development agencies 26.5 % 23.7 % Labor market agencies, professional associations
25.9 % 43.3 %
Identifying the importance of external knowledge sources, managers
participating in the company surveys were asked to assess the role of these sources.
Table 27 contains the shares of the external knowledge source use in Hungarian
and Slovakian business service firm practices.
Ranking in order, the experience and knowledge of customers, suppliers,
and external consulting are the most important external knowledge sources in both
countries in comparison to such external knowledge sources as ‘higher education,’
‘training institutions,’ and ‘labor market institutions.’ However, these institutions,
especially educational (training) institutions and labor market agencies, continue to
play more important roles in Slovakian than in Hungarian company practices. We
need to include other factors (e.g., R & D expenditure, access to a highly educated
and skilled population, and quality of institutions) to better understand the
systematic prerequisites for the knowledge-based growth in the countries

72
investigated.31 However, the relatively stronger reliance on the variety of external
knowledge sources in the Slovak KIBS in comparison to Hungary indicates the better
innovation and learning potential of Slovak KIBS firms.
31 See Veugelers (2010).

73
References
Augier, M. – Teece, D. J. (2008) Strategy and Evolution with Design: The Foundation of Dynamic Capabilities and the Role of Managers in the Economic System, Organization Studies, Vol. 29, pp. 1187-1190.
Bajzikova, L. – Sajgalikova, H. – Wojcak, E. – Polakova, M. (2009) Multinational and Local Resources – Business Services (Report for Slovakia), Bratislava: Comenius University in Bratislava – Faculty of Management, May, p. 25.
Chesbrough, H. – Shphrer, J. (2006) Service Science: A Research Manifesto, Haas School of Business – University California Berkeley – IBM Research, 18th March.
DiBella, A. J. – Nevis, E. C. – Gould, J. M. (1996) Understanding Organizational Learning Capability, Journal of Management Studies, 33:3, May, pp. 361-379.
Employer–provided vocational training in Europe (Evaluation and interpretation of the third continuous vocational training survey (2010)) Research Paper No.2, Luxemburg: Publications Office for the European Union, p. 155.
European Innovation Scoreboard 2008. Comparative analysis of innovation performance, European Commission, Enterprise, and Industry (2009) PRO INNO Europe paper No. 10. Luxemburg: Office for Official Publications of the European Communities, p. 58.
Finegold, D. – Soskice, D. (1988) The Failure of Training in Britain: Analysis and Prescription, Oxford Review of Economic Policy, Autumn, pp. 21-51.
Fitzsimmons, J. A. – Fitzsimmons, M. J. (2008) Service Management (Operations, Strategy, Information Technology), New York: McGraw-Hill – Irwin, 6th Edition.
Flecker, J. – Holtgrewe, U. – Schönauer, A. – Dunkel, W. – Mail, P. (2008) Restructuring across Value Chains and Changes in Work and Employment, (Case Study evidence from Clothing, Food, IT and Public Sector), Leuven: Katholieke Universiteit Leuven.
Freeman, R. B. (2006) Labor market imbalances: shortages, or surpluses, or fish stories? Boston Federal Reserve Economic Conference ‘Global Imbalances – As Giants Evolve,’ Chatham Massachusetts, June 14-16, 2006.
Freeman, R. B. (2005) The Great Doubling: labor in the new global economy, Georgia State University
Goos, M. and Manning, A. (2003) ‘Lousy and Lovely Jobs: The Rising Polarization of Work in Britain,’ in Dickens, R., Gregg, P. and Wadsworth, J. (eds.) The Labour Market under New Labour: The State of Working Britain 2003, Palgrave - MacMillan, Basingstoke.

74
Gospel, H. – Sako, M. (2009) The Unbundling of Corporate Functions: The Evolution of Shared Services and Outsourcing in Human Resource Management, King’s College London – Said Business School – Oxford University, p. 36. (Draft to be submitted to Industrial and Corporate Change)
Gupta, A. – Vollenweider, M. (2009) Evalueserve: Globalizing the Business of Giving Insight? London: Said Business School – Oxford University, p. 37.
Hansen, M. T. et al. (1999) What's Your Strategy for Managing Knowledge, Harvard Business Review, March-April, pp. 106-116.
Kattel, R. – Reinert, E. S. – Suurna, M. (2009) Industrial Restructuring and Innovation Policy in Central and Eastern Europe since 1990, Working Papers in Technology Governance and Economic Dynamics no. 23, The Other Canon Foundation, Norway – Tallin University of Technology, Tallin, p. 43.
Kyzlinková, R., Dokulilová, L., Kroupa, A. (2007) Teamwork and high performance work organisation, Dublin: European Foundation for the Improvement of Living and Working Conditions.
Korczynski, M. (2002) Human Resource Management in Service Work, Houndsmills London: Palgrave.
Lazonick, W. (2006) The Innovative Firm, In: Fagerberg, J. – Mowery D. C. – Nelson, R. R. (eds.) The Oxford Handbook of Innovation, Oxford: Oxford University Press, pp. 29-55.
Leiponen, A. (2004) Knowledge services in the Finnish Innovation System, In: Schienstock, G. (ed.) (2004) Embracing the Knowledge Economy, (The Dynamic Transformation of the Finnish Innovation System), London: Edward Elgar, p. 85-105.
Leiponen, A. (2001) Knowledge Services in the Innovation System, Helsinki: Taloustieto Oy in Association with ETLA (The Research Institute of the Finnish Economy and Sitra (The Finnish National Fund for Research and Development).
Likert, J. K. – Fruin, W. M. – Adler, P. S. (Eds.) (1999) Remade in America (Transplanting & Transforming Japanese Management Systems), New York – Oxford: Oxford University Press.
Lovelock, C. – Wirtz, J. – Chen, P. (2009) Services Marketing, Singapore: Pearson Education.
Nielsen, P. and Lundvall, B.-A. (2007) Innovation, Learning Organizations and Employment Relations, In: Makó, Cs. – Moerel, H. – Illéssy, M. – Csizmdia, P. (eds.) Working It Out? The Labour Process and Employment Relations in the New Economy, Budapest: Akadémiai Kiadó, p. 74.
Makó, Cs. – Csizmadia, P. – Illéssy, M. – Iwasaki, I. – Szanyi, M. (2009) Organizational Innovation in the Manufacturing Sector and the Knowledge-intensive Business

75
Services, Tokyo: Center for Economic Institutions – Research Paper Series, No. 2009-1, Institute of Economic Research – Hitotsubashi University, October, p. 65.
Mintzberg H. (1979) The Structuring of Organisations. Englewood Cliffs, NJ, Prentice Hall. Mintzberg H. (1983) Structure in Fives. Designing effective organizations, Englewood-
Cliffs, NJ, Prentice Hall. Nonaka, I. - Takeuchi, H. (1995) The Knowledge-creating Company. New York, Oxford. OECD (2007) OECD in Figures. OECD: Paris. The MEADOW Guidelines (2010) Measuring the Dynamics of Organization and Work
(MEADOW, Project Founded within the 6th FP of the European Commission’s DG Research), Grigny (France), p. 386.
Nielsen, P. (2007) From Theories to Themes and Basic Definitions, MEADOW Project (Measuring the Dynamics of Organisations and Work). 6th FP, Aalborg University Business School, Aalborg, p. 67.
Salter, A. – Tether, B. S. (2006) Innovation in Services (Through the Looking Glass of Innovation Studies), Advanced Institute of Management (AIM), Research’s Grand Challenges on Service Science.
Salter, A. – Tether, B. S. (2006) Innovation in Services (Through the Looking Glass of Innovation Studies), Background Paper for Advanced Institute of Management (AIM), Research’s Grand Challenge in Service Science.
Sako, M. (2009) (a) Impacts of Recession on Outsourcing – Off shoring, 3rd International Services and Outsourcing Conference, Corinthia Hotel – Budapest, 9th October.
Sako, M. (2009) (b) Technology, Strategy and Management, (Globalization of Knowledge – Intensive Professional Services (Does the trend toward standardization of professional services make outsourcing inevitable?), Communications of the Association for Computing Machinery, Vol. 52, No. 7, July, pp. 31-33.
Sako, M. (2006) Outsourcing and Off shoring: Implications for Productivity of Business Services, Oxford Review of Economic Policy, Vol. 22, No. 4, Oxford: Said Business School- Oxford University, November.
Sandberg, A. – Augustsson, F. (2002) Interactive Media in Sweden 2001. Stockholm, National Institute for Working Life.
Statisztikai Tükör (2007) Budapest: Központi Statisztikai Hivatal (KSH), No. 14, p. 5. Toivonen, M. (2006) Future Prospects of Knowledge-Intensive Business Services (KIBS)
and Implications to Regional Economies, ICFAI Journal of Knowledge Management, Vol. 4, No. 3, pp. 18-36.
Valeyre, A. – Lorenz, E. – Cartron, D. – Csizmadia, P. – Gollac, M. – Illéssy, M. – Makó, Cs. (2009) Working conditions in the European Union: Work organisation, Luxemburg: Office for Official Publications of the European Communities, p. 59.

76
Veugelers, R. (2010) Assessing the Potential for Knowledge-based Development in Transition Countries, Bruegel Working Paper, 2010/01, May.
Vinken, H. – Ester, P. (2006) The need for European company surveys: Some results from panel surveys in the Netherlands and Germany, Paper presented at the First WORKS Conference, Chania, Greece, 21st –22nd September 2006.
Womack, J. P. – Jones, D. T. – Roos, D. (1990) The Machine that Changed the World, New York: Rawson Associates.
Womack, J. P. – Jones, D. T. (2003) Lean Thinking. Banish Waste and Create Wealth in Your Corporation, New York: Free Press.

77
Appendix 1. Branches (by NACE Codes) Grouped into Knowledge-intensive and Less- knowledge-intensive Service Sectors
NACE codes32 Branches
Knowledge-intensive services
61 Water transport 62 Air transport 64 Post and telecommunications
65 Financial intermediation, except insurance and pension funding
66 Insurance and pension funding, except compulsory social security
67 Activities auxiliary to financial intermediation 70 Real estate activities
71 Renting of machinery and equipment without operator and of personal and household goods
72 Computer and related activities 73 Research and development 74 Other business activities 80 Education 85 Health and social work 92 Recreational, cultural, and sporting activities
Knowledge-intensive high-technology services
64 Post and telecommunications 72 Computer and related activities 73 Research and development
Knowledge-intensive market services (excluding financial intermediation and high-tech services)
61 Water transport 62 Air transport 70 Real estate activities
71 Renting of machinery and equipment without operator and of personal and household goods
74 Other business activities
Knowledge-intensive financial services
65 Financial intermediation, except insurance and pension funding
66 Insurance and pension funding, except compulsory social security
67 Activities auxiliary to financial intermediation
Other knowledge-intensive services
80 Education 85 Health and social work 92 Recreational, cultural, and sporting activities
32 NACE Rev. 1.1 codes

78
Less-knowledge-intensive services
50 Sale, maintenance, and repair of motor vehicles and motorcycles; retail sale of automotive fuel
51 Wholesale trade and commission trade, except for motor vehicles and motorcycles
52 Retail trade, except for motor vehicles and motorcycles; repair of personal and household goods
55 Hotels and restaurants 60 Land transport; transport via pipelines
63 Supporting and auxiliary transport activities; activities of travel agencies
75 Public administration and defense; compulsory social security
90 Sewage and refuse disposal, sanitation, and similar activities
91 Activities of membership organizations n.e.c.33 93 Other service activities
95 Activities of households as employers of domestic staff
99 Extra-territorial organizations and bodies
Less-knowledge-intensive market services
50 Sale, maintenance, and repair of motor vehicles and motorcycles; retail sale of automotive fuel
51 Wholesale trade and commission trade, except for motor vehicles and motorcycles
52 Retail trade, except for motor vehicles and motorcycles; repair of personal and household goods
55 Hotels and restaurants 60 Land transport; transport via pipelines
63 Supporting and auxiliary transport activities; activities of travel agencies
Other less-knowledge-intensive services
75 Public administration and defense; compulsory social security
90 Sewage and refuse disposal, sanitation, and similar activities
91 Activities of membership organizations n.e.c. 93 Other service activities
95 Activities of households as employers of domestic staff
99 Extra-territorial organizations and bodies
33 Not even considered

79
Appendix 2.
NACE: Knowledge-intensive high-technology services: NACE Rev. 1.1 codes 64, 72, and 73 UNIT: Percentage of total employment
TIME 2000 2005 2006 2007 2008 GEO
European Union (EU-27) 3.21 (i) 3.28 3.32 3.29 :Belgium 3.86 3.74 3.92 3.89 3.75Bulgaria 2.52 2.71 2.59 (b) 2.54 :Czech Republic 3.04 3.17 2.94 (b) 2.99 3.06Denmark 5.04 4.32 4.39 (b) 4.19 (b) 4.30Germany 3.03 3.34 (b) 3.47 (b) 3.44 3.36Estonia 2.87 (b) 2.47 (u) 2.54 (b) 2.55 2.60Ireland 4.01 3.57 3.76 (b) 3.70 3.80Greece 1.57 1.74 1.99 (b) 1.95 1.82Spain 2.29 2.70 (b) 2.98 (b) 2.95 2.77France 3.86 3.99 3.89 (b) 3.40 3.71Italy 2.93 2.98 3.06 (b) 3.12 3.17Cyprus 1.67 2.12 1.97 (b) 2.33 2.22Latvia 2.29 2.68 2.52 (b) 2.47 2.59Lithuania 2.31 1.96 2.05 (b) 2.10 2.33Luxembourg (Grand... 2.66 3.33 3.28 3.37 3.37Hungary 3.09 3.15 3.42 (b) 3.28 3.28Malta 3.06 3.03 3.07 (b) 3.25 3.79Netherlands 4.13 (b) 4.12 3.83 (b) 4.26 4.30Austria 2.80 3.04 2.75 (b) 2.59 2.92Poland : 2.27 2.38 (b) 2.57 :Portugal 1.19 1.81 1.85 (b) 1.70 1.83Romania 1.39 1.40 1.61 (b) 1.52 1.73Slovenia 2.54 2.96 2.74 (b) 2.80 :Slovakia 2.97 2.67 2.56 (b) 2.89 2.77Finland 4.39 (b) 4.51 4.59 (b) 4.56 4.85Sweden 5.13 5.12 (b) 5.06 (b) 5.07 :United Kingdom 4.30 4.30 4.22 (b) 4.36 4.26Croatia : 2.22 2.11 (b) 2.63 (b) 2.50Former Yugoslav R... : : 1.43 (b) 1.60 :Turkey : : .80 (b) .83 .85Iceland 4.41 4.75 4.13 (b) 4.06 3.75Norway 3.77 3.81 3.92 (b) 3.82 3.74Switzerland 3.73 3.96 3.79 (b) 3.75 3.88

80
Appendix 3. NACE: Knowledge-intensive high-technology services: NACE Rev. 1.1 codes 64, 72, and 73 UNIT: Percentage of total employment
TIME 2000 2005 2006 2007 2008 GEO
European Union (EU-27) 3.21 (i) 3.28 3.32 3.29 :Belgium 3.86 3.74 3.92 3.89 3.75Bulgaria 2.52 2.71 2.59 (b) 2.54 :Czech Republic 3.04 3.17 2.94 (b) 2.99 3.06Denmark 5.04 4.32 4.39 (b) 4.19 (b) 4.30Germany 3.03 3.34 (b) 3.47 (b) 3.44 3.36Estonia 2.87 (b) 2.47 (u) 2.54 (b) 2.55 2.60Ireland 4.01 3.57 3.76 (b) 3.70 3.80Greece 1.57 1.74 1.99 (b) 1.95 1.82Spain 2.29 2.70 (b) 2.98 (b) 2.95 2.77France 3.86 3.99 3.89 (b) 3.40 3.71Italy 2.93 2.98 3.06 (b) 3.12 3.17Cyprus 1.67 2.12 1.97 (b) 2.33 2.22Latvia 2.29 2.68 2.52 (b) 2.47 2.59Lithuania 2.31 1.96 2.05 (b) 2.10 2.33Luxembourg (Grand... 2.66 3.33 3.28 3.37 3.37Hungary 3.09 3.15 3.42 (b) 3.28 3.28Malta 3.06 3.03 3.07 (b) 3.25 3.79Netherlands 4.13 (b) 4.12 3.83 (b) 4.26 4.30Austria 2.80 3.04 2.75 (b) 2.59 2.92Poland : 2.27 2.38 (b) 2.57 :Portugal 1.19 1.81 1.85 (b) 1.70 1.83Romania 1.39 1.40 1.61 (b) 1.52 1.73Slovenia 2.54 2.96 2.74 (b) 2.80 :Slovakia 2.97 2.67 2.56 (b) 2.89 2.77Finland 4.39 (b) 4.51 4.59 (b) 4.56 4.85Sweden 5.13 5.12 (b) 5.06 (b) 5.07 :United Kingdom 4.30 4.30 4.22 (b) 4.36 4.26Croatia : 2.22 2.11 (b) 2.63 (b) 2.50Former Yugoslav R... : : 1.43 (b) 1.60 :Turkey : : .80 (b) .83 .85Iceland 4.41 4.75 4.13 (b) 4.06 3.75Norway 3.77 3.81 3.92 (b) 3.82 3.74Switzerland 3.73 3.96 3.79 (b) 3.75 3.88

81
Appendix 4. NACE: Knowledge-intensive financial services: NACE Rev. 1.1 codes 65, 66, and 67 UNIT: Percentage of total employment
TIME 2000 2005 2006 2007 2008 GEO
European Union (EU-27) 3.11 (i) 2.96 2.95 2.97 :Belgium 4.05 3.83 3.66 3.72 3.96Bulgaria 1.13 1.27 1.26 (b) 1.35 :Czech Republic 2.04 2.03 1.91 (b) 2.07 2.30Denmark 3.40 3.24 3.32 (b) 3.07 (b) 3.07Germany 3.66 3.62 (b) 3.39 (b) 3.50 3.41Estonia 1.46 (bu) 1.13 (u) 1.13 (bu) 1.43 (u) 1.59 (u)Ireland 4.11 4.41 4.20 (b) 4.43 4.47Greece 2.64 2.60 2.62 (b) 2.55 2.60Spain 2.68 2.41 (b) 2.23 (b) 2.40 2.66France 3.09 3.02 3.28 (b) 3.09 3.13Italy 3.20 2.84 2.94 (b) 2.87 2.80Cyprus 5.70 5.23 5.32 (b) 4.98 5.14Latvia 1.23 1.92 2.25 (b) 1.93 1.74Lithuania .99 1.11 (u) 1.11 (bu) 1.45 1.33Luxembourg (Grand... 9.95 11.34 11.32 10.54 10.55Hungary 2.23 2.06 2.05 (b) 2.16 2.44Malta 3.87 4.11 4.24 (b) 4.16 3.76Netherlands 3.46 (b) 3.32 3.35 (b) 3.18 2.93Austria 3.79 3.76 3.39 (b) 3.36 3.49Poland : 2.09 2.24 (b) 2.38 :Portugal 1.90 1.89 1.77 (b) 1.88 1.88Romania .88 .94 .99 (b) 1.04 1.18Slovenia 2.43 2.44 2.35 (b) 2.45 :Slovakia 1.77 2.17 2.25 (b) 2.02 2.27Finland 2.11 (b) 1.86 2.02 (b) 2.01 2.14Sweden 1.95 1.86 (b) 1.90 (b) 1.95 :United Kingdom 4.35 4.23 4.34 (b) 4.35 4.23Croatia : 1.82 2.46 (b) 2.27 (b) 2.11Former Yugoslav R... : : 1.24 (b) 1.53 :Turkey : : 1.07 (b) 1.11 1.13Iceland 4.15 4.11 4.34 (b) 4.93 5.09Norway 2.20 2.22 2.16 (b) 2.34 2.09Switzerland 4.84 5.51 5.73 (b) 5.79 5.79

82
Appendix 5. NACE: Other knowledge-intensive services: NACE Rev. 1.1 codes 80, 85, and 92 UNIT: Percentage of total employment
TIME 2000 2005 2006 2007 2008 GEO
European Union (EU-27) 17.22 (i) 18.45 18.53 18.43 :Belgium 21.63 23.27 23.09 22.69 22.88Bulgaria 14.70 13.87 13.83 (b) 13.31 :Czech Republic 14.27 14.97 14.74 (b) 14.74 14.15Denmark 26.25 27.58 27.48 (b) 28.13 (b) 28.17Germany 16.79 18.74 (b) 18.69 (b) 19.21 19.44Estonia 16.38 (b) 17.65 17.92 (b) 16.83 16.47Ireland 16.40 18.42 18.73 (b) 19.43 19.87Greece 12.22 13.58 13.91 (b) 14.01 13.86Spain 12.69 13.71 (b) 14.30 (b) 13.98 13.90France 19.78 21.16 21.06 (b) 21.16 20.92Italy 14.40 15.03 15.16 (b) 15.11 15.23Cyprus 11.25 13.04 13.33 (b) 13.40 13.15Latvia 16.22 16.31 15.26 (b) 14.16 15.58Lithuania 19.87 18.53 17.64 (b) 17.78 17.86Luxembourg (Grand... 15.80 18.36 19.43 19.08 19.93Hungary 16.50 17.07 17.08 (b) 16.85 16.55Malta 17.33 17.38 17.49 (b) 17.62 17.96Netherlands 21.54 (b) 24.22 24.50 (b) 24.75 24.36Austria 15.43 16.69 16.34 (b) 15.84 16.59Poland : 14.93 15.03 (b) 14.49 :Portugal 12.08 13.86 13.90 (b) 13.86 13.86Romania 7.84 9.30 9.40 (b) 9.15 9.18Slovenia 13.49 14.73 15.56 (b) 15.38 :Slovakia 16.43 15.87 15.36 (b) 14.87 14.24Finland 22.94 (b) 24.66 24.71 (b) 24.24 24.18Sweden 29.10 30.22 (b) 29.80 (b) 29.38 :United Kingdom 21.92 24.19 24.71 (b) 24.12 24.28Croatia : 12.73 13.32 (b) 13.34 (b) 13.53Former Yugoslav R... : : 13.07 (b) 13.44 :Turkey : : 7.47 (b) 7.39 7.71Iceland 22.67 25.92 25.39 (b) 25.82 27.33Norway 27.58 30.31 30.21 (b) 29.93 31.06Switzerland 19.91 22.04 22.07 (b) 22.32 22.84

83
Appendix 6. NACE: Other knowledge-intensive services: NACE Rev. 1.1 codes 80, 85, and 92 UNIT: Percentage of total employment
TIME 2000 2005 2006 2007 2008 GEO
European Union (EU-27) 17.22 (i) 18.45 18.53 18.43 :Belgium 21.63 23.27 23.09 22.69 22.88Bulgaria 14.70 13.87 13.83 (b) 13.31 :Czech Republic 14.27 14.97 14.74 (b) 14.74 14.15Denmark 26.25 27.58 27.48 (b) 28.13 (b) 28.17Germany 16.79 18.74 (b) 18.69 (b) 19.21 19.44Estonia 16.38 (b) 17.65 17.92 (b) 16.83 16.47Ireland 16.40 18.42 18.73 (b) 19.43 19.87Greece 12.22 13.58 13.91 (b) 14.01 13.86Spain 12.69 13.71 (b) 14.30 (b) 13.98 13.90France 19.78 21.16 21.06 (b) 21.16 20.92Italy 14.40 15.03 15.16 (b) 15.11 15.23Cyprus 11.25 13.04 13.33 (b) 13.40 13.15Latvia 16.22 16.31 15.26 (b) 14.16 15.58Lithuania 19.87 18.53 17.64 (b) 17.78 17.86Luxembourg (Grand... 15.80 18.36 19.43 19.08 19.93Hungary 16.50 17.07 17.08 (b) 16.85 16.55Malta 17.33 17.38 17.49 (b) 17.62 17.96Netherlands 21.54 (b) 24.22 24.50 (b) 24.75 24.36Austria 15.43 16.69 16.34 (b) 15.84 16.59Poland : 14.93 15.03 (b) 14.49 :Portugal 12.08 13.86 13.90 (b) 13.86 13.86Romania 7.84 9.30 9.40 (b) 9.15 9.18Slovenia 13.49 14.73 15.56 (b) 15.38 :Slovakia 16.43 15.87 15.36 (b) 14.87 14.24Finland 22.94 (b) 24.66 24.71 (b) 24.24 24.18Sweden 29.10 30.22 (b) 29.80 (b) 29.38 :United Kingdom 21.92 24.19 24.71 (b) 24.12 24.28Croatia : 12.73 13.32 (b) 13.34 (b) 13.53Former Yugoslav R... : : 13.07 (b) 13.44 :Turkey : : 7.47 (b) 7.39 7.71Iceland 22.67 25.92 25.39 (b) 25.82 27.33Norway 27.58 30.31 30.21 (b) 29.93 31.06Switzerland 19.91 22.04 22.07 (b) 22.32 22.84

84
Appendix 7. NACE: Total knowledge-intensive services: NACE Rev. 1.1 codes 61, 62, 64 to 67, 70 to 74, 80, 85, and 92 UNIT: Percentage of total employment
TIME 2000 2005 2006 2007 2008 GEO
European Union (EU-27) 30.36 (i) 32.47 32.80 32.96 :Belgium 37.00 38.38 38.84 38.24 38.50Bulgaria 21.18 22.15 21.99 (b) 21.66 :Czech Republic 24.03 25.09 25.07 (b) 25.66 25.63Denmark 42.13 42.78 43.50 (b) 43.51 (b) 43.91Germany 30.37 33.75 (b) 34.13 (b) 34.79 35.30Estonia 26.88 (b) 28.67 28.64 (b) 27.84 28.16Ireland 31.76 34.02 34.23 (b) 35.48 36.22Greece 21.76 24.55 24.96 (b) 25.07 25.73Spain 24.55 26.86 (b) 27.94 (b) 28.19 28.89France 34.69 36.74 36.97 (b) 36.89 37.04Italy 26.68 30.17 30.41 (b) 30.67 31.02Cyprus 25.53 27.21 28.28 (b) 29.20 29.32Latvia 24.76 25.58 25.48 (b) 24.72 26.81Lithuania 26.19 25.42 25.58 (b) 25.97 27.14Luxembourg (Grand... 35.50 41.96 43.49 43.02 45.10Hungary 26.50 28.22 28.42 (b) 28.20 28.73Malta 29.72 30.44 30.77 (b) 32.82 32.67Netherlands 39.21 (b) 41.96 42.02 (b) 42.71 42.66Austria 28.17 31.09 30.44 (b) 30.00 31.50Poland : 24.49 24.66 (b) 24.81 :Portugal 19.37 22.86 23.08 (b) 23.51 23.79Romania 11.12 13.89 14.59 (b) 14.40 14.84Slovenia 22.80 25.28 26.15 (b) 26.27 :Slovakia 24.48 25.43 24.87 (b) 24.74 24.71Finland 37.91 (b) 40.53 41.10 (b) 40.73 41.06Sweden 45.71 47.85 (b) 47.67 (b) 47.83 :United Kingdom 39.83 42.31 42.91 (b) 42.85 42.74Croatia : 21.55 23.03 (b) 23.43 (b) 23.27Former Yugoslav R... : : 18.23 (b) 19.06 :Turkey : : 12.77 (b) 12.92 13.65Iceland 39.26 43.34 42.54 (b) 44.00 44.88Norway 42.26 45.52 46.08 (b) 45.98 46.75Switzerland 36.22 41.21 41.30 (b) 42.16 42.71
Source: Eurostat Data Explorer (http://epp.eurostat.ec.europa.eu/portal/page/portal/statistics/themes)

85
Appendix 8. NACE: Total less-knowledge-intensive services: NACE Rev. 1.1 codes 50, 51, 52, 55, 60, 63, 75, 90, 91, 93, 95, and 99 UNIT: Percentage of total employment
TIME 2000 2005 2006 2007 2008 GEO
European Union (EU-27) 33.45 (i) 33.89 33.89 33.77 :Belgium 34.90 34.90 34.51 35.46 35.05Bulgaria 33.11 34.75 35.45 (b) 35.31 :Czech Republic 30.83 31.43 31.17 (b) 30.51 30.48Denmark 28.96 30.20 30.11 (b) 30.33 (b) 30.66Germany 33.46 34.16 (b) 33.75 (b) 32.77 32.99Estonia 31.77 (b) 32.03 32.84 (b) 32.25 32.43Ireland 31.97 32.40 32.31 (b) 31.88 32.51Greece 38.28 40.65 41.03 (b) 40.96 41.17Spain 37.94 38.18 (b) 37.78 (b) 38.14 39.18France 34.90 35.96 36.32 (b) 36.37 37.23Italy 36.29 34.87 35.20 (b) 35.19 35.45Cyprus 45.37 44.19 44.88 (b) 43.90 44.02Latvia 33.66 36.11 36.52 (b) 36.91 36.69Lithuania 27.94 31.44 32.32 (b) 32.98 34.41Luxembourg (Grand... 41.32 39.02 37.99 38.22 37.90Hungary 33.27 34.44 34.45 (b) 34.54 34.67Malta 35.50 37.56 38.74 (b) 39.12 39.88Netherlands 37.49 (b) 35.31 35.54 (b) 34.85 36.67Austria 35.80 35.88 35.93 (b) 37.09 37.02Poland : 28.83 29.21 (b) 29.50 :Portugal 34.24 35.46 35.39 (b) 35.17 36.38Romania 18.65 23.37 24.09 (b) 24.66 24.98Slovenia 30.49 28.99 29.25 (b) 29.45 :Slovakia 31.35 31.08 31.95 (b) 31.67 31.78Finland 28.01 (b) 28.74 28.43 (b) 28.56 29.09Sweden 27.03 27.99 (b) 28.26 (b) 28.35 :United Kingdom 33.53 34.20 33.74 (b) 33.51 34.39Croatia : 32.84 33.73 (b) 33.28 (b) 32.97Former Yugoslav R... : : 29.07 (b) 31.42 :Turkey : : 34.65 (b) 35.25 34.65Iceland 29.94 28.53 29.64 (b) 29.25 28.01Norway 31.69 30.34 29.60 (b) 30.01 28.93Switzerland 35.14 32.65 32.46 (b) 31.53 31.39

86
Appendix 9. Survey questionnaire in English
Institute for World Economics Hungarian Academy of Sciences
Institute of Economic Research Hitotsubashi University
Institute of Sociology Hungarian Academy of Sciences
Multinationals and Local Resources
Questionnaire
Business Services
2008

87
Number:
I. FIRM AND ITS CONTEXT
1. Name of the firm:_______________________________
Instructions for the interviewer: In the following, the basic data, organizational structure, and activities of the firm are recorded.
2. Address of the firm’s headquarters in Hungary:
Postal code City Street Nr.
3. Statistical code of the firm’s main activity (NACE, 4 digits): ………………………
4. Year of establishment of the firm: (if 2000 = 00)
5. Corporate ownership structure of the firm
100% foreign-owned enterprise
Majority foreign-owned enterprise
100% domestically owned enterprise
Majority domestically owned enterprise
100% domestically state-owned enterprise
Majority domestically state-owned enterprise Other (please specify) …………… 6. Is the firm part of a company group?
(A group consists of two or more legally defined enterprises under common ownership. The head office is also part of an enterprise group.)
Yes No IF THE ANSWER IS NO, SKIP TO QUESTION 10.

88
In the following, please summarize the main characteristics of the parent firm.
7. In which country is the parent company located? …………………………
8. Number of employees at the parent company:
Less than 10
10-49
50-249
250-999
1,000-4,999
5,000-9,999
10,000 or more
9. Did the firm have a legal predecessor before 1990? (If more, please indicate only the oldest one.) (Note: Are the numbers used under question number 9 correct: ‘10.1, …10.2…’ etc.? Please check and change here and elsewhere if appropriate.)
9.1 No
9.2 Yes, state-owned firm, founded before 1990
9.3 Yes, state-owned firm, founded in or after 1990
9.4 Yes, private firm, founded before 1990
9.5 Yes, private firm, founded in or after 1990 9.6 Other………………………………………………………….
10. Number of employees: (Please consider the employees of the firm working at customers’ premises and the permanent subcontractors as well.)
Less than 10
10-49
50-249
250-999
1,000-4,999
5,000-9,999
10,000 or more

89
11. How many organizational levels does the firm have between the CEO and the employees?
12. What services does the company provide for its clients in the following fields?
12.1. Accounting, financial services, and legal services
Legal services
Tax consultancy
Financial audit
Accounting
Financial consultancy Other(please specify)…………………………………………………………
12.2. Human Resources Management
Employee recruitment, manpower leasing
HR consulting
Training and education
Payroll Other(please specify)…………………………………………………………
12.3. Architectural and engineering activities, consulting
Architectural activities
Engineering activities and related technical consulting
Technical testing and analysis
Research and development Other(please specify)…………………………………………………………
12.4. IT activities Sales, implementation of IT systems (hardware, application), and related
consultancy
Operating IT systems (hardware, applications)
Software development
Data entry and processing
Web hosting and/or Web development

90
Web portals, content provision Other(please specify)…………………………………………………………
12.5. Advertising, marketing, customer service
Advertising, marketing services
Market research
Management consultancy activities
Customer service, operating call center Other(please specify)…………………………………………………………
12.6. Other activities (please specify) ………………………………………………………………………………………………………………………………………………………………………………………… Instructions for the interviewer: The following questions deal with the firm’s
markets.
13. Market shares of the company from 2005 through 2007…
Yes, dominan
tly
Yes, to a lesser extent
No
13.1 In Hungary
13.2 The post-socialist New EU Members States
(This category includes the following countries: Bulgaria, Czech Republic, Estonia, Croatia, Hungary, Poland, Latvia, Lithuania, Romania, and Slovenia)
13.3 The EU-15 countries
(This category includes: Austria, Belgium, Denmark, Finland, France, Germany, Greece, Ireland, Italy, Luxembourg, Netherlands, Portugal, Spain, Sweden, and the United Kingdom)
13.4 Russia, Ukraine, Kazakhstan
13.5 Asia
13.6 North America
13.7 Other (please specify) …...……………………

91
QUESTION 14 IS ASKED ONLY IF THE ANSWER IS YES TO QUESTION 6, E.G., THE FIRM IS
PART OF THE COMPANY GROUP.
14. The typical customers of the firm…. (in %)
(Please calculate on the basis of the yearly turnover.)
14.1 are within the company group …………%
14.2 are outside of the company group …………%
15. The number of the firm’s customers:
15.1 One customer
15.2 More customers
Instructions for the interviewer: The following questions deal with the services
provided by the company.
16. The scale of services provided by the firm:
16.1 One or two services in one business field
16.2 More services in one business field
16.3 One-two services in more business fields
16.4 More services in more business fields
17. The characteristics of the typical services provided by the firm (in %)
(Please calculate on the basis of the yearly turnover.)
17.1 Tailor-made solutions (e.g., IT: software development or HR: carrier
planning) …………% 17.2 Standardized services (e.g., IT: packaged software or HR: payroll)
…………%
18. What is the proportion of the low- and high value-added services within the company’s service portfolio?
18.1 Low value-added (e.g., data entry and processing) ………… %
18.2 High value-added (e.g., software development or consultancy)
………… %

92
II. RELATIONS BETWEEN THE HUNGARIAN AND FOREIGN
MANAGERS
19. Do foreign managers work at your firm?
Yes No IF ‘NO,’ SKIP TO QUESTION 25.
20. In the last few years, to what extent did your firm rely on the contribution of expatriates? If you do not have precise data, please estimate their number.
Year Number of foreign
managers Number of local
managers Total
2007 2003
21. What countries do the foreign managers come from?
Year The HQ from
the parent firm
From other members of the company group
From other companies Total
2007 100% 2003 100%
22. Please estimate the number of Hungarian employees who worked at foreign subsidiaries of the company group between 2003 and 2007.
Year Number of Hungarian managers
working abroad 2007 2003
23. Nationality of the managing director of the firm:
23.1 Hungarian 23.2 Expatriate
Instructions for the interviewer: In the following, information about the relationship between your firm and the parent firm will be sought.

93
24. At your firm, who is responsible for the following business functions? (Please remark with X.)
Expatriate Hungarian
24.1 Finance and accounting 24.2 Human resources management 24.3 Production 24.4 Quality control 24.5 Sales and marketing 24.6 Customer service 24.7 IT 24.8 Research and development 24.9 Other (please specify): QUESTIONS 25 AND 26 ARE ONLY ASKED IF THE ANSWER IS YES TO QUESTION 6, E.G., THE FIRM IS PART OF A COMPANY GROUP.
25. To what extent do the local managers participate in managing the business processes?
25.1 Implement the standards of the parent firm
25.2 Implement the standards of the parent firm but actively take part in the
further development of these standards
25.3 Adapt the standards of the parent firm according to the local needs
25.4 Create its business processes independently while following the parent
company’s policies 25.5 Create its business processes independently from the parent company’s
policy
25.6 Implement the standards of the customers (e.g., outsourcing of business
processes)
Instructions for the interviewer: In the following, questions about the Human Resources Management (HRM) will be sought.

94
26. Please evaluate the similarities and differences between the HRM practices of your firm and those of the parent company. Your firm is relying on the following: (Please mark only one answer.)
26.1 Implement the HRM system of the parent company
26.2 Implement the HRM system of the parent firm with slight adaptation to
the local environments
26.3 Create an autonomous HRM system that corresponds to the local needs
while consistent with the parent company’s HRM practices
26.4 Create an autonomous HRM system using only the local requirements
27. Does your firm have a Board of Directors or a Supervisory Board? (If the firm is a unit of a parent company registered in Hungary, please answer in regard to the registered parent company.)
27.1 There is only a Board of Directors SKIP TO QUESTION 29!
27.2 There are both a Board of Directors and a Supervisory Board
27.3 Neither SKIP TO QUESTION 30!
28. Please estimate the composition of the Supervisory Board by nationality.
Expatriate Hungarian 28.1 Chairman of the Supervisory Board
28.2 Number of Supervisory Board members
28.3 Number of external members of Supervisory Board
28.4 Number of independent members of Supervisory Board

95
29. Please estimate the composition of the Board of Directors by nationality.
Expatriate Hungarian 29.1 Chair of the Board of Directors 29.2 Number of board members 29.3 - of which external members 29.4 - of which independent members

96
III. ORGANIZATIONAL INNOVATIONS WITHIN THE COMPANY
30. From 2005 through 2007, did your firm introduce:
30.1 New business practices for organizing work or procedures (i.e., supply chain management, business re-engineering, lean production, quality
management, education/training systems) 30.2 New knowledge management systems to better use or exchange information, knowledge, and skills within your enterprise or to collect and
interpret information from outside your enterprise 30.3 New methods of workplace organization for distributing responsibilities and decision-making (i.e., first use of a new system of employee responsibilities, teamwork, decentralization, and integration or de-integration of departments)
30.4 New methods of organizing external relations with other firms or public
institutions (i.e., alliances, partnerships, outsourcing, or sub-contracting)
31. Does your firm make use of some of the following methods of organizing work?
31.1 Job rotation
31.2 Teamwork
31.3 Systems for collection of employee proposals
31.4 Quality circles/groups
31.5 Cross-occupational working groups
31.6 Project-based work
31.7 Benchmarking
31.8 Flat organization
31.9 Quality Control System (e.g., ISO, TQM)

97
32. If your firm did not introduce organizational innovations from 2005 through 2007, how important were the following factors? (Please evaluate the following reasons on a 5-point scale, 5 indicating very important, and 1, not at all important.)
32.1 Introduction of organizational innovations before 2005; no need for further changes
1 2 3 4 5
32.2 Lack of funds to implement organizational innovations 1 2 3 4 5
32.3 Lack of knowledge or qualified staff 1 2 3 4 5
32.4 Employees or management resistant to organizational change
1 2 3 4 5
32.5 No need for organizational innovation from 2005 through 2007
1 2 3 4 5
32.6. Other reasons (please specify): …………………………………………………………
1 2 3 4 5
QUESTION 33 IS ASKED ONLY IF THE ANSWER IS YES TO QUESTION 31.2, E.G., THE FIRM
PRACTICES TEAMWORK.
33. If your firm practices teamwork, please describe it. The team members decide about…
Yes No Do not know
No answer
33.1 - ...division of the tasks 1 2 8 9
33.2 - ...the selection of the team leader 1 2 8 9

98
34. During the adaptation of companies to market requirements, from time to time, it is necessary to initiate organizational changes. At your firm, what are the drivers of the organizational changes? (Please evaluate the following reasons on a 5-point scale, 5 indicating very characteristic, and 1, not at all characteristic.)
34.1 Improvement of the effectiveness of daily work 1 2 3 4 5
34.2 Strengthening of the cooperation and coordination within the organization
1 2 3 4 5
34.3 Adapting to environmental changes 1 2 3 4 5
34.4 Continuous renewal of products/services 1 2 3 4 5
34.5 Continuous renewal of knowledge and know-how 1 2 3 4 5
34.6 Outsourcing activities 1 2 3 4 5
34.7 Improvement of the quality and customer service 1 2 3 4 5
34.8 Increase of the firm size 1 2 3 4 5
34.9 Other (please specify.) …..………………………... ……………………………………………………………….
1 2 3 4 5
34.10 No organisational changes
35. Please assess, on a 5-point scale, the intensity of competition with other subsidiaries of the company group (if applicable) or with your competitors on the market (if there are any). (Please evaluate the forms of competition on a 5-point scale, 5 indicating that competition is very intensive, and 1, not at all intensive.)
QUESTION 35.1 SHOULD ONLY BE ASKED IF THE ANSWER IS YES TO QUESTION 6, E.G., THE FIRM IS PART OF A CONCERN/GROUP.
No competition at all
Very intensive competition
35.1 Competition between the subsidiaries
1 2 3 4 5
35.2 Market competition 1 2 3 4 5
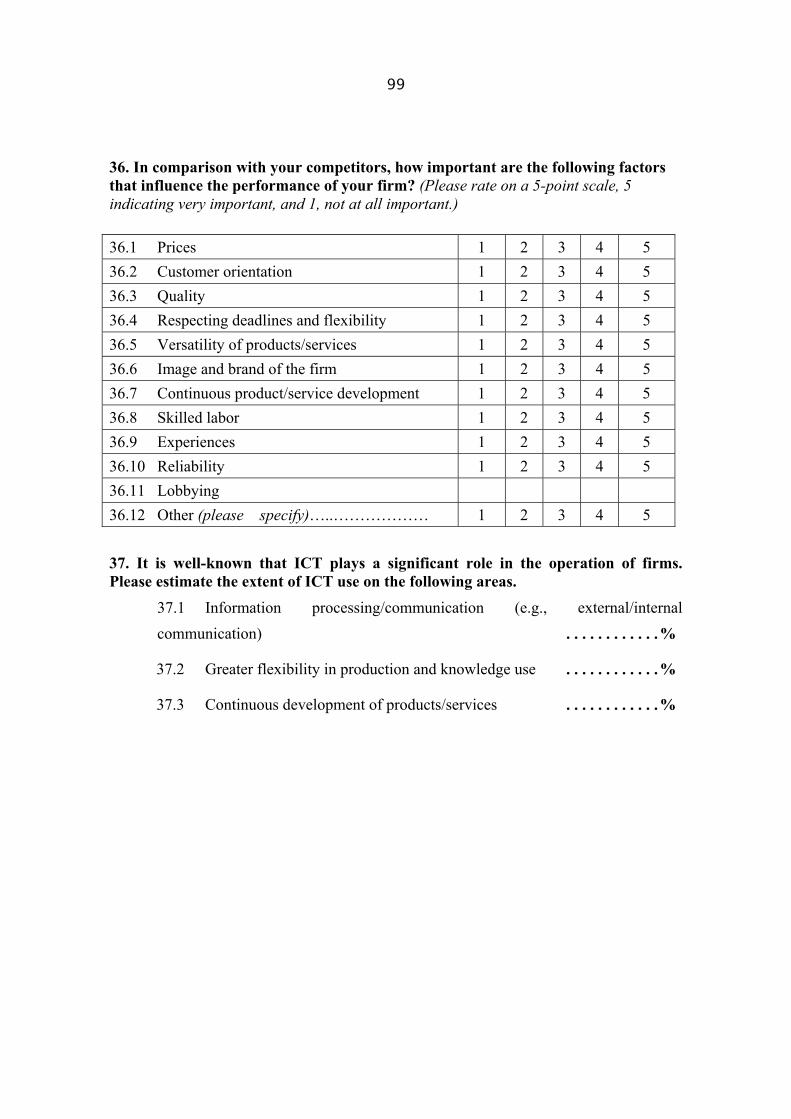
99
36. In comparison with your competitors, how important are the following factors that influence the performance of your firm? (Please rate on a 5-point scale, 5 indicating very important, and 1, not at all important.)
36.1 Prices 1 2 3 4 5
36.2 Customer orientation 1 2 3 4 5
36.3 Quality 1 2 3 4 5
36.4 Respecting deadlines and flexibility 1 2 3 4 5
36.5 Versatility of products/services 1 2 3 4 5
36.6 Image and brand of the firm 1 2 3 4 5
36.7 Continuous product/service development 1 2 3 4 5
36.8 Skilled labor 1 2 3 4 5
36.9 Experiences 1 2 3 4 5
36.10 Reliability 1 2 3 4 5
36.11 Lobbying
36.12 Other (please specify)…..……………… 1 2 3 4 5
37. It is well-known that ICT plays a significant role in the operation of firms. Please estimate the extent of ICT use on the following areas.
37.1 Information processing/communication (e.g., external/internal
communication) …………%
37.2 Greater flexibility in production and knowledge use …………%
37.3 Continuous development of products/services …………%

100
IV. WORK ORGANIZATION AND KNOWLEDGE USE
38. Which characteristics of human resources are important for the improvement of the firm’s performance? (Please assess the following reasons on a 5-point scale, 5 indicating very important, and 1, not at all important!)
38.1 Professional-technical knowledge 1 2 3 4 5
38.2 Experience and competence 1 2 3 4 5
38.3 Managerial-organizational skill 1 2 3 4 5
38.4 Customer orientation 1 2 3 4 5
38.5 Creativity, innovative skills 1 2 3 4 5
38.6 Ability to cooperate 1 2 3 4 5
38.7 Language skills 1 2 3 4 5
38.8 Problem-solving ability 1 2 3 4 5
38.9 General IT skills 1 2 3 4 5
38.10 Communications skills 1 2 3 4 5
38.11 Punctuality and reliability 1 2 3 4 5
38.12 Other (please specify)…………………………
1 2 3 4 5
39. Please estimate the share of employees with a university or college degree.
The ratio of employees with a degree: ………… %
40. What attention is devoted by the management to the continuous skill development of employees? (Please use the following 5-point scale, 5 indicating very important, and 1, not at all important.)
40.1 On-the-job training 1 2 3 4 5
40.2 Consultation with managers/other employees 1 2 3 4 5
40.3 Job rotation 1 2 3 4 5
40.4 Teamwork 1 2 3 4 5
40.5 Supporting cooperation between various organizational units
1 2 3 4 5
40.6 Participation in formal trainings 1 2 3 4 5
40.7 Training tailored to the needs of the firm (e.g., language courses, further professional training)
1 2 3 4 5
40.8 Visiting exhibitions and fairs 1 2 3 4 5

101
41. Please estimate the ratio of employees participating in various training courses organized and financed by the firm.
%
41.1 Training organized and financed by the firm (e.g., language courses, further professional training)
………
41.2 Training initiated by the employee but financed by the employer (e.g., external training, participation at conferences)
………
41.3 Training not financed by the employer but supported with reduced working time (e.g., second degree/diploma)
………
42. What kind of training courses are organized and financed by the employer? (Please select only one.)
42.1 EXCLUSIVELY work-related skills (e.g., quality assurance, professional skill development)
42.2 EXCLUSIVELY generic skills (e.g., language, communication skills)
42.3 BOTH generic and work-related skills
43. Organizational knowledge can be developed by the use of external partner experiences. To what extent does your firm rely on the following groups in developing organizational knowledge? (Please indicate the appropriate partners with X.)
Regularly Occasionally Never
43.1 Customers
43.2 Various suppliers (e.g., parts, services)
43.3 Consulting firms
43.4 Higher-education institutions
43.5 Other educational training agencies
43.6 Research institutes
43.7 Development agencies 43.8 Other professional and labor market
organizations

102
44. Code of the interviewer: ………………
45. Name of the
interviewee……………………………………………………………………….
46. Phone number of the interviewee (with area
code)………………………………………….
47. Date of interview: ......................... (dd/mm/yy)
General comments of the interviewer:
Signature of the interviewer
…….……..…………………………….

103
ADDITIONAL QUESTIONS ABOUT WORKING TIME FLEXIBILITY
31.1 Does your firm make use of the following flexible work and working time systems? (You can choose more than one answer!)
For the interviewees:
TELEWORKING: Working from outside of the workplace using info-communication tools, (PC, phone, fax, modem, Internet, teleconferencing, e-mail, etc.). MOBILE WORK: Working in places other than home or company’s/ organization’s premises, e.g., client’s premises, on the road.
31.1.1 Teleworking from home, once a week
31.1.2 Teleworking from home, several times a week
31.1.3 Mobile work
31.1.4 Part-time work
31.1.5 Flexible working time 31.2 Is your firm planning to introduce these methods in the near future? (You can choose more than one answer!)
31.2.1 Teleworking from home, once a week
31.2.2 Teleworking from home, several times a week
31.2.3 Mobile work
31.2.4 Part-time work
31.2.5 Flexible working time

104
Institute for World Economics Hungarian Academy of Sciences
Institute of Economic Research Hitotsubashi University
Institute of Sociology Hungarian Academy of Sciences
Multinationals and Local Resources
Questionnaire
Manufacturing
2008

105
Number:
I. FIRM AND ITS CONTEXT
1. Name of the firm:_______________________________
Instructions for the interviewer: In the following, the basic data, organizational structure, and activities of the firm are recorded.
2. Address of the firm’s headquarters in Hungary
Postal code City Street Nr.
3. Statistical code of the firm’s main activity (NACE, 4 digits): ………………………
4. Year of establishment of the firm: (if 2000 = 00)
5. Corporate ownership structure of the firm
100% foreign-owned enterprise
Majority foreign-owned enterprise
100% domestically owned enterprise
Majority domestically owned enterprise
100% domestically state-owned enterprise
Majority domestically state-owned enterprise Other (please specify) …………… 6. Is the firm part of a company group?
(A group consists of two or more legally defined enterprises under common ownership. The head office is also part of an enterprise group.)
Yes No IF THE ANSWER IS NO, SKIP TO QUESTION 10.

106
In the following, please summarize the main characteristics of the parent firm.
7. In which country is the parent company locate?
8. Number of employees at the parent company:
Less than 10
10-49
50-249
250-999
1,000-4,999
5,000-9,999
10,000 or more
9. Did the firm have a legal predecessor before 1990? (If more, please indicate only the oldest one.)
9.1 No
9.2 Yes, state-owned firm, founded before 1990
9.3 Yes, state-owned firm, founded in or after 1990
9.4 Yes, private firm, founded before 1990
9.5 Yes, private firm, founded in or after 1990 9.6 Other………………………………………………………….
10. Number of employees: (Please consider the employees of the firm working at customers’ premises and the permanent subcontractors as well.)
Less than 10
10-49
50-249
250-999
1,000-4,999
5,000-9,999
10,000 or more

107
11. How many organizational levels does the firm have between the CEO and the employees?
Instructions for the interviewer: The following questions deal with the firm’s
markets.
12. Market shares of the company from 2005 through 2007…
Yes,
dominantly
Yes, to lesser extent
No
12.1 In Hungary
12.2 The post-socialist New EU Members States
(This category includes the following countries: Bulgaria, Czech Republic, Estonia, Croatia, Hungary, Poland, Latvia, Lithuania, Romania, and Slovenia)
12.3 The EU-15 countries
(This category includes: Austria, Belgium, Denmark, Finland, France, Germany, Greece, Ireland, Italy, Luxembourg, Netherlands, Portugal, Spain, Sweden, and the United Kingdom)
12.4 Russia, Ukraine, Kazakhstan
12.5 Asia
12.6 North America
12.7 Other (please specify) …...……………………

108
QUESTION 13 IS ASKED ONLY IF THE ANSWER IS YES TO QUESTION 6, E.G., THE FIRM IS
PART OF THE COMPANY GROUP.
13. The typical customers of the firm…. (in %)
(Please calculate on the basis of the yearly turnover.)
13.1 are within the company group …………%
13.2 are outside of the company group …………%
14. The number of the firm’s customers:
14.1 One customer
14.2 More customers
Instructions for the interviewer: The following questions deal with the products
manufactured by the firm.
15. The rate of change of products manufactured by the firm is (please mark only one item):
15.1 Non-changing
15.2 Slowly changing
15.3 Fast changing
16. The volume of the products manufactured and distributed by the firm is (in %): (Please calculate on the basis of the yearly turnover.)
16.1 Individual product …………%
16.2 Mass product …………%
17. The level of technology used by the firm compared to the period before 2005 is:
17.1 The same
17.2 Improved
17.3 Completely new

109
18. The level of technology used by the firm compared to its competitors is:
18.1 Older than the technology used by the competitors
18.2 Similar to the technology used by the competitors
18.3 More developed than the technology used by the competitors
18.4 Internationally ‘leading edge’ technology

110
II. RELATIONS BETWEEN THE HUNGARIAN AND FOREIGN
MANAGERS
19. Do foreign managers work at your firm?
Yes No IF ‘NO,’ SKIP TO QUESTION 25.
20. In the last few years, to what extent did your firm rely on the contribution of expatriates? If you do not have precise data, please estimate their number.
Year Number of foreign
managers Number of local
managers Total
2007 2003
21. What countries do the foreign managers come from?
Year The HQ from
the parent firm
From other members of the company group
From other companies Total
2007 100% 2003 100%
22. Please estimate the number of Hungarian employees who worked at foreign subsidiaries of the company group between 2003 and 2007.
Year Number of Hungarian managers
working abroad 2007 2003
23. Nationality of the managing director of the firm:
23.1 Hungarian 23.2 Expatriate
Instructions for the interviewer: In the following, information about the relationship between your firm and the parent firm will be sought.

111
24. At your firm, who is responsible for the following business functions? (Please remark with X.)
Expatriate Hungarian 24.1 Finance and accounting 24.2 Human resources management 24.3 Production 24.4 Quality control 24.5 Sales and marketing 24.6 Customer service 24.7 IT 24.8 Research and development 24.9 Other (please specify): QUESTIONS 25 AND 26 ARE ONLY ASKED IF THE ANSWER IS YES TO QUESTION 6, E.G., THE FIRM IS PART OF A COMPANY GROUP.
25. To what extent do the local managers participate in managing the business processes?
25.1 Implement the standards of the parent firm
25.2 Implement the standards of the parent firm but actively take part in the
further development of these standards
25.3 Adapt the standards of the parent firm according to the local needs
25.4 Create its business processes independently while following the parent
company’s policies 25.5 Create its business processes independently from the parent company’s
policy
25.6 Implement the standards of the customers (e.g., outsourcing of business
processes)

112
Instructions for the interviewer: In the following, questions about the Human Resources Management (HRM) will be sought. 26. Please evaluate the similarities and differences between the HRM practices of your firm and those of the parent company. Your firm is relying on the following: (Please mark only one answer.)
26.1 Implement the HRM system of the parent company
26.2 Implement the HRM system of the parent firm with slight adaptation to
the local environments
26.3 Create an autonomous HRM system that corresponds to the local needs
while consistent with the parent company’s HRM practices
26.4 Create an autonomous HRM system using only the local requirements
27. Does your firm have a Board of Directors or a Supervisory Board? (If the firm is a unit of a parent company registered in Hungary, please answer in regard to the registered parent company.)
27.1 There is only a Board of Directors SKIP TO QUESTION 29!
27.2 There are both a Board of Directors and a Supervisory Board
27.3 Neither SKIP TO QUESTION 30!
28. Please estimate the composition of the Supervisory Board by nationality.
Expatriate Hungarian 28.1 Chairman of the Supervisory Board
28.2 Number of Supervisory Board members
28.3 - of which external members 28.4 - of which independent members

113
29. Please estimate the composition of the Board of Directors by nationality.
Expatriate Hungarian 29.1 Chair of the Board of Directors 29.2 Number of board members 29.3 - of which external members 29.4 - of which independent members

114
III. ORGANIZATIONAL INNOVATIONS WITHIN THE COMPANY
30. From 2005 through 2007, did your firm introduce:
30.1 New business practices for organizing work or procedures (i.e., supply chain management, business re-engineering, lean production, quality
management, education/training systems) 30.2 New knowledge management systems to better use or exchange information, knowledge, and skills within your enterprise or to collect and
interpret information from outside your enterprise 30.3 New methods of workplace organization for distributing responsibilities and decision-making (i.e., first use of a new system of employee responsibilities, teamwork, decentralization, and integration or de-integration of departments)
30.4 New methods of organizing external relations with other firms or public
institutions (i.e., alliances, partnerships, outsourcing, or sub-contracting)
31. Does your firm make use of some of the following methods of organizing work?
31.1 Job rotation
31.2 Teamwork
31.3 Systems for collection of employee proposals
31.4 Quality circles/groups
31.5 Cross-occupational working groups
31.6 Project-based work
31.7 Benchmarking
31.8 Flat organization
31.9 Quality Control System (e.g., ISO, TQM)

115
32. If your firm did not introduce organizational innovations from 2005 through 2007, how important were the following factors? (Please evaluate the following reasons on a 5-point scale, 5 indicating very important, and 1, not at all important.)
32.1 Introduction of organizational innovations before 2005; no need for further changes
1 2 3 4 5
32.2 Lack of funds to implement organizational innovations 1 2 3 4 5
32.3 Lack of knowledge or qualified staff 1 2 3 4 5
32.4 Employees or management resistant to organizational change
1 2 3 4 5
32.5 No need for organizational innovation from 2005 through 2007
1 2 3 4 5
32.6. Other reasons (please specify): …………………………………………………
1 2 3 4 5
QUESTION 33 IS ASKED ONLY IF THE ANSWER IS YES TO QUESTION 31.2, E.G., THE FIRM
PRACTICES TEAMWORK!
33. If your firm practices teamwork, please describe it. The team members decide about…
Yes No Do not know
No answer
33.1 - ...division of the tasks 1 2 8 9
33.2 - ...the selection of the team leader 1 2 8 9

116
34. During the adaptation of companies to market requirements, from time to time, it is necessary to initiate organizational changes. At your firm, what are the drivers of the organizational changes? (Please evaluate the following reasons on a 5-point scale, 5 indicating very characteristic, and 1, not at all characteristic.)
34.1 Improvement of the effectiveness of daily work 1 2 3 4 5
34.2 Strengthening of the cooperation and coordination within the organization
1 2 3 4 5
34.3 Adapting to environmental changes 1 2 3 4 5
34.4 Continuous renewal of products/services 1 2 3 4 5
34.5 Continuous renewal of knowledge and know-how 1 2 3 4 5
34.6 Outsourcing activities 1 2 3 4 5
34.7 Improvement of the quality and customer service 1 2 3 4 5
34.8 Increase of the firm size 1 2 3 4 5
34.9 Other (please specify.) …..………………………. 1 2 3 4 5
34.10 No organisational changes
35. Please assess, on a 5-point scale, the intensity of competition with other subsidiaries of the company group (if applicable) or with your competitors on the market (if there are any). (Please evaluate the forms of competition on a 5-point scale, 5 indicating that competition is very intensive, and 1, not at all intensive.)
QUESTION 35.1 SHOULD ONLY BE ASKED IF THE ANSWER IS YES TO QUESTION 6, E.G., THE FIRM IS PART OF A CONCERN/GROUP.
No competition at all
Very intensive competition
35.1 Competition between the subsidiaries
1 2 3 4 5
35.2 Market competition 1 2 3 4 5

117
36. In comparison with your competitors, how important are the following factors that influence the performance of your firm? (Please rate on a 5-point scale, 5 indicating very important, and 1, not at all important.)
36.1 Prices 1 2 3 4 5
36.2 Customer orientation 1 2 3 4 5
36.3 Quality 1 2 3 4 5
36.4 Respecting deadlines and flexibility 1 2 3 4 5
36.5 Versatility of products/services 1 2 3 4 5
36.6 Image and brand of the firm 1 2 3 4 5
36.7 Continuous product/service development 1 2 3 4 5
36.8 Skilled labor 1 2 3 4 5
36.9 Experiences 1 2 3 4 5
36.10 Reliability 1 2 3 4 5
36.11 Lobbying
36.12 Other (please specify)…..……………………… 1 2 3 4 5
37. It is well-known that ICT plays a significant role in the operation of firms. Please estimate the extent of ICT use on the following areas.
37.1 Information processing/communication (e.g., external/internal communication)
…………%
37.2 Greater flexibility in production and knowledge use …………%
37.3 Continuous development of products/services …………%

118
IV. WORK ORGANIZATION AND KNOWLEDGE USE
38. Which characteristics of human resources are important for the improvement of the firm’s performance? (Please assess the following reasons on a 5-point scale, 5 indicating very important, and 1, not at all important!)
38.1 Professional-technical knowledge 1 2 3 4 5
38.2 Experience and competence 1 2 3 4 5
38.3 Managerial-organizational skill 1 2 3 4 5
38.4 Customer orientation 1 2 3 4 5
38.5 Creativity, innovative skills 1 2 3 4 5
38.6 Ability to cooperate 1 2 3 4 5
38.7 Language skills 1 2 3 4 5
38.8 Problem-solving ability 1 2 3 4 5
38.9 General IT skills 1 2 3 4 5
38.10 Communications skills 1 2 3 4 5
38.11 Punctuality and reliability 1 2 3 4 5
38.12 Other (please specify)…………………………
1 2 3 4 5
39. Please estimate the share of employees with a university or college degree.
The ratio of employees with a degree: ………… %
40. What attention is devoted by the management to the continuous skill development of employees? (Please use the following 5-point scale, 5 indicating very important, and 1, not at all important.)
40.1 On-the-job training 1 2 3 4 5
40.2 Consultation with managers/other employees 1 2 3 4 5
40.3 Job rotation 1 2 3 4 5
40.4 Teamwork 1 2 3 4 5
40.5 Supporting cooperation between various organizational units
1 2 3 4 5
40.6 Participation in formal trainings 1 2 3 4 5
40.7 Training tailored to the needs of the firm (e.g., language courses, further professional training)
1 2 3 4 5
40.8 Visiting exhibitions and fairs 1 2 3 4 5

119
41. Please estimate the ratio of employees participating in various training courses organized and financed by the firm.
%
41.1 Training organized and financed by the firm (e.g., language courses, further professional training)
………
41.2 Training initiated by the employee but financed by the employer (e.g., external training, participation at conferences)
………
41.3 Training not financed by the employer but supported with reduced working time (e.g., second degree/diploma)
………
42. What kind of training courses are organized and financed by the employer? (Please select only one.)
42.1 EXCLUSIVELY work-related skills (e.g., quality assurance, professional skill development)
42.2 EXCLUSIVELY generic skills (e.g., language, communication skills)
42.3 BOTH generic and work-related skills
43. Organizational knowledge can be developed by the use of external partner experiences. To what extent does your firm rely on the following groups in developing organizational knowledge? (Please indicate the appropriate partners with X.)
Regularly Occasionally Never
43.1 Customers
43.2 Various suppliers (e.g., parts, services)
43.3 Consulting firms
43.4 Higher-education institutions
43.5 Other educational training agencies
43.6 Research institutes
43.7 Development agencies 43.8 Other professional and labor market
organizations

120
44. Code of the interviewer: ………………
45. Name of the
interviewee……………………………………………………………………….
46. Phone number of the interviewee (with area
code)………………………………………….
47. Date of interview: ......................... (dd/mm/yy)
General comments of the interviewer:
Signature of the interviewer

121
Appendix 10. Survey questionnaire in Slovak
Institute for World Economics Hungarian Academy of Sciences
Institute of Economic Research Hitotsubashi University
Institute of Sociology Hungarian Academy of Sciences
Nadnárodné spoločnosti a miestne zdroje
Dotazník
Podnikové služby
FAKULTA MANAGEMENTU
UNIVERZITA KOMENSKÉHO
BRATISLAVA
2008

122
Číslo:
I. PODNIK V KONTEXTE
1. Názov podniku:
Inštrukcie pre anketára: Nasledujúca časť obsahuje základné údaje o podniku, jeho organizačnej štruktúre a činnosti/činnostiach.
2. Adresa sídla podniku na Slovensku
PSČ Mesto Ulica č.
3. Štatistický kód základnej činnosti podniku (SKNACE – kód štatisickej
klasifikácie ekonomických činností, štvorčíslie):
4. Rok založenia podniku: (ak 2000 = 00)
5. Štruktúra vlastníctva podniku
podnik so 100%-nou zahraničnou účasťou
podnik s väčšinovou zahraničnou účasťou
podnik so 100%-nou domácou účasťou
podnik s väčšinovou domácou účasťou
podnik so 100%-nou domácou účasťou štátu
podnik s väčšinovou domácou účasťou štátu
Iné (uveďte): ……………
6. Je váš podnik súčasťou koncernu/skupiny?
(Skupina pozostáva z dvoch alebo viacerých právne vymedzených podnikov v jednom spoločnom vlastníctve. Vedenie podniku je súčasťou tejto skupiny.)
Áno Nie AK JE ODPOVEĎ NIE, PREJDITE NA OTÁZKU 10

123
V nasledujúcej časti uveďte hlavné charakteristiky materského podniku.
7. V ktorom štáte sídli materský podnik?
8. Počet zamestnancov podniku:
Menej ako 10
10-49
50-249
250-999
1.000-4.999
5.000-9.999
10.000 a viac
9. Mal váš podnik pred rokom 1990 právne vymedzeného predchodcu? (Ak ich bolo viac, prosím, uveďte údaje len o najstaršom z nich.)
9.1 Nie
9.2 Áno, podnik v štátnom vlastníctve založený pred rokom 1990
9.3 Áno, podnik v štátnom vlastníctve v roku 1990 alebo neskôr
9.4 Áno, podnik v súkromnom vlastníctve, založený pred rokom 1990
9.5 Áno, podnik v súkromnom vlastníctve založený v roku 1990 alebo neskôr 9.6 Iné (uveďte):…………………………………………………………. 10. Počet zamestnancov: (Do počtu zahrňte aj zamestnancov pracujúcich u zákazníkov ako aj zamestnancov na čiastočný pracovný úväzok)
Menej ako 10
10-49
50-249
250-999
1.000-4.999
5.000-9.999
10.000 a viac

124
11. Koľko úrovní riadenia obsahuje organizačná štruktúra medzi vrcholovým vedením a radovými zamestnancami?
12. Ktoré služby poskytuje váš podnik klientom?
12.1. Účtovníctvo, finančné služby, právne služby
Právne služby
Daňové poradenstvo
Finančný audit
Účtovníctvo
Finančné poradenstvo
Iné (uveďte):………………………………………………………………………
12.2. Riadenie ľudských zdrojov
Nábor pracovníkov, personálny lízing
Poradenstvo v oblasti riadenia ľudských zdrojov
Školenia a vzdelávanie
Mzdy
Iné (uveďte):……………………………………………………………………
12.3. Architektonické a technické služby, poradenstvo
Architektonické služby
Technické služby a s nimi súvisiace technické poradenstvo
Technické testovanie a analýzy
Výskum a vývoj
Iné (uveďte):………………………………………………………………………

125
12.4 Informačné technológie Predaj, zavádzanie informačných technológií (hardvér, aplikácie) a s tým
súvisiace poradenstvo
Operačné systémy (hardvér, aplikácie)
Vývoj softvéru
Zber a spracovanie dát
Web-hosting a/alebo vývoj webových stránok Webové portály, správa obsahu
Iné (uveďte):………………………………………………………………………
12.5. Reklama, marketing, služby zákazníkom
Reklama, marketingové služby
Výskum trhu
Manažérsky servis
Služby zákazníkom, služby call-centra
Iné (uveďte):………………………………………………………………………
12.6 Iné činnosti (uveďte): ……………………………………………………………………………………………

126
Inštrukcia pre anketára: Nasledujúca časť dotazníka zhromažďuje údaje o trhoch podniku.
13. Trhový podiel podniku v období 2005 – 2007 bol
Áno, dominan
tný
Áno, v menšom rozsahu
Nie
13.1 Na Slovensku
13.2 V post-socialistických štátoch – t.j. v nových členských štátoch EÚ
(Táto kategória zahŕňa nasledovné štáty: Bulharsko, Česká republika, Estónsko, Chorvátsko, Maďarsko, Poľsko, Lotyšsko, Litva, Rumunsko, Slovinsko)
13.3 V 15 štátoch EÚ
(Táto kategória zahŕňa nasledovné štáty: Rakúsko, Belgicko, Dánsko, Fínsko, Francúzsko, Nemecko, Grécko, Írsko, Taliansko, Luxembursko, Holandsko, Portugalsko, Španielsko, Švédsko, Veľká Británia)
13.4 Rusko, Ukrajina, Kazachstan
13.5 Ázia
13.6 Severná Amerika
13.7 Iné (uveďte):…………………………
ODPOVEĎ NA OTÁZKU Č. 14 UVEĎTE LEN V PRÍPADE, AK BOLA ODPOVEĎ NA OTÁZKU Č.
6 ÁNO, NAPR. PODNIK JE SÚČASŤOU SKUPINY.
14. Typickí zákazníci podniku (v %)
(Vypočítajte na základe ročného obratu.)
14.1 sú v rámci skupiny …………%
14.2 sú mimo skupiny …………%
15. Počet zákazníkov podniku:
15.1 Jeden zákazník
15.2 Viac zákazníkov
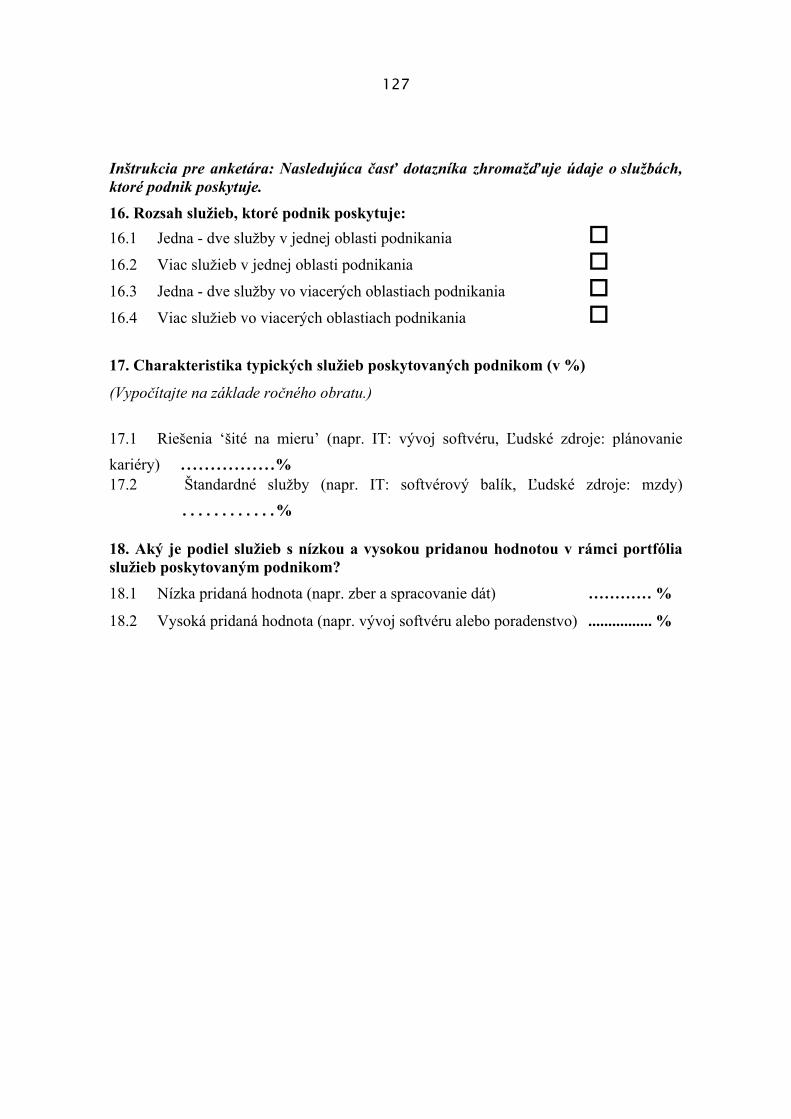
127
Inštrukcia pre anketára: Nasledujúca časť dotazníka zhromažďuje údaje o službách, ktoré podnik poskytuje.
16. Rozsah služieb, ktoré podnik poskytuje:
16.1 Jedna - dve služby v jednej oblasti podnikania
16.2 Viac služieb v jednej oblasti podnikania
16.3 Jedna - dve služby vo viacerých oblastiach podnikania
16.4 Viac služieb vo viacerých oblastiach podnikania
17. Charakteristika typických služieb poskytovaných podnikom (v %)
(Vypočítajte na základe ročného obratu.)
17.1 Riešenia ‘šité na mieru’ (napr. IT: vývoj softvéru, Ľudské zdroje: plánovanie
kariéry) ................% 17.2 Štandardné služby (napr. IT: softvérový balík, Ľudské zdroje: mzdy)
…………%
18. Aký je podiel služieb s nízkou a vysokou pridanou hodnotou v rámci portfólia služieb poskytovaným podnikom?
18.1 Nízka pridaná hodnota (napr. zber a spracovanie dát) ………… %
18.2 Vysoká pridaná hodnota (napr. vývoj softvéru alebo poradenstvo) ................ %

128
II. VZŤAHY MEDZI SLOVENSKÝMI A ZAHRANIČNÝMI
MANAŽÉRMI
19. Pracujú vo vašom podniku zahraniční manažéri?
Áno Nie x AK ‘NIE’, PREJDITE NA OTÁZKU 25.
20. V akom rozsahu sa váš podnik v poslednom čase spoliehal na prínos zahraničných manažérov? Ak nemáte presné údaje, prosím, odhadnite ich počet.
Rok Počet zahraničných
manažérov Počet domácich
manažérov Spolu
2007 2003
21. Odkiaľ pochádzajú zahraniční manažéri vo vašom podniku?
Rok Z vedenia
materského podniku
Z iných podnikov skupiny
Z iných podnikov Spolu
2007 2003
22. Odhadnite, prosím, koľko slovenských zamestnancov pracovalo v rokoch 2003 – 2007 v zahraničných pobočkách koncernu/skupiny, kam patrí váš podnik?
Rok Počet slovenských manažérov pracujúcich v
zahraničí 2007 2003
23. Štátna príslušnosť riadiaceho pracovníka podniku:
23.1 Slovenská 23.2 Štát materského podniku
Inštrukcia pre anketára: Nasledujúca časť dotazníka zhromažďuje údaje o vzťahu vášho podniku a materského podniku.

129
24. Kto je vo vašom podniku zodpovedný za nasledovné funkcie? (Prosím, označte X)
Zahraničný pracovník
Slovák
24.1 Financie a účtovníctvo 24.2 Manažment ľudských zdrojov 24.3 Výroba 24.4 Kontrola kvality 24.5 Predaj a marketing 24.6 Služby zákazníkom 24.7 Informačné technológie 24.8 Výskum a vývoj 24.9 Iné (uveďte):
OTÁZKY 25 A 26 KLADIEME, LEN AK ODPOVEĎ NA OTÁZKU 6 BOLA ÁNO, NAPRÍKLAD
PODNIK JE SÚČASŤOU SKUPINY.
25. V akom rozsahu sa domáci manažéri zúčastňujú na riadení podnikových procesov?
25.1 Implementujú štandardy materského podniku
25.2 Implementujú štandardy materského podniku, ale aktívne sa zúčastňujú na
ďalšom rozvoji týchto štandardov
25.3 Prispôsobujú štandardy materského podniku miestnym potrebám
25.4 Samostatne vytvárajú vlastné podnikové procesy, ale dodržiavajú zásady
materského podniku 25.5 Vytvárajú vlastné podnikové procesy nezávisle od zásad materského podniku
25.5 Implementujú štandardy zákazníkov (napríklad outsourcing podnikových
procesov)
Inštrukcia pre anketára: Nasledujúca časť obsahuje otázky zamerané na manažment ľudských zdrojov.

130
26. Prosím, zhodnoťte podobnosti a rozdiely medzi praxou manažmentu ľudských zdrojov vášho podniku a postupmi materského podniku. Váš podnik sa spolieha na: (Prosím, označte iba jednu odpoveď.)
26.1 zavádzanie systému manažmentu ľudských zdrojov materského podniku
26.2 zavádzanie systému manažmentu ľudských zdrojov materského podniku,
ale mierne ho prispôsobuje miestnym podmienkam
26.3 vytváranie autonómneho systému manažmentu ľudských zdrojov zohľadňujúceho miestne potreby, ktorý je však v súlade s uplatňovaní postupov manažmentu
ľudských zdrojov materského podniku
26.4 vytváranie autonómneho systému manažmentu ľudských zdrojov zohľadňujúceho
výlučne miestne požiadavky
27. Existuje vo vašom podniku správna rada alebo dozorná rada? (Ak je podnik útvarom materského podniku registrovaného na Slovensku, odpovedajte prosím, za registrovaný materský podnik.)
27.1 Existuje iba správna rada PREJDITE NA OTÁZKU 29
27.2 Existujú obe, správna rada aj dozorná rada
27.3 Neexistuje ani jedna z nich PREJDITE NA OTÁZKU 30
28. Uveďte zloženie dozornej rady podľa štátnej príslušnosti.
Cudzí štátny príslušník
Slovák
28.1 Predseda dozornej rady 28.2 Počet členov dozornej rady 28.3 - z toho externí členovia 28.4 - z toho nezávislí členovia
29. Uveďte zloženie správnej rady podľa štátnej príslušnosti.
Cudzí štátny príslušník
Slovák
29.1 Predseda správnej rady 29.2 Počet členov správnej rady 29.3 - z toho externí členovia 29.4 - z toho nezávislí členovia

131
III. ORGANIZAČNÉ INOVÁCIE V PODNIKU
30. V období rokov 2005 až 2007, váš podnik predstavil:
30.1 nové podnikové postupy pre organizovanie práce alebo procesov (t.j. manažment zásobovania, podnikový re-inžiniering, štíhla výroba, manažment kvality,
systém vzdelávania/školení atď.). 30.2 nový systém znalostného manažmentu pre lepšie využitie a výmenu informácií, znalostí a zručností v rámci podniku, alebo na zber a interpretáciu informácií z externého
prostredia vášho podniku. 30.3 nové metódy organizácie pracovného miesta na rozdelenie zodpovedností a rozhodovania (t.j. prvé využitie nového systému zodpovednosti zamestnancov, tímová
práca, decentralizácia, integrácia alebo de-integrácia oddelení atď.) 30.4 nové metódy organizovania externých vzťahov s inými firmami alebo verejnými inštitúciami (t.j. aliancie, partnerstvá, outsourcing alebo zmluvná spolupráca atď.).
31. Využíva váš podnik niektorú z nasledovných metód organizácie práce?
31.1 Rotácia na pracovisku
31.2 Tímová práca
31.3 Systém zberu zamestnaneckých návrhov
31.4 Krúžky/skupiny kvality
31.5 Pracovné skupiny pozostávajúce z členov z viacerých odborov
31.6 Práca na základe projektov
31.7 Benchmarking
31.8 Ploché usporiadanie
31.9 Systém kontroly kvality (napr. ISO, TQM)

132
32. Využíva váš podnik nasledovné formy flexibilnej organizácie práce a systémy pracovného času? (Môžete označiť viac odpovedí.)
TELEPRÁCA: práca mimo pracoviska s pomocou využitia IKT (PC, telefón, fax, modem, Internet, telekonferencie, e-mail atď.).
VYSUNUTÉ MOBILNÉ PRACOVISKÁ: práca na miestach iných ako doma alebo v podnikoch, firemných priestoroch, napr.: u klienta, na ceste.
32.1 Telepráca z domu raz týždenne
32.2 Telepráca z domu viac krát za týždeň
32.3 Vysunuté mobilné pracovisko
32.4 Práca na čiastočný pracovný úväzok
32.5 Pružný pracovný čas
33. Plánuje váš podnik tieto formy organizácie práce v blízkej budúcnosti? (Môžete označiť viac odpovedí.)
33.1 Telepráca z domu raz týždenne
33.2 Telepráca z domu viac krát za týždeň
33.3 Vysunuté mobilné pracovisko
33.4 Práca na čiastočný pracovný úväzok
33.5 Pružný pracovný čas

133
4. Ak váš podnik v rokoch 2005 až 2007 nezaviedol nijaké organizačné inovácie, vyznačte ako dôležité boli pre váš podnik nasledovné faktory (Priraďte každému faktoru hodnotu z päťstupňovej škály: 5=veľmi dôležitý a 1=nepodstatný). 34.1 Zavedenie organizačných inovácií pred rokom
2005, ktoré nepožadovali ďalšie zmeny 1 2 3 4 5
34.2 Nedostatok fondov na zavedenie inovácií 1 2 3 4 5
34.3 Nedostatok vedomostí a absencia kvalifikovaných pracovníkov
1 2 3 4 5
34.4 Odpor zamestnancov alebo manažmentu k organizačným zmenám
1 2 3 4 5
34.5 V rokoch 2005 až 2007 absencia potreby zavádzať organizačné zmeny
1 2 3 4 5
34.6. Iné dôvody (uveďte): …………………………………………………………
1 2 3 4 5

134
OTÁZKU 35 TREBA POLOŽIŤ LEN V PRÍPADE, AK ODPOVEĎ NA OTÁZKU 31.2 BOLA ÁNO, T.J. PODNIK UPLATŇUJE TÍMOVÚ PRÁCU.
35. Ak Váš podnik uplatňuje tímovú prácu, opíšte tento proces. Členovia tímu sami rozhodujú o:
Áno Nie Neviem Nijaká
odpoveď
35.1 - rozdelení pracovných úloh 1 2 8 9
35.2 - výbere vedúceho/vedúcej tímu 1 2 8 9
36. Počas adaptovania sa podnikov na požiadavky trhu je z času na čas potrebné iniciovať organizačné zmeny. Čo sú motivátory zmeny vo vašom podniku (Priraďte každému dôvodu hodnotu na päťstupňovej škále: 5=absolútne typické a 1=úplne netypické).
36.1 Zlepšenie výkonu každodennej práce 1 2 3 4 5
36.2 Posilnenie kooperácie a koordinácie v rámci organizácie práce
1 2 3 4 5
36.3 Prispôsobenie sa zmenám prostredia 1 2 3 4 5
36.4 Neprestajné obnovovanie produkov/služieb 1 2 3 4 5
36.5 Neprestajné obnovovanie znalostí a know-how 1 2 3 4 5
36.6 Možnosti využívať outsourcing 1 2 3 4 5
36.7 Zlepšenie kvality a zlepšenie zákazníckych služieb 1 2 3 4 5
36.8 Rastúca veľkosť podniku 1 2 3 4 5
36.9 Iné (uveďte):………………………….. 1 2 3 4 5
36.10 Nijaké organizačné zmeny

135
37. Vyhodnoťte na päťbodovej stupnici intenzitu konkurenčného boja s inými podnikmi v rámci skupiny (ak je váš podnik členom skupiny) alebo s vašimi konkurentmi na trhu (ak takí sú) (Prisúďte váhu danej forme konkurencie z päťbodovej škály: 5= konkurencia je veľmi intenzívna a 1=nijaká konkurencia)
MOŽNOSŤ 37.1 VYŽADUJE ODPOVEĎ IBA V PRÍPADE AK ODPOVEĎ NA OTÁZKU 6 BOLA
ÁNO, NAPRÍKLAD PODNIK JE SÚČASŤOU KONCERNU/SKUPINY.
Vôbec nijaká konkurencia
Veľmi intenzívna
konkurencia
37.1 Konkurencia medzi pobočkami 1 2 3 4 5
37.2 Trhová konkurencia 1 2 3 4 5
38.Aké dôležité sú nasledovné faktory, ktoré ovplyvňujú výkonnosť vášho podniku (Prisúďte im hodnotu z päťbodovej stupnice: 5=veľmi dôležitý faktor a 1=nepodstatný faktor).
38.1 Ceny 1 2 3 4 5
38.2 Orientácia na zákazníkov 1 2 3 4 5
38.3 Kvalita 1 2 3 4 5
38.4 Dodržiavanie termínov a flexibilita 1 2 3 4 5
38.5 Neprestajná obmena produktov/služieb 1 2 3 4 5
38.6 Imidž, značka podniku 1 2 3 4 5
38.7 Neprestajný rozvoj produktov/služieb 1 2 3 4 5
38.8 Zručná pracovná sila 1 2 3 4 5
38.9 Skúsenosti 1 2 3 4 5
38.10 Spoľahlivosť 1 2 3 4 5
38.11 Lobovanie 3
38.12 Iné (upresnite):…..……………………………
1 2 3 4 5

136
39. Je známe, že informačno-komunikačné technológie hrajú v podniku dôležitú úlohu. (Uveďte rozsah využívania informačno-komunikačných technológií v nasledujúcich oblastiach):
39.1 spracovanie informácií/komunikácia (napríklad externá/interná
komunikácia) ....%
39.2 vyššia flexibilita v produkcii a využívaní znalostí ....%
39.3 neprestajný rozvoj produktov/služieb .....%

137
IV. ORGANIZÁCIA PRÁCE A VYUŽITIE ZNALOSTÍ
40. Ktoré charakteristiky ľudských zdrojov sú dôležité pre zlepšenie výkonnosti podniku (Priraďte hodnotu nasledovným charakteristikám z päťbodovej stupnice: 5=veľmi dôležité a 1=nepodstatné)
40.1 Profesijno-odborné znalosti 1 2 3 4 5
40.2 Skúsenosti a kompetentnosti 1 2 3 4 5
40.3 Manažérske organizačné zručnosti 1 2 3 4 5
40.4 Orientácia na zákazníka 1 2 3 4 5
40.5 Tvorivosť, inovatívne zručnosti 1 2 3 4 5
40.6 Schopnosť spolupracovať 1 2 3 4 5
40.7 Jazykové zručnosti 1 2 3 4 5
40.8 Schopnosť riešiť problémy 1 2 3 4 5
40.9 Všeobecné zručnosti v oblasti informačných technológií
1 2 3 4 5
40.10 Komunikačné zručnosti 1 2 3 4 5
40.11 Dôslednosť a spoľahlivosť v práci 1 2 3 4 5
40.12 Iné (uveďte):………………………… 1 2 3 4 5
41. Uveďte podiel zamestnancov s vysokoškolským vzdelaním
Podiel zamestnancov s vysokoškolským vzdelaním: 75 %

138
42. Akú pozornosť venuje vedenie vášho podniku sústavnému rozvoju zručností zamestnancov? (Priraďte hodnotu nasledovným zručnostiam z päťbodovej stupnice: 5=veľmi dôležité a 1= nepodstatné)
42.1 Školenia na pracovisku v rámci pracovnej doby 1 2 3 4 5
42.2 Konzultácie s manažérmi/s inými zamestnancami
1 2 3 4 5
42.3 Rotácia na pracovisku 1 2 3 4 5
42.4 Tímová práca 1 2 3 4 5
42.5 Podporovanie kooperácie medzi rôznymi organizačnými jednotkami
1 2 3 4 5
42.6 Účasť na formálnych školeniach 1 2 3 4 5
42.7 Školenia ‘šité na mieru’ podľa potrieb podniku (napríklad jazykové kurzy, ďalšie odborné školenia, atď.)
1 2 3 4 5
42.8 Návšteva výstav a veľtrhov 1 2 3 4 5
43. Uveďte podiel zamestnancov, ktorí sa zúčastňujú na rôznych školeniach organizovaných a financovaných podnikom.
%
43.1 Školenie organizované a financované podnikom (napríklad jazykový kurz, ďalšie odborné školenie)
43.2 Školenie iniciované zamestancom, ale financované zamestnávateľom (napríklad externé školenie, účasť na konferenciách)
43.3 Školenie nefinancované zamestnávateľom ale podporované skráteným pracovným časom (napríklad ďalšie vzdelávanie/štúdium na vysokej škole atď.)
44. Aké druhy školení sú organizované a financované zamestnávateľom? (Označte iba jednu odpoveď).
44.1 VÝHRADNE zamerané na zručnosti súvisiace s prácou (napríklad rozvoj odborných zručností)
44.2 VÝHRADNE zamerané na všeobecné zručnosti (napríklad jazykové, komunikačné zručnosti)
44.3 X Zamerané na OBA druhy zručností, t.j. všeobecné aj tie súvisiace s prácou

139
45. Organizačné zručností sa môžu rozvíjať aj na základe využitia skúseností externých partnerov. V akom rozsahu váš podnik pri rozvoji organizačných zručností využíva nasledujúce skupiny (Označte príslušný partner X).
Pravid
elne Príležitost
ne Nikdy
45.1 Zákazníci
45.2 Rôzni dodávatelia (napríklad dielov, služieb)
45.3 Poradenské firmy
45.4 Vzdelávacie inštitúcie terciálnej sféry
45.5 Iné vzdelávacie agentúry
45.6 Výskumné ústavy
45.7 Rozvojové agentúry 45.8 Iné odborné organizácie a agentúry
pracovného trhu
46. Meno respondenta…
47. Telefónne číslo respondenta (s predvoľbou)
48. Kód anketára:
49. Dátum interview:
Všeobecné pripomienky anketára:

140
Appendix 11. Survey questionnaire in Hungarian
Institute for World Economics Hungarian Academy of Sciences
Institute of Economic Research Hitotsubashi University
Institute of Sociology Hungarian Academy of Sciences
MULTINACIONÁLIS VÁLLALATOK ÉS
HELYI ERŐFORRÁSOK
Kérdőív
Üzleti szolgáltatási szektor
A VÁLASZADÁS ÖNKÉNTES!
AZ ADATOKAT TITKOSAN KEZELJÜK!
2008.
‘Multinacionális vállalatok és helyi erőforrások’ c. kutatás

141
sorszám:
I. A CÉG ÁLTALÁNOS JELLEMZŐI
1. A cég (vállalat, fióktelep, szervezeti egység) teljes
neve:_______________________________
A következőkben a vizsgált cég alapadatait, szervezeti felépítését és tevékenységi körét rögzítjük.
2. A cég magyarországi központjának címe
Irányítószám Helység Utca Hsz. (hrsz.)
3. A cég statisztikai főtevékenységének száma (TEÁOR, 4 számjegyig):
………………………
4. A cég megalakulásának éve: (ha a cég 2000-ben jött létre, akkor 00)
5. A cég tulajdonosainak összetétele
100% külföldi
Többségben külföldi
100% magyar magán
Többségi magyar magán
100% magyar állami
Többségi magyar állami Egyéb, éspedig…………… 6. Tagja-e a cég valamely vállalatcsoportnak? (Vállalatcsoport két vagy több, közös tulajdonban lévő, jogi személyiséggel rendelkező vállalkozást jelent. A vállalati központ szintén része a vállalatcsoportnak.)

142
Igen Nem HA ’NEM’, UGORJ A 10. KÉRDÉSRE!
A következőkben arra kérjük, hogy az anyavállalat legfontosabb jellemzőit foglalja össze.
7. Az anyavállalat melyik országban található?
……………………………………………
8. Az anyavállalat alkalmazottainak száma:
10 fő alatt
10-49 fő
50-249 fő
250-999 fő
1000 4999 fő
5000-9999 fő
10000 fő vagy annál több
9. Magyarországon volt-e jogelődje a cégnek? (Ha több is volt, akkor a legrégebbit vegyék figyelembe!)
10.1 Nem
10.2 Igen, 1990 előtt alapított állami (szövetkezeti stb.) Tulajdonú cég 10.3 Igen, 1990-ben vagy később alapított állami (szövetkezeti stb.) Tulajdonú
cég
10.4 Igen, 1990 előtt alapított magántulajdonú cég
10.5 Igen, 1990-ben vagy később alapított magántulajdonú cég 10.6 Egyéb, éspedig…………………………………………….

143
10. A cég alkalmazottainak száma (Vegye figyelembe a cég állományába tartozó, de a vevő telephelyén dolgozó munkatársakat és az állandó alvállalkozókat is.)
10 fő alatt
10-49 fő
50-249 fő
250-999 fő
1000 4999 fő
5000-9999 fő
10000 fő vagy annál több
11. Hány vezetői szint van az első számú vezető és a végrehajtásban dolgozók
között?
(A felsővezetőt és a végrehajtás szintjét ne számolja hozzá.)
12. Az Ön cége milyen (rész)tevékenységeket lát el az alábbi szolgáltatási területeken ügyfelei számára?
12.1. Könyvelés, pénzügy, jogi szolgáltatások
Jogi tanácsadás, jogi képviselet
Adótanácsadás
Könyvvizsgálat
Könyvelés
Pénzügyi tanácsadás Egyéb, éspedig……………………………………………………………………
12.2. Emberi erőforrás-menedzsment
Munkaerő-közvetítés, -kölcsönzés
Emberi-erőforrás tanácsadás
Képzés
Bérszámfejtés Egyéb, éspedig……………………………………………………………………

144
12.3. Műszaki tervezés, tanácsadás
Építészmérnöki tevékenység
Mérnöki tevékenység, tanácsadás
Műszaki vizsgálat, elemzés
Kutatás-fejlesztés Egyéb, éspedig……………………………………………………………………
12.4 Informatikai, számítástechnikai tevékenység
IT rendszerek (hardver, alkalmazás) értékesítés, telepítése és tanácsadás
IT rendszerek (hardver, alkalmazás) üzemeltetése
Szoftverfejlesztés
Adatrögzítés- és feldolgozás
Web-hosting és/vagy web-fejlesztés Webes tartalomszolgáltatás Egyéb, éspedig……………………………………………………………………
12.5. Reklám, marketing, ügyfélszolgálat
Reklám, marketing szolgáltatások
Piackutatás
Gazdasági, üzletviteli tanácsadás
Ügyélszolgálat, call-center működtetése Egyéb, éspedig……………………………………………………………………
12.6 Egyéb tevékenység, éspedig Tevékenységek:…………………………………………………………………………

145
A következő kérdések a cég piacaira vonatkoznak.
13. 2005 és 2007 között mely földrajzi piacokon értékesítette a cég a szolgáltatásait?
Igen, jellemzően
Igen, kisebb
jelentőséggel
Nem
13.1 Magyarország határain belül
13.2 A poszt-szocialista régió új EU-tagállamai
(Ez a kategória a következő országokat foglalja magába: Bulgária, Cseh Köztársaság, Észtország, Horvátország, Lengyelország, Lettország, Litvánia, Románia, Szlovákia, Szlovénia)
13.3 Az EU régi tagállamai
(Ez a következő országokat jelenti: Ausztria, Belgium, Dánia, Egyesült Királyság, Finnország, Franciaország, Görögország, Hollandia, Írország, Luxemburg, Németország, Olaszország, Portugália, Spanyolország, , Svédország)
13.4 Oroszország, Ukrajna, Kazahsztán
13.5 Ázsia
13.6 Észak-Amerika
13.7 Egyéb, éspedig: ………………………………
A 14. KÉRDÉST CSAK AKKOR KÉRDEZD, HA A 6. KÉRDÉSRE IGEN VOLT A VÁLASZ, AZAZ
A VÁLLALAT TAGJA VALAMELY VÁLLALATCSOPORTNAK.
14. A cég jellemző ügyfelei (százalékos megoszlásban):
(Kérjük, az árbevétel alapján értékeljen!)
14.1 A vállalatcsoporton belül vannak …………százalék
14.2 A vállalatcsoporton kívül vannak …………százalék

146
15. A cég ügyfeleinek száma:
15.1 Egy ügyfél
15.2 Több ügyfél
A következő kérdések a cég által nyújtott szolgáltatásokra vonatkoznak.
16. A cég által nyújtott szolgáltatások skálája:
16.1 Egy üzleti területen egy-két szolgáltatás
16.2 Egy üzleti területen több szolgáltatás
16.3 Több üzleti területen –egy-két szolgáltatás
16.4 Több üzleti területen több szolgáltatás
17. A cég által nyújtott jellemző szolgáltatások jellege (százalékos megoszlásban): (Kérjük, az árbevétel alapján értékeljen!)
17.1 A vevő egyedi igényeinek megfelelő megoldás (pl. IT: egyedi szoftver fejlesztése vagy HR: karriertanácsadás)
…………százalék 17.2 Sztenderdizált szolgáltatás (pl. IT: csomagolt szoftver vagy HR: bérszámfejtés)
…………százalék
18. A cég által nyújtott szolgáltatások között milyen arányt képviselnek az alacsony és a magas hozzáadott értékű szolgáltatások?
18.1 Alacsony hozzáadott érték (pl. adatfeldolgozás) ………… százalék 18.2 Magas hozzáadott érték (pl. szoftverfejlesztés) ………… százalék

147
II. A MAGYAR ÉS KÜLFÖLDI MENEDZSMENT KAPCSOLATA
19. Vannak-e az Ön cégénél külföldi menedzserek vagy vezetők?
Igen Nem HA ’NEM’, UGORJ A 25. KÉRDÉSRE!
20. Az Ön cége az elmúlt években milyen mértékben támaszkodott külföldi vezetőkre és szakértőkre a menedzsmentben? Ha nem rendelkezik pontos adatokkal, kérjük, becsülje meg a számukat!
Év Külföldi
menedzserek számaHazai menedzserek
száma Összesen
2007
2003
21. Honnan érkeztek a külföldi menedzserek?
Év Az anyavállalat
központjából A vállalatcsoport
más tagjától Más vállalattól
(‘kívülről’) Összesen
2007 100%
2003 100%
22. Kérjük, becsülje meg, hogy ugyanebben az időszakban hány magyar munkavállaló dolgozott a vállalatcsoport külföldi cégeinél!
Év Külföldön dolgozó magyar
menedzserek száma 2007
2003
23. A cég vezetőjének nemzetisége:
23.1 Magyar 23.2 Külföldi

148
A következőkben a cég külföldi anyavállalattal való kapcsolatáról kérdezzük.
24. Az Ön cégénél az alábbi területekért magyar vagy külföldi felsővezető felel? (Jelölje X-szel)
Külföldi Magyar 24.1 Könyvelés és pénzügy 24.2 Emberi erőforrás-menedzsment 24.3 Termelésirányítás 24.4 Minőség-ellenőrzés 24.5 Értékesítés és marketing 24.6 Ügyfélszolgálat 24.7 Informatika 24.8 Kutatás-fejlesztés
A 25. ÉS 26. KÉRDÉST CSAK AKKOR TEDD FEL, HA A 6. KÉRDÉSRE IGEN VOLT A
VÁLASZ! 25. Milyen mértékben vesz részt a helyi vezetés a vállalati folyamatok kialakításában?
25.1 Az anyavállalat által kialakított standard folyamatokat veszi át
25.2 Az anyavállalat által kialakított folyamatokat veszi át, de aktívan részt is
vesz ezen standardok fejlesztésében
25.3 Az anyavállalat által kialakított standardokat a helyi viszonyokra adaptálja
25.4 Önállóan, de a vállalatcsoport általános irányvonalainak megfelelően
alakítja ki a folyamatait 25.5 Önállóan, a anyavállalat gyakorlatától függetlenül alakítja ki a folyamatait
25.5 A vevő eljárásait és gyakorlatait viszi, fejleszti tovább (pl. üzleti folyamat
kiszervezés)

149
Az előző kérdésben felmerült folyamatok közül most egy kiemelt területtel, az emberi-erőforrás menedzsmenttel (HR) kapcsolatban kérdezünk. 26. Kérjük, értékelje az anyavállalat és az Önök vállalata (leányvállalat) emberi-erőforrás gazdálkodási gyakorlata közötti kapcsolatokat. Az Önök (leány)vállalata: (Kérjük, csak egy választ jelöljön meg!)
26.1 A központi vállalat HR rendszerét alkalmazza
26.2 A központi vállalat HR-rendszerét a helyi viszonyoknak megfelelő
minimális változtatásokkal alkalmazza
26.3 A helyi szokásoknak megfelelő, de a központi vállalati gyakorlattal
konzisztens HR-rendszert alakít ki
26.4 A központi vállalati gyakorlattól függetlenül, a helyi szokásoknak
megfelelően alakítja a HR rendszerét
27. Az Ön cégénél működik-e igazgatóság/igazgatótanács vagy felügyelő bizottság? (Ha a cég Magyarországon bejegyzett vállalat szervezeti egysége, akkor a bejegyzett vállalatról válaszoljon!)
27.1 Csak igazgatóság/igazgatótanács működik
UGORJ A 29. KÉRDÉSRE!
27.2 Igazgatóság és felügyelő bizottság is működik
27.3 Egyik sincs UGORJ A 30. KÉRDÉSRE!
28. Kérjük, becsülje meg a felügyelő bizottság összetételét nemzetiség szerint!
Külföldi Magyar 28.1 Felügyelő bizottság elnöke 28.2 Felügyelőbizottsági tagok száma 28.3 - ebből külső tagok száma 28.4 - ebből független tagok száma
29. Kérjük, becsülje meg az igazgatóság összetételét nemzetiség szerint!
Külföldi Magyar 29.1 Igazgatóság elnöke 29.2 Igazgatósági tagok száma 29.3 - ebből külső tagok száma 29.4 - ebből független tagok száma

150
III. A SZERVEZETI INNOVÁCIÓK ELTERJEDTSÉGE A CÉGEN
BELÜL
30. A 2005-től 2007-ig tartó időszakban az Önök vállalkozása vezetett-e be:
30.1 A munkavégzést vagy szervezeti folyamatokat érintő új üzleti gyakorlatokat (pl. ellátási-lánc-menedzsment, üzleti folyamatok átszervezése,
lapos szervezet, minőségmenedzsment, oktatási/képzési rendszerek, stb.) 30.2 Új tudásmenedzsment rendszereket annak érdekében, hogy hatékonyabb legyen a vállalaton belüli és kívüli információk és tudások felhasználása és
megosztása 30.3 A munkaszervezés új módszereit (pl. az alkalmazottak felelősségének növelése a munkavégzésben, csapatmunka, decentralizáció, szervezeti egységek
összevonása vagy részekre bontása, stb.) 30.4 Más vállalatokkal vagy közintézményekkel való külső kapcsolatok szervezésének új módszereit (pl. szövetségek, partnerségek, kiszervezés, stb.)
31. Az alábbi munkaszervezési módszerek közül melyeket alkalmazzák vállalatánál?
31.1 Munkaköri csere (rotáció)
31.2 Team-munka
31.3 A dolgozók javaslatainak összegyűjtése
31.4 A minőségellenőrzést a munkavállalók végzik (minőségi körök vagy
csoportok)
31.5 Különböző szakmákat átfogó munkacsoportok létrehozása
31.6 Projekt-alapú munkavégzés
31.7 A versenytársak tevékenységének figyelemmel kísérése (benchmarking)
31.8 Lapos szervezeti felépítés
31.9 Minőségirányítási rendszer (pl. ISO, TQM) alkalmazása

151
32. Amennyiben az Önök vállalkozása nem vezetett be szervezeti innovációt 2005 és 2007 között, az alábbi tényezők milyen szerepet játszottak ebben? (Kérjük, egy ötös skálán értékeljen úgy, hogy ötöst ad, ha egy tényezőt nagyon fontosnak, és egyest, ha egyáltalán nem fontosnak tart!)
32.1 2005 előtt vezettek be szervezeti innovációt és azóta nem volt szükség további változtatásra
1 2 3 4 5
32.2 A szervezeti innováció bevezetéséhez szükséges források hiánya
1 2 3 4 5
32.3 A szervezeti innováció bevezetéséhez szükséges hozzáértő és megfelelően képzett munkaerő hiánya
1 2 3 4 5
32.4 Az alkalmazottak vagy a vezetés ellenállása a szervezeti változásokkal szemben
1 2 3 4 5
32.5 2005 és 2007 között nem volt szükség szervezeti innováció bevezetésére
1 2 3 4 5
32.6. Egyéb ok, éspedig: …………………………………………………………
1 2 3 4 5
A 33. KÉRDÉST AKKOR KÉRDEZD, HA A 31.2 KÉRDÉSRE IGEN VOLT A VÁLASZ!
33. Ha az Ön cégénél előfordul a team-munka, kérjük, jellemezze azok működését! A team tagjai maguk döntenek ...
Olvasd fel! Igen Nem Nem tudja
Nem válaszol
33.1 - ...a feladatok megosztásáról 1 2 8 9
33.2 - ...arról, ki legyen a csoport vezetője 1 2 8 9

152
34. A cégek hatékony piaci alkalmazkodása szempontjából időnként elengedhetetlenek a szervezeti változások. Az Ön cégénél mik a szervezeti változtatások indítékai? (Kérjük, egy ötös skálán értékelje a felsorolt indokokat úgy, hogy ötöst ad, ha nagymértékben jellemző és egyest, ha egyáltalán nem jellemző!)
34.1 A napi munka hatékonyságának javítása 1 2 3 4 5
34.2 A szervezeten belüli együttműködés és koordináció erősítése
1 2 3 4 5
34.3 Alkalmazkodás a környezeti változásokhoz 1 2 3 4 5
34.4 A termékek és szolgáltatások folyamatos megújítása 1 2 3 4 5
34.5 A tudások és ismeretek folyamatos megújítása 1 2 3 4 5
34.6 Tevékenységek kiszervezése 1 2 3 4 5
34.7 A minőség és a vevőszolgálat javítása 1 2 3 4 5
34.8 A cég méretének növekedése 1 2 3 4 5
34.9Egyéb,éspedig:…………………………………………………
1 2 3 4 5
34.10 Nincsenek/nem voltak szervezeti változások a cégnél
35. Értékelje egytől ötig terjedő skálán, hogy milyen intenzitású verseny folyik a munkák, tevékenységek elnyeréséért a vállalatcsoport leányvállalatai (ha értelmezhető), illetve a piaci versenytársak (ha vannak) között! (Kérjük, egy ötös skálán értékeljen úgy, hogy ötös ad, ha nagyon intenzív a verseny, és egyest, ha egyáltalán nincs verseny! Karikázza a nullát, ha nincs jelen azon a piacon.)
A 35.1 KÉRDÉST CSAK AKKOR KÉRDEZD, HA A 6. KÉRDÉSRE IGEN VOLT A VÁLASZ, AZAZ A VÁLLALAT TAGJA VALAMELY VÁLLALATCSOPORTNAK!
Egyáltalán nincs verseny
Nagyon intenzív verseny
35.1 Vállalatcsoporton belüli verseny 1 2 3 4 5
35.2 ‘Külső’ piaci verseny 1 2 3 4 5

153
36. Versenytársaival összehasonlítva a következő tényezők milyen szerepet játszanak a cég teljesítményében? (Kérjük, egy ötös skálán értékeljen úgy, hogy ötöst ad, ha az adott tényezőt a cég teljesítményében kiemelkedőnek tartja, és egyest, ha nem játszik szerepet!)
36.1 Árak 1 2 3 4 5
36.2 Vevő-centrikus szemlélet 1 2 3 4 5
36.3 Minőség 1 2 3 4 5
36.4 Gyorsaság és rugalmasság 1 2 3 4 5
36.5 Termékek/szolgáltatások sokoldalúsága 1 2 3 4 5
36.6 Imázs, márka, arculat 1 2 3 4 5
36.7 Termékek/szolgáltatások folyamatos fejlesztése 1 2 3 4 5
36.8 Szakképzett munkaerő 1 2 3 4 5
36.9 Tapasztalat 1 2 3 4 5
36.10 Megbízhatóság 1 2 3 4 5
36.11 Lobbitevékenység
36.12 Egyéb, éspedig: ……………………………………… …………………………………………………………………
1 2 3 4 5
37. Közismert az IKT használatának kiemelkedő jelentősége a vállalkozások működésében. Kérjük becsülje meg, hogy az alábbiak területeken milyen arányban használnak IKT eszközöket (infokommunikációs technológiákat?
37.1 Információfeldolgozás/kommunikáció (pl. külső-belső levelezés) …………százalék
37.2 Vállalati folyamatok alakítása (pl. integrált vállalatirányítási rendszer)
…………százalék
37.3 Fejlesztési tevékenység (pl. saját tudásbázis létrehozása, ügyfélforgalom mérése, saját alkalmazások készítése)
…………százalék

154
IV. A MUNKASZERVEZET ÉS A TUDÁSFELHASZNÁLÁS JELLEMZŐI
38. A vállalat egészének működését figyelembe véve, az emberi erőforrások alábbiakban felsorolt jellemzői közül melyeket tartja fontosnak a vállalat szempontjából? (Kérjük, egy ötös skálán értékeljen úgy, hogy ötöst ad, ha nagyon fontosak, és egyest, ha egyáltalán nem fontosak!)
38.1 Szakmai-technikai tudás 1 2 3 4 5
38.2 Begyakorlottság, jártasság 1 2 3 4 5
38.3 Vezetési-szervezési készség 1 2 3 4 5
38.4 Ügyfél- és vevőcentrikus szemlélet 1 2 3 4 5
38.5 Kreativitás, innovációs készség 1 2 3 4 5
38.6 Együttműködési, alkalmazkodási készség 1 2 3 4 5
38.7 Nyelvtudás 1 2 3 4 5
38.8 Problémamegoldó képesség 1 2 3 4 5
38.9 Általános informatikai ismeretek 1 2 3 4 5
38.10 Kommunikációs készség 1 2 3 4 5
38.11 Precíz, megbízható munkavégzés 1 2 3 4 5
38.12 Egyéb, éspedig: …………………………………
1 2 3 4 5
39. Kérjük, becsülje meg, a cég munkavállalóinak hány százaléka rendelkezik főiskolai vagy egyetemi diplomával!
A diplomával rendelkező munkavállalók aránya: ………… százalék

155
40. Mekkora jelentőséget tulajdonít a vezetés az alábbi módszereknek a munkavállalói tudás folyamatos fejlesztésében? (Kérjük, egy ötös skálán értékeljen úgy, hogy ötöst ad, ha kiemelkedő jelentőségű, és egyest, ha nincs jelentősége!)
40.1 Munkahelyi képzés / ‘On-the-job training’ 1 2 3 4 5
40.2 A vezetéssel vagy más alkalmazottal való konzultáció lehetősége
1 2 3 4 5
40.3 Munkaköri csere 1 2 3 4 5
40.4 Csoportos munkavégzés alkalmazása 1 2 3 4 5
40.5 Szervezeti egységek közötti együttműködés ösztönzése
1 2 3 4 5
40.6 Iskolarendszerű képzésben való részvétel 1 2 3 4 5
40.7 A cég igényeihez igazodó képzés megszervezése (pl. nyelvtanfolyam, vállalati szakmai továbbképzés, stb.)
1 2 3 4 5
40.8 Vásárok, kiállítások, szakmai találkozók látogatása
1 2 3 4 5
41. Kérjük, becsülje meg, hogy a cég munkavállalóinak mekkora aránya vett részt különböző módon szervezett és finanszírozott képzésekben?
Százalék
41.1 A cég által szervezett és finanszírozott képzés (pl. munkahelyi nyelvtanfolyam, munkahelyi szakmai továbbképzés)
………
41.2 A munkavállaló által választott, de a cég által finanszírozott képzés (pl. tréning, konferencia)
………
41.3 Nem finanszírozott, de munkaidő-kedvezménnyel támogatott képzés (pl. másoddiplomás képzés)
………
42. Jellemzően milyen területhez kapcsolódik a munkaadó által finanszírozott képzés? (Kérjük, egy választ jelöljön meg!)
42.1 KIZÁRÓLAG specifikusan a munkafeladathoz (pl. minőség, szaktudás)
42.2 KIZÁRÓLAG általános készségekhez (pl. nyelv, tárgyalástechnika)
42.3 A munkafeladatokhoz ÉS általános készségekhez

156
43. A szervezeti tudás fejleszthető számos külső partner tapasztalatának, tudásának, visszajelzésének becsatornázásával. Milyen mértékben támaszkodnak a következő csoportokra a szervezeti tudás és a szolgáltatások fejlesztésében? (Jelölje X-szel!)
Rend-
szeresen Eseten-
ként Soha
43.1 Ügyfelek, megrendelők 43.2 Külső beszállítók, szolgáltatók, nyersanyagot,
eszközöket, rendszereket (be)szállító cégek
43.3 Külső tanácsadók
43.4 Felsőoktatási intézmények
43.5 Egyéb oktatási intézmények
43.6 Kutatóintézetek
43.7 Fejlesztési ügynökségek és szervezetek 43.8 Foglalkoztatáspolitikai és szakmai
szervezetek vagy egyesületek
44. A kérdezőbiztos kódja:………………
45. Az interjúalany
neve:…………………………………………………………………………….
46. Az interjúalany telefonszáma
(körzetszámmal):……………………………………………….
47. Az interjúkészítés időpontja: 2008. ……………..hó………nap
A kérdezőbiztos általános megjegyzései:
Kérdezőbiztos aláírása…………….……..…………………………….

157
Appendix 12. Cross tables
Section I. Firm and Its Context … 158 Section II. Relations between Foreign and Local Managers … 174 Section III. Organizational Innovations within the Company …186 Section IV. Work Organization and Knowledge Use … 203
Note: HM, HS and SS denote Hungarian manufacturing firms, Hungarian service firms and Slovakian service firms, respectively.

Section I. Firm and Its Context
1. Year of establishment (Common: Q4)
Number Share (%) Number Share (%) Number Share (%) Number Share (%)1930-34 3 0.8 2 1.0 1 0.5 0 0.01935-39 0 0.0 0 0.0 0 0.0 0 0.01940-44 0 0.0 0 0.0 0 0.0 0 0.01945-49 1 0.3 1 0.5 0 0.0 0 0.01950-54 0 0.0 0 0.0 0 0.0 3 3.11955-59 2 0.5 0 0.0 2 1.0 1 1.01960-64 1 0.3 0 0.0 1 0.5 0 0.01965-69 3 0.8 1 0.5 2 1.0 1 1.01970-74 3 0.8 1 0.5 2 1.0 0 0.01975-79 1 0.3 1 0.5 0 0.0 0 0.01980-84 3 0.8 1 0.5 2 1.0 0 0.01985-89 16 4.1 12 6.3 4 2.0 0 0.01990-94 134 34.6 86 45.0 48 24.5 25 25.81995-99 100 25.8 52 27.2 48 24.5 21 21.62000-04 91 23.5 25 13.1 66 33.7 30 30.92005- 29 7.5 9 4.7 20 10.2 16 16.5Hard to answer/no answer 0 0.0 0 0.0 0 0.0 0 0.0Total 387 100.0 191 100.0 196 100.0 97 100.0
Hungary Slovakia(A) All firms (B) Manufacturing firms (C) Service firms (D) Service firms
158

2. Corporate ownership structure of the firm (Common: Q5)
Number Share (%) Number Share (%) Number Share (%) Number Share (%)100% foreign-owned enterprise 60 15.5 42 22.0 18 9.2 26 26.8Majority foreign-owned enterprise 29 7.5 14 7.3 15 7.7 12 12.4100% domestically-owned enterprise 243 62.8 117 61.3 126 64.3 41 42.3Majority domestically-owned enterprise 17 4.4 7 3.7 10 5.1 8 8.2100% domestically state-owned enterprise 23 5.9 7 3.7 16 8.2 4 4.1Majority domestically state-owned enterprise 4 1.0 2 1.0 2 1.0 3 3.1Other 11 2.8 2 1.0 9 4.6 3 3.1Hard to answer/no answer 0 0.0 0 0.0 0 0.0 0 0.0Total 387 100.0 191 100.0 196 100.0 97 100.0
3. Affilication to a company group (Common: Q6)
Number Share (%) Number Share (%) Number Share (%) Number Share (%)Yes 74 19.1 39 20.4 35 17.9 49 50.5No 313 80.9 152 79.6 161 82.1 48 49.5Hard to answer/no answer 0 0.0 0 0.0 0 0.0 0 0.0Total 387 100.0 191 100.0 196 100.0 97 100.0
(A) All firms (B) Manufacturing firms (C) Service firms (D) Service firms
Hungary Slovakia(A) All firms (B) Manufacturing firms (C) Service firms (D) Service firms
Hungary Slovakia
159

4. Location of the parent company of group firms (Common: Q7)
Number Share (%) Number Share (%) Number Share (%) Number Share (%)Austria 8 2.1 5 2.6 3 1.5 0 0.0Croatia 0 0.0 0 0.0 0 0.0 1 1.0Cypress 1 0.3 0 0.0 1 0.5 0 0.0Czech 0 0.0 0 0.0 0 0.0 6 6.2England 4 1.0 1 0.5 3 1.5 5 5.2Finnland 1 0.3 0 0.0 1 0.5 0 0.0France 3 0.8 1 0.5 2 1.0 3 3.1Germany 15 3.9 13 6.8 2 1.0 4 4.1Holland 1 0.3 0 0.0 1 0.5 1 1.0Hungary 23 5.9 6 3.1 17 8.7 0 0.0Italy 3 0.8 3 1.6 0 0.0 0 0.0Ireland 0 0.0 0 0.0 0 0.0 1 1.0Japan 2 0.5 2 1.0 0 0.0 0 0.0Slovakia 1 0.3 1 0.5 0 0.0 13 13.4Slovenia 1 0.3 0 0.0 1 0.5 2 2.1Spain 1 0.3 1 0.5 0 0.0 0 0.0Sweden 2 0.5 1 0.5 1 0.5 0 0.0Switzerland 1 0.3 1 0.5 0 0.0 0 0.0UAE 0 0.0 0 0.0 0 0.0 1 1.0United States 6 1.6 4 2.1 2 1.0 14 14.4Hard to answer/no answer 314 81.1 152 79.6 162 82.7 46 47.4Total 387 100.0 191 100.0 196 100.0 97 100.0
Hungary Slovakia(A) All firms (B) Manufacturing firms (C) Service firms (D) Service firms
160

5. Number of employees at the parent company (Common: Q8)
Number Share (%) Number Share (%) Number Share (%) Number Share (%)Less 10 persons 3 0.8 0 0.0 3 1.5 48 49.510-49 persons 18 4.7 2 1.0 16 8.2 15 15.550-249 persons 15 3.9 8 4.2 7 3.6 12 12.4250-999 persons 9 2.3 6 3.1 3 1.5 6 6.21000-4999 persons 8 2.1 6 3.1 2 1.0 16 16.55000-9999 persons 3 0.8 3 1.6 0 0.0 0 0.010000 or more 13 3.4 9 4.7 4 2.0 0 0.0Hard to answer/no answer 318 82.2 157 82.2 161 82.1 0 0.0Total 387 100.0 191 100.0 196 100.0 97 100.0
6. Did the firm have a legal predecessor before 1990? (Common: Q9)
Number Share (%) Number Share (%) Number Share (%) Number Share (%)No 315 81.4 160 83.8 155 79.1 35 36.1State-owned firm, founded before 1990 20 5.2 15 7.9 5 2.6 5 5.2State-owned firm, founded in or after 1990 3 0.8 3 1.6 0 0.0 1 1.0Private firm, founded before 1990 5 1.3 3 1.6 2 1.0 4 4.1Private firm, founded in or after 1990 9 2.3 3 1.6 6 3.1 3 3.1Other 4 1.0 0 0.0 4 2.0 0 0.0Hard to answer/no answer 31 8.0 7 3.7 24 12.2 49 50.5Total 356 92.0 191 100.0 196 100.0 97 100.0
Hungary Slovakia(D) Service firms
(A) All firms (B) Manufacturing firms (C) Service firmsHungary Slovakia
(D) Service firms
(A) All firms (B) Manufacturing firms (C) Service firms
161

7. Number of employees (Common: Q10)
Number Share (%) Number Share (%) Number Share (%) Number Share (%)Less 10 persons 0 0.0 0 0.0 0 0.0 9 9.310-49 persons 259 66.9 101 52.9 158 80.6 55 56.750-249 persons 100 25.8 69 36.1 31 15.8 26 26.8250-999 persons 24 6.2 17 8.9 7 3.6 7 7.21000-4999 persons 3 0.8 3 1.6 0 0.0 0 0.05000-9999 persons 1 0.3 1 0.5 0 0.0 0 0.010000 or more 0 0.0 0 0.0 0 0.0 0 0.0Hard to answer/no answer 0 0.0 0 0.0 0 0.0 0 0.0Total 387 100.0 191 100.0 196 100.0 97 100.0
8. How many organizational levels does the firm have between the CEO and the employees? (Common: Q11)
Number Share (%) Number Share (%) Number Share (%) Number Share (%)0 52 13.4 23 12.0 29 14.8 3 3.11 147 38.0 69 36.1 78 39.8 27 27.82 105 27.1 56 29.3 49 25.0 28 28.93 58 15.0 32 16.8 26 13.3 20 20.64 15 3.9 7 3.7 8 4.1 9 9.35 5 1.3 3 1.6 2 1.0 2 2.16 2 0.5 1 0.5 1 0.5 2 2.17 0 0.0 0 0.0 0 0.0 2 2.18 0 0.0 0 0.0 0 0.0 2 2.19 0 0.0 0 0.0 0 0.0 0 0.010 or more 0 0.0 0 0.0 0 0.0 2 2.1Hard to answer/no answer 3 0.8 0 0.0 3 1.5 0 0.0Total 387 100.0 191 100.0 196 100.0 97 100.0
Hungary Slovakia(A) All firms (B) Manufacturing firms (C) Service firms (D) Service firms
Hungary Slovakia(A) All firms (B) Manufacturing firms (C) Service firms (D) Service firms
162

(a) Accounting, financial services, and legal services
Number Share (%) Number Share (%)Legal services 4 6.1 12 1.9Tax consultancy 10 15.2 5 0.8Financial audit 4 6.1 6 0.9Accounting 12 18.2 9 1.4Financial consultancy 19 28.8 9 1.4Other 17 25.8 0 0.0Total 66 100.0 41 6.4
(b) Human resources management
Number Share (%) Number Share (%)Employee recruitment, manpower leasing 17 40.5 9 20.0HR consulting 5 11.9 13 28.9Training and education 14 33.3 19 42.2Payroll 4 9.5 4 8.9Other 2 4.8 0 0.0Total 42 100.0 45 100.0
(c) Architectural and engineering activities, consulting
Number Share (%) Number Share (%)Architectural activities 9 11.8 11 52.4Engineering activities and related technical 28 36.8 7 33.3Technical testing and analysis 25 32.9 3 14.3Research and development 12 15.8 0 0.0Other 2 2.6 0 0.0Total 76 100.0 21 100.0
Hungary Slovakia(A) Service firms (B) Service firms
Slovakia(A) Service firms (B) Service firms
9. What services does the company provide for its clients in the following fields? (Multiple answer) (HS: Q12, SS: Q12)
Hungary Slovakia(A) Service firms (B) Service firms
Hungary
163

(d) IT activities
Number Share (%) Number Share (%)Sales, implementation of IT systems and related 19 17.6 17 3.3Operating IT systems 18 16.7 11 2.1Software development 22 20.4 8 1.5Data entry and processing 18 16.7 8 1.5Web-hosting and/or web-development 10 9.3 7 1.4Web portals, content provision 10 9.3 0 0.0Other 11 10.2 0 0.0Total 108 100.0 51 9.9
(e) Advertising, marketing, customer service
Number Share (%) Number Share (%)Advertising, marketing services 9 32.1 11 45.8Market research 5 17.9 8 33.3Management consultancy activities 5 17.9 2 8.3Costumer service, operating call-centre 8 28.6 3 12.5Other 1 3.6 0 0.0Total 28 100.0 24 100.0
10. Market shares of the company from 2005 through 2007 (HM: Q12; HS: Q13; SS: Q13)
(a) In the domestic market
Number Share (%) Number Share (%) Number Share (%) Number Share (%)Dominantly 282 72.9 106 55.5 176 89.8 49 50.5To lesser extent 54 14.0 48 25.1 6 3.1 35 36.1No share 39 10.1 35 18.3 4 2.0 6 6.2Hard to answer/no answer 12 3.1 2 1.0 10 5.1 7 7.2Total 387 100.0 191 100.0 196 100.0 97 100.0
Slovakia(A) All firms (B) Manufacturing firms (C) Service firms (D) Service firms
(B) Service firms
Hungary Slovakia(A) Service firms (B) Service firms
Hungary Slovakia(A) Service firms
Hungary
164

(b) In the post-socialist new EU members states
Number Share (%) Number Share (%) Number Share (%) Number Share (%)Dominantly 39 10.1 27 14.1 12 6.1 14 14.4To lesser extent 71 18.3 55 28.8 16 8.2 28 28.9No share 253 65.4 103 53.9 150 76.5 18 18.6Hard to answer/no answer 24 6.2 6 3.1 18 9.2 37 38.1Total 387 100.0 191 100.0 196 100.0 97 100.0
(c) In EU15 countries
Number Share (%) Number Share (%) Number Share (%) Number Share (%)Dominantly 108 27.9 89 46.6 19 9.7 13 13.4To lesser extent 46 11.9 35 18.3 11 5.6 22 22.7No share 215 55.6 65 34.0 150 76.5 22 22.7Hard to answer/no answer 18 4.7 2 1.0 16 8.2 40 41.2Total 387 100.0 191 100.0 196 100.0 97 100.0
(d) In Russia, Ukraine and Kazakhstan
Number Share (%) Number Share (%) Number Share (%) Number Share (%)Dominantly 9 2.3 6 3.1 3 1.5 6 6.2To lesser extent 22 5.7 19 9.9 3 1.5 14 14.4No share 331 85.5 160 83.8 171 87.2 27 27.8Hard to answer/no answer 25 6.5 6 3.1 19 9.7 50 51.5Total 387 100.0 191 100.0 196 100.0 97 100.0
(C) Service firms (D) Service firms
Hungary Slovakia
(A) All firms (B) Manufacturing firms (C) Service firms (D) Service firms
(A) All firms (B) Manufacturing firms (C) Service firms (D) Service firms
Hungary Slovakia
Hungary Slovakia(A) All firms (B) Manufacturing firms
165

(e) In Asia
Number Share (%) Number Share (%) Number Share (%) Number Share (%)Dominantly 9 2.3 5 2.6 4 2.0 5 5.2To lesser extent 19 4.9 14 7.3 5 2.6 11 11.3No share 334 86.3 165 86.4 169 86.2 27 27.8Hard to answer/no answer 25 6.5 7 3.7 18 9.2 54 55.7Total 387 100.0 191 100.0 196 100.0 97 100.0
(f) In North America
Number Share (%) Number Share (%) Number Share (%) Number Share (%)Dominantly 12 3.1 7 3.7 5 2.6 11 11.3To lesser extent 15 3.9 12 6.3 3 1.5 7 7.2No share 332 85.8 164 85.9 168 85.7 25 25.8Hard to answer/no answer 28 7.2 8 4.2 20 10.2 54 55.7Total 387 100.0 191 100.0 196 100.0 97 100.0
(g) In other markets
Number Share (%) Number Share (%) Number Share (%) Number Share (%)Dominantly 7 1.8 6 3.1 1 0.5 4 4.1To lesser extent 13 3.4 11 5.8 2 1.0 3 3.1No share 0 0.0 0 0.0 0 0.0 17 17.5Hard to answer/no answer 367 94.8 174 91.1 193 98.5 73 75.3Total 387 100.0 191 100.0 196 100.0 97 100.0
(D) Service firmsHungary Slovakia
(A) All firms (B) Manufacturing firms
(A) All firms (B) Manufacturing firms (C) Service firms (D) Service firms
Hungary Slovakia(A) All firms (B) Manufacturing firms (C) Service firms (D) Service firms
SlovakiaHungary
(C) Service firms
166

11. Share of customers in total turnover (HM: Q13; HS: Q14; SS: Q14)
(a) Share of group companies
Number Share (%) Number Share (%) Number Share (%) Number Share (%)0% 13 3.4 6 3.1 7 3.6 68 70.11-10% 16 4.1 7 3.7 9 4.6 12 12.411-20% 7 1.8 2 1.0 5 2.6 3 3.121-30% 3 0.8 0 0.0 3 1.5 0 0.031-40% 5 1.3 3 1.6 2 1.0 0 0.041-50% 2 0.5 1 0.5 1 0.5 0 0.051-60% 2 0.5 2 1.0 0 0.0 4 4.161-70% 2 0.5 2 1.0 0 0.0 3 3.171-80% 2 0.5 2 1.0 0 0.0 3 3.181-90% 3 0.8 1 0.5 2 1.0 2 2.191-100% 13 3.4 12 6.3 1 0.5 2 2.1Hard to answer/no answer 319 82.4 153 80.1 166 84.7 0 0.0Total 387 100.0 191 100.0 196 100.0 97 100.0
(b) Share of non-group companies
Number Share (%) Number Share (%) Number Share (%) Number Share (%)0% 12 3.1 11 5.8 1 0.5 49 50.51-10% 5 1.3 3 1.6 2 1.0 3 3.111-20% 2 0.5 2 1.0 0 0.0 2 2.121-30% 1 0.3 1 0.5 0 0.0 4 4.131-40% 2 0.5 2 1.0 0 0.0 4 4.141-50% 3 0.8 2 1.0 1 0.5 0 0.051-60% 5 1.3 3 1.6 2 1.0 0 0.061-70% 3 0.8 0 0.0 3 1.5 0 0.071-80% 5 1.3 1 0.5 4 2.0 2 2.181-90% 12 3.1 5 2.6 7 3.6 7 7.291-100% 24 6.2 8 4.2 16 8.2 26 26.8Hard to answer/no answer 313 80.9 153 80.1 160 81.6 0 0.0Total 387 100.0 191 100.0 196 100.0 97 100.0
(A) All firms (B) Manufacturing firms (C) Service firms (D) Service firmsHungary Slovakia
Hungary Slovakia(A) All firms (B) Manufacturing firms (C) Service firms (D) Service firms
167

12. Number of customers (HM: Q14; HS: Q15; HS: Q15)
Number Share (%) Number Share (%) Number Share (%) Number Share (%)One customer 12 3.1 10 5.2 2 1.0 3 3.1More customers 363 93.8 179 93.7 184 93.9 94 96.9Hard to answer/no answer 12 3.1 2 1.0 10 5.1 0 0.0Total 387 100.0 191 100.0 196 100.0 97 100.0
13. Scale of services provided by the firm (HS: Q16, SS: Q16)
Number Share (%) Number Share (%)One-two services in one business field 51 26.0 24 24.7More services in one business field 85 43.4 46 47.4One-two services in more business fields 16 8.2 2 2.1More services in more business fields 40 20.4 26 26.8Hard to answer/no answer 4 2.0 0 0.0Total 196 100.0 98 101.0
Slovakia(A) All firms (B) Manufacturing firms (C) Service firms (D) Service firms
Hungary Slovakia(A) Service firms (B) Service firms
Hungary
168

14. Share of different type of services in total turnover (%) (HS: Q17, SS: Q17)
(a) Tailor-made solutions (e.g. IT: software development or HR: carrier planning)
Number Share (%) Number Share (%)0% 19 9.7 5 5.21-10% 6 3.1 5 5.211-20% 8 4.1 2 2.121-30% 6 3.1 2 2.131-40% 5 2.6 2 2.141-50% 11 5.6 28 28.951-60% 14 7.1 2 2.161-70% 10 5.1 3 3.171-80% 18 9.2 7 7.281-90% 20 10.2 11 11.391-100% 64 32.7 30 30.9Hard to answer/no answer 15 7.7 0 0.0Total 196 100.0 97 100.0
(b) Standardized services (e.g. . IT: packaged software or HR: payroll)
Number Share (%) Number Share (%)0% 54 27.6 22 22.71-10% 24 12.2 17 17.511-20% 16 8.2 7 7.221-30% 12 6.1 4 4.131-40% 14 7.1 2 2.141-50% 11 5.6 29 29.951-60% 5 2.6 2 2.161-70% 6 3.1 1 1.071-80% 8 4.1 2 2.181-90% 4 2.0 5 5.291-100% 24 12.2 6 6.2Hard to answer/no answer 18 9.2 0 0.0Total 196 100.0 97 100.0
Slovakia(A) Service firms (B) Service firms
Hungary
Hungary Slovakia(A) Service firms (B) Service firms
169

15. Share of the low- and high value-added services in total turnover (%) (HS: Q18, SS: Q18)
(a) Low value-added (e.g. data entry and processing)
Number Share (%) Number Share (%)0% 55 28.1 29 29.91-10% 28 14.3 12 12.411-20% 18 9.2 10 10.321-30% 9 4.6 8 8.231-40% 8 4.1 2 2.141-50% 9 4.6 22 22.751-60% 5 2.6 2 2.161-70% 10 5.1 3 3.171-80% 3 1.5 2 2.181-90% 4 2.0 2 2.191-100% 16 8.2 5 5.2Hard to answer/no answer 31 15.8 0 0.0Total 196 100.0 97 100.0
(b) High value-added (e.g. software development or consultancy)
Number Share (%) Number Share (%)0% 19 9.7 3 3.11-10% 4 2.0 4 4.111-20% 3 1.5 2 2.121-30% 10 5.1 3 3.131-40% 5 2.6 2 2.141-50% 9 4.6 22 22.751-60% 8 4.1 1 1.061-70% 9 4.6 8 8.271-80% 17 8.7 8 8.281-90% 22 11.2 7 7.291-100% 59 30.1 37 38.1Hard to answer/no answer 31 15.8 0 0.0Total 196 100.0 97 100.0
Slovakia(A) Service firms (B) Service firms
Hungary Slovakia(A) Service firms (B) Service firms
Hungary
170

16. Rate of change of products (HM: Q15)
Number Share (%)Non-changing 30 30.9Slowly changing 116 119.6Fast changing 45 46.4Hard to answer/no answer 0 0.0Total 191 196.9
17. Share of different type of products in total turnover (%) (HM: Q16)
(a) Share of individual product
Number Share (%)0% 71 37.21-10% 27 14.111-20% 8 4.221-30% 11 5.831-40% 3 1.641-50% 13 6.851-60% 2 1.061-70% 4 2.171-80% 5 2.681-90% 5 2.691-100% 35 18.3Hard to answer/no answer 7 3.7Total 191 100.0
HungaryManufacturing firms
HungaryManufacturing firms
171

(b) Share of mass product
Number Share (%)0% 27 14.11-10% 7 3.711-20% 6 3.121-30% 4 2.131-40% 2 1.041-50% 13 6.851-60% 3 1.661-70% 8 4.271-80% 9 4.781-90% 14 7.391-100% 89 46.6Hard to answer/no answer 9 4.7Total 191 100.0
18. Level of technology used by the firm compared to the period before 2005 (HM: Q17)
Number Share (%)Same 66 34.6Improved 108 56.5Completely new 14 7.3Hard to answer/no answer 3 1.6Total 191 100.0
HungaryManufacturing firms
HungaryManufacturing firms
172

19. Level of technology used by the firm compared to its competitors (HM: Q18)
Number Share (%)Older than the technology used by thecompetitors 7 3.7Similar to the technology used by thecompetitors 117 61.3More developed than the technology used bythe competitors 42 22.0
Internationally ‘leading edge’ technology 24 12.6
Hard to answer/no answer 1 0.5Total 191 100.0
HungaryManufacturing firms
173

Section II. Relations between Foreign and Local Managers
1. Do foreign managers work at your firm? (Common: Q19)
Number Share (%) Number Share (%) Number Share (%) Number Share (%)Yes 45 11.6 31 16.2 14 7.1 24 24.7No 342 88.4 160 83.8 182 92.9 73 75.3Hard to answer/no answer 0 0.0 0 0.0 0 0.0 0 0.0Total 387 100.0 191 100.0 196 100.0 97 100.0
2. Total number of managers (Common: Q20)
(a) In 2003
Number Share (%) Number Share (%) Number Share (%) Number Share (%)1-10 persons 33 8.5 22 11.5 11 5.6 10 10.311-20 persons 3 0.8 3 1.6 0 0.0 2 2.121-30 persons 1 0.3 1 0.5 0 0.0 4 4.131-40 persons 0 0.0 0 0.0 0 0.0 2 2.141-50 persons 0 0.0 0 0.0 0 0.0 0 0.051-60 persons 0 0.0 0 0.0 0 0.0 0 0.061-70 persons 0 0.0 0 0.0 0 0.0 0 0.071-80 persons 1 0.3 1 0.5 0 0.0 0 0.081-90 persons 0 0.0 0 0.0 0 0.0 0 0.091-100 persons 1 0.3 1 0.5 0 0.0 0 0.0100 or more 0 0.0 0 0.0 0 0.0 1 1.0Hard to answer/no answer 348 89.9 163 85.3 185 94.4 78 80.4Total 387 100.0 191 100.0 196 100.0 97 100.0
Hungary Slovakia(A) All firms (B) Manufacturing firms (C) Service firms (D) Service firms
Hungary Slovakia(A) All firms (B) Manufacturing firms (C) Service firms (D) Service firms
174

(b) In 2007
Number Share (%) Number Share (%) Number Share (%) Number Share (%)1-10 persons 36 9.3 23 12.0 13 6.6 9 9.311-20 persons 3 0.8 3 1.6 0 0.0 4 4.121-30 persons 1 0.3 1 0.5 0 0.0 2 2.131-40 persons 0 0.0 0 0.0 0 0.0 1 1.041-50 persons 0 0.0 0 0.0 0 0.0 2 2.151-60 persons 0 0.0 0 0.0 0 0.0 3 3.161-70 persons 0 0.0 0 0.0 0 0.0 0 0.071-80 persons 0 0.0 0 0.0 0 0.0 0 0.081-90 persons 1 0.3 1 0.5 0 0.0 0 0.091-100 persons 1 0.3 1 0.5 0 0.0 0 0.0100 or more 0 0.0 0 0.0 0 0.0 3 3.1Hard to answer/no answer 345 89.1 162 84.8 183 93.4 73 75.3Total 387 100.0 191 100.0 196 100.0 97 100.0
3. Percentage of foreigners in entire managers (Common: Q20)
(a) In 2003
Number Share (%) Number Share (%) Number Share (%) Number Share (%)1-10% 3 0.8 3 1.6 0 0.0 3 3.111-20% 1 0.3 1 0.5 0 0.0 2 2.121-30% 4 1.0 3 1.6 1 0.5 0 0.031-40% 5 1.3 2 1.0 3 1.5 4 4.141-50% 10 2.6 6 3.1 4 2.0 1 1.051-60% 1 0.3 1 0.5 0 0.0 1 1.061-70% 2 0.5 1 0.5 1 0.5 3 3.171-80% 0 0.0 0 0.0 0 0.0 2 2.181-90% 0 0.0 0 0.0 0 0.0 0 0.090-100% 6 1.6 5 2.6 1 0.5 1 1.0Hard to answer/no answer 355 91.7 169 88.5 186 94.9 5 5.2Total 387 100.0 191 100.0 196 100.0 22 22.7
Hungary Slovakia(A) All firms (B) Manufacturing firms (C) Service firms (D) Service firms
Hungary Slovakia(A) All firms (B) Manufacturing firms (C) Service firms (D) Service firms
175

(b) In 2007
Number Share (%) Number Share (%) Number Share (%) Number Share (%)1-10% 5 1.3 5 2.6 0 0.0 5 5.211-20% 4 1.0 3 1.6 1 0.5 3 3.121-30% 2 0.5 1 0.5 1 0.5 4 4.131-40% 9 2.3 5 2.6 4 2.0 5 5.241-50% 12 3.1 10 5.2 2 1.0 2 2.151-60% 0 0.0 0 0.0 0 0.0 1 1.061-70% 4 1.0 1 0.5 3 1.5 2 2.171-80% 0 0.0 0 0.0 0 0.0 0 0.081-90% 0 0.0 0 0.0 0 0.0 0 0.090-100% 4 1.0 3 1.6 1 0.5 2 2.1Hard to answer/no answer 347 89.7 163 85.3 184 93.9 73 75.3Total 387 100.0 191 100.0 196 100.0 97 100.0
4. Number of Hungarian employees who worked at foreign subsidiaries of the company group (Common: Q22)
(a) In 2003
Number Share (%) Number Share (%) Number Share (%) Number Share (%)0 person 32 8.3 21 11.0 11 5.6 88 90.71-10 persons 1 0.3 1 0.5 0 0.0 8 8.211-20 persons 0 0.0 0 0.0 0 0.0 1 1.021-30 persons 0 0.0 0 0.0 0 0.0 0 0.031-40 persons 1 0.3 1 0.5 0 0.0 0 0.041-50 persons 0 0.0 0 0.0 0 0.0 0 0.051-60 persons 0 0.0 0 0.0 0 0.0 0 0.061-70 persons 0 0.0 0 0.0 0 0.0 0 0.071-80 persons 1 0.3 1 0.5 0 0.0 0 0.081-90 persons 0 0.0 0 0.0 0 0.0 0 0.091-100 persons 0 0.0 0 0.0 0 0.0 0 0.0100 or more 1 0.3 1 0.5 0 0.0 0 0.0Hard to answer/no answer 351 90.7 166 86.9 185 94.4 0 0.0Total 387 100.0 191 100.0 196 100.0 97 100.0
Hungary Slovakia(A) All firms (B) Manufacturing firms (C) Service firms (D) Service firms
(B) Manufacturing firms (C) Service firms (D) Service firmsHungary Slovakia
(A) All firms
176

(b) In 2007
Number Share (%) Number Share (%) Number Share (%) Number Share (%)0 person 31 8.0 19 9.9 12 6.1 82 84.51-10 persons 3 0.8 3 1.6 0 0.0 12 12.411-20 persons 1 0.3 1 0.5 0 0.0 2 2.121-30 persons 1 0.3 1 0.5 0 0.0 0 0.031-40 persons 0 0.0 0 0.0 0 0.0 1 1.041-50 persons 0 0.0 0 0.0 0 0.0 0 0.051-60 persons 1 0.3 1 0.5 0 0.0 0 0.061-70 persons 0 0.0 0 0.0 0 0.0 0 0.071-80 persons 0 0.0 0 0.0 0 0.0 0 0.081-90 persons 0 0.0 0 0.0 0 0.0 0 0.091-100 persons 0 0.0 0 0.0 0 0.0 0 0.0100 or more 1 0.3 1 0.5 0 0.0 0 0.0Hard to answer/no answer 349 90.2 165 86.4 184 93.9 0 0.0Total 387 100.0 191 100.0 196 100.0 97 100.0
5. Nationality of the managing director (Common: Q23)
Number Share (%) Number Share (%) Number Share (%) Number Share (%)Native 16 4.1 10 5.2 6 3.1 63 64.9Foreigner 28 7.2 20 10.5 8 4.1 28 28.9Hard to answer/no answer 343 88.6 161 84.3 182 92.9 6 6.2Total 387 100.0 191 100.0 196 100.0 97 100.0
(A) All firms (B) Manufacturing firms (C) Service firms (D) Service firms
Hungary Slovakia(A) All firms (B) Manufacturing firms (C) Service firms (D) Service firms
Hungary Slovakia177

6. Who is responsible for the following business functions? (Common: Q24)
(a) Finance and accounting
Number Share (%) Number Share (%) Number Share (%) Number Share (%)Foreign manager 4 1.0 1 0.5 3 1.5 24 24.7Local manager 39 10.1 29 15.2 10 5.1 22 22.7Hard to answer/no answer 344 88.9 161 84.3 183 93.4 51 52.6Total 387 100.0 191 100.0 196 100.0 97 100.0
(b) Human resources management
Number Share (%) Number Share (%) Number Share (%) Number Share (%)Foreign manager 8 2.1 4 2.1 4 2.0 11 11.3Local manager 33 8.5 24 12.6 9 4.6 35 36.1Hard to answer/no answer 346 89.4 163 85.3 183 93.4 51 52.6Total 387 100.0 191 100.0 196 100.0 97 100.0
(c) Production
Number Share (%) Number Share (%) Number Share (%) Number Share (%)Foreign manager 8 2.1 6 3.1 2 1.0 19 19.6Local manager 29 7.5 20 10.5 9 4.6 27 27.8Hard to answer/no answer 350 90.4 165 86.4 185 94.4 51 52.6Total 387 100.0 191 100.0 196 100.0 97 100.0
(d) Quality control
Number Share (%) Number Share (%) Number Share (%) Number Share (%)Foreign manager 8 2.1 4 2.1 4 2.0 20 20.6Local manager 32 8.3 24 12.6 8 4.1 26 26.8Hard to answer/no answer 347 89.7 163 85.3 184 93.9 51 52.6Total 387 100.0 191 100.0 196 100.0 97 100.0
Hungary Slovakia(A) All firms (B) Manufacturing firms (C) Service firms (D) Service firms
Hungary Slovakia(A) All firms (B) Manufacturing firms (C) Service firms (D) Service firms
Hungary Slovakia(A) All firms (B) Manufacturing firms (C) Service firms (D) Service firms
Hungary Slovakia(A) All firms (B) Manufacturing firms (C) Service firms (D) Service firms
178

(e) Sales and marketing
Number Share (%) Number Share (%) Number Share (%) Number Share (%)Foreign manager 13 3.4 10 5.2 3 1.5 14 14.4Local manager 26 6.7 16 8.4 10 5.1 32 33.0Hard to answer/no answer 348 89.9 165 86.4 183 93.4 51 52.6Total 387 100.0 191 100.0 196 100.0 97 100.0
(f) Customer service
Number Share (%) Number Share (%) Number Share (%) Number Share (%)Foreign manager 5 1.3 4 2.1 1 0.5 16 16.5Local manager 29 7.5 18 9.4 11 5.6 30 30.9Hard to answer/no answer 353 91.2 169 88.5 184 93.9 51 52.6Total 387 100.0 191 100.0 196 100.0 97 100.0
(g) IT
Number Share (%) Number Share (%) Number Share (%) Number Share (%)Foreign manager 8 2.1 7 3.7 1 0.5 18 18.6Local manager 32 8.3 21 11.0 11 5.6 28 28.9Hard to answer/no answer 347 89.7 163 85.3 184 93.9 51 52.6Total 387 100.0 191 100.0 196 100.0 97 100.0
(h) Research and development
Number Share (%) Number Share (%) Number Share (%) Number Share (%)Foreign manager 14 3.6 11 5.8 3 1.5 16 16.5Local manager 19 4.9 11 5.8 8 4.1 30 30.9Hard to answer/no answer 354 91.5 169 88.5 185 94.4 51 52.6Total 387 100.0 191 100.0 196 100.0 97 100.0
Hungary Slovakia(A) All firms (B) Manufacturing firms (C) Service firms (D) Service firms
Hungary Slovakia(A) All firms (B) Manufacturing firms (C) Service firms (D) Service firms
Hungary Slovakia(A) All firms (B) Manufacturing firms (C) Service firms (D) Service firms
Hungary Slovakia(A) All firms (B) Manufacturing firms (C) Service firms (D) Service firms
179

7. To what extent do the local managers participate in managing the business processes? (Common: Q25)
Number Share (%) Number Share (%) Number Share (%) Number Share (%)
Implement the standards of the parent firm 7 1.8 4 2.1 3 1.5 15 15.5
Implement the standards of the parent firm butactively take part in the further development ofthese standards
7 1.8 4 2.1 3 1.5 23 23.7
Adapt the standards of the parent firmaccording to the local needs 17 4.4 9 4.7 8 4.1 24 24.7
Create its business processes independentlywhile following the parent company’s policies 26 6.7 14 7.3 12 6.1 26 26.8
Create its business processes independentlyfrom the parent company’s policy 2 0.5 0 0.0 2 1.0 9 9.3
Implement the standards of the customers (e.g.outsourcing of business processes) 5 1.3 2 1.0 3 1.5 8 8.2
Hard to answer/no answer 323 83.5 158 82.7 165 84.2 0 0.0
Total 387 100.0 191 100.0 196 100.0 105 108.2
Hungary Slovakia(A) All firms (B) Manufacturing firms (C) Service firms (D) Service firms
180

8. How do you evaluate the similarities and differences between the HRM practices of your firm and those of the parent company? (Common: Q26)
Number Share (%) Number Share (%) Number Share (%) Number Share (%)My firm implements the HRM system of theparent company. 4 1.0 2 1.0 2 1.0 6 6.2My firm implements the HRM system of theparent firm with slight adaptation to the local 13 3.4 4 2.1 9 4.6 17 17.5My firm creates an autonomous HRM systemthat corresponds to the local needs while 26 6.7 15 7.9 11 5.6 23 23.7My firm creates an autonomous HRM systemusing only the local requirements. 20 5.2 11 5.8 9 4.6 5 5.2
Hard to answer/no answer 324 83.7 159 83.2 165 84.2 46 47.4Total 387 100.0 191 100.0 196 100.0 97 100.0
9. Does your firm have a Board of Directors or a Supervisory Board? (Common: Q27)
Number Share (%) Number Share (%) Number Share (%) Number Share (%)Only board of directors 38 9.8 20 10.5 18 9.2 8 8.2Both board of directors and supervisory board 44 11.4 26 13.6 18 9.2 14 14.4None of them 302 78.0 144 75.4 158 80.6 73 75.3Hard to answer/no answer 3 0.8 1 0.5 2 1.0 2 2.1Total 387 100.0 191 100.0 196 100.0 97 100.0
Hungary Slovakia(A) All firms (B) Manufacturing firms (C) Service firms (D) Service firms
Hungary Slovakia(A) All firms (B) Manufacturing firms (C) Service firms (D) Service firms
181

10. Composition of the supervisory board (Common: Q28)
(a) Chairman of the supervisory board
Number Share (%) Number Share (%) Number Share (%) Number Share (%)Foreigner 13 3.4 11 5.8 2 1.0 6 6.2Native 26 6.7 10 5.2 16 8.2 8 8.2Hard to answer/no answer 350 90.4 170 89.0 180 91.8 83 85.6Total 389 100.5 191 100.0 198 101.0 97 100.0
(b) Number of foreign supervisory board members
Number Share (%) Number Share (%) Number Share (%) Number Share (%)0 25 6.5 8 4.2 17 8.7 6 6.21 3 0.8 2 1.0 1 0.5 2 2.12 2 0.5 2 1.0 0 0.0 3 3.13 3 0.8 3 1.6 0 0.0 0 0.04 1 0.3 1 0.5 0 0.0 0 0.05 1 0.3 1 0.5 0 0.0 0 0.06 0 0.0 0 0.0 0 0.0 0 0.07 0 0.0 0 0.0 0 0.0 0 0.08 1 0.3 1 0.5 0 0.0 0 0.09 0 0.0 0 0.0 0 0.0 1 1.010 or more 1 0.3 1 0.5 0 0.0 2 2.1Hard to answer/no answer 350 90.4 172 90.1 178 90.8 83 85.6Total 387 100.0 191 100.0 196 100.0 97 100.0
Hungary Slovakia(A) All firms (B) Manufacturing firms (C) Service firms (D) Service firms
Hungary Slovakia(A) All firms (B) Manufacturing firms (C) Service firms (D) Service firms
182

(c) Number of foreign external members
Number Share (%) Number Share (%) Number Share (%) Number Share (%)0 33 8.5 16 8.4 17 8.7 11 11.31 2 0.5 1 0.5 1 0.5 0 0.02 0 0.0 0 0.0 0 0.0 1 1.03 1 0.3 1 0.5 0 0.0 0 0.04 0 0.0 0 0.0 0 0.0 0 0.05 0 0.0 0 0.0 0 0.0 1 1.06 0 0.0 0 0.0 0 0.0 0 0.07 0 0.0 0 0.0 0 0.0 0 0.08 0 0.0 0 0.0 0 0.0 0 0.09 0 0.0 0 0.0 0 0.0 1 1.010 or more 0 0.0 0 0.0 0 0.0 0 0.0Hard to answer/no answer 351 90.7 173 90.6 178 90.8 83 85.6Total 387 100.0 191 100.0 196 100.0 97 100.0
(d) Number of foreign independent directors
Number Share (%) Number Share (%) Number Share (%) Number Share (%)0 35 9.0 17 8.9 18 9.2 12 12.41 1 0.3 1 0.5 0 0.0 0 0.02 0 0.0 0 0.0 0 0.0 0 0.03 0 0.0 0 0.0 0 0.0 1 1.04 0 0.0 0 0.0 0 0.0 0 0.05 0 0.0 0 0.0 0 0.0 0 0.06 0 0.0 0 0.0 0 0.0 0 0.07 0 0.0 0 0.0 0 0.0 0 0.08 0 0.0 0 0.0 0 0.0 0 0.09 0 0.0 0 0.0 0 0.0 1 1.010 or more 0 0.0 0 0.0 0 0.0 0 0.0Hard to answer/no answer 351 90.7 173 90.6 178 90.8 83 85.6Total 387 100.0 191 100.0 196 100.0 97 100.0
(D) Service firms
Hungary Slovakia(A) All firms (B) Manufacturing firms (C) Service firms (D) Service firms
Hungary Slovakia(A) All firms (B) Manufacturing firms (C) Service firms
183

11. Composition of the board of directors (Common: Q29)
(a) Chairman of the board of directors
Number Share (%) Number Share (%) Number Share (%) Number Share (%)Foreigner 14 3.6 13 6.8 1 0.5 0 0.0Native 53 13.7 22 11.5 31 15.8 22 22.7Hard to answer/no answer 320 82.7 156 81.7 164 83.7 75 77.3Total 387 100.0 191 100.0 196 100.0 97 100.0
(b) Number of foreign board members
Number Share (%) Number Share (%) Number Share (%) Number Share (%)0 53 13.7 21 11.0 32 16.3 11 11.31 4 1.0 3 1.6 1 0.5 3 3.12 4 1.0 3 1.6 1 0.5 1 1.03 1 0.3 0 0.0 1 0.5 2 2.14 3 0.8 2 1.0 1 0.5 1 1.05 0 0.0 0 0.0 0 0.0 2 2.16 0 0.0 0 0.0 0 0.0 0 0.07 0 0.0 0 0.0 0 0.0 0 0.08 0 0.0 0 0.0 0 0.0 0 0.09 0 0.0 0 0.0 0 0.0 0 0.010 or more 1 0.3 1 0.5 0 0.0 2 2.1Hard to answer/no answer 321 82.9 161 84.3 160 81.6 75 77.3Total 387 100.0 191 100.0 196 100.0 97 100.0
Hungary Slovakia(A) All firms (B) Manufacturing firms (C) Service firms (D) Service firms
Hungary Slovakia(A) All firms (B) Manufacturing firms (C) Service firms (D) Service firms
184

(c) Number of foreign external members
Number Share (%) Number Share (%) Number Share (%) Number Share (%)0 63 16.3 29 15.2 34 17.3 18 18.61 1 0.3 1 0.5 0 0.0 0 0.02 1 0.3 0 0.0 1 0.5 2 2.13 1 0.3 0 0.0 1 0.5 2 2.14 0 0.0 0 0.0 0 0.0 0 0.05 0 0.0 0 0.0 0 0.0 0 0.06 0 0.0 0 0.0 0 0.0 0 0.07 0 0.0 0 0.0 0 0.0 0 0.08 0 0.0 0 0.0 0 0.0 0 0.09 0 0.0 0 0.0 0 0.0 0 0.010 or more 0 0.0 0 0.0 0 0.0 0 0.0Hard to answer/no answer 321 82.9 161 84.3 160 81.6 75 77.3Total 387 100.0 191 100.0 196 100.0 97 100.0
(d) Number of foreign independent directors
Number Share (%) Number Share (%) Number Share (%) Number Share (%)0 65 16.8 29 15.2 36 18.4 20 20.61 1 0.3 1 0.5 0 0.0 1 1.02 0 0.0 0 0.0 0 0.0 0 0.03 0 0.0 0 0.0 0 0.0 0 0.04 0 0.0 0 0.0 0 0.0 0 0.05 0 0.0 0 0.0 0 0.0 0 0.06 0 0.0 0 0.0 0 0.0 0 0.07 0 0.0 0 0.0 0 0.0 0 0.08 0 0.0 0 0.0 0 0.0 1 1.09 0 0.0 0 0.0 0 0.0 0 0.010 or more 0 0.0 0 0.0 0 0.0 0 0.0Hard to answer/no answer 321 82.9 161 84.3 160 81.6 75 77.3Total 387 100.0 191 100.0 196 100.0 97 100.0
(A) All firms (B) Manufacturing firms (C) Service firms (D) Service firms
Hungary Slovakia(A) All firms (B) Manufacturing firms (C) Service firms (D) Service firms
Hungary Slovakia185

Section III. Organizational Innovations within the Company
1. From 2005 through 2007, did your firm introduce the following innovative systems? (Common: Q30)
Number Share (%) Number Share (%) Number Share (%) Number Share (%)Yes 100 25.8 50 26.2 50 25.5 43 44.3No 287 74.2 141 73.8 146 74.5 54 55.7Hard to answer/no answer 0 0.0 0 0.0 0 0.0 0 0.0Total 387 100.0 191 100.0 196 100.0 97 100.0
Number Share (%) Number Share (%) Number Share (%) Number Share (%)Yes 67 17.3 33 17.3 34 17.3 32 33.0No 320 82.7 158 82.7 162 82.7 65 67.0Hard to answer/no answer 0 0.0 0 0.0 0 0.0 0 0.0Total 387 100.0 191 100.0 196 100.0 97 100.0
Number Share (%) Number Share (%) Number Share (%) Number Share (%)Yes 159 41.1 81 42.4 78 39.8 39 40.2No 228 58.9 110 57.6 118 60.2 58 59.8Hard to answer/no answer 0 0.0 0 0.0 0 0.0 0 0.0Total 387 100.0 191 100.0 196 100.0 97 100.0
(c) New methods of workplace organization for distributing responsibilities and decision-making (i.e., first use of a new system of employeeresponsibilities, teamwork, decentralization, and integration or de-integration of departments)
Hungary Slovakia(A) All firms (B) Manufacturing firms (C) Service firms (D) Service firms
(a) New business practices for organizing work or procedures (i.e., supply chain management, business re-engineering, lean production, qualitymanagement, education/training systems)
(b) New knowledge management systems to better use or exchange information, knowledge, and skills within your enterprise or to collect andinterpret information from outside your enterprise
Hungary Slovakia(A) All firms (B) Manufacturing firms (C) Service firms (D) Service firms
Hungary Slovakia(A) All firms (B) Manufacturing firms (C) Service firms (D) Service firms
186

Number Share (%) Number Share (%) Number Share (%) Number Share (%)Yes 111 28.7 53 27.7 58 29.6 29 29.9No 276 71.3 138 72.3 138 70.4 68 70.1Hard to answer/no answer 0 0.0 0 0.0 0 0.0 0 0.0Total 387 100.0 191 100.0 196 100.0 97 100.0
2. Does your firm make use of some of the following methods of organizing work (Common: Q31)
(a) Job rotation
Number Share (%) Number Share (%) Number Share (%) Number Share (%)Yes 70 18.1 52 27.2 18 9.2 28 28.9No 317 81.9 139 72.8 178 90.8 69 71.1Hard to answer/no answer 0 0.0 0 0.0 0 0.0 0 0.0Total 387 100.0 191 100.0 196 100.0 97 100.0
(b) Teamwork
Number Share (%) Number Share (%) Number Share (%) Number Share (%)Yes 168 43.4 84 44.0 84 42.9 84 86.6No 219 56.6 107 56.0 112 57.1 13 13.4Hard to answer/no answer 0 0.0 0 0.0 0 0.0 0 0.0Total 387 100.0 191 100.0 196 100.0 97 100.0
(c) Systems for collection of employee proposals
Number Share (%) Number Share (%) Number Share (%) Number Share (%)Yes 184 47.5 86 45.0 98 50.0 40 41.2No 203 52.5 105 55.0 98 50.0 57 58.8Hard to answer/no answer 0 0.0 0 0.0 0 0.0 0 0.0Total 387 100.0 191 100.0 196 100.0 97 100.0
Hungary Slovakia(A) All firms (B) Manufacturing firms (C) Service firms (D) Service firms
Hungary Slovakia(A) All firms (B) Manufacturing firms (C) Service firms (D) Service firms
Hungary Slovakia(A) All firms (B) Manufacturing firms (C) Service firms (D) Service firms
(d) New methods of organizing external relations with other firms or public institutions (i.e., alliances, partnerships, outsourcing, or sub-Hungary Slovakia
(A) All firms (B) Manufacturing firms (C) Service firms (D) Service firms
187

(d) Quality circles/groups
Number Share (%) Number Share (%) Number Share (%) Number Share (%)Yes 131 33.9 86 45.0 45 23.0 14 14.4No 256 66.1 105 55.0 151 77.0 83 85.6Hard to answer/no answer 0 0.0 0 0.0 0 0.0 0 0.0Total 387 100.0 191 100.0 196 100.0 97 100.0
(e) Cross-occupational working groups
Number Share (%) Number Share (%) Number Share (%) Number Share (%)Yes 70 18.1 41 21.5 29 14.8 35 36.1No 317 81.9 150 78.5 167 85.2 62 63.9Hard to answer/no answer 0 0.0 0 0.0 0 0.0 0 0.0Total 387 100.0 191 100.0 196 100.0 97 100.0
(f) Project-based work
Number Share (%) Number Share (%) Number Share (%) Number Share (%)Yes 114 29.5 43 22.5 71 36.2 67 69.1No 273 70.5 148 77.5 125 63.8 30 30.9Hard to answer/no answer 0 0.0 0 0.0 0 0.0 0 0.0Total 387 100.0 191 100.0 196 100.0 97 100.0
(g) Benchmarking
Number Share (%) Number Share (%) Number Share (%) Number Share (%)Yes 125 32.3 54 28.3 71 36.2 21 21.6No 262 67.7 137 71.7 125 63.8 76 78.4Hard to answer/no answer 0 0.0 0 0.0 0 0.0 0 0.0Total 387 100.0 191 100.0 196 100.0 97 100.0
Hungary Slovakia(A) All firms (B) Manufacturing firms (C) Service firms (D) Service firms
Hungary Slovakia(A) All firms (B) Manufacturing firms (C) Service firms (D) Service firms
Hungary Slovakia(A) All firms (B) Manufacturing firms (C) Service firms (D) Service firms
Hungary Slovakia(A) All firms (B) Manufacturing firms (C) Service firms (D) Service firms
188

(h) Flat organization
Number Share (%) Number Share (%) Number Share (%) Number Share (%)Yes 32 8.3 15 7.9 17 8.7 13 13.4No 355 91.7 176 92.1 179 91.3 84 86.6Hard to answer/no answer 0 0.0 0 0.0 0 0.0 0 0.0Total 387 100.0 191 100.0 196 100.0 97 100.0
(i) Quality Control System (e.g. ISO, TQM)
Number Share (%) Number Share (%) Number Share (%) Number Share (%)Yes 146 37.7 100 52.4 46 23.5 32 33.0No 241 62.3 91 47.6 150 76.5 65 67.0Hard to answer/no answer 0 0.0 0 0.0 0 0.0 0 0.0Total 387 100.0 191 100.0 196 100.0 97 100.0
Number Share (%)Teleworking from home, once a week 13 5.9Teleworking from home, many times a week 37 16.9Mobil work 38 17.4Part-time work 57 26.0Flexible working time 74 33.8Hard to answer/no answer 0 0.0Total 219 100.0
3. Does your firm make use of the following flexible work and working time systems? (Multiple answer) (SS: Q32)
SlovakiaService firms
Hungary Slovakia(A) All firms (B) Manufacturing firms (C) Service firms (D) Service firms
Hungary Slovakia(A) All firms (B) Manufacturing firms (C) Service firms (D) Service firms
189

Number Share (%)Teleworking from home, once a week 8 7.4Teleworking from home, many times a week 21 19.4Mobil work 17 15.7Part-time work 30 27.8Flexible working time 32 29.6Hard to answer/no answer 0 0.0Total 108 100.0
(a) Introduction of organizational innovations before 2005; no need for further changes
Number Share (%) Number Share (%) Number Share (%) Number Share (%)1 (Not important at all) 103 26.6 55 28.8 48 24.5 10 10.32 12 3.1 9 4.7 3 1.5 3 3.13 41 10.6 30 15.7 11 5.6 8 8.24 34 8.8 13 6.8 21 10.7 5 5.25 (Very important) 113 29.2 47 24.6 66 33.7 7 7.2Hard to answer/no answer 83 21.4 36 18.8 47 24.0 64 66.0Total 386 99.7 190 99.5 196 100.0 97 100.0
SlovakiaService firms
4. Is your firm planning to introduce the following flexible work and working time systems in the near future? (Multiple answer) (SS: Q33)
5. If your firm did not introduce organizational innovations from 2005 through 2007, how important were the following factors? (5-point scaleevaluation) (HM: Q32; HS: Q32, SS: Q34)
Hungary Slovakia(A) All firms (B) Manufacturing firms (C) Service firms (D) Service firms
190

(b) Lack of funds to implement organizational innovations
Number Share (%) Number Share (%) Number Share (%) Number Share (%)1 (Not important at all) 215 55.6 99 51.8 116 59.2 17 17.52 23 5.9 15 7.9 8 4.1 5 5.23 29 7.5 19 9.9 10 5.1 5 5.24 17 4.4 12 6.3 5 2.6 4 4.15 (Very important) 15 3.9 8 4.2 7 3.6 2 2.1Hard to answer/no answer 88 22.7 38 19.9 50 25.5 64 66.0Total 387 100.0 191 100.0 196 100.0 97 100.0
(c) Lack of knowledge or qualified staff
Number Share (%) Number Share (%) Number Share (%) Number Share (%)1 (Not important at all) 222 57.4 103 53.9 119 60.7 16 16.52 21 5.4 15 7.9 6 3.1 5 5.23 27 7.0 15 7.9 12 6.1 8 8.24 14 3.6 10 5.2 4 2.0 2 2.15 (Very important) 14 3.6 10 5.2 4 2.0 4 4.1Hard to answer/no answer 89 23.0 38 19.9 51 26.0 62 63.9Total 387 100.0 191 100.0 196 100.0 97 100.0
(d) Employees or management resistant to organizational change
Number Share (%) Number Share (%) Number Share (%) Number Share (%)1 (Not important at all) 243 62.8 119 62.3 124 63.3 16 16.52 18 4.7 13 6.8 5 2.6 9 9.33 17 4.4 10 5.2 7 3.6 1 1.04 12 3.1 6 3.1 6 3.1 5 5.25 (Very important) 8 2.1 5 2.6 3 1.5 2 2.1Hard to answer/no answer 89 23.0 38 19.9 51 26.0 64 66.0Total 387 100.0 191 100.0 196 100.0 97 100.0
Hungary Slovakia(A) All firms (B) Manufacturing firms (C) Service firms (D) Service firms
Hungary Slovakia(A) All firms (B) Manufacturing firms (C) Service firms (D) Service firms
Hungary Slovakia(A) All firms (B) Manufacturing firms (C) Service firms (D) Service firms
191

(e) No need for organizational innovation from 2005 through 2007
Number Share (%) Number Share (%) Number Share (%) Number Share (%)1 (Not important at all) 114 29.5 49 25.7 65 33.2 9 9.32 9 2.3 7 3.7 2 1.0 5 5.23 42 10.9 29 15.2 13 6.6 6 6.24 36 9.3 19 9.9 17 8.7 2 2.15 (Very important) 97 25.1 50 26.2 47 24.0 8 8.2Hard to answer/no answer 89 23.0 37 19.4 52 26.5 67 69.1Total 387 100.0 191 100.0 196 100.0 97 100.0
(a) Division of the tasks
Number Share (%) Number Share (%) Number Share (%) Number Share (%)Yes 113 29.2 57 29.8 56 28.6 53 54.6No 53 13.7 25 13.1 28 14.3 31 32.0Hard to answer/no answer 221 57.1 109 57.1 112 57.1 13 13.4Total 387 100.0 191 100.0 196 100.0 97 100.0
(b) Selection of the team leader
Number Share (%) Number Share (%) Number Share (%) Number Share (%)Yes 45 11.6 26 13.6 19 9.7 10 10.3No 118 30.5 53 27.7 65 33.2 72 74.2Hard to answer/no answer 224 57.9 112 58.6 112 57.1 15 15.5Total 387 100.0 191 100.0 196 100.0 97 100.0
]Hungary Slovakia
(A) All firms (B) Manufacturing firms (C) Service firms (D) Service firms
6. If your firm practices teamwork, do the team members decide themselves about the following subjects? (HM: Q33; HS: Q33, SS: Q35)
Hungary Slovakia(A) All firms (B) Manufacturing firms (C) Service firms (D) Service firms
Hungary Slovakia(A) All firms (B) Manufacturing firms (C) Service firms (D) Service firms
192

(a) Improvement of the effectiveness of daily work
Number Share (%) Number Share (%) Number Share (%) Number Share (%)1 (Not important at all) 14 3.6 4 2.1 10 5.1 11 11.32 3 0.8 1 0.5 2 1.0 4 4.13 24 6.2 9 4.7 15 7.7 17 17.54 84 21.7 45 23.6 39 19.9 21 21.65 (Very important) 228 58.9 122 63.9 106 54.1 44 45.4Hard to answer/no answer 34 8.8 10 5.2 24 12.2 0 0.0Total 387 100.0 191 100.0 196 100.0 97 100.0
(b) Strengthening of the cooperation and coordination within the organization
Number Share (%) Number Share (%) Number Share (%) Number Share (%)1 (Not important at all) 25 6.5 8 4.2 17 8.7 18 18.62 9 2.3 4 2.1 5 2.6 4 4.13 40 10.3 14 7.3 26 13.3 23 23.74 100 25.8 56 29.3 44 22.4 32 33.05 (Very important) 179 46.3 99 51.8 80 40.8 20 20.6Hard to answer/no answer 34 8.8 10 5.2 24 12.2 0 0.0Total 387 100.0 191 100.0 196 100.0 97 100.0
(c) Adapting to environmental changes
Number Share (%) Number Share (%) Number Share (%) Number Share (%)1 (Not important at all) 19 4.9 5 2.6 14 7.1 14 14.42 19 4.9 9 4.7 10 5.1 5 5.23 41 10.6 19 9.9 22 11.2 17 17.54 101 26.1 58 30.4 43 21.9 31 32.05 (Very important) 173 44.7 90 47.1 83 42.3 30 30.9Hard to answer/no answer 34 8.8 10 5.2 24 12.2 0 0.0Total 387 100.0 191 100.0 196 100.0 97 100.0
Hungary Slovakia(A) All firms (B) Manufacturing firms (C) Service firms (D) Service firms
Hungary Slovakia(A) All firms (B) Manufacturing firms (C) Service firms (D) Service firms
7. How important are the following factors to initiate organizational chages in your firm? (5-point scale evaluation) (HM: Q34; HS: Q34, SS: Q36)
Hungary Slovakia(A) All firms (B) Manufacturing firms (C) Service firms (D) Service firms
193
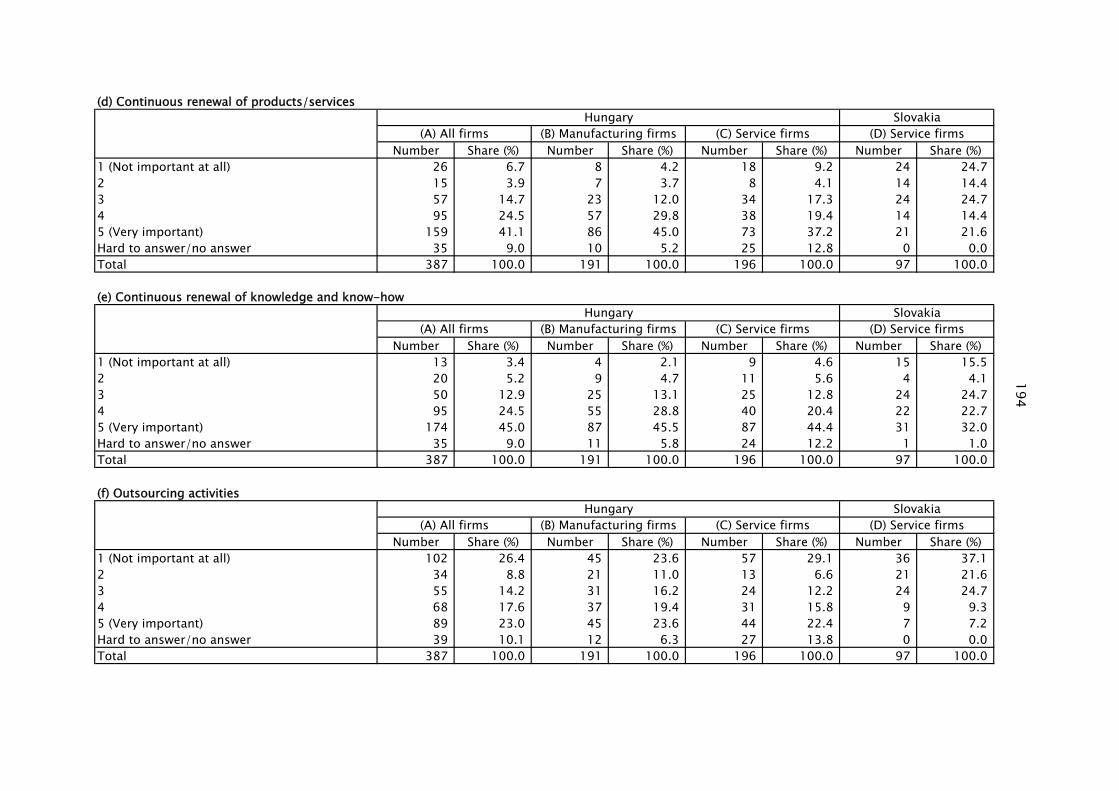
(d) Continuous renewal of products/services
Number Share (%) Number Share (%) Number Share (%) Number Share (%)1 (Not important at all) 26 6.7 8 4.2 18 9.2 24 24.72 15 3.9 7 3.7 8 4.1 14 14.43 57 14.7 23 12.0 34 17.3 24 24.74 95 24.5 57 29.8 38 19.4 14 14.45 (Very important) 159 41.1 86 45.0 73 37.2 21 21.6Hard to answer/no answer 35 9.0 10 5.2 25 12.8 0 0.0Total 387 100.0 191 100.0 196 100.0 97 100.0
(e) Continuous renewal of knowledge and know-how
Number Share (%) Number Share (%) Number Share (%) Number Share (%)1 (Not important at all) 13 3.4 4 2.1 9 4.6 15 15.52 20 5.2 9 4.7 11 5.6 4 4.13 50 12.9 25 13.1 25 12.8 24 24.74 95 24.5 55 28.8 40 20.4 22 22.75 (Very important) 174 45.0 87 45.5 87 44.4 31 32.0Hard to answer/no answer 35 9.0 11 5.8 24 12.2 1 1.0Total 387 100.0 191 100.0 196 100.0 97 100.0
(f) Outsourcing activities
Number Share (%) Number Share (%) Number Share (%) Number Share (%)1 (Not important at all) 102 26.4 45 23.6 57 29.1 36 37.12 34 8.8 21 11.0 13 6.6 21 21.63 55 14.2 31 16.2 24 12.2 24 24.74 68 17.6 37 19.4 31 15.8 9 9.35 (Very important) 89 23.0 45 23.6 44 22.4 7 7.2Hard to answer/no answer 39 10.1 12 6.3 27 13.8 0 0.0Total 387 100.0 191 100.0 196 100.0 97 100.0
Hungary Slovakia(A) All firms (B) Manufacturing firms (C) Service firms (D) Service firms
Hungary Slovakia(A) All firms (B) Manufacturing firms (C) Service firms (D) Service firms
Hungary Slovakia(A) All firms (B) Manufacturing firms (C) Service firms (D) Service firms
194

(g) Improvement of the quality and customer service
Number Share (%) Number Share (%) Number Share (%) Number Share (%)1 (Not important at all) 23 5.9 5 2.6 18 9.2 11 11.32 6 1.6 2 1.0 4 2.0 4 4.13 34 8.8 17 8.9 17 8.7 12 12.44 103 26.6 57 29.8 46 23.5 27 27.85 (Very important) 185 47.8 100 52.4 85 43.4 41 42.3Hard to answer/no answer 36 9.3 10 5.2 26 13.3 2 2.1Total 387 100.0 191 100.0 196 100.0 97 100.0
(h) Increase of the firm size
Number Share (%) Number Share (%) Number Share (%) Number Share (%)1 (Not important at all) 53 13.7 23 12.0 30 15.3 21 21.62 35 9.0 21 11.0 14 7.1 11 11.33 85 22.0 44 23.0 41 20.9 29 29.94 80 20.7 47 24.6 33 16.8 18 18.65 (Very important) 96 24.8 44 23.0 52 26.5 18 18.6Hard to answer/no answer 38 9.8 12 6.3 26 13.3 0 0.0Total 387 100.0 191 100.0 196 100.0 97 100.0
Hungary Slovakia(A) All firms (B) Manufacturing firms (C) Service firms (D) Service firms
Hungary Slovakia(A) All firms (B) Manufacturing firms (C) Service firms (D) Service firms
195

(a) Competition with other subsidiaries of the company group, which your firm belongs to
Number Share (%) Number Share (%) Number Share (%) Number Share (%)1 (No competition at all) 36 9.3 21 11.0 15 7.7 32 33.02 17 4.4 5 2.6 12 6.1 10 10.33 11 2.8 7 3.7 4 2.0 5 5.24 17 4.4 13 6.8 4 2.0 1 1.05 (Very intensive) 6 1.6 5 2.6 1 0.5 1 1.0Hard to answer/no answer 300 77.5 140 73.3 160 81.6 48 49.5Total 387 100.0 191 100.0 196 100.0 97 100.0
(b) Competition with companies except for firms belonging to your company group
Number Share (%) Number Share (%) Number Share (%) Number Share (%)1 (No competition at all) 19 4.9 11 5.8 8 4.1 2 2.12 4 1.0 3 1.6 1 0.5 6 6.23 42 10.9 18 9.4 24 12.2 33 34.04 115 29.7 50 26.2 65 33.2 17 17.55 (Very intensive) 126 32.6 58 30.4 68 34.7 39 40.2Hard to answer/no answer 81 20.9 51 26.7 30 15.3 0 0.0Total 387 100.0 191 100.0 196 100.0 97 100.0
Hungary Slovakia(A) All firms (B) Manufacturing firms (C) Service firms (D) Service firms
8. Intensity of competition with other subsidiaries of the company group and other competitors in the market (5-point scale evaluation) (HM: Q35;HS: Q35, SS: Q37)
Hungary Slovakia(A) All firms (B) Manufacturing firms (C) Service firms (D) Service firms
196

(a) Prices
Number Share (%) Number Share (%) Number Share (%) Number Share (%)1 (Not important at all) 16 4.1 3 1.6 13 6.6 11 11.32 11 2.8 4 2.1 7 3.6 4 4.13 34 8.8 13 6.8 21 10.7 22 22.74 69 17.8 40 20.9 29 14.8 27 27.85 (Very important) 247 63.8 129 67.5 118 60.2 33 34.0Hard to answer/no answer 10 2.6 2 1.0 8 4.1 0 0.0Total 387 100.0 191 100.0 196 100.0 97 100.0
(b) Customer orientation
Number Share (%) Number Share (%) Number Share (%) Number Share (%)1 (Not important at all) 18 4.7 1 0.5 17 8.7 8 8.22 7 1.8 4 2.1 3 1.5 3 3.13 26 6.7 13 6.8 13 6.6 7 7.24 81 20.9 42 22.0 39 19.9 24 24.75 (Very important) 245 63.3 128 67.0 117 59.7 55 56.7Hard to answer/no answer 10 2.6 3 1.6 7 3.6 0 0.0Total 387 100.0 191 100.0 196 100.0 97 100.0
(c) Quality
Number Share (%) Number Share (%) Number Share (%) Number Share (%)1 (Not important at all) 11 2.8 1 0.5 10 5.1 9 9.32 2 0.5 0 0.0 2 1.0 1 1.03 8 2.1 1 0.5 7 3.6 8 8.24 50 12.9 22 11.5 28 14.3 25 25.85 (Very important) 306 79.1 165 86.4 141 71.9 54 55.7Hard to answer/no answer 10 2.6 2 1.0 8 4.1 0 0.0Total 387 100.0 191 100.0 196 100.0 97 100.0
Hungary Slovakia(A) All firms (B) Manufacturing firms (C) Service firms (D) Service firms
Hungary Slovakia(A) All firms (B) Manufacturing firms (C) Service firms (D) Service firms
9. In comparison with your competitors, how important are the following factors that influence the performance of your firm? (5-point scaleevaluation) (HM: Q36; HS: Q36, SS: Q38)
Hungary Slovakia(A) All firms (B) Manufacturing firms (C) Service firms (D) Service firms
197

(d) Respecting deadlines and flexibility
Number Share (%) Number Share (%) Number Share (%) Number Share (%)1 (Not important at all) 12 3.1 1 0.5 11 5.6 6 6.22 1 0.3 0 0.0 1 0.5 4 4.13 12 3.1 2 1.0 10 5.1 11 11.34 70 18.1 37 19.4 33 16.8 24 24.75 (Very important) 282 72.9 148 77.5 134 68.4 52 53.6Hard to answer/no answer 10 2.6 3 1.6 7 3.6 0 0.0Total 387 100.0 191 100.0 196 100.0 97 100.0
(e) Versatility of products/services
Number Share (%) Number Share (%) Number Share (%) Number Share (%)1 (Not important at all) 28 7.2 8 4.2 20 10.2 24 24.72 17 4.4 5 2.6 12 6.1 18 18.63 49 12.7 24 12.6 25 12.8 26 26.84 104 26.9 65 34.0 39 19.9 19 19.65 (Very important) 178 46.0 87 45.5 91 46.4 10 10.3Hard to answer/no answer 11 2.8 2 1.0 9 4.6 0 0.0Total 387 100.0 191 100.0 196 100.0 97 100.0
(f) Image and brand of the firm
Number Share (%) Number Share (%) Number Share (%) Number Share (%)1 (Not important at all) 45 11.6 17 8.9 28 14.3 8 8.22 15 3.9 9 4.7 6 3.1 7 7.23 76 19.6 41 21.5 35 17.9 24 24.74 90 23.3 47 24.6 43 21.9 29 29.95 (Very important) 151 39.0 75 39.3 76 38.8 29 29.9Hard to answer/no answer 10 2.6 2 1.0 8 4.1 0 0.0Total 387 100.0 191 100.0 196 100.0 97 100.0
Hungary Slovakia(A) All firms (B) Manufacturing firms (C) Service firms (D) Service firms
Hungary Slovakia(A) All firms (B) Manufacturing firms (C) Service firms (D) Service firms
Hungary Slovakia(A) All firms (B) Manufacturing firms (C) Service firms (D) Service firms
198

(g) Continuous product/service development
Number Share (%) Number Share (%) Number Share (%) Number Share (%)1 (Not important at all) 26 6.7 5 2.6 21 10.7 9 9.32 16 4.1 8 4.2 8 4.1 13 13.43 47 12.1 22 11.5 25 12.8 20 20.64 104 26.9 63 33.0 41 20.9 26 26.85 (Very important) 184 47.5 91 47.6 93 47.4 29 29.9Hard to answer/no answer 10 2.6 2 1.0 8 4.1 0 0.0Total 387 100.0 191 100.0 196 100.0 97 100.0
(h) Skilled labor
Number Share (%) Number Share (%) Number Share (%) Number Share (%)1 (Not important at all) 13 3.4 4 2.1 9 4.6 8 8.22 9 2.3 4 2.1 5 2.6 3 3.13 29 7.5 19 9.9 10 5.1 11 11.34 83 21.4 51 26.7 32 16.3 29 29.95 (Very important) 243 62.8 111 58.1 132 67.3 46 47.4Hard to answer/no answer 10 2.6 2 1.0 8 4.1 0 0.0Total 387 100.0 191 100.0 196 100.0 97 100.0
(i) Experiences
Number Share (%) Number Share (%) Number Share (%) Number Share (%)1 (Not important at all) 11 2.8 2 1.0 9 4.6 7 7.22 1 0.3 0 0.0 1 0.5 4 4.13 19 4.9 8 4.2 11 5.6 11 11.34 91 23.5 51 26.7 40 20.4 26 26.85 (Very important) 256 66.1 128 67.0 128 65.3 49 50.5Hard to answer/no answer 9 2.3 2 1.0 7 3.6 0 0.0Total 387 100.0 191 100.0 196 100.0 97 100.0
Hungary Slovakia(A) All firms (B) Manufacturing firms (C) Service firms (D) Service firms
Hungary Slovakia(A) All firms (B) Manufacturing firms (C) Service firms (D) Service firms
Hungary Slovakia(A) All firms (B) Manufacturing firms (C) Service firms (D) Service firms
199

(j) Reliability
Number Share (%) Number Share (%) Number Share (%) Number Share (%)1 (Not important at all) 8 2.1 1 0.5 7 3.6 8 8.22 1 0.3 0 0.0 1 0.5 3 3.13 8 2.1 3 1.6 5 2.6 8 8.24 59 15.2 34 17.8 25 12.8 15 15.55 (Very important) 302 78.0 151 79.1 151 77.0 63 64.9Hard to answer/no answer 9 2.3 2 1.0 7 3.6 0 0.0Total 387 100.0 191 100.0 196 100.0 97 100.0
(k) Lobbying
Number Share (%) Number Share (%) Number Share (%) Number Share (%)1 (Not important at all) 97 25.1 47 24.6 50 25.5 60 61.92 26 6.7 13 6.8 13 6.6 6 6.23 35 9.0 24 12.6 11 5.6 15 15.54 68 17.6 45 23.6 23 11.7 8 8.25 (Very important) 75 19.4 35 18.3 40 20.4 8 8.2Hard to answer/no answer 86 22.2 27 14.1 59 30.1 0 0.0Total 387 100.0 191 100.0 196 100.0 97 100.0
Hungary Slovakia(A) All firms (B) Manufacturing firms (C) Service firms (D) Service firms
Hungary Slovakia(A) All firms (B) Manufacturing firms (C) Service firms (D) Service firms
200
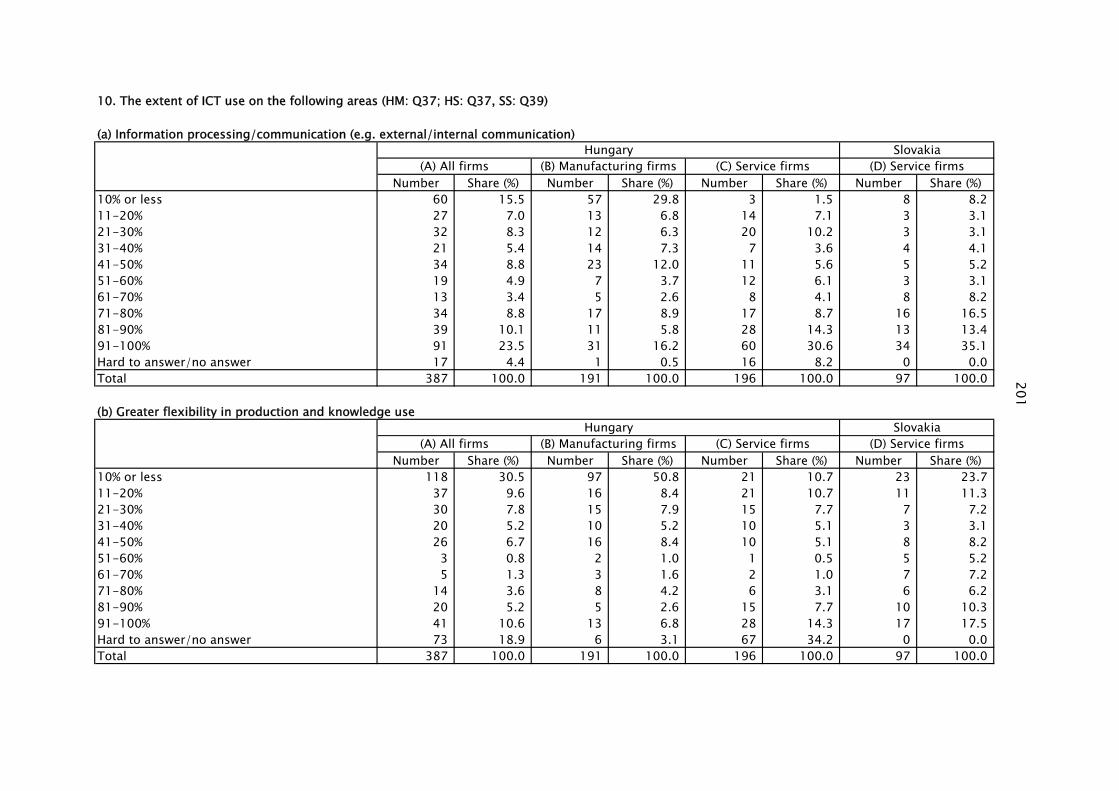
10. The extent of ICT use on the following areas (HM: Q37; HS: Q37, SS: Q39)
(a) Information processing/communication (e.g. external/internal communication)
Number Share (%) Number Share (%) Number Share (%) Number Share (%)10% or less 60 15.5 57 29.8 3 1.5 8 8.211-20% 27 7.0 13 6.8 14 7.1 3 3.121-30% 32 8.3 12 6.3 20 10.2 3 3.131-40% 21 5.4 14 7.3 7 3.6 4 4.141-50% 34 8.8 23 12.0 11 5.6 5 5.251-60% 19 4.9 7 3.7 12 6.1 3 3.161-70% 13 3.4 5 2.6 8 4.1 8 8.271-80% 34 8.8 17 8.9 17 8.7 16 16.581-90% 39 10.1 11 5.8 28 14.3 13 13.491-100% 91 23.5 31 16.2 60 30.6 34 35.1Hard to answer/no answer 17 4.4 1 0.5 16 8.2 0 0.0Total 387 100.0 191 100.0 196 100.0 97 100.0
(b) Greater flexibility in production and knowledge use
Number Share (%) Number Share (%) Number Share (%) Number Share (%)10% or less 118 30.5 97 50.8 21 10.7 23 23.711-20% 37 9.6 16 8.4 21 10.7 11 11.321-30% 30 7.8 15 7.9 15 7.7 7 7.231-40% 20 5.2 10 5.2 10 5.1 3 3.141-50% 26 6.7 16 8.4 10 5.1 8 8.251-60% 3 0.8 2 1.0 1 0.5 5 5.261-70% 5 1.3 3 1.6 2 1.0 7 7.271-80% 14 3.6 8 4.2 6 3.1 6 6.281-90% 20 5.2 5 2.6 15 7.7 10 10.391-100% 41 10.6 13 6.8 28 14.3 17 17.5Hard to answer/no answer 73 18.9 6 3.1 67 34.2 0 0.0Total 387 100.0 191 100.0 196 100.0 97 100.0
Hungary Slovakia(A) All firms (B) Manufacturing firms (C) Service firms (D) Service firms
Hungary Slovakia(A) All firms (B) Manufacturing firms (C) Service firms (D) Service firms
201

(c) Continuous development of products/services
Number Share (%) Number Share (%) Number Share (%) Number Share (%)10% or less 130 33.6 111 58.1 19 9.7 31 32.011-20% 27 7.0 20 10.5 7 3.6 7 7.221-30% 27 7.0 10 5.2 17 8.7 8 8.231-40% 28 7.2 5 2.6 23 11.7 3 3.141-50% 36 9.3 13 6.8 23 11.7 6 6.251-60% 12 3.1 6 3.1 6 3.1 3 3.161-70% 10 2.6 3 1.6 7 3.6 4 4.171-80% 19 4.9 9 4.7 10 5.1 9 9.381-90% 15 3.9 0 0.0 15 7.7 6 6.291-100% 37 9.6 6 3.1 31 15.8 20 20.6Hard to answer/no answer 46 11.9 8 4.2 38 19.4 0 0.0Total 387 100.0 191 100.0 196 100.0 97 100.0
Hungary Slovakia(A) All firms (B) Manufacturing firms (C) Service firms (D) Service firms
202

Section IV. Work Organization and Knowledge Use
(a) Professional-technical knowledge
Number Share (%) Number Share (%) Number Share (%) Number Share (%)1 (Not important at all) 3 0.8 0 0.0 3 1.5 4 4.12 3 0.8 2 1.0 1 0.5 1 1.03 12 3.1 5 2.6 7 3.6 7 7.24 64 16.5 39 20.4 25 12.8 20 20.65 (Very important) 303 78.3 145 75.9 158 80.6 65 67.0Hard to answer/no answer 2 0.5 0 0.0 2 1.0 0 0.0Total 387 100.0 191 100.0 196 100.0 97 100.0
(b) Experience and competence
Number Share (%) Number Share (%) Number Share (%) Number Share (%)1 (Not important at all) 7 1.8 0 0.0 7 3.6 5 5.22 5 1.3 0 0.0 5 2.6 2 2.13 32 8.3 6 3.1 26 13.3 7 7.24 105 27.1 46 24.1 59 30.1 32 33.05 (Very important) 236 61.0 139 72.8 97 49.5 51 52.6Hard to answer/no answer 2 0.5 0 0.0 2 1.0 0 0.0Total 387 100.0 191 100.0 196 100.0 97 100.0
1. Which characteristics of human resources are important for the improvement of the firm’s performance? (5-point scale evaluation) (HM: Q38; HS:Q38, SS: Q40)
Hungary(A) All firms (B) Manufacturing firms (C) Service firms (D) Service firms
Slovakia
Hungary Slovakia(A) All firms (B) Manufacturing firms (C) Service firms (D) Service firms
203

(c) Managerial-organizational skill
Number Share (%) Number Share (%) Number Share (%) Number Share (%)1 (Not important at all) 27 7.0 15 7.9 12 6.1 3 3.12 26 6.7 14 7.3 12 6.1 1 1.03 81 20.9 33 17.3 48 24.5 19 19.64 107 27.6 52 27.2 55 28.1 29 29.95 (Very important) 141 36.4 76 39.8 65 33.2 45 46.4Hard to answer/no answer 5 1.3 1 0.5 4 2.0 0 0.0Total 387 100.0 191 100.0 196 100.0 97 100.0
(d) Customer orientation
Number Share (%) Number Share (%) Number Share (%) Number Share (%)1 (Not important at all) 9 2.3 4 2.1 5 2.6 6 6.22 6 1.6 2 1.0 4 2.0 1 1.03 25 6.5 16 8.4 9 4.6 10 10.34 91 23.5 57 29.8 34 17.3 18 18.65 (Very important) 252 65.1 112 58.6 140 71.4 62 63.9Hard to answer/no answer 4 1.0 0 0.0 4 2.0 0 0.0Total 387 100.0 191 100.0 196 100.0 97 100.0
(e) Creativity, innovative skills
Number Share (%) Number Share (%) Number Share (%) Number Share (%)1 (Not important at all) 12 3.1 3 1.6 9 4.6 6 6.22 9 2.3 5 2.6 4 2.0 5 5.23 51 13.2 29 15.2 22 11.2 21 21.64 120 31.0 69 36.1 51 26.0 29 29.95 (Very important) 193 49.9 85 44.5 108 55.1 36 37.1Hard to answer/no answer 2 0.5 0 0.0 2 1.0 0 0.0Total 387 100.0 191 100.0 196 100.0 97 100.0
Hungary Slovakia(A) All firms (B) Manufacturing firms (C) Service firms (D) Service firms
Hungary Slovakia(A) All firms (B) Manufacturing firms (C) Service firms (D) Service firms
Hungary Slovakia(A) All firms (B) Manufacturing firms (C) Service firms (D) Service firms
204

(f) Ability to cooperate
Number Share (%) Number Share (%) Number Share (%) Number Share (%)1 (Not important at all) 7 1.8 0 0.0 7 3.6 7 7.22 2 0.5 1 0.5 1 0.5 1 1.03 29 7.5 15 7.9 14 7.1 15 15.54 87 22.5 43 22.5 44 22.4 34 35.15 (Very important) 259 66.9 132 69.1 127 64.8 40 41.2Hard to answer/no answer 3 0.8 0 0.0 3 1.5 0 0.0Total 387 100.0 191 100.0 196 100.0 97 100.0
(g) Language skills
Number Share (%) Number Share (%) Number Share (%) Number Share (%)1 (Not important at all) 37 9.6 14 7.3 23 11.7 8 8.22 44 11.4 26 13.6 18 9.2 9 9.33 103 26.6 70 36.6 33 16.8 34 35.14 90 23.3 47 24.6 43 21.9 19 19.65 (Very important) 110 28.4 33 17.3 77 39.3 27 27.8Hard to answer/no answer 3 0.8 1 0.5 2 1.0 0 0.0Total 387 100.0 191 100.0 196 100.0 97 100.0
(h) Problem-solving ability
Number Share (%) Number Share (%) Number Share (%) Number Share (%)1 (Not important at all) 7 1.8 0 0.0 7 3.6 6 6.22 2 0.5 1 0.5 1 0.5 1 1.03 27 7.0 18 9.4 9 4.6 10 10.34 81 20.9 41 21.5 40 20.4 38 39.25 (Very important) 268 69.3 131 68.6 137 69.9 41 42.3Hard to answer/no answer 2 0.5 0 0.0 2 1.0 1 1.0Total 387 100.0 191 100.0 196 100.0 97 100.0
Hungary Slovakia(A) All firms (B) Manufacturing firms (C) Service firms (D) Service firms
Hungary Slovakia(A) All firms (B) Manufacturing firms (C) Service firms (D) Service firms
Hungary Slovakia(A) All firms (B) Manufacturing firms (C) Service firms (D) Service firms
205

(i) General IT skills
Number Share (%) Number Share (%) Number Share (%) Number Share (%)1 (Not important at all) 19 4.9 7 3.7 12 6.1 8 8.22 36 9.3 26 13.6 10 5.1 6 6.23 94 24.3 65 34.0 29 14.8 37 38.14 126 32.6 65 34.0 61 31.1 28 28.95 (Very important) 107 27.6 25 13.1 82 41.8 18 18.6Hard to answer/no answer 5 1.3 3 1.6 2 1.0 0 0.0Total 387 100.0 191 100.0 196 100.0 97 100.0
(j) Communications skills
Number Share (%) Number Share (%) Number Share (%) Number Share (%)1 (Not important at all) 10 2.6 4 2.1 6 3.1 5 5.22 6 1.6 6 3.1 0 0.0 2 2.13 55 14.2 40 20.9 15 7.7 17 17.54 115 29.7 70 36.6 45 23.0 30 30.95 (Very important) 199 51.4 71 37.2 128 65.3 43 44.3Hard to answer/no answer 2 0.5 0 0.0 2 1.0 0 0.0Total 387 100.0 191 100.0 196 100.0 97 100.0
(k) Punctuality and reliability
Number Share (%) Number Share (%) Number Share (%) Number Share (%)1 (Not important at all) 3 0.8 0 0.0 3 1.5 7 7.22 1 0.3 1 0.5 0 0.0 0 0.03 4 1.0 2 1.0 2 1.0 3 3.14 49 12.7 24 12.6 25 12.8 19 19.65 (Very important) 326 84.2 164 85.9 162 82.7 68 70.1Hard to answer/no answer 4 1.0 0 0.0 4 2.0 0 0.0Total 387 100.0 191 100.0 196 100.0 97 100.0
Hungary Slovakia(A) All firms (B) Manufacturing firms (C) Service firms (D) Service firms
Hungary Slovakia(A) All firms (B) Manufacturing firms (C) Service firms (D) Service firms
Hungary Slovakia(A) All firms (B) Manufacturing firms (C) Service firms (D) Service firms
206

2. Share of employees with a university or college degree (HM: Q39; HS: Q39, SS: Q41)
Number Share (%) Number Share (%) Number Share (%) Number Share (%)10% or less 159 41.1 136 71.2 23 11.7 7 7.211-20% 55 14.2 34 17.8 21 10.7 2 2.121-30% 24 6.2 11 5.8 13 6.6 4 4.131-40% 19 4.9 3 1.6 16 8.2 5 5.241-50% 15 3.9 0 0.0 15 7.7 6 6.251-60% 14 3.6 0 0.0 14 7.1 7 7.261-70% 25 6.5 1 0.5 24 12.2 5 5.271-80% 19 4.9 0 0.0 19 9.7 18 18.681-90% 13 3.4 0 0.0 13 6.6 22 22.791-100% 27 7.0 0 0.0 27 13.8 21 21.6Hard to answer/no answer 17 4.4 6 3.1 11 5.6 0 0.0Total 387 100.0 191 100.0 196 100.0 97 100.0
(a) On-the-job training
Number Share (%) Number Share (%) Number Share (%) Number Share (%)1 (Not important at all) 79 20.4 40 20.9 39 19.9 13 13.42 35 9.0 21 11.0 14 7.1 11 11.33 65 16.8 33 17.3 32 16.3 19 19.64 105 27.1 50 26.2 55 28.1 21 21.65 (Very important) 100 25.8 47 24.6 53 27.0 33 34.0Hard to answer/no answer 3 0.8 0 0.0 3 1.5 0 0.0Total 387 100.0 191 100.0 196 100.0 97 100.0
3. What attention is devoted by the management to the continuous skill development of employees? (5-point scale evaluation) (HM: Q40; HS: Q42,
Hungary Slovakia(A) All firms (B) Manufacturing firms (C) Service firms (D) Service firms
Hungary Slovakia(A) All firms (B) Manufacturing firms (C) Service firms (D) Service firms
207

(b) Consultation with managers/other employees
Number Share (%) Number Share (%) Number Share (%) Number Share (%)1 (Not important at all) 51 13.2 22 11.5 29 14.8 8 8.22 24 6.2 12 6.3 12 6.1 4 4.13 62 16.0 35 18.3 27 13.8 23 23.74 133 34.4 78 40.8 55 28.1 31 32.05 (Very important) 113 29.2 43 22.5 70 35.7 31 32.0Hard to answer/no answer 4 1.0 1 0.5 3 1.5 0 0.0Total 387 100.0 191 100.0 196 100.0 97 100.0
(c) Job rotation
Number Share (%) Number Share (%) Number Share (%) Number Share (%)1 (Not important at all) 187 48.3 75 39.3 112 57.1 43 44.32 53 13.7 26 13.6 27 13.8 18 18.63 70 18.1 34 17.8 36 18.4 16 16.54 48 12.4 33 17.3 15 7.7 13 13.45 (Very important) 28 7.2 23 12.0 5 2.6 7 7.2Hard to answer/no answer 1 0.3 0 0.0 1 0.5 0 0.0Total 387 100.0 191 100.0 196 100.0 97 100.0
(d) Teamwork
Number Share (%) Number Share (%) Number Share (%) Number Share (%)1 (Not important at all) 107 27.6 43 22.5 64 32.7 14 14.42 36 9.3 16 8.4 20 10.2 5 5.23 77 19.9 46 24.1 31 15.8 13 13.44 92 23.8 50 26.2 42 21.4 29 29.95 (Very important) 74 19.1 36 18.8 38 19.4 36 37.1Hard to answer/no answer 1 0.3 0 0.0 1 0.5 0 0.0Total 387 100.0 191 100.0 196 100.0 97 100.0
Hungary Slovakia(A) All firms (B) Manufacturing firms (C) Service firms (D) Service firms
Hungary Slovakia(A) All firms (B) Manufacturing firms (C) Service firms (D) Service firms
Hungary Slovakia(A) All firms (B) Manufacturing firms (C) Service firms (D) Service firms
208

(e) Supporting cooperation between various organizational units
Number Share (%) Number Share (%) Number Share (%) Number Share (%)1 (Not important at all) 92 23.8 39 20.4 53 27.0 22 22.72 43 11.1 19 9.9 24 12.2 4 4.13 91 23.5 48 25.1 43 21.9 22 22.74 88 22.7 51 26.7 37 18.9 34 35.15 (Very important) 69 17.8 33 17.3 36 18.4 15 15.5Hard to answer/no answer 4 1.0 1 0.5 3 1.5 0 0.0Total 387 100.0 191 100.0 196 100.0 97 100.0
(f) Participation in formal trainings
Number Share (%) Number Share (%) Number Share (%) Number Share (%)1 (Not important at all) 153 39.5 85 44.5 68 34.7 20 20.62 83 21.4 45 23.6 38 19.4 17 17.53 89 23.0 42 22.0 47 24.0 22 22.74 37 9.6 16 8.4 21 10.7 17 17.55 (Very important) 23 5.9 3 1.6 20 10.2 21 21.6Hard to answer/no answer 2 0.5 0 0.0 2 1.0 0 0.0Total 387 100.0 191 100.0 196 100.0 97 100.0
(g) Training tailored to the needs of the firm (e.g., language courses, further professional training)
Number Share (%) Number Share (%) Number Share (%) Number Share (%)1 (Not important at all) 102 26.4 55 28.8 47 24.0 17 17.52 48 12.4 28 14.7 20 10.2 10 10.33 93 24.0 49 25.7 44 22.4 11 11.34 78 20.2 35 18.3 43 21.9 26 26.85 (Very important) 65 16.8 24 12.6 41 20.9 33 34.0Hard to answer/no answer 1 0.3 0 0.0 1 0.5 0 0.0Total 387 100.0 191 100.0 196 100.0 97 100.0
Hungary Slovakia(A) All firms (B) Manufacturing firms (C) Service firms (D) Service firms
Hungary Slovakia(A) All firms (B) Manufacturing firms (C) Service firms (D) Service firms
Hungary Slovakia(A) All firms (B) Manufacturing firms (C) Service firms (D) Service firms
209

(h) Visiting exhibitions and fairs
Number Share (%) Number Share (%) Number Share (%) Number Share (%)1 (Not important at all) 72 18.6 26 13.6 46 23.5 35 36.12 42 10.9 23 12.0 19 9.7 26 26.83 95 24.5 71 37.2 24 12.2 20 20.64 109 28.2 50 26.2 59 30.1 12 12.45 (Very important) 66 17.1 20 10.5 46 23.5 4 4.1Hard to answer/no answer 3 0.8 1 0.5 2 1.0 0 0.0Total 387 100.0 191 100.0 196 100.0 97 100.0
4. Ratio of employees participating in various training courses organized and financed by the firm (HM: Q41; HS: Q41, SS: Q43)
(a) Training organized and financed by the firm (e.g., language courses, further professional training)
Number Share (%) Number Share (%) Number Share (%) Number Share (%)10% or less 146 37.7 133 69.6 13 6.6 25 25.811-20% 38 9.8 17 8.9 21 10.7 9 9.321-30% 20 5.2 10 5.2 10 5.1 7 7.231-40% 9 2.3 5 2.6 4 2.0 1 1.041-50% 15 3.9 4 2.1 11 5.6 8 8.251-60% 9 2.3 3 1.6 6 3.1 1 1.061-70% 16 4.1 3 1.6 13 6.6 8 8.271-80% 15 3.9 6 3.1 9 4.6 11 11.381-90% 10 2.6 3 1.6 7 3.6 12 12.491-100% 21 5.4 3 1.6 18 9.2 15 15.5Hard to answer/no answer 88 22.7 4 2.1 84 42.9 0 0.0Total 387 100.0 191 100.0 196 100.0 97 100.0
Hungary Slovakia(A) All firms (B) Manufacturing firms (C) Service firms (D) Service firms
Hungary Slovakia(A) All firms (B) Manufacturing firms (C) Service firms (D) Service firms
210
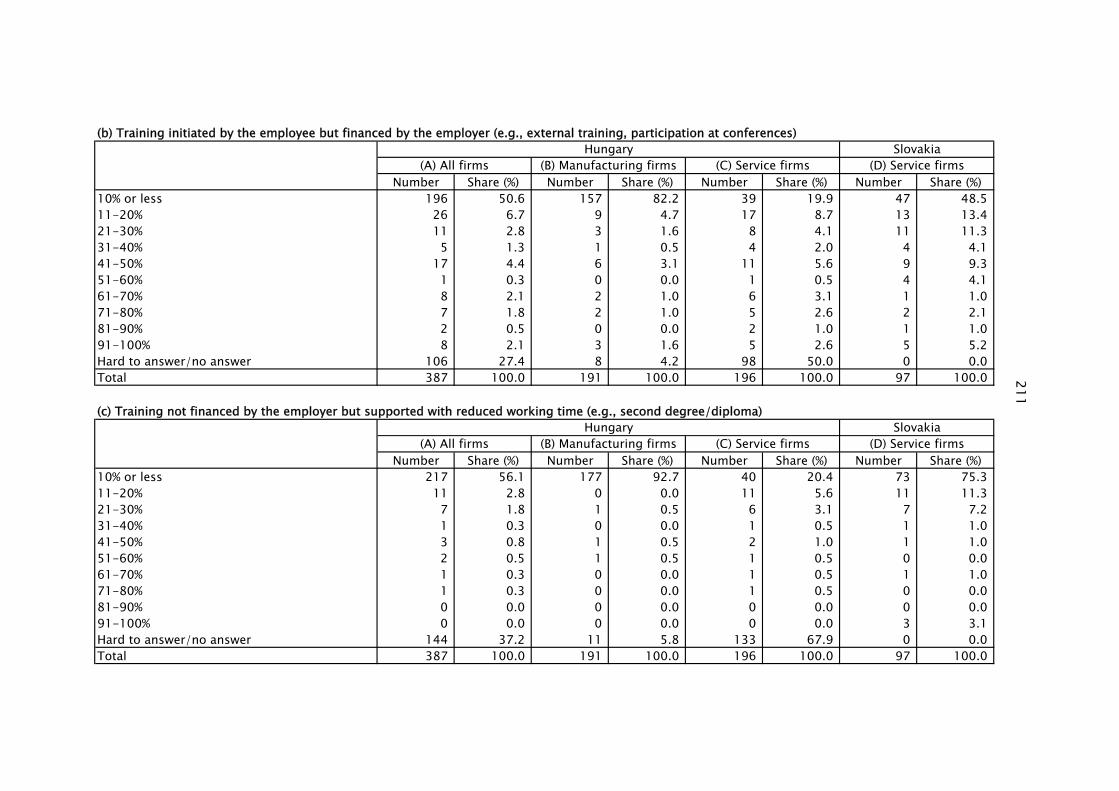
(b) Training initiated by the employee but financed by the employer (e.g., external training, participation at conferences)
Number Share (%) Number Share (%) Number Share (%) Number Share (%)10% or less 196 50.6 157 82.2 39 19.9 47 48.511-20% 26 6.7 9 4.7 17 8.7 13 13.421-30% 11 2.8 3 1.6 8 4.1 11 11.331-40% 5 1.3 1 0.5 4 2.0 4 4.141-50% 17 4.4 6 3.1 11 5.6 9 9.351-60% 1 0.3 0 0.0 1 0.5 4 4.161-70% 8 2.1 2 1.0 6 3.1 1 1.071-80% 7 1.8 2 1.0 5 2.6 2 2.181-90% 2 0.5 0 0.0 2 1.0 1 1.091-100% 8 2.1 3 1.6 5 2.6 5 5.2Hard to answer/no answer 106 27.4 8 4.2 98 50.0 0 0.0Total 387 100.0 191 100.0 196 100.0 97 100.0
(c) Training not financed by the employer but supported with reduced working time (e.g., second degree/diploma)
Number Share (%) Number Share (%) Number Share (%) Number Share (%)10% or less 217 56.1 177 92.7 40 20.4 73 75.311-20% 11 2.8 0 0.0 11 5.6 11 11.321-30% 7 1.8 1 0.5 6 3.1 7 7.231-40% 1 0.3 0 0.0 1 0.5 1 1.041-50% 3 0.8 1 0.5 2 1.0 1 1.051-60% 2 0.5 1 0.5 1 0.5 0 0.061-70% 1 0.3 0 0.0 1 0.5 1 1.071-80% 1 0.3 0 0.0 1 0.5 0 0.081-90% 0 0.0 0 0.0 0 0.0 0 0.091-100% 0 0.0 0 0.0 0 0.0 3 3.1Hard to answer/no answer 144 37.2 11 5.8 133 67.9 0 0.0Total 387 100.0 191 100.0 196 100.0 97 100.0
Hungary Slovakia(A) All firms (B) Manufacturing firms (C) Service firms (D) Service firms
Hungary Slovakia(A) All firms (B) Manufacturing firms (C) Service firms (D) Service firms
211

5. What kind of training courses are organized and financed by the employer? (HM: Q42; HS: Q42, SS: Q44)
Number Share (%) Number Share (%) Number Share (%) Number Share (%)Exclusively work-related skills (e.g. qualityassurance, professional skill development) 123 31.8 62 32.5 61 31.1 27 27.8Exclusively generic skills (e.g. language,communication skills) 16 4.1 8 4.2 8 4.1 1 1.0
Both generic and work-related skills 123 31.8 55 28.8 68 34.7 56 57.7
Hard to answer/no answer 125 32.3 66 34.6 59 30.1 13 13.4Total 387 100.0 191 100.0 196 100.0 97 100.0
6. To what extent does your firm rely on the following groups in developing organizational knowledge? (HM: Q43; HS: Q43, SS: Q45)
(a) Customers
Number Share (%) Number Share (%) Number Share (%) Number Share (%)Regulary 230 59.4 108 56.5 122 62.2 37 38.1Occasionaly 101 26.1 72 37.7 29 14.8 35 36.1Never 54 14.0 11 5.8 43 21.9 25 25.8Hard to answer/no answer 2 0.5 0 0.0 2 1.0 0 0.0Total 387 100.0 191 100.0 196 100.0 97 100.0
(b) Various suppliers (e.g. parts, services)
Number Share (%) Number Share (%) Number Share (%) Number Share (%)Regulary 121 31.3 68 35.6 53 27.0 39 40.2Occasionaly 148 38.2 79 41.4 69 35.2 39 40.2Never 115 29.7 43 22.5 72 36.7 19 19.6Hard to answer/no answer 3 0.8 1 0.5 2 1.0 0 0.0Total 387 100.0 191 100.0 196 100.0 97 100.0
Hungary Slovakia(A) All firms (B) Manufacturing firms (C) Service firms (D) Service firms
Hungary Slovakia(A) All firms (B) Manufacturing firms (C) Service firms (D) Service firms
Hungary Slovakia(A) All firms (B) Manufacturing firms (C) Service firms (D) Service firms
212

(c) Consulting firms
Number Share (%) Number Share (%) Number Share (%) Number Share (%)Regulary 25 6.5 11 5.8 14 7.1 31 32.0Occasionaly 149 38.5 62 32.5 87 44.4 54 55.7Never 210 54.3 117 61.3 93 47.4 12 12.4Hard to answer/no answer 3 0.8 1 0.5 2 1.0 0 0.0Total 387 100.0 191 100.0 196 100.0 97 100.0
(d) Higher-education institutions
Number Share (%) Number Share (%) Number Share (%) Number Share (%)Regulary 15 3.9 4 2.1 11 5.6 43 44.3Occasionaly 90 23.3 46 24.1 44 22.4 48 49.5Never 280 72.4 141 73.8 139 70.9 6 6.2Hard to answer/no answer 2 0.5 0 0.0 2 1.0 0 0.0Total 387 100.0 191 100.0 196 100.0 97 100.0
(e) Other educational training agencies
Number Share (%) Number Share (%) Number Share (%) Number Share (%)Regulary 19 4.9 6 3.1 13 6.6 33 34.0Occasionaly 103 26.6 59 30.9 44 22.4 53 54.6Never 263 68.0 126 66.0 137 69.9 11 11.3Hard to answer/no answer 2 0.5 0 0.0 2 1.0 0 0.0Total 387 100.0 191 100.0 196 100.0 97 100.0
Hungary Slovakia(A) All firms (B) Manufacturing firms (C) Service firms (D) Service firms
Hungary Slovakia(A) All firms (B) Manufacturing firms (C) Service firms (D) Service firms
Hungary Slovakia(A) All firms (B) Manufacturing firms (C) Service firms (D) Service firms
213

(f) Research institutes
Number Share (%) Number Share (%) Number Share (%) Number Share (%)Regulary 16 4.1 4 2.1 12 6.1 69 71.1Occasionaly 68 17.6 37 19.4 31 15.8 26 26.8Never 301 77.8 150 78.5 151 77.0 2 2.1Hard to answer/no answer 2 0.5 0 0.0 2 1.0 0 0.0Total 387 100.0 191 100.0 196 100.0 97 100.0
(g) Development agencies
Number Share (%) Number Share (%) Number Share (%) Number Share (%)Regulary 4 1.0 2 1.0 2 1.0 74 76.3Occasionaly 71 18.3 22 11.5 49 25.0 19 19.6Never 309 79.8 167 87.4 142 72.4 4 4.1Hard to answer/no answer 3 0.8 0 0.0 3 1.5 0 0.0Total 387 100.0 191 100.0 196 100.0 97 100.0
(i) Other professional and labor market organizations
Number Share (%) Number Share (%) Number Share (%) Number Share (%)Regulary 22 5.7 11 5.8 11 5.6 55 56.7Occasionaly 77 19.9 41 21.5 36 18.4 35 36.1Never 281 72.6 137 71.7 144 73.5 7 7.2Hard to answer/no answer 7 1.8 2 1.0 5 2.6 0 0.0Total 387 100.0 191 100.0 196 100.0 97 100.0
Hungary Slovakia(A) All firms (B) Manufacturing firms (C) Service firms (D) Service firms
Hungary Slovakia(A) All firms (B) Manufacturing firms (C) Service firms (D) Service firms
Hungary Slovakia(A) All firms (B) Manufacturing firms (C) Service firms (D) Service firms
214