Orbital Debris Shape and Orientation Effects on Impact ... · Orbital Debris Shape and Orientation...
5
Orbital Debris Shape and Orientation Effects on Impact Damage to Shuttle Tiles Joel Williamsen* Institute for Defense Analyses, Alexandria, Virginia 2231 I Taking the damage results from a previous paper as a guide, and using a tile model created for the STS-107 accident investigation, we used the SPHC hydrodynamic code to evaluate the probable worst- case impact effects of flat, rectangular, “flake-shaped,” orbital debris particles on Space Shuttle thermal tiles. We compared the damage from flakes with that produced by spheres. The flakes and spheres were sized according to a “characteristic length” (Lc) derived from radar cross-section measurements, and embodied in the NASA Standard Breakup Model (SBM). Impacts were simulated at near-normal obliquity, at 12 kdsec. We modeled the worst-case flake orientation: a corner-on impact, an orientation we term a “Face A-B” impact. Results of our simulations indicate that flake impactors are less damaging than spheres of the same Lc. Since spherical impactors have been assumed in analyses of shuttle orbital debris impact risk, we find that these risks may have been overestimated. This work represents a preliminary second step, i.e., a follow-on to [1], in developing a sensitivity analysis for the expected range of effects on damage considering spherical vs. non-spherical impactors, as recommended by the Institute for Defense Analyses (IDA) report to the Columbia Accident Investigation Board. I. Introduction The latest version of the NASA orbital debris model is ORDEM2000, which was released for use in May 2002. This model utilizes updated in-situ impact data and ground-based radar data to form an empirical model of the current orbital debris flux, with predictions for flux growth in the out-years based on the NASA EVOLVE model. The Standard Breakup Model (SBM) is the component of EVOLVE that derives an area-to-size relationship for small orbital debris particles [3] based on radar cross section (RCS) measurements from the Haystack and Goldstone stations. The debris particle “size” distribution is stated in terms of characteristic length, Lc. The SBM area-to-size relationship assumes that particles with Le below 1.66 mm are cubes, whereas particles above this size become increasingly “flake-shaped,’’ e.g., a particle with an Lc of 5.3 mm has a length-to-thickness ratio of 3. These shapes are consistent with the RCS-to-size conversion from the Haystack radar data and the mass-to-size relationships from the Spacecraft Orbital Debris Characterization Impact Test (SOCIT) fragment measurements. In contrast, most impact testing utilizes spherical projectiles (although it is possible to use other shapes), and derives damage equations from the results. We have shown in [l] that the damage inflicted on Whipple shields by flakes and spheres is different in several ways, and that the flake damage depends on the orientation of the projectile at impact. The most damaging impacts in that study were those due to corner-on impacts, an orientation we refer to as a “Face A-B” impact. In the interest of brevity of the present study, we confined our simulations to a comparison of impacts by spheres and Face A-B flakes. Aerospace Engineer, Environment Effects Branch, Mail Stop EM50, Member AIAA. Senior Analyst, Space and Air Vehicle Vulnerability Operational Evaluation Division, Member AIAA. American Institute of Aeronautics and Astronautics
Transcript of Orbital Debris Shape and Orientation Effects on Impact ... · Orbital Debris Shape and Orientation...

Orbital Debris Shape and Orientation Effects on Impact Damage to Shuttle Tiles
Joel Williamsen* Institute for Defense Analyses, Alexandria, Virginia 2231 I
Taking the damage results from a previous paper as a guide, and using a tile model created for the STS-107 accident investigation, we used the SPHC hydrodynamic code to evaluate the probable worst- case impact effects of flat, rectangular, “flake-shaped,” orbital debris particles on Space Shuttle thermal tiles. We compared the damage from flakes with that produced by spheres. The flakes and spheres were sized according to a “characteristic length” (Lc) derived from radar cross-section measurements, and embodied in the NASA Standard Breakup Model (SBM). Impacts were simulated at near-normal obliquity, at 12 kdsec. We modeled the worst-case flake orientation: a corner-on impact, an orientation we term a “Face A-B” impact. Results of our simulations indicate that flake impactors are less damaging than spheres of the same Lc. Since spherical impactors have been assumed in analyses of shuttle orbital debris impact risk, we find that these risks may have been overestimated. This work represents a preliminary second step, i.e., a follow-on to [1], in developing a sensitivity analysis for the expected range of effects on damage considering spherical vs. non-spherical impactors, as recommended by the Institute for Defense Analyses (IDA) report to the Columbia Accident Investigation Board.
I. Introduction
The latest version of the NASA orbital debris model is ORDEM2000, which was released for use in May 2002. This model utilizes updated in-situ impact data and ground-based radar data to form an empirical model of the current orbital debris flux, with predictions for flux growth in the out-years based on the NASA EVOLVE model. The Standard Breakup Model (SBM) is the component of EVOLVE that derives an area-to-size relationship for small orbital debris particles [3] based on radar cross section (RCS) measurements from the Haystack and Goldstone stations. The debris particle “size” distribution is stated in terms of characteristic length, Lc. The SBM area-to-size relationship assumes that particles with Le below 1.66 mm are cubes, whereas particles above this size become increasingly “flake-shaped,’’ e.g., a particle with an Lc of 5.3 mm has a length-to-thickness ratio of 3. These shapes are consistent with the RCS-to-size conversion from the Haystack radar data and the mass-to-size relationships from the Spacecraft Orbital Debris Characterization Impact Test (SOCIT) fragment measurements.
In contrast, most impact testing utilizes spherical projectiles (although it is possible to use other shapes), and derives damage equations from the results. We have shown in [l] that the damage inflicted on Whipple shields by flakes and spheres is different in several ways, and that the flake damage depends on the orientation of the projectile at impact. The most damaging impacts in that study were those due to corner-on impacts, an orientation we refer to as a “Face A-B” impact. In the interest of brevity of the present study, we confined our simulations to a comparison of impacts by spheres and Face A-B flakes.
Aerospace Engineer, Environment Effects Branch, Mail Stop EM50, Member AIAA. Senior Analyst, Space and Air Vehicle Vulnerability Operational Evaluation Division, Member AIAA.
American Institute of Aeronautics and Astronautics
IT. Simulation Setup
In order to examine the impact damage from our orbital debris particles, we made use of the SPHC hydrodynamic code. The runs were three-dimensional simulations, with memory reserved for up to 210,000 SPH particles. The projectiles were spheres and flakes of 2024 aluminum, and the flakes were assigned length and thickness proportions based on data f?om SBM for various input values of Lc. Figure 1 shows details of a vertical slke through the tiIe model. The bulk of the tile is LI-900, a product consisting of ‘%gidized fibrous silica” with a density of 9 lb/ft?. The outer coating of Reaction Cured Glass (RCG) can withsoand temperatures in excess of 2000 degrees F. The Strain Isolation Pad (SIP), and an underlying “skin” or wing segment are shown in the illustration. The thickness of the Aluminum 6061 skin is 0.25 in. The impact speed in all simulations was 12 km/s, and the velocity obliquity was 1.6 deg off the normal - this was done in order to break any gridding symmetries.
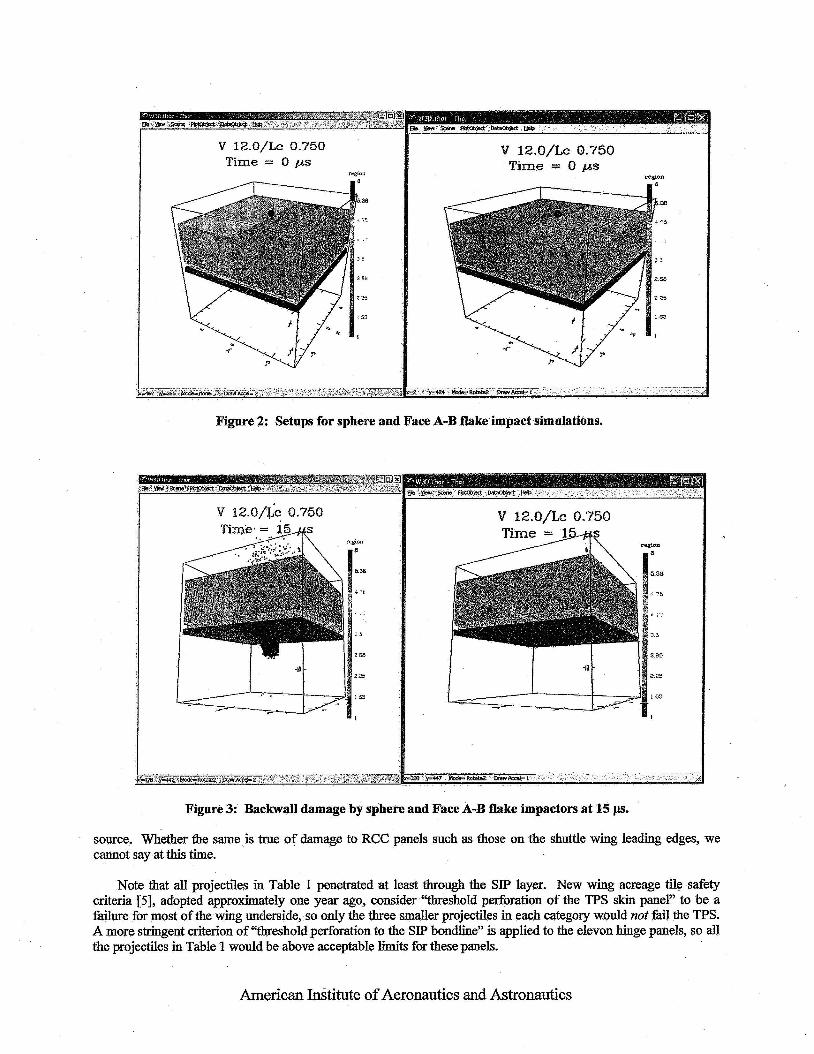
We created an algorithm to assign length and thichess proportions to our flake impactors, based on data h m SBM, for each input value of Lc. The resulting dimensions are shown in Table 1. We selected five flake orientations, separated by 45 degree increments in the rotation axes, to examine the effect of this parameter on the resulting debris clouds and damage to the backwalk. Sketches of these orientations are shown in Figure 1. Assuming each of the twenty-six I‘esulting ‘cviews’7 occurs with equal likelihood, the hquencies of each orientation w e can be derived, and are given in Figure 1. Figure 2 shows simulation setups €or a sphere and a flake, both with Lc = 6.0 mm. In this particular case, the sphere’s mass was 0.314 g, and the flake’s was 0.1 15 g. The flake setup corresponds to the “Face A - B example in Figure 1.
Figure 1: LI-900 tile configuration: RCG - dark blue; LI-900 - blue-green; densified LI-900 - bright green; strain isolation pad - olive; aluminum backwall - red; gap fillers - tan.
In [l] the Face A-B impacts generated a concentration of material in a plane normal to both the flake face and the target surface, which caused a linear rip in the backwall. We assumed that this orientation is also the most damaging in the present case, since the target geometry is similar, with a thin RCG crust and with low-density silica fibers now f d h g the “standoff’ space.
Figure 2 shows the simulation setups for a sphere and a flake, both with Lc = 0.75 cm, and with the flake in the Face A-B orientation. The sphere’s mass was 0.614 g, and the flake’s was 0.204 g.
ILI. Simulation Results
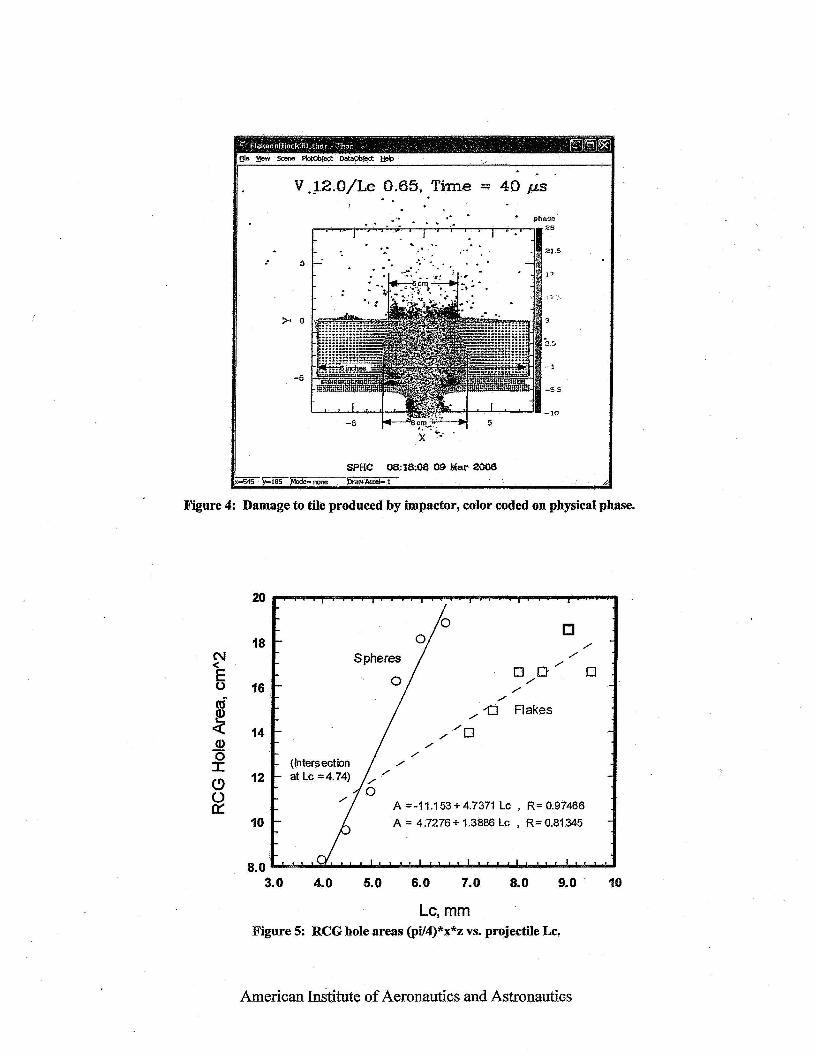
Figure 3 compares exterior views of the backwall damage produced by the sphere and flake impactors at the 15 microsecond point. The sphere has clearly perforated the backwall, whereas the flake material has not. Figure 4 is a view through a tile following impact, showing the damage to the RCG layer, an urn-shaped cavity in the LI-900, and perforation of the aluminum backwall. This particular example was damage produced by a sphere’ but the damage style from flakes is remarkably similar.
h
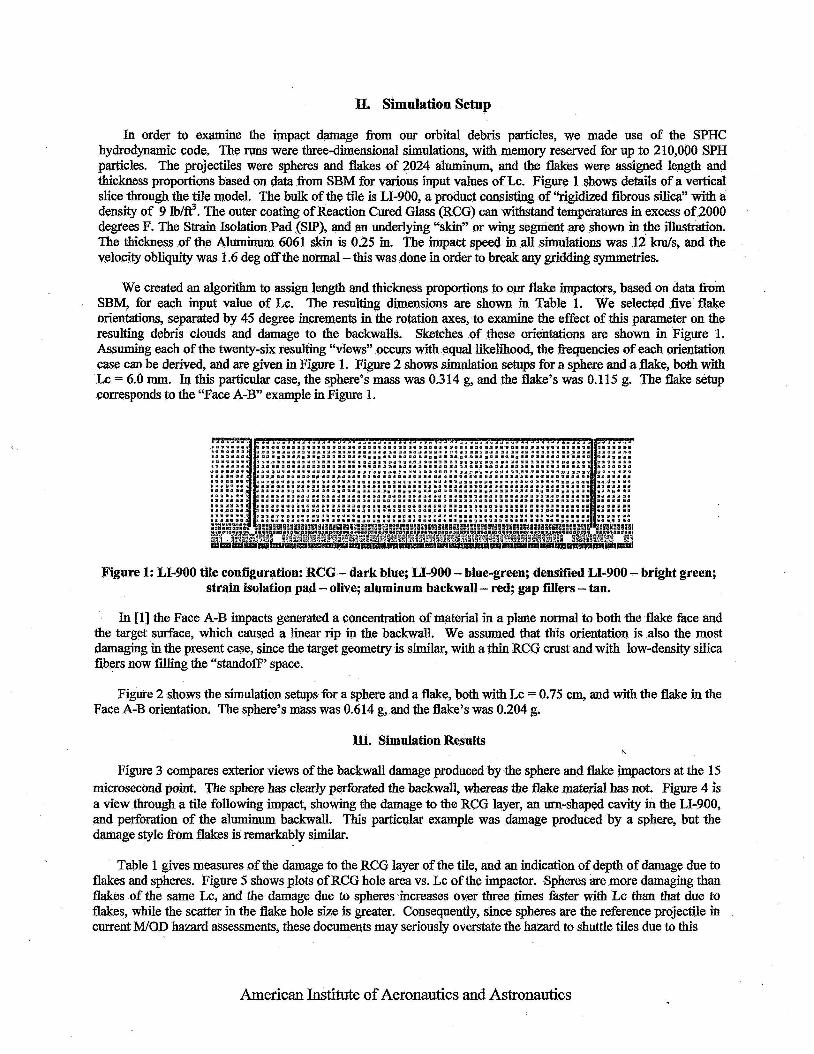
Table 1 gives measures of the damage to the RCG layer of the tile, and an indication of depth of damage due to flakes and spheres. Figure 5 shows plots of RCG hole area vs. Lc of the impactor. Spheres are more damaging than flakes of the same Lc, and the damage due to spheres increases over three times fhster with Lc than that due to flakes, while the scatter in the M e hole size is greater. Consequently, since spheres are the reference projectile in current M/OD hazard assessments, these documents may seriously overstate the hazard to shuttle tiles due to this
American Institute of Aeronautics and Astronautics
V lZ.O/Lc 0.750 Time = 0 p s
V 12.O/Lc 0.750 Time = 0 ps
Figure 2: Setups for sphere and Face A-B flake impact simulations.
I . . P
*- I d i 5’
I
Figure 3: Backwall damage by sphere and Face A-B flake impactors at 15 ps.
source. Whether the same is true of damage to RCC panels such as those on the shuttle wing leading edges, we cannot say at this time.
Note that all projectiles in Table 1 penetrated at least through the SIP layer. New wing acreage tile safety criteria [SI, adopted approximately one year ago, consider ‘‘threshold perforation of the TPS skin panel” to be a failure for most of the wing underside, so only the three smaller projectiles in each category would not fail the TPS. A more stringent criterion of ‘’threshold perforation to the SIP bondline” is applied to the elevon hinge panels, so dl the projectiles in Table 1 would be above acceptable limits for these panels.
American Institute of Aeronautics and Astronautics
V.1.2.O/Lc 0.65, Time = 40 ps
Figure 4 Damage to tile produced by impactor, coIor coded on physical phase.
20
18 b Spheres f
/
/ /
0 5 / 0 /
/ / a Flakes
/
/ 'a
/ A =-I 1.153 f 4.7371 Lc , R= 0.97466 A = 4.7276 + 1.3886 Lc , R= 0.81 345
1 ° ~ P 8.0
3.0 4.0 5.0 6.0 7.0 8.0 9.0 10
Lc, mm Figure 5: RCG hole areas @Y4)*x*z vs. projectile Lc.
American hdtute of Aeronautics and Astronautics

J TabIe 1: Damage to LI-900 tiles by flake and sphere impactors
Lc, mm Mass, g RCG Hole Pen. Depth x-dir, cm z-dir, em Area, em2
Face A-B 78 0.171 4.2 4.2 13.9 Thru SIP 7.5 0.204 4.3 4.4 14.9 0.2 cm into Bkwl 8.0 0.241 4.7 4.5 16.6 0.4 cm into Bkwl 8.5 0.281 4.7 4.5 16.6 Thru Bkwl 9.0 0.326 5.0 4.7 18.5 Tbru Bkwl 9.5 0.374 4.5 4.7 16.6 Tbru Bkwl
Sphere 4.0 0.093 3.2 3.3 8.3 Thru SIP 4.5 0.132 3.5 3.5 9.6 0.3 cm into Bkwl 5.0 0.181 3.7 3 9 11.3 0.6 cm into Bkwl 5.5 0.242 4.4 4.7 16.2 Thru Bkwl 6.0 0.3 14 4.8 4.8 18.1 Thru Bkwl 6.5 0.399 5.0 4.8 18.8 Tbru Bkwl
. Conclusions
Current impact testing typically utilizes spherical projectiles, which we have shown to be more damaging at a given characteristic length, Lc, than fltike-shaped objects; this is true down to Lc -4.74 mm for RCG surface damage, and down to even smaller Lc’s for SIP damage. Nevertheless, spherical impact results are used to develop damage prediction equations used in shuttle risk calculations. The current debris flux model incorporates nonspherical fhgment shapes in predicting current and future debris population trends. It is inconsistent to use both spherical and nonspherical hgments in this type of analysis, and, once limiting damage criteria are independently established, use of spherical impactor results will significantly overstate the actual level of risk.
References
1.
2.
3.
4.
5.
WWamsen, J. E. and Evans, S. W., “Predicting Orbital Debris Shape and Orientation Effects on SpacecraR Shield Ballistic Limits Based on Characteristic Length,” 2005 Hypervelocity Impact Symposium, Lake Tahoe, CAY October 2005. Stellingwerf, R F., et al., “Foam-on-Tile Impact Modeling for the STS-107 Investigation,” 42&AL4A Aerospace Sciences Meeting and Exhibit, Reno, NV, January 2004. Reynold, RC., et al. ‘WASA Standard Breakup Model, 1998 Revision.” Lockheed Martin Space and Mission Systems and Services Report LMSMMSS-32532, September 1998. Williamsen, J., “Review of Space Shuttle MeteoroidOrbital Debris Critical Risk Assessment Practices,” IDA Paper P-3838, November 2003. Chistiansen, E. and Hyde, J., “DRAF’T STS-114 Flight Readiness Review Micrometeoroid Orbital Debris (MMOD) Asse~sment,’~ SR2804, April 26,2005.
American Institute of Aeronautics and Astronautics