Optimizing Post-Acute Care Services in Population …...facilitates the flow and analysis of...
35
Optimizing Post-Acute Care Services in Population Health April 3, 2013
Transcript of Optimizing Post-Acute Care Services in Population …...facilitates the flow and analysis of...

Optimizing Post-Acute Care Services in Population Health April 3, 2013

2
PROPRIETARY & CONFIDENTIAL – © 2012 PREMIER INC.
Key objectives ! Provide background on population health and its impact
on PAC providers ! Discuss capabilities required / associated with post-acute
care coordination ! Share case studies and examples
Contents ! Background ! Post acute care (PAC) costs and utilization ! Strategic considerations ! PAC assessment tool
Table of contents

Population Health Background

4
PROPRIETARY & CONFIDENTIAL – © 2012 PREMIER INC.
“Americans always do the right thing, after they have tried everything else”
– Winston Churchill
5
PROPRIETARY & CONFIDENTIAL – © 2012 PREMIER INC.
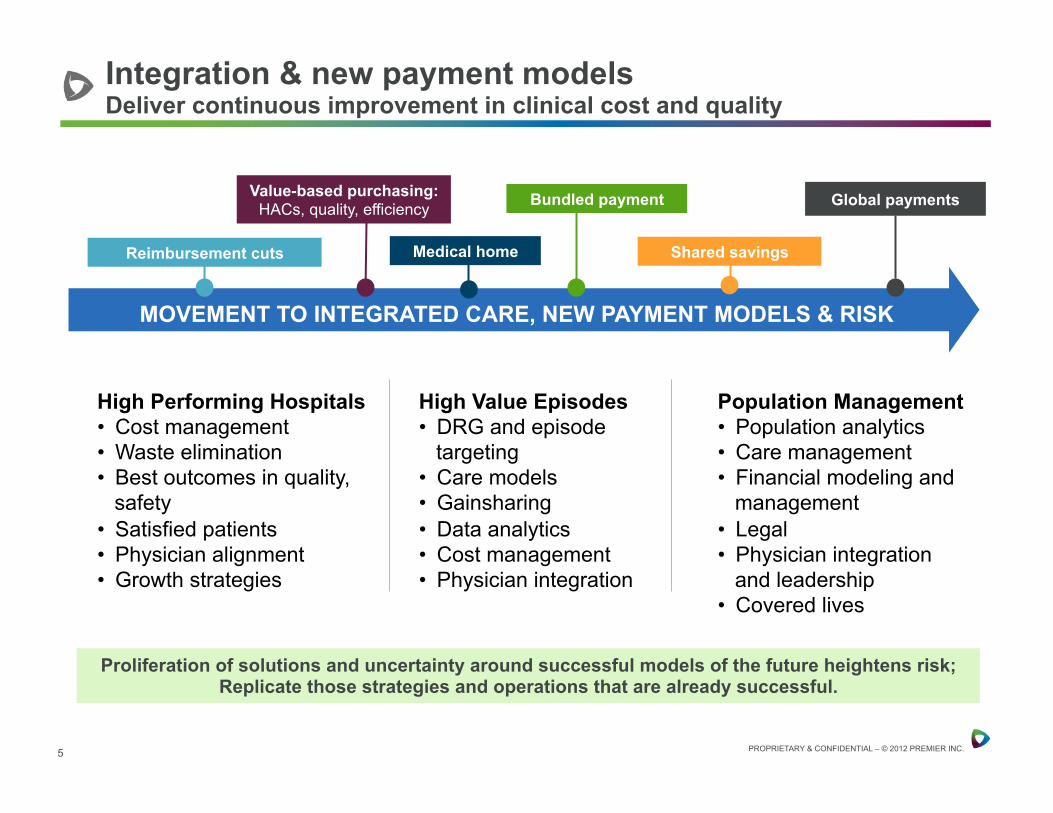
Integration & new payment models Deliver continuous improvement in clinical cost and quality
Population Management • Population analytics • Care management • Financial modeling and
management • Legal • Physician integration
and leadership • Covered lives
High Value Episodes • DRG and episode
targeting • Care models • Gainsharing • Data analytics • Cost management • Physician integration
High Performing Hospitals • Cost management • Waste elimination • Best outcomes in quality,
safety • Satisfied patients • Physician alignment • Growth strategies
Proliferation of solutions and uncertainty around successful models of the future heightens risk; Replicate those strategies and operations that are already successful.
MOVEMENT TO INTEGRATED CARE, NEW PAYMENT MODELS & RISK
Bundled payment
Shared savings
Value-based purchasing: HACs, quality, efficiency Global payments
Reimbursement cuts Medical home

6
PROPRIETARY & CONFIDENTIAL – © 2012 PREMIER INC.
Medicare Bundled Payment Initiative Over 500

7
PROPRIETARY & CONFIDENTIAL – © 2012 PREMIER INC.
! CMS has begun it’s “no risk” period and preparing agreements for this initiative
! Model 1, a retrospective model across all MS-DRGs, is expected to begin in April
! Models 2 – 4 are expected to begin operating in July • Model 2 – acute care hospital stay plus 30+ days post acute care
with retrospective reconciliation • Model 3 – post acute care only with retrospective reconciliation • Model 4 – acute care hospital stay only with prospective payment
CMMI’s Bundled Payments for Care Improvement Initiative

8
PROPRIETARY & CONFIDENTIAL – © 2012 PREMIER INC.
Medicare ACOs across the country
8
NJ
DE MD
WA
IL
LA
AR
MO
IA
MN
KS
NE
SD
ND MT
WY
CO
NM
ID
UT
AZ
NV
CA
OR
MA
RI CT
SC
NC
VA WV
PA
VT
NH
ME
FL
GA AL MS
TN
KY
MI
OH IN
DC
MO
NY
TX
OK
NATIONWIDE GROWTH
WI
Medicare ACO’s 20+ 10-19 5-10 2-4 1 0
HI
AK

9
PROPRIETARY & CONFIDENTIAL – © 2012 PREMIER INC.
! 254 Medicare ACO’s in 43 states • First ACOs (10 organizations) part of the PGP demonstration
project beginning in 2006 (sunset 12/31/12)
! 32 CMMI “Pioneer” participants, program began 1/1/2012 • Roughly 30% physician organization-led
! Medicare Shared Savings Program • 4/1/2012: 27 ACOs selected to participate
» Majority of organizations physician-led • 7/01/2012: 89 ACOs selected to participate • 1/1/2013: 106 ACOs selected to participate
Growing number of Medicare ACOs

10
PROPRIETARY & CONFIDENTIAL – © 2012 PREMIER INC.
Complete view of accountable care
ACO CEO
COO CFO CMO CNO CQO
Payer Partners
People Centered Foundation will ensure that the first principle for
accountable care design and ongoing operations is to enable all people within the AC community to meet their needs and desires for
good health.
Health Home redesigns primary care to create a new PCP model
that provides people centric care as well as care guidance to the
practice population.
Payer Partnerships - focused on the framework necessary for the network
to develop and maintain mutually advantageous relationships with AC
payer partners (plans and employers).
AC Leadership addresses the strategic leadership and operational infrastructure
necessary to support a successful network that is organized around
Triple Aim goals.
Population Health Data Management facilitates the flow and analysis of
clinical, financial, and patient related data and information across all components of
accountable care delivery system.
High Value Network delivers provider networks that will
optimize care delivery within and across the continuum and
ensure that care is coordinated.

11
PROPRIETARY & CONFIDENTIAL – © 2012 PREMIER INC.
The High Value Network will deliver provider networks that will optimize care delivery within and across the continuum and ensure that care is coordinated.
High Value Network
Key Attributes: • There is a wide range of clinical providers and
facilities supporting primary care practices • Care models across the health system define how
care is consistently delivered to patients • How and when patients move between sites of
care is actively managed and supported • The entire health system is focused on improving
the health and costs of the population it serves

12
PROPRIETARY & CONFIDENTIAL – © 2012 PREMIER INC.
Post Acute Spectrum
Key ACO Attributes: • Person-Centered Foundation • High-Value PAC Network • Payer Partnerships • Leadership • Post-Acute Care Coordination • Population Health Data Management
The Post Acute Spectrum serves as a step down from the intense acute hospital services and a partner in management of chronic conditions.

13
PROPRIETARY & CONFIDENTIAL – © 2012 PREMIER INC.
! Has your organization identified your accountable care partner(s)?
! Have you assessed your capabilities relative to managing a population?
! For those that have, have you taken those results to accountable care networks?
Context setting questions

PAC costs and utilization

15
PROPRIETARY & CONFIDENTIAL – © 2012 PREMIER INC.
Payment Models
Physician Outpatient Hospital and
ASCs
Inpatient Acute Care
Long Term Acute Care
Inpatient Rehab
SNFs Home Health Care
RBRVS APC MS-‐DRG MS-‐DRG RICs RUGs HHRGs
VBP modifier plan published on 11/1/11
Implement in FY2013 PFS
P4R in FY2013; VBP
implementaJon plan submiKed to
Congress on 4/18/11
VBP commenced 10/1/12
P4R in FY14: VBP test pilot by 1/1/16
VBP test pilot by 1/1/2016
VBP impl. plan sent to Congress 6/15/13
VBP impl. plan to Congress overdue (10/1/11 deadline)
Accountable Care Organizations
Trac
k Tw
o Tr
ack
One
Value Based Purchasing across payment silos
Post-Acute Care Episode Bundling
Acute Care Bundling
Medical Home
Acute and Post-Acute Care Episode Bundling
Will Congress speed up VBP and create national Bundling Program in CY 2013?

16
PROPRIETARY & CONFIDENTIAL – © 2012 PREMIER INC.
Medicare spend on post acute care
Managed care spending is not included in this chart. Source: CMS, Office of the Actuary (Healthcare Spending and the Medicare Program MEDPAC, June, 2012)
26.6
32.6 34.337.5
42.1 43.5
48.651.9
55.758.0
63.5
12.114.8 15.0 16.7
18.6 19.622.4 24.2 25.8 27.0
31.8
8.09.6 10.1 10.8 12.6 13.0 15.4 16.9 18.8 19.4 19.6
4.5 5.7 6.2 6.4 6.5 6.3 6.1 6.0 6.0 6.3 6.7
2.0 2.5 3.0 3.6 4.4 4.6 4.7 4.8 5.1 5.3 5.40.0
10.0
20.0
30.0
40.0
50.0
60.0
70.0
2001 2002 2003 2004 2005 2006 2007 2008 2009 2010 2011
$ in billions
Medicare Spending on FFS Post-‐Acute Care 2001-‐2011All post-‐acute care
Skilled nursing facilities
Home health agencies
Inpatient rehabilitation hospitals
Long-‐term care hospitals

17
PROPRIETARY & CONFIDENTIAL – © 2012 PREMIER INC.
Summary of ACO expenditures
Home health alone could generate over 3x the savings as inpatient expenses
NOTE: Client example; costs not severity adjusted
Expense for ACO Assigned Beneficiaries
All MSSP ACOs
Impact of 5% Cost
Reduction
Impact of Reaching
MSSP Average
Total $11,494 $9,824 $7,308,138 $21,236,584
ERSD $69,541 $65,029 $740,612 $961,103 Inpatient $3,550 $3,200 $2,257,328 $4,458,411
Skilled Nursing $1,088 $891 $692,058 $2,609,422
Home Health $1,664 $527 $1,012,427 $14,462,779

18
PROPRIETARY & CONFIDENTIAL – © 2012 PREMIER INC.
MSSP results of first year # of beneficiaries
1st 27 375,000Next 88 1,200,000Total 1,575,000
1/1/2011 -‐ 12/31/2011 1/1/2012 -‐ 12/31/2012 ∆All ACOs All ACOs % Improvement
Total Expenditures per Assigned Beneficiary Status2, 4
Total 9,832 9,895 -‐0.64%
Component Expenditures per Assigned Beneficiary3
Inpatient4 3,305 3,236 2.08% Indirect Medical Education (IME)4 135 131 3.52% Disproportionate Share Hospital (DSH)4 310 315 -‐1.69%Skilled Nursing Facility 867 732 15.61%Institutional (Hospital) Outpatient 1,449 1,597 -‐10.21%Part B Physician/Supplier 3,454 3,253 5.82%Home Health 484 538 -‐11.11%Durable Medical Equipment 317 309 2.53%Hospice 196 228 -‐16.33%
Transition of Care/Care Coordination Utilization30-‐Day All-‐Cause Readmissions Per 1,000 Discharges5 158 147 6.96%30-‐Day Post-‐Discharge Provider Visits Per 1,000 Discharges 785 780 0.64%
Additional Utilization Rates (Per 1,000 Person Years)Hospitalizations6 378 340 10.15%Emergency Department Visits 672 662 1.44% Emergency Department Visits That Lead To Hospitalizations 250 226 9.70%Computed Tomography (CT) Events 639 643 -‐0.67%Magnetic Resonance Imaging (MRI) Events 303 259 14.67%Primary Care Service Visits7 With a Primary Care Physician8 4,609 4,144 10.09%With a Specialist Physician9 4,766 4,222 11.42%With a Nurse Practitioner/Physician's Assistant/Clinical Nurse Specialist10 553 648 -‐17.11%With a FQHC / RHC11 47 36 24.10%
Ambulance Events 855 694 18.81%
Medicare Shared Savings ProgramBenchmark Period Aggregate Expenditure/Utilization Trend Report
All ACO -‐ comparison of 2011 and 2012 expenditures and utilization statistics

19
PROPRIETARY & CONFIDENTIAL – © 2012 PREMIER INC.
Post Acute Care -‐ 1-‐30 Days after Discharge
Cost Categories Hospital Total HRC Hospital Total HRCNationwide Average
Well-‐Managed Benchmark Hospital Total HRC
Part AInpatient Readmissions -‐ Facil ity *** $796 $1,110 8.3% 11.9% 9.5% 6.2% $9,590 $9,330Acute Inpatient Rehab -‐ Facil ity $634 $308 4.2% 1.8% 2.0% 1.1% $15,089 $17,087Long Term Acute Care (LTAC) -‐ Facil ity $0 $57 0.0% 0.2% 1.1% 0.9% $0 $28,400Skilled Nursing Facil ity -‐ Facil ity $3,201 $3,120 25.0% 26.8% 18.6% 10.8% $12,802 $11,641Home care ** $1,278 $1,034 62.5% 45.7% 34.5% 30.2% $2,044 $2,263
Part BInpatient Readmissions -‐ Professional $110 $130 8.3% 11.9% 9.5% 6.2% $1,325 $1,094Acute Inpatient Rehab -‐ Professional $3 $7 4.2% 1.8% 2.0% 1.1% $68 $369Long Term Acute Care (LTAC) -‐ Professional $0 $2 0.0% 0.2% 1.1% 0.9% $0 $1,035Skilled Nursing Facil ity -‐ Professional $16 $44 25.0% 26.8% 18.6% 10.8% $62 $164OP rehab $0 $0 0.0% 0.2% -‐ -‐ $0 $130Part B drugs $0 $3 0.0% 2.0% -‐ -‐ $0 $172Other outpatient facil ity (lab, radiology, etc) $6 $27 8.3% 12.3% -‐ -‐ $77 $220Other outpatient professional $8 $29 12.5% 20.3% -‐ -‐ $63 $142Other outpatient (including DME) $7 $33 4.2% 5.2% -‐ -‐ $159 $643
Total Post Acute Care -‐ Part A and B $6,057 $5,904
Average Allowed Cost per Patient*
% of Anchor DRG Admissions with Some Util ization in Category
Average Allowed Cost per Service for those
with a Claim for Service
Episode of care utilization of post acute services MS-DRG 330 - Major small & large bowel procedures w CC

Strategic considerations
21
PROPRIETARY & CONFIDENTIAL – © 2012 PREMIER INC.
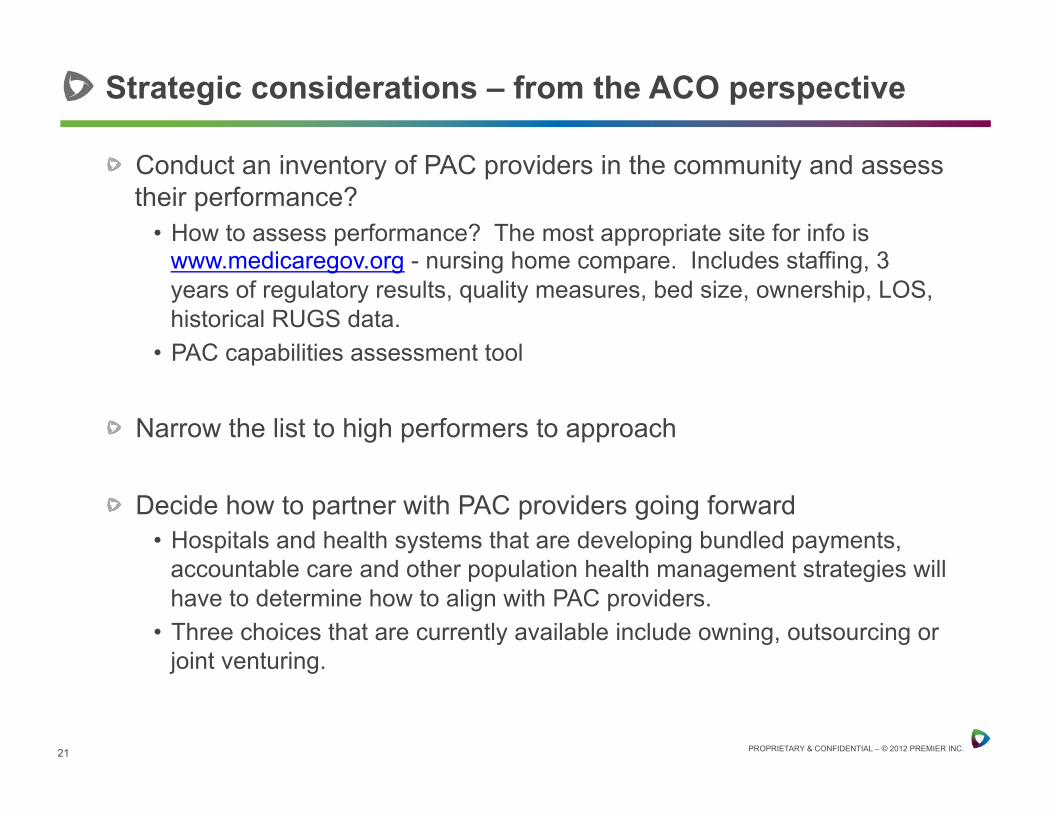
! Conduct an inventory of PAC providers in the community and assess their performance?
• How to assess performance? The most appropriate site for info is www.medicaregov.org - nursing home compare. Includes staffing, 3 years of regulatory results, quality measures, bed size, ownership, LOS, historical RUGS data.
• PAC capabilities assessment tool
! Narrow the list to high performers to approach
! Decide how to partner with PAC providers going forward • Hospitals and health systems that are developing bundled payments,
accountable care and other population health management strategies will have to determine how to align with PAC providers.
• Three choices that are currently available include owning, outsourcing or joint venturing.
Strategic considerations – from the ACO perspective

22
PROPRIETARY & CONFIDENTIAL – © 2012 PREMIER INC.
! Knowledge and understanding of industry trends • What do we need to learn and how will we learn it?
! Knowledge of the market(s) / environmental scan (external) • Referral patterns and utilization of post-acute care • Market data Review • Physician practice strategies/ hospital & physician alignment • Payer strategies • How fast is the market moving towards integrated care • Continuum strategies • Competitor intelligence • What are potential collaborators in the market doing
! Internal assessment • PAC assessment Tool • Culture • Fluidity / ability to change • Capacity for new service development / innovative care delivery
approaches
Strategic considerations – from the PAC perspective

PAC assessment tool

24
PROPRIETARY & CONFIDENTIAL – © 2012 PREMIER INC.
Attributes of a post acute partner (1)
Minimum Requirements Ideal Requirements Post Acute Continuum
Single service Source for full continuum, from skilled nursing to palliative care
Access for Qualified Patients
Admits <10% of a hospital’s post acute patients
Guarantees for access & placement of 100% of patients in need
Location Within the hospital’s service area Locations close to population clusters
Clinical Quality Scores
Quality scores similar to local averages
Better scores than other local providers and in the top quartile nationally
Service Quality
Similar to other local providers Demonstrably better than local providers
Patient Satisfaction
Scores close to local average scores
Better than acute provider’s satisfaction scores

25
PROPRIETARY & CONFIDENTIAL – © 2012 PREMIER INC.
Attributes of a post acute partner (2)
Minimum Requirements Ideal Requirements Case Management
Manages cost and quality control for services offered
Participates in management across episode of care
Patient Compliance
None Innovative systems to help track and manage compliance
EHR Ability to receive and transmit basic patient information
Provides cost and care information in a manner that allows for analysis
Medical Champions
Passive Medical Directors Physicians helping to drive improvement
Vision Targets for the cost and quality of service provided
Concept of the future and action to plan to achieve it with the help of its partners
Leadership Can competently manage the services being provided
Can help anticipate future needs and respond in an appropriate manner
Cost Proportionate to above measures
Value added

26
PROPRIETARY & CONFIDENTIAL – © 2012 PREMIER INC.
Post acute care coordination models

27
PROPRIETARY & CONFIDENTIAL – © 2012 PREMIER INC.
! Population health management, whether it be through an ACO or an episode of care, is expected to connect groups of providers across the care continuum that are willing and able to take responsibility for improving the health status, efficiency and experience of care for a defined population.
! The Post-Acute Care (PAC) Capabilities Framework is intended to provide organizations with a tool to assess a PAC provider’s current level of performance and readiness as it relates to the implementation of population health management principles.
! It can be used to inform acute care providers who are developing ACOs or bundled payments with information regarding which PAC providers should be considered for partnerships and/or preferred provider status.
PAC Capabilities Framework: Overview

28
PROPRIETARY & CONFIDENTIAL – © 2012 PREMIER INC.
! The assessment is meant to be used by a number of different audiences.
• Provider systems that are developing accountable care organizations and the network to serve that population can use this tool to assess potential PAC partners they might want to have as a part of the full continuum of care.
• PAC providers that are not currently associated with an accountable care network can assess their capabilities and take the results to large provider systems to point out that they would be a good partner in the accountable care network.
• PAC providers that are part of a PAC system or stand-alone providers.
PAC readiness assessment

29
PROPRIETARY & CONFIDENTIAL – © 2012 PREMIER INC.
PAC core capabilities (1)
Core Capabilities Example Capabilities
Example Operating Activities
Person-Centered Foundation Patient and caregivers at the center, honoring preferences, coordination, education, patient satisfaction scores, service, etc.
Involve people in decisions that affect their health care
Individualized Care Plans, Navigation/Coordination, Advanced Care Planning
High-Value PAC Network Source of full PAC continuum, access, coordination, transitions, and partnerships/affiliations
Full PAC continuum, Transitions of Care across care settings
Skilled to Palliative Care, Measurements for readmissions and evaluative improvement systems in place
Payer Partnerships Focused on the framework necessary to develop and maintain mutually beneficial relationships with payers; ability and/or willingness to perform under a variety of reimbursement structures
Value Based Purchasing
Willingness to work with a variety of reimbursement models and takes accountability for outcomes
Leadership Vision and strategy evident; corporate infrastructure, retention, partnerships /alliances, and culture
Vision and Strategic Planning
Evidence that strategic planning occurs; leadership involvement in creating alignment with ACO initiatives

30
PROPRIETARY & CONFIDENTIAL – © 2012 PREMIER INC.
PAC core capabilities (2)
Core Capabilities Example Capabilities
Example Operating Activities
Post-Acute Care Coordination Use of evidence based medicine and clinical pathways, care transitions and coordination interventions, ability to accept medically complex patients, guaranteed access, medical champions, and in alignment with 33 quality indicators (Medicare Shared Savings Program)
Delivery of High Quality Post Acute Care
Medication Management, Chronic Disease Management, Use of Care Path Programs
Population Health Data Management Able to analyze clinical, financial and patient information; data exchange among providers
Data Analysis and Exchange
Capture & Analyze data across multiple sources and exchange data across the care continuum

31
PROPRIETARY & CONFIDENTIAL – © 2012 PREMIER INC.
Post Acute (Home Health) Capabilities Framework: Sample Subset
POST ACUTE CARE CAPABILITIES FRAMEWORK: Home Health
PAC Component Capability Operating Activity Description of Operating Activity to help score status
High Value PAC Network
II.A. Provides full PAC continuum
II.A.1.System has full PAC continuum, from skilled care to palliative care
Baseline: Single Service Credentialed, Partnerships with other PAC providers. Partner: provides most services Driver: Source for full continuum
High Value PAC Network
II.B.1. Admission Capabilities The HHA has a written process for accepting patients that is based on its ability to provide the care, treatment or services required. Admission capabilities have been assessed, and the organization puts the necessary resources, oversight and staff development processes in place to enable them to receive and care for all levels of acuity appropriate for a home care setting.
High Value PAC Network
II.B.2. Within the hospital’s service area
Locations close to ACO's population and/or related affiliated clinics and service providers. 24/7 coverage
High Value PAC Network
II.C.1. Identifies and partners with ancillary care providers
Outsources/contracts for ancillary services such as lab; x-‐ray; podiatry; rehabilitative therapies. Selection standards for screening and performance of ancillary providers are identified and followed -‐ including but not limited to their involvement in the IDT plan of care. Selection process includes an evaluation of willingness to share efforts and responsibility for reduction of readmissions and quality outcomes for patients.
High Value PAC Network
II.C.2. Identifies partners essential to success in reducing readmission rates/ER visits
HHA initiates/participates in a collaborative effort with hospitals and other PAC providers to reduce hospital readmission rates and ER visits. Metrics and best practices are studied. Shared processes and work flows are analyzed and improved (e.g.. Method with which patient information is shared during transitions in care). The culture established is one of shared responsibility.
II.B. Access
II. C. PAC collaborates to facilitate high-‐
quality partnerships

32
PROPRIETARY & CONFIDENTIAL – © 2012 PREMIER INC.
Capabilities Framework: Demonstration of Scoring System
POST ACUTE CARE CAPABILITIES FRAMEWORK: Skilled Nursing Facility (SNF)
PAC Component Capability Operating Activity Score Weight
Total Score Per
"Operational Activity"
Total Score Per Capability
Percent of Implementation per Capability
Total Score per
Component
Percent of Implementation per Component
Post Acute Care Coordination
V.A.9 . Infection Control
0.8 0.0
PHDM VI.A. Support Data Analysis
VI.A.1. Capture and analyze data from multiple sources
0.8 0.0
0.0 0%
PHDM VI.B. Data ExchangeVI.B.1. Data exchange across care continuum
0.8 0.00.0 0%
PHDM VI.C. Support Clinical Practice
VI. C.1. Clinical Record Platform
0.8 0.0
0.0 0%
V.A. Deliver High Quality Post Acute
Care0.0 0% 0.0 0%
0.0 0%

33
PROPRIETARY & CONFIDENTIAL – © 2012 PREMIER INC.

34
PROPRIETARY & CONFIDENTIAL – © 2012 PREMIER INC.
Brent Hardaway Vice President, Population Health Management
Premier healthcare alliance Telephone: 512-657-2225
Email: [email protected]
Lori Peterson Collaborative Consulting
Telephone: 866.332.3923 Email: [email protected]
Contact information

Appendix