Optimizing FCCU Performance Effectively with Technologies Tracerco_News_V1_E… · and mechanical...
7
News Volume 1 Edition 2 Delivering diagnostic services and measurement solutions worldwide. tracercomatthey.com www.tracerco.com 1 A petrochemical plant had just performed a major revamp of one of their most critical distillation towers. This tower is over 150 feet tall, more than 20 feet in diameter, and contains several large beds of structured packing. The scope of the revamp included removing all of the old distributors and packed beds and replacing them with a more efficient design. Upon start-up, the tower was unusually unstable. Operations could not increase the feed to design rates while maintaining desired product quality. Both the overhead and bottoms products were off specification, even when the tower was running stable, below design rates. The first diagnostic step taken by plant personnel was sample analysis. Samples were collected at each packed bed, and the analysis of these samples indicated that all of the beds were performing poorly. What Continued on page 5 The Fluidized Catalytic Cracking Unit is the heart of a refinery. Small operational and mechanical problems in an FCC Unit can have a huge impact on the profitability of the refinery. Locating the root cause of problems is no easy task, particularly when the symptoms observed could be caused by a variety of factors. Tracerco is committed to providing quality investigative services for FCCU critical assets through our highly trained field engineers, use and development of proprietary equipment, advanced interpre- tative software and our dedication to research and development. Operations and engineering personnel use various information, including temper- ature, pressure, flow, and lab analysis to evaluate the performance of components in an FCC Unit. Often, finding the source of a problem is a process of elimination. At times there is no clear indication of the cause of the problem. This is when supplementary specialist techniques including TRACERCO Diagnostics™ applications can be used to measure a number of operational parameters on equipment including the: Regenerator Reactor Riser Stripper Main Fractionator In this issue of Tracerco News we will focus on FCCU Regenerator and Reactor appli- cations. Optimizing FCCU Performance Effectively with TRACERCO Diagnostics ™ Technologies Continued on page 4 Case Study: Identifying the Cause of Liquid Maldistribution in a Revamped Distillation Tower Figure 6 - Tracerco’s grid formation scan results showed slight maldistribution in all the beds so plant personnel decided to perform a TRACERCO Diagnostics™ ThruVision Scan to obtain a complete picture of the distribution pattern. TO FRACTIONATOR FEED AIR DISTRIBUTOR REACTOR RISER AIR FCCU Regenerator Regenerator Scan Catalyst/Air Distribution Study Residence Time Distribution Cyclone Efficiency Study Entrainment Study Spent Catalyst & Regenerated Catalyst Standpipes Standpipe Scan Slant Scan Time Study FCCU Reactor Reactor Scan Riser Termination Efficiency Residence Time Distribution Entrainment Study Reactor Stripping Section Stripper Grid Scan Catalyst Flow & MRT Steam/HC Flow & MRT Entrainment Study Reactor Riser Riser Density Scan Riser Scan Time Study Flow Rate Measurement of Catalyst and Vapor Phases
Transcript of Optimizing FCCU Performance Effectively with Technologies Tracerco_News_V1_E… · and mechanical...
NewsVolume 1 Edition 2 Delivering diagnostic services and measurement solutions worldwide.
[email protected] www.tracerco.com 1
A petrochemical plant had just performed a major revamp of one of theirmost critical distillation towers. This toweris over 150 feet tall, more than 20 feet indiameter, and contains several large bedsof structured packing. The scope of therevamp included removing all of the olddistributors and packed beds and replacingthem with a more efficient design.
Upon start-up, the tower was unusuallyunstable. Operations could not increase the
feed to design rates while maintainingdesired product quality. Both the overheadand bottoms products were off specification,even when the tower was running stable, below design rates.
The first diagnostic step taken by plantpersonnel was sample analysis. Sampleswere collected at each packed bed, and theanalysis of these samples indicated that allof the beds were performing poorly. What
Continued on page 5
The Fluidized Catalytic Cracking Unit isthe heart of a refinery. Small operationaland mechanical problems in an FCC Unitcan have a huge impact on the profitabilityof the refinery. Locating the root cause ofproblems is no easy task, particularly whenthe symptoms observed could be causedby a variety of factors.
Tracerco is committed to providingquality investigative services for FCCUcritical assets through our highly trainedfield engineers, use and development ofproprietary equipment, advanced interpre-tative software and our dedication toresearch and development.
Operations and engineering personneluse various information, including temper-ature, pressure, flow, and lab analysis toevaluate the performance of components inan FCC Unit. Often, finding the source ofa problem is a process of elimination. Attimes there is no clear indication of the
cause of the problem. This is when supplementaryspecialist techniques including TRACERCO Diagnostics™applications can be used to measure a number of operationalparameters on equipment including the:
RegeneratorReactorRiserStripperMain Fractionator
In this issue of TracercoNews we will focus on FCCURegenerator and Reactor appli-cations.
Optimizing FCCU Performance Effectively with TRACERCO Diagnostics™ Technologies
Continued on page 4
Case Study: Identifying the Causeof Liquid Maldistribution in aRevamped Distillation Tower
Figure 6 - Tracerco’s grid formation scan resultsshowed slight maldistribution in all the beds so plantpersonnel decided to perform a TRACERCODiagnostics™ ThruVision Scan to obtain a completepicture of the distribution pattern.
TOFRACTIONATOR
FEED
AIR DISTRIBUTOR
REAC
TOR
RISE
R
AIR
FCCU RegeneratorRegenerator ScanCatalyst/Air Distribution StudyResidence Time DistributionCyclone Efficiency StudyEntrainment Study
Spent Catalyst & Regenerated Catalyst StandpipesStandpipe ScanSlant ScanTime Study
FCCU ReactorReactor ScanRiser Termination EfficiencyResidence Time DistributionEntrainment Study
Reactor Stripping SectionStripper Grid ScanCatalyst Flow & MRTSteam/HC Flow & MRTEntrainment Study
Reactor RiserRiser Density ScanRiser ScanTime StudyFlow Rate Measurement of Catalyst and Vapor Phases

................. ı [email protected] www.tracerco.com
A common problem in anyrefinery or chemical plant isleaking heat exchangers.These can be reboilers, condensers, feed/effluentexchangers, etc. Most of thetime, there are some questionsin the mind of the operationsand maintenance staff about theleak. These questions can be:• Is the reboiler or condenser
leaking or is there contami-nant in the feed?
• Of a bank of exchangers,which one is leaking?
• For a feed/effluent exchanger,is there a leak or is there aproblem with the catalyst bed?Each of these questions can
be answered by performing aTRACERCO Diagnostics™Leak study of the exchangers.
The traditional method forperforming a leak test involvesbypassing the equipment orshutting down the unit. Eachexchanger is then isolated withblinds, filled and pressurizedwith water and a hydrostatictest is performed.
This method is generallyexpensive. Maintenance
expense is required for scaf-folding, line breaking, blind-ing, and hydrostatic testing foreach exchanger. It alsorequires a significant amountof time, while the unit is shut-down or on reduced through-put. Hence, on top of the main-tenance costs, there is the addi-tional cost of lost productionand the risk that the mainte-nance work or hydrostatic testwill cause a leak in anexchanger that was previouslyoperating well.
An alternative method isoften available that significant-ly reduces the costs associatedwith confirming and locating aleaking exchanger. While theunit and exchangers are on-line, tracers can be injectedinto the high-pressure side ofthe exchanger that can be mon-itored through the process sys-tem. The use of a TRACERCODiagnostics™ Leak studyeliminates the need for theequipment to be off-line or theunit to be shutdown whilesearching for the leakingexchanger. It also reduces
maintenance costs, since onlythe exchanger found to beleaking requires attention.
Radioisotope tracers aremost often used with radiationdetectors mounted externallyon the feed and effluent linesto and from the exchanger.While popular, this techniquehas limitations to the size ofleak that is detectable.Generally, the leak must begreater than 0.5 percent of thehigh-pressure stream flow. Ifthe leak is suspected to besmaller, then it is best to sam-ple the low-pressure streamand test the samples for thepresence of the tracer.
Case StudyOne common application
involves the testing of dieselhydrotreater feed/effluentexchanger systems. In onesuch case, the system consistedof four exchangers in series(Figure 8). The first exchangerto receive the feed was identi-
fied as the A exchanger andthe last was the D exchanger.The effluent was in countercurrent flow, entering the Dexchanger first and the Aexchanger last. There was aconvenient injection point (a3/4 inch bleeder) on the feedline to each exchanger. On theeffluent side, there was a 3/4inch bleeder on the effluentexit line from each exchanger.
A specific amount of radio-tracer was injected into theprocess stream. The first injec-tion was made into the Dexchanger and used a shortlived organic radiotracer toensure adequate mixing withinthe system. At the samplepoint on the effluent line, asample cooler was installed toensure that the diesel could beadequately cooled to eliminatesample vaporization.
A blank sample was collect-ed before any tracer was inject-ed. Ten 1-minute samples weretaken; the first one started at
Leak Test by Sampling Saves Time and MoneyBy Dave Ferguson, Business Development Manager - Tracers, Houston, Texas USA
Figure 9 - Samples were collected and each sample was counted atthe site for 2 minutes using a sensitive radiation detector. The onlysample's that were significantly above background were samples 4-9 of the C exchanger, illustrated in the green plot line shown above.
1
200250300350400450500550600650
3 5 7 9 11
Exchanger Leak Test Resultsby Sampling
Sample Number
Rad
iati
on
Co
un
ts
A ExchangerB ExchangerC ExchangerD Exchanger
Figure 8 - Illustrates the injection and sample points in the testingof a diesel hydrotreater feed/effluent exchanger system. The systemconsisted of four exchangers in series.
B
A
FeedLine
EffluentLines
InjectionPoint 4
SP2
D
C
From Reactor
IP3 IP1
SP4IP2
To Reactor
SamplePoint 1
SP3

................. ı [email protected] www.tracerco.com
The TRACERCO™ Densitygauge is a custom designeddensity measurement systemthat can be used in a widerange of applications on arefinery or chemical processingplant including:
• Density of single, two orthree phase process mixtures
• Gas or water slug presence,velocity, volume and frequency
• Oil in water or water in oilbreakthrough at low levelsin two phase separators
• Liquid carry over or vaporcarry under within separa-tion vessels
• Solids build-up on vessel orpipe walls
• Measurement of slurry concentrations in vessels ortransfer pipelines
The TRACERCO™ Densitygauge is a non-invasive systemdesigned to ensure reliable den-sity measurements. The gaugeconsists of a very small radioac-tive source housed within ashielded container and a sensi-tive detector. The detector ishoused in a flameproof enclo-sure and is suitable for use inhazardous areas up to andincluding Zone 1. The detectorand shield are mounted exter-nally to the pipe with no mov-ing parts eliminating mechani-
cal failure orfouling.
Radiation isattenuated bymaterial placedin its’ path. Attenuationdepends on the thickness of thematerial and its density. In atypical application within aprocessing plant the radiationbeam will be attenuated by thepipe or vessel walls and theprocess medium. As attenua-tion by the walls is constant,any variation in intensity at thedetector will be caused by vari-ation in the process medium.The system is calibrated usingknown densities of materialspassing between the source and
detector. The radiation countrate is stored within the instru-ment microprocessor for agiven density. This is then usedto accurately calculate densityof materials within the processat any given time.
If you would like to learnmore on Tracerco’s SpecialistMeasurement Instrument rangethen please contact a local representative in your area.
Specialist Measurement InstrumentsTracerco Featured ProductNon-Invasive - TRACERCO™ Density gauge
the same time that the radio-tracer injection was initiated.The injection and samplingsystem was then moved to theC exchanger and the procedurewas repeated. The B and Aexchangers were also tested inthis manner.
After collecting all of thesamples, each of them was
counted at the site for 2 minutesusing a sensitive radiation detec-tor. The results are shown inFigure 9 on page 2. The onlysamples that contained tracermaterial which was significantlyabove background were samples4 through 9 of the C exchanger.Based on the amount of tracer inthese samples and the counts ofradiation recorded from a stan-dard sample made from a smallamount of the original tracer,
the leak size was calculated tobe equivalent to 266 ppm or0.0266%.
ConclusionAs a result of the TRACERCO
Diagnostics™ Leak study plantpersonnel took a short outage toopen the C Exchanger. Theyfound a tube sheet leak andrepaired it. When they broughtthe unit back on line, the productwas back on specification. They
reported that knowing the specific leaking exchangerreduced downtime to about halfof the time they usually took tofind similar leaks. They alsoreported that savings in reducedproduction loss and maintenanceexpense was at least ten timesthe total costs associated withthe radiotracer leak test.
Leak Test Sampling(Continued from page 2)
Tracerco has launched its new TRACERCO™ Taggants website. To findout more information about the range ofTRACERCO™ Taggants that are used extensively as part of brand protection, anti-
adulteration, anti-theft and consumer protection programmes throughout thehydrocarbon chain please please visit ourwebsite at www.tracerco.com/taggants
Visit Our New TRACERCO™ Taggants Website
................. ı [email protected] www.tracerco.com
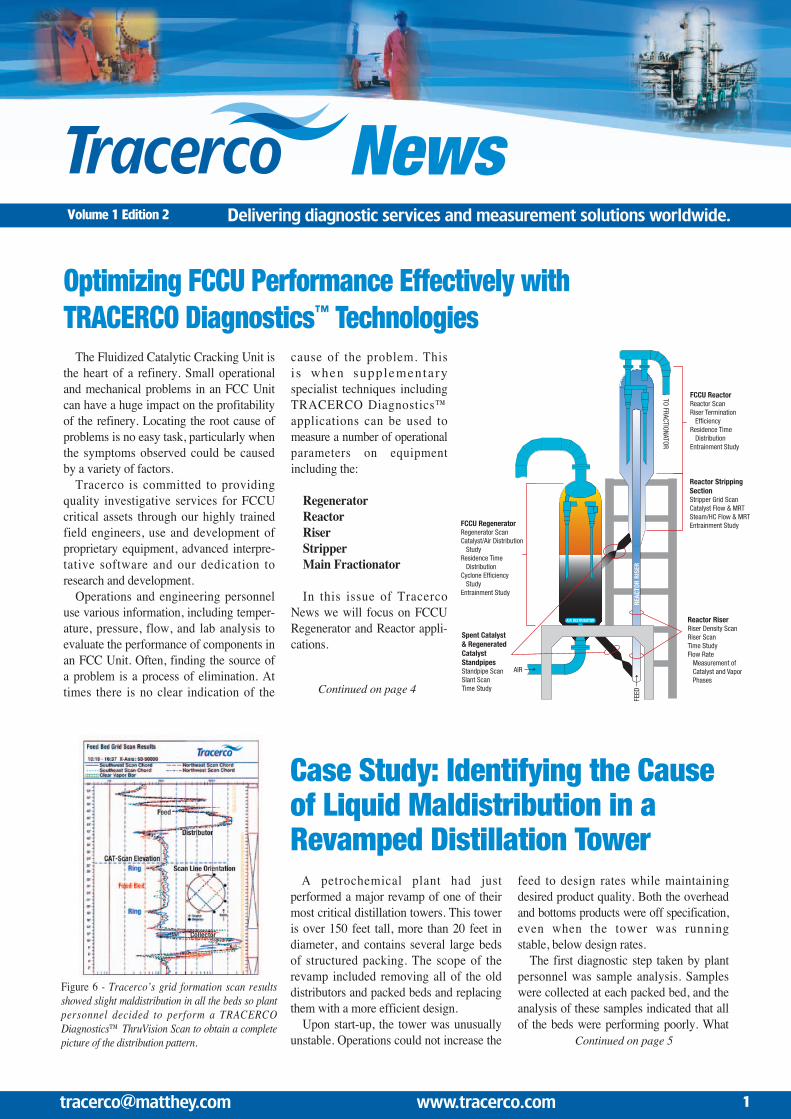
REGENERATORSealed and unsealed source
and distribution techniques areused to identify the air rate,flue gas rate, and bed level ele-vation. Both the air rate andflue gas rate in the regeneratorcan be measured simultaneous-ly with a single injection of ashort lived gaseous radioiso-tope. A group of radiationdetectors are placed a knowndistance apart on the air supplyline to the Regenerator andanother set on the flue gas lineleaving the Regenerator. Theflow rates are measured byconverting the velocities to vol-
umetric flow with respect toline diameter, process pressureand process temperature.
The dense bed level can bedetermined by using Tracerco’sservices. There are twomethodologies used to measurethe Regenerator catalyst level.A single scan through theRegenerator will produce adensity profile at the catalystbed level area that will indicatedense phase and dilute phaselevels. This procedure can beperformed over varying operational conditions to assessthe changes in level and canassist in the calibration of levelcontrol instruments.
A scan using a grid formation will determine amore accurate indication of theRegnerator’s catalyst bed level.Using a grid formation, fourscanlines are performedthrough the catalyst level areain an orthogonal grid pattern.(Figure 1)
The scanlines do not necessarilyhave to remain parallel in orderto miss the internal diplegs, butthey must be of the s amechord length to ensure consis-tent comparable dense bed anddilute phase densities betweenthe four quadrants. When over-
laying the four scanlines travers-ing different quadrants of theRegenerator (Figure 2) Tracercocannot only identify the denseand dilute phase catalyst levels,but we can see if the levels areuneven, which is an indication of maldistribution ofair and air grid efficiency.
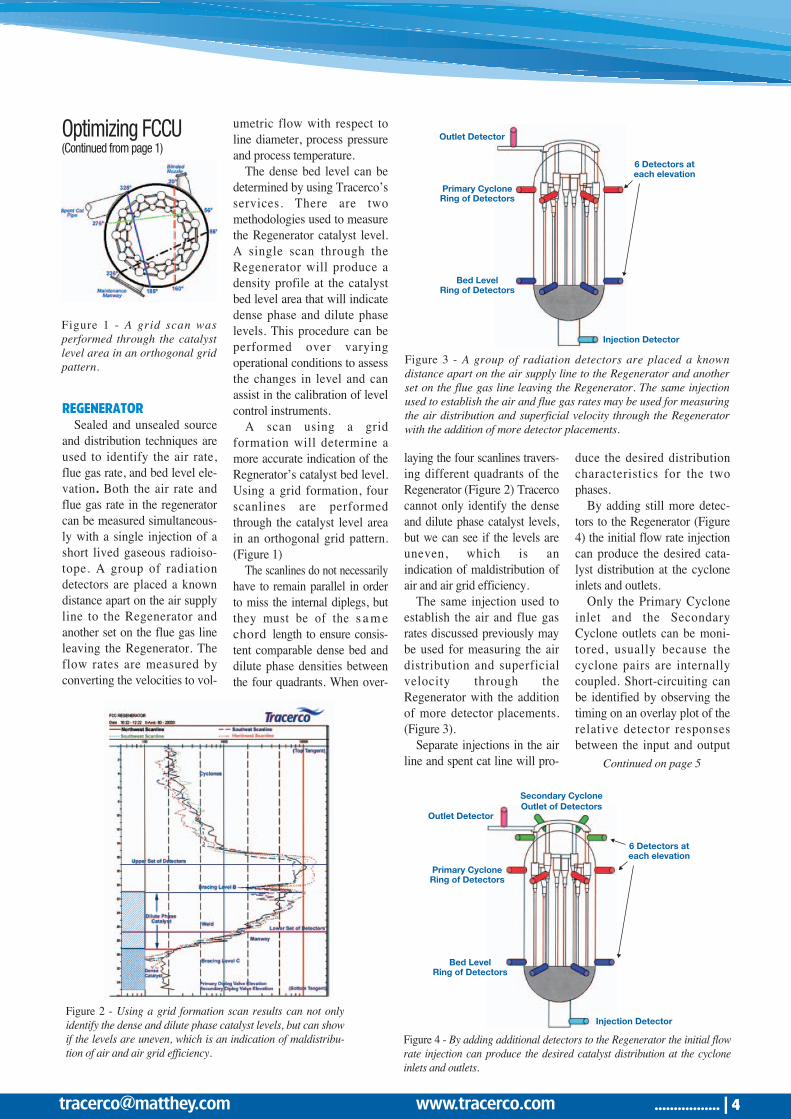
The same injection used toestablish the air and flue gasrates discussed previously maybe used for measuring the airdistribution and superficialvelocity through theRegenerator with the additionof more detector placements.(Figure 3).
Separate injections in the airline and spent cat line will pro-
duce the desired distributioncharacteristics for the twophases.
By adding still more detec-tors to the Regenerator (Figure4) the initial flow rate injectioncan produce the desired cata-lyst distribution at the cycloneinlets and outlets.
Only the Primary Cycloneinlet and the SecondaryCyclone outlets can be moni-tored, usually because thecyclone pairs are internallycoupled. Short-circuiting canbe identified by observing thetiming on an overlay plot of therelative detector responsesbetween the input and output
Continued on page 5
Figure 2 - Using a grid formation scan results can not onlyidentify the dense and dilute phase catalyst levels, but can showif the levels are uneven, which is an indication of maldistribu-tion of air and air grid efficiency.
Figure 1 - A grid scan was performed through the catalystlevel area in an orthogonal gridpattern. Figure 3 - A group of radiation detectors are placed a known
distance apart on the air supply line to the Regenerator and anotherset on the flue gas line leaving the Regenerator. The same injectionused to establish the air and flue gas rates may be used for measuringthe air distribution and superficial velocity through the Regeneratorwith the addition of more detector placements.
Outlet Detector
Primary CycloneRing of Detectors
Bed LevelRing of Detectors
6 Detectors ateach elevation
Injection Detector
Figure 4 - By adding additional detectors to the Regenerator the initial flowrate injection can produce the desired catalyst distribution at the cycloneinlets and outlets.
Outlet Detector
Secondary CycloneOutlet of Detectors
Primary CycloneRing of Detectors
Bed LevelRing of Detectors
6 Detectors ateach elevation
Injection Detector
Optimizing FCCU(Continued from page 1)

................. ı [email protected] www.tracerco.com
could not be determined was thereason that the beds were per-forming poorly. One possibilitywas liquid maldistributionthrough all the beds. If the liq-uid distribution was good, thenthe packing was falling wellshort of its designed efficiency.Another possibility was thatsome type of mechanical dam-age might have occurred dur-ing start-up.
Acquire DataIn order to help diagnose the
cause of the problem, Tracercowas called. The first step was toperform a grid formation scan ofthis tower.
The results of the grid scanshowed that all distributors, collectors, and packed bedswere in place with no evidenceof mechanical damage. The gridscan also showed slight liquidmaldistribution in all of thebeds, but it did not appearsevere enough to cause the very
poor efficiency of the tower.The scanline orientations andgrid scan results from the FeedBed are illustrated in Figure 6,page 1.
Liquid maldistribution hadbeen strongly suspected andsince the grid scan indicatedthat maldistribution was anissue, plant personnel wantedto get as complete a picture ofthe distribution pattern as possible. In order to obtain amore detailed liquid distri-bution profile, TRACERCO
Diagnostics™ ThruVisionscan was performed. A mutual decision was made thatthe most advantageous placeto perform the TRACERCODiagnostics™ ThruVisionscan was near the top of the bed as shown in Figure 6,page 1.
The scan results of theTRACERCO Diagnostics™ThruVision (Figure 7) showedthat a large amount of liquidwas channeling down throughthe center of the bed. This
confirmed that a liquid maldis-tribution problem, rather thanpoor packing performance,was the cause of the efficiencyreduction in the tower.
Implement ActionWith the information
provided by the Tracercoscans, plant personnel decidedto shut down the tower andinspect the liquid distributors.Upon inspection, an error indistributor installation was discovered. This error wascausing a large portion of theliquid to channel down thecenter of the packing. Theproblem was corrected, andthe tower was restarted with-out incident.
BenefitThe tower was pushed to
maximum design rates, andthe desired separation efficiency of the new packingwas achieved.
of the cyclones. By comparingthe integration of the areasbeneath each of the distributiondetector responses maldistribu-tion can be determined.
REACTORDetector placements for
establishing Reactor flow dis-tribution and superficial veloci-ties are the same in theory aswhen applied to theRegenerator study. Only theinjection sites are different. Forthe hydrocarbon (or vaporphase), an injection of a shortlived gaseous radiotracer ismade through the hydrocarbonfeed or catalyst lifting steamnozzles on the riser. For the cat-
alyst phase, an injection of ashort lived solid radiotracergenerated from a specific parti-cle size of native catalyst ismade into the regenerated catline prior to the riser. If twoadditional detectors are posi-tioned on the riser it is possibleto measure the “Catalyst Slip”factor, which is the ratio of thevelocity of the two phases inthe riser. The Catalyst Slip fac-tor is a useful tool for FCCUbenchmarking and profiling.
An example of a typical dis-tribution profile exhibitingmaldistribution at the Reactorcyclone inlets is presented inFigure 5. Comparing the inletresponse to the outlet responsecan identify problematic oper-ation of the coupled cyclonepair with respect to the others.
SUMMARYWhether benchmarking an
FCC after a turnaround, plan-ning modifications for the nextturnaround, or troubleshootingabnormal operations, the FCCProcess Engineer can utilize
TRACERCO Diagnostics™applicat ions to bet ter understand operational andmechanical problems. Thisleads to better performance forthe FCC resulting in enhancedprofitability.
Optimizing FCCU(Continued from page 4)
Case Study(Continued from page 1)
Vapor Distribution at Cyclone Inlets
Time (seconds)
Rad
iati
on
Inte
nsit
y
Figure 5 - Results illustrated above is an example of a typical distributionprofile exhibiting maldistribution at the Reactor cyclone inlets.
Figure 7 - TRACERCO Diagnostics™ ThruVision scan results illustrated alarge amount of liquid was channeling down the center of the bed.

Tracerco Brand Architecture
TRACERCO™ TRACERCO Diagnostics™
Process Diagnostic ServicesSpecialist Measurement Instruments Fuel Tagging Systems
TRACERCO™
The TRACERCO Profiler™ TRACERCO Diagnostics™ FCCU studyTRACERCO Diagnostics™ Separator studyTRACERCO Diagnostics™ FMITRACERCO Diagnostics™ Pipeline assuranceTRACERCO Diagnostics™ Flow studyTRACERCO Diagnostics™ Residence studyTRACERCO Diagnostics™ Distribution studyTRACERCO Diagnostics™ Tower scanTRACERCO Diagnostics™ MaximizerTRACERCO Diagnostics™ Interwell studyTRACERCO Diagnostics™ Wellbore studyTRACERCO Diagnostics™ Flow profileTRACERCO Diagnostics™ Leak studyTRACERCO Diagnostics™ Temperature studyTRACERCO Diagnostics™ Mercury studyTRACERCO Diagnostics™ MUITRACERCO Diagnostics™ SlugMonitor
TRACERCO™ 100 SeriesTRACERCO™ 200 SeriesTRACERCO™ 300 SeriesTRACERCO™ 400 SeriesTRACERCO™ 500 SeriesTRACERCO™ 600 SeriesTRACERCO™ 700 SeriesTRACERCO™ 800 Series
TRACERCO™ Density gaugeTRACERCO™ Level gaugeTRACERCO™ Interface gaugeTRACERCO™ Radiation monitorTRACERCO™ Mud monitorTRACERCO™ Catalyst probeTRACERCO™ SmartGaugeTRACERCO™ Level alarmTRACERCO™ PhaseGaugeTRACERCO™ SlugMonitorTRACERCO™ Contamination monitor
Billingham, UKTel +44 (0) 1642 375500
Aberdeen, UKTel +44 (0) 1224 592527
Rotterdam, The NetherlandsTel +31 (0) 10 26 46 510
Oldenburg, GermanyTel +49 441 36 11 09-0
Milan, ItalyTel +39 02 90989971
Bergen, NorwayTel +47 55 36 55 40
Perth, AustraliaTel +61 (0) 8 9480 3718
Kuala Lumpur, MalaysiaTel +603 7957 9821
Rio de Janeiro, BrazilTel +55 21 3865 0098
www.tracerco.com [email protected]
Upcoming Conference ScheduleTo learn more about our services and specialist measurement instruments, please stop by and visit the Tracerco boothat any of the following conferences:
XM0 227/0/0
ADIPEC Exhibition5-8 November 2006 Abu Dhabi Internation Exhibition
Centre, United Arab Emirates
2006 Cyclone Technologies (CT) Conference7-9 November 2006 Fisher Klosterman
San Antonio, Texas USA
Deep Offshore Technology28-30 November 2006 Booth 403
Houston, Texas USA
MEOS Exhibition11-14 March 2007 Bahrain Internation Exhibition
Centre, United Arab Emirates
OMC 07 Exhibition28-30 March 2007 Palazzo Delle Arti e Dello Sport '
Mauro De Andre' (Pala De Andre), Viale Europe, 1-48100 Ravenna, Italy
Offshore Europe 20074-7 September 2007 Stand no 1276
Aberdeen Exhibition & Conference Centre

TRA
CE
RC
OP
OB
OX
1B
ELA
SIS
HA
LLTE
CH
NO
LOG
YPA
RK
BIL
LIN
GH
AM
TS23
ILB
UN
ITE
DK
ING
DO
M
PLA
CE
STA
MP
HE
RE
TRA
CE
RC
OP
OB
OX
1B
ELA
SIS
HA
LLTE
CH
NO
LOG
YPA
RK
BIL
LIN
GH
AM
TS23
ILB
UN
ITE
DK
ING
DO
M
PLA
CE
STA
MP
HE
RE
Ple
ase
sen
dm
ead
ditio
nal
info
rmatio
no
nTra
cerco
’sS
pe
cialist
Me
asu
rem
en
tIn
strum
en
ts:
Name:
JobTitle:
Company
Name:
Address:
City:Country:
PostCode:
Phone:Em
ail:
❏Th
eTR
AC
ER
CO
Pro
filer™
❏TR
AC
ER
CO
™D
ensity
Gau
ge❏
TRA
CE
RC
O™
LevelG
auge
❏TR
AC
ER
CO
™In
terface
Gau
ge❏
TRA
CE
RC
O™
Ph
aseG
auge
❏TR
AC
ER
CO
™R
adiatio
nM
onito
r
❏TR
AC
ER
CO
™S
martG
auge
❏TR
AC
ER
CO
™Leve
lA
larm❏
TRA
CE
RC
O™
Co
ntam
inatio
nM
onito
r
Name:
JobTitle:
Company
Name:
Address:
City:Country:
PostCode:
Phone:Em
ail:
Tracerco
would
liketo
up
date
our
datab
asefo
r2
00
6.P
lease
com
ple
teth
ein
form
ation
belo
wto
registe
rfo
rco
pie
sof
the
Tracerco
New
s.
oTR
AC
ER
CO
Diagn
ostics ™
Tow
er
scano
TRA
CE
RC
OD
iagnostics ™
Sep
arator
stud
yo
TRA
CE
RC
OD
iagnostics ™
Distrib
utio
nstu
dy
oTR
AC
ER
CO
Diagn
ostics ™
FC
CU
Stu
dy
oTR
AC
ER
CO
Diagn
ostics ™
Leak
Stu
dy
oTR
AC
ER
CO
Diagn
ostics ™
Flo
wS
tud
y
oIw
ould
ow
ould
not
liketo
contin
ue
rece
iving
futu
reissu
es
of
Tracerco
New
s.
oIw
ould
liketo
sched
ule
anon-site
pre
sentatio
n.
Iamin
tere
sted
inad
ditio
nalin
form
ation
on
the
follo
win
g: