ACC Review DRAFT Yale Hydroelectric Project Entrainment ... · YALE ENTRAINMENT REPORT – ACC...
44
YALE ENTRAINMENT REPORT – ACC DRAFT ACC Review DRAFT Yale Hydroelectric Project Entrainment Final Report F. Shrier PacifiCorp Energy, Portland, Oregon M. Keefe T. Nightengale R2 Resources, Inc. Portland, Oregon and J. Doyle CH2M HILL, Portland, Oregon May 1, 2007
Transcript of ACC Review DRAFT Yale Hydroelectric Project Entrainment ... · YALE ENTRAINMENT REPORT – ACC...
YALE ENTRAINMENT REPORT – ACC DRAFT
ACC Review DRAFT
Yale Hydroelectric Project Entrainment Final Report
F. Shrier PacifiCorp Energy, Portland, Oregon
M. Keefe T. Nightengale
R2 Resources, Inc. Portland, Oregon and
J. Doyle CH2M HILL, Portland, Oregon
May 1, 2007
YALE ENTRAINMENT REPORT – ACC DRAFT
i
Table of Contents 1.0 Abstract........................................................................................................................ 6 2.0 Introduction................................................................................................................. 6 3.0 Study Site ..................................................................................................................... 7
3.1 Yale Dam and Reservoir ................................................................................... 7 4.0 Methods........................................................................................................................ 9
4.1 Underwater Video Design................................................................................. 9 4.2 Hydroacoustic Design ..................................................................................... 10 4.3 Data Analysis .................................................................................................. 12
4.3.1 Initial Data Processing ..................................................................... 12 4.3.2 Determination of Entrainment Area................................................. 12 4.3.3 Weighting of Fish in Entrainment Area ........................................... 17
4.3.4 Conversions of Target Strengths to Fish Lengths ........................................ 18 4.3.5 Entrainment Rates ........................................................................................ 18
5.0 Results ........................................................................................................................ 19 5.1 Study Flow Periods ......................................................................................... 19 5.2 Video Analysis ................................................................................................ 19 5.3 Fish Observations using the Hydroacoustics .................................................. 20 5.4 Fish Observations............................................................................................ 25
6.0 Discussion................................................................................................................... 33 6.1 Fish Entrainment Zone.................................................................................... 33 6.2 Entrainment Rates ........................................................................................... 33 6.3 Video Observations......................................................................................... 33 6.4 Hydroacoustics................................................................................................ 34 6.4.1 Entrainment Rates ........................................................................................ 34 6.4.2 Fish lengths .................................................................................................. 35
7.0 References .................................................................................................................. 39 Appendix 1 ....................................................................................................................... 41 Appendix 2. ...................................................................................................................... 42 Appendix 3a ..................................................................................................................... 43 Appendix 3a ..................................................................................................................... 43 Appendix 3b..................................................................................................................... 44

YALE ENTRAINMENT REPORT - DRAFT
ii
List of Tables Page Table 5-1. Weekly study periods with mean operational flows for Yale Dam Turbines 1 and 2 from November 24, 2005 to July 19, 2006……………………………………………………………….….22 Table 5-3. Flow-type periods with mean operational flows for Yale Dam Turbines 1 and 2 from November 24, 2005 to July 19, 2006. Total fish detected and estimated mean lengths of detected fish are also shown………………………………………………………………………………..27
YALE ENTRAINMENT REPORT - DRAFT
ii
List of Figures Page Figure 3.0-1. Map showing location of Yale Lake and the Lewis River Hydroelectric Projects…………………………………………………………………………………8 Figure 4.2-1. Schematic of one of the hydroacoustic transducer placement and
orientation in the Yale intake structure……………………………………………………………….11
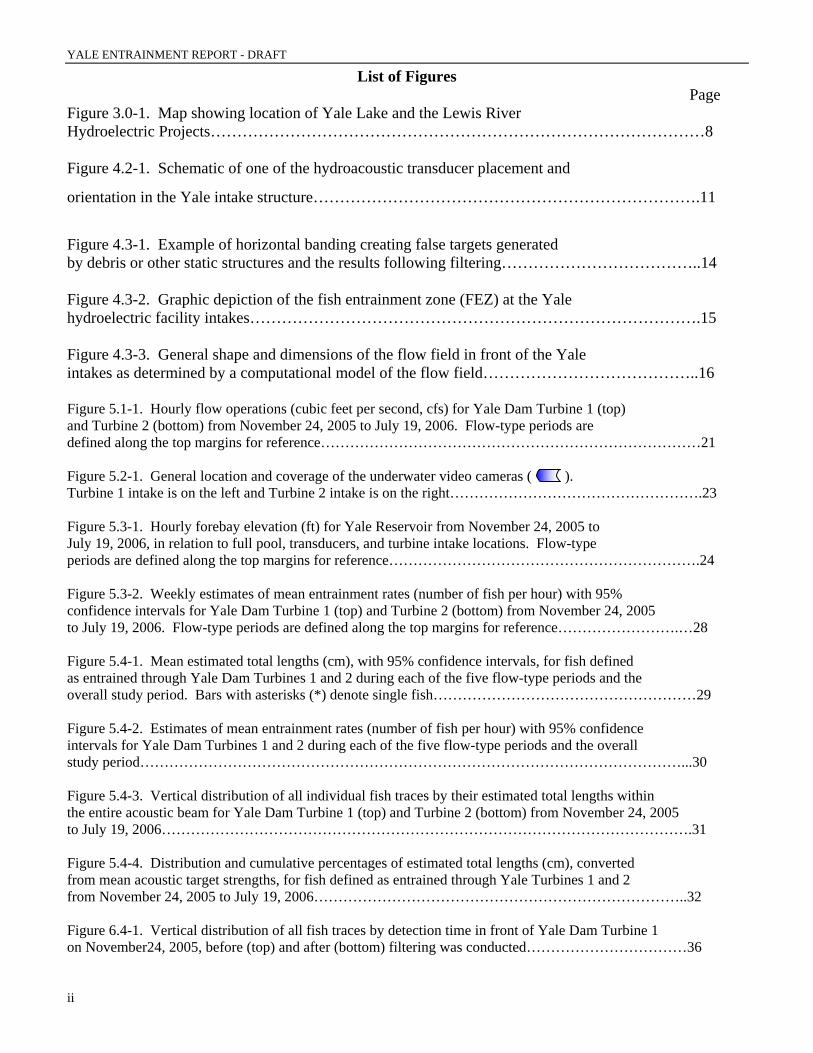
Figure 4.3-1. Example of horizontal banding creating false targets generated by debris or other static structures and the results following filtering………………………………..14 Figure 4.3-2. Graphic depiction of the fish entrainment zone (FEZ) at the Yale hydroelectric facility intakes………………………………………………………………………….15 Figure 4.3-3. General shape and dimensions of the flow field in front of the Yale intakes as determined by a computational model of the flow field…………………………………..16 Figure 5.1-1. Hourly flow operations (cubic feet per second, cfs) for Yale Dam Turbine 1 (top) and Turbine 2 (bottom) from November 24, 2005 to July 19, 2006. Flow-type periods are defined along the top margins for reference……………………………………………………………………21 Figure 5.2-1. General location and coverage of the underwater video cameras ( ). Turbine 1 intake is on the left and Turbine 2 intake is on the right…………………………………………….23 Figure 5.3-1. Hourly forebay elevation (ft) for Yale Reservoir from November 24, 2005 to July 19, 2006, in relation to full pool, transducers, and turbine intake locations. Flow-type periods are defined along the top margins for reference……………………………………………………….24 Figure 5.3-2. Weekly estimates of mean entrainment rates (number of fish per hour) with 95% confidence intervals for Yale Dam Turbine 1 (top) and Turbine 2 (bottom) from November 24, 2005 to July 19, 2006. Flow-type periods are defined along the top margins for reference…………………….…28 Figure 5.4-1. Mean estimated total lengths (cm), with 95% confidence intervals, for fish defined as entrained through Yale Dam Turbines 1 and 2 during each of the five flow-type periods and the overall study period. Bars with asterisks (*) denote single fish………………………………………………29 Figure 5.4-2. Estimates of mean entrainment rates (number of fish per hour) with 95% confidence intervals for Yale Dam Turbines 1 and 2 during each of the five flow-type periods and the overall study period…………………………………………………………………………………………………...30 Figure 5.4-3. Vertical distribution of all individual fish traces by their estimated total lengths within the entire acoustic beam for Yale Dam Turbine 1 (top) and Turbine 2 (bottom) from November 24, 2005 to July 19, 2006……………………………………………………………………………………………….31 Figure 5.4-4. Distribution and cumulative percentages of estimated total lengths (cm), converted from mean acoustic target strengths, for fish defined as entrained through Yale Turbines 1 and 2 from November 24, 2005 to July 19, 2006…………………………………………………………………..32 Figure 6.4-1. Vertical distribution of all fish traces by detection time in front of Yale Dam Turbine 1 on November24, 2005, before (top) and after (bottom) filtering was conducted……………………………36

YALE ENTRAINMENT REPORT - DRAFT
ii
List of Figures (continued) Page Figure 6.4-2. Vertical distribution of fish by their estimated total lengths within the defined zone of entrainment for Yale Dam Turbine 1 (top) and Turbine 2 (bottom) from November 24, 2005 to July 19, 2006……………………………………………………………………………………………………37
YALE ENTRAINMENT REPORT – ACC DRAFT
PAGE 6 OF 44
1.0 Abstract
The Lewis River Settlement Agreement calls for a study to evaluate bull trout entrainment at both Yale and Merwin hydroelectric projects and subsequently the development of an Entrainment Reduction Plan that minimizes negative impacts to bull trout and other species associated with entrainment. We investigated entrainment rates at Yale Hydroelectric Project using hydroacoustic equipment coupled with underwater video cameras. Hydroacoustics detections were filtered to eliminate debris and non-fish hits then analyzed in relation to a calculated fish entrainment zone. Overall fish were entrained at a rate of 0.19 fish per hour with a size range of 4.78 to 44.04 cm. Underwater cameras allowed us to observe only two fish that appeared to be kokanee. Based on the results and analysis of bull trout entrainment at Yale dam, we do not find there to be enough compelling evidence to warrant placement of an entrainment reduction device at Yale for the prevention of bull trout entrainment
2.0 Introduction
The Lewis River Settlement Agreement calls for a study to evaluate bull trout entrainment at both Yale and Merwin hydroelectric projects and subsequently the development of an Entrainment Reduction Plan that minimizes negative impacts to bull trout and other species associated with entrainment. Settlement Agreement Section 4.9.3 specifically describes evaluation of either strobe lights or a barrier net with submersible cork lines that could be designed to accommodate a Merwin-type floating trap (See Appendix 1). PacifiCorp has previously studied fish entrainment during relicensing of the Lewis River Hydroelectric Project. These past entrainment studies have provided useful information and guidance for designing a proposed entrainment study at Yale and Merwin dams. A brief summary of the pertinent information from these studies follows. The 1997 entrainment study at the Yale facility (PacifiCorp 1999) used hydroacoustics to evaluate fish entrainment that occurred over a four-month period extending from January through April. Entrainment rates during this time averaged approximately 21 fish per hour with a range of 40 to 180 fish per hour (unfiltered data). Estimated fish size ranged from 7 to 16 cm (2.75 to 6.30 inches). Fish were observed at higher frequencies in the upper, as opposed to lower, portion of the water column and also higher frequencies in the intake Bay 2 (Turbine 1) as compared to Bay 1 (Turbine 2). PacifiCorp also found the highest percent of the fish (60%) were entrained at the Turbine 1 intake. A 2002 entrainment study at Swift Dam (PacifiCorp 2004) used a rotary screw trap and fish salvage operations to capture fish downstream of Swift No.1 turbine discharge that were presumably entrained at Swift No. 1 and entered the Swift canal. The purpose of this study was to assess species composition and relative abundance of fish entrained in the Swift No. 1 project. This study identified 12 species of potentially entrained fish. The total number of entrained fish decreased from the start of the study in winter to the end of the study in summer. Three Bull trout were collected during spring and one during the summer sampling periods.
YALE ENTRAINMENT REPORT - DRAFT
Page 7 of 44
The approach to the SA Section 4.9.3 requirement was to evaluate current entrainment at the Yale intakes to obtain more recent information on fish sizes and numbers in order to make more informed recommendations for an entrainment reduction device. In order to do that, the 1997 entrainment study of the Yale facility was repeated with hydroacoustic equipment with underwater video cameras added. There were two major objectives established for this Study and approved by the Lewis River Aquatics Coordination Committee (ACC): 1) Evaluate fish entrainment into the turbine intakes at Yale and Merwin dams, and 2) Develop a draft Entrainment Reduction Plan for review by the ACC. We developed this report to address these two objectives and include a total of five (5) interrelated tasks that are described below. This report focuses on the Yale project in the near term both in the study phase and the entrainment reduction plan phase. Once an entrainment reduction plan is in place and actions at Yale implemented, the Merwin phase of this project will be addressed. That phase will include an assessment of the need for entrainment reduction at Merwin and, if that moves forward, then we will conduct an evaluation of applying the Yale plan and design to Merwin.
3.0 Study Site
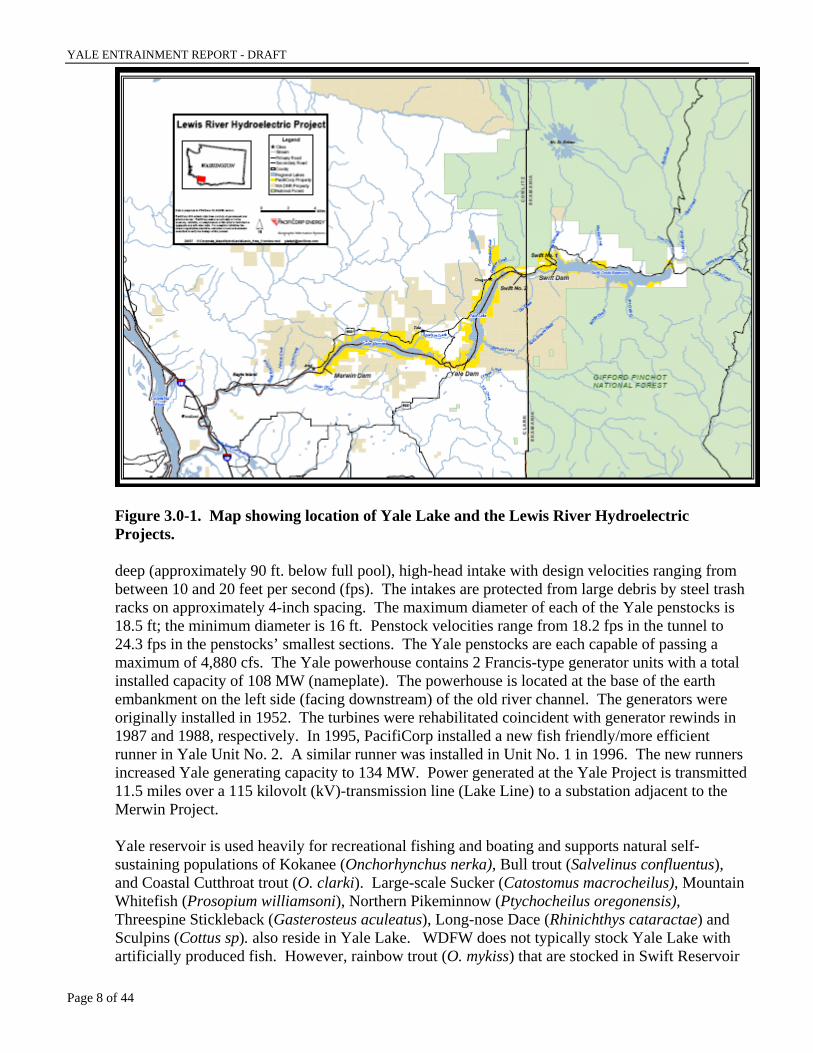
Our research was conducted at Yale dam along the mainstem Lewis River in Southwest Washington (Figure 3.0-1). Yale Dam is located on the North Fork Lewis River approximately 30 miles upstream from the confluence with the Columbia River. The Yale Hydroelectric Project is a 134 MW plant owned and operated by PacifiCorp that lies directly upstream of the Merwin Hydroelectric Project on the Lewis River. Construction of the Yale Project began in 1951 and was complete by 1953. The project consists of a main embankment dam, saddle dam, reservoir, penstocks, powerhouse, and transmission line. The Yale project is operated in coordination with the other three hydroelectric facilities (Merwin, Swift No. 2 and Swift No. 1) on the North Fork Lewis River.
3.1 Yale Dam and Reservoir
The main dam is a rolled earthen fill embankment type dam with a crest length of 1,305 ft and a height of 323 ft above its lowest foundation point. Its crest elevation is 503 ft-msl. The saddle dam is located ¼ mile west of the main dam and is approximately 1,600 ft long and 40 ft high with a crest elevation of 503 ft-msl. The main dam has a chute-type spillway, located in the right abutment, with a capacity of 120,000 cfs through five 30-foot by 39-foot taintor gates at reservoir elevation 490 ft-msl. Yale Lake is approximately 10.5 miles long with a surface area of approximately 3,800 acres at elevation 490 ft-msl (full pool). At full pool, the reservoir has a gross storage capacity of approximately 401,000 acre-ft. At the minimum pool elevation of 430 ft-msl, the reservoir has a capacity of approximately 190,000 acre-ft. The Yale Project consists of two tunnels/penstocks leading from Yale Dam to the powerhouse. Water is delivered to the tunnels/penstocks via a common intake. The intake for the Unit number 2 penstock is located on the intake gallery side nearest the spillway while the Unit number 1 penstock is located closest to the shoreline. The Yale intake is a relatively
YALE ENTRAINMENT REPORT - DRAFT
Page 8 of 44
Figure 3.0-1. Map showing location of Yale Lake and the Lewis River Hydroelectric Projects. deep (approximately 90 ft. below full pool), high-head intake with design velocities ranging from between 10 and 20 feet per second (fps). The intakes are protected from large debris by steel trash racks on approximately 4-inch spacing. The maximum diameter of each of the Yale penstocks is 18.5 ft; the minimum diameter is 16 ft. Penstock velocities range from 18.2 fps in the tunnel to 24.3 fps in the penstocks’ smallest sections. The Yale penstocks are each capable of passing a maximum of 4,880 cfs. The Yale powerhouse contains 2 Francis-type generator units with a total installed capacity of 108 MW (nameplate). The powerhouse is located at the base of the earth embankment on the left side (facing downstream) of the old river channel. The generators were originally installed in 1952. The turbines were rehabilitated coincident with generator rewinds in 1987 and 1988, respectively. In 1995, PacifiCorp installed a new fish friendly/more efficient runner in Yale Unit No. 2. A similar runner was installed in Unit No. 1 in 1996. The new runners increased Yale generating capacity to 134 MW. Power generated at the Yale Project is transmitted 11.5 miles over a 115 kilovolt (kV)-transmission line (Lake Line) to a substation adjacent to the Merwin Project. Yale reservoir is used heavily for recreational fishing and boating and supports natural self-sustaining populations of Kokanee (Onchorhynchus nerka), Bull trout (Salvelinus confluentus), and Coastal Cutthroat trout (O. clarki). Large-scale Sucker (Catostomus macrocheilus), Mountain Whitefish (Prosopium williamsoni), Northern Pikeminnow (Ptychocheilus oregonensis), Threespine Stickleback (Gasterosteus aculeatus), Long-nose Dace (Rhinichthys cataractae) and Sculpins (Cottus sp). also reside in Yale Lake. WDFW does not typically stock Yale Lake with artificially produced fish. However, rainbow trout (O. mykiss) that are stocked in Swift Reservoir
YALE ENTRAINMENT REPORT - DRAFT
Page 9 of 44
and Swift No. 2 power canal (just upstream of Yale Lake) occasionally enter Yale Lake through the upriver project turbines or through spill.
4.0 Methods
The following are ACC-approved sub tasks for this study: Task 1a. Investigate the Amount of Entrainment Occurring at Each Project Prior to Placement of a Barrier Net; and Task 1b. Determine if any of the Entrained Fish are Bull Trout. We combined these two tasks (Tasks 1a and 1b) to estimate both the number and species composition of fish being entrained into the Yale Dam intakes. For this, we used a combination of hydroacoustic and underwater video technologies. As stated earlier, investigations at Merwin follow Yale implementation. Hydroacoustic technology was used to determine the amount of entrainment that occurred, while sampling with an underwater video camera was used to determine the occurrence and relative proportion of bull trout that were entrained. Data from past Lewis River entrainment studies indicated that overall entrainment of small fish at Yale Dam can be high (40-180 fish per hour) during the winter and spring but drops off during the summer (PacifiCorp 1999) and also that three bull trout ( 75mm to 300mm) moved downstream in the Swift Canal during spring and summer (PacifiCorp 2004). Data from other Pacific Northwest rivers indicate that post-spawning adult bull trout migrate downstream in the fall (Wade and Tranquilli 2002; US Bureau of Reclamation 2004). Recent data from tagged bull trout in the Willamette River basin documented adult movement out of the Cougar reservoir during October (personal communication with Mark Wade, Oregon Department of Fish and Wildlife, Leaburg, OR). Based on these studies, a sampling window was selected that began in early October 2005 and continued into July 2006.
4.1 Underwater Video Design
To generate data relevant for species composition and species proportions of the fish entrained by the intakes, two SEA VIEW® underwater video cameras were mounted to the dam upstream of the intakes. The cameras were mounted and focused to cover as much as possible of the entrance to both intakes. The cameras were attached to the dam at the mouth of the intakes by commercial divers. The cameras were equipped with internal illumination. Since it was possible that the lighted camera at a depth of 70 feet would serve as a source of fish attraction, we minimized this concern by operating the camera for a brief period each day. In addition, the 24-hour hydroacoustic data was intended to be used to test the hypothesis that the use of the camera light does not alter the fish entrainment. With an 18-degree lens, each camera allowed coverage of an area approximately 20 feet wide by 10 feet deep, about one half of each intake opening. Past entrainment sampling at Yale found that the majority of fish moved through the upper half of the water column (PacifiCorp 2004). We therefore focused the cameras on the upper half of the water column within the intake. The
YALE ENTRAINMENT REPORT - DRAFT
Page 10 of 44
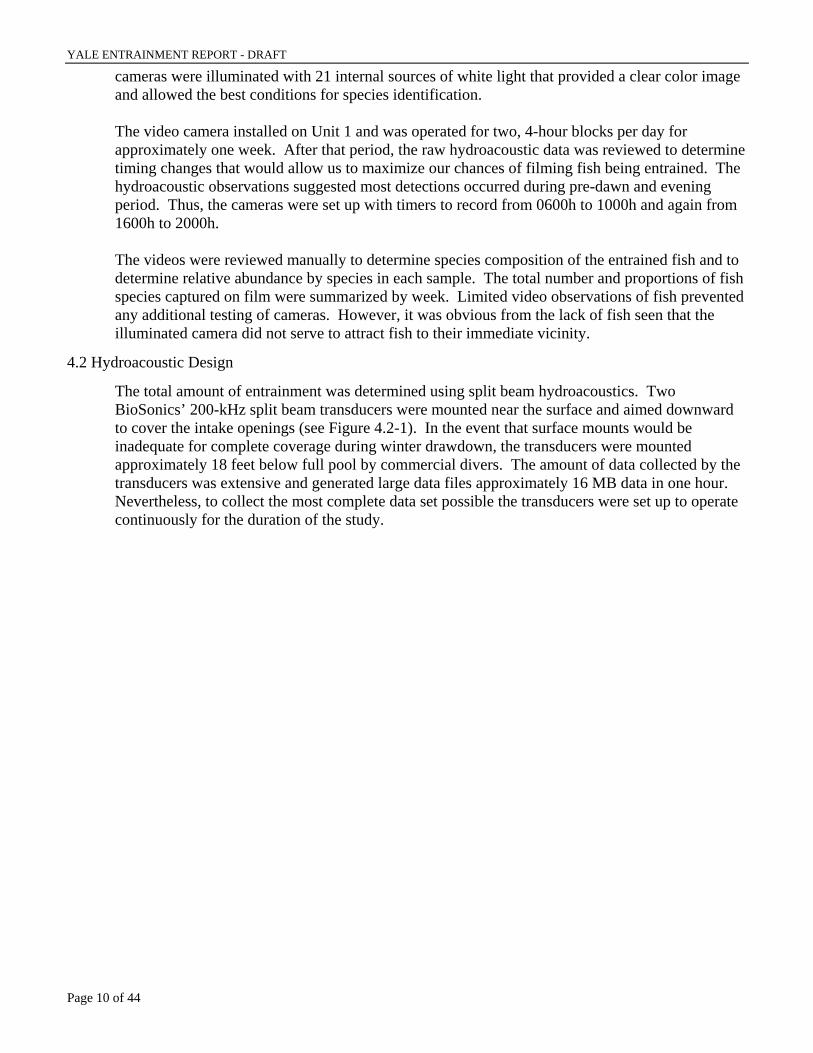
cameras were illuminated with 21 internal sources of white light that provided a clear color image and allowed the best conditions for species identification. The video camera installed on Unit 1 and was operated for two, 4-hour blocks per day for approximately one week. After that period, the raw hydroacoustic data was reviewed to determine timing changes that would allow us to maximize our chances of filming fish being entrained. The hydroacoustic observations suggested most detections occurred during pre-dawn and evening period. Thus, the cameras were set up with timers to record from 0600h to 1000h and again from 1600h to 2000h. The videos were reviewed manually to determine species composition of the entrained fish and to determine relative abundance by species in each sample. The total number and proportions of fish species captured on film were summarized by week. Limited video observations of fish prevented any additional testing of cameras. However, it was obvious from the lack of fish seen that the illuminated camera did not serve to attract fish to their immediate vicinity.
4.2 Hydroacoustic Design
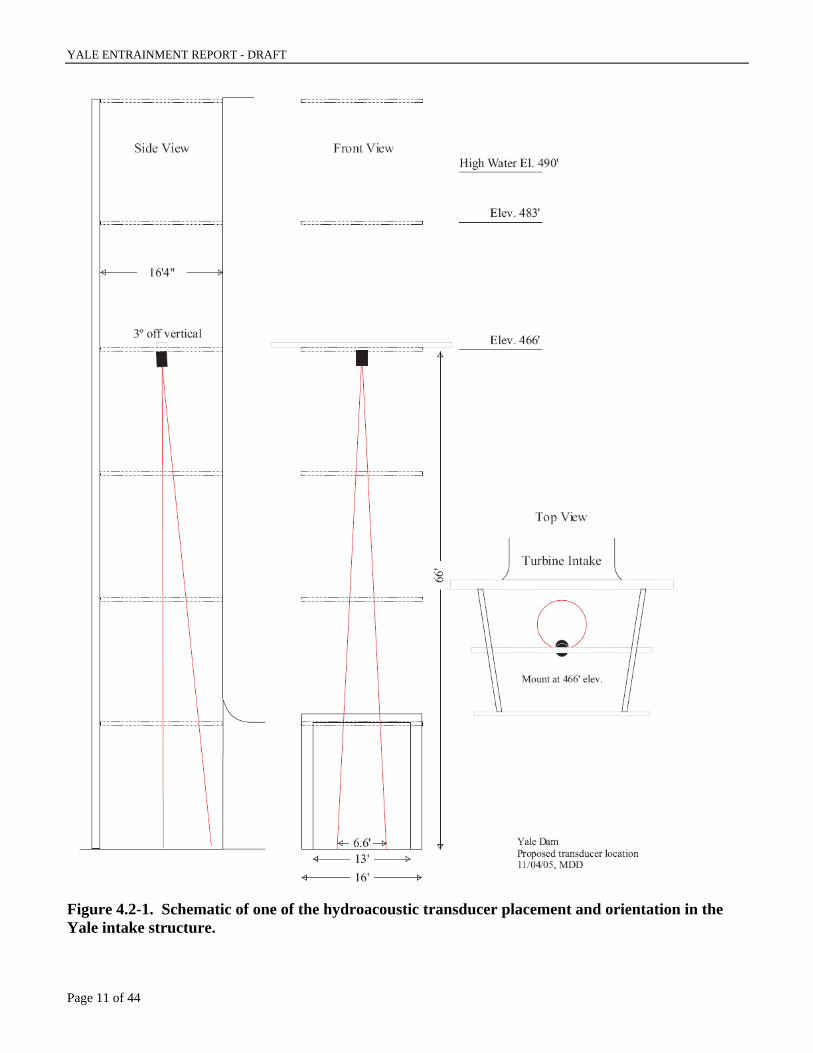
The total amount of entrainment was determined using split beam hydroacoustics. Two BioSonics’ 200-kHz split beam transducers were mounted near the surface and aimed downward to cover the intake openings (see Figure 4.2-1). In the event that surface mounts would be inadequate for complete coverage during winter drawdown, the transducers were mounted approximately 18 feet below full pool by commercial divers. The amount of data collected by the transducers was extensive and generated large data files approximately 16 MB data in one hour. Nevertheless, to collect the most complete data set possible the transducers were set up to operate continuously for the duration of the study.
YALE ENTRAINMENT REPORT - DRAFT
Page 11 of 44
Figure 4.2-1. Schematic of one of the hydroacoustic transducer placement and orientation in the Yale intake structure.
YALE ENTRAINMENT REPORT - DRAFT
Page 12 of 44
4.3 Data Analysis
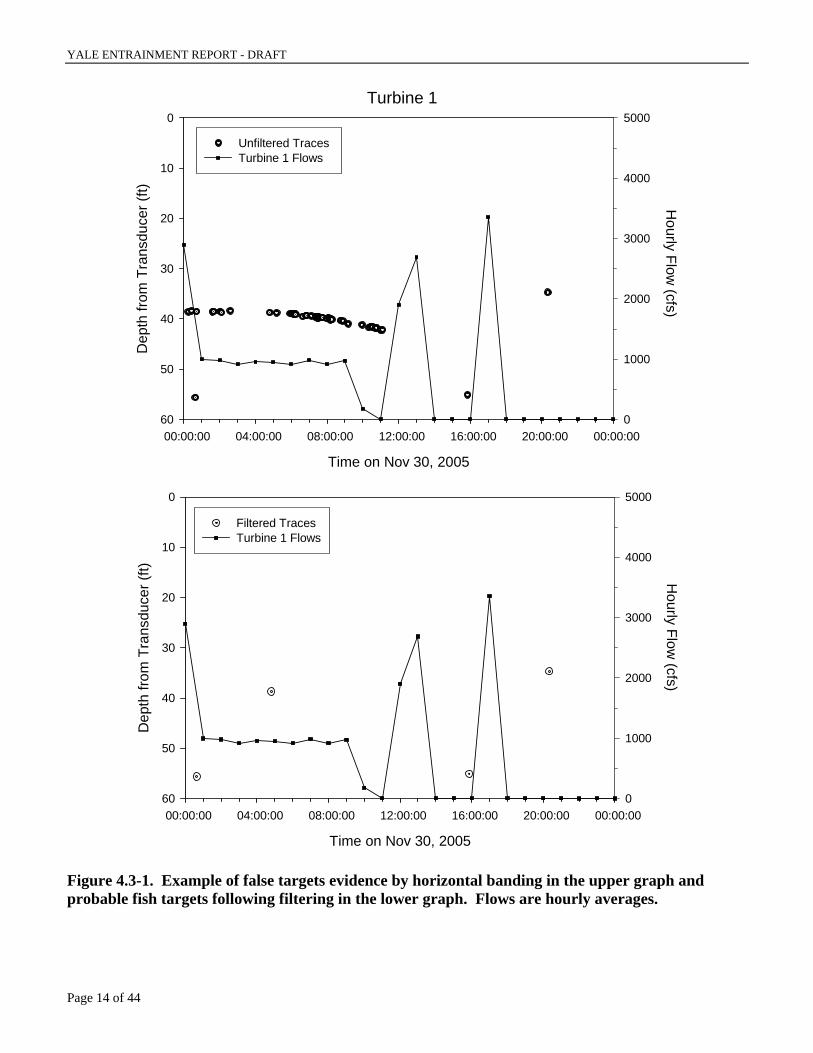
4.3.1 Initial Data Processing Hydroacoustic data was analyzed to determine daily and hourly entrainment rates. The split beam data also provided information on the direction of fish travel, the distribution of fish within each of the intakes, and acoustic size of the entrained fish. Acoustic data files were run through a 2-dimensional (time/range) trace formation program, as well as manually reviewed for erroneous records. Tracking parameters were determined by testing trace formation performance with those from manual analysis. The date/time, mean Target Strength (TS), and mid-range of each accepted fish trace was written to file, along with a host of other descriptive measurements. There was a large amount of debris entangled in the trash rack and support structures of the dam that created a high volume of false targets in the data files. To address false targets, post processing of the trace formation output was required. False targets generated by debris and other static structures are characterized by horizontal banding in the echograms (Figure 4.3-1). To eliminate these erroneous data, the trace formation output was analyzed for temporal and spatial peaks in target detection. After identifying the spatial and temporal peaks in false targets, the corresponding acoustic files were then reviewed to confirm the presence of debris interference. All targets matching the temporal and spatial location of the observed debris were filtered out of the dataset. Additional erroneous data was noted during periods when the turbine units were off and the wicket gates were closed. Since it is impossible for fish to be entrained during this time, the data was subject to a second layer of filtering that removes all targets collected during times when the corresponding turbine was non-operational, defined in this study as flows of less than 100 cfs.
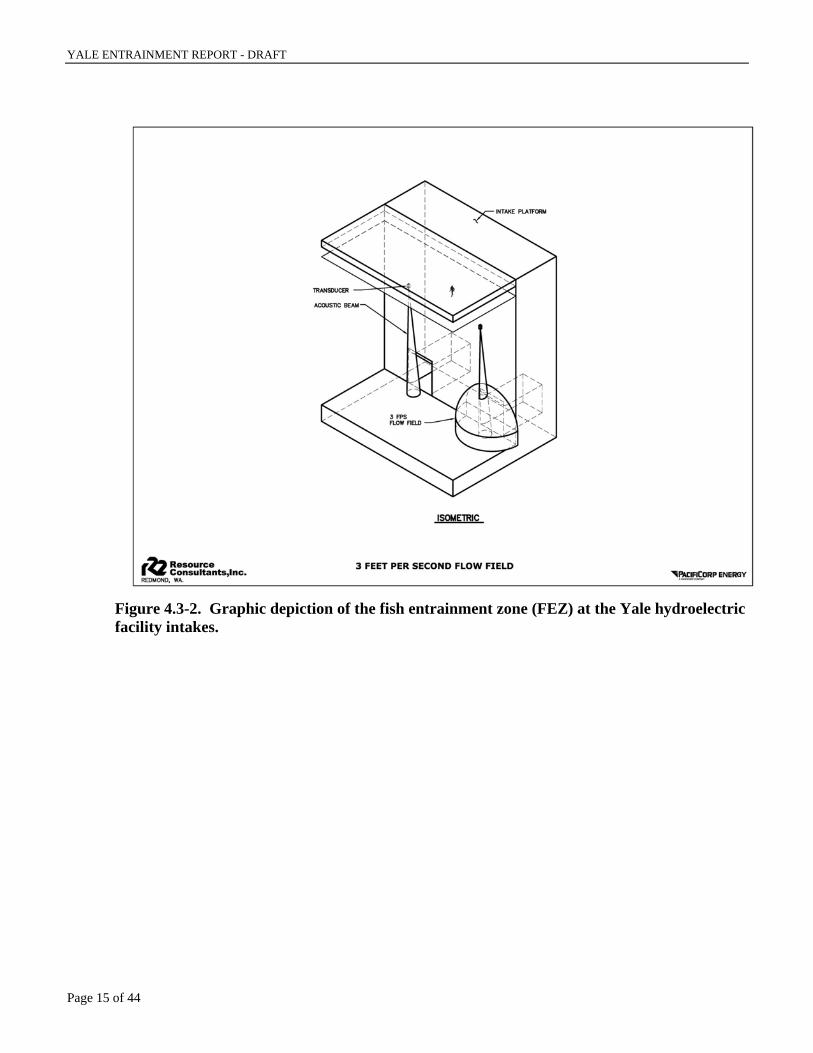
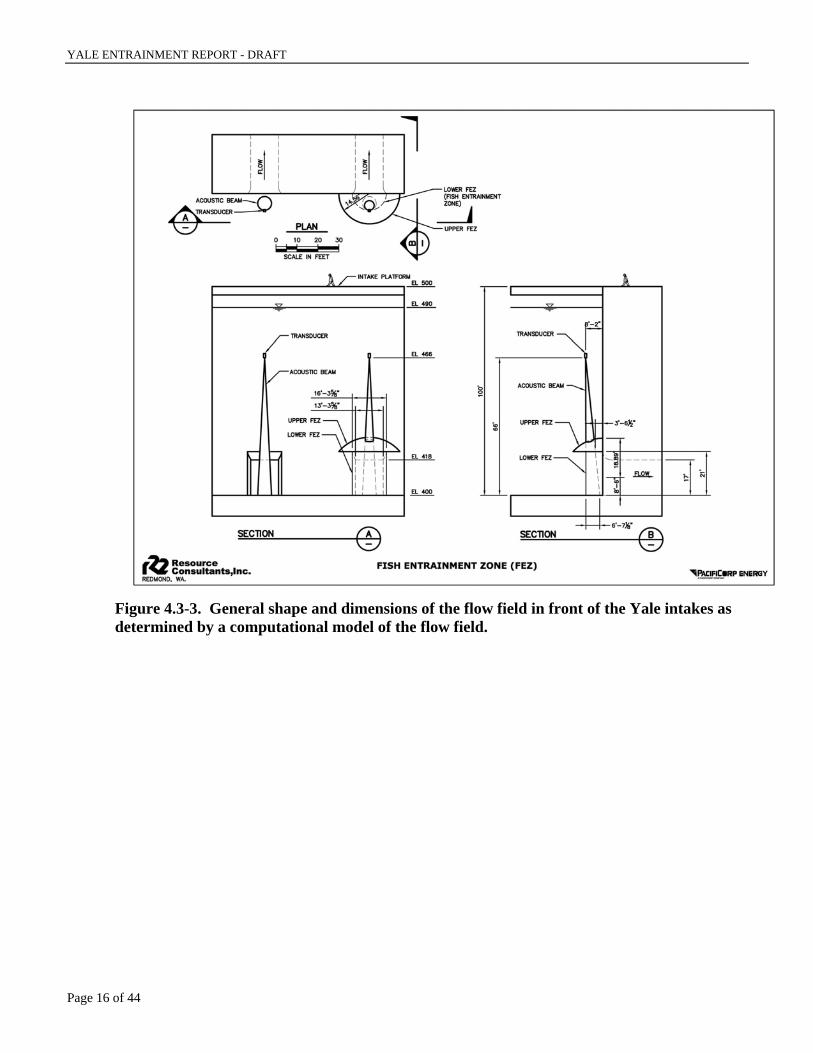
4.3.2 Determination of Entrainment Area The split-beam hydroacoustic units only covered a portion of the intake opening (Figure 4.2-1). In addition, due to their near surface mounting location targets were detected far as 41.6 ft above the intake in areas of estimated low flows. Thus, it was deemed inappropriate to equate filtered target data with entrained fish. Instead, we used an approach similar to that used in recent entrainment studies on the Columbia River (Simmons et al. 2006) and we defined a Fish Entrainment Zone (FEZ) (Figure 4.3-2). Hydroacoustic data was then adjusted, expanded or eliminated as described below, to account for entrained fish within the FEZ. No data were available to describe the water velocity in the vicinity the intakes; thus, a conceptual model of a flow field was generated. The general shape of the flow field was comprised of a half cylinder covering the intake opening topped by a wedge (Figure 4.3-3). This shape was similar to a Computational Fluid Dynamics model constructed for turbine intakes at Grand Coulee Dam (Simmons et al. 2006). A half cylinder extended from the floor to the top of the intake and out a radius of 8 ft into the forebay. We assumed that for the height and width of the intake opening, the flow would enter largely along horizontal vectors and that any fish entrained in this flow would pass through this half cylinder. Flow velocities inside the cylinder were estimated to be greater than 11.75 ft/sec (fps). For the upper portion of the FEZ, we defined a wedge with the following three borders: one below can be described as a horizontal plane that extended out from the top of the intake; the second was the defined by the side of the dam; and, a third was bounded
YALE ENTRAINMENT REPORT - DRAFT
Page 13 of 44
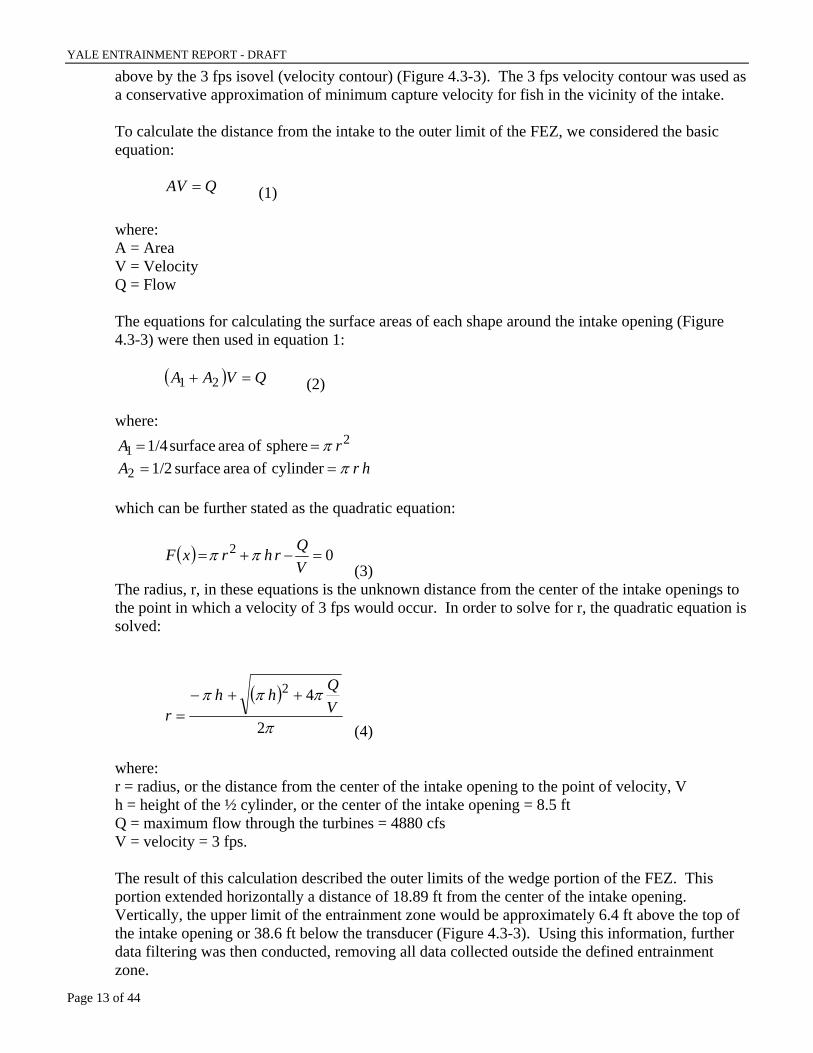
above by the 3 fps isovel (velocity contour) (Figure 4.3-3). The 3 fps velocity contour was used as a conservative approximation of minimum capture velocity for fish in the vicinity of the intake. To calculate the distance from the intake to the outer limit of the FEZ, we considered the basic equation: QAV = (1) where: A = Area V = Velocity Q = Flow The equations for calculating the surface areas of each shape around the intake opening (Figure 4.3-3) were then used in equation 1: ( ) QVAA =+ 21 (2) where:
2 1 sphere of area surface1/4 rA π== hrA π== cylinder of area surface 1/22
which can be further stated as the quadratic equation:
( ) 02 =−+=
VQrhrxF ππ
(3) The radius, r, in these equations is the unknown distance from the center of the intake openings to the point in which a velocity of 3 fps would occur. In order to solve for r, the quadratic equation is solved:
( )
π
πππ
2
42VQhh
r++−
= (4)
where: r = radius, or the distance from the center of the intake opening to the point of velocity, V h = height of the ½ cylinder, or the center of the intake opening = 8.5 ft Q = maximum flow through the turbines = 4880 cfs V = velocity = 3 fps. The result of this calculation described the outer limits of the wedge portion of the FEZ. This portion extended horizontally a distance of 18.89 ft from the center of the intake opening. Vertically, the upper limit of the entrainment zone would be approximately 6.4 ft above the top of the intake opening or 38.6 ft below the transducer (Figure 4.3-3). Using this information, further data filtering was then conducted, removing all data collected outside the defined entrainment zone.
YALE ENTRAINMENT REPORT - DRAFT
Page 14 of 44
Turbine 1
Time on Nov 30, 2005
00:00:00 04:00:00 08:00:00 12:00:00 16:00:00 20:00:00 00:00:00
Dep
th fr
om T
rans
duce
r (ft)
0
10
20
30
40
50
60
Hourly Flow
(cfs)
0
1000
2000
3000
4000
5000
Unfiltered Traces Turbine 1 Flows
Time on Nov 30, 2005
00:00:00 04:00:00 08:00:00 12:00:00 16:00:00 20:00:00 00:00:00
Dep
th fr
om T
rans
duce
r (ft)
0
10
20
30
40
50
60
Hourly Flow
(cfs)
0
1000
2000
3000
4000
5000
Filtered TracesTurbine 1 Flows
Figure 4.3-1. Example of false targets evidence by horizontal banding in the upper graph and probable fish targets following filtering in the lower graph. Flows are hourly averages.
YALE ENTRAINMENT REPORT - DRAFT
Page 15 of 44
Figure 4.3-2. Graphic depiction of the fish entrainment zone (FEZ) at the Yale hydroelectric facility intakes.
YALE ENTRAINMENT REPORT - DRAFT
Page 16 of 44
Figure 4.3-3. General shape and dimensions of the flow field in front of the Yale intakes as determined by a computational model of the flow field.
YALE ENTRAINMENT REPORT - DRAFT
Page 17 of 44
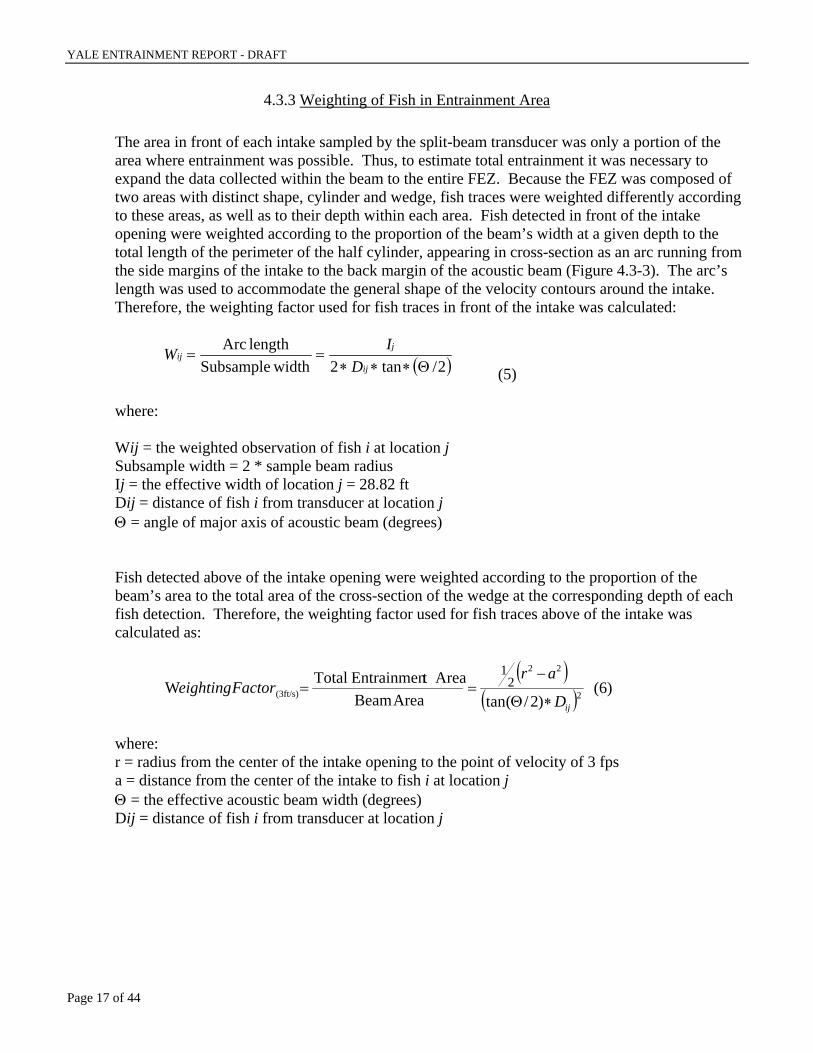
4.3.3 Weighting of Fish in Entrainment Area
The area in front of each intake sampled by the split-beam transducer was only a portion of the area where entrainment was possible. Thus, to estimate total entrainment it was necessary to expand the data collected within the beam to the entire FEZ. Because the FEZ was composed of two areas with distinct shape, cylinder and wedge, fish traces were weighted differently according to these areas, as well as to their depth within each area. Fish detected in front of the intake opening were weighted according to the proportion of the beam’s width at a given depth to the total length of the perimeter of the half cylinder, appearing in cross-section as an arc running from the side margins of the intake to the back margin of the acoustic beam (Figure 4.3-3). The arc’s length was used to accommodate the general shape of the velocity contours around the intake. Therefore, the weighting factor used for fish traces in front of the intake was calculated:
( )2/tan2 widthSubsamplelength Arc
Θ∗∗∗==
ij
jij
DIW
(5) where: Wij = the weighted observation of fish i at location j Subsample width = 2 * sample beam radius Ij = the effective width of location j = 28.82 ft Dij = distance of fish i from transducer at location j Θ = angle of major axis of acoustic beam (degrees) Fish detected above of the intake opening were weighted according to the proportion of the beam’s area to the total area of the cross-section of the wedge at the corresponding depth of each fish detection. Therefore, the weighting factor used for fish traces above of the intake was calculated as:
)(
( )222
(3ft/s) )2/(tanAreaBeam t AreaEntrainmen TotalW 2
1
ijD
arFactoreighting
∗Θ
−== (6)
where: r = radius from the center of the intake opening to the point of velocity of 3 fps a = distance from the center of the intake to fish i at location j Θ = the effective acoustic beam width (degrees) Dij = distance of fish i from transducer at location j
YALE ENTRAINMENT REPORT - DRAFT
Page 18 of 44
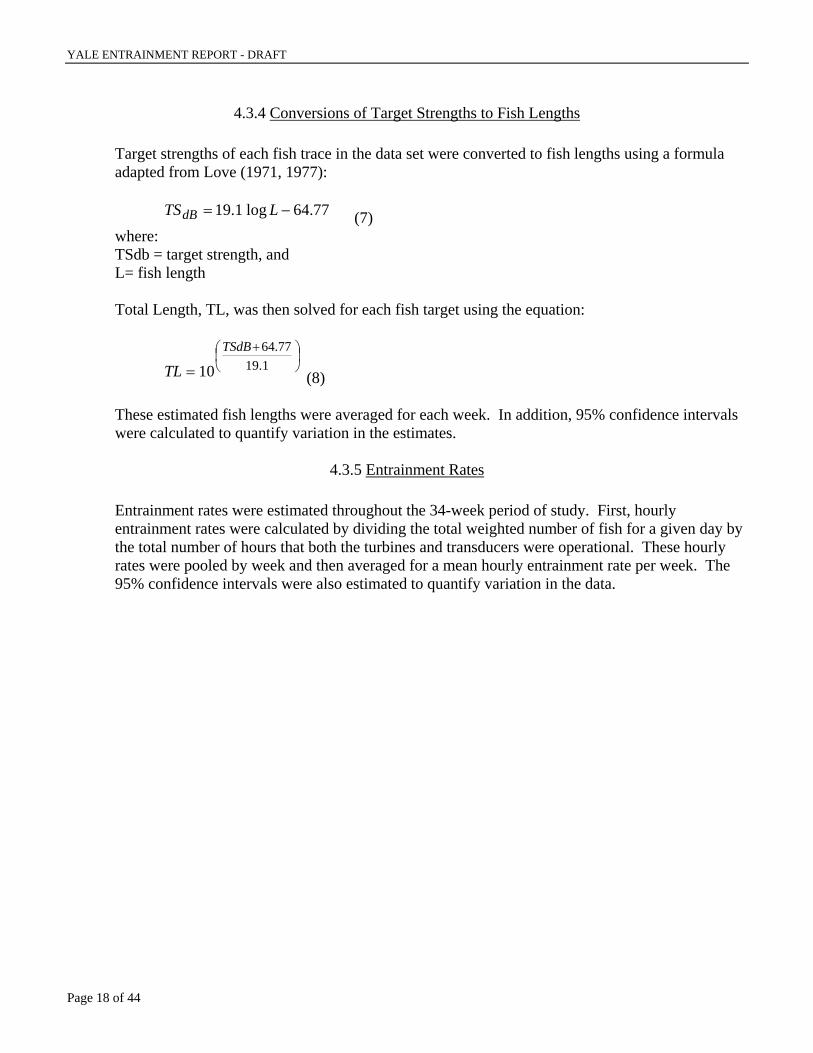
4.3.4 Conversions of Target Strengths to Fish Lengths Target strengths of each fish trace in the data set were converted to fish lengths using a formula adapted from Love (1971, 1977):
77.64log1.19 −= LTSdB (7) where: TSdb = target strength, and L= fish length Total Length, TL, was then solved for each fish target using the equation:
⎟⎠⎞
⎜⎝⎛ +
= 1.1977.64
10TSdB
TL (8) These estimated fish lengths were averaged for each week. In addition, 95% confidence intervals were calculated to quantify variation in the estimates.
4.3.5 Entrainment Rates Entrainment rates were estimated throughout the 34-week period of study. First, hourly entrainment rates were calculated by dividing the total weighted number of fish for a given day by the total number of hours that both the turbines and transducers were operational. These hourly rates were pooled by week and then averaged for a mean hourly entrainment rate per week. The 95% confidence intervals were also estimated to quantify variation in the data.
YALE ENTRAINMENT REPORT – ACC DRAFT
PAGE 19 OF 44
5.0 Results
5.1 Study Flow Periods
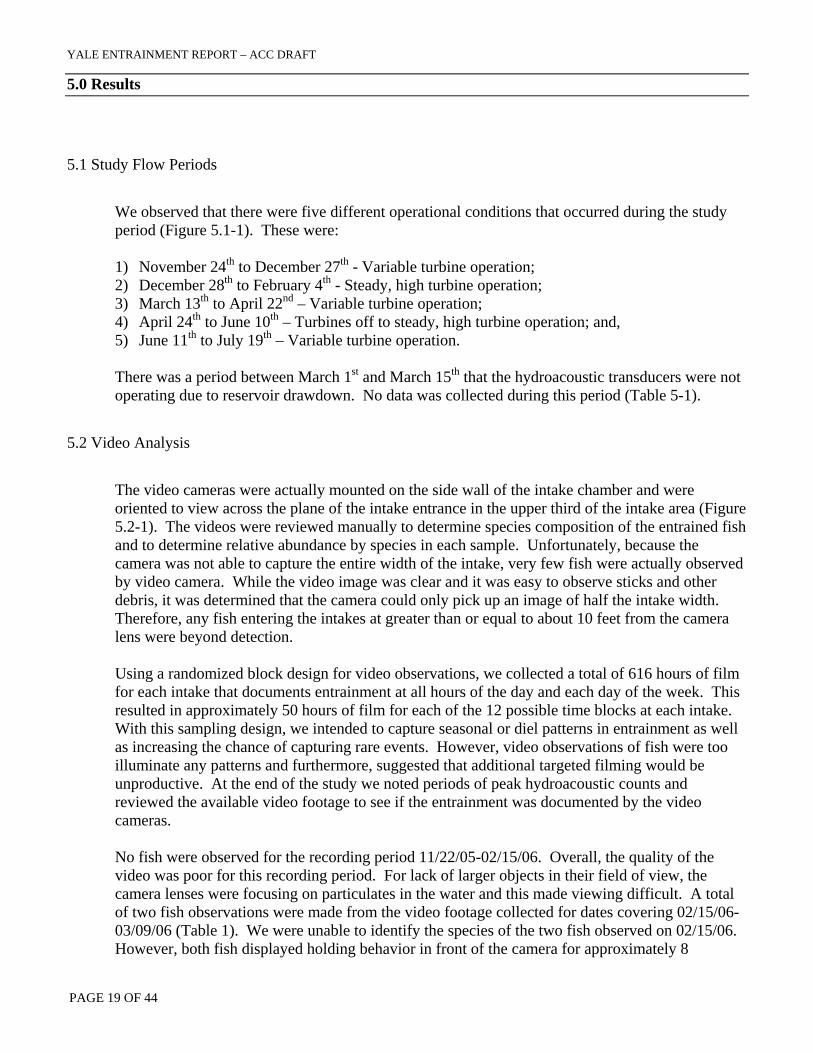
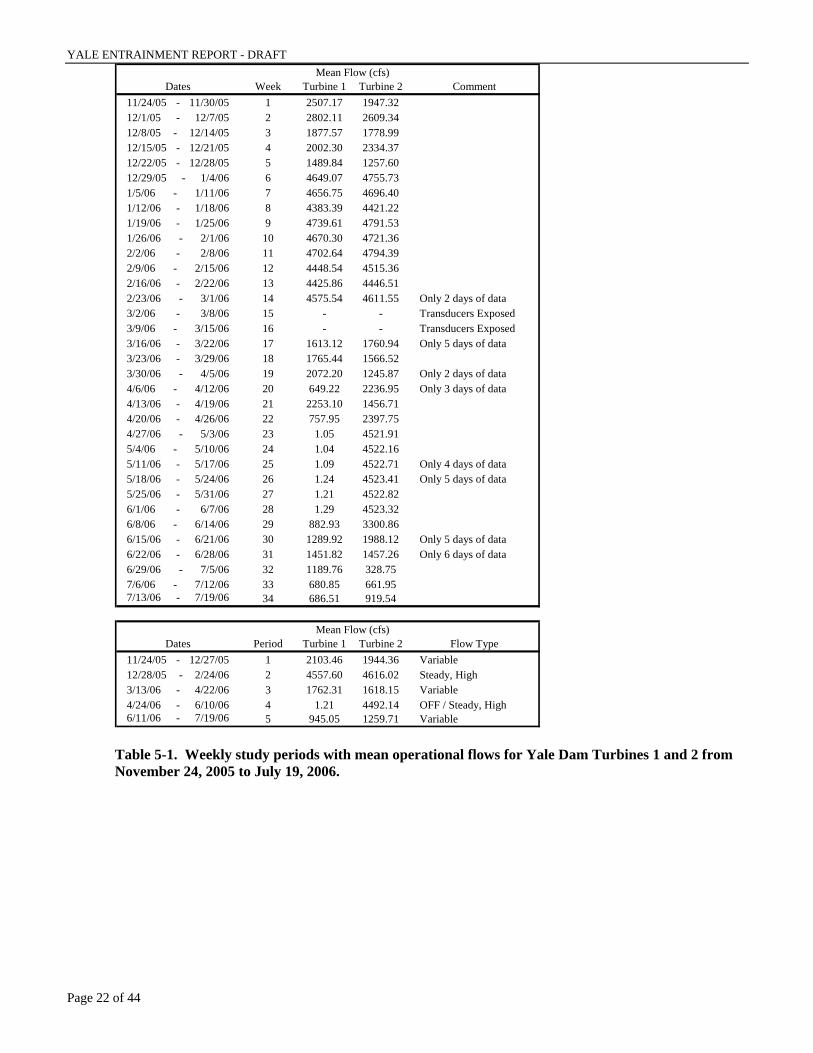
We observed that there were five different operational conditions that occurred during the study period (Figure 5.1-1). These were: 1) November 24th to December 27th - Variable turbine operation; 2) December 28th to February 4th - Steady, high turbine operation; 3) March 13th to April 22nd – Variable turbine operation; 4) April 24th to June 10th – Turbines off to steady, high turbine operation; and, 5) June 11th to July 19th – Variable turbine operation.
There was a period between March 1st and March 15th that the hydroacoustic transducers were not operating due to reservoir drawdown. No data was collected during this period (Table 5-1).
5.2 Video Analysis
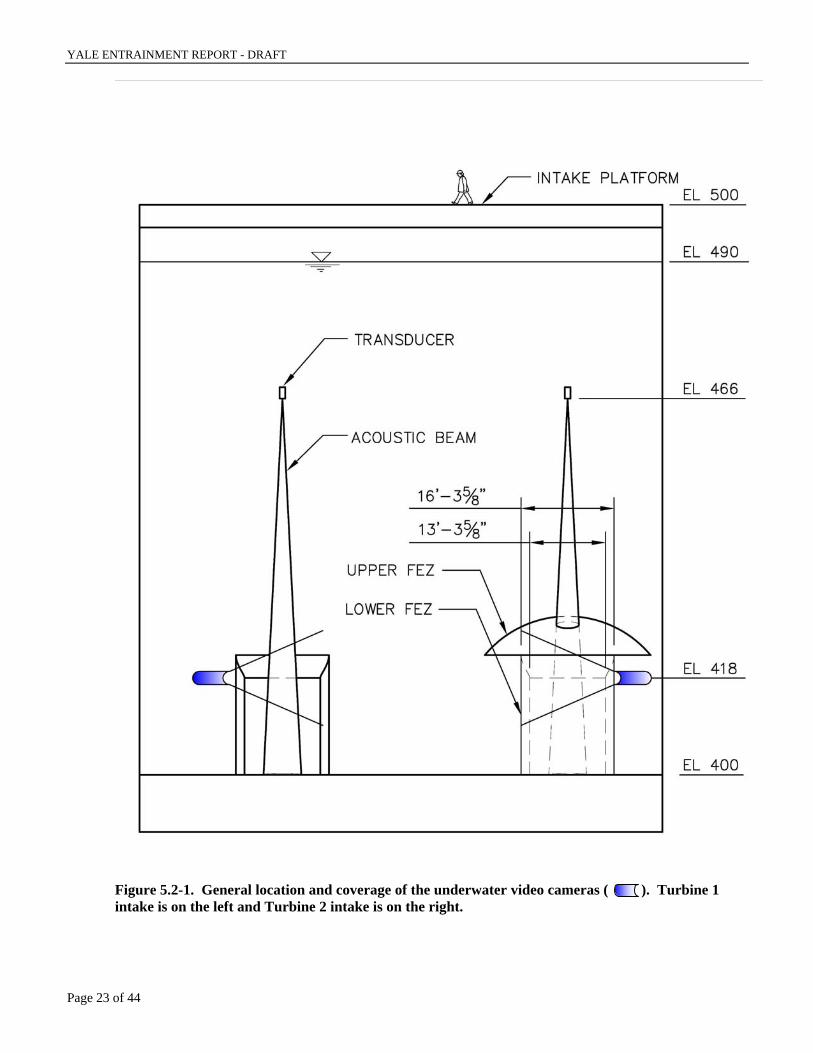
The video cameras were actually mounted on the side wall of the intake chamber and were oriented to view across the plane of the intake entrance in the upper third of the intake area (Figure 5.2-1). The videos were reviewed manually to determine species composition of the entrained fish and to determine relative abundance by species in each sample. Unfortunately, because the camera was not able to capture the entire width of the intake, very few fish were actually observed by video camera. While the video image was clear and it was easy to observe sticks and other debris, it was determined that the camera could only pick up an image of half the intake width. Therefore, any fish entering the intakes at greater than or equal to about 10 feet from the camera lens were beyond detection. Using a randomized block design for video observations, we collected a total of 616 hours of film for each intake that documents entrainment at all hours of the day and each day of the week. This resulted in approximately 50 hours of film for each of the 12 possible time blocks at each intake. With this sampling design, we intended to capture seasonal or diel patterns in entrainment as well as increasing the chance of capturing rare events. However, video observations of fish were too illuminate any patterns and furthermore, suggested that additional targeted filming would be unproductive. At the end of the study we noted periods of peak hydroacoustic counts and reviewed the available video footage to see if the entrainment was documented by the video cameras. No fish were observed for the recording period 11/22/05-02/15/06. Overall, the quality of the video was poor for this recording period. For lack of larger objects in their field of view, the camera lenses were focusing on particulates in the water and this made viewing difficult. A total of two fish observations were made from the video footage collected for dates covering 02/15/06-03/09/06 (Table 1). We were unable to identify the species of the two fish observed on 02/15/06. However, both fish displayed holding behavior in front of the camera for approximately 8

YALE ENTRAINMENT REPORT - DRAFT
Page 20 of 44
seconds. The fish observed on 02/28/06 appeared to be a Kokanee salmon. No fish were recorded by the video at the times indicated as peak entrainment periods based on hydroacoustic data.
5.3 Fish Observations using the Hydroacoustics
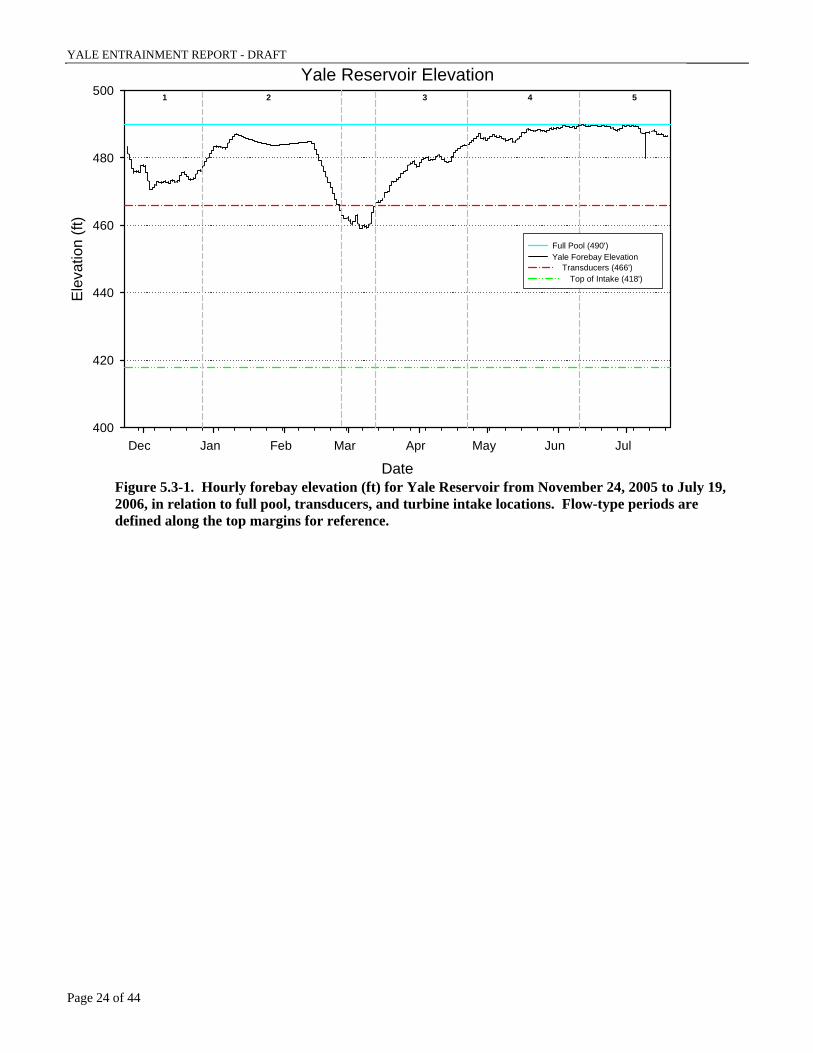
Operation of the video and hydroacoustic monitoring began on November 22, 2005 and ended on July 27, 2006. Reservoir elevations during the study period ranged from a low of approximately 460 ft-msl to full pool at 490 ft-msl (Figure 5.3-1). During the March period, water level in the reservoir was reduced to below the transducer level in order to complete some Swift No. 2 canal
YALE ENTRAINMENT REPORT - DRAFT
Page 21 of 44
Turbine 1
Date
Dec Jan Feb Mar Apr May Jun Jul
Flow
(cfs
)
0
1000
2000
3000
4000
5000
Turbine 2
Date
Dec Jan Feb Mar Apr May Jun Jul
Flow
(cfs
)
0
1000
2000
3000
4000
5000
1 2 3 4 5
1 2 3 4 5
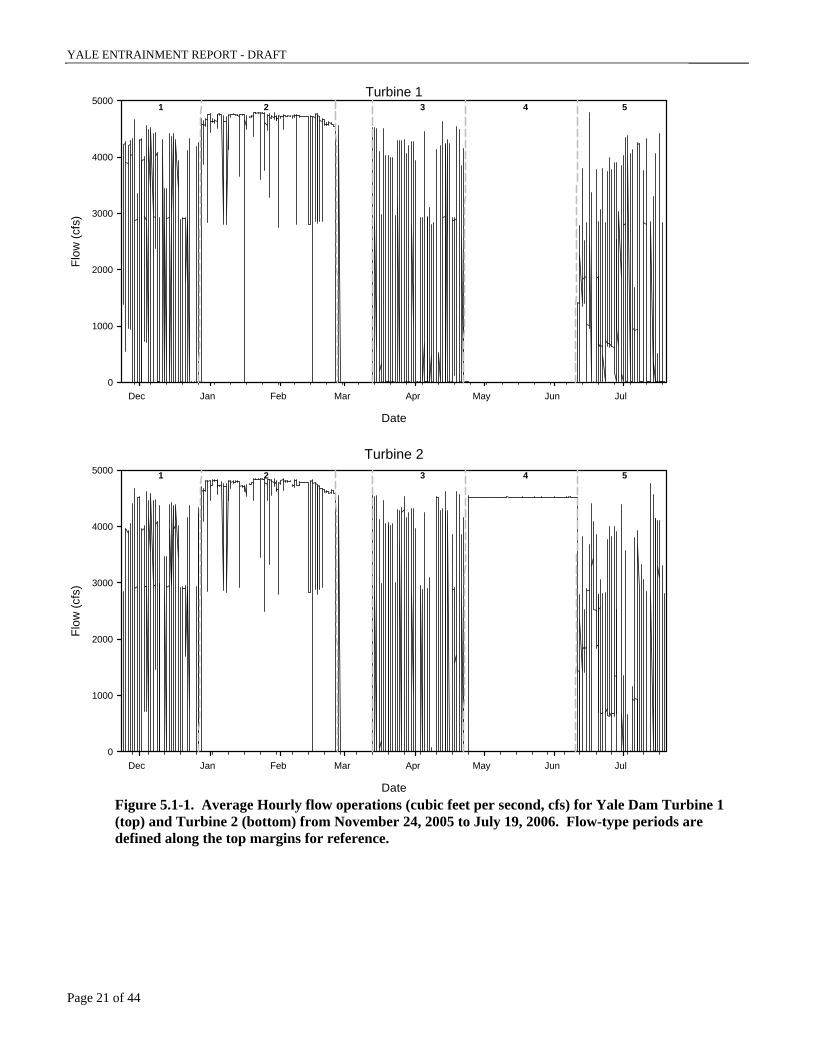
Figure 5.1-1. Average Hourly flow operations (cubic feet per second, cfs) for Yale Dam Turbine 1 (top) and Turbine 2 (bottom) from November 24, 2005 to July 19, 2006. Flow-type periods are defined along the top margins for reference.
YALE ENTRAINMENT REPORT - DRAFT
Page 22 of 44
Dates Week Turbine 1 Turbine 2 Comment11/24/05 - 11/30/05 1 2507.17 1947.3212/1/05 - 12/7/05 2 2802.11 2609.3412/8/05 - 12/14/05 3 1877.57 1778.9912/15/05 - 12/21/05 4 2002.30 2334.3712/22/05 - 12/28/05 5 1489.84 1257.6012/29/05 - 1/4/06 6 4649.07 4755.731/5/06 - 1/11/06 7 4656.75 4696.401/12/06 - 1/18/06 8 4383.39 4421.221/19/06 - 1/25/06 9 4739.61 4791.531/26/06 - 2/1/06 10 4670.30 4721.362/2/06 - 2/8/06 11 4702.64 4794.392/9/06 - 2/15/06 12 4448.54 4515.362/16/06 - 2/22/06 13 4425.86 4446.512/23/06 - 3/1/06 14 4575.54 4611.55 Only 2 days of data3/2/06 - 3/8/06 15 - - Transducers Exposed3/9/06 - 3/15/06 16 - - Transducers Exposed3/16/06 - 3/22/06 17 1613.12 1760.94 Only 5 days of data3/23/06 - 3/29/06 18 1765.44 1566.523/30/06 - 4/5/06 19 2072.20 1245.87 Only 2 days of data4/6/06 - 4/12/06 20 649.22 2236.95 Only 3 days of data4/13/06 - 4/19/06 21 2253.10 1456.714/20/06 - 4/26/06 22 757.95 2397.754/27/06 - 5/3/06 23 1.05 4521.915/4/06 - 5/10/06 24 1.04 4522.165/11/06 - 5/17/06 25 1.09 4522.71 Only 4 days of data5/18/06 - 5/24/06 26 1.24 4523.41 Only 5 days of data5/25/06 - 5/31/06 27 1.21 4522.826/1/06 - 6/7/06 28 1.29 4523.326/8/06 - 6/14/06 29 882.93 3300.866/15/06 - 6/21/06 30 1289.92 1988.12 Only 5 days of data6/22/06 - 6/28/06 31 1451.82 1457.26 Only 6 days of data6/29/06 - 7/5/06 32 1189.76 328.757/6/06 - 7/12/06 33 680.85 661.957/13/06 - 7/19/06 34 686.51 919.54
Dates Period Turbine 1 Turbine 2 Flow Type11/24/05 - 12/27/05 1 2103.46 1944.36 Variable12/28/05 - 2/24/06 2 4557.60 4616.02 Steady, High3/13/06 - 4/22/06 3 1762.31 1618.15 Variable4/24/06 - 6/10/06 4 1.21 4492.14 OFF / Steady, High 6/11/06 - 7/19/06 5 945.05 1259.71 Variable
Mean Flow (cfs)
Mean Flow (cfs)
Table 5-1. Weekly study periods with mean operational flows for Yale Dam Turbines 1 and 2 from November 24, 2005 to July 19, 2006.
YALE ENTRAINMENT REPORT - DRAFT
Page 23 of 44
Figure 5.2-1. General location and coverage of the underwater video cameras ( ). Turbine 1 intake is on the left and Turbine 2 intake is on the right.
YALE ENTRAINMENT REPORT - DRAFT
Page 24 of 44
Yale Reservoir Elevation
DateDec Jan Feb Mar Apr May Jun Jul
Ele
vatio
n (ft
)
400
420
440
460
480
500 1 2 3 4 5
Yale Forebay Elevation Full Pool (490')
Transducers (466')Top of Intake (418')
Figure 5.3-1. Hourly forebay elevation (ft) for Yale Reservoir from November 24, 2005 to July 19, 2006, in relation to full pool, transducers, and turbine intake locations. Flow-type periods are defined along the top margins for reference.
YALE ENTRAINMENT REPORT - DRAFT
Page 25 of 44
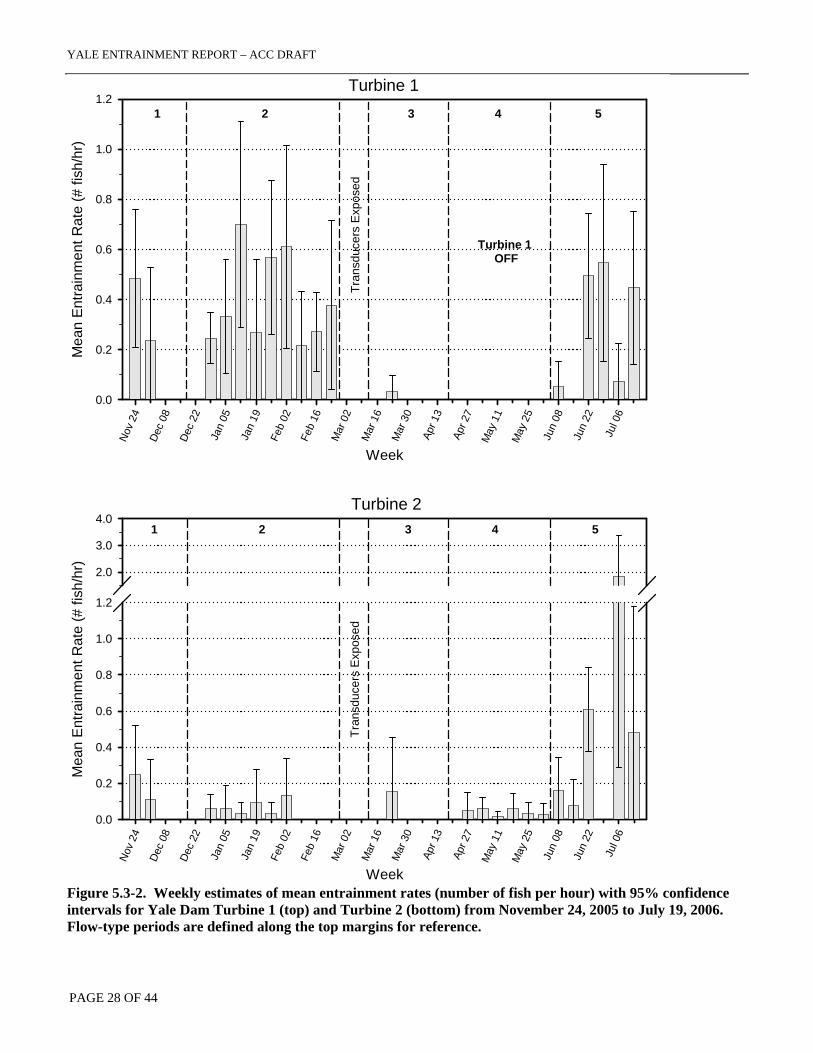
construction. Therefore the transducers were shut down during this period and no entrainment was evaluated. Mean hourly entrainment rates and 95% confidence intervals were also calculated in a similar fashion for each of five flow periods defined during the course of the study (Table 5-3). The transducer over the Turbine 1 intake collected data for a total of 4,885 hrs during the 34-week study period. The amount of this time in which the turbine was ON (flows >100 cfs) totaled 2,741 hours, indicating that Turbine 1 was operational 56.1% of the total monitoring time during the study. The Turbine 2 transducer collected data for a total of 4,789 hrs during the 34-week study period. The amount of this time in which the turbine was ON (flows >100 cfs) totaled 3,671 hours, indicating that Turbine 2 was operational 76.7% of the total monitoring time during the study. Hydroacoustic data was analyzed to determine daily and hourly entrainment rates. The split beam data also provided information on the distribution of fish within the water column and acoustic size of the entrained fish. A total of 2,741 hours of acoustic observations at the Turbine 1 intake and 3,671 hours at the Turbine 2 intake were logged when the units were on (Table 5-3). During the observation period, 207 fish targets were detected by the hydroacoustic transducers. This number was expanded to approximately 1,132 fish entrained during the study period. The expanded number of detections at Turbine 1 was 795.76 fish, and 336.15 fish at Turbine 2. The majority of the fish (69.6%) were observed entering the intake bay to Turbine 1 (Figure 5.3-2).
5.4 Fish Observations
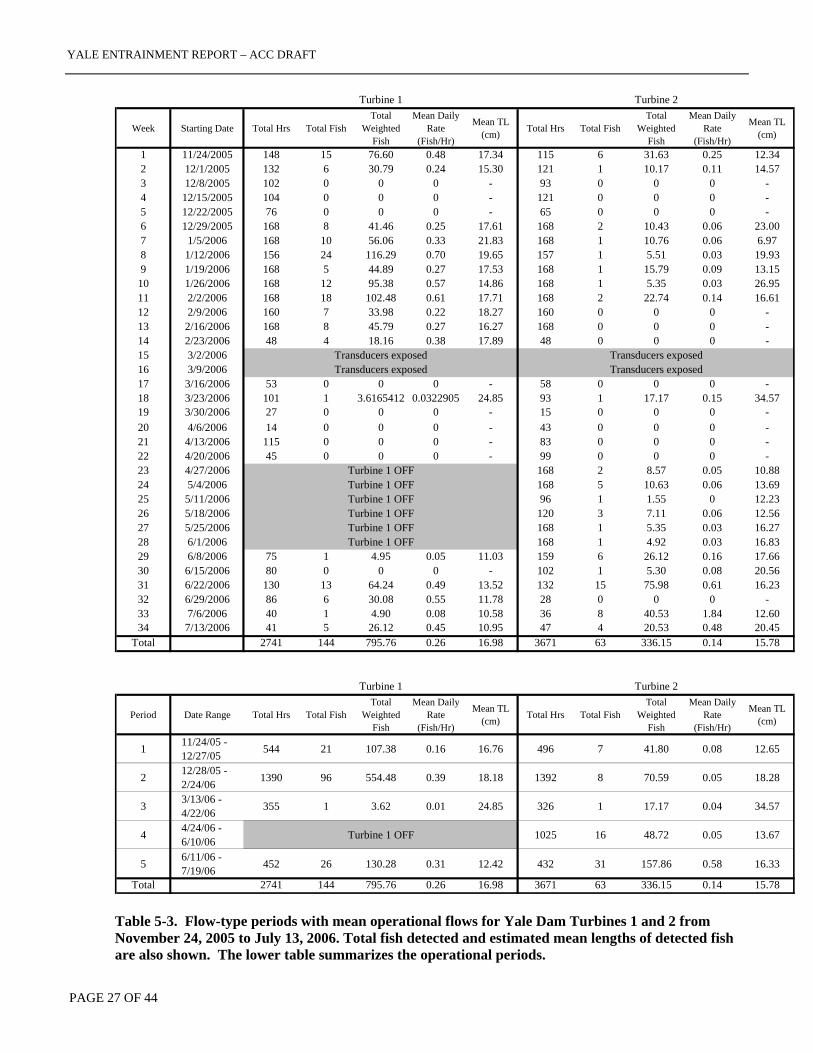
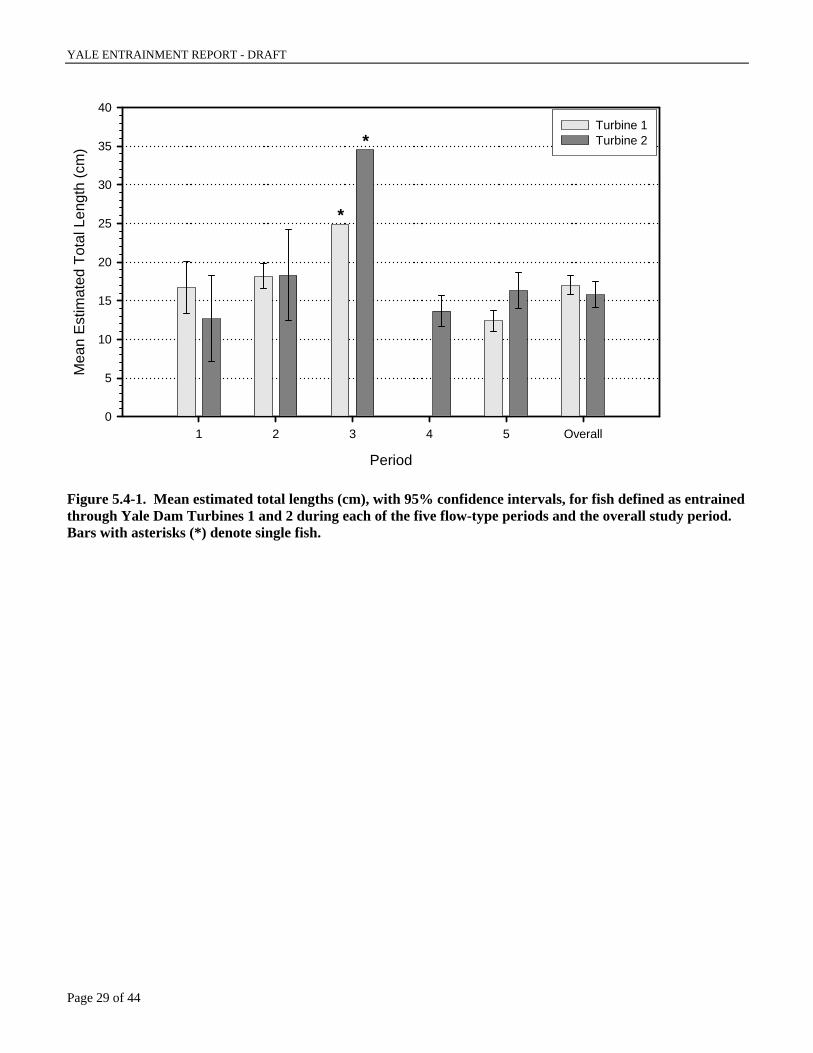
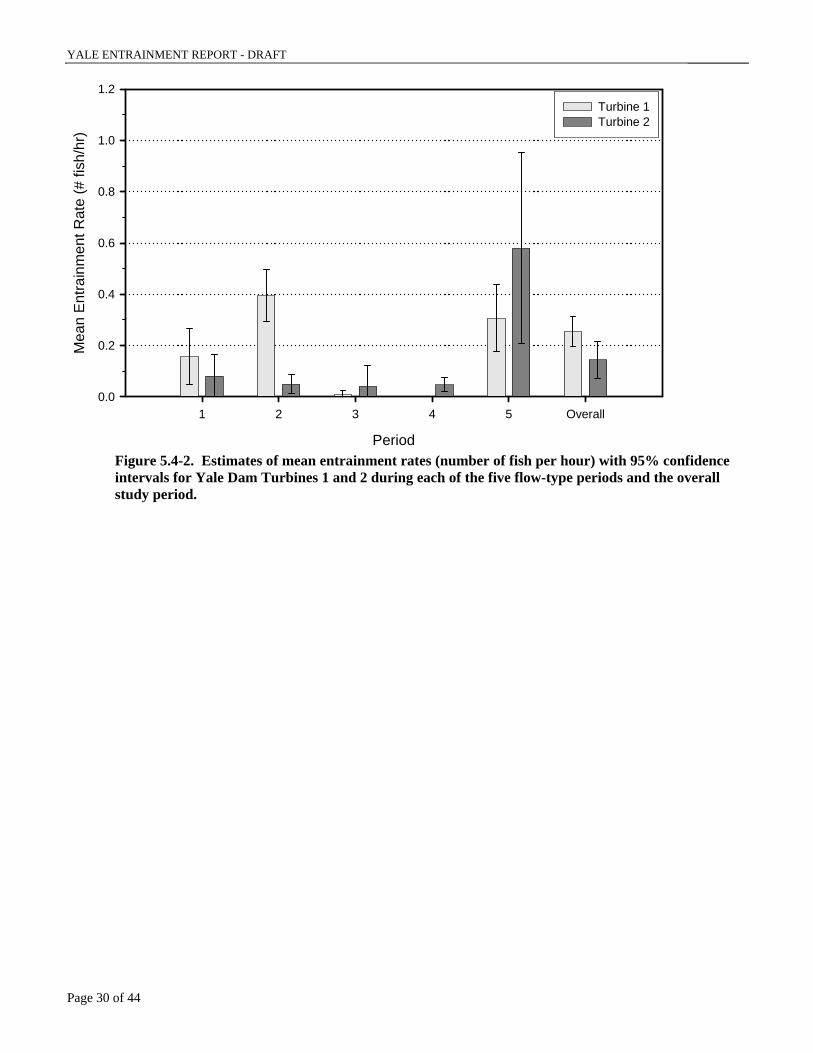
Estimated fish lengths were then averaged for each week, and for each of five distinct flow periods that occurred during the course of the study (Figure 5.4-1). In addition, 95% confidence intervals were calculated to quantify variation in the estimates (Table 5-3). The estimated total length for the 144 observed fish at Turbine 1 averaged 18.47 ±1.35 cm (7.3 in), with a range of 4.78 cm to 44.04 cm. Not included in this analysis was one 80 cm fish that briefly moved into and out of the intake area at about 28 feet below the transducer. For Turbine 2 the estimated total length for the 63 entrained fish averaged 17.17 ±1.84 cm (6.8 in), with a range of 4.94 cm to 37.62 cm. One 69 cm fish also briefly entered and left the Turbine 2 area also at about 28 feet below the transducer. Hourly entrainment rates averaged 0.26 fish/hr at Turbine 1, with the highest rate (0.70 ±0.41 fish/hr) occurring during Week 8 (January 2006) and during Flow-type Period 2 (0.39 ±0.10 fish/hr). At Turbine 2 hourly entrainment rates averaged 0.14 fish/hr, with the highest rate (1.84 ±1.55 fish/hr) occurring during Week 33 and during Flow-type Period 5 (0.58 ±0.37 fish/hr). These higher rates were the result of three days in July when fish were detected during only 1-6 hours of monitoring time. For example, July 8, 2006 recorded only 1 hour of data, during which time one fish was detected. The hourly entrainment rate for that day was then expanded to 5.0 fish/hr. The 95% confidence intervals surrounding the estimated rates are an indication of large amount of variability in the data for Turbine 2 during these weeks and this period (Figure 5.4-2). Overall entrainment averaged for the two intakes was 0.1927 +/- 0.0484 (range 0.1443-0.2411) fish per hour combined over the entire study period. That equates to an annual estimate with a 95% CI that ranges from 1264 to 2112 fish/yr, averaging 1688 fish/yr.
YALE ENTRAINMENT REPORT - DRAFT
Page 26 of 44
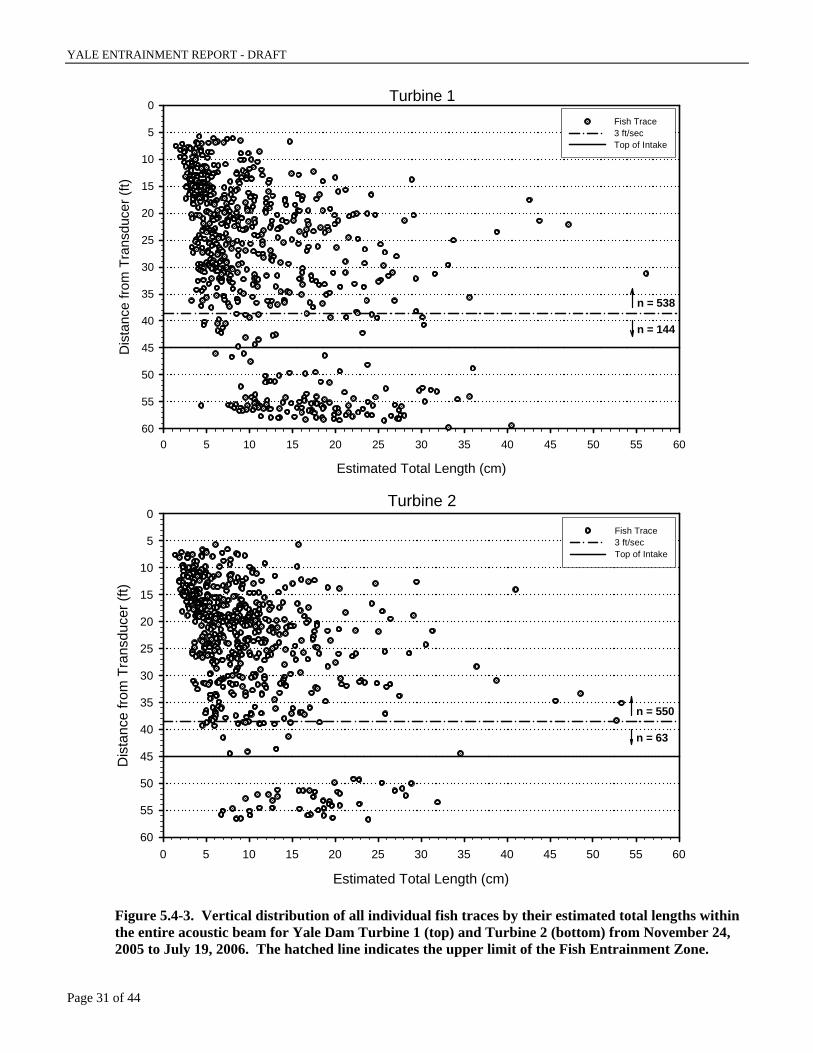
The upper limit of the zone of entrainment was calculated to be a distance of 18.89 ft from the center of the intake opening. Extended vertically, the upper limit of the entrainment zone would be approximately 38.6 ft from the transducer, or 6.4 ft above the top of the intake opening. Figure 5.4-3 shows all fish traces that were recorded while the turbines were operational (> 100 cfs) and the transducers were functioning. For Turbine 1, 681 fish traces were recorded during the study; 537 (78.9%) of the traces were located at depths above the defined entrainment zone, whereas 144 (21.1%) traces were within the entrainment zone. For Turbine 2, 613 fish traces were recorded during the study; 550 (89.7%) of the traces were located at depths above the defined entrainment zone, whereas 63 (10.3%) traces were within the entrainment zone. Viewing the distribution of the estimated total lengths of the fish traces in Figure 5.4-3, a majority of fish above the entrainment zone are 10 cm or less (61.8% for Turbine 1, 61.5% for Turbine 2). For entrained fish, less than 20% are 10 cm or less (13.9% for Turbine 1, 17.5% for Turbine 2; shown in Figure 5.4-4). A greater number of smaller fish were observed at the surface than at depth within FEZ.
YALE ENTRAINMENT REPORT – ACC DRAFT
PAGE 27 OF 44
Week Starting Date Total Hrs Total FishTotal
Weighted Fish
Mean Daily Rate
(Fish/Hr)
Mean TL (cm) Total Hrs Total Fish
Total Weighted
Fish
Mean Daily Rate
(Fish/Hr)
Mean TL (cm)
1 11/24/2005 148 15 76.60 0.48 17.34 115 6 31.63 0.25 12.342 12/1/2005 132 6 30.79 0.24 15.30 121 1 10.17 0.11 14.573 12/8/2005 102 0 0 0 - 93 0 0 0 -4 12/15/2005 104 0 0 0 - 121 0 0 0 -5 12/22/2005 76 0 0 0 - 65 0 0 0 -6 12/29/2005 168 8 41.46 0.25 17.61 168 2 10.43 0.06 23.007 1/5/2006 168 10 56.06 0.33 21.83 168 1 10.76 0.06 6.978 1/12/2006 156 24 116.29 0.70 19.65 157 1 5.51 0.03 19.939 1/19/2006 168 5 44.89 0.27 17.53 168 1 15.79 0.09 13.15
10 1/26/2006 168 12 95.38 0.57 14.86 168 1 5.35 0.03 26.9511 2/2/2006 168 18 102.48 0.61 17.71 168 2 22.74 0.14 16.6112 2/9/2006 160 7 33.98 0.22 18.27 160 0 0 0 -13 2/16/2006 168 8 45.79 0.27 16.27 168 0 0 0 -14 2/23/2006 48 4 18.16 0.38 17.89 48 0 0 0 -15 3/2/2006 Transducers exposed Transducers exposed16 3/9/2006 Transducers exposed Transducers exposed17 3/16/2006 53 0 0 0 - 58 0 0 0 -18 3/23/2006 101 1 3.6165412 0.0322905 24.85 93 1 17.17 0.15 34.5719 3/30/2006 27 0 0 0 - 15 0 0 0 -20 4/6/2006 14 0 0 0 - 43 0 0 0 -21 4/13/2006 115 0 0 0 - 83 0 0 0 -22 4/20/2006 45 0 0 0 - 99 0 0 0 -23 4/27/2006 Turbine 1 OFF 168 2 8.57 0.05 10.8824 5/4/2006 Turbine 1 OFF 168 5 10.63 0.06 13.6925 5/11/2006 Turbine 1 OFF 96 1 1.55 0 12.2326 5/18/2006 Turbine 1 OFF 120 3 7.11 0.06 12.5627 5/25/2006 Turbine 1 OFF 168 1 5.35 0.03 16.2728 6/1/2006 Turbine 1 OFF 168 1 4.92 0.03 16.8329 6/8/2006 75 1 4.95 0.05 11.03 159 6 26.12 0.16 17.6630 6/15/2006 80 0 0 0 - 102 1 5.30 0.08 20.5631 6/22/2006 130 13 64.24 0.49 13.52 132 15 75.98 0.61 16.2332 6/29/2006 86 6 30.08 0.55 11.78 28 0 0 0 -33 7/6/2006 40 1 4.90 0.08 10.58 36 8 40.53 1.84 12.6034 7/13/2006 41 5 26.12 0.45 10.95 47 4 20.53 0.48 20.45
Total 2741 144 795.76 0.26 16.98 3671 63 336.15 0.14 15.78
Period Date Range Total Hrs Total FishTotal
Weighted Fish
Mean Daily Rate
(Fish/Hr)
Mean TL (cm) Total Hrs Total Fish
Total Weighted
Fish
Mean Daily Rate
(Fish/Hr)
Mean TL (cm)
1 11/24/05 - 12/27/05 544 21 107.38 0.16 16.76 496 7 41.80 0.08 12.65
2 12/28/05 - 2/24/06 1390 96 554.48 0.39 18.18 1392 8 70.59 0.05 18.28
3 3/13/06 - 4/22/06 355 1 3.62 0.01 24.85 326 1 17.17 0.04 34.57
4 4/24/06 - 6/10/06 Turbine 1 OFF 1025 16 48.72 0.05 13.67
5 6/11/06 - 7/19/06 452 26 130.28 0.31 12.42 432 31 157.86 0.58 16.33
Total 2741 144 795.76 0.26 16.98 3671 63 336.15 0.14 15.78
Turbine 1 Turbine 2
Turbine 1 Turbine 2
Table 5-3. Flow-type periods with mean operational flows for Yale Dam Turbines 1 and 2 from November 24, 2005 to July 13, 2006. Total fish detected and estimated mean lengths of detected fish are also shown. The lower table summarizes the operational periods.
YALE ENTRAINMENT REPORT – ACC DRAFT
PAGE 28 OF 44
Turbine 1
Week
Nov
24
Dec
08
Dec
22
Jan
05
Jan
19
Feb
02
Feb
16
Mar
02
Mar
16
Mar
30
Apr 1
3
Apr 2
7M
ay 1
1
May
25
Jun
08
Jun
22
Jul 0
6
Mea
n E
ntra
inm
ent R
ate
(# fi
sh/h
r)
0.0
0.2
0.4
0.6
0.8
1.0
1.2
Turbine 1 OFF
Tran
sduc
ers
Exp
osed
1 2 3 4 5
Turbine 2
Week
Nov
24
Dec
08
Dec
22
Jan
05
Jan
19
Feb
02
Feb
16
Mar
02
Mar
16
Mar
30
Apr 1
3
Apr 2
7M
ay 1
1
May
25
Jun
08
Jun
22
Jul 0
6
Mea
n E
ntra
inm
ent R
ate
(# fi
sh/h
r)
0.0
0.2
0.4
0.6
0.8
1.0
1.2
2.0
3.0
4.0
Tran
sduc
ers
Expo
sed
1 2 3 4 5
Figure 5.3-2. Weekly estimates of mean entrainment rates (number of fish per hour) with 95% confidence intervals for Yale Dam Turbine 1 (top) and Turbine 2 (bottom) from November 24, 2005 to July 19, 2006. Flow-type periods are defined along the top margins for reference.
YALE ENTRAINMENT REPORT - DRAFT
Page 29 of 44
Period
1 2 3 4 5 Overall
Mea
n E
stim
ated
Tot
al L
engt
h (c
m)
0
5
10
15
20
25
30
35
40Turbine 1Turbine 2
*
*
Figure 5.4-1. Mean estimated total lengths (cm), with 95% confidence intervals, for fish defined as entrained through Yale Dam Turbines 1 and 2 during each of the five flow-type periods and the overall study period. Bars with asterisks (*) denote single fish.
YALE ENTRAINMENT REPORT - DRAFT
Page 30 of 44
Period
1 2 3 4 5 Overall
Mea
n E
ntra
inm
ent R
ate
(# fi
sh/h
r)
0.0
0.2
0.4
0.6
0.8
1.0
1.2Turbine 1Turbine 2
Figure 5.4-2. Estimates of mean entrainment rates (number of fish per hour) with 95% confidence intervals for Yale Dam Turbines 1 and 2 during each of the five flow-type periods and the overall study period.
YALE ENTRAINMENT REPORT - DRAFT
Page 31 of 44
Turbine 1
Estimated Total Length (cm)
0 5 10 15 20 25 30 35 40 45 50 55 60
Dis
tanc
e fro
m T
rans
duce
r (ft)
0
5
10
15
20
25
30
35
40
45
50
55
60
Fish Trace3 ft/secTop of Intake
Turbine 2
Estimated Total Length (cm)
0 5 10 15 20 25 30 35 40 45 50 55 60
Dis
tanc
e fro
m T
rans
duce
r (ft)
0
5
10
15
20
25
30
35
40
45
50
55
60
Fish Trace3 ft/secTop of Intake
n = 550
n = 63
n = 538
n = 144
Figure 5.4-3. Vertical distribution of all individual fish traces by their estimated total lengths within the entire acoustic beam for Yale Dam Turbine 1 (top) and Turbine 2 (bottom) from November 24, 2005 to July 19, 2006. The hatched line indicates the upper limit of the Fish Entrainment Zone.
YALE ENTRAINMENT REPORT - DRAFT
Page 32 of 44
Distribution of Estimated Fish Lengths
Both Turbines
Bin of Estimated Fish Length (cm)
2 4 6 8 10 12 14 16 18 20 22 24 26 28 30 32 34 36 More
Freq
uenc
y
0
5
10
15
20
25
30
Cum
ulative Percentage (%
)
0
20
40
60
80
100
Turbine 1 Turbine 2Cumulative %
Turbine 1
Bin of Estimated Fish Length (cm)
2 4 6 8 10 12 14 16 18 20 22 24 26 28 30 32 34 36 More
Freq
uenc
y
0
5
10
15
20
25
Cum
ulative Percentage (%)
0
20
40
60
80
100
FrequencyCumulative %
Turbine 2
Bin of Estimated Fish Length (cm)
2 4 6 8 10 12 14 16 18 20 22 24 26 28 30 32 34 36 More
Freq
uenc
y
0
3
6
9
12
15
Cum
ulative Percentage (%)
0
20
40
60
80
100
Frequency Cumulative %
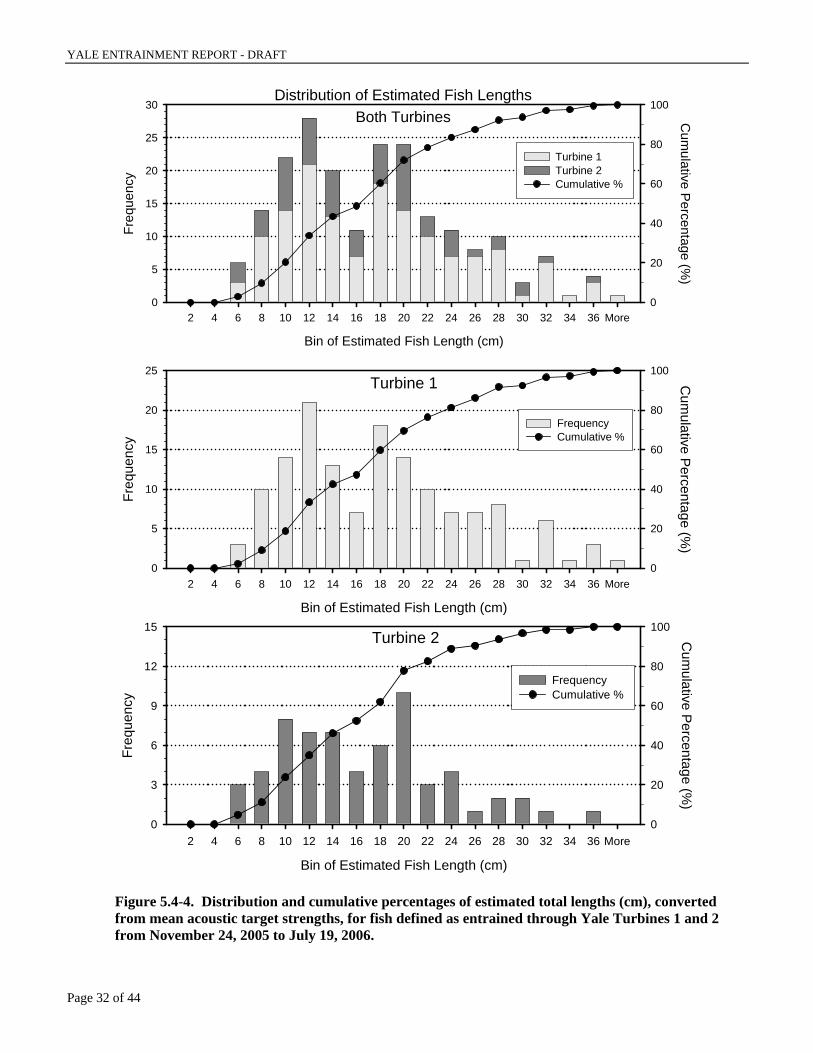
Figure 5.4-4. Distribution and cumulative percentages of estimated total lengths (cm), converted from mean acoustic target strengths, for fish defined as entrained through Yale Turbines 1 and 2 from November 24, 2005 to July 19, 2006.
YALE ENTRAINMENT REPORT - DRAFT
Page 33 of 44
6.0 Discussion
6.1 Fish Entrainment Zone
The methodology of this study attempted to take into account the water velocity contours around the turbine intakes in order to calculate a biologically appropriate velocity threshold from which fish would be unable to escape and thus, be entrained. The velocity chosen for this threshold was 3 fps, well below the escape velocity criteria established for most salmonid life stages. For reference, PacifiCorp and the ACC Engineering Subgroup are using 7 fps as a capture velocity (25.4 cm steelhead surrogate) for the Swift Floating Surface Collector. We chose a lower threshold to be conservative and to allow for the possibility that smaller fish may be entrained at lower flows, and that some fish may not attempt to avoid flows, but may instead detect them as a cue and actively move towards the increase in velocity. This defined area was designated the Fish Entrainment Zone (FEZ). Currently the FEZ top wedge is based on 3 fps velocity contour and extends 18.9 ft above the center point of the intake. If we would have used 2 fps the FEZ would extend 23.9 ft and 1.5 fps would extend it to 28.2 ft from intake center point. At 2 fps this would have resulted in increased fish entrainment estimates by 1,305 fish for Turbine 1 and 1,121 fish for Turbine 2. Regardless of the characteristics of the FEZ, when looking at percent of total fish entrained at Turbine 1 versus Turbine 2 are remarkably similar to the 1997 study indicating conditions between the two studies was similar and repeatable.
6.2 Entrainment Rates
During this study fish, overall entrainment at Yale intakes was estimated to be approximately 0.19 fish per hour or about 1,664 fish per year. In comparison, Hiebert (Bureau of Reclamation website www.ykfp.org/par04/Exe.Sum.Rimrock20032002) found approximately 5,500 fish per year entrained at Rimrock Reservoir in eastern Washington. The majority of those entrained fish (97%) were kokanee. In a recent study at Grande Coulee Dam, about 0.17% of the entrained fish were bull trout (9 bull trout per year). Simmons et al. (2006) detected 3,256 entrained fish at Grand Coulee dam during a 3 month study period. The entrained fish observed by Simmons et al. (2006) included kokanee, rainbow trout and walleye (Sander vitreus). Simmons et al. (2006) estimated annual entrainment for salmonids was to be 3 fish per year at Grand Coulee dam with the remainder of the entrained fish being primarily walleye and other non-salmonids.
6.3 Video Observations
One element of the Yale entrainment studies continues to elude resolution. That is, the identification of the species entrained. We do, however, have a clear idea of the sizes and numbers of fish but, since there are salmonid species of similar body form and length in Yale Lake, we cannot definitively identify species entrained.
Of the 616 hours of underwater video, only a few fish were actually observed. This is more a function of the viewing area than it is water clarity or fish size. Simmons et al. (2006) experienced similar problems and were only able to film 6 fish in 72 hours of video. Their equipment was
YALE ENTRAINMENT REPORT - DRAFT
Page 34 of 44
much more sophisticated and able to make progressive scans which may account for more fish observations despite the larger intake area (48’ high and 29’ wide). After making a second attempt to identify species using different methods in 1997 and 2005/6, we remain challenged by this information need and the lack of technology to resolve the question at the Yale facility.
6.4 Hydroacoustics
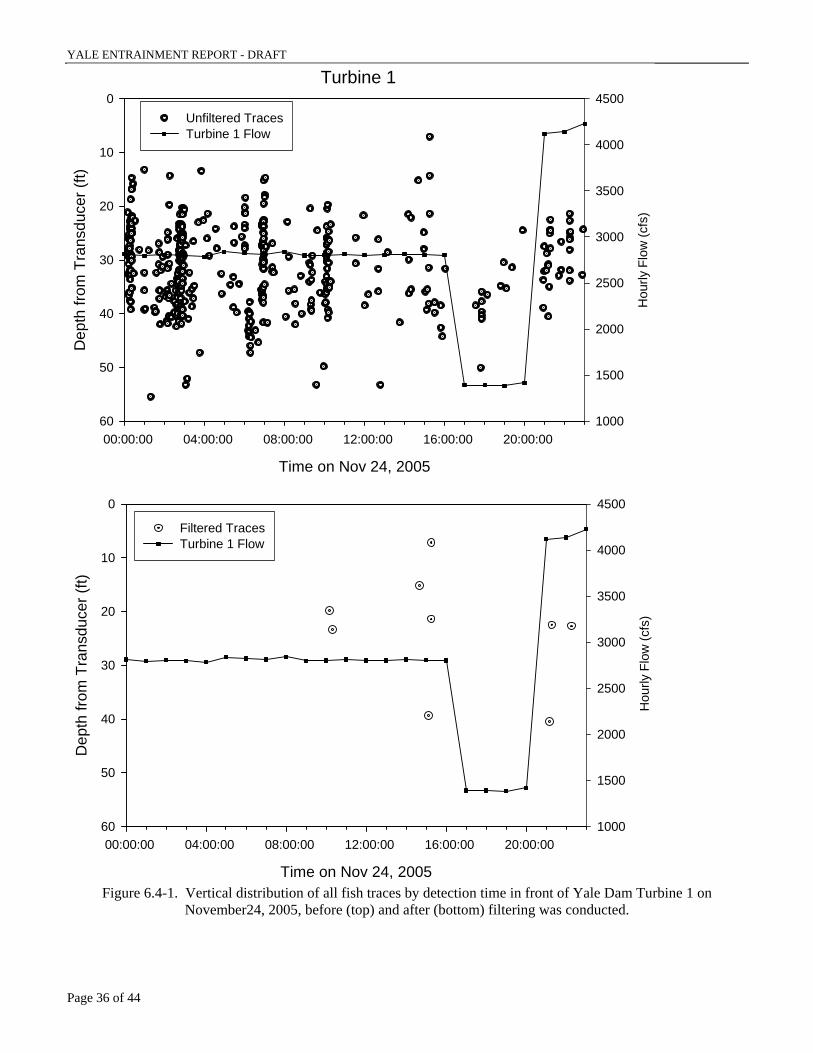
Overall, the hydroacoustic transducer performed very well and enabled to us to make very good observations of the Yale turbine intakes. Because of the ability to store data and analyze it from a number of different angles, we were able to filter out debris, identify fish size, distribution in the water column, and proximity to the fish entrainment zone. Figure 6.4-1 is an example of how filtering allows one to focus on fish targets and their location in relation to the intake portals.
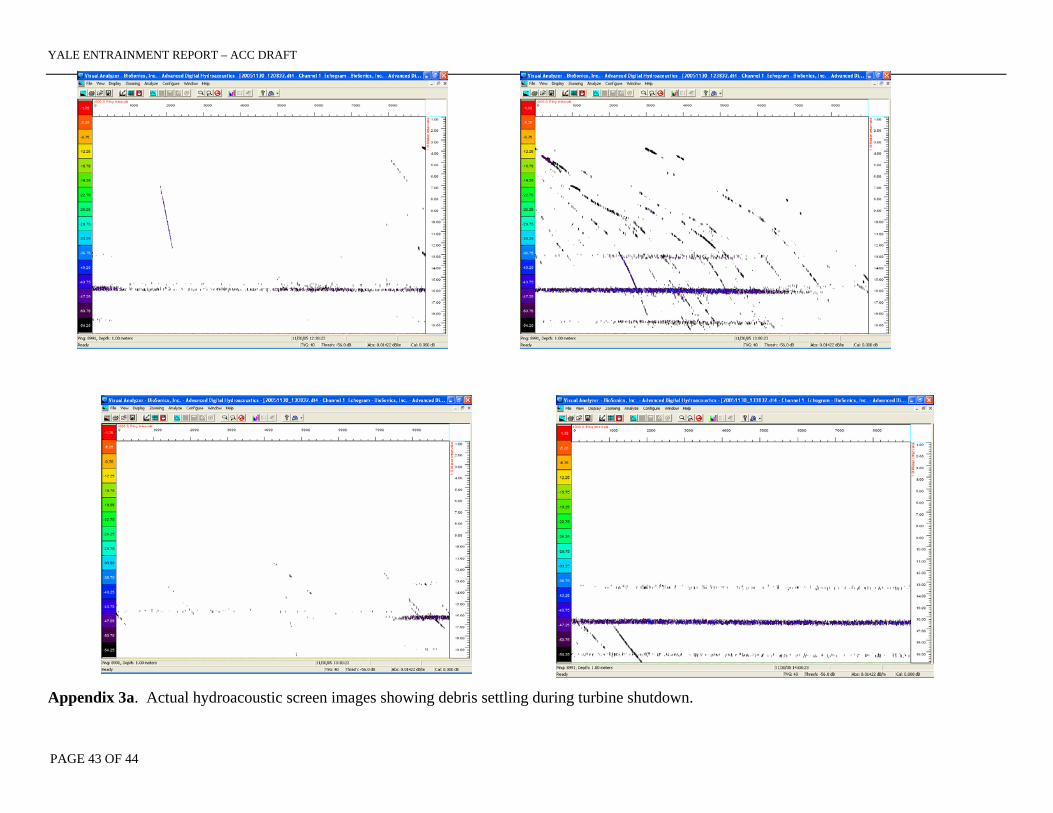
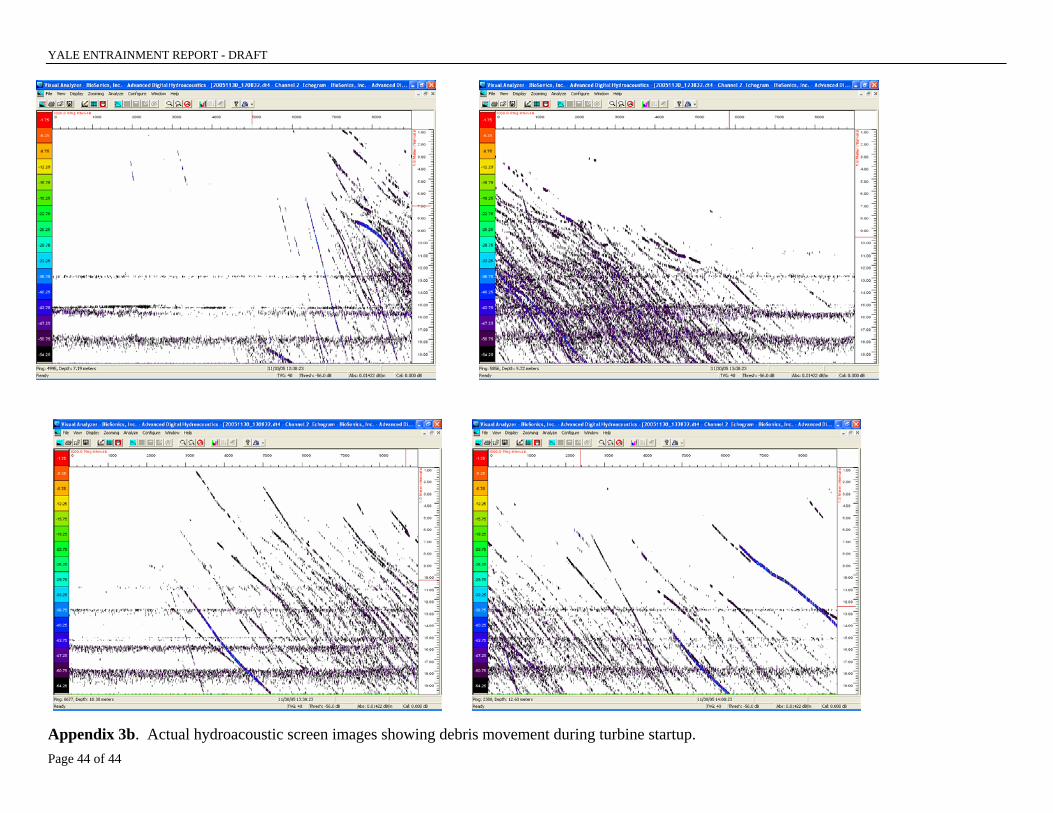
6.4.1 Entrainment Rates In comparison to the previous Yale Dam entrainment study (PacifiCorp 1999), the current estimates of total entrainment are much lower (see Appendix 2). For instance, the hourly entrainment rate from the previous study was estimated to be 28.5 fish per hour while the current level of entrainment is estimated to be 0.19 fish per hour. For the 11-week study period in 1997, the hourly rate equates to 50,000 fish entrained annually, yet in September of the same year the total Yale reservoir fish population was estimated to be between 82,000 and 110,000 using hydroacoustic surveys. The majority of the fish targets detected during the 1997 hydroacoustic lake population survey (90 percent) were found between the depths of 17 m and 29 m (56 to 90 ft.). Based on the 1997 hydroacoustic lake population estimate, it is unlikely that over half the lake population was potentially entrained in the short 11-week study period. The difference lies in treatment of the observations. During this recent study, it was obvious, especially during shutdown and startup periods, that there was a large amount of debris in the intake area that becomes dislodged or that settles during these periods (Appendix 3). The resulting records would have overestimated entrainment without a filtering methodology that allowed for differentiation of woody/detrital debris and fish targets. This methodology was not applied in the 1997 study. The basic assumption in 1997 was that if a target was observed within the intake bar racks, it was an entrained fish. With no consideration of capture velocity, this assumption led to an overestimation of actual fish entrainment. With this current study, we have a very good estimate of how many actual fish targets entered the intake gallery and, of those, how many were actually entrained using the FEZ criteria. As with the 1997 study, a large difference exists between fish entrained at Turbine 1 and Turbine 2. We can only attribute that to location. In other words, it appears that fish approach the intake gallery from the southern shore line rather than along the face of Yale Dam. This results in more fish entering the Turbine 1 penstock. The importance of that fact is debatable. What is important is total entrainment and what that means to the bull trout population in particular. There is uncertainty around how many of the entrained fish are actually bull trout. An analysis of fish length, migration timing and vertical pelagic position may assist with minimizing the uncertainty.
YALE ENTRAINMENT REPORT - DRAFT
Page 35 of 44
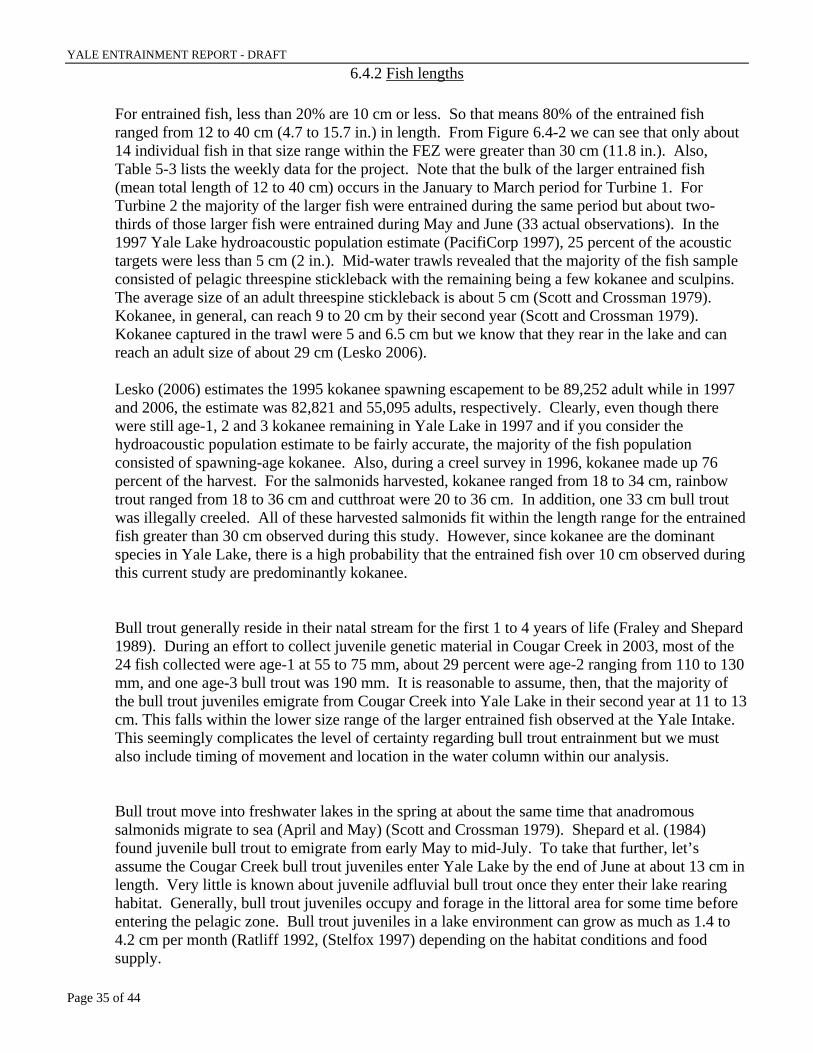
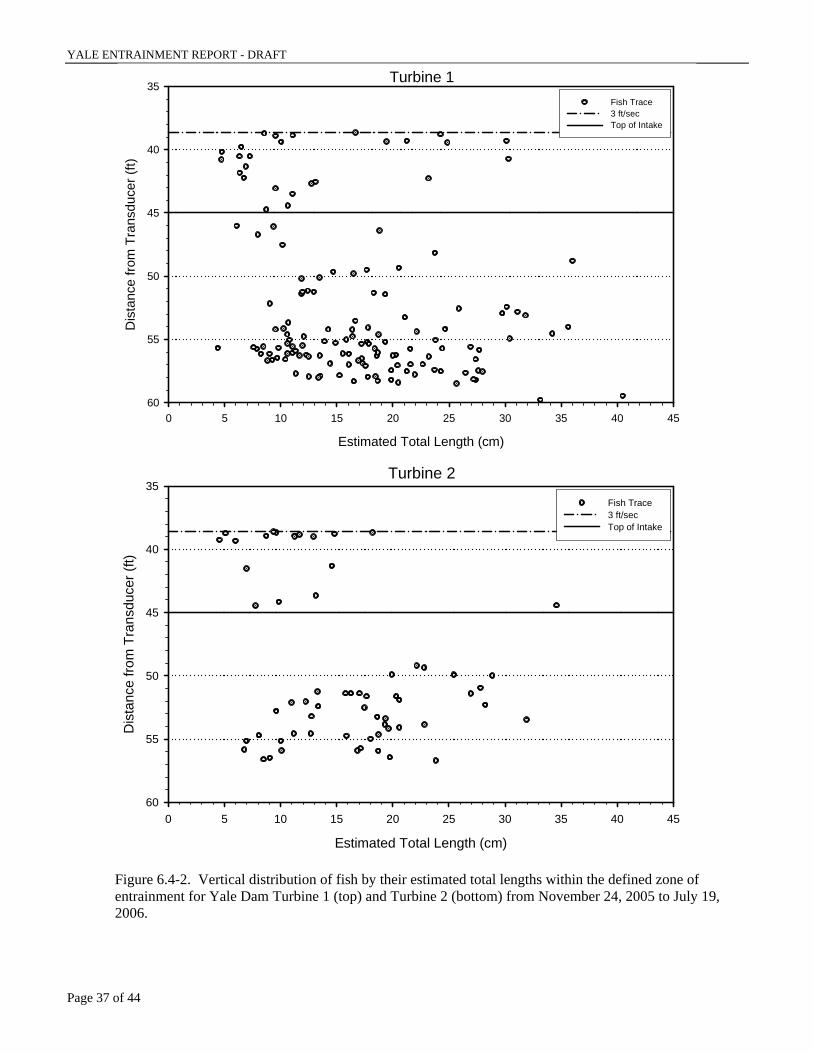
6.4.2 Fish lengths For entrained fish, less than 20% are 10 cm or less. So that means 80% of the entrained fish ranged from 12 to 40 cm (4.7 to 15.7 in.) in length. From Figure 6.4-2 we can see that only about 14 individual fish in that size range within the FEZ were greater than 30 cm (11.8 in.). Also, Table 5-3 lists the weekly data for the project. Note that the bulk of the larger entrained fish (mean total length of 12 to 40 cm) occurs in the January to March period for Turbine 1. For Turbine 2 the majority of the larger fish were entrained during the same period but about two-thirds of those larger fish were entrained during May and June (33 actual observations). In the 1997 Yale Lake hydroacoustic population estimate (PacifiCorp 1997), 25 percent of the acoustic targets were less than 5 cm (2 in.). Mid-water trawls revealed that the majority of the fish sample consisted of pelagic threespine stickleback with the remaining being a few kokanee and sculpins. The average size of an adult threespine stickleback is about 5 cm (Scott and Crossman 1979). Kokanee, in general, can reach 9 to 20 cm by their second year (Scott and Crossman 1979). Kokanee captured in the trawl were 5 and 6.5 cm but we know that they rear in the lake and can reach an adult size of about 29 cm (Lesko 2006). Lesko (2006) estimates the 1995 kokanee spawning escapement to be 89,252 adult while in 1997 and 2006, the estimate was 82,821 and 55,095 adults, respectively. Clearly, even though there were still age-1, 2 and 3 kokanee remaining in Yale Lake in 1997 and if you consider the hydroacoustic population estimate to be fairly accurate, the majority of the fish population consisted of spawning-age kokanee. Also, during a creel survey in 1996, kokanee made up 76 percent of the harvest. For the salmonids harvested, kokanee ranged from 18 to 34 cm, rainbow trout ranged from 18 to 36 cm and cutthroat were 20 to 36 cm. In addition, one 33 cm bull trout was illegally creeled. All of these harvested salmonids fit within the length range for the entrained fish greater than 30 cm observed during this study. However, since kokanee are the dominant species in Yale Lake, there is a high probability that the entrained fish over 10 cm observed during this current study are predominantly kokanee. Bull trout generally reside in their natal stream for the first 1 to 4 years of life (Fraley and Shepard 1989). During an effort to collect juvenile genetic material in Cougar Creek in 2003, most of the 24 fish collected were age-1 at 55 to 75 mm, about 29 percent were age-2 ranging from 110 to 130 mm, and one age-3 bull trout was 190 mm. It is reasonable to assume, then, that the majority of the bull trout juveniles emigrate from Cougar Creek into Yale Lake in their second year at 11 to 13 cm. This falls within the lower size range of the larger entrained fish observed at the Yale Intake. This seemingly complicates the level of certainty regarding bull trout entrainment but we must also include timing of movement and location in the water column within our analysis. Bull trout move into freshwater lakes in the spring at about the same time that anadromous salmonids migrate to sea (April and May) (Scott and Crossman 1979). Shepard et al. (1984) found juvenile bull trout to emigrate from early May to mid-July. To take that further, let’s assume the Cougar Creek bull trout juveniles enter Yale Lake by the end of June at about 13 cm in length. Very little is known about juvenile adfluvial bull trout once they enter their lake rearing habitat. Generally, bull trout juveniles occupy and forage in the littoral area for some time before entering the pelagic zone. Bull trout juveniles in a lake environment can grow as much as 1.4 to 4.2 cm per month (Ratliff 1992, (Stelfox 1997) depending on the habitat conditions and food supply.
YALE ENTRAINMENT REPORT - DRAFT
Page 36 of 44
Turbine 1
Time on Nov 24, 2005
00:00:00 04:00:00 08:00:00 12:00:00 16:00:00 20:00:00
Dep
th fr
om T
rans
duce
r (ft)
0
10
20
30
40
50
60
Hou
rly F
low
(cfs
)
1000
1500
2000
2500
3000
3500
4000
4500Unfiltered TracesTurbine 1 Flow
Time on Nov 24, 2005
00:00:00 04:00:00 08:00:00 12:00:00 16:00:00 20:00:00
Dep
th fr
om T
rans
duce
r (ft)
0
10
20
30
40
50
60
Hou
rly F
low
(cfs
)
1000
1500
2000
2500
3000
3500
4000
4500
Filtered TracesTurbine 1 Flow
Figure 6.4-1. Vertical distribution of all fish traces by detection time in front of Yale Dam Turbine 1 on
November24, 2005, before (top) and after (bottom) filtering was conducted.
YALE ENTRAINMENT REPORT - DRAFT
Page 37 of 44
Turbine 1
Estimated Total Length (cm)
0 5 10 15 20 25 30 35 40 45
Dis
tanc
e fro
m T
rans
duce
r (ft)
35
40
45
50
55
60
Fish Trace3 ft/secTop of Intake
Turbine 2
Estimated Total Length (cm)
0 5 10 15 20 25 30 35 40 45
Dis
tanc
e fro
m T
rans
duce
r (ft)
35
40
45
50
55
60
Fish Trace3 ft/secTop of Intake
Figure 6.4-2. Vertical distribution of fish by their estimated total lengths within the defined zone of entrainment for Yale Dam Turbine 1 (top) and Turbine 2 (bottom) from November 24, 2005 to July 19, 2006.
YALE ENTRAINMENT REPORT - DRAFT
Page 38 of 44
Given the topography, food supply and water conditions, Yale Lake is much closer in comparison to Lake Billy Chinook than it is to Lake Roosevelt so it is likely that for fish available to be entrained, bull trout juveniles would be approximately 13 cm in June and 14.4 cm in July. With their estimated size and littoral orientation, those larger entrained fish observed in the Yale Intake Gallery are not likely to be juvenile bull trout. To carry this analysis further, after one year in the reservoir, these same juveniles would be in the 30 cm size range. By the time they reach that age and size, bull trout are usually found in the profundal zone of a reservoir (22.5m to 40m) (Connor, et al. 1997) where they follow the diel movements of their prey. Based on the previous information, we believe that it is safe to assume that very little sub-adult bull trout entrainment occurs at Yale dam. From the adult perspective, adult and sub-adult bull trout captured in the Yale tailrace over the past 11 years range in size from 29 cm to 82 cm while Swift Reservoir bull trout range in size from 17 cm to 80 cm for the past 10 years. The Lewis River Settlement Agreement defines an adult bull trout to be greater than 13 inches (33 cm). So it’s relatively safe to assume that, if adults were not in the profundal zone and were subjected to entrainment, then those fish would fall within the defined adult size (33 cm) to the observed adult size (82 cm). For larger fish detected using hydroacoustics, only 5 fish in the adult size range (33cm to 41 cm) were observed within the FEZ for Turbine 1 and only one fish in the adult size range (35 cm) was observed in the Turbine 2 FEZ (Figure 5.4-3). The size range of the observed fish within the FEZ also includes the upper size range for kokanee (18 to 34 cm) rainbow trout (18 to 36 cm) and cutthroat (20 to 36 cm). Only one fish observed in the FEZ exceeded 36 cm so it is quite possible that the remaining fish targets were salmonids other than bull trout since bull trout numbers are a very small percentage of the total fish population in Yale Lake. The current Biological Opinion (US Fish and Wildlife Service 2006) assumes that 2 or fewer bull trout will be entrained per year at Yale Dam and, given the preceding discussion, we believe that this is a reasonable assumption. 6.5 Recommendations Based on the results and analysis of entrainment at Yale dam, there is a very small number of bull trout that are potentially entrained (less than 2 bull trout per year). Relative to the spawning population size in Cougar Creek that may seem high (perhaps as much as 10 percent). However, the size of spawners observed in Cougar Creek far exceed the larger fish that were observed in the Yale intake area. During data collection for pre-spawning adult bull trout in Cougar Creek, observed adult sizes averaged 56.2 cm (s.d.=10.2 cm) (Shrier – unpublished data from 1993 and 1994) so it does not appear that any potentially entrained fish are greater than or equal to spawning sized bull trout. Considering the efforts by PacifiCorp Energy to protect bull trout habitat and their combined effort with Washington Department of Fish and Wildlife to transport bull trout adults from the Yale tailrace and to monitor the spawning population in Cougar Creek, these actions protect and foster bull trout survival in Yale Lake and Cougar Creek and serve to offset any potential loss from entrainment at the dam. Based on the above analysis and continued conservation efforts, we do not find there to be enough compelling evidence to warrant placement of an entrainment reduction device at Yale for the prevention of bull trout entrainment. At a potential of about 2 bull trout entrained per year, the expense of placement and maintenance of such a device does not seem practical. Therefore we do not recommend any changes or modifications to the Yale Intake.

YALE ENTRAINMENT REPORT - DRAFT
Page 39 of 44
7.0 References
Connor, E., D. Reiser, K. Binkley, D. Paige, and K. Lynch. 1997. Abundance and distribution of an unexploited bull trout population in the Cedar River, Washington. In: Friends of the Bull Trout Conference Proceedings ( W. Mackay, M. Brewin, and M. Monita, editors). The Bull Trout Task Force. Alberta, Canada. Fraley, J.J. and B.B. Shepard. 1989. Life History, ecology and population status of migratory bull trout (Salvelinus confluentus) in the Flathead Lake river system, Montana. Northwest Science 63(4): 133-143.
Lesko, E. 2006. Annual report of kokanee escapement on Cougar Creek. PacifiCorp Energy, Portland, Oregon.
Love, R.H. 1971. Dorsal aspect target strength of an individual fish. Journal of the Acoustical Society of America. 49(3): 816–823.
Love, R.H. 1977. Target strength of individual fish at any respect. Journal of the Acoustical Society of America. 62(6): 1397-1403.
McPhail, J.D. and C.B. Murray. 1979. The early life-history and ecology of Dolly Varden (Salvelinus malma) in the upper Arrow Lakes. Department of Zoology and Institute of Animal Resources, University of British Columbia, Vancouver, B.C.
PacifiCorp. 2004. Evaluation of Fish Entrainment at the Swift No. 1 Hydroelectric Project (AQU 6). Final Technical Report. Lewis River Relicensing Documents. Portland, Oregon.
PacifiCorp. 1999. Hydroacoustic evaluation of fish entrainment at Yale dam. Final Technical Report for Aquatic Resources. Lewis River Relicensing Documents. Portland, Oregon.
Ratliff, D. 1992. Bull trout investigations in the Metolius River-Lake Billy Chinook system. Proceedings of the Gearhart Mountain Bull Trout Workshop. Oregon Chapter of the American Fisheries Society. Corvallis, Oregon.
Scott, W.B. and E.J. Crossman. 1979. Freshwater fishes of Canada. Fisheries research Board of Canada, Ottawa.
Shepard, B., K. Pratt, and P. Graham. 1984. Life histories of westslope cutthroat and bull trout in the upper Flathead River Basin, Montana. Report to the Environmental Protection Agency Contract R008224-01-5. Montana Department of Fish, Wildlife and Parks. Helena, Montana. Simmons, M., R. Johnson, C. McKinstry, C. Simmons, C. Cook, S. Thorsten, Bret Nine, Richard LeCaire, and S. Francis. 2006. Chief Joseph Kokanee Enhancement Project; Strobe Light Deterrent Efficacy Test and Fish Behavior Determination at Grand Coulee Dam Third Powerplant Forebay. 2005-2006 Annual Report, Project No. 199501100, 69 electronic pages, (BPA Report DOE/BP-00000652-33). Stelfox, J. Seasonal movements, growth, survival, and population status of the adfluvial bull trout population in lower Kananaskis Lake, Alberta. In: Friends of the Bull Trout Conference Proceedings ( W. Mackay, M. Brewin, and M. Monita, editors). The Bull Trout Task Force. Alberta, Canada.

YALE ENTRAINMENT REPORT - DRAFT
Page 40 of 44
US Bureau of Reclamation. 2004. Movement and mortality patterns of adult adfluvial bull trout (Salvelinus confluentus) in the Boise River Basin Idaho. Technical Report for Arrowrock Dam Biological Opinion #1009.0405 OALS *00-912 and Upper Snake River Biological Opinion #1009.2700.
US Fish and Wildlife Service. 2006. Biological Opinion for the Federal Regulatory Commission relicensing of the Lewis River Hydroelectric projects. Western Washington Fish and Wildlife Office. Lacey, Washington.
Wade, M. and V. Tranquilli. 2002. Minimizing Risks and Mitigation of Impacts to Bull Trout Salvelinus confluentus from Construction of Temperature Control Facilities at Cougar Reservoir, Oregon. US Bureau of Reclamation, Denver, Colorado.
YALE ENTRAINMENT REPORT - DRAFT
Page 41 of 44
Appendix 1
The following is an excerpt from the Lewis River Settlement Agreement:
4.9.3 Yale and Merwin Bull Trout Entrainment Reduction. Immediately following the Effective Date, PacifiCorp shall design and implement a study to evaluate bull trout entrainment reduction methods for Yale and Merwin dams in Consultation with the ACC. Potential entrainment reduction methods include installation of exclusion devices, such as strobe lights, and installation of barrier nets with submersible cork lines and designed to accommodate a Merwin-type floating trap. Due to the small numbers of bull trout in Yale and Merwin, any evaluation of strobe lights will be performed in Swift Reservoir. Based upon its study, PacifiCorp shall prepare, in Consultation with the ACC, a draft entrainment reduction plan for the Yale Project. The plan would be developed to minimize unacceptable incidental impacts to bull trout or other species. PacifiCorp shall submit the draft plan to members of the ACC for comment within 16 months after completing the entrainment reduction study. PacifiCorp shall allow at least 45 days for members of the ACC to comment on the draft plan. PacifiCorp shall finalize the plan and obtain the approval of USFWS. PacifiCorp shall submit the final plan to the Commission upon approval by USFWS, subject to Section 15.14, but not later than the third anniversary of the Effective Date. PacifiCorp shall commence the approved entrainment reduction measures at Yale Dam within one year after the Issuance of the New License for the Yale Project, and shall maintain such measures until commencing operation of the Yale Downstream Facility. Upon the request of USFWS, PacifiCorp shall, in Consultation with the ACC and subject to the approval of USFWS, develop criteria to determine when similar entrainment reduction measures should be implemented at Merwin Dam. PacifiCorp shall submit the criteria to the Commission for approval after obtaining USFWS approval, subject to Section 15.14, within 12 months after the USFWS request for criteria. Once approved by the Commission, if and when such criteria are met PacifiCorp shall commence the same entrainment reduction measures approved for Yale at Merwin Dam, and shall maintain such measures until commencing operation of the Merwin Downstream Facility.
YALE ENTRAINMENT REPORT - DRAFT
Page 42 of 44
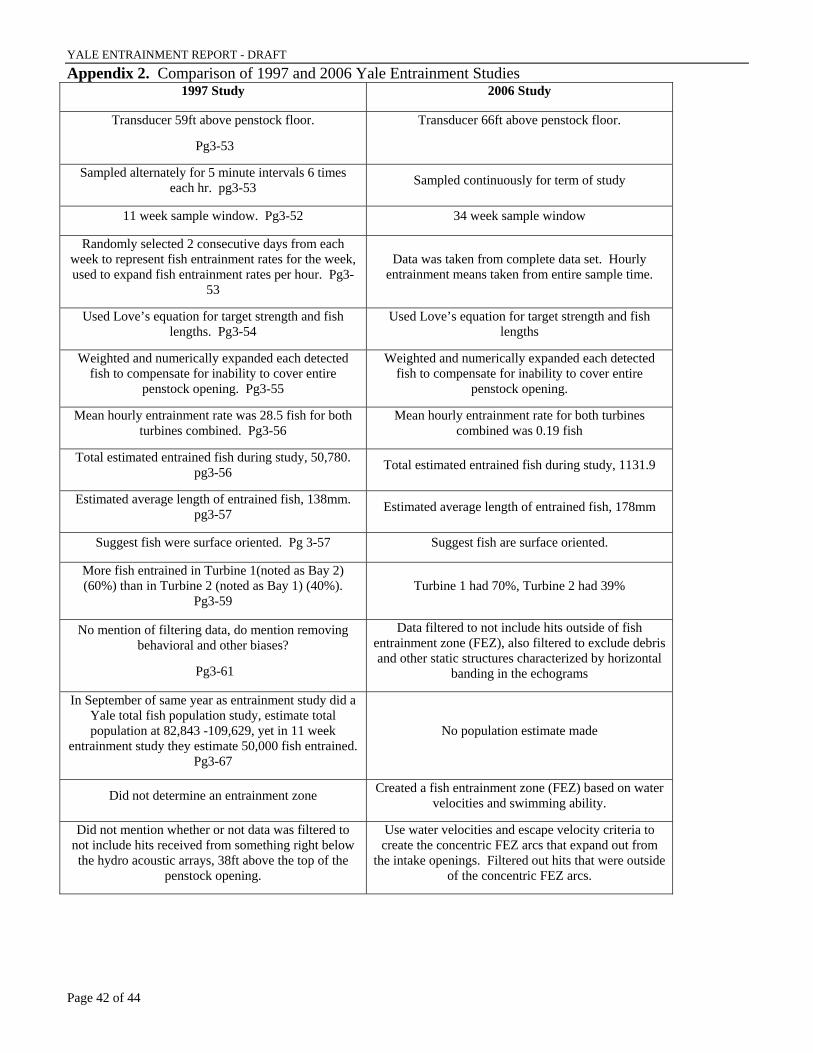
Appendix 2. Comparison of 1997 and 2006 Yale Entrainment Studies 1997 Study 2006 Study
Transducer 59ft above penstock floor.
Pg3-53
Transducer 66ft above penstock floor.
Sampled alternately for 5 minute intervals 6 times each hr. pg3-53 Sampled continuously for term of study
11 week sample window. Pg3-52 34 week sample window
Randomly selected 2 consecutive days from each week to represent fish entrainment rates for the week, used to expand fish entrainment rates per hour. Pg3-
53
Data was taken from complete data set. Hourly entrainment means taken from entire sample time.
Used Love’s equation for target strength and fish lengths. Pg3-54
Used Love’s equation for target strength and fish lengths
Weighted and numerically expanded each detected fish to compensate for inability to cover entire
penstock opening. Pg3-55
Weighted and numerically expanded each detected fish to compensate for inability to cover entire
penstock opening.
Mean hourly entrainment rate was 28.5 fish for both turbines combined. Pg3-56
Mean hourly entrainment rate for both turbines combined was 0.19 fish
Total estimated entrained fish during study, 50,780. pg3-56 Total estimated entrained fish during study, 1131.9
Estimated average length of entrained fish, 138mm. pg3-57 Estimated average length of entrained fish, 178mm
Suggest fish were surface oriented. Pg 3-57 Suggest fish are surface oriented.
More fish entrained in Turbine 1(noted as Bay 2) (60%) than in Turbine 2 (noted as Bay 1) (40%).
Pg3-59 Turbine 1 had 70%, Turbine 2 had 39%
No mention of filtering data, do mention removing behavioral and other biases?
Pg3-61
Data filtered to not include hits outside of fish entrainment zone (FEZ), also filtered to exclude debris and other static structures characterized by horizontal
banding in the echograms
In September of same year as entrainment study did a Yale total fish population study, estimate total population at 82,843 -109,629, yet in 11 week
entrainment study they estimate 50,000 fish entrained. Pg3-67
No population estimate made
Did not determine an entrainment zone Created a fish entrainment zone (FEZ) based on water velocities and swimming ability.
Did not mention whether or not data was filtered to not include hits received from something right below the hydro acoustic arrays, 38ft above the top of the
penstock opening.
Use water velocities and escape velocity criteria to create the concentric FEZ arcs that expand out from
the intake openings. Filtered out hits that were outside of the concentric FEZ arcs.
YALE ENTRAINMENT REPORT – ACC DRAFT
PAGE 43 OF 44
Appendix 3a. Actual hydroacoustic screen images showing debris settling during turbine shutdown.
YALE ENTRAINMENT REPORT - DRAFT
Page 44 of 44
Appendix 3b. Actual hydroacoustic screen images showing debris movement during turbine startup.