Optimizing Diesel Production Using Advanced Process Control and Dynamic Simulation
36
Optimizing Diesel Production Using Advanced Process Control and Dynamic Simulation Márcio R. S. Garcia 1 , Renato N. Pitta 2 , Gilvan A. G. Fischer 2 , Enéas R. N. Neto 2 1 Radix Engenharia e Desenvolvimento de Software Ltda, Rio de Janeiro, RJ, Brazil (e-mail: [email protected] ) 2 Refinaria Henrique Lage, São José dos Campos, SP, Brazil (e-mail: [email protected] , [email protected] , [email protected] )
-
Upload
marcio-garcia -
Category
Engineering
-
view
265 -
download
7
description
This paper describes the economical and operational benefits achieved with the use of advanced process control techniques and dynamic simulation applied to a Naphtha Splitter Column. The project consists in optimizing the Diesel blending system of Henrique Lage Renery (REVAP) located in the state of S~ao Paulo, Brazil. The control strategy was designed to maximize production rate, respecting the operational constraints. The results include an increase in the Naphtha flow stream to the Diesel blending system and improvement of the operational stability, leading to valuable economic gains. The project is also a step forward in the use of Dynamic simulation for modelling and identication, where the simulation models have shown to be representative for the inferential variables integration, adding value to the final result.
Transcript of Optimizing Diesel Production Using Advanced Process Control and Dynamic Simulation

Optimizing Diesel Production UsingAdvanced Process Control and Dynamic
Simulation
Márcio R. S. Garcia1,
Renato N. Pitta2,
Gilvan A. G. Fischer2,
Enéas R. N. Neto2
1Radix Engenharia e Desenvolvimento de Software Ltda, Rio de Janeiro, RJ, Brazil (e-mail: [email protected])
2Refinaria Henrique Lage, São José dos Campos, SP, Brazil (e-mail: [email protected] , [email protected] , [email protected] )
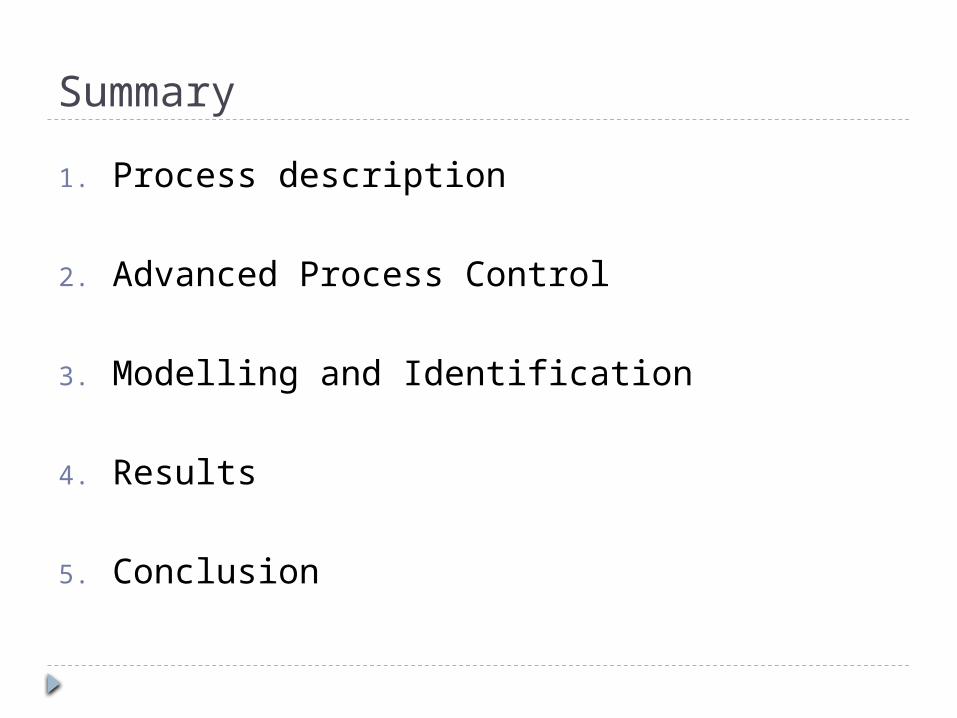
Summary
1. Process description
2. Advanced Process Control
3. Modelling and Identification
4. Results
5. Conclusion

Process description – Diesel Blending System
The Diesel blending system of REVAP (Henrique Lage Refinery), located in the state of São Paulo, is composed of three product streams: The Diesel from the Gasoil Hydrotreating Unit (HDT-GOK); the Diesel from the Diesel Hydrotreating Unit (HDT-D) and the Heavy Naphtha from the Naphtha Splitter Column;
The three streams are blended to compose the S-10 / 500 Diesel (Diesel with maximum Sulfur content of 10 / 500 ppm) product;
The Naphtha Stream has a large impact on the Diesel’s flash point (The temperature in which the hydrocarbonate vapor sparks in the presence of an ignition source).
The Diesel flash point must be constantly monitored in order to avoid the products off-specification, which represents large economic losses to the refinery due to the necessity of reprocessing

Process description – Diesel Blending System
* 7% of Diesel production, but large impact on the flash point.
*

Process description – Naphtha Splitter

Process description – Diesel Blending Profile
Diesel from HDT-GOK
Diesel from HDT-D
Heavy Naphtha
45%
48%
7%

Summary1. Process description
2. Advanced Process Control
3. Modelling and Identification
4. Results
5. Conclusion

Advanced Process Control – Problem Statement
The Naphtha feed was kept in Automatic mode, fixed setpoint. The temperature of the column was also kept in a fixed setpoint. There was no optimization in the split process and the splitter operated most of the time away from the limit of its capacity;
The column’s feed vessel used to flood most of the times that the operators tried to increased the processed feed;
The Naphtha flash point or T5% (The temperature directly related to the initial boiling point) are not measured. There are no analyzers in the Naphtha outlet stream and the Diesel’s flash point was always far from its minimum;
The processed feed, medium pressure (MP) steam and top reflux form a highly multivariable system. APC strategies are intrinsically multivariable and the most suitable solution for the plant optimization. Also, it can easily reject the disturbances cause by the changes in the feed composition, finding the best operation point on a real-time basis.

Advanced Process Control - Configuration
Manipulated Variables Controlled Variables
- Splitter’s Feed - Splitter’s temperature
- Medium Pressure Steam flow - Bottom level controller output signal
- Top Reflux flow- Splitter’s pressure controller output
signal
- Naphtha flash point (inferential)
- Reflux calculated ratio (inferential)
- Heavy Naphtha / T5% ratio (inferential)
- Manipulated variables have their setpoints or control signals defined by the advanced controller in order to keep the process controlled variables (constraints) within their limits;
- Controlled variables represent the process constraints and must remain within their safe operational limits;
- Inferential variables are controlled variables that are not directly measured, but inferred from the operational conditions.

Advanced Process Control – Naphtha SplitterManipulated
Variables
ControlledVariables
Reflux Ratio
Naphtha’s Flash Point

Advanced Process Control – Control Strategy
Linear Optimizer
- Economic Function;- Linear / Quadratic programing;- Steady state targets.
Controller
- ARX models;- Model Predictive Control.
DIGITAL CONTROL SYSTEM (DCS)
- Process variables;- Human-machine Interface.
TargetsU*, Yl*
MV’s Setpoints, Control Actions
MV’s, DV’s and CV’s

Advanced Process Control – Control Strategy
The APC uses a two-layer control strategy:
1. Linear Optimizer
- DU = Control action increment; - SCV = Slack Control Variable;
- W1 = economic coefficient; - uat = previous control action;
- W2 = supression factor; - Uinf, Usup = MV limits;
- W3 = slack variables weights; - Yinf, Ysup = CV limits;
s.t.
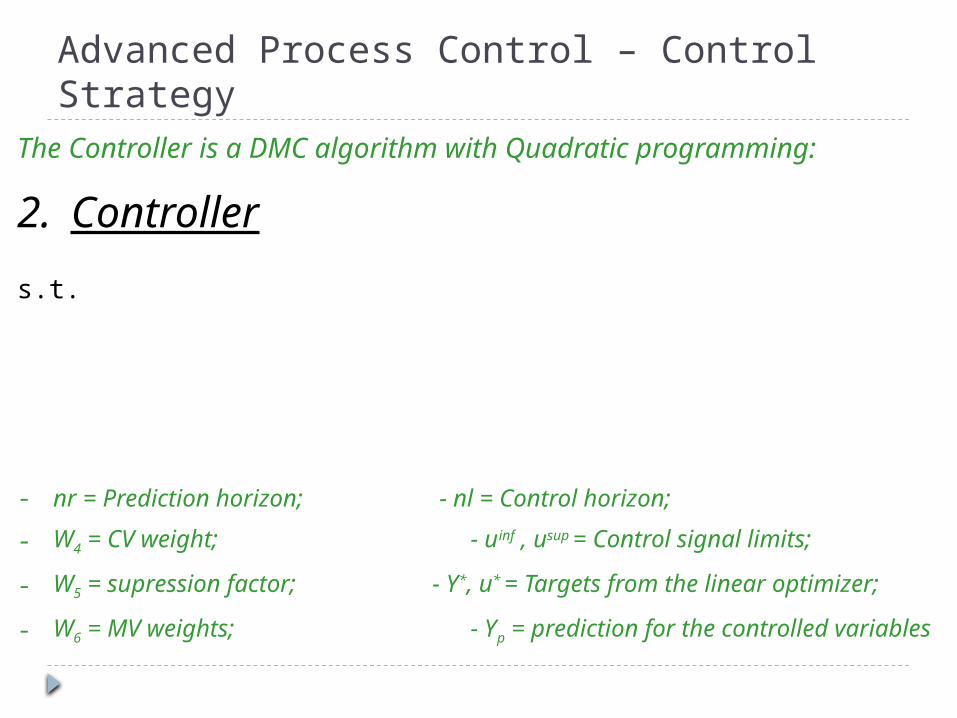
Advanced Process Control – Control StrategyThe Controller is a DMC algorithm with Quadratic programming:
2. Controller
- nr = Prediction horizon; - nl = Control horizon;
- W4 = CV weight; - uinf , usup = Control signal limits;
- W5 = supression factor; - Y*, u* = Targets from the linear optimizer;
- W6 = MV weights; - Yp = prediction for the controlled variables
s.t.

Summary
1. Process description
2. Advanced Process Control
3. Modelling and Identification
4. Results
5. Conclusion

Modelling and Identification – Naphtha Splitter
Identification tests were performed in the real plant and generated the step-response based ARX models. Field tests presented poor models for the inferential variables, due to the limitation of the step tests. Also, there is no online analyzer for the Naphtha’s flash point;
The inferential models were obtained based on laboratory sampled data in different operational conditions. The Naphtha’s flash point was not measured since there are no analyzers covering its expected magnitude;
A dynamic simulator project was built in order to provide engineers with all information necessary for the inferential variables modelling and Identification. Also, the dynamic simulator was used to evaluate the APC strategy;
The software used for simulation is the RSI’s Indiss® suite. The simulation included the Splitter and the Diesel from HDT-D and from the Gasoil HDT stream, which were used to provide the Naphtha’s flash point inferential model.
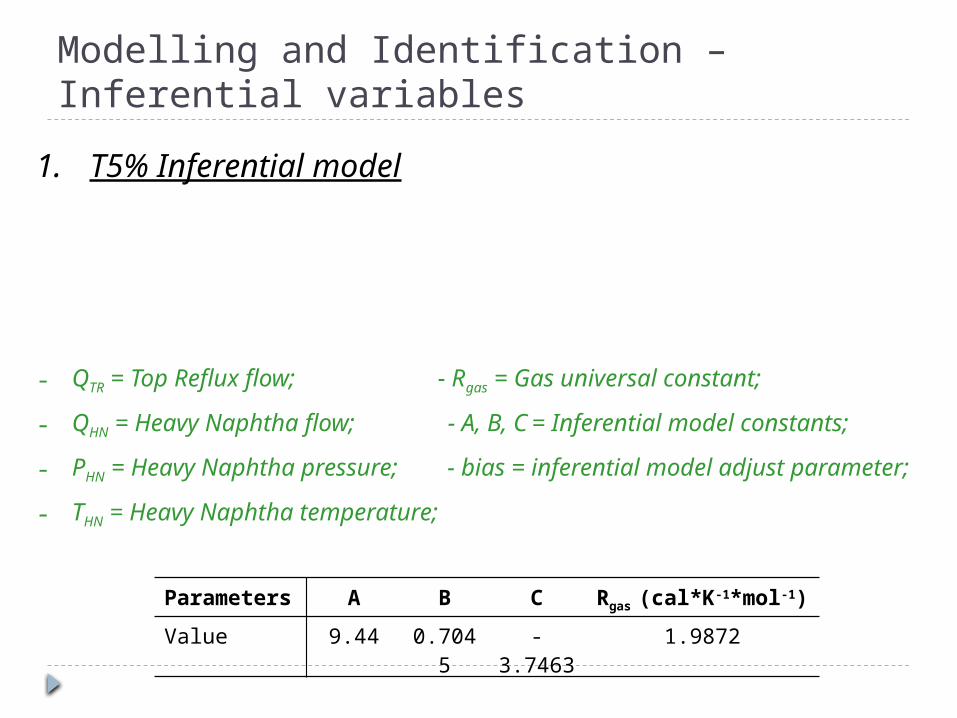
Modelling and Identification – Inferential variables
1. T5% Inferential model
- QTR = Top Reflux flow; - Rgas = Gas universal constant;
- QHN = Heavy Naphtha flow; - A, B, C = Inferential model constants;
- PHN = Heavy Naphtha pressure; - bias = inferential model adjust parameter;
- THN = Heavy Naphtha temperature;Parameters
A B C Rgas (cal*K-1*mol-1)
Value 9.44 0.7045
-3.7463
1.9872
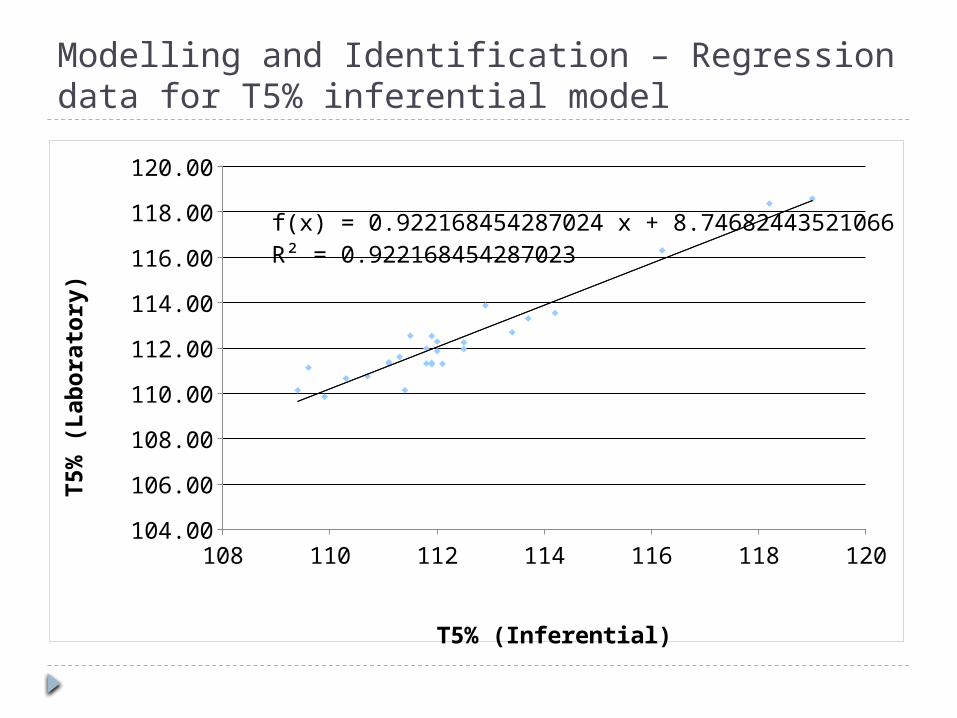
Modelling and Identification – Regression data for T5% inferential model
108 110 112 114 116 118 120104.00
106.00
108.00
110.00
112.00
114.00
116.00
118.00
120.00
f(x) = 0.922168454287002 x + 8.74682443521313R² = 0.922168454287013
T5% (Inferential)
T5
% (
Lab
ora
tory
)

Modelling and Identification – Inferential variables
2. Heavy Naphtha / T5% ratio
3. Reflux Calculated Ratio
QTR = Top Reflux flow; QLN = Light Naphtha flow; QHN = Heavy Naphtha flow;
𝑅𝑄𝑇 5=𝑄𝐻𝑁
𝑇 5%
𝑅𝑅=𝑄𝑇𝑅
𝑄𝑇𝑅+𝑄𝐿𝑁

Modelling and Identification – Naphtha Splitter dynamic simulation
Transmitter1
74.43
Sheet
Sheet1
T5
111.92 +
T0
107.41
B8423.45 kg/s
FI785
29.42
FI783
28.56
PI7837.85
TI789
25.40
TI785
25.10
TI786
45.91
TI784
45.95
TI783
39.51
TI788
169.30
TI790
169.30
TI791
174.81
TI792
92.14
TI782
102.84
TI781
108.33
DS501
1.01e+005 Pa352 K29.54 kg/s
29.54 kg/sValve27
2.70 kg/sValve26
2.70 kg/sValve25
0.00 kg/sValve3
11.39 kg/sValve2
CargaT21080v2
6.00e+006 Pa366 K11.39 kg/s
OPCClient
OPCClient1
RFC786
84.29
HOSTFC
CIN786
RLC781
65.69
HOSTLC
CIN781
RTC7870.00
HOSTTC
CIN787
RFC7840.00
HOSTFC
CIN784
RLC782
67.82
HOSTLC
CIN782
RPC781B0.00
HOSTPC
CIN781B
RPC781A6.00
HOSTPC
CIN781A
RFC782
27.03
HOSTFC
CIN782
RPC782
42.41
HOSTPC
CIN782
RFC781
73.56
HOSTFC
CIN781
TB90
152.08
TB10
56.36
Flash5
-40.42
AnalyserDEE
AnalyserDEE5
Flash3
37.37
AnalyserDEE
AnalyserDEE4
Flash2
47.23
FI2620.00
FC262
FC272
FI272
100.00
0.00 kg/sValve24
23.45 kg/sValve23
DS500
1.01e+005 Pa354 K23.45 kg/s
DS50
1.01e+005 Pa345 K0.00 kg/s
BatteryLimit2
1.01e+005 Pa345 K0.00 kg/s
BatteryLimit1
1.01e+005 Pa290 K0.00 kg/s
0.00 kg/sValve22
0.00 kg/sValve21
0.00 kg/sValve206.25 kg/sValve4
AnalyserDEE
AnalyserDEE3
23.30 kg/sFC272086
0.00 kg/sFC26219
S500
Level : 100.00 %
Temperature : 354.23 K
S50
Level : 0.00 %
Temperature : 345.29 K
U272D
1.00e+006 Pa366 K23.30 kg/s
U262
1.00e+006 Pa366 K0.00 kg/s
Flash1
9.57
T10
116.42
AnalyserDEE
AnalyserDEE2
P82
Ta10
43.03
AnalyserDEE
AnalyserDEE1
Flash
-51.90
Flow Prod
29.34
FI781
60.32
15.73 kg/sValve19
AguaResf2
2.00e+005 Pa298 K15.73 kg/s
15.73 kg/sValve18
SAguaResf2
1.01e+005 Pa348 K15.73 kg/s
41.30 kg/sValve17
SAguaResf1
1.01e+005 Pa300 K41.30 kg/s
41.30 kg/sValve16
AguaResf1
2.00e+005 Pa298 K41.30 kg/s
68.46 kg/sValve15
68.46 kg/sValve14
SAguaResf
1.01e+005 Pa305 K68.46 kg/s
AguaResf
2.00e+005 Pa298 K68.46 kg/s
32.77 kg/sValve13
32.77 kg/sValve11
TI787
150.23
TC787
FI7865.62
FC786
FC781
FI782
12.01
FC782
5.61 kg/sValve9
6.25 kg/sValve8
FI784
29.42
FC784
0.00 kg/sV784
6.25 kg/sValve6
PC781A
LC782
LI782
47.90
LC781
LI781
50.05
PC781B
PI7810.99
PC782
PI7821.51
6.25 kg/sV782
NaftaPetr
1.00e+005 Pa298 K5.61 kg/s
7.84 kg/sValve12
Tocha
1.01e+005 Pa319 K0.00 kg/s
0.00 kg/sV781B
7.90 kg/sValve10
7.61 kg/sV787
0.23 kg/sV781A
7.84 kg/sValve7
V21080
P ressure : 9.53e+004 P a
Level : 50.05 %Temperature : 319.10 K
1.56 kg/sV786
1.56 kg/sValve1
C16
1.50e+006 Pa444 K1.56 kg/s
V16
1.75e+006 Pa523 K1.56 kg/s
5.61 kg/sV783
2.29 kg/sV785
B836.25 kg/s
B817.90 kg/s
P85
P81
P86
11.39 kg/sValve5
GOL1
5.00e+005 Pa365 K2.70 kg/s
11.39 kg/sV781
P65
GOL
1.09e+006 Pa453 K2.70 kg/s
CargaT21080
6.00e+006 Pa366 K0.00 kg/s
Fundo
47.90 %442 K
2.8e+005 Pa
T210802.47e+005 Pa
369.852
Naphtha Splitter
Splitter’s Feed
Blending System
HDT-D Diesel
HDT-GOK Diesel
Medium Pressure Steam Virtual Plant
Heavy Naphtha analyzer

Modelling and Identification – Naphtha’s Flash point vs T5% (dynamic simulation)
7.00
7.50
8.00
8.50
9.00
9.50
10.00
10.50
f(x) = 0.846857386941746 x − 85.0796143310715R² = 0.998597702601914
Naphtha’s T5% (oC)
Nap
hth
a’s
Fla
sh
Poin
t (o
C)

Modelling and Identification – Naphtha’s Flash Point
The bias of the T5% inferential model can be adjusted with a Hu-Burns mixing rules backcalculation method:
Flash Point:
- Pic = Flash point for the i-stream, in ºC; - FPIi = Flash Point Index, i-stream;
- QDS = Blended Diesel flow; - Qi = i-stream flow;
- FPIDS = Flash Point Index, blended Diesel stream;
- PcDS = Flash Point of the blended Diesel stream, in ºF;
𝑃𝑐𝑖=255.372∗( 𝐹𝑃 𝐼𝑖
𝑘1)𝑘2
−273.15
Parameters
k1 k2 X
Value 104 -0.038
-0.06
𝐹𝑃 𝐼𝐷𝑆=( 1𝑄𝐷𝑆
)∑𝑖=1
𝑛
𝐹𝑃 𝐼𝑖∗𝑄𝑖 𝐹𝑃 𝐼𝐷𝑆=(𝑃𝑐
𝐷𝑆+459.69)1 /𝑋∗104
(459.69 )1 /𝑋

Modelling and Identification – Real Plant vs Virtual plant model comparative
0 8 16 24 32 40 48 56 64 72 80 88 96 104 112
-10
-8
-6
-4
-2
0
2
4
6
8
10
Splitter's Feed (varia-tion)
Real Plant Step Response
Time (minutes)
5% (
)D
ToC

Modelling and Identification – Conclusion
The simulator can provide the inferential variables that can not be measured in the real plant;
The curve fitting parameter shows that the virtual plant, when compared to the real plant models, can be used for modelling and Identification of the real plant. Virtual plant-based models have shown consistent results.
Model Regression R2 Fitting parameters
Feed Steam Flow Reflux Flow
Real Virtual Real Virtual Real Virtual
Splitter’s Temperature 0.968 0.987 0.872 0.842 0.948 0.893
Level Controller Output signal 0.886 0.905 0.750 0.529 0.657 0.737
T5% 0.976 0.972 0.611 0.657 0.862 0.861

Modelling and Identification – APC model Matrix (ARX)
- First-Order Plus Dead-Time models; - Time Sample = 1 minute, Settling Time Tr = 60 minutes

Summary
1. Process description
2. Advanced Process Control
3. Modelling and Identification
4. Results
5. Conclusion

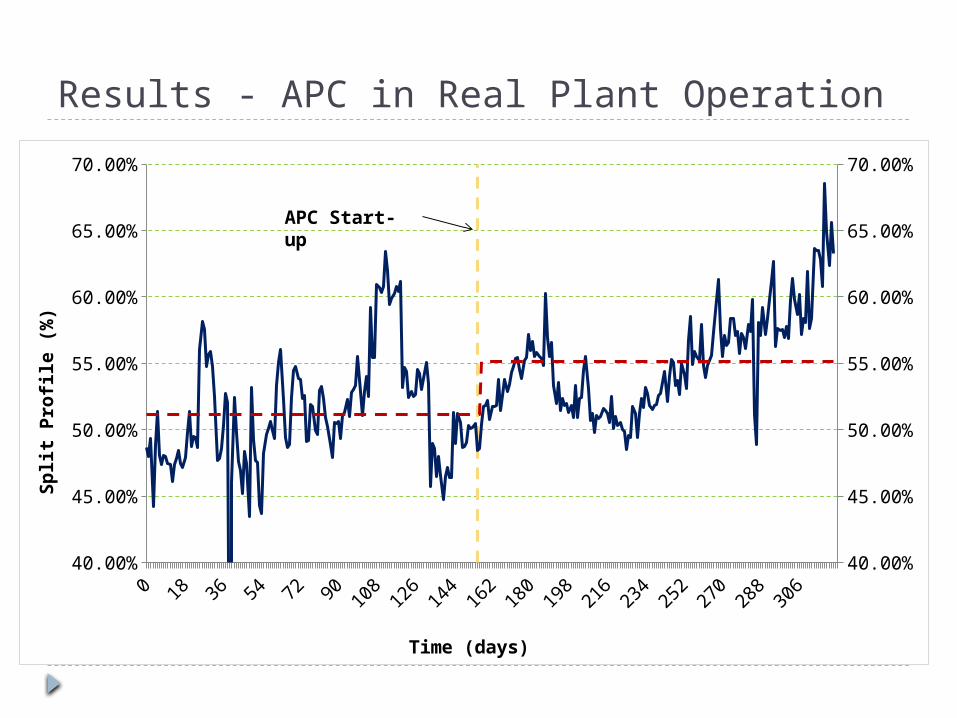
Results
The following results show the application of the APC strategy in the real plant;
The data set is collected from the historian software for a six-month period of time after the APC start-up and comissioning and compared to the units operation before the APC project;
All sampled data (before / after APC) was treated to match regular steady-state operational conditions only, in order to correctly evaluate the control strategy performance. The data that did not satisfy this condition was discarded.

Results - APC in Real Plant Operation
0 15 30 45 60 75 90 105
120
135
150
165
180
195
210
225
240
255
270
285
300
315
25.00
30.00
35.00
40.00
45.00
50.00
25.00
30.00
35.00
40.00
45.00
50.00
Time (days)
Da
ily-a
ve
rag
e H
ea
vy N
ap
hth
a F
low
(m
³/h
)
Time Sample Ts = 1min; Prediction Horizon nr = 60min, Control Horizon nl = 8min:
APC Start-up

Results - APC in Real Plant Operation
0 15 30 45 60 75 90 105
120
135
150
165
180
195
210
225
240
255
270
285
300
315
50.00
55.00
60.00
65.00
70.00
75.00
80.00
85.00
90.00
95.00
100.00
50.00
55.00
60.00
65.00
70.00
75.00
80.00
85.00
90.00
95.00
100.00
Time (days)
Da
ily-a
ve
rag
e S
pli
tte
r’s F
ee
d (
m³/
h)
APC Start-up

Results - APC in Real Plant Operation
0 15 30 45 60 75 90 105
120
135
150
165
180
195
210
225
240
255
270
285
300
315
15.00
20.00
25.00
30.00
35.00
40.00
45.00
50.00
15.00
20.00
25.00
30.00
35.00
40.00
45.00
50.00
Time (days)
He
avy N
ap
hth
a v
s L
igh
t N
ap
hth
a
Flo
w (
m³/
h)
APC Start-up
Results - APC in Real Plant Operation
0 15 30 45 60 75 90 105
120
135
150
165
180
195
210
225
240
255
270
285
300
315
40.00%
45.00%
50.00%
55.00%
60.00%
65.00%
70.00%
40.00%
45.00%
50.00%
55.00%
60.00%
65.00%
70.00%
Time (days)
Sp
lit
Pro
file
(%
)
APC Start-up

Results - APC in Real Plant Operation
0 10 20 30 40 50 60 70 80 90100
110120
130140
150160
170180
190200
0
10
20
30
40
50
60
70
Flash Point Mean + std - std Spec
days
Ble
nd
ed
Die
sel Fla
sh P
oin
t (o
C)
Before APC After APC DAverage Blended Diesel Flash Point giveaway (single tank) 8,49 oC 3.82 oC - 54,8%

Results - APC in Real Plant Operation
Avg: 46.28oCStd: 2.18oC
Avg: 52.08oCStd: 5.03oC
Specification: 41.5oC

Results - Economic Assessment
Averages
Before APC After APC D
Processed Feed (m³/h) 67.27 80.49 19,64%
Heavy Naphtha flow (m³/h) 34.65 44.79 29.27%
MP Steam / Feed ratio (ton/m³)
88.73 93.96 5.90%
Split (%) 51.33 55.61 8.33%
𝑌𝑖𝑒𝑙𝑑=(𝐺1∗ Δ𝑄𝐻𝑁+𝐺2∗ Δ𝑄𝑆𝑇𝐸𝐴𝑀)∗𝑇 𝑂𝑁G1 = Price difference between Diesel and Naphtha in $/m³G2 = MP steam cost, in $/ton;DHN = ;;TON

Summary
1. Process description
2. Advanced Process Control
3. Modelling and Identification
4. Results
5. Conclusion

Conclusion
The APC improved the operational reliability by compensanting the variations on feed quality and maintining the splitter in its optimal operation point;
The economic benefits achieved by the APC control are expressive when compared to the low cost of implementation. Based on the actual costs of Diesel and Naphtha, the economic yields of the APC implementation are calculated in over $5MM.
Dynamic simulation is a powerfull tool for modelling and identification and improved the control system reliability. This tool was fundamental to provide inferential models for the variables that would, otherwise, not be controlled.

Optimizing Diesel Production UsingAdvanced Process Control and Dynamic
Simulation
Márcio R. S. Garcia1,
Renato N. Pitta2,
Gilvan A. G. Fischer2,
Enéas R. N. Neto2
1Radix Engenharia e Desenvolvimento de Software Ltda, Rio de Janeiro, RJ, Brazil (e-mail: [email protected])
2Refinaria Henrique Lage, São José dos Campos, SP, Brazil (e-mail: [email protected] , [email protected] , [email protected] )