Optimization of Surface Roughness of EN8 Steel by … · Optimization of Surface Roughness of EN8...
5
International Journal of Science and Research (IJSR) ISSN (Online): 2319-7064 Impact Factor (2012): 3.358 Volume 3 Issue 11, November 2014 www.ijsr.net Licensed Under Creative Commons Attribution CC BY Optimization of Surface Roughness of EN8 Steel by Changing Cutting Parameters and Insert Geometry in Turning Process K. G. Nikam 1 , S. S. Kadam 2 1 P.G.Student, Production Engineering Department, K.I.T.’s College of Engineering, Kolhapur, Maharashtra, India 2 Assistant Professor, Mechanical Engineering Department, K.I.T.’s College of Engineering, Kolhapur, Maharashtra, India Abstract: Good surface quality is desired for the proper functioning of the produced parts. In the present study it was seen that the desired surface roughness were not obtained consistently in turning of EN 8 steel applications (camshaft). These higher values of surface roughness results in rework and increases cost hence the main objective is optimization of surface roughness. Lots of optimization researches for finish turning were either accomplished within certain manufacturing purposes, or achieved through various equipment operations. Therefore, a general optimization of surface roughness is deemed to be necessary for the most of manufacturing industry. The surface quality is influenced by cutting speed, feed rate and depth of cut and many other parameters. In the present study attempt has been made to investigate the effect of cutting parameters(cutting speed, feed rate, depth of cut) and insert geometry(CNMG and TNMG type insert) on surface roughness in the finish turning of EN 8 steel. The experiments have been conducted using L9 orthogonal array in a SPEED LX 200 MAJOR CNC lathe machine. Turning process carried out on the EN 8 steel. The optimum cutting condition was determined surface roughness were evaluated by the analysis of variance (ANOVA). Keywords: Turning, Surface roughness, insert geometry, ANOVA, Taguchi Method 1. Introduction In the study of metal cutting, the output quality is rather important. A significant improvement in output quality may be obtained by proper tool and work piece combination, optimizing the cutting parameters. Tool insert is not only improves output quality, but also ensures low cost manufacturing. Tool insert include tool insert geometry such as nose radius, approach angle, rake angle, angle of inclination, clearance angle etc. Cutting parameters include feed rate, cutting speed, depth of cut, cutting fluids and so on. In machining of parts, surface quality is one of the most specific customer requirements where major indication of surface quality on machined parts is surface roughness value [1]. EN8 or 080M40 is unalloyed medium carbon steel which has medium strength and good tensile strength; it is suitable for manufacture of shafts, studs, keys, general purpose axles etc [7]. Taha et al. [2] were compared the experimental surface roughness value with theoretical surface roughness of two types of insert, ‘C’ type and ‘T’ type. The feed rate varied within the recommended feed rate range. It observed that there are large deviations between measured and theoretical surface roughness at low feed rates (0.05mm/rev) for both inserts. Patel et al. [3] have considered a novel approach for optimum cutting tool insert selection strategy. In this approach, two well-known Multiple Attribute Decision Making (MADM) methods such as Simple Additive Weighting (SAW) and Weighted Product Method (WPM) use for a case study of tool insert selection for better surface finish in CNC (Computer Numerical Control) turning operation. In these methods their relative performance are compared with respect to ranking of alternative and from ranking they have selected best tool insert for better surface quality during turning operation on alloy steel using CNC turning centre. Bhattacharya et al. [4] have investigated the effect of cutting parameters on surface finish and power consumption during high speed machining of AISI 1045 steel using Taguchi design and ANOVA. The result showed a significant effect of cutting speed on surface roughness and power consumption, while the other parameters have not substantially affected the response. Thangarasu et al. [5] studied relationship with the basic parameters to the responses namely Surface roughness (Ra) and Material Removal Rate (MRR). Depth of cut for better surface finish and material removal rate. The Ra and MRR is resultant of various controllable process parameters are Spindle speed, Feed rate and Depth of Cut. Depth of cut was found as the most critical factor for attaining the desired MRR while reducing the value of surface roughness. Kabra et al. [6] studied on three machining parameters as process parameters: Cutting Speed, Feed rate and Depth of cut. The experimentation plan is designed using DOE and Minitab-16 statistical software is used. Optimal values of process parameters for desired performance characteristics are obtained by design of experiment. Prediction models are developed with the help of regression analysis method using Minitab-16 software and finally the optimal and predicted results are also verified with the help of confirmation experiments. Ilhan Asilturk and Harun Akkus [8] obtained the effect of cutting parameters on surface roughness in hard turning using the Taguchi method. In this study, dry turning test carried out on hardened AISI 4140 (51 HRC) with coated carbide cutting tools. The statistical methods of signal-to-noise (S/N) ratio and analysis of variance (ANOVA) are applied to obtained effect of cutting parameters on surface roughness. Kumar et al. [13] obtained the effect of spindle speed and feed rate on surface roughness of Carbon Alloy Steel in CNC turning. In this study, five different carbon steel used for turning are SAE 8620, EN8, EN19, EN24 and EN47. As a result, it was Paper ID: OCT141235 1331
Transcript of Optimization of Surface Roughness of EN8 Steel by … · Optimization of Surface Roughness of EN8...
International Journal of Science and Research (IJSR) ISSN (Online): 2319-7064
Impact Factor (2012): 3.358
Volume 3 Issue 11, November 2014 www.ijsr.net
Licensed Under Creative Commons Attribution CC BY
Optimization of Surface Roughness of EN8 Steel by Changing Cutting Parameters and Insert Geometry
in Turning Process
K. G. Nikam1, S. S. Kadam2
1P.G.Student, Production Engineering Department, K.I.T.’s College of Engineering, Kolhapur, Maharashtra, India
2Assistant Professor, Mechanical Engineering Department, K.I.T.’s College of Engineering, Kolhapur, Maharashtra, India
Abstract: Good surface quality is desired for the proper functioning of the produced parts. In the present study it was seen that the desired surface roughness were not obtained consistently in turning of EN 8 steel applications (camshaft). These higher values of surface roughness results in rework and increases cost hence the main objective is optimization of surface roughness. Lots of optimization researches for finish turning were either accomplished within certain manufacturing purposes, or achieved through various equipment operations. Therefore, a general optimization of surface roughness is deemed to be necessary for the most of manufacturing industry. The surface quality is influenced by cutting speed, feed rate and depth of cut and many other parameters. In the present study attempt has been made to investigate the effect of cutting parameters(cutting speed, feed rate, depth of cut) and insert geometry(CNMG and TNMG type insert) on surface roughness in the finish turning of EN 8 steel. The experiments have been conducted using L9 orthogonal array in a SPEED LX 200 MAJOR CNC lathe machine. Turning process carried out on the EN 8 steel. The optimum cutting condition was determined surface roughness were evaluated by the analysis of variance (ANOVA). Keywords: Turning, Surface roughness, insert geometry, ANOVA, Taguchi Method
1. Introduction In the study of metal cutting, the output quality is rather important. A significant improvement in output quality may be obtained by proper tool and work piece combination, optimizing the cutting parameters. Tool insert is not only improves output quality, but also ensures low cost manufacturing. Tool insert include tool insert geometry such as nose radius, approach angle, rake angle, angle of inclination, clearance angle etc. Cutting parameters include feed rate, cutting speed, depth of cut, cutting fluids and so on. In machining of parts, surface quality is one of the most specific customer requirements where major indication of surface quality on machined parts is surface roughness value [1]. EN8 or 080M40 is unalloyed medium carbon steel which has medium strength and good tensile strength; it is suitable for manufacture of shafts, studs, keys, general purpose axles etc [7]. Taha et al. [2] were compared the experimental surface roughness value with theoretical surface roughness of two types of insert, ‘C’ type and ‘T’ type. The feed rate varied within the recommended feed rate range. It observed that there are large deviations between measured and theoretical surface roughness at low feed rates (0.05mm/rev) for both inserts. Patel et al. [3] have considered a novel approach for optimum cutting tool insert selection strategy. In this approach, two well-known Multiple Attribute Decision Making (MADM) methods such as Simple Additive Weighting (SAW) and Weighted Product Method (WPM) use for a case study of tool insert selection for better surface finish in CNC (Computer Numerical Control) turning operation. In these methods their relative performance are compared with respect to ranking of alternative and from ranking they have selected best tool insert for better surface quality during turning operation on
alloy steel using CNC turning centre. Bhattacharya et al. [4] have investigated the effect of cutting parameters on surface finish and power consumption during high speed machining of AISI 1045 steel using Taguchi design and ANOVA. The result showed a significant effect of cutting speed on surface roughness and power consumption, while the other parameters have not substantially affected the response. Thangarasu et al. [5] studied relationship with the basic parameters to the responses namely Surface roughness (Ra) and Material Removal Rate (MRR). Depth of cut for better surface finish and material removal rate. The Ra and MRR is resultant of various controllable process parameters are Spindle speed, Feed rate and Depth of Cut. Depth of cut was found as the most critical factor for attaining the desired MRR while reducing the value of surface roughness. Kabra et al. [6] studied on three machining parameters as process parameters: Cutting Speed, Feed rate and Depth of cut. The experimentation plan is designed using DOE and Minitab-16 statistical software is used. Optimal values of process parameters for desired performance characteristics are obtained by design of experiment. Prediction models are developed with the help of regression analysis method using Minitab-16 software and finally the optimal and predicted results are also verified with the help of confirmation experiments. Ilhan Asilturk and Harun Akkus [8] obtained the effect of cutting parameters on surface roughness in hard turning using the Taguchi method. In this study, dry turning test carried out on hardened AISI 4140 (51 HRC) with coated carbide cutting tools. The statistical methods of signal-to-noise (S/N) ratio and analysis of variance (ANOVA) are applied to obtained effect of cutting parameters on surface roughness. Kumar et al. [13] obtained the effect of spindle speed and feed rate on surface roughness of Carbon Alloy Steel in CNC turning. In this study, five different carbon steel used for turning are SAE 8620, EN8, EN19, EN24 and EN47. As a result, it was
Paper ID: OCT141235 1331

International Journal of Science and Research (IJSR) ISSN (Online): 2319-7064
Impact Factor (2012): 3.358
Volume 3 Issue 11, November 2014 www.ijsr.net
Licensed Under Creative Commons Attribution CC BY
concluded that the surface roughness increased with increased feed rate and it higher at lower speeds and vice versa. The objective of this study is obtain optimal turning conditions (cutting speed, feed rate and depth of cut) for minimizing the Ra when turning EN 8 steel material with three different CVD coated carbide inserts and also select the best insert. These cutting inserts are selected by MADM (Multiple Attribute Decision Making) method. Taguchi’s L9 Orthogonal Array was used in the design of experiment. Furthermore, analysis of variance (ANOVA) is performed to see which process parameters are statistically significant. 2. Experimental Details 2.1 Material The sample was EN 8 steel in the form of round bar with 110 mm diameter and 1000 mm cutting length. This steel is especially recommended for the manufacture of shafts, studs, keys, general purpose axles, camshafts etc. In the study it is used for camshaft application. The hardness range is 28-32 HRC. 2.2 Cutting inserts In this experimental study CVD coated carbide inserts used as the cutting tool material. The TaeguTec inserts with the ISO designation of CNMG 120408FG-TT5100, CNMG 120412FC-TT5100 (800 Rhombic insert) and TNMG 160408 FG-TT5100 were used. For CNMG inserts PCLNL 2525 M12 tool holder were used. For TNMG inserts MTJNR 2525 M16 tool holder were used. 2.3 Cutting condition and surface roughness Measurements The experiments carried out under wet environment using SPEED LX 200 MAJOR CNC lathe which have maximum spindle speed of 3500 rpm and a maximum spindle power of 15 kw. The coolant used is water soluble oil (Metcut brand). In this study, three factors were studied and their low–middle–high levels are given in Table 1. After the experiments, Average surface (Ra) value which is one of the most important machinability criteria was measured by using Mitutoyo’s Surftest surface roughness tester within sampling length 2.5 mm. The Taguchi method and L9 Orthogonal Array were used to reduce variance for the experiments with optimum setting of control parameters. It also provides a set of well balanced (minimum) experiments serve as objective function for optimization.
Table 1: Cutting Parameters Factor Cutting parameters Level 1 Level 2 Level 3
Vc Cutting speed (m/min) 200 225 250 F Feed (mm/rev) 0.2 0.23 0.25
DOC Depth of cut (mm) 0.5 1 1.5
3. Design of Experiments Taguchi’s L9 Orthogonal Array was used in the design of experiment. Taguchi technique is a powerful tool for the design of high quality systems. It also provides simple, efficient and systematic approach to optimize designs for performance, quality and cost. Taguchi technique is efficient tool for designing process that operates consistently and optimally over a variety of conditions. Taguchi technique is an experimental design technique, which is useful in reducing the number of experiments by using orthogonal arrays. Taguchi’s approach to design of experiments is easy to adopt and apply for users with limited knowledge of statistics; hence it has gained a wide popularity in the engineering and scientific community [14]. The main objective of Taguchi method is to ensure quality in the design phase. Taguchi technique also allows controlling the variations caused by the uncontrollable factors which are not taken into consideration at traditional design of experiment. Taguchi technique converts the objective function values to signal-to-noise (S/N) ratio for measure the performance characteristics of the levels of control factors against these factors. Signal-to-noise (S/N) ratio is defined as the desired signal ratio for the undesired random noise value and shows the quality characteristics of the experimental data [10, 11]. Depending upon type of response, S/N ratio characteristics can be divided into three categories given by Eqns (1)-(3), when characteristic is continuous [9]: • Nominal is the best characteristic,
• Smaller is the better characteristic,
• Larger is the better characteristic,
This indicated that engineering systems behave in such a way that the manipulated production factors can be divided into three categories: where, y is the average of observed data, S2 y the variation of y, n the number of observations, and y the observed data or each type of the characteristics. Deviation between experimental and desired values is defined as loss function in the Taguchi technique. This loss function is then converted into S/N signal–noise ratio [12].In the Taguchi technique, the optimum cutting conditions required for the best surface roughness were obtained by using Eq. (1), ‘‘the smaller-the better’’ signal–noise ratio. S/N ratios and level values were calculated by using Eq. (2), ‘‘the smaller-the better’’ in the MINITAB 17 Program. . S/N ratios obtained from this equation are given in Table 2.ANOVA is used to evaluate effect of the cutting parameters on surface roughness. The optimum combination of the cutting parameters (i.e. cutting speed, feed rate, and depth of cut) is determined by the help of ANOVA and S/N ratios. Finally, confirmation experiments are done using the
Paper ID: OCT141235 1332
International Journal of Science and Research (IJSR) ISSN (Online): 2319-7064
Impact Factor (2012): 3.358
Volume 3 Issue 11, November 2014 www.ijsr.net
Licensed Under Creative Commons Attribution CC BY
optimum machining parameters which were found by taguchi optimization technique and thereby validation of the optimization is tested.
Table 2: The results of experiments and S/N ratios values
for insert CNMG 120408 FG Exp. No. Vc F DOC Ra1 SNRA1
1 200 0.2 0.5 2.96 -9.4309 2 200 0.23 1 4.16 -12.3819 3 200 0.25 1.5 4.56 -13.1793 4 225 0.2 1 3.63 -11.1981 5 225 0.23 1.5 4.08 -12.2132 6 225 0.25 0.5 4.26 -12.5882 7 250 0.2 1.5 2.97 -9.45513 8 250 0.23 0.5 3.92 -11.8657 9 250 0.25 1 4.43 -12.9281
Table 3: The results of experiments and S/N ratios values
for insert CNMG 120412 FC Exp. No. Vc F DOC Ra2 SNRA2
1 200 0.2 0.5 1.34 -2.5421 2 200 0.23 1 1.56 -3.86249 3 200 0.25 1.5 1.94 -5.75603 4 225 0.2 1 1.41 -2.98438 5 225 0.23 1.5 1.63 -4.24375 6 225 0.25 0.5 2.05 -6.23508 7 250 0.2 1.5 1.36 -2.67078 8 250 0.23 0.5 1.84 -5.29636 9 250 0.25 1 1.93 -5.71115
Table 4: The results of experiments and S/N ratios values
for insert TNMG 160408 FG Exp. No. Vc F DOC Ra3 SNRA3
1 200 0.2 0.5 1.65 -4.34968 2 200 0.23 1 2.4 -7.60422 3 200 0.25 1.5 3.02 -9.60014 4 225 0.2 1 1.75 -4.86076 5 225 0.23 1.5 2.53 -8.06241 6 225 0.25 0.5 2.63 -8.39911 7 250 0.2 1.5 1.81 -5.15357 8 250 0.23 0.5 2.25 -7.04365 9 250 0.25 1 2.84 -9.06637
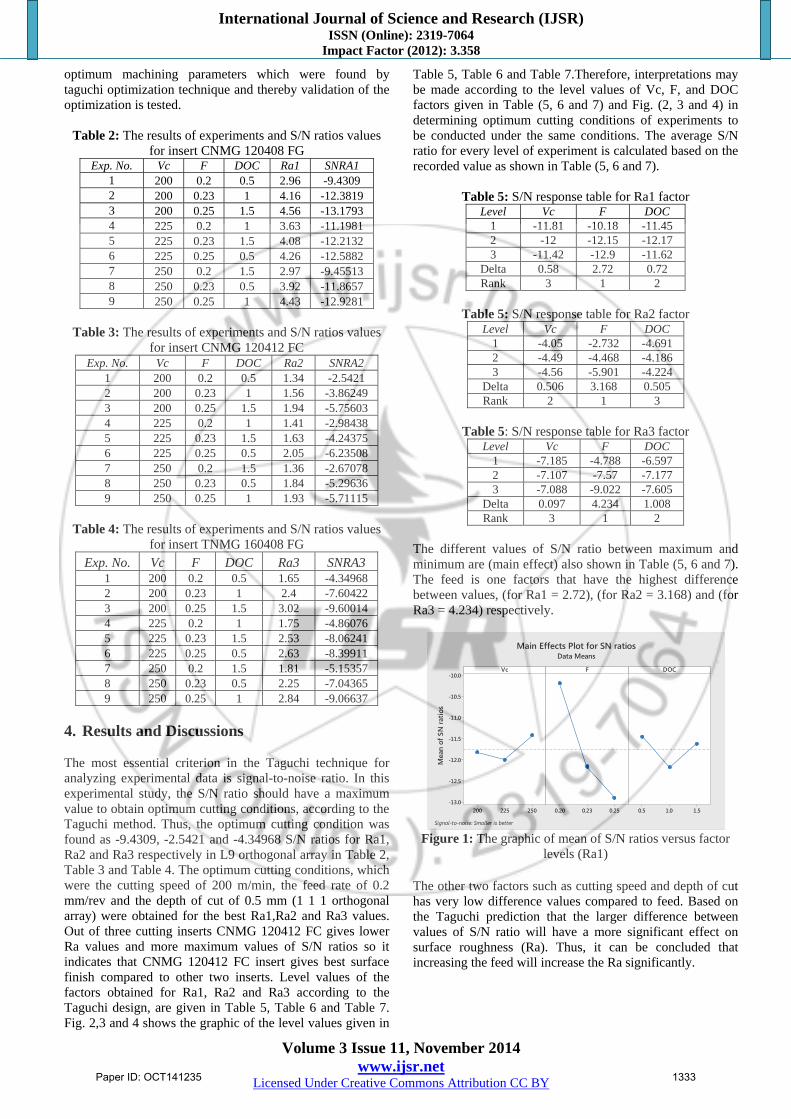
4. Results and Discussions The most essential criterion in the Taguchi technique for analyzing experimental data is signal-to-noise ratio. In this experimental study, the S/N ratio should have a maximum value to obtain optimum cutting conditions, according to the Taguchi method. Thus, the optimum cutting condition was found as -9.4309, -2.5421 and -4.34968 S/N ratios for Ra1, Ra2 and Ra3 respectively in L9 orthogonal array in Table 2, Table 3 and Table 4. The optimum cutting conditions, which were the cutting speed of 200 m/min, the feed rate of 0.2 mm/rev and the depth of cut of 0.5 mm (1 1 1 orthogonal array) were obtained for the best Ra1,Ra2 and Ra3 values. Out of three cutting inserts CNMG 120412 FC gives lower Ra values and more maximum values of S/N ratios so it indicates that CNMG 120412 FC insert gives best surface finish compared to other two inserts. Level values of the factors obtained for Ra1, Ra2 and Ra3 according to the Taguchi design, are given in Table 5, Table 6 and Table 7. Fig. 2,3 and 4 shows the graphic of the level values given in
Table 5, Table 6 and Table 7.Therefore, interpretations may be made according to the level values of Vc, F, and DOC factors given in Table (5, 6 and 7) and Fig. (2, 3 and 4) in determining optimum cutting conditions of experiments to be conducted under the same conditions. The average S/N ratio for every level of experiment is calculated based on the recorded value as shown in Table (5, 6 and 7).
Table 5: S/N response table for Ra1 factor
Level Vc F DOC 1 -11.81 -10.18 -11.45 2 -12 -12.15 -12.17 3 -11.42 -12.9 -11.62
Delta 0.58 2.72 0.72 Rank 3 1 2
Table 5: S/N response table for Ra2 factor
Level Vc F DOC1 -4.05 -2.732 -4.6912 -4.49 -4.468 -4.1863 -4.56 -5.901 -4.224
Delta 0.506 3.168 0.505Rank 2 1 3
Table 5: S/N response table for Ra3 factor
Level Vc F DOC 1 -7.185 -4.788 -6.597 2 -7.107 -7.57 -7.177 3 -7.088 -9.022 -7.605
Delta 0.097 4.234 1.008 Rank 3 1 2
The different values of S/N ratio between maximum and minimum are (main effect) also shown in Table (5, 6 and 7). The feed is one factors that have the highest difference between values, (for Ra1 = 2.72), (for Ra2 = 3.168) and (for Ra3 = 4.234) respectively.
Figure 1: The graphic of mean of S/N ratios versus factor
levels (Ra1)
The other two factors such as cutting speed and depth of cut has very low difference values compared to feed. Based on the Taguchi prediction that the larger difference between values of S/N ratio will have a more significant effect on surface roughness (Ra). Thus, it can be concluded that increasing the feed will increase the Ra significantly.
250225200
-10.0
-10.5
-11.0
-11.5
-12.0
-12.5
-13.00.250.230.20 1.51.00.5
Vc
Mea
n of
SN
ratio
s
F DOC
Main Effects Plot for SN ratiosData Means
Signal-to-noise: Smaller is better
Paper ID: OCT141235 1333

International Journal of Science and Research (IJSR) ISSN (Online): 2319-7064
Impact Factor (2012): 3.358
Volume 3 Issue 11, November 2014 www.ijsr.net
Licensed Under Creative Commons Attribution CC BY
Figure 2: The graphic of mean of S/N ratios versus factor
levels (Ra2)
Figure 3: The graphic of mean of S/N ratios versus factor
levels (Ra3)
MINITAB is Statistical Analysis software that allows to easily conducting analysis of data. The MINITAB 17 program studies the experimental data and then provides the calculated results of signal-to-noise ratio. In this experimental work, the software has given the signal-to-noise ratio for surface roughness. The effect of different process parameters on surface roughness are calculated and plotted as the process parameters changes from one level to another. The use of both ANOVA and S/N ratio statistical method makes it easy to analyze the results and hence, make it fast to reach on the conclusion. From Fig (1 and 3) it can be seen that with increase of feed rate and depth of cut surface roughness value would increase. From figure 2 it can be seen that with increase of feed rate surface roughness value would increase. If compare three figures it can be seen that feed rate affects the surface finish than other cutting parameters. Best surface roughness value is obtained at low value of feed rate. In addition, the graph shows that CNMG 120408 FC insert type gives better surface finish as feed rate increase as compare to other two types of inserts.
Table 6: Analysis of Variance of SN ratios for Surface
roughness Ra1 Source DF Adj SS Adj MS F-Value P-Value% contribution
Vc 2 0.07887 0.003943 0.88 0.532 3.1642F 2 2.17807 1.08903 24.31 0.04 87.3814
DOC 2 0.14607 0.07303 1.63 0.38 5.8601Error 2 0.0896 0.0448 3.5946Total 8 2.4926 100.0000
Table 7: Analysis of Variance of SN ratios for Surface roughness Ra2
Source DF Adj SS Adj MS F-Value P-Value% contributionVc 2 0.01647 0.008233 1.08 0.481 2.745F 2 0.54607 0.273033 35.77 0.027 91.012
DOC 2 0.0222 0.0111 1.45 0.407 3.700Error 2 0.01527 0.007633 2.545Total 8 0.6 100.002
Table 8: Analysis of Variance of SN ratios for Surface
roughness Ra3 Source DF Adj SS Adj MS F-Value P-Value% contribution
Vc 2 0.00607 0.003033 0.84 0.543 0.312 F 2 1.81727 0.908633 252.4 0.004 93.394
DOC 2 0.11527 0.057633 16.01 0.059 5.924 Error 2 0.0072 0.0036 0.370 Total 8 1.9458 100.000
In ANOVA if the P value of factor is less than 0.05 then that factor is significant and if P value is more than 0.05 then that factor is insignificant. Table (6, 7 and 8) shows the analysis of variance for surface roughness Ra1, Ra2 and Ra3. It is clear from the table (6, 7 and 8) that feed rate is the most significant factor for surface roughness Ra1, Ra2 and Ra3. Effect of cutting speed and depth of cut is insignificant in the present study as compared with other cutting parameters for surface roughness Ra1. 5. Conclusion From the analysis of the results in the turning process using the signal-to-noise (S/N) ratio approach, analysis of variance (ANOVA) and Taguchi’s optimization method, the following can be concluded from the present study. Highest surface finish (lowest Ra) is obtained at a cutting
speed of 200 m/min, feed rate of 0.2 mm/revolutions and a depth of cut of 0.5mm.
Best surface roughness is obtained from CNMG 120412 FC insert than other two type of insert.
The results of ANOVA for surface roughness show that feed rate is most significant parameter which affects the surface finish than other cutting parameters. The cutting speed and depth of cut are least significant parameters.
Best surface roughness at high cutting speed (i.e. 250 m/min) is obtained from CNMG 120412 FC insert.
Satisfying results were obtained so that they may be used in future research work and industrial studies.
References [1] M. Anthony Xavior, M. Adithan, Determining the
influence of cutting fluids on tool wear and surface roughness during turning of AISI 304 austenic stainless steel, Journal of Materials Processing Technology 209, 2009, 900-909.
[2] Zahari Taha, H.K.Lelana, Hideki Aoyama, “Effect of insert geometry on surface roughness in the turning process of AISI D2”, The 11th Asia Pacific Industrial Engineering and Management System Conference,7-10 December,2010.
[3] Nikunj V. Patel, R. K. Patel, U. J. Patel, B. P. Patel, “A novel approach for selection of tool insert in CNC turning process using MADM methods”, International
250225200
-3.0
-3.5
-4.0
-4.5
-5.0
-5.5
-6.0
0.250.230.20 1.51.00.5
Vc
Mea
n of
SN
ratio
sF DOC
Main Effects Plot for SN ratiosData Means
Signal-to-noise: Smaller is better
250225200
-5
-6
-7
-8
-9
0.250.230.20 1.51.00.5
Vc
Mea
n of
SN
ratio
s
F DOC
Main Effects Plot for SN ratiosData Means
Signal-to-noise: Smaller is better
Paper ID: OCT141235 1334

International Journal of Science and Research (IJSR) ISSN (Online): 2319-7064
Impact Factor (2012): 3.358
Volume 3 Issue 11, November 2014 www.ijsr.net
Licensed Under Creative Commons Attribution CC BY
Journal of Engineering and Advanced Technology (IJEAT) ISSN: 2249 – 8958, Volume-1, Issue-5, June 2012.
[4] A.Bhattacharya,S.Das, P.Majumdar and A. Batish, “Estimating the effect of cutting parameters on surface finish and power consumption during high speed machining of AISI 1045 steel using Taguchi design and ANOVA”, Prod. Eng.Res.Devel, Volume 3, pages 31-40, 2009.
[5] V. S. Thangarasu, G. Devaraj, R. Sivasubramanian, “High speed CNC machining Optimization of process parameters”, International Journal of Engineering, Science and Technology Vol. 4, No. 3, pp. 66-77, 2012.
[6] Ashish Kabra, Amit Agarwal, Vikas Agarwal, Sanjay Goyal, Ajay Bangar “Parametric Optimization & Modeling for Surface Roughness, Feed and Radial Force of EN-19/ANSI-4140 Steel in CNC Turning Using Taguchi and Regression Analysis Method”, International Journal of Engineering Research and Applications (IJERA) ISSN: 2248-9622 Vol. 3, Issue 1, pp.1537-1544,2013.
[7] http://www.steelexpress.co.uk/engineeringsteel/EN8.html .
[8] Ilhan Asilturk , Harun Akkus, “Determining the effect of cutting parameters on surface roughness in hard turning using the Taguchi method” Measurement 44 (2011) 1697–1704.
[9] R. Shetty, R.B. Pai, S.S. Rao, R. Nayak, Taguchi’s technique inmachining of metal matrix composites, J. Braz. Soc. Mech. Sci. Eng.31 (1) (2009) 12–20.
[10] M. Kurt, E. Bagci, Y. Kaynak, Application of Taguchi methods in the optimization of cutting parameters for surface finish and hole diameter accuracy in dry drilling progress, Int. J. Adv. Manuf. Technol. 40 (2009) 458– 469.
[11] M. Gunay, A. Kacal, Y. Turgut, Optimization of machining parameters in milling of Ti–6Al–4V alloy using Taguchi method, e-J. New World Sci. Acad. Eng. Sci. 6 (1) (2011) 428–440.
[12] Vikas Upadhyay , P.K. Jain, N.K. Mehta, “In-process prediction of surface roughness in turning of Ti–6Al–4V alloy using cutting parameters and vibration signals” Measurement 46 (2013) 154–160.
[13] N. Satheesh Kumar, Ajay Shettyb, Ashay Shetty,Ananth Kb , Harsha Shetty, “Effect of spindle speed and feed rate on surface roughness of Carbon Steels in CNC turning” International Conference on Modeling,Optimization and Computing (ICMOC 2012).
[14] D.C.Montgomery, (1997), Design and analysis of experiments, 4th edition, John Wiley & sons.
References
Mr. K. G. Nikam , 1) PG student in Department of Production Engineering ,Class: M.E.(Mechanical Production) Part-II, KIT’s college of engineering, Kolhapur, Maharashtra, India Prof S. S. Kadam, Associate professor in Department of Mechanical Engineering, KIT’s College of Engineering, Kolhapur, Maharashtra, India
Paper ID: OCT141235 1335