Optimization of Bioactive Fortification in Apple Snacks...
8
Food and Nutrition Sciences, 2010, 2, 45-52 doi:10.4236/fns.2010.12008 Published Online October 2010 (http://www.SciRP.org/journal/fns) Copyright © 2010 SciRes. FNS 45 Optimization of Bioactive Fortification in Apple Snacks through Vacuum Impregnation Using Response Surface Methodology Ajit P. K. Joshi, Handunkutti Pathirannehalage Vasantha Rupasinghe * Tree Fruit Bio-product Research Program, Department of Environmental Sciences, Nova Scotia Agricultural College, Nova Scotia, Canada. Email: [email protected] Received July 8 th , 2010; revised July 12 th , 2010; accepted July 12 th , 2010. ABSTRACT Fortification of apple slices with t-resveratrol glucoside was obtained by vacuum impregnation (VI) of apple slices with a solution containing grape juice using response surface methodology (RSM). Three independent variables of the VI process: vacuum pressure, application time and relaxation time, were coded at five levels in a central composite design. The VI-treated and dried apple slices were analyzed for t-resveratrol glucoside concentration and textural attributes (gradient and linear distance). Multiple response optimization revealed the following optimum VI conditions for the bioactive enrichment and improved textural quality of dried apple slices: vacuum pressure of 6 in. of Hg, application time of 10 min, and relaxation time of 22.5 min. Keywords: Apple Snack, Bioactive Fortification, Response Surface Methodology, Texture, Vacuum Impregnation, Resveratrol 1. Introduction The leading causes of premature deaths in North Amer- ica are cardiovascular diseases (CVD) and cancer. Scien- tific evidence reveals that apple, which is rich in many health-enhancing phytonutrients including dietary fiber, flavonoids and phenolic acids, provides demonstrated health benefits beyond basic nutrition and can reduce the risk of certain chronic diseases [1,2]. Considering the health benefits of apples and their suitability for snack production, apples can be used as a source for the pro- duction of healthy snacks as well as a food matrix to de- liver essential nutrients and health promoting bioactives not present in apples. Among the bioactive compounds, resveratrol has gained much attention because of its chemopreventative properties [3]. Resveratrol acts as both a free radical scavenger and a potent antioxidant due to its promotion of the activities of a variety of antioxi- dant enzymes [3,4]. Application of vacuum impregnation (VI) process using fruit juices and sugar syrups contain- ing minerals, vitamins, bioactives and other food ingre- dients is an excellent way of producing fortified or value-added fruit products [5,6]. VI can also be used to modify the compositional, thermal and physico-chemical properties of food products which will increase the proc- ess efficiency in a manner beneficial for attaining desired product characteristics such as improved taste, texture, and shelf life [7,8]. The specific objectives of the present research were to optimize the VI process conditions for the fortification of the apple slices with natural bioactive (t-resveratrol glu- coside) present in grape juice, and to evaluate simulta- neously the effect of VI on the textural quality attributes of the VI-treated and dried apple slices. 2. Materials and Methods 2.1. Plant Material and Chemical Reagents ‘Empire’ apple were obtained from a local fruit market (Sterling Fruit Market, Truro, NS). A solution of Welch’s grape cocktail frozen concentrate diluted to a concentra- tion of 15 ± 2° Brix was used for dipping the apple slices into solution. t-Resveratrol glucoside standards were ob- tained from ChromaDex Inc., Irvine, CA. Acetone, ace- tonitrile, formic acid and methanol were purchased from Fisher Scientific Ltd., ON.
Transcript of Optimization of Bioactive Fortification in Apple Snacks...
Food and Nutrition Sciences, 2010, 2, 45-52 doi:10.4236/fns.2010.12008 Published Online October 2010 (http://www.SciRP.org/journal/fns)
Copyright © 2010 SciRes. FNS
45
Optimization of Bioactive Fortification in Apple Snacks through Vacuum Impregnation Using Response Surface Methodology
Ajit P. K. Joshi, Handunkutti Pathirannehalage Vasantha Rupasinghe*
Tree Fruit Bio-product Research Program, Department of Environmental Sciences, Nova Scotia Agricultural College, Nova Scotia, Canada. Email: [email protected] Received July 8th, 2010; revised July 12th, 2010; accepted July 12th, 2010.
ABSTRACT
Fortification of apple slices with t-resveratrol glucoside was obtained by vacuum impregnation (VI) of apple slices with a solution containing grape juice using response surface methodology (RSM). Three independent variables of the VI process: vacuum pressure, application time and relaxation time, were coded at five levels in a central composite design. The VI-treated and dried apple slices were analyzed for t-resveratrol glucoside concentration and textural attributes (gradient and linear distance). Multiple response optimization revealed the following optimum VI conditions for the bioactive enrichment and improved textural quality of dried apple slices: vacuum pressure of 6 in. of Hg, application time of 10 min, and relaxation time of 22.5 min. Keywords: Apple Snack, Bioactive Fortification, Response Surface Methodology, Texture, Vacuum Impregnation,
Resveratrol
1. Introduction
The leading causes of premature deaths in North Amer-ica are cardiovascular diseases (CVD) and cancer. Scien-tific evidence reveals that apple, which is rich in many health-enhancing phytonutrients including dietary fiber, flavonoids and phenolic acids, provides demonstrated health benefits beyond basic nutrition and can reduce the risk of certain chronic diseases [1,2]. Considering the health benefits of apples and their suitability for snack production, apples can be used as a source for the pro-duction of healthy snacks as well as a food matrix to de-liver essential nutrients and health promoting bioactives not present in apples. Among the bioactive compounds, resveratrol has gained much attention because of its chemopreventative properties [3]. Resveratrol acts as both a free radical scavenger and a potent antioxidant due to its promotion of the activities of a variety of antioxi-dant enzymes [3,4]. Application of vacuum impregnation (VI) process using fruit juices and sugar syrups contain-ing minerals, vitamins, bioactives and other food ingre-dients is an excellent way of producing fortified or value-added fruit products [5,6]. VI can also be used to
modify the compositional, thermal and physico-chemical properties of food products which will increase the proc-ess efficiency in a manner beneficial for attaining desired product characteristics such as improved taste, texture, and shelf life [7,8].
The specific objectives of the present research were to optimize the VI process conditions for the fortification of the apple slices with natural bioactive (t-resveratrol glu-coside) present in grape juice, and to evaluate simulta-neously the effect of VI on the textural quality attributes of the VI-treated and dried apple slices.
2. Materials and Methods
2.1. Plant Material and Chemical Reagents
‘Empire’ apple were obtained from a local fruit market (Sterling Fruit Market, Truro, NS). A solution of Welch’s grape cocktail frozen concentrate diluted to a concentra-tion of 15 ± 2° Brix was used for dipping the apple slices into solution. t-Resveratrol glucoside standards were ob-tained from ChromaDex Inc., Irvine, CA. Acetone, ace-tonitrile, formic acid and methanol were purchased from Fisher Scientific Ltd., ON.

Optimization of Bioactive Fortification in Apple Snacks through Vacuum Impregnation Using Response Surface Methodology
Copyright © 2010 SciRes. FNS
46
2.2. Sample Preparation
Apples were cut into 2.0-mm-thick slices perpendicular to the core using an apple slicer (Waring PROTM, Model: FS 150C, Torrington, CT). The apple slices were then immediately immersed in diluted grape fruit juice (15 ± 2° Brix) with a fruit to solution ratio of 1:10 (w/v) and given VI treatment (described in Subsection 2.3) at room temperature (20 ± 2°C) using vacuum oven (Shel lab, Model: 1465, Geneq Inc., Montreal). The time to reach intended vacuum was 30 s and included in the applica-tion time. Three replicates were used for each treatment where a replicate consisted of six randomly selected slices prepared from two apples. After the VI treatment, the slices were immediately put in the vacuum dryer and drying was carried out (30-40 ± 2°C; 20 hr). Preliminary experiments were conducted to optimize the drying con-ditions. Immediately after drying, the vacuum impreg-nated dried apple slices were transferred to air tight plas-tic containers and kept at room temperature.
2.3. Selection of the Parameters of VI Process
For the present study, the values were selected based on the range obtained from the reported levels given in the literature review [8-14]. Coding was used as a part of the response surface methodology (RSM) and coded values are given in brackets: application time 5 (−1) to 15 (+1) min, relaxation time 15 (−1) to 30 (+1) min and vacuum pressure 4 (−1) to 8 (+1) in. of Hg, as shown in Table 1. Grape juice was selected as the immersion solution to act as a visual indicator of the incorporation of the grape juice by providing purple color to the apple slices and act as a source for the incorporation of the bioactive phenolic compounds, i.e., t–resveratrol glucoside [15] which is not present in the apples and hence can be used as a marker to assess the impact of VI process conditions.
2.4. Optimization of VI Process Using RSM
To determine the optimal level for the given factors, RSM was used [16]. RSM enables the evaluation of the effects of several process variables and their interactions on response variables. This methodology has been ap-
plied by several other researchers for the optimization of food processing conditions to obtain desired quality of food products [13,17,18]. The experimental design em-ployed was a central composite design with 3 variables and 5 levels of each variable. The three independent variables for the vacuum impregnation process were va- cuum pressure, application time and relaxation time Ta-ble 1. The responses included fortification effect of grape juice on t-resveratrol glucoside concentration and tex-tural attributes (gradient and linear distance) of the VI- treated and dried apple slices. RSREG procedure of SAS Institute, Inc. (2003) [19] was used to obtain predictive models. Optimization of the independent variables was conducted by employing canonical analysis [16]. The assumptions of normality and constant variance were checked and confirmed. Adequacy of the models was determined by analysis of variance. When the results showed a saddle point in response surfaces, the ridge analysis of SAS RSREG procedure was used to compute the estimated ridge of the optimum response at points of increasing radii from the center of the design. Contour plots were generated as a function of two factors when the third factor was held constant from the models using MINITAB15.
2.5. Determination of T-Resveratrol Glucoside Concentration
For the determination of t-resveratrol glucoside concen-tration, a previously reported method [20] was modified and used. VI-treated and dried apple slices were ground in to powder form (1 mm mesh; Cuisinart, Model: DCG-12BCC, Cuisinart Canada, Woodbridge, ON). Ex-traction solvent (15 mL; 40: 40: 20: 0.1 methanol: ace-tone: water: formic acid) was added to 0.5 g of powder and the mixtures were subjected to approximately 20 kHz frequency of sonication (Model: 750D, ETL Testing Laboratories Inc., Cortland, NY) for 15 min × three times with 10-min intervals. The crude extract was centrifuged (Model: Durafuge 300, Precision, Winchester, VA) at 4000 g for 15 min. The extracted samples were concen-trated 10-fold by removal of methanol using a vacuum
Table 1. The VI process variables and their levels in central composite design.
Levels of operating parameters
Coded value −1.68 −1 0 +1 +1.68
Uncoded variables
VP 2.6 4 6 8 9.4
AT 1.6 5 10 15 18.4
RT 9.9 15 22.5 30 35.1
VP, vacuum pressure (in. of Hg); AT, application time (min); RT, relaxation time (min)

Optimization of Bioactive Fortification in Apple Snacks through Vacuum Impregnation Using Response Surface Methodology
Copyright © 2010 SciRes. FNS
47
concentrator (Universal vacuum system, Model: UVS400- 115, Thermo Electron Corporation, Milford, MA, US) and dissolving the suspension in appropriate volume of methanol. Extracts of each sample were prepared in trip-licate and stored in amber vials at –70°C. Analyses of t-resveratrol glucoside was performed using a Waters Alliance 2695 separations module (Waters, Milford, MA) coupled with a Micromass Quattro micro API MS/MS system and controlled with MassLynx V4.0 data analy-sis system (Micromass, Cary, NC). The column used was a Phenomenex Luna C18 (150 mm 2.1 mm, 5 μm) with a Waters X-Terra MS C18 guard column. A previ-ously reported method [20] was modified and used for the separation of the t-resveratrol glucoside. A gradient elution was carried out with 0.1% formic acid in water (solvent A) and 0.1% formic acid in acetonitrile (solvent B) at a flow rate of 0.35 mL/min. A linear gradient pro-file was used with the following proportions of solvent A applied at time t (min); (t, A%): (0, 94%), (9, 84%), (12, 83%), (14, 83%), (16, 83%), (18, 82%), (21, 80%), (29, 0%), (31, 94%), (40, 94%). Electrospray ionization in negative ion mode (ESI–) was used for the analysis of t-resveratrol glucoside with the following conditions: capillary voltage 3000 V, nebulizer gas (N2) at tempera-ture 375°C and a flow rate of 0.35 mL/min. Multiple Reaction Monitoring (MRM) mode using a specific pre-cursor→ product ion transition (m/z 389→227) was em-ployed for quantification in comparison with standards of t-resveratrol glucoside. The concentration of t-res- veratrol glucoside of the juice used for VI treatment was 0.12 mg/L.
2.6. Determination of Textural Characteristics
A puncture test method was performed on the dried apple slices using a texture analyzer (Model: TA.XT Plus tex-ture analyzer, Texture Technologies Corp., New York, USA), in which a blade probe was passed through a given distance (15 mm) at the test speed of 1.00 mm/s [21]. The data were obtained for forward gradient of the deformation curve (kg/s) and linear distance traveled after contact with the sample and until rupture of the ap-ple slice (kg.s).
3. Results and discussion
3.1. Optimization of Process Conditions for Individ-ual Responses
The response values of t-resveratrol glucoside and tex-tural attributes (gradient and linear distance) obtained by applying the central composite design using RSM are given in Table 2. Analysis of variance (ANOVA) was performed on each response separately Table 3 and the results indicated that the model was adequate. There was no significant lack of fit (p > 0.05) which indicated that the number of experimental combinations formed in the design of experiment was enough to find out the effect of independent variables on the responses. Further exami-nation of contour plots illustrated the relationship be-tween experimental factors and response in two-dimen- sional representation generated for all the responses Fig-ures 1, 2 and 3. Multiple response optimization was done by overlaying contour plots.
Table 2. Response values for given levels of variables (vacuum pressure, application time and relaxation time) in RSM.
Uncoded variables
Experiment Coded variables VP AT RT
t-Resveratrol glucoside (mg/100g
DM)
Gradient
(kg/s)a Linear distance
(kg.s)
1 1.68 0 0 9.4 10.0 22.5 28.10 0.81 2.31 2 0 −1.68 1 6.0 1.6 30.0 24.75 0.76 2.47 3 −1 1 1 4.0 15.0 30.0 25.61 0.82 2.33 4 −1.68 −1.68 1 2.6 1.6 30.0 26.20 0.64 2.83
5,6,7,8,9,10 0 0 0 6.0 10.0 22.5 24.16 0.64 2.66 11 1 1 −1 8.0 15.0 15.0 25.79 0.63 2.65 12 −1 −1 −1 4.0 5.0 15.0 28.15 1.23 2.08 13 −1 1 −1 4.0 15.0 15.0 24.92 0.80 2.46 14 0 0 −1.68 6.0 10.0 9.9 22.56 0.59 2.46 15 0 1.68 0 6.0 18.4 22.5 25.19 0.74 2.39 16 1 −1 1 8.0 5.0 30.0 24.00 0.77 2.01 17 −1.68 0 0 2.6 10.0 22.5 22.97 0.54 2.43 18 0 0 1.68 6.0 10.0 35.1 25.45 0.58 2.78 16 0 0 0 6.0 10.0 22.5 23.58 0.67 2.45 19 1 1 1 8.0 15.0 30.0 26.24 0.70 2.79 20 1 −1 −1 8.0 5.0 15.0 18.25 0.64 2.80
aGradient was transformed (X: (1/X)3) before analysis to achieve normality. Untransformed values are shown in the Table. VP, vacuum pressure (in. of Hg); AT, application time (min); RT, relaxation time (min)

Optimization of Bioactive Fortification in Apple Snacks through Vacuum Impregnation Using Response Surface Methodology
Copyright © 2010 SciRes. FNS
48
Table 3. Regression coefficients and analysis of variance (ANOVA).
Regression coefficients t-Resveratrol glucoside Gradient a Linear distance
0 42.865354 –7.981650 0.832844
1 (VP) –4.469402 1.296660 0.076673
2 (AT) –0.573949 0.962972 0.147376
3 (RT) –0.380817 0.294952 0.062411
11 0.109618 –0.035410 0.000879
12 0.130985 0.021471 0.005405
22 0.003060 –0.039456 –0.006100
13 0.082939 –0.054076 –0.006664
23 –0.005108 –0.012119 –0.002682
33 0.000383 0.003759 0.000349
ANOVA (p-values)
Lack-of-fit 0.0823 0.0732 0.0994 aGradient was transformed (X: (1/X)3) before analysis to achieve normality; VP, vacuum pressure (in. of Hg); AT, application time (min); RT, relaxation time (min)
Canonical analysis demonstrated a saddle point for all
the responses examined in VI-treated apple slices Table 4. Also, the eigen values obtained for all the responses showed both positive and negative signs. Thus, station-arypoint for responses could not be obtained as minimum or maximum. Therefore, ridge analysis was performed to determine the levels of the design variables that would produce the maximum response for t-resveratrol glucoside concentration and gradient values, and minimum response for linear distance, under the given conditions Table 5.
3.1.2. T -Resveratrol Glucoside Concentration
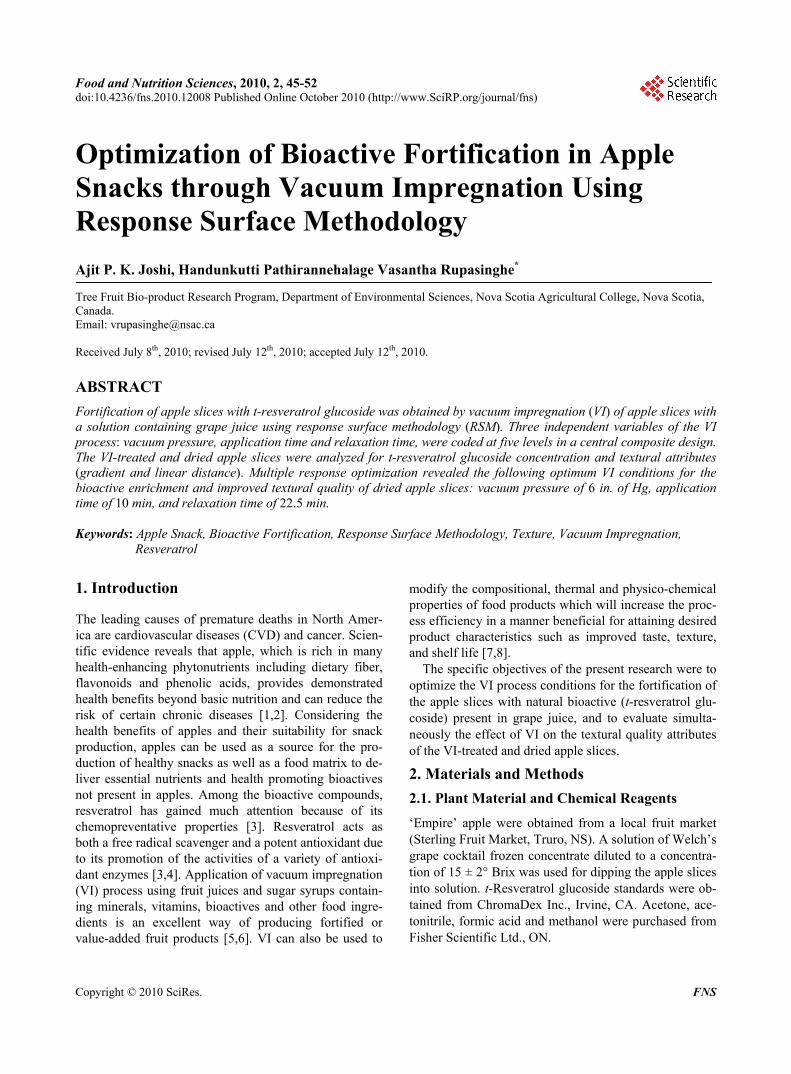
The t-resveratrol glucoside concentration in the VI- treated, dried apple slices were used as a specific bioac-tive marker for the fortification using grape juice during optimization of VI conditions. The results of the canoni-cal analysis for t-resveratrol glucoside concentration de-picted the stationary point to be a saddle point Table 4. Under constant relaxation time Figure 1(a) and applica-tion time (Figure 1(b)) the saddle point can be clearly seen. The contour plots Figure 1(a) indicated that the incorporation of t-resveratrol glucoside was lower at the lower application time and vacuum pressure settings. However, above 5 in. of Hg and application time above 10 min the incorporation of t-resveratrol glucoside would start to increase. Similar results for higher t-resveratrol glucoside concentration can be obtained by keeping vacuum pressure below 5 in. of Hg and relaxation time below 25 min. When vacuum pressure is held constant (6 in. of Hg), increasing the level of application time and relaxation time would result in increased t-resveratrol glucoside concentration Figure 1(c). The ridge analysis showed that the vacuum conditions that will maximize the uptake of this specific bioactive was vacuum pressure
8.45 in. of Hg, application time 14.45 min and relaxation time 28.11 min Table 5.
3.1.3. Textural Characteristics of VI–treated, Dried Apple Slices
Crispiness is one of the most important textural attributes of snacks which can be explained in terms of gradient and linear distance [22,23]. In instrumental texture analysis of the VI-treated apple slices, greater values for gradient and lesser value for linear distance corresponds to higher crispiness.
3.1.3.1. Gradient
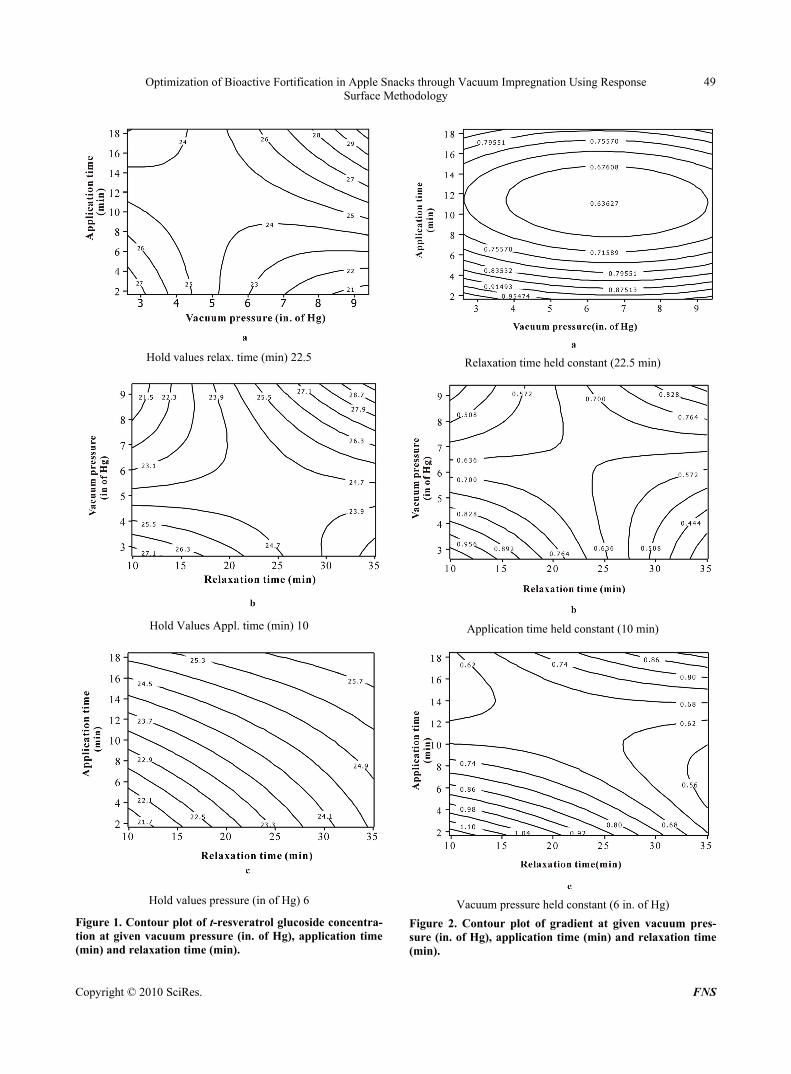
The examination of contour plots showed that VI appli-cation time had a greater impact on this textural parame-ter than vacuum pressure Figure 2(a). The gradient value would be least (0.64 kg/s) when application time is in the range of 10 to 12 min and vacuum pressure is in the range of 4 to 9 in. of Hg. When application time is held constant (10 min) the gradient value would be affected by both vacuum pressure and relaxation time Figure 2(b). Similarly, under constant vacuum pressure Figure 2(c), gradient values seemed to be influenced by both applica-tion time and relaxation time. The maximum crispiness, as assessed by a large gradient value was predicted at vacuum pressure 4.04 in. of Hg, application time 8.93 min and relaxation time 32.68 min Table 5.
3.1.3.2. Linear distance
The stationary point for linear distance of dried apple slices in the canonical analysis was observed to be a sad-dle point which can also be seen in the contour plots Ta-ble 4; Figure 3. When relaxation time was held constant, the response values for linear distance would increase
Optimization of Bioactive Fortification in Apple Snacks through Vacuum Impregnation Using Response Surface Methodology
Copyright © 2010 SciRes. FNS
49
Hold values relax. time (min) 22.5
Hold Values Appl. time (min) 10
Hold values pressure (in of Hg) 6
Figure 1. Contour plot of t-resveratrol glucoside concentra-tion at given vacuum pressure (in. of Hg), application time (min) and relaxation time (min).
Relaxation time held constant (22.5 min)
Application time held constant (10 min)
Vacuum pressure held constant (6 in. of Hg)
Figure 2. Contour plot of gradient at given vacuum pres-sure (in. of Hg), application time (min) and relaxation time (min).

Optimization of Bioactive Fortification in Apple Snacks through Vacuum Impregnation Using Response Surface Methodology
Copyright © 2010 SciRes. FNS
50
Table 4. Canonical analysis for optimization of VI process.
Variable t-Resveratrol glucoside (mg/100
g DM) Gradient (kg/s) Linear distance (kg.s)
Eigen values 3.24 1.47 0.22 0.41 –1.16 –0.11 –2.10 –2.91 –0.47
Critical values at the coded level of variables VP –0.31 –0.03 0.42 AT –0.06 0.08 0.06 RT 0.26 –0.16 –0.04
Critical values at the actual level of variables VP 4.94 5.91 7.43 AT 9.54 10.67 10.53 RT 25.77 20.47 22.01
Predicted response value 24.18 0.63 2.58
Stationary point Saddle Saddle Saddle
VP, vacuum pressure (in. of Hg); AT, application time (min); RT, relaxation time (min)
Table 5. Ridge analysis for maximizing the individual response value in VI process.
Estimated values at coded radius 1.0 t-Resveratrol glucoside
(mg/100 g DM) Gradient (kg/s) Linear Distance (kg.s)
Response 28.49 0.55 2.09
Parameters of VI process
VP 8.45 6.43 6.24
AT 14.45 1.78 2.19
RT 28.11 20.44 17.95
VP, vacuum pressure (in. of Hg); AT, application time (min); RT, relaxation time (min)
with the increasing level of application time and after reaching 12 min of application time it would start de-creasing again Figure 3(a). Higher levels of vacuum, within the range studied in these investigations, would result in reduced linear distance under longer relaxation time interval, and hence a more crispy product Figure 3(b). Similarly, under constant vacuum pressure Figure 3(c), the linear distance values would be low at the lower level of relaxation time, but would increase with applica-tion time up to certain level and then decrease after 15 min of application time. The ridge analysis was done, which showed that apple slices with minimum values for linear distance (2.09) (at a coded radius 1.0) in canonical analysis would be estimated at vacuum pressure 6.24 in. of Hg, application time 2.19 min and relaxation time 17.95 min Table 5.
3.2. Optimization of Process Conditions for All Responses
Overlaid contour plot was obtained for three responses to
relate to two continuous design variables (vacuum pres-sure and relaxation time) while holding the third variable i.e., application time in a model at 10 min Figure 4. Overlaying the individual plots for the responses resulted in the identification of region in the centre of the plots which satisfied all constraints as shown in Figure 4. Thus, based on the overlaid contour plots the optimum conditions for VI process were selected: vacuum pressure of 6 in. of Hg, application time of 10 min, and relaxation time of 22.5 min.
4. Conclusions
In conclusion, the VI process for vacuum pressure, ap-plication time and relaxation time can be effectively op-timized using RSM for the incorporation of t-resveratrol glucoside, a natural bioactive from grape juice, and as well as the improvement of the textural attributes of dried apple slices. RSM was used for identifying the final op- timal experimental parameters for each response indi- vidually as well as considering all responses using multi-

Optimization of Bioactive Fortification in Apple Snacks through Vacuum Impregnation Using Response Surface Methodology
Copyright © 2010 SciRes. FNS
51
Relaxation time held constant (22.5 min)
Application time held constant (10 min)
Vacuum pressure held constant (6 in. of Hg)
Figure 3. Contour plot of linear distance at given vacuum pressure (in. of Hg), application time (min) and relaxation time (min).
Application time held constant (10 min)
Figure 4. Overlaid contour plot for the optimum operation conditions.
ple response optimization. Hence, to obtain both the op- timum textural quality and bioactives uptake in the apple snacks, the parameters for VI process were selected based on multiple response optimization. The developed apple snacks obtained using optimized VI-process were further compared with un-treated apple snacks for the sensory attributes, and the results are published else-where based on the overlaid contour plots the optimum conditions for VI process were selected: vacuum pressure of 6 in. of Hg, application time of 10 min, and relaxation time of 22.5 min.
5. Acknowledgements
This study was funded by the Atlantic Innovation Funds Program of the Atlantic Canada Opportunity Agency (ACOA) and Noggins Corner Farm Limited, Greenwich, NS. Authors would like to thank Dr. Tess Astatkie for his guidance on statistical analysis.
REFERENCES [1] N. Lewis and J. Ruud, “Apples in the American Diet,”
Nutrition in Clinical Care, Vol. 7, No. 2, 2004, pp. 82-88.
[2] J. Wu, H. Gao, L. Zhao, X. Liao, F. Chen, Z. Wang and X. Hu, “Chemical Compositional Characterization of Some Apple Cultivars,” Food Chemistry, Vol. 103, No. 1, 2007, pp. 88-93.
[3] M. Jang, L. Cai, G. O. Udeani, K. V. Slowing, C. F. Thomas, C. W. W. Beecher, H. H. S. Fong, N. R. Farnsworth, A. D. Kinghorn, R. G. Mehta, R. C. Moon
Optimization of Bioactive Fortification in Apple Snacks through Vacuum Impregnation Using Response Surface Methodology
Copyright © 2010 SciRes. FNS
52
and J. M. Pezzuto, “Cancer Chemopreventive Activity of Resveratrol, a Natural Product Derived from Grapes,” Science, Vol. 275, No. 5297, 1997, pp. 218-220.
[4] M. Fontecave, M. Lepoivre, E. Elleingand, C. Gerez and O. Guittet, “Resveratrol, a Remarkable Inhibitor of Ribonucleotide Reductase,” FEBS Letters, Vol. 421, No. 3, 1998, pp. 277-279.
[5] N. Betoret, L. Puente, M. J. Dıaz, M. J. Pagán, M. J. Garcıa, M. L. Gras, J. Martınez-Monzó and P. Fito, “Development of Probiotic-Enriched Dried Fruits by Vacuum Impregnation,” Journal of Food Engineering, Vol. 56, No. 2, 2003, pp. 273-277.
[6] J. Xie and Y. Zhao, “Nutritional Enrichment of Fresh Apple (Royal Gala) by Vacuum Impregnation,” Inter- national Journal of Food Sciences & Nutrition, Vol. 54, No. 5, 2003, p. 387.
[7] S. V. Anino, D. M. Salvatori and S. M. Alzamora, “Changes in Calcium Level and Mechanical Properties of Apple Tissue Due to Impregnation with Calcium Salts,” Food Research International, Vol. 39, No. 3, 2006, pp. 154-164.
[8] P. Fito, A. Chiralt, J. M. Barat, A. Andres, J. Martinez- Monzo and N. Martinez-Navarette, “Vacuum Impreg- nation for Development of New Dehydrated Products,” Journal of Food Engineering, Vol. 49, No. 4, 2001, pp. 297-302.
[9] J. Martinez-Monzo, J. M. Barat, C. Gonzalez-Martinez, A. Chiralt and P. Fito, “Changes in Thermal Properties of Apple Due to Vacuum Impregnation,” Journal of Food Engineering, Vol. 43, No. 4, 2000, pp. 213-218.
[10] J. M. Barat, A. Chiralt and P. Fito, “Effect of Osmotic Solution Concentration, Temperature and Vacuum Impre- gnation Pretreatment on Osmotic Dehydration Kinetics of Apple Slices,” Food Science & Technology International, Vol. 7, No. 5, 2001, pp. 451-456.
[11] M. Jeon and Y. Zhao, “Honey in Combination with Vacuum Impregnation to Prevent Enzymatic Browning of Fresh-Cut Apples,” International Journal of Food Sciences & Nutrition, Vol. 56, No. 3, 2005, pp. 165-176.
[12] D. Salvatori, A. Andres, A. Chiralt and P. Fito, “The Response of Some Properties of Fruits to Vacuum Impregnation,” Journal of Food Process Engineering, Vol. 21, No. 1, 1998, pp. 59-73.
[13] H. Mújica-Paz, A. Valdez-Fragoso, A. López-Malo, E. Palou and J. Welti-Chanes, “Impregnation and Osmotic Dehydration of Some Fruits: Effect of the Vacuum
Pressure and Syrup Concentration,” Journal of Food Engineering, Vol. 57, No. 4, 2003, pp. 305-314.
[14] P. Fito, A. Chiralt, N. Betoret, M. Gras, M. Chafer, J. Martinez-Monzo, A. Andres and D. Vidal, “Vacuum Impregnation and Osmotic Dehydration in Matrix Engineering Application in Functional Fresh Food Development,” Journal of Food Engineering, Vol. 49, No. 2-3, 2001, pp. 175-183.
[15] O. Gürbüz, D. Göçmen, F. Dagˇdelen, M. Gürsoy, S. Aydin, İ. Şahin, L. Büyükuysal and M. Usta, “Deter- mination of Flavan-3-Ols and Trans-Resveratrol in Grapes and Wine Using HPLC with Fluorescence Detection,” Food Chemistry, Vol. 100, No. 2, 2007, pp. 518-525.
[16] D. C. Montgomery, “Introduction to Factorial Designs,” Design and Analysis of Experiments, John Wily and Sons, Inc., New York, 2005.
[17] V. A. E. King and R.R. Zall, “A response Surface Methodology Approach to the Optimization of Controlled Low-Temperature Vacuum Dehydration,” Food Research International, Vol. 25, No. 1, 1992, pp. 1-8.
[18] S. L. Shyu and L.S. Hwang, “Effect of Processing Conditions on the Quality of Vacuum Fried Apple Chips,” Food Research International, Vol. 34, No. 2, 2001, pp. 133-142.
[19] SAS Institute, “SAS User’s Guide: Statistics,” Version 8, SAS Inst, Cary, 2003.
[20] F. Buiarelli, F. Coccioli, R. Jasionowska, M. Merolle and A. Terracciano, “Chromatographic Analysis of Trans- resveratrol in Italian Wines: Comparisons between FL, UV and MS Detection,” Chromatographia, Vol. 64, No. 7, 2006, pp. 475-481.
[21] E. E. Katz and T. P. Labuza, “Effect of Water Activity on the Sensory Crispness and Mechanical Deformation of Snack Food Products,” Journal of Food Science, Vol. 46, No. 2, 1981, pp. 403-409.
[22] J. F. Lefort, T. D. Durance and M. K. Upadhyaya, “Effects of Tuber Storage and Cultivar on the Quality of Vacuum Microwave-Dried Potato Chips,” Journal of Food Science, Vol. 68, No. 2, 2003, pp. 690-696.
[23] P. W. Y. Sham, C. H. Scaman and T. D. Durance, “Texture of Vacuum Microwave Dehydrated Apple Chips as Affected by Calcium Pretreatment, Vacuum Level, and Apple Variety,” Journal of Food Science, Vol. 66, No. 9, 2001, pp. 1341-1347.