OPTIMAL EXCISE RATE: EXAMPLE OF UKRAINIAN … · “DETERMINING THE OPTIMAL EXCISE RATE: EXAMPLE OF...
50
“DETERMINING THE OPTIMAL EXCISE RATE: EXAMPLE OF UKRAINIAN TOBACCO INDUSTRY” by Maksym Mashlyakivsky A thesis submitted in partial fulfillment of the requirements for the degree of MA in Economics EERC MA Program in Economics at the University of “Kiev-Mohyla Academy” 2001 Approved by ___________________________________________________ Chairperson of Supervisory Committee __________________________________________________ __________________________________________________ __________________________________________________ Program Authorized to Offer Degree _________________________________________________ Date 28.05.2001 _________________________________________________
Transcript of OPTIMAL EXCISE RATE: EXAMPLE OF UKRAINIAN … · “DETERMINING THE OPTIMAL EXCISE RATE: EXAMPLE OF...

“DETERMINING THE OPTIMAL EXCISE RATE:
EXAMPLE OF UKRAINIAN TOBACCO INDUSTRY”
by
Maksym Mashlyakivsky
A thesis submitted in partial fulfillment of the requirements for the degree of
MA in Economics
EERC MA Program in Economics at the University
of “Kiev-Mohyla Academy”
2001
Approved by ___________________________________________________ Chairperson of Supervisory Committee
__________________________________________________
__________________________________________________
__________________________________________________
Program Authorized to Offer Degree _________________________________________________
Date 28.05.2001 _________________________________________________

EERC MA Program in Economics at the University
of “Kiev-Mohyla Academy”
Abstract
“DETERMINING THE OPTIMAL EXCISE RATE: EXAMPLE OF UKRAINIAN TOBACCO INDUSTRY”
by Maksym Mashlyakivsky
Chairperson of the Supervisory Committee: Professor Serhiy Korablin, Institute of Economic Forecasting at the Academy of Sciences of Ukraine
In this paper, I developed a model of efficient excise taxation in the Ukrainian
tobacco industry. Efficiency was considered from the government’s viewpoint
where the government is aiming at maximizing tax proceeds. However, the
government is also interested in reducing consumption of the harmful good (i.e.
cigarettes). In Ukraine, the achievement of these objectives is hampered by the
easy availability of illegal cigarettes. The majority of smuggled cigarettes originates
in Russia, due to existence of rather transparent borders between the countries.
Therefore, the markets of the two countries are interconnected.
The econometric part of my research is based on three regressions. First, a
demand function for cigarettes was estimated. The elasticity of demand with
respect to the excise rate was found to be –0.37. Second, a Laffer curve was
estimated for the tobacco industry. The curve shows a relationship between the
excise rate and excise revenues, and has a normal shape predicted by the
economic theory. My estimates show that current excise rates in Ukraine are well
below the revenue-maximizing level. Third, a price equation for the industry was
estimated which allowed determining the mark-up in the industry. The last
estimate showed that the government could increase the excise rate without
driving producers out of the market since the average mark-up is significant.

TABLE OF CONTENTS
ACKNOWLEDGMENTS............................................................................... II
GLOSSARY....................................................................................................III
CHAPTER 1. INTRODUCTION....................................................................1
CHAPTER 2. PROFILE OF UKRAINE’S TOBACCO MARKET..................5
CHAPTER 3. THEORETIC FRAMEWORK................................................10 Previous Theoretic Findings.............................................................................10 Developing a Theoretic Model Relevant to the Ukrainian Market .....................14
CHAPTER 4. EMPIRICAL RESULTS...........................................................25 Data Description.............................................................................................25 Model Estimation Results ................................................................................25 Evaluation of the Current Ukrainian Excise Policy and Policy Implications.......28
CHAPTER 5. CONCLUSIONS......................................................................32
WORKS CITED.............................................................................................34
APPENDIX A. ESTIMATION OUTPUT: DEMAND FOR CIGARETTES IN UKRAINE ................................................................................................36
APPENDIX B. ESTIMATION OUTPUT: LAFFER CURVE FOR UKRAINE’S TOBACCO INDUSTRY...........................................................37
APPENDIX C. ESTIMATION OUTPUT: PRICE EQUATION..................38
APPENDIX D. DATA DESCRIPTION AND SOURCES ............................39
APPENDIX E. ALTERNATIVE ESTIMATES OF THE DEMAND FUNCTION...................................................................................................41

ii
ACKNOWLEDGMENTS
I wish to thank Tetiana Sytnyk and Hlib Vyshlinsky (ICPS) for the idea of this
research; Dr. Stefan Lutz for advice and guidance; Olexandr Hluschenko and
Natalia Marchuk (Philip Morris Ukraine) for valuable comments and help in
obtaining statistical data; Olga Prochukhanova for help in obtaining statistical
data. I am also grateful to Larysa Syvolozhska for providing support and
inspiration.

iii
GLOSSARY
Ad-valorem excise taxation
Excise taxation system, under which the excise tax is calculated as a percentage of the price of a particular good. Hence, the higher the price, the more is paid in taxes.
Myopic behavior model
This model assumes that while making their decisions, consumers do not care about future effects of their present decisions. Hence, the effect of present decisions on future utility is ignored. In modelling addictive behavior, one needs to include past consumption as a regressor in the demand function, while future consumption is not included in the model.
Rational behavior model
This model assumes that consumers fully realize the effect of their present consumption decisions on future utility. In the case of cigarettes, for example, consumers realize future harm from smoking. Hence, while making a decision to smoke today, consumers take into account negative future effects (i.e., harm to their health and habit formation) of such a decision. Consequently, in econometric models, one needs to include both past and future consumption as regressors in the demand function.
Specific excise taxation
Excise taxation system, under which the excise tax is imposed in fixed monetary amount per some quantity of a good. In the cigarette industry, the tax is usually paid per 1000 sticks. Hence, the amount of the tax paid does not depend on the price.
Ukrtutun
The Ukrainian Association of tobacco growers and cigarette producers. The Association includes ten major cigarette-producing factories. This works similar to a business association.
1
C h a p t e r 1
INTRODUCTION
To some economists, the problem I investigate in my research (i.e. excise
taxation) may seem to be very specific and unimportant. However, excise taxation
is one component of the overall tax system of a country. So, one should
understand that without improvements in each specific area of the tax system, it
is next to impossible to improve the overall system, which is crucial for any
economy in transition. Each area of taxation should deserve attention, because
improvements in the overall tax system are determined by changes in each
particular sub-area. Hence, I do not consider my research as a purely theoretic
exercise, but rather as an attempt to address one particular policy problem on a
scientific basis. Unless all specific problems are solved properly, it is impossible to
ensure success of the overall tax reform.
Until the present, Ukrainian authorities have paid little attention to issues of
excise taxation of different goods, and no scientific base for determining excise
rates has been developed. Meanwhile, excise taxes represent a very important part
of the tax system in a country and usually have certain additional objectives (e.g.,
influence the demand for a certain good).
As a rule, excise taxes are imposed on a number of specific goods that usually
have inelastic demands1. This characteristic of the demand makes the goods
especially attractive for raising budget revenues from indirect taxes (excises) on
those goods. In addition, the government may have other objectives: e.g.,
1 For a detailed discussion of different issues of excise taxation see, for example, Institute for transition
economics (2000).

2
reducing consumption of particular goods through indirect increases in their
prices using the excise tax. Hence, under the “optimal excise rate”, I understand
the rate that ensures maximization of government revenues, while the
government is also interested in determining the effect of its excise policy on the
demand for a particular good.
As with all taxes, the government should be careful in imposing high excise rates
since an extremely high price (caused by high excise taxes) may lead to a sharp
drop in the demand and, consequently, in the budget revenues. As the theory
suggests2, an initial increase in the tax rate will lead to higher budget revenues,
while further increases may cause the revenues to shrink.
The objective of determining excise rates becomes even more important if
consumers are able to switch away from taxed goods. If, for example, similar
illegal (and hence, untaxed) products are easily available in the market, the effect
of taxation may be different, since consumers would switch to cheaper untaxed
goods if legal products become more expensive due to higher tax rates. In this
case, setting an extremely high excise rate may lead not only to lower budget
revenues, but to unchanged consumption as well, since the majority of
consumers may switch to illegal (and usually cheaper) products.
The tobacco industry is a good example of an industry where excise taxation is
present and where all the indicated features and objectives usually exist. That is
why in my research, I investigate excise taxation in the Ukrainian tobacco
industry.
In Ukraine, the tobacco industry makes up over 17% of the food industry, and
contributes about 3% of total budget revenues (ICPS, 2000). Hence, on the one
hand, from the economic point of view the industry is important for the
2 See, for example, Varian (1999).

3
Ukrainian economy as a source of budget revenues; on the other hand, the
government tries to limit tobacco consumption due to health considerations.
Thus, it is clear that proper tax “regulation” is needed to ensure achievement of
these two objectives.
In Ukraine, excise taxation does not seem to be effective, since excise rates are set
by the government under the lobby of different interested parties3. For example,
non-filter cigarette producers vote for a lower excise on non-filter cigarettes and
higher excise for filter cigarettes. For filter cigarette producers the interests are the
opposite. At the same time, some authorities insist on imposing extremely high
excise rates to cope with smoking (however, they typically forget about the
problem of smuggling4). Moreover, the government itself may be tempted to rise
excise rates in order to increase tax proceeds. These factors tend to make
government policy unstable and inefficient.
As a result of such insufficiently considered actions in excise taxation, it is
possible to predict that the state health care policy fails and the government does
not maximize its revenues while about 30% of the market is covered by illegal
(and often poor-quality) products (ICPS, 2000).
Thus, in my research, I will try to develop a model, which takes into account
major peculiarities of Ukraine’s tobacco market and allows to determine the
excise rate that enables achievement of the indicated objectives (i.e. maximize
budget revenues and reduce cigarette consumption). Consequently, in my
research, I will investigate the relationship between the excise tax on the one
hand, and government revenues, cigarette consumption, and firms’ profits – on
the other. The reason for such a broad scope of my research is the necessity to
3 See Business Newspaper (2001).
4 An important feature of the Ukrainian tobacco market is that illegal tobacco products can relatively easily enter the market (particularly from Russia). See Business Newspaper (2001).

4
consider all involved groups (i.e. government, consumers, and producers) in
order to develop an effective policy. Such policy is aimed at (1) maximizing tax
proceeds, (2) reducing cigarette consumption, and (3) ensuring profits to
producers to keep them operating in the market.
The paper is organized as follows. Chapter 2 provides a profile of the Ukrainian
tobacco industry and market. The theoretical model is derived in chapter 3.
Chapter 4 represents an empirical part of my research. Here, the theoretic model
is estimated and evaluation of the current Ukrainian excise policy is given. Finally,
chapter 5 concludes.

5
C h a p t e r 2
PROFILE OF UKRAINE’S TOBACCO MARKET5
Before conducting theoretic and empirical analysis of excise taxation in the
tobacco industry, one should understand major peculiarities of the market for
cigarettes in Ukraine. Hence, in this section, I describe major features of
Ukraine’s tobacco market that should be taken into account in further research.
In Ukraine, 23 factories have licenses for producing tobacco products. However,
only 17 factories are operating now. Out of those 17, ten factories are members
of the Ukrainian association of tobacco producers (“Ukrtutun”). Those ten
factories account for over 99% of the industry’s output. The ten factories in turn
can be divided into two groups: (1) factories owned by multinational enterprises
(MNE)—5 factories producing about 96% of total output; and (2) factories
without foreign capital (see Figure 1). It is obvious that MNEs dominate in the
market (concentration in the market is rather high) and production at the
factories without foreign capital is shrinking, while the major competition exists
among MNEs. The large share of MNEs in cigarette production (and hence, in
budget revenues) makes the multinationals especially powerful in lobbying their
interests.
5 This chapter is mainly based on the analysis provided in ICPS (2000).

6
FIGURE 1. MNEs in the Ukrainian tobacco market (production shares) – 2000
Source: “Ukrtutun”
Under “Others” one should understand factories without foreign capital. Those
factories operated when Ukraine was a part of the Soviet Union. Now, they still
use outdated equipment and mainly produce old soviet non-filter cigarette
brands.
All tobacco factories owned by MNEs work with wholesale firms (about 600
entities) in different regions of Ukraine. Each MNE directly works with 35-45
wholesale firms that operate in different regions of Ukraine. Usually their
activities are conducted in a particular region (oblast). If a wholesale firm works
with a producer, the latter can set the upper limit of the price, which can be
charged by the wholesaler. Wholesalers have a certain chain of retail distributors
within the region.
Unfortunately, not much information is available on wholesale firms. Moreover,
cigarette consumption patterns seem to differ among different regions. These
two factors result in the impossibility to make any estimates based on the data for
wholesale firms.
Reemtsma 39%
Others4%
British-American Tobacco
19%JT International
14%
Philip Morris24%

7
Since their entry into the Ukrainian market, MNEs have used mixed strategy: (1)
they promoted old soviet brands (which were already popular) while improving
their quality and producing “modified” cigarettes (for example introducing filter
cigarettes) under the same brand name, and (2) started production of
international brands in Ukraine (for example, Marlboro, Magna, L&M,
Chesterfield, etc.). Similar strategy has been used by MNEs operating in Russia,
which means that products produced in the two countries are almost the same,
and consumers in each country can easily substitute them (see below).
In the cigarette production, MNEs (that dominate the market) use mainly
imported raw tobacco (the major exporter is the USA). Since the quality of
domestic-grown tobacco is rather low, imported raw tobacco is used even for
production of non-filter cigarettes (that are generally cheaper and of lower
quality). The cost of imported raw tobacco constitutes a significant share of total
production costs. Hence, I may predict that cigarette prices in Ukraine are very
sensitive to changes in the exchange rate of the hryvnia with respect to the US
dollar.
Production capacity of the ten factories—members of “Ukrtutun” is 75.63 billion
sticks annually. However, capacity has been significantly underutilized during
1990s, partially due to existence of illegal import.
An important feature of the Ukrainian cigarette market is extensive illegal
activities. Currently, illegal imports account for about 30% of total consumption.
Illegal cigarettes originate in Russia and Moldova, which is caused by excise tax
differentials. Usually, cigarettes are legally bought in Russia or Moldova and then
illegally transported to Ukraine without paying taxes to the Ukrainian budget. For
example, legally produced non-filter cigarettes cost two times less in Russia than
in Ukraine. After the cigarettes are illegally imported to Ukraine, their retail price
8
in the black market constitutes approximately two-thirds of the price of non-filter
cigarettes legally sold in Ukraine6.
Another important issue is excise taxation in Ukraine. The excise tax is paid by
producers. The procedure is as follows. Before a particular month, tobacco
factories submit applications to the State Tax Administration where they indicate
the number of excise stamps they will need in the following month (this is based
on factories’ estimates regarding production volumes). After producing cigarettes,
excise stamps are put on each pack. Then cigarettes are sold to wholesalers. After
the month is over, producers submit a report to the State Tax Administration
where they indicate the amount of cigarettes sold and here excise payment takes
place.
In Ukraine, cigarettes are subject to specific excise taxation. This means that the
amount of the tax does not depend on the price of cigarettes and producers pay a
fixed amount (in hryvnias) per one thousand sticks (for example, 10 hryvnias per
1000 sticks). Before 2000, excise tax had been calculated in EUROs. During the
previous years, excise rates (calculated in EUROs) changed only from year to year
and were constant during one particular year. During this period, the excise rate
remained the same for filter and non-filter cigarettes. In practice, excise tax was
paid in hryvnias according to the NBU exchange rate. The amount of the excise
tax in hryvnias was calculated at the beginning of each quarter based on the NBU
exchange rate and remained constant during the quarter. This important feature
needs to be taken into account while processing the corresponding data.
Finally, I should mention that even cigarette producers in Ukraine lack proper
estimates of consumption, and the influence of taxation (and prices) on the
demand and budget revenues. Even the problem of smuggl ing has not been
6 See ICPS (2000).

9
properly analyzed. This is mainly explained by high costs of conducting such
research and surveys. Consequently, any scientific approaches towards these
issues are missing. Hence, my research will be one of the first attempts to address
these problems. However, this also represents a weakness of my research,
because it is impossible to compare my results with any other research, since the
latter is missing.
With all this information in mind, I am ready to develop a theoretic model
relevant to the Ukrainian market. This will be done in the following chapter.

10
C h a p t e r 3
THEORETIC FRAMEWORK
Previous Theoretic Findings
As was mentioned above, the scope of my research is broad since I try to
consider the general environment in which excise taxation takes place. Hence, I
try to estimate the impact of excise taxation on budget revenues, while also
considering the effect of taxation on consumers and producers. Such approach
allows to evaluate general effectiveness of the excise taxation policy and
determine possible directions of the policy.
In their papers, other researchers typically analyzed one of the problems set in my
research: either they were concerned with tax revenues, or cigarette consumption,
or firms’ profits. So, till present, I have not found a comprehensive research
where all the three issues were analyzed. However, the articles I have already read
contain useful information and method descriptions related to different aspects
of my research. The majority of literature deals with the issue of cigarette
consumption and its effect on people’s health. At the same time, majority of the
papers was devoted to cigarette consumption in developed countries and hence,
the effect of taxation on budget revenues was mainly ignored (since in developed
countries, excise proceeds make-up a small share of tax revenues).
In order to determine the impact of taxation on budget revenues, it is necessary
to get an idea of the demand for cigarettes. Tax proceeds will be largely
dependent upon the reaction of consumers to changes in the tax rate (and hence,
prices). Therefore, the first issue in my research is estimation of cigarette demand.

11
Basically, economists distinguish between two groups of models where an
addictive good is involved. The two groups are “myopic behavior models” and
“rational behavior models”.7 When consumers are “rational”, they take into
account all future effects of their present consumption (they maximize life-time
utility). In the case of cigarettes, consumers realize future harm and utility of their
present consumption decisions. That is, present consumption will also depend
upon future consumption.
On the contrary, “myopic behavior” models assume that consumers do not
realize (or pay attention) to future effects. The only thing that matters is the
addiction of consumers. This means that when consumers increase their demand
in the current period, it will be difficult for them to stop consuming the good in
the future even if the price grows. Hence, present cigarette consumption will
depend upon past consumption (since cigarettes represent an addictive good) and
not upon future consumption. Such feature of the cigarette demand makes the
long-term elasticity of demand higher.
It is reasonable to assume that “myopic behavior” model is more relevant to
Ukraine’s tobacco market, since mainly, the public is not aware of the long-term
harmful effects of smoking and there were no well-developed programs for
informing people and youth, in particular, about these effects. Hence, in my
estimations I will test the hypothesis of consumers’ ”myopic behavior”.
As opposed to estimates for highly developed countries8, where the price
elasticity of cigarette demand is in the range from –0.4 to –0.6, the elasticity tends
to be higher for low-income countries (from –0.8 to –1) since here, consumers
7 See, for example, Grossman, M., et al (1998), and Galbraith and Kaiserman (1997) .
8 See, for example, Harris E., Jeffrey (1994).

12
are more price sensitive9. Hence, one should expect the elasticity of demand for
Ukraine to be closer to one.
In the view of the problem of smuggling, it is possible to use one important
explanatory variable while estimating a demand function: an incentive to smuggle.
This is represented by the difference in excise rates between two neighboring
states (countries). Some successful attempts were made in estimating demand
functions using this regressor (among others) and it turned to be statistically
significant10. Baltagi and Levin (1986) used almost the same approach. In their
study for the US, they included the price of cigarettes in neighboring states while
estimating cigarette demand for each particular state. Excluding this regressor will
lead to the price elasticity estimate being biased upward.
After determining factors that influence the demand for cigarettes in Ukraine, I
will turn to the major issue of my research – determining the relationship
between the excise tax rate and government revenues. Here, the concept of the
Laffer curve will be used. According to theory11, when the tax rate is increased,
tax proceeds start growing. However, after a certain point is reached, further
increases in the tax rate will cause the proceeds to shrink, since consumers will
adjust their behavior. Consequently, tax proceeds are determined by the tax rate
on the one hand, and factors that influence the demand for a certain good – on
the other.
Finally, I will try to determine the impact of excise taxation on producers’ profits.
In case currently, producers receive small profits, an increase in the tax rate may
lead to the situation when some firms find it unprofitable to operate in the
Ukrainian market. If some producers leave the market, the government will
9 Chaloupka, et al (2000).
10 See Thursby G., Jerry; Thursby C., Marie. (1994).
11 See, for example, Sachs, J., Larrain, F. (1993).

13
definitely lose in terms of tax proceeds. As was described earlier, concentration in
the market is rather high, and hence, each firm has some market power. Since,
firms do not typically report their profits, it would be reasonable to somehow
estimate the average mark-up in the industry.
One way of estimating the mark-up was described in Sumner (1981). The author
proposed a simple method of estimating the mark-up without direct
measurement of producer costs. Hence, the major problem (i.e. determining
producer costs) of such estimates is avoided. Using a simple proof, Sumner
(1981) showed that “the coefficient of the tax rate term in a price equation
identifies the ratio of price to marginal cost”. According to this methodology, all
one needs to do is to estimate an equation where the price is determined as a
function of some explanatory variables12. Moreover, based on the coefficient of
the tax rate, it is possible to estimate the average firm-level price elasticity of
demand. According to Sumner (1981), the following equality holds:
θj = ηj/(ηj+1)
where ηj is the firm-level price elasticity of demand, and θj is the coefficient of
the tax rate term in a price equation.
The methodology proposed by Sumner (1981) will help me determine the mark-
up (i.e. profits) in the Ukrainian tobacco industry. If the mark-up is significant,
the government may be in a position to increase the excise tax rate if found
necessary.
In my research, I will not consider such issues as advantages and disadvantages of
specific and ad valorem excise taxes. However, one thing is worth noting. Many
articles and books were devoted to the issues of excise taxation, including ad
12 Similar methodology was used in Delipalla, S., O’Donnell, O. (1999).

14
valorem, specific, and mixed taxation.13 As the evidence suggests, implementation
of different taxation methods depends on the government objectives. In my
research, I assumed two basic goals of Ukraine’s government: to raise revenues
and reduce cigarette consumption. In this case, specific excise taxation is more
relevant. According to some researches14, an increase in a specific tax leads to a
larger increase in cigarette prices as compared to the ad valorem tax. Hence, it is
more powerful in distracting people from smoking and does not cause significant
losses to producers since the major share of excise tax is transferred to
consumers15 (which in turn, ensures state budget revenue inflow).
Developing a Theoretic Model Relevant to the Ukrainian Market16
As described above, in my research, I will analyze the situation from the
viewpoint of the government, consumers, and producers. However, the major
topic of my research is to estimate the revenue-maximizing excise rate. The focus
on maximizing tax proceeds is explained by the fact that governments (especially
in low-income countries) are mainly concerned with raising revenues from
taxation, while other objectives (e.g. reduce consumption of certain goods) are of
lower priority. Nevertheless, I will start developing a theoretic model from
deriving a demand function. Such logic is justified, since determining factors that
influence cigarette demand in Ukraine will facilitate deriving the relationship
between the excise rate and tax proceeds. After determining factors influencing
the demand, it will be possible to derive a Laffer curve for the tobacco industry
13 See, for example, Chaloupka, F., et al (2000), and Oxford Economic Forecasting and International Tax and
Investment Center (2001) .
14 See Delipalla, S., O’Donnell, O. (1999).
15 Ibid.
16 In this paper, I do not analyze the effect of excise taxation and government policy on different consumer groups. Hen ce, the issues of wealth distribution and equity are not discussed here. In my model, the government is interested in maximizing tax proceeds while also caring about the general reduction in cigarette consumption. The issues of wealth distribution and equity are discussed, for example, in Friedman, M. (1952) and Break, G. (1954).
15
since tax proceeds depend both on the tax rate and consumption patterns.
Hence, below I derive three sub-models.
The first sub-model (consumer) aims at determining factors influencing cigarette
demand in Ukraine. The second sub-model (government) will be built on the
basis of information obtained from the first sub-model. The government sub-
model is used for deriving a Laffer curve, which shows the relationship between
the tax rate and tax proceeds. Finally, the third sub-model (producer) is aimed at
determining the impact of excise taxation on producers (and their profits in
particular). The reason for introducing this last model lies in the fact that if the
government decides to increase the excise rate significantly, some producers may
leave the market if their activity becomes unprofitable. This in turn may
negatively affect potential budget revenues.
Consumer model
This model is used for determining consumers’ reaction on changes in the excise
rate. Since no data is available on consumption of cigarettes in Ukraine, the only
possibility is to use legal sales as a dependent variable. However, this may not
pose significant problems if the effect of smuggling is taken into account. As
some researches showed,17 it is still possible to obtain reliable estimates of the
demand function if attention is paid to the smuggling problem.
As mentioned above, to estimate the correct price (or tax) elasticity of demand
there is a need to consider smuggling. One possibility is to include the “incentive
variable”. This incentive variable is represented by the difference in cigarette
prices (or in my case – in excise tax rates) in two neighboring countries.18 Hence,
it measures the potential profit from smuggling. It is assumed that cigarettes in
17 See for example Sung, Hai-Yen et al (1992).
18 Baltagi, B., Levin, D. (1986).

16
the two countries are of similar quality (which is true for Ukraine and its
neighboring countries) and the only factor that causes smuggling is the tax
differential. The larger is the potential profit, the more incentives will smugglers
have to bring illegal products to the country with higher taxes.
In the case of Ukraine, majority of illegal products comes from Russia19, which is
explained by the existence of rather transparent borders between the two
countries. Hence, I include the difference between the excise rates in Ukraine and
Russia as an explanatory variable. However, one modification of the incentive
variable could be the ratio of the two excise rates. This modified variable will
have the same meaning, while it may be suitable for some model specifications.
One peculiarity of smuggling is that it takes time for smugglers to identify the
difference or change in taxes (and hence, prices) and to establish channels for
distribution of illegal products. Consequently, a change in the excise rate in Russia
will not influence Ukrainian market immediately. Instead, some time will pass
before the effect will be felt in the Ukrainian market. One example when there
was a dramatic drop in the Russian excise tax, is the financial crisis of 1998. After
the depreciation of the ruble, the excise tax in Russia fell in real terms and in
hryvnia equivalent. As tobacco producers claimed, after the crisis, the massive
inflow of illegal cigarettes started after 4-5 months. Hence, it is reasonable to
incorporate this information into my model.
There could be other explanations why extensive smuggling does not occur
immediately after the opportunity of extracting profits occur. First of all,
consumers may be “brand-addicted”. This means that a consumer is used to
smoking a particular cigarette brand. Hence, if his “favorite” brand becomes
relatively more expensive, the consumer my not switch to other cheaper
19 See ICPS (2000).
17
(smuggled) brands immediately. Instead, the consumer will look for a smuggled
brand that is more close to his taste. This process will take some time, and the
consumer will switch to smuggled cigarettes after a certain period of time.
Another reason is the necessity to transport smuggled goods to more distant
regions. As it was observed20, initially, smuggled cigarettes entered the markets of
Eastern oblasts of Ukraine that are located directly at the border with Russia.
Now, these markets are extensively supplied by smugglers. However, in order to
extend their markets, smugglers need to move to other oblasts, which are more
distant. This requires establishing new distribution chains in other oblasts, which
in turn requires certain expenditures and time.
Typical models of demand for any good include price as a main regressor.
However, in my research, I am more interested in the effect of the excise tax on
the demand for cigarettes. Hence, the demand should be modeled using the
excise rate as an explanatory variable. Of course, this does not allow explicit
inclusion of the price variable in my model because of the likely correlation
between the price and the excise rate. Instead, I will need to include factors that
influence (determine) the price among which is the excise tax.
The most common factors that influence cigarette demand include income,
demand in the previous periods (according to the myopic behavior model and
existence of the addiction to cigarettes), and the price21. In my case, the price
variable will be replaced by the excise tax and the exchange rate of the hryvnia
with respect to the US dollar. The reason for including the exchange rate lies in
the fact that cigarettes in Ukraine are mainly produced from imported raw
tobacco (the main exporter is the USA). Since the cost of tobacco accounts for a
20 ICPS (2000).
21 See Becker G. et al (1994).
18
significant share of the total costs, fluctuations in the exchange rate reflect
changes in the price of the major input (i.e., tobacco). Consequently, depreciation
of the hryvnia will increase the price of tobacco, which in turn will lead to higher
cigarette prices.
However, in Ukraine, US dollars play another role. It is acknowledged in many
researches22 that Ukrainians extensively use dollars as a store of wealth. Hence,
while a depreciation of the hryvnia will increase cigarette prices (and decrease the
demand) it will likely have another effect. Actually, a depreciation of the hryvnia
means that consumers become wealthier, since their wealth in hryvnia equivalent
grows. Consequently, the exchange rate of the hryvnia with respect to the US
dollar will have two opposite effects: on the one hand, a depreciation of hryvnia
will reduce cigarette demand, due to higher prices, while on the other hand, the
depreciation will foster cigarette demand, due to increased wealth of Ukrainian
consumers.
Although it was often assumed in previous research that the price (or in my case,
its substitutes) influences consumers’ behavior in the same period, it is very likely
that consumers will not react to price changes immediately. This may happen due
to the existence of smoking habit (or addiction) and slow reaction of consumers
to market changes (which is true for the Ukrainian market).
Some estimates23 show that Ukrainian consumers tend to respond to price
changes with a lag equal to one period. In the cigarette market, one possible
explanation to this may be the fact that numerous cigarette retailers do not raise
their prices simultaneously. Instead, some of them prefer to keep their prices
22 See, for example, UEPLAC (2000).
23 For example, a complex macroeconomic model for Ukraine is estimated by the International Center for Policy Studies in the framework of one of its ongoing projects. These estimates support the hypothesis that Ukrainian consumers tend to react to price changes with a lag equal to 1 period.

19
unchanged for some period of time in order not to distract consumers and even
gain from their increased market share. Hence, an increase in the price may leave
current consumption unchanged, while it will influence future consumer
decisions.
Taking into account the analysis and assumptions given above, it is possible to
derive the following equation for estimation of cigarette demand in Ukraine24:
Dom_salest = a1 + a2*Exciset + a3*Exciset-1 + a4*DY t + a5*Dom_sales t-1 +
a6*(Exciset/Rust-4) + a 7USt + a 8USt-1
where Dom_sales stands for domestic sales (calculated as domestic production +
imports – exports); Excise is the excise rate in Ukraine; DY – consumption
expenditures by households; Rus – excise rate in Russia (the major illegal exporter
of cigarettes to Ukraine); US – exchange rate of the hryvnia with respect to the
US dollar.
Of course, this is a schematic representation of the exact econometric model. The
exact number of lags in each variable will be determined later, as well as the form
of the curve (linear or non-linear)25.
One should expect a2 and a3 to be negative since an increase in the corresponding
variables represent an increase in the cigarette price. The sign of the coefficients
in front of the US variable may be either positive, or negative. This is explained
by the fact that Ukrainians consider dollars as the main store of wealth. Hence, an
increase in US (depreciation of the hryvnia) will raise the hryvnia value of
“savings” accumulated in dollars which represents an increase in people’s wealth.
24 Since I am mainly interested in estimating the elasticity of the demand with respect to the excise rate, I will
estimate this equation in the logarithmic form.
25 This depends on the peculiarities of the market and consumer behavior. A priori economic analysis does not allow to establish the exact form of the demand function.

20
Higher level of wealth will tend to increase people’s demand for consumer goods
and cigarettes, in particular. Thus, the sign of this explanatory variable (US) will
depend on which effect dominates: higher price of cigarettes (due to higher price
of raw tobacco) reducing demand, or higher wealth increasing demand.
The sign of the a6 coefficient is expected to be negative. This is the discussed
above “incentive variable”. It is clear that the higher the ratio of the two excise
rates, the more smuggled goods will enter Ukrainian market and more consumers
will consume them. Of course, this will negatively affect legal domestic sales.
Other coefficients should be found positive. Higher consumption expenditures
will increase demand for consumer goods and cigarettes, in particular. Lagged
consumption variable (Dom_salest-1) will also have a positive effect on current
sales due to the addiction effect. In general, addiction implies that higher
consumption today will increase future consumption.
Government model
After determining factors influencing cigarette demand, I can turn to the main
topic: deriving the relationship between the excise rate and budget revenues.
Hence, the so-called “government model” is aimed at estimating the relationship
between the excise rate and excise tax revenues. The concept is known as the
Laffer curve. According to the theory 26, when the tax rate is increased tax
revenues grow up to a certain point. At this point, tax revenues are maximized
and further increase in the tax rate will reduce tax revenues. Hence, I need to
apply this model to the Ukrainian tobacco industry27.
26 See, for example, Varian (1999).
27 Note that only legal cigarettes are taken into account while calculating tax revenues.

21
Due to the indicated features of the Laffer curve, the equation describing the
model cannot be linear because as the theory predicts, the corresponding curve
slopes upward, reaches its maximum, and, finally, declines. The dependent
variable is excise tax revenue, which is easily calculated given that Ukraine has
specific excise taxation.
Tax revenues naturally depend on the tax rate. However, on the other hand,
revenues are influenced by the demand. If taxes are raised significantly, the price
of the taxed good is likely to grow causing the demand to shrink. In addition, the
above-mentioned specific features of addictive goods will influence the Laffer
curve equation.
It was mentioned earlier that consumers of addictive goods may not react
immediately to price (or tax) changes. If for example, changes in the tax rate do
not affect current demand (which is likely in case of cigarettes), an unanticipated
increase in the tax rate may cause revenues to grow sharply in the current period,
while they will be reduced in the next period when consumers finally change their
behavior (in this case – reduce demand) after the tax increase. Thus, it is
reasonable to include both current and past excise rates as explanatory variables
in the Laffer curve equation for the tobacco industry.
In addition to the excise rate, there is a need to include explanatory variables that
influence the demand for legal cigarettes. In particular, as was described above, if
smuggling is not taken into account, the estimated coefficients are likely to be
biased. Hence, in order to estimate “pure” effect of the excise rate on tax
revenues, the incentive variable will be included as an additional regressor. This
will be included in the same form as in the demand function (see above).

22
To make the model complete, I will include other factors influencing cigarette
demand. These are consumption expenditures and the exchange rate of the
hryvnia with respect to the US dollar.
Taking into account previous analysis, it is possible to construct a simple version
of the Laffer curve for Ukraine’s tobacco industry:
Rev_tt = b1 + b2*Exciset̂ 2 + b3*Exciset-1 + b4*Exciset-1^2 + b5*(Exciset/Rust-4)
+ b6*DY t + b7*USt + b8*US t-1
where Rev_t represent excise tax revenues; Excise – is the excise rate in Ukraine;
Rus – is the excise rate in Russia; DY – consumption expenditures by
households; and US – the exchange rate of the hryvnia with respect to the US
dollar.
According to my earlier analysis and assumptions, b2 is likely to be positive since
consumers will not react immediately and an increase in the tax rate will increase
tax revenues in the current period. b3 and b4 will have opposite signs since the
past excise rate affects demand and, consequently, revenues. These coefficients
account for the specific shape of the Laffer curve. b5 is expected to be negative
since an increased incentive to smuggle will reduce legal sales and hence, budget
revenues (as described above). b6 is expected to be positive, since higher
consumption expenditures will increase cigarette demand and hence, budget
revenues (see above). Finally, the coefficients in front of the US variable can be
positive or negative depending on which effect (price change or wealth)
dominates.
Producer model
The third sub-model (i.e. producer) is aimed at estimating average profits in the
industry. Specifically, my objective is to estimate the average mark-up. Here, I will

23
use the methodology proposed by Sumner (1981) and described above. Hence,
after estimating the price equation, I will be able to determine the mark-up in the
industry on the basis of the coefficient of the tax rate variable in the price
equation. It is worth mentioning that other methods were developed as well28 to
estimate the mark-up and market power of producers in an industry. However,
these methods are also based on estimates of the price equation.
Hence, the key element of this model is the price equation. This equation shows
the relationship between the price and factors that determine the price. Usually,
the average price is used as a dependent variable. In Ukraine, it is possible to
predict that cigarette prices are mainly determined by taxes (and excise tax in
particular) and the exchange rate of the hryvnia with respect to the US dollar.
The reason for including the exchange rate was described earlier. Since cigarette
production depends on imported raw tobacco, any changes in the exchange rate
will affect the price of this key input. This, in turn, will affect the price of the
output (i.e. cigarettes).
Another factor that is likely to influence cigarette prices is labor costs. However,
no statistics are available on wages in this particular industry, and the average
wage in the whole economy is unlikely to represent the true picture. Due to the
exclusion of this important variable, there may be a need to control for possible
autocorrelation.
Hence, I will estimate the following equation:
PRICEt = c 1 + c 2*(EXCISE/50)t + c 3*USt
28 See, for example, Delipalla, Sophia; O’Donnell, Owen (1999).

24
Where PRICE is the average price per pack of cigarettes; EXCISE/50 – is the
excise rate per pack of cigarettes29; US – is the exchange rate of the hryvnia with
respect to the US dollar.
In this equation, one should expect both c2 and c3 to be positive, since a higher
tax and a depreciation of the hryvnia (growth in the US variable) represent an
increase in the cost of production. Under the higher costs, producers will charge
higher prices for their products.
What I am interested in, is the coefficient c2. As described above, this coefficient
is an estimate of the ratio of the price to the marginal cost of production. In
order to obtain an estimate of the mark-up in the tobacco industry, I will need to
subtract 1 from c2.
Now, when the three theoretic models are derived, I can turn to the empirical
part of my research.
29 Prices are given for a pack of cigarettes, while the excise tax is calculated per 1000 sticks. Dividing the
excise rate by 50 (since 1000 sticks is equivalent to 50 packs) will give me the excise rate per one pack of cigarettes.
25
C h a p t e r 4
EMPIRICAL RESULTS
Data Description
While estimating the three sub-models (i.e. consumer, government, and
producer), I used monthly data for the period from January 1997 to December
2000 for a total of 48 observations. This period was chosen because up to 1997,
the tobacco industry had been well regulated and tobacco producers started to
exhibit “market behavior” thereafter. Prior to this, producers had been increasing
production and developing their capacities, and hence, any conclusions based on
the 1991-1996 period are likely to be unreliable. Moreover, starting approximately
in 1996-1997, reliable statistical data are available.
For a detailed description of data sources and transformations see Appendix D.
Model Estimation Results
Consumer model
Using the previously derived theoretic model, I will determine the relationship
between the excise rate and domestic sales and obtain an estimate of the
corresponding elasticity. The estimation output produced by the EViews software
and the exact model specification are given in Appendix A. As can be seen, all
coefficients are significant at 10% level of significance. Also note that all
coefficients have correct (expected) signs.

26
A number of model specifications was tried30 and the best one is given in the
Appendix. Quadratic variables were used where appropriate to account for
possible non-linearity.
As was predicted, Ukrainian smokers do not react immediately to excise (and
price) changes. Instead the lagged variable is used. This means that an increase in
the excise rate will not cause an immediate decline in the demand. Instead,
consumers will react in the following period. The elasticity of demand with
respect to the excise rate was found to be –0.37. Note that this figure represents
the “pure” effect of the excise rate on consumption since the problem of
smuggling was taken into account using a separate regressor.
As was argued by tobacco producers, changes in the excise rate in Russia affect
Ukrainian market after a certain period of time. It was estimated that the lag
equals 4 months. As can be seen, the elasticity of legal sales in Ukraine with
respect to the incentive variable equals -0.12. This means that 1% increase in the
incentive variable leads to 0.12% decrease in legal sales of tobacco products in
Ukraine (because these consumers switched to illegal products).
My estimates supported the idea of the myopic behavior of Ukrainian smokers.
The coefficient of lagged domestic sales is positive and significant. This implies
that higher consumption in the past will tend to increase current consumption
due to the existence of habit or addiction.
As I suspected, at the current values, the net effect of the exchange rate is
positive. This implies that the wealth effect described above dominates the effect
of the higher cigarette price. When the hryvnia depreciates, consumers increase
their demand probably due to their increased wealth.
30 For other possible specifications see Appendix E.

27
Real consumption expenditures (a measure of the household income) have a net
positive effect on consumption as it was predicted by the theory31.
Government model
Here, the Laffer curve for the tobacco industry was estimated. For the estimation
output and exact specification of this model see Appendix B. As can be seen, all
coefficients are statistically significant at 5% level of significance.
The signs of the coefficients correspond to those predicted earlier in this paper.
Since the demand estimations showed that consumers do not react immediately
to changes in the market, excise revenues increase in the period when the excise
rate is raised. However, in the following period, consumers adjust their behavior
and domestic sales fall. A closer look at the equation shows that the estimated
Laffer curve has a regular shape predicted by the theory with one global
maximum corresponding to the revenue-maximizing excise rate.
As was predicted, the incentive variable negatively affects budget revenues. When
smugglers have more incentives to smuggle, the market for illegal products
expands and hence, domestic sales fall. This in turn implies lower budget
revenues. This feature was first observed while estimating the demand function.
Other included variables (i.e. real consumption expenditures and hryvnia/US
dollar exchange rate) have expected signs as well. This again was observed for the
first time while estimating the demand function. Note also that as in the demand
function, the overall effect of the exchange rate is positive (at present values).
31 However, note that the income elasticity of the demand in Ukrainian cigarette market is higher than in
more developed countries (see Reinhardt, F., Giles, D. (1999)) where it was estimated to be around 0.2. Hence, my estimates support the hypothesis that consumers in low-income countries are more sensitive to changes in their incomes.

28
This again supports the idea that wealth effect dominates the effect of higher
cigarette prices.
Producer model
The estimated producer model is given in Appendix C. As can be seen, all
coefficients are statistically significant even at 1% level of significance. Moreover,
the coefficients have expected (predicted) signs.
My estimates showed that the coefficient of the tax rate variable equals
approximately +1.54. This implies that the average mark-up in the Ukrainian
tobacco industry is about 54%. Using the formula given in Sumner (1981) (θj =
ηj/(ηj+1)), I can calculate the average firm-level price elasticity of demand. For
the Ukrainian tobacco industry this is equal to approximately –2.85. These two
estimates clearly show that Ukrainian cigarette producers on average receive
significant profits and have relatively strong market power.
Evaluation of the Current Ukrainian Excise Policy and Policy Implications
Now, I will turn to analyzing the current excise policy in Ukraine. Based on my
estimates, it is possible to draw several conclusions about the effectiveness of
such policy, and provide some recommendations on its improvement.
The Laffer curve estimated above makes it possible to calculate whether the
government maximizes its revenues. In case the current excise policy is not
optimal and the government should change the excise rate, the demand function
will show the effect of such changes on the consumption of cigarettes. Finally,
having the prediction of the producer profits on the basis of the producer model
aimed at estimating the mark-up in the industry, will allow me to forecast the
effect of such policy changes on cigarette producers.

29
Straightforward calculations show that excise taxation in Ukraine is sub-optimal.
In my simulation, I took all values (except for the excise rate) as of December
2000. Substituting these values into the estimated Laffer curve and leaving only
one independent variable (i.e. the excise rate) produces the following picture. The
revenue-maximizing excise rate equals approximately 9.5 constant 1995 hryvnia
per 1000 stick32. At the same time, the excise rate as of December 2000, equaled
approximately 3.6 constant hryvnia per 1000 stick. Hence, the actual excise rate
was 2.6 times lower than the revenue-maximizing rate. Consequently, if the
government increases the excise rate to the theoretically predicted revenue-
maximizing value, budget revenue will grow by 6.3 million constant 1995 hryvnia
per month.
Performing the necessary calculations using the demand function allows me to
obtain some additional results. If the excise rate is increased up to 9.5 hryvnia,
consumption of cigarettes will drop by approximately 59%. At the same time,
consumption of illegal cigarettes will rise by about 19.8%.
Of course, such results should be interpreted with care. Such a huge drop in
consumption (59%) may seem unrealistic. However, the estimated elasticity of
the demand with respect to the excise rate is in line with estimates for other
countries33. However, we are nevertheless unlikely to observe such changes in
consumption since:
• Such a huge jump in the excise rate will definitely change the coefficients in
my estimated equations. Given such a jump, one will need to re-estimate all
equations and the new results may turn to be completely different (consumers
32 In other words, all monetary variables in my model are inflation-adjusted (i.e., expressed in real terms).
33 See Chaloupka, F., et al (2000).

30
are likely to change their behavior). It is impossible to obtain reliable estimates,
if you deal with such dramatic changes in any variable.
• After such a huge increase in the excise rate, I can predict that consumers will
adjust their behavior slower (it is unlikely that 59% of addicted consumers will
quickly quit smoking). Hence, the lag will not equal one. Meanwhile, the
following factors will tend to increase cigarette demand thus counteracting the
excise increase: a gradual increase in the overall level of household income,
depreciation of the hryvnia, and inflation (as CPI increases, the variables
expressed in constant terms (e.g., excise rate) will fall).
• It is possible that some consumers will switch to self-made cigarettes.
Despite the indicated limitations, some conclusions can be drawn from my
research:
1) It is in government’s interests to increase the excise rate in the tobacco
industry. This will definitely increase state budget revenues.
2) Besides increasing tax proceeds, such policy will reduce cigarette
consumption in Ukraine, which will help implement the state health care
policy. An increase in the excise rate (and hence, in the price) will reduce
smoking among the most price-sensitive groups of consumers. These are,
first of all, young people34.
3) The observed trend of increasing household income will promote cigarette
consumption. However, given the specification of the Laffer curve, the
optimal excise rate will not change due to growing incomes. At any excise
rate households will simply smoke more, which will ensure higher tax
34 See Grossman, M., et al (1998).

31
proceeds. If the major goal is maximizing budget revenues, there is no need
to change the optimal excise rate due to growing household incomes.
4) There is an urgent need to implement administrative measures to counteract
smuggling. In terms of my model, successful anti-smuggling policy will result
in the reduced coefficient in front of the incentive variable. For example,
increased protection of the state border will make it difficult for smugglers to
bring illegal products to Ukraine. Hence, at each value of the incentive
variable, there will be less illegal products in the Ukrainian market. As a result
of the anti-smuggling policy, state budget revenues will grow, while less
criminal activity will take place.
5) On average, cigarette producers receive significant profits. Hence, I can
predict that even under the higher excise rate (which will reduce producers’
sales) producers will be able to extract some profits and still remain in the
market.
32
C h a p t e r 5
CONCLUSIONS
In this paper, I developed a theoretic model of efficient excise taxation of
cigarettes in Ukraine. Efficiency was considered from the government’s
viewpoint. In my model, the government is aiming at maximizing its revenues,
while also trying to reduce consumption of such a harmful good as cigarettes. In
addition, Ukraine’s cigarette market is subject to extensive smuggling, which
results in the necessity to control for this important factor while conducting any
estimates.
The general model was split into three sub-models: government model aiming at
determining the relationship between the excise rate and budget revenues;
consumer model aiming at determining the effect of excise taxation on cigarette
consumption; and producer model aiming at estimating average profits in the
industry.
The government model showed that the current excise rate is far below the
revenue-maximizing rate (Ukraine is on the upward-sloping portion of the Laffer
curve). Hence, budget revenues can be significantly increased if the excise rate is
increased.
From the consumer model, I can conclude that increased excise rate will indeed
reduce cigarette consumption (which is the goal of the state health care policy),
while also increasing the amount of illegal products consumed. At the same time,
higher household income tends to increase demand for consumer goods and
cigarettes in particular. My model also supports the hypothesis of consumers’

33
“myopic behavior”, which means that consumers exhibit addictive behavior,
while not caring about future effects of their present consumption decisions.
Finally, the producer model showed that the average mark -up in the tobacco
industry is significant. Hence, the claims of cigarette producers that their profits
are minimal (and they need lower excise rates) are not justified. This again
supports the idea of the necessity to increase the excise rate.
Hence, based on my estimates the following recommendations and conclusions
can be made:
1) It is in government’s interests to increase the excise rate in the tobacco
industry. This will increase state budget revenues.
2) Besides increasing tax proceeds, such policy will reduce cigarette
consumption in Ukraine, which will help implement the state health care
policy.
3) There is an urgent need to implement administrative measures to counteract
smuggling. As a result of the successful anti-smuggling policy, state budget
revenues will grow, while less criminal activity will take place.
4) On average, cigarette producers receive significant profits. Hence, even under
the higher excise rate (which will reduce producers’ sales) producers will be
able to extract some profits and still remain in the industry.
34
WORKS CITED
Baltagi B., Levin D. 1986. Estimating dynamic demand for cigarettes using panel data: The effects of bootlegging, taxation, and advertising Reconsidered. The Review of Economics and Statistics, volume 68, issue 1, p.p. 148-155.
Becker G., Grossman M., Murphy K. 1994. An empirical analysis of cigarette addiction. The American Economic Review, volume 84, issue 3, p.p. 396-418.
Break, George. 1954. Excise tax burdens and benefits. The American Economic Review, volume 44, issue 4, p.p. 577-594.
“Business” newspaper (ãàçåòà «Áèçíåñ»), 2001, #9 (424), February 26. Tobacco captains 2001 (Òàáà÷íûå êàïèòàíû 2001).
Chaloupka J., Frank; Hu, T.-W.; Warner E., Kenneth; van der Merwe, Rowena; Yurekli, Ayda. 2000. The taxation of tobacco products. Tobacco Control in Developing Countries, chapter 10, p.p. 235-272.
Delipalla, Sophia; O’Donnell, Owen. 1999. Estimating tax incidence, market power and market conduct: the European cigarette industry. Working paper.
Friedman, Milton. 1952. The “welfare” effects of an income tax and an excise tax. The Journal of Political
Economy, volume 60, issue 1, p.p. 25-33.
Galbraith, John; Kaiserman, Murray. 1997. Taxation, smuggling and demand for cigarettes in Canada: Evidence from time-series data. Journal of Health Economics, volume 16, p.p. 287-301.
Grossman, M., et al. 1998. A survey of economic models of addictive behavior. Journal of Drug Issues 28(3), p.p. 631-643.
Harris E., Jeffrey. 1994. A working model for predicting the consumption and revenue impacts of large increases in the U.S. federal cigarette excise tax. Working paper.
ICPS. 2000. Causes and effects of the illegal import and circulation of tobacco products in Ukraine. Analytical report.
Institute for transition economics (Èíñòèòóò ýêîí î ì è ê è ïåðåõîäíîãî ïåðèîäà). 2000. Problems of the tax system in Russia: theory, experience, reform (Ï ð î á ë å ì û íàëîãîâîé ñèñòåìû Ðîññèè: òåîðèÿ, î ï û ò, ðåô îð ìà). Volume 1, chapter 5.
Oxford economic forecasting; International tax and investment center. 2001. Should cigarette excise taxes be ad valorem or specific? International tax notes, volume 22, # 2.

35
Parliament of the Russian Federation. 1991. Federal Law “On excises” ( Îá àêöèçàõ ). Amendments to the Law: 10.01.1997; 4.02.1998; 3.12.1999. Available at www.referent.ru. Last accessed 1.04.2001.
Reinhardt, Frank; Giles, David. 1999. Are cigarette bans really good economic policy? Working paper.
Sachs, Jeffrey; Larrain, Felipe. 1993. Macroeconomics in the global economy.
Sumner, D. 1981. Measurement of monopoly behavior: An application to the cigarette industry. Journal of Political Economy, volume 89, #5.
Sung H.-Y., Hu T.-W., and Keeler T. 1992. A dynamic simultaneous -equations model for cigarette consumption in the Western states. Working paper.
Thursby G., Jerry; Thursby C., Marie. 1994. Interstate cigarette bootlegging: extent, revenue losses, and effects of federal intervention. NBER working paper #4763.
UEPLAC. November 2000. Ukrainian economic trends. Analytical bulletin.
Varian R., Hal. 1999. Intermediate microeconomics. A modern approach. Fifth edition.
Verkhovna Rada of Ukraine. 1995. The Law of Ukraine “On the excise on alcoholic beverages and tobacco products” ( Ïðî àêöèçíèé çá³ð íà àëêîãîëüí³ íàïî¿ òà òþòþíîâ³ âèðîáè). #329/95-ÂÐ. Amendments to the Law: 11.09.1997; 5.03.1998; 11.12.1998; 20.04.2000.
Information-analytical center “LIGA”.
Warner, Kenneth; Chaloupka, Frank; and others. 1995. Criteria for determining an optimal cigarette tax: the economist’s perspective. Tobacco Control, volume 4, #4, p.p. 380-386.
The World Bank. 1999. Curbing the Epidemic: Governments and the Economics of Tobacco Control. Analytical Report.

36
APPENDIX A. ESTIMATION OUTPUT: DEMAND FOR CIGARETTES IN UKRAINE
Dependent Variable: LOG(DOM_SALES) Method: Least Squares Sample(adjusted): 1997:05 2000:12 Included observations: 44 after adjusting endpoints
Variable Coefficient Std. Error t-Statistic Prob.
C 2.117110 1.632081 1.297184 0.2028 LOG(EXCISE(-1)) -0.374864 0.199871 -1.875528 0.0688 LOG(DOM_SALES(-2)) 0.178263 0.097099 1.835882 0.0746 LOG(US(-1)) 3.120598 1.056833 2.952783 0.0055 LOG(US(-1))^2 -1.298763 0.422626 -3.073080 0.0040 LOG(DY) 0.937096 0.180657 5.187166 0.0000 LOG(DY(-1)) -0.429698 0.188458 -2.280066 0.0286 LOG(EXCISE(-1)/RUS(-4)) -0.121752 0.065262 -1.865599 0.0703
R-squared 0.739327 Mean dependent var 8.468519 Adjusted R-squared 0.688640 S.D. dependent var 0.174947 S.E. of regression 0.097620 Akaike info criterion -1.652503 Sum squared resid 0.343068 Schwarz criterion -1.328105 Durbin-Watson stat 2.204812 F-statistic 14.58626 Prob(F-statistic) 0.000000 Variables: DOM_SALES – domestic sales of legal cigarettes in Ukraine EXCISE – real excise rate per 1000 cigarettes in Ukraine RUS - real excise rate per 1000 cigarettes in Russia US – exchange rate of the hryvnia with respect to the US dollar DY – real consumption expenditures in Ukraine

37
APPENDIX B. ESTIMATION OUTPUT: LAFFER CURVE FOR UKRAINE’S TOBACCO INDUSTRY
Dependent Variable: REV_T Method: Least Squares Sample(adjusted): 1997:05 2000:12 Included observations: 44 after adjusting endpoints
Variable Coefficient Std. Error t-Statistic Prob.
C -39973.69 11799.02 -3.387881 0.0017 EXCISE 4413.206 913.3285 4.832003 0.0000 EXCISE(-1)̂ 2 -195.7598 88.91744 -2.201590 0.0340 EXCISE(-1)/RUS(-4) -1048.341 310.4264 -3.377100 0.0017 DY 6.344860 1.814644 3.496477 0.0012 US(-1) 23538.11 8999.621 2.615455 0.0128 US(-1)̂ 2 -3114.914 1164.290 -2.675378 0.0111
R-squared 0.923689 Mean dependent var 19718.40 Adjusted R-squared 0.911314 S.D. dependent var 6644.781 S.E. of regression 1978.828 Akaike info criterion 18.16331 Sum squared resid 1.45E+08 Schwarz criterion 18.44716 Durbin-Watson stat 2.182865 F-statistic 74.64287 Prob(F-statistic) 0.000000
Variables: REV_T – real excise-tax revenue (thousand hryvnia) EXCISE – real excise rate per 1000 cigarettes in Ukraine RUS - real excise rate per 1000 cigarettes in Russia US – exchange rate of the hryvnia with respect to the US dollar DY – real consumption expenditures in Ukraine

38
APPENDIX C. ESTIMATION OUTPUT: PRICE EQUATION
Dependent Variable: PRICE Method: Least Squares Sample(adjusted): 1997:02 2000:12 Included observations: 47 after adjusting endpoints Convergence achieved after 17 iterations
Variable Coefficient Std. Error t-Statistic Prob.
C 0.148651 0.023701 6.271966 0.0000 EXCISE/50 1.537088 0.158430 9.702028 0.0000 US 0.037705 0.005650 6.673427 0.0000 AR(1) 0.829983 0.092921 8.932093 0.0000
R-squared 0.988239 Mean dependent var 0.395679 Adjusted R-squared 0.987419 S.D. dependent var 0.092641 S.E. of regression 0.010391 Akaike info criterion -6.214433 Sum squared resid 0.004643 Schwarz criterion -6.056974 Durbin-Watson stat 2.090674 F-statistic 1204.397 Prob(F-statistic) 0.000000
Inverted AR Roots .83
Variables: PRICE – weighted average price of one pack of cigarettes in Ukraine EXCISE/50 – real excise rate per one pack of cigarettes in Ukraine US – exchange rate of the hryvnia with respect to the US dollar

39
APPENDIX D. DATA DESCRIPTION AND SOURCES
DOM_SALES - domestic sales of legal cigarettes in Ukraine (million sticks). This was
calculated as domestic production + imports – exports. Data on production and exports was obtained from the Ukrtutun Association (Business association of Ukrainian tobacco producers). Data on imports was obtained from the State customs service of Ukraine and State statistics committee.
DY - real consumption expenditures of households (million hryvnia). This was
calculated as nominal consumption expenditures/CPI. Data on nominal consumption expenditures was obtained from the State statistics committee. CPI is estimated by ICPS.
EXCISE - real excise rate for cigarettes in Ukraine (hryvnia per thousand sticks). This
was calculated in the following way: for 1997-1999 – excise rate in EUROs * hryvnia/EURO exchange rate / CPI; for 2000 – excise rate in hryvnias / CPI. Excise rates were taken from the law of Ukraine “On excises” and subsequent amendments to the law. Hryvnia/EURO exchange rate was obtained from the NBU official Internet site.
PRICE - real weighted average price of cigarettes (hryvnias per pack). Nominal prices
for different types of cigarettes were obtained from the State Statistics Committee of Ukraine. Average nominal prices were calculated as average prices where market shares of different types of cigarettes were used as weights. Finally, dividing average nominal prices by CPI yields real average prices.
REV_T - real excise tax revenues (thousand hryvnias). This was calculated as (domestic
production + imports) * EXCISE (as defined above).
RUS - real excise rate for cigarettes in Russia (hryvnia per thousand sticks). This was
calculated as average excise rate in Russia * hryvnia/ruble exchange rate / CPI in Ukraine. Since in Russia, different excise rates are used for different types of cigarettes, their average was calculated. Data on Russian excise rates was taken from the law of Russian Federation “On excises” and subsequent

40
amendments to the law. Hryvnia/ruble exchange rate was obtained from the NBU official Internet site.
US - exchange rate of the hryvnia with respect to the US dollar. The exchange rate
was obtained from the NBU official Internet site (www.bank.gov.ua. Last accessed 15.04.2001).

41
APPENDIX E. ALTERNATIVE ESTIMATES OF THE DEMAND FUNCTION35
1) Dependent Variable: LOG(DOM_SALES) Method: Least Squares Sample(adjusted): 1997:05 2000:12 Included observations: 44 after adjusting endpoints
Variable Coefficient Std. Error t-Statistic Prob.
C 2.053937 1.735219 1.183676 0.2445 LOG(EXCISE(-1))^2 -0.023353 0.192913 -0.121053 0.9043 LOG(EXCISE(-1)) -0.308830 0.581933 -0.530696 0.5990 LOG(DOM_SALES(-2)) 0.177192 0.098853 1.792472 0.0817 LOG(US(-1)) 3.085609 1.109896 2.780090 0.0087 LOG(US(-1))^2 -1.287463 0.438581 -2.935517 0.0058 LOG(DY) 0.936207 0.183328 5.106731 0.0000 LOG(DY(-1)) -0.422043 0.201282 -2.096770 0.0433 LOG(EXCISE(-1)/RUS(-4)) -0.120032 0.067681 -1.773488 0.0848
R-squared 0.739436 Mean dependent var 8.468519 Adjusted R-squared 0.679878 S.D. dependent var 0.174947 S.E. of regression 0.098984 Akaike info criterion -1.607467 Sum squared resid 0.342924 Schwarz criterion -1.242519 Durbin-Watson stat 2.208940 F-statistic 12.41548 Prob(F-statistic) 0.000000 35 Based on these estimates, the best model specification was chosen. Also note that the coefficients of the
major variables do not change much when the model specification is changed.

42
2) Dependent Variable: LOG(DOM_SALES) Method: Least Squares Sample(adjusted): 1997:05 2000:12 Included observations: 44 after adjusting endpoints
Variable Coefficient Std. Error t-Statistic Prob.
C -39.79742 14.45961 -2.752317 0.0092 LOG(EXCISE(-1)) -0.496616 0.175554 -2.828856 0.0076 LOG(RUS(-4)) 0.121752 0.065262 1.865599 0.0703 LOG(DOM_SALES(-2)) 0.178263 0.097099 1.835882 0.0746 LOG(USD(-1)) 15.08265 4.947950 3.048263 0.0043 LOG(USD(-1))^2 -1.298763 0.422626 -3.073080 0.0040 LOG(DY) 0.937096 0.180657 5.187166 0.0000 LOG(DY(-1)) -0.429698 0.188458 -2.280066 0.0286
R-squared 0.739327 Mean dependent var 8.468519 Adjusted R-squared 0.688640 S.D. dependent var 0.174947 S.E. of regression 0.097620 Akaike info criterion -1.652503 Sum squared resid 0.343068 Schwarz criterion -1.328105 Durbin-Watson stat 2.204812 F-statistic 14.58626 Prob(F-statistic) 0.000000

43
3) Dependent Variable: LOG(DOM_SALES) Method: Least Squares Sample(adjusted): 1997:05 2000:12 Included observations: 44 after adjusting endpoints
Variable Coefficient Std. Error t-Statistic Prob.
C 1.879400 1.686682 1.114258 0.2726 LOG(EXCISE(-1))^2 -0.119322 0.066510 -1.794036 0.0812 LOG(DOM_SALES(-2)) 0.170457 0.097052 1.756345 0.0875 LOG(US(-1)) 2.776359 0.935143 2.968913 0.0053 LOG(US(-1))^2 -1.175321 0.380465 -3.089166 0.0039 LOG(DY) 0.932434 0.181353 5.141533 0.0000 LOG(DY(-1)) -0.392495 0.191489 -2.049700 0.0477 LOG(EXCISE(-1)/RUS(-4)) -0.119241 0.066987 -1.780078 0.0835
R-squared 0.737339 Mean dependent var 8.468519 Adjusted R-squared 0.686266 S.D. dependent var 0.174947 S.E. of regression 0.097991 Akaike info criterion -1.644907 Sum squared resid 0.345684 Schwarz criterion -1.320508 Durbin-Watson stat 2.200548 F-statistic 14.43696 Prob(F-statistic) 0.000000
44
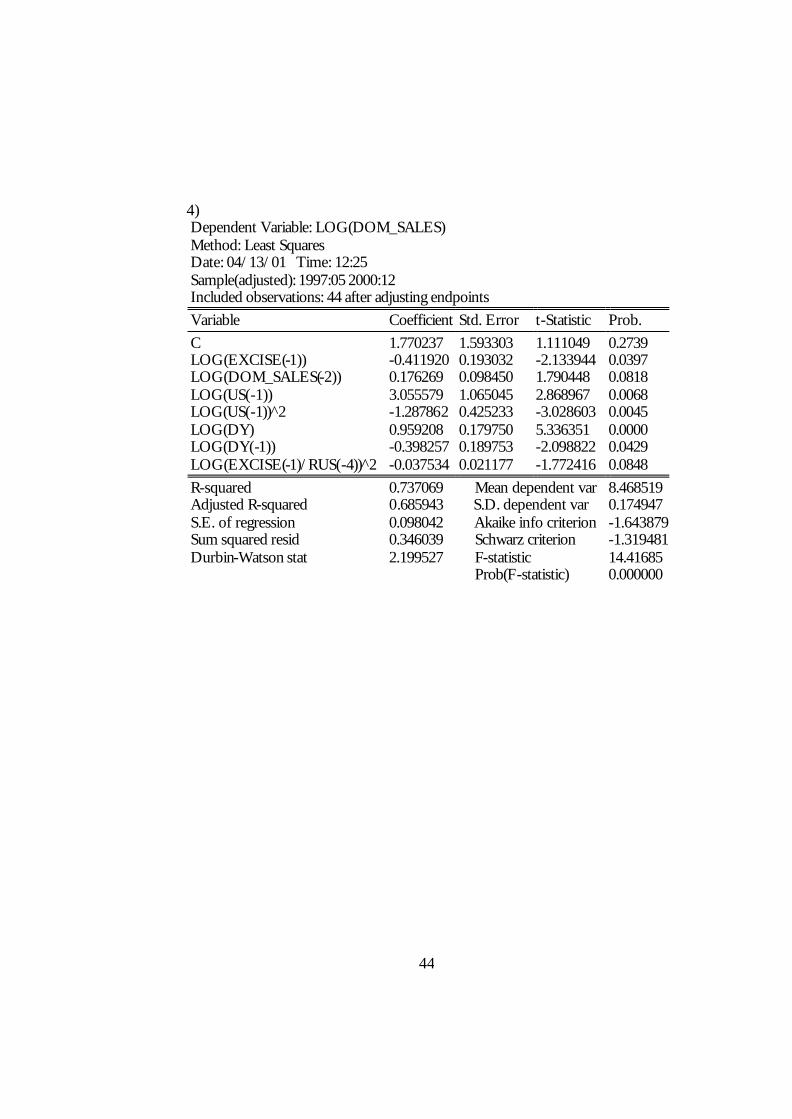
4) Dependent Variable: LOG(DOM_SALES) Method: Least Squares Date: 04/13/01 Time: 12:25 Sample(adjusted): 1997:05 2000:12 Included observations: 44 after adjusting endpoints
Variable Coefficient Std. Error t-Statistic Prob.
C 1.770237 1.593303 1.111049 0.2739 LOG(EXCISE(-1)) -0.411920 0.193032 -2.133944 0.0397 LOG(DOM_SALES(-2)) 0.176269 0.098450 1.790448 0.0818 LOG(US(-1)) 3.055579 1.065045 2.868967 0.0068 LOG(US(-1))^2 -1.287862 0.425233 -3.028603 0.0045 LOG(DY) 0.959208 0.179750 5.336351 0.0000 LOG(DY(-1)) -0.398257 0.189753 -2.098822 0.0429 LOG(EXCISE(-1)/RUS(-4))^2 -0.037534 0.021177 -1.772416 0.0848
R-squared 0.737069 Mean dependent var 8.468519 Adjusted R-squared 0.685943 S.D. dependent var 0.174947 S.E. of regression 0.098042 Akaike info criterion -1.643879 Sum squared resid 0.346039 Schwarz criterion -1.319481 Durbin-Watson stat 2.199527 F-statistic 14.41685 Prob(F-statistic) 0.000000
45
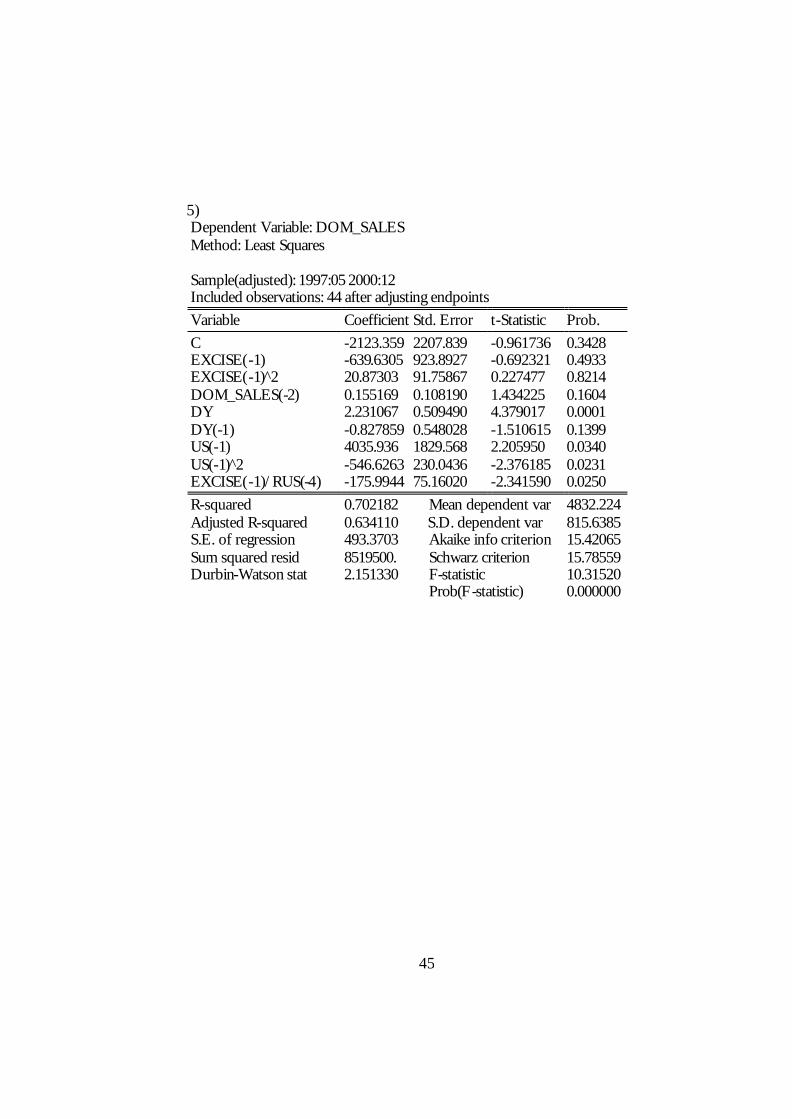
5) Dependent Variable: DOM_SALES Method: Least Squares Sample(adjusted): 1997:05 2000:12 Included observations: 44 after adjusting endpoints
Variable Coefficient Std. Error t-Statistic Prob.
C -2123.359 2207.839 -0.961736 0.3428 EXCISE(-1) -639.6305 923.8927 -0.692321 0.4933 EXCISE(-1)̂ 2 20.87303 91.75867 0.227477 0.8214 DOM_SALES(-2) 0.155169 0.108190 1.434225 0.1604 DY 2.231067 0.509490 4.379017 0.0001 DY(-1) -0.827859 0.548028 -1.510615 0.1399 US(-1) 4035.936 1829.568 2.205950 0.0340 US(-1)̂ 2 -546.6263 230.0436 -2.376185 0.0231 EXCISE(-1)/RUS(-4) -175.9944 75.16020 -2.341590 0.0250
R-squared 0.702182 Mean dependent var 4832.224 Adjusted R-squared 0.634110 S.D. dependent var 815.6385 S.E. of regression 493.3703 Akaike info criterion 15.42065 Sum squared resid 8519500. Schwarz criterion 15.78559 Durbin-Watson stat 2.151330 F-statistic 10.31520 Prob(F-statistic) 0.000000