Operationalising Predictive Insights - … · Operationalising Predictive Insights To Impact the...
33
16.06.2015 1 Operationalising Predictive Insights To Impact the Bottom Line Ali Rahim Advanced Analytics Product Manager 1. Predictive Analytics 2 Why RStat Agenda Agenda 2. Why RStat 3. Step through the Predictive process 4. RStat Roadmap 5. Operationalise RStat Results 2
Transcript of Operationalising Predictive Insights - … · Operationalising Predictive Insights To Impact the...

16.06.2015
1
Operationalising Predictive InsightsTo Impact the Bottom Line
Ali RahimAdvanced Analytics Product Manager
1. Predictive Analytics
2 Why RStat
AgendaAgenda
2. Why RStat
3. Step through the Predictive process
4. RStat Roadmap
5. Operationalise RStat Results
2

16.06.2015
2
Predictive Analytics Overview
3
Predictive Analytics (PA) helps one to…
Predictive Analytics IS a key business process…
WHAT IS PREDICTIVE ANALYTICS?
one to… Discover/understand what’s going on Predict what’s going to happen Improve business processes Create a competitive edge!
business process… “Learning from experience” User‐centric, interactive An information‐based approach to decision making
Using Historical and current transactional data to identify risks and opportunities about future, or otherwise unknown, events

16.06.2015
3
Predictive Analytics vs. Business Intelligence
B i I lli P di i A l iBusiness Intelligence User driven Rear view Manual methods All attributes are equally important
Predictive Analytics Data driven Forward view Automated methods A few attributes are the keys Actionable info
Copyright 2007, Information
p Reportable info Experience‐driven
Data‐driven
PREDICTIVE ANALYTICS SUMMARY
Sample Applications in Organizations to Operationalise Predictive:
Reduce marketing/operational costs
Increase sales
I ll/ ll i Improve cross‐sell/up‐sell campaigns
Increase retention/loyalty
Detect and prevent fraud
Identify credit risks
Acquire new customers
6
ROI is realized when:
Results are widely‐distributed to end users where decisions are made
Decision‐making is improved with forward‐looking views of likely behavior

16.06.2015
4
1. It’s new. It actually has bee around since 1930 when Fisher and Durand
created the first credit score model.
Misconceptions of Predictive Analytics
2. Produces perfect prediction. That depends on the data, and models are
estimates.
3. Push‐button solutions. Tools cannot provide everything; knowledga ble users
should select the technique based on business context.
4. Build it and forget it. All models depend on the data that is provided. Data also
has cutoff time periods; for this reason, models can get outdated. A refresh is
required but varies by customers, industry and business case.
7
Why RStat?
8

16.06.2015
5
WEBFOCUS ANALYTIC ENVIRONMENT
We provide an integrated set of components to address predictive analytics…
2 Processes – 3 ComponentsModel Train and Model Consumption Processes
WebFOCUS ‐ Data Access and Preparation (usually the bulk of an
WEBFOCUS ANALYTIC ENVIRONMENT
WebFOCUS Data Access and Preparation (usually the bulk of an Predictive Analytics implementation project)
Data Access Native access to 300 data sources – no requirement to move all data to the warehouse or to build a warehouse
Data PreparationData Preparation Merging, filtering, aggregating, deriving, transforming, sampling, improving data quality
Good predictive models require complete and relevant data
Copyright 2007, Information
16.06.2015
6
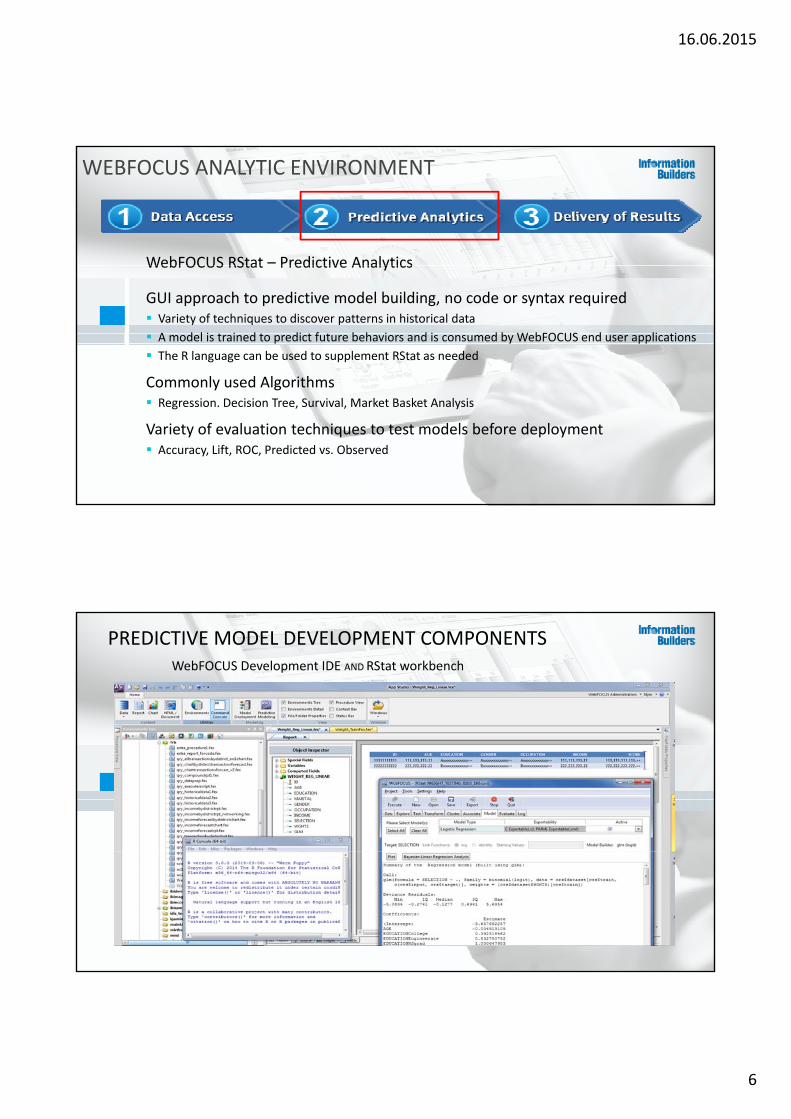
WebFOCUS RStat – Predictive Analytics
WEBFOCUS ANALYTIC ENVIRONMENT
WebFOCUS RStat Predictive Analytics
GUI approach to predictive model building, no code or syntax required Variety of techniques to discover patterns in historical data
A model is trained to predict future behaviors and is consumed by WebFOCUS end user applications
The R language can be used to supplement RStat as needed
Commonly used AlgorithmsCommonly used Algorithms Regression. Decision Tree, Survival, Market Basket Analysis
Variety of evaluation techniques to test models before deployment Accuracy, Lift, ROC, Predicted vs. Observed
PREDICTIVE MODEL DEVELOPMENT COMPONENTSWebFOCUS Development IDE AND RStat workbench

16.06.2015
7
Integrated Platform Integrated with WebFOCUS BI Platform Allows for easy data access and data preparation Deploys results to non‐technical, business end users automatically
WebFOCUS RStat Value Proposition
Deploys results to non technical, business end users automatically Single server for BI and PA, eliminating additional costs
Low Total Cost of Ownership Based on open‐source R statistical language R language is not required for deployment User‐friendly interface ‐ Advanced analytics without coding or syntax Good exploratory and graphing capabilities ‐most commonly used
predictive and exploratory modelingpredictive and exploratory modeling Extends very broadly with R package
6500 packaged extensions provides instant access to more models Quick Time to Market Openness, low TCO and usability combine for a quick time to market and
high value for our customers
Train and Test partitioning of the data Sample seed for replication or revision of partitionsRadio buttons for defining variables roles Input, target, ID, ignore
COMPREHENSIVE ANALYTIC FUNCTIONALITY DATA PREPARATION ANDEXPLORATORY CAPABILITIES
Descriptive statistics: Summary statistics, distributions, correlationsVariable reduction via principal components analysisVisualizations of Box, bar, dot plots, histograms, benford and mosaic chartsHypothesis Testing: T‐Tests, F‐testsData Transformations Normalizations, missing value imputation, binning, cleanup

16.06.2015
8
Supervised modeling techniques for classification and prediction Decision Trees BoostingR d F t
Unsupervised modeling techniques for exploratory work
Clustering – K‐means and Hierarchical clustering for grouping records Association Rules apriori algorithm
COMPREHENSIVE ANALYTIC FUNCTIONALITYMODEL BUILDING AND MODEL TESTING CAPABILITIES
Random Forests Regression – Linear, GLM, Logistic, Poisson and Multinomial Support Vector Machines Feed Forward Neural Network Survival Analysis – Cox PH and Parametric
Association Rules ‐ apriori algorithm for finding co‐occurrences of items
Model evaluation techniques
Error matrix, risk chart, lift chart, ROC Curve, precision and sensitivity charts, predicted vs. observed charts
WebFOCUS ‐ Delivering results to end users for decision making
WEBFOCUS ANALYTIC ENVIRONMENT
Information Delivery Dashboards, core reporting, charts, scorecards, maps, queries, active reports, OLAP,
mobile, feeding a downstream system…
Consumption of the predictive results as a scoring function (derived fields) WebFOCUS seamlessly consumes
d d li h di d l iand delivers the predicted results into
the end user application in
any form needed
End User‐friendly output

16.06.2015
9
Step through the Predictive process
17
Business Dilemma – “Throwing the Net out there”
• Contact (marketing) 300k prospects• Customer Acquisition Cost: $100 per• Average Profit per response is $250• Response: a little over 29% of prospects receiving catalog
Under these conditions, a catalog campaign will not be profitable ‐i h li l h ll l
# of Prospects 300,000.00
Cost per Prospect 100.00$
Total Cost for Acquisition 30,000,000.00$ tate
with a little math, actually lose $8.25million. Sales $ per response 250.00$
% Responsed 29%
Total Responses 87,000.00
Total Sales 21,750,000.00$ Curr
entS

16.06.2015
10
BULLSEYE… Target Marketing the Prospects
• Target 20% of most likely responders based on model output.• Likely to make $9million profit
li d i $1 2 illi• A realized gain $17.25 million
# of Targeted Prospects 60,000.00
Cost per Prospect 100.00$
Total Cost for Acquisition 6,000,000.00$
Sales $ per response 250.00$
% R d 100%
edicted
del
% Responsed 100%
Total Responses 60,000.00
Total Sales 15,000,000.00$
Total Profit (9,000,000.00)$
17,250,000.00$ Bottom Line Impact
WithPr
Mo
RStat ROADMAP
20

16.06.2015
11
Built on R 3.0.3 ‐ 32bit and 64bit RRandom Forest C file export – return class or regression
values
Q4 2014 ‐ RSTAT 1.6 RELEASE OCT. 2014
Common use is Variable Selection, Classification, or Regression
Ada Boost C file export – return class or probability for binary trees
MODEL Tab: Model selection paradigm changed to handle multiple models simultaneously
Cross Tab ‐ a contingency table for cross‐classifying
factorsEnhanced Correlation graphics with advanced graphics
optionChi Square GUI: Independence Test and Goodness of fit
test ‐ Deals with nominal level data
Density Plot: run a graphical representation for Kurtosis & Skewness
Association Rules Plot: plot a graph representing the rules
EWKM: Entropy Weighted KMeans functionality included
Regression Plots: outliers labeled, Quantile plot of residuals,
Res vs Leverage shows undue influence on Reg.
NEW ADDITIONS IN RSTAT 1.6
22
16.06.2015
12
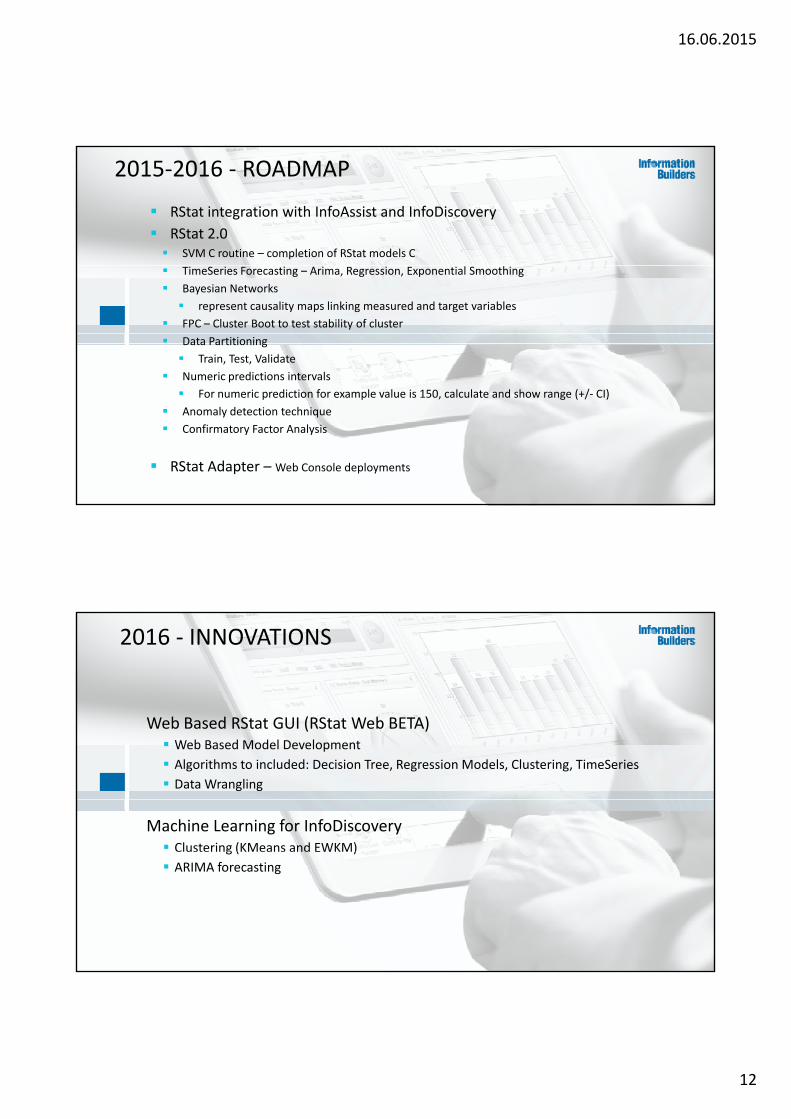
RStat integration with InfoAssist and InfoDiscovery
RStat 2.0 SVM C routine – completion of RStat models C
2015‐2016 ‐ ROADMAP
TimeSeries Forecasting – Arima, Regression, Exponential Smoothing
Bayesian Networks
represent causality maps linking measured and target variables
FPC – Cluster Boot to test stability of cluster
Data Partitioning
Train, Test, Validate
Numeric predictions intervals
For numeric prediction for example value is 150, calculate and show range (+/‐ CI)
Anomaly detection technique
Confirmatory Factor Analysis
RStat Adapter – Web Console deployments
Web Based RStat GUI (RStat Web BETA)
2016 ‐ INNOVATIONS
Web Based Model Development
Algorithms to included: Decision Tree, Regression Models, Clustering, TimeSeries
Data Wrangling
Machine Learning for InfoDiscovery Clustering (KMeans and EWKM)C uste g ( ea s a d )
ARIMA forecasting

16.06.2015
13
Operationalise RStat Results
Applications of Predictive Analytics
Displaying Predictive OutputDisplaying Predictive Output
25
Horizontal Applications of Predictive Analytics
Marketing / CRM Offer and promotion targeting
Fraud / Risk Fraud detection and prevention Credit riskOffer and promotion targeting
Customer segmentation Improve response rates Cross and up‐selling Customer retention Reduce campaign costs Predict customer life time value
Process improvement Quality improvement
Collections and recovery Patient outcomes Claims analysis
Customer acquisition Quality improvement Warranty analysis Time to failure Resource allocation Demand forecasting
16.06.2015
14
Sales, Marketing and CRM
It’s very expensive to acquire new customers, there must be a better way
Business Initiatives That Predictive Analytics Can Address
If I understood who my best customers are, I could target more like that I wish I knew which of my customers were interested in offers, instead of offering all products to all customers Response rates to our campaigns are low and declining, how can we better target our customers? I wish I knew which customers were most likely to churn so I could retain ythem How can I provide better service to my customers by understanding their needs and guide my interactions?
27
Fraud How can I predict fraudulent activity and at the same time avoid investigating 100% of my data?
Business Initiatives That Predictive Analytics Can Address
Risk I want to approve and price my prospects for insurance coverage appropriately I want to approve my prospects for loans or credit to maximize profit and minimize my risk
Process Improvement Process Improvement How can I use my process data to uncover the root cause of defects? How can I better predict the time until some event (failure, attrition, churn) occurs?
28

16.06.2015
15
Financial Services Applications of Predictive Analytics Growth
Acquisition targeting Organic growth
Cross selling, up selling, retention (churn)P i i Promotion targetingWho to target, which offer, which channel, what time
Customer segmentation Groupings of like customers
Predicting customer lifetime value Profitability
Inter‐department analysis of promoting products to low‐risk customers
C ll ti d Collections and recoveryManaging risk
Credit approvals Predicting credit risk Anti‐money laundering Fraud detection / prevention
29
Insurance Applications of PA
Growth Acquisition targeting Organic growth
Cross selling, up selling, retention (churn)
Customer segmentation Groupings of like customers
Predicting customer lifetime value Price optimization Profitability
Managing risk Pricing / underwriting of policies Predicting claim risk and severity Fraudulent claim detection /
Inter‐department analysis of promoting products to low‐risk customers
prevention Claims processing
Claim to agent routing Fast tracking claims Subrogation modeling Early total loss
30

16.06.2015
16
Healthcare Applications of Predictive Analytics
Patient care Predict which patients will develop chronic conditions Predict which patients will respond to which treatmentsP di ll i l b d Predict overall survival based on treatments Predict numerous lengths of time
In the hospital In intensive care In recovery
Operations Predict likely re admissions Predict likely re‐admissions Fraud detection and prevention Predict patient volumes Optimize the Master Schedule
31
Retail Applications of Predictive Analytics
Growth Acquisition targeting Organic growth
Cross selling up selling loyalty programsCross selling, up selling, loyalty programs Customer segmentation
Groupings of like customers Promotion targeting
Who to target, which offer, which channel, what time Price Optimization Product demand predictions (supply chain)p ( pp y ) Fraud (Shrinkage) Prevention If customers are tracked (loyalty card), then this is done at a customer level If transactions are anonymous, then the results are deployed at an aggregated level (store, territory)
Item placement on shelves, weekly flyer arrangement, displays
32

16.06.2015
17
Higher Education Applications of Predictive Analytics
Enrollment goalsWho to admitWho will enroll
Student segmentation Groupings of like students
Student performanceWho is at risk of dropping out
Graduation ratesAli i h d d Align programs with students needs
Funding programs Targeting alumni for donations
33
Manufacturing Applications of PA
Quality improvements Predicting the time to failure Root cause analysis of defects
Warranty analysis Determine the length of a warranty to place on a part or system?
Scrap or repair disposition for parts Predicting product demand Inventory management Predicting machine maintenance
34

16.06.2015
18
WebFOCUS RStat Predictive Churn Dashboard
WebFOCUS Dashboard Displaying Predictive OutputActive report and graphical output of predicted patient volumes for Healthcare
36

16.06.2015
19
WebFOCUS Dashboard Displaying Predictive OutputGraphical output of predicted defaults and non defaults of loans
37
WebFOCUS Dashboard Displaying Predictive OutputActive report of product affinities and recommendations for cross selling
38

16.06.2015
20
WebFOCUS Dashboard Displaying Predictive OutputActive report and graphical output of predicted students at risk
39
WebFOCUS Dashboard Displaying Predictive OutputActive report and graphical output of predicted failures of manufactured parts
40

16.06.2015
21
Predictive Crime Analytics
WebFOCUS Dashboard Displaying Predictive OutputGIS, active report and graphical output of predicted responses to a marketing campaign

16.06.2015
22
3i Health SolutionsPredictive Readmissions Performance
• Predict and Score Patients Most Likely to Readmit based on Previous Clinical History based on Demographics, Consumer Habits and Clinical Factors
Predictive ApplicationDisplays value, churn likelihood and offers for inbound and outbound targeting
44

16.06.2015
23
OUTPUT FORMAT AND ANALYSIS
Extending WebFOCUS Predictive Platform
Leveraging R ‐ R‐Script + WF Dialog Manager

16.06.2015
24
SCIENTIFIC QUERY – DATA PREP, DATA WRANGLE, STATISTICAL SCRIPTS,
VISUALIZATION AND OUTPUT DISTRIBUTION
SCIENTIFIC QUERY – DATA PREP, DATA WRANGLE, STATISTICAL SCRIPTS,
VISUALIZATION AND OUTPUT DISTRIBUTION

16.06.2015
25
WRAP‐UP
Thank you for your time today!
For additional information or if you have any questions, please contact
your local Information Builders Account Executive
RStat Screenshots – Churn Demo
50

16.06.2015
26
Historical Report of Telco CustomersDemographic, Account, Sentiment and Churn Data
Launch RStatAssign the attribute roles in the data tab

16.06.2015
27
Explore TabSummary and descriptive statistics of the data set
Explore TabHistogram and bar chart for visualizations

16.06.2015
28
Explore TabCorrelation analysis with visualization
Test TabT‐test of the average sentiment score for churners vs. non‐churners

16.06.2015
29
Transform TabRevise the data via rescale, impute, recode and cleanup
Cluster TabKMeans and Hierarchical algorithms for clustering

16.06.2015
30
Associate TabDiscovers affinity rules for co‐occurrence of items
Model TabDecision Tree output to predict churn, sentiment data excluded

16.06.2015
31
Model TabDecision Tree output to predict churn, sentiment data included
Evaluate TabDisplays model accuracy; model with sentiment data performs much better
Model error rate = 44%without sentiment data
Model error rate = 7%with sentiment data

16.06.2015
32
Model DeploymentMap the attributes to the model parameters required
Model DeploymentFinished computed model scoring attribute – Churn Prediction

16.06.2015
33
Deployed Scoring Model for Customer ChurnReport displays customers predicted to churn and a likelihood