Operational forest management planning methods: proceedings
122
PACIFIC SOUTHWEST Forest and Range Experiment Station FOREST SERVICE U.S.DEPARTMEN'I' OF AGRICULTURE GENERAL TECHNICAL REPORT PSW- 32 OPERATIONAL FOREST MANAGEMENT PLANNING METHODS: proceedings, meeting of Steering Systems Project Group, International Union of Forestry Research Organizations Bucharest, Romania June 18-24, 1978
Transcript of Operational forest management planning methods: proceedings
PACIFIC SOUTHWEST Forest and Range Experiment Station FOREST SERVICE USDEPARTMENI OF AGRICULTURE
GENERAL TECHNICAL REPORT PSW- 32
OPERATIONAL FOREST MANAGEMENT PLANNING METHODS
proceedings meeting of Steering Systems Project Group International Union of Forestry Research Organizations
Bucharest Romania June 18-24 1978
OPERATIONAL FOREST MANAGEMENT PLANNING METHODS
proceedings meeting of Steering Systems Project Group InternationalUnion of Forestry Research Organizations
Bucharest Romania June 18-24 1978
Daniel Navon Compiler
CONTENTS Page
A Method of Forest Management for the Planned Introductionof Intensive Husbandry in Virgin Forest Stands 1
B Dolezal Theoretical and Computational Foundations of ManagementClass Simulation 7
Denie Gerold A Computerized Tree Growth Projection System for Forest Resource Evaluation in the Lake States 13
Allen L Lundgren and Burton L Essex Techniques of Australian Forest Planning 24
Australian Forestry Council Operations Research Techniques in the Management of Large-Scale Reforestation Programs 36
Joseph Buongiorno and DE Teeguarden Wood Transportation Systems-A Spin-Off of a ComputerizedInformation and Mapping Technique 45
William W Phillips and Thomas J Corcoran Optimal Control of Raw Timber Production Processes 54
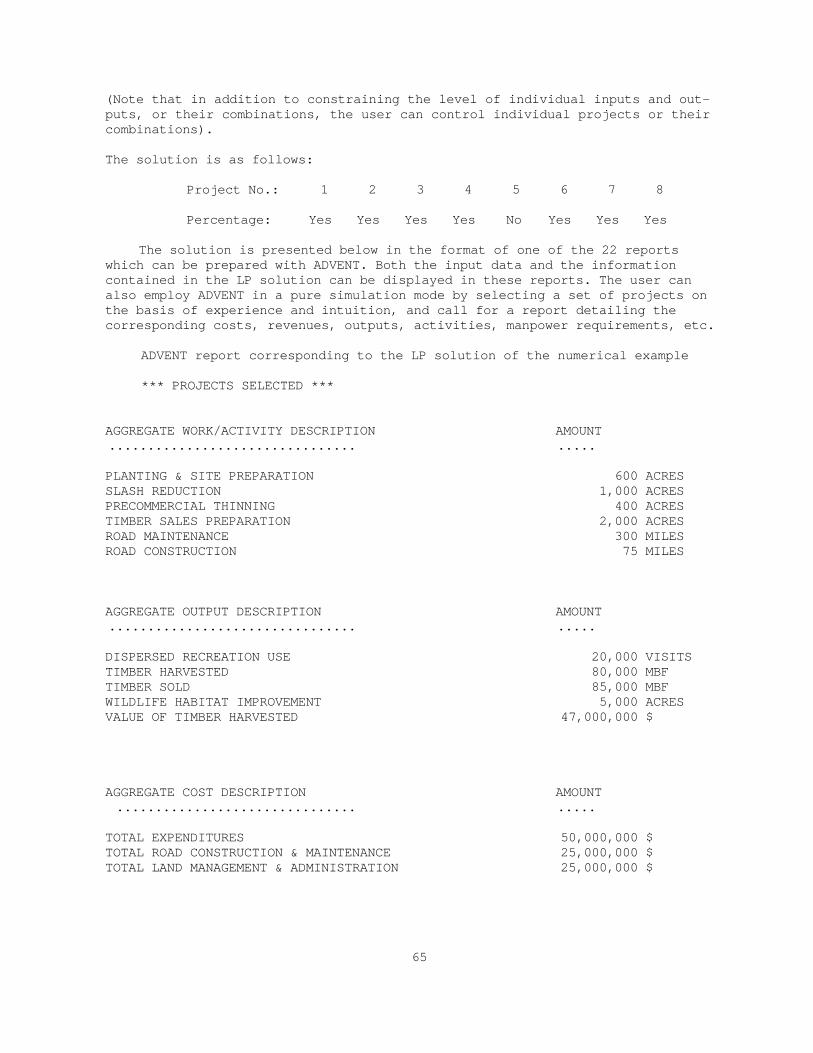
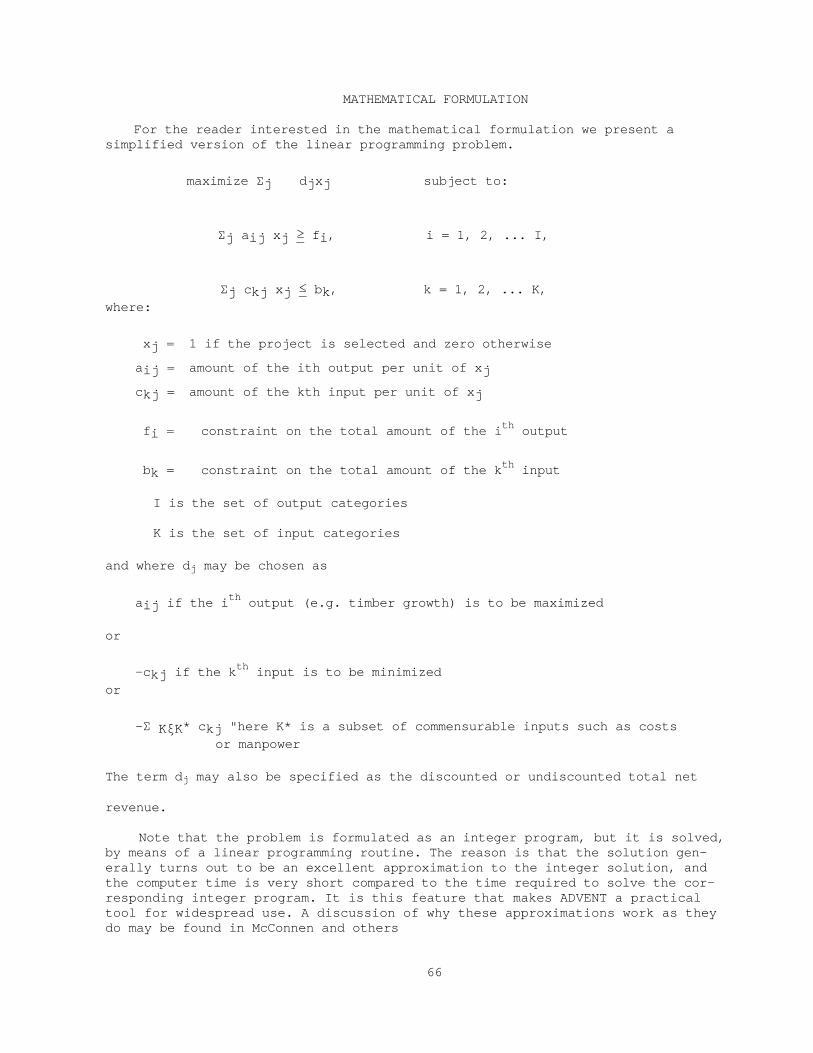
Ivan Kolenka Large-Scale Budget Applications of Mathematical Programming in the Forest Service 60
Malcolm Kirby Forest Management Planning for Timber Production A Sequential Approach 68
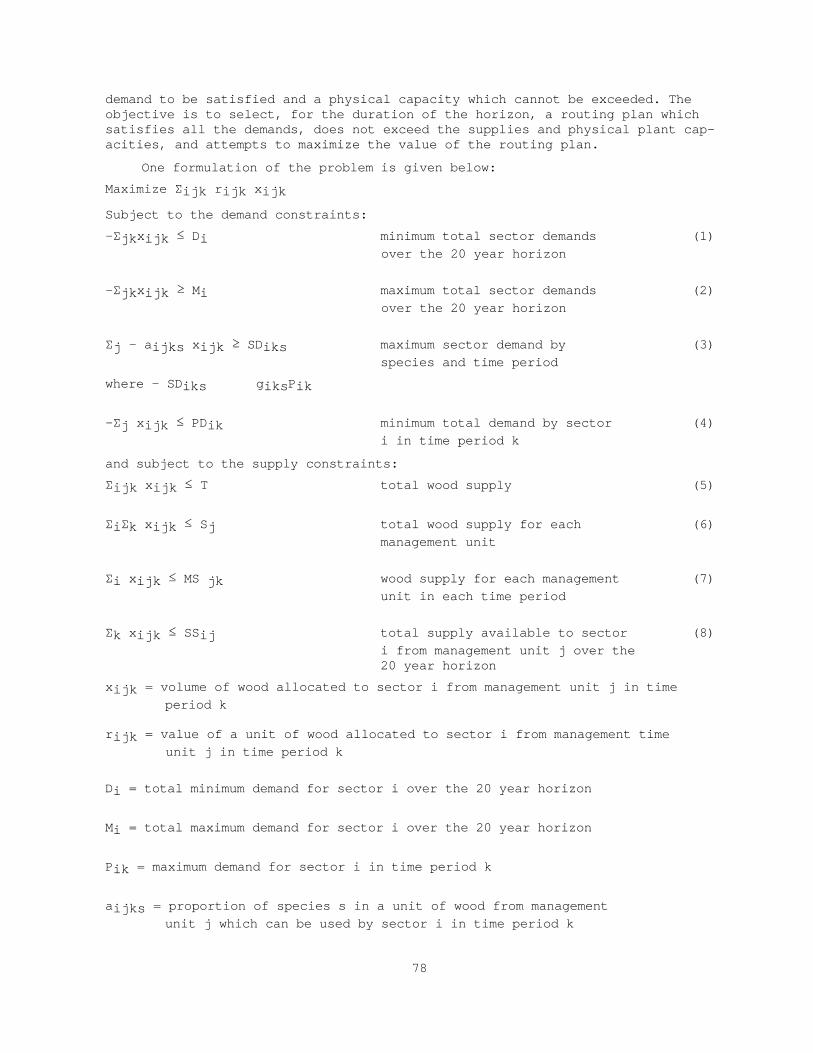
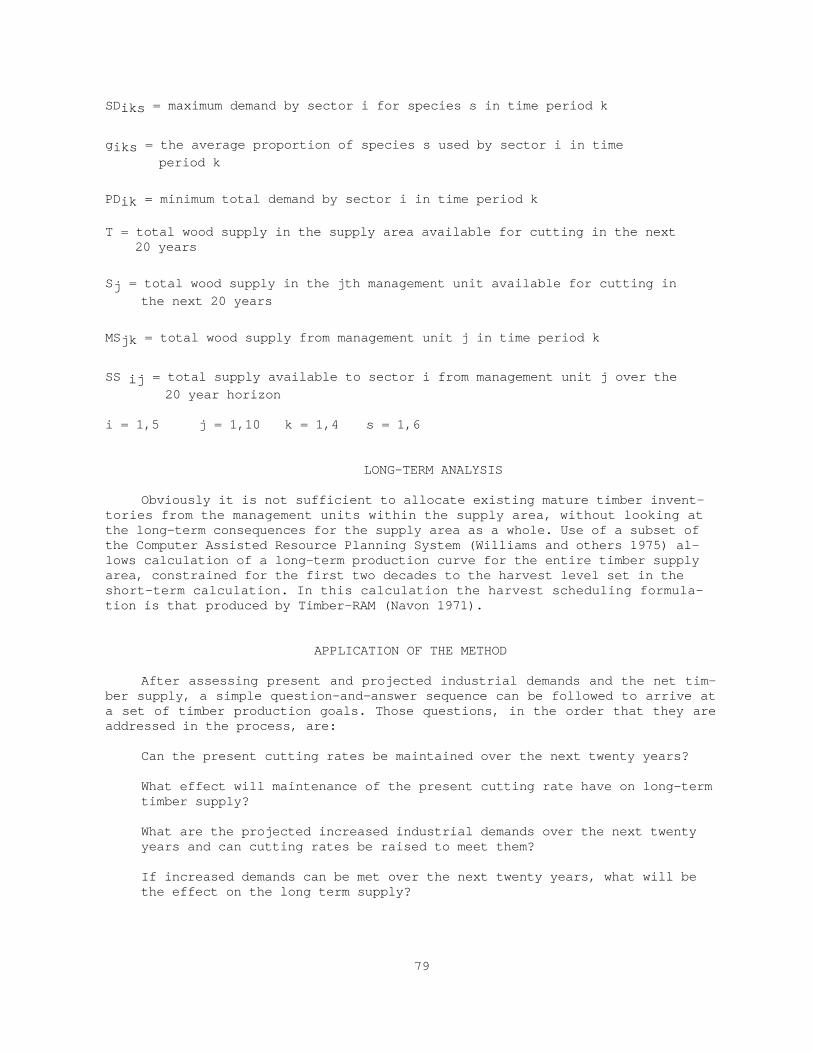
Krishna P Rustagi A Two-Phase Method for Timber Supply Analysis 76
Stephen Smith Timber Management Planning with Timber RAM and Goal Programming 82
Richard C Field Analytical Aids in Land Management Planning 91
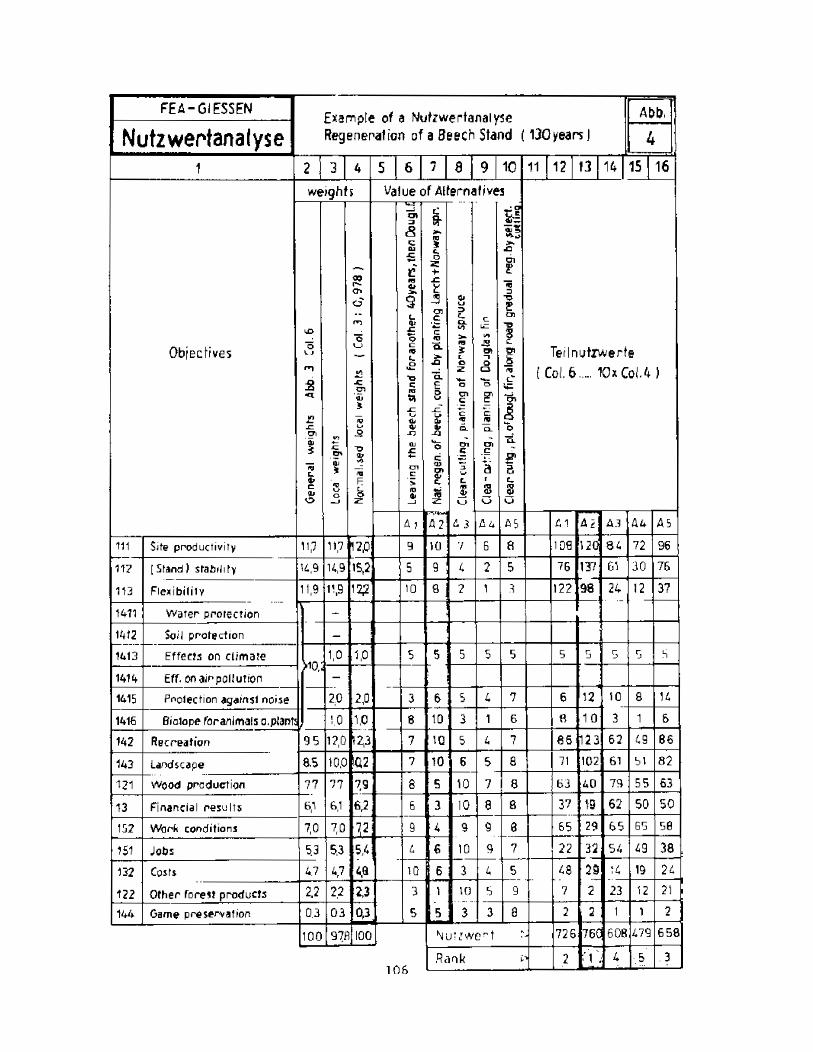
David R Betters Nutzwertanalyse 100
A Henne A Methodology for Decisionmaking in Project Evaluation in Land Management Planning 109
A Weintraub Pacific Southwest Forest and Range Experiment Station
PO Box 245 Berkeley California 94701
1978
Navon Daniel Compiler 1978 Operational forest management planning methods proceedings
meeting of steering systems project group International Union of For-estry Research Organizations Bucharest Romania June 18-24 1978 Gen Tech Rep PSW-32 117p illus Pacific Southwest Forest and Range Exp Stn Forest Serv US Dep Agric Berkeley Calif
These 14 papers were submitted to a conference of Project Group P407 Division IV International Union of Forestry Research Organizations Topics discussed included the uses of simulations analytical techniques and mathematical pro-gramming techniques in land management planning reforestation programs inten-sive forestry timber management and production tree growth wood transporta-tion and budgeting
Oxford 6[--0155 + 3]Retrieval Terms operations research analytical methods simulation land-use planning reforestation intensive management timber management resource analysis
Compiler _________________________________________________________________ DANIEL NAVON is an economist in the Stations land management and landscape planning methodology research unit with headquarters in Berkeley California
The Authors______________________________________________________________ AUSTRALIAN FORESTRY COUNCIL Banks Street Yarralumla ACT 2600 Aus-tralia DAVID R BETTERS Department of Forest and Wood Sciences Colorado State University Fort Collins Colorado 80521 USA JOSEPH BUONGIORNO Forestry Department University of Wisconsin Madison Wisconsin 53705 USA THOMAS J CORCORAN University of Maine Orono Maine 04473 USA B DOLEZAL School of Forestry Brno Agricultural University Brno Czechoslovakia BURTON L ESSEX North Central Forest Experiment Station 1992 Folwell Ave St Paul Minnesota 55108 USA RICHARD C FIELD Southeastern Forest Experiment Station Carlton Street Athens Georgia 30602 USA DENIE GEROLD Technische Universitat Dresden Sek-tion Forstwirschaft Tharandt DDR 8223 Tharandt Pinnerstr 8 A HENNE Hess Forsteinrichtungsanstaft Gressen Deutschland MALCOLM KIRBY Management Sci-ences Staff Forest Service PO Box 245 Berkeley California 94701 USA IVAN KOLENKA University College of Forestry and Wood Technology Zvolen Czechos-lovakia ALLEN L LUNDGREN North Central Forest Experiment Station 1992 Folwell Ave St Paul Minnesota 55108 USA WILLIAM W PHILLIPS University of Maine Orono Maine 04473 USA KRISHNA P RUSTAGI College of Forest Resources University of Washington Seattle Washington 98105 USA STEPHEN SMITH British Columbia Forest Service Victoria British Columbia DENNIS E TEEGUARDEN College of Natural Resources University of California Berkeley California 94720 USA A WEINTRAUB University of California Berkeley California 94720 USA and Departamento de Industrias University of Chile Cassilia 2777 Santiago Chile
PREFACE
At the XVIth World Congress held in Oslo Nor-way in 1976 the International Union of Forestry Re-search Organizations (IUFRO) reaffirmed its com-mitment to study forestry problems in the developing countries and to seek solutions This collection of papers is the contribution to this task made by the Steering Systems Project Group Division IV This project was established at the Congress at the sugges-tion of Hans Speidel Richard Plochman and Robert Magin to promote communication and collaboration among IUFRO scientists doing research in the devel-opment and application of forest management planning methods The Project Group is conducting two major activities First an International Directory of Comput-erized Planning and Research Tools is being estab-lished under the sponsorship of the Forest Service US Department of Agriculture Second international meetings are held to inform members of the state of the art in forest management planning and to promote the collaboration of all forestry researchers in addressing the challenges posed by forest management in develop-ing nations
The 14 papers collected here report on planning methods which have been successfully used in devel-oped countries and which―in the judgment of the members of the Project Group―may be useful in at-tacking problems in less developed nations Many of our members are deeply aware of their limited grasp of these problems Our sincere hope is the these papers will open a dialogue which will lead to better under-standing of these problems and to an effective collab-oration among researchers from all nations in an attack on these problems
The papers presented here span the spectrum of approaches used in forest management planning in recent decades In the first paper Bohumil Dolezal presents the classical approach to planning intensive forest management and establishes the validity of these principles for dealing with contemporary problems of developing economies
The remaining papers deal with specific planning techniques all of which―except two―require the use of electronic computers to conduct simulations solve mathematical programs or invert input-output ma-trices The papers by Denie Gerold and Allen Lundgren demonstrate the usefulness efficiency modest cost and versatility of electronic computers in modeling the behavior of forest stands and in provid-ing detailed estimates of outputs and of resources
needed for the diverse conditions typically encountered in commercial forest lands
The paper contributed by members of the Australian Forestry Council reports on six stand-growth and yield-simulation models which rely on functions de-rived from graphic analysis nonlinear estimation and generalized least squares This paper also reports on two linear programming (LP) methods The first of these provides an analysis of long-term cutting strategy for intensively managed Pinus radiata plantations The second combines LP with the simulation of stand yields determination of thinnings and clear felling yield for an entire plantation
Two additional papers report on methods integrating simulation and optimization methods The model de-scribed by Joseph Buongiorno and Dennis Teeguarden uses simulation to estimate future growth and to help managers select promising management alternatives and linear programming to find an optimum combina-tion of reforestation projects William W Phillips and Thomas D Corcoran present an interactive model which uses simulation to explore alternative market transport possibilities and linear programming for identifying optimal overall strategies
The next five papers report on methods which rely on the use of LP and a recent extension of LP goal programming Ivan Kolenka presents a model for planning the logging transport and distribution of wood assortments in the context of a planned eco-nomy Malcolm Kirby presents a budgeting model for large private or public forest enterprises which also provides an analytical framework for evaluation of overall management programs The two-stage LP methods discussed in separate papers by Krishna Rus-tagi and Stephen Smith provide a practical strategy for dealing with one of the most vexing limitations of LP the assumption of the availability of reliable informa-tion about future events Richard C Fields describes a goal programming model which provides a systematic method for dealing with a limitation of LP which has proved particularly bothersome in forestry the impos-sibility of specifying an objective function which re-flects adequately the incommensurable outputs of for-est management
David Betters reports on a model which integrates a computerized procedure based on factor analysis with linear programming and input-output analysis The computerized procedure is used to develop among planners consumers and managers a consensus of
resource use preferences Linear programming then provides optimal combinations of forest management alternatives and an input-output model estimates the impact on local economic activity and employment levels
The last two papers discuss systematic procedures for evaluating well-defined forest management alterna-tives without paying tribute to computers August Henne presents an operational version of Zangemeis-ters Nutzwertanalyse which retains the essential fea-tures of the original scheme for ranking a set of com-plementary projects Andres Weintraub reports on a heuristic procedure for selecting a management pro-gram from among mutually exclusive alternatives
The preparation and publication of this collection of papers was made possible through the collaboration of too many persons to permit giving them individually the acknowledgement and thanks which are due them Goran von Malmborg co-chairman of the Steering Systems Project Group and all our members join me in
expressing special thanks to Professor Robert Magin for inviting us to meet with the Forest Management Planning and Managerial Economics Working Group and to Professor Adolf Priesol and Director George Bumbu for their warm hospitality We also extend our special thanks to the Food and Agriculture Organiza-tion of the United Nations for allowing Dr Arnoldo Contreras to share with us his clear understanding of forestry problems in developing countries and for help FAO is giving us in reaching our colleagues in those countries
The publication of this collection of papers was funded by the Research and National Forest System branches of the Forest Service US Department of Agriculture
Trade names and commercial enterprises or prod-ucts are mentioned in this publication solely for infor-mation No endorsement by the sponsoring organi-zations is implied
A Method of Forest Management for the Planned Introduction of Intensive Husbandry in Virgin
Forest Stands
B Dolezal
Abstract The method proposed is derived from longexperience of intensive management in forest stands ofCentral Europe and from our proposal for management invirgin Iranian forests of the Caspian Region The methodestablishes the need for systematic planning of standconversion to insure both sustained yield and the har-vesting of sufficient timber to sustain economic develop-ment The method also recognises the need to integratethe planning of silvicultural activities with capitalinvestments in roads and machinery
INTRODUCTION
The method described in this paper is based on the realization that forest planning must be consistent with the political and economic situation of a de-veloping country as well as with the given natural and economic conditionsfinancial position market conditions and the technological procedures in-volved in the process of production which are all traditionally taken intoconsideration in forest husbandry A method of this kind is expected also toreflect the latest scientific achievements in understanding of the forest asan entity Market conditions must be considered to insure a reasonable fin-ancial return from management It must also be recognized that the forest is a national resource of special value in a countrys watershed management andin the development of an environment beneficial to its population
The principles discussed below and incorporated in the method for intro-ducing an intensive system of management into virgin forest stands were obtain-ed partly from what has been gathered during the past 250 years of intensivemanagement in the forest stands of Central Europe and partly from the experi-ence gained while compiling our proposal for forest management in virgin Iran-ian forests of the Caspian Region The method is based on the principles that(1) the introduction of an intensive system of management into the virgin-likeforest must be planned and (2) once converted the commercial forest must beable to produce sustained yields adequate in quality volume and monetaryvalue and must supply the market with sufficient amounts of timber in thespecies and assortments needed for economic development
1
The method for introducing an intensive system of management as suggested here is based on the idea of short-term credits which are required to make the virgin stands accessible for management for purchasing needed machineryand if necessary even for constructing wood-processing plants The short-term credit needed to secure accessibility of virgin-like forests can be es-timated by assuming that the stand regeneration will progress through areas that are spatially linked so that the transport of wood from the part of the forest which has just been made accessible passes through those which have al-ready been made accessible The availability of short-term credit indeed ap-pears to be an important requirement for the introduction of intensive man-agement in the forests of developing countries
The suggested method is based on scientific knowledge of the forest It utilizes data on the geographical and ecological classification of forestswhich serves to stratify forest land This stratification is needed to delim-it forest land planning and control units for management to define the quan-tities to be estimated and to elaborate the instructions needed to manage the forest
METHOD
Economic Evaluation of Wood Production
Delimitation of the Forest Land Resource
It would not be reasonable to introduce intensive management into forests which within a known period of time are intended to serve some other type of land utilization (such as fields meadows grassland dwelling estates) It is therefore urgent to determine on the basis of consultation with competent institutions in the country which of the forest areas will be left as perma-nent stands regardless of population increases This task appears to be ur-gent especially in the territories which are characterized either by a highor by a very low forest cover percentage compared to the targets planned for the years to come
Survey and Analysis of Natural and Working Conditions in the Forests
The primary concerns should be the survey and analysis of soil climateand terrain all of which are decisive for the future productivity of the forest stands Survey and analysis should also be concerned with the present condition of the forest stands (existing species diameter health conditionforest inventory data potential production of assortments suitable for com-mercial and industrial uses and the like) The remaining items to be eval-uated are conditions for management especially the character of the topo-graphy potential accessibility of the stands and timber transport delimi-tation of gravitational areas etc conditions for location of timber yards and sawmills the level of protection needed against forest fire and destruct-tive wind
Maps produced using photogrammetry are part of the surveys mentioned above
2
Marketing
An investigation is carried out to determine the opportunities for tradingtimber to assess the demand for timber assortments by local population and in-dustries and to estimate the export requirements as well finally the poten-tial for the processing of the timber harvest by woodworking plants is assessed
Organization of the Forest Stands
Working Circle
These are the frames for harvest regulation 1he areas range from 15 to 50000 ha They are designed to insure sustained even and sufficient sup-plies of timber in order to simplify management and to obtain the short-term financial credits needed to make the forest accessible to transport Workingcircles cover contiguous areas encompassing entire watershed or timbersheds which are homogeneous with respect to both natural and economic conditions These working circles permit the application of a uniform method of management and a uniform type of harvesting regulation Relatively large areas are covered by working circles This is made possible by the introduction of the concept of working complexes of stands which refer to land units homogen-eous with respect to production and management The only role left for the working circle is to insure sustained and even yields from the forest If required working circles can be drawn for forests managed for purposes other than timber production eg protection forests recreation forests nature reserves and the like
Working Complexes of Stands
These are defined as the groupings of forest stands with ecological pro-ductional and management characteristics so similar that they permit the in-troduction of a uniform system for (1) compilation of instructions for manage-ment (2) calculation of the index of harvest regulation and (3) calculation of the timing of management activities for the forest etc The reasons for introducing the working complexes of stands into forest management are to make the goals and the decisions of management concrete to facilitate real plan-ning and control of managerial actions and to simplify the managerial pro-cess Clearly the use of working complexes is indicated when a system of in-tensive management is introduced into virgin-like forests
Forest Compartments
These are defined as the permanent lard management units based on the forests biological and management typification They range in area from 30 to 100 ha Where possible the forest compartments are marked off by distinct characteristics of the terrain Their uniform morphological character should mesh with the network used for timber skidding and with the road system Moreover the forest compartments are supposed to be independent units also
3
from the point of view of forest protection For this reason preventive measures of protection are worked out for each compartment Compartments are surveyed and as a rule their boundaries are located using photogrammetry The forest compartments are the basic units of the forests spatial organi-zation both with respect to planning and with respect to the realization of the plan
Subcompartments
Under diversified natural and working conditions there are occasional cases when the compartment cannot cover all ecological and stand differencesit then follows that the compartment is not a convenient unit for the plan-ning control and realization of pertinent measures of management in the sec-tors of silviculture and forest protection Instead subcompartments are de-limited as a lower category of the forests spatial organization The sub-compartments are assumed to possess the same properties indicates above for the compartments--those necessary for the uniform planning of management act-ivities related to silviculture and forest protection In this particular case the planning of timber transport and skidding occurs within the frame of the compartment
HARVEST REGULATION
The principle observed is that optimum productivity be reached in the for-est stands within the compartment or subcompartment at the same time the yields produced within the frame of the working circle must be sustained and even In compliance with the requirement for simplicity and the conditions in developing countries harvest regulation should be based on area It is true that allowable cuts are derived on the basis of area and volume as well as on assortments and value but always so that considerations for the elements of volume are subordinated to those of area
Calculation of the Allowable Cut
The final allowable cut is determined primarily by the normal fellingarea according to the formula
e = inhu
where e denotes the volume of the allowable cut in stands for the normal
felling area in hectares and hu designates the average volume per hectare of the growing stock within the working circle at the time of stand maturity
This average stock per hectare of the working circle is obtained with the formula
hu = ΣihiFiΣiFi where hi denotes the per-hectare stock in stands of individual working com-
plexes Fi indicates the area in hectares of the ith working complex belong-ing to the working circle and
4
i = Fu
where F is the area of the working circle and u is the rotation of the work-ing circle calculated according to the formula
u= EiuiFiziFi
For the volume index of harvest regulation it is possible to use the final mean annual increment in stands of the working circle This is calculated bysumming up the final mean annual increments achieved in all the individual working complexes which constitute the working circle
The stand volumes per hectare of individual working complexes are obtained by determining the growing stock volume per hectare in sample plots distri-buted in individual working complexes Principles of systematic random selec-tion must be observed to obtain representative estimates of the characteris-tics of the stands of the working circle
Concerning the realization of the allowable cut the main object of the method proposed here is to promote the harvesting of the allowable cut in a contiguous area (French terms quartier de regeneration affectation unique)The method thus permits respecting the silvicultural requirements of stands in individual subcompartments or compartments within the frame of the ecological and production conditions characterizing individual working complexes In doing so harmony is achieved between the interests of silviculture and those of cutting regulation
For long rotations and the use of small-area harvesting sytems the allow-able cut in the quartier de regeneration is calculated from the formula
HO+ Ci bull P2 e = _____________
P
where HO denotes the total volume of stands in the quartier de regener-ation P stands for the regeneration period (cutting cycle) expressed inyears and Ci designates the current increment The number of regenerationtreatments is determined with respect to the ecological requirements of thespecies represented in or introduced into the stands Regeneration in thesubsequent quartier de regenerationn does not commence until completion ofthe stand regeneration in the quartier de regeneration immediatelypreceding
The harvesting in stands except for the quartiers de regeneration just under regeneration is dependent on the possibility of transporting the material exploited As a rule the plan is to utilize the wood for charcoal burning and only then carry it out of inaccessible stands on the backs of mules or donkeys Sanitary fellings are largely concerned with the removal of sick ill-shaped overaged and similar trees which if kept would not contri-bute to the value of the stand The cycle for these treatments is usuallyfixed at 10 or 20 years the volume of timber harvested per hectare in indi-vidual working complexes is estimated on the basis of a current survey of the condition of the stands
5
SYSTEMS OF MANAGEMENT AND EXPLOITATION
The method for introducing intensive management into virgin-like forests assumes the use of a system of management and exploitation that is consistent with the natural and economic conditions of the country concerned The main --and highly desirable--objective is to avoid the destruction of the forests sources of production--the soil above all--due to erosion waterlogging or excessive growth of woody plants The selection of the system of management is dependent also on the ecological requirements of the species in the speci-fic stand environment and on the technique of skidding to be employed In general it seems advantageous to prefer the small-area systems of managementthe better to maintain the forests production capability This howevershould not exclude the use of regeneration cuttings when conditions are suitable
CONCLUSIONS
In addition to what has been indicated above the method of introducingintensive management into virgin forests assumes thorough planning to carryout the management practices effectively and to use expensive harvesting and transporting machinery efficiently Another requirement is that all the com-plex aspects of forest management be taken into consideration The same a-mount of attention given to the harvesting of timber must be paid to afforest-ation of harvested areas and to the tending and protection of new stands The construction of a network of timber transport roads adequately dense and dulydistributed in space (about 15 kmha) is also a prerequisite
The method discussed in this paper is not only consistent with all the latest achievements in Central European forestry it is also consistent with the natural working and politico-economic conditions found in developingcountries
6
Theoretical and Computational Foundations of Management
Class Simulation
Denie Gerold
Abstract Investigations on complicated complexand not well-ordered systems are possible only with the aid of mathematical methods and electronic data processingSimulation as a method of operations research is particu-larly suitable for this purpose Theoretical and computa-tional foundations of management class simulation must be integrated into the planning systems of forest management and must provide a large number of alternatives for action A model already in wide use is described
INTRODUCTION
Research on complicated complex and not well-ordered systems is possible only with the aid of mathematical methods and electronic data processing equip-ment With analytical model analysis (eg optimization models) the solution algorithm yields a specifically defined result but computational experiments are more or less systematic test procedures for which there is no logicallycertain procedure for optimal solution The purpose of the computational ex-periment is to search for the optimal solution or the best corresponding de-cision Complete and partial searches are differentiated according to thescope of search processes within the framework of a given decision model In complete searches all possible constellations of variables are calculated and the optimum with respect to the objective concepts exists with certainty amongthe variants The partial search is limited to a sample of all possible searches It must be guaranteed that partial search procedures are directed toward the research goal Partial searches differentiate between pure simu-lation and design game plan In simulation one specifically formulates definitions for actual decisions through decision rules at the beginning of a series of searches In the design game plan the strategies for a searchseries are not fixed at the beginning of the game but develop in the course of the game as the result of chains of decisions
Simulation is suitable as a method for operations research because of its adaptability for analysis of systems with numerous input and output quantities and complicated structures It is distinguished by the following essential crite
7
1 A system can be simulated if it can be subdivided into a variety of elements for which the behavioral rules can be assigned
2 The simulation encompasses a mathematical model which runs but is not solved ie time is very important in the simulation
3 The process of system optimization is not directly contained in the simulation
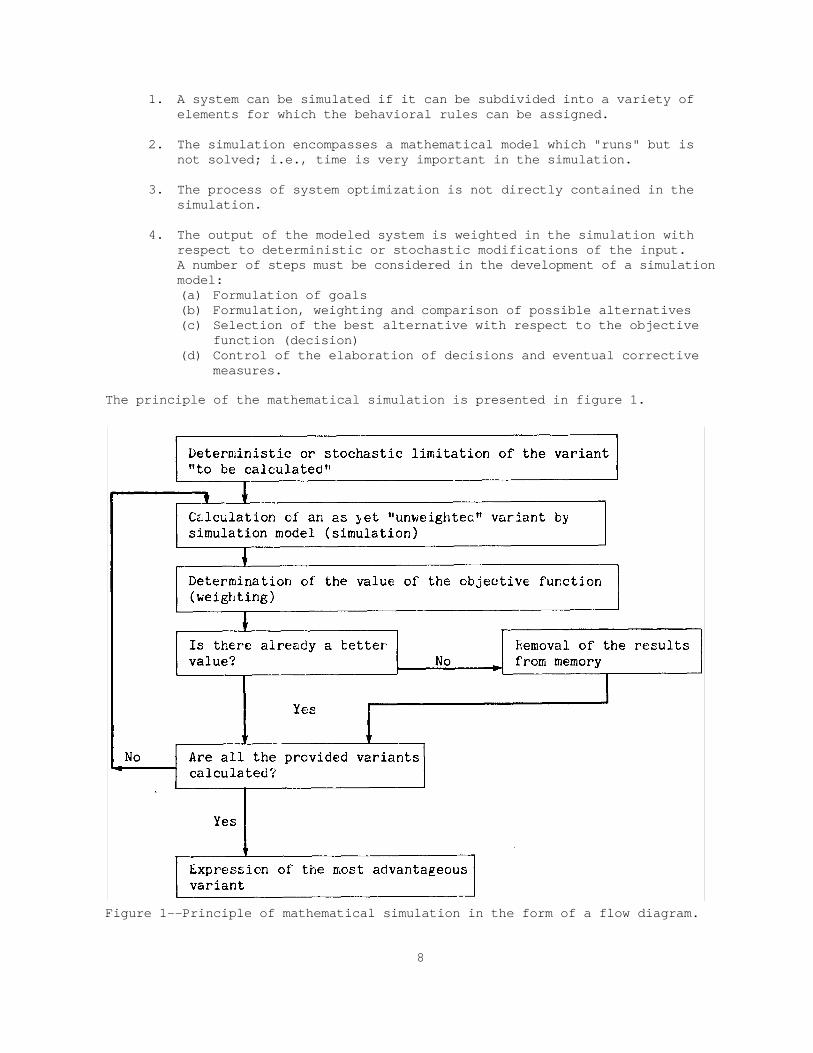
4 The output of the modeled system is weighted in the simulation with respect to deterministic or stochastic modifications of the input A number of steps must be considered in the development of a simulationmodel (a) Formulation of goals(b) Formulation weighting and comparison of possible alternatives (c) Selection of the best alternative with respect to the objective
function (decision)(d) Control of the elaboration of decisions and eventual corrective
measures
The principle of the mathematical simulation is presented in figure 1
Figure 1--Principle of mathematical simulation in the form of a flow diagram
8
FOUNDAIIONS OF THE MANAGENENT CLASS SIMULATION
The significance of simulation for forestry problems is conditioned pri-marily by the long duration of the production process The extensive time differences between managerial measures and their effects on the forest neces-sitates the inclusion of future developments in present decisions The value of a measure can be interpreted only in view of its effect on long-term goals
The management class as a system within a sustained unit is decidedly sig-nificant for the complex planning of a forest evaluation Its stratified structure is only ascertainable through simulation of multiple alternatives in its combined time and space-related development A management class simulator (Gerold 1976) is a model based on the specific state of a tree species manage-ment class which includes all stands of a tree species cultivated for similar production goals and found within a sustained unit With this model the ef-fects of different variants of production and yield regulation on the develop-ment of this management class over long periods of time (the prognosis) can be analyzed Also the mutual correlation of the component problems of the sus-tained unit can be demonstrated The formulation of this type of model has the following foundations and requirements
(a) The model must be integrated into the total planning system of the forest evaluation It must have numerous alternatives and includetherefore many component problems of sustained yield regulation The time interval over which simulation takes place should be deter-mined by the user
(b) The stand is the active element in a management class The complex sustained yield regulation requires that the input information of the simulator refer to this conditional unit All management class data are derived from the aggregation of stand information during simu-lation The accuracy of stand information should be known to cor-rectly classify the results of the simulation model with respect to certainty within the framework of the decision aids
(c) Component models weighted and easily integrated into the planningsystem of forest evaluation are to be used for the generation of many alternatives (eg intermediate and final yield strategies)ie a large scope in the formulation of a model The scope of the alternatives is determined by the flexibility and quality of the man-agement class simulator
(d) An efficient updating algorithm which guarantees certain extrapo-lation is necessary for the simulation of stand information
(e) The model must make possible the processing of management classes of any stand ie of any age quality and growing stand density struc-ture If the memory capacity of the electronic data processing unit is not sufficient for calculation of larger conditional units becausestands are numerous then the stands are aggregates into computation units of a higher order In this case the criteria must be as follows
Age (eg 2-year intervals)Quality (eg have quality grades)Density stand volume (units of 10)
9
This facilitates the use of the simulator for sustained units of anygiven size
(f) On the basis of goals formulated for the stands and of management class information the actual conditions obtained in the individual stages of the prognostic time span and the planning magnitude are to be weighted according to valuation criteria for the age structure and the stand density From the weighting the deviation from the normis to be estimated This weighting facilitates the selection of certain planning alternatives by the planner in the context of the overall goals
(g) The following prerequisites apply for the preparation of the computed information (1) An electronic data processing unit with a large memory capacity
and high calculation speed must be available
(2) The simulation program is based on the block principle to provideflexible subroutine exchange thereby making possible simple con-sideration of new alternatives
(3) The presentation of results using a high speed printer must be inthe form of` clear and easily visible tables Automatic symbol equipment to represent the development of specific key numbers ofthe management class are to be used as much as possible
(4) The preparation of stand information is rationally possible onlythrough electronics An additional prerequisite is a functionallyefficient permanently actualized data memory containing infor-mation which can be recalled at any time using available sortingidentifiers
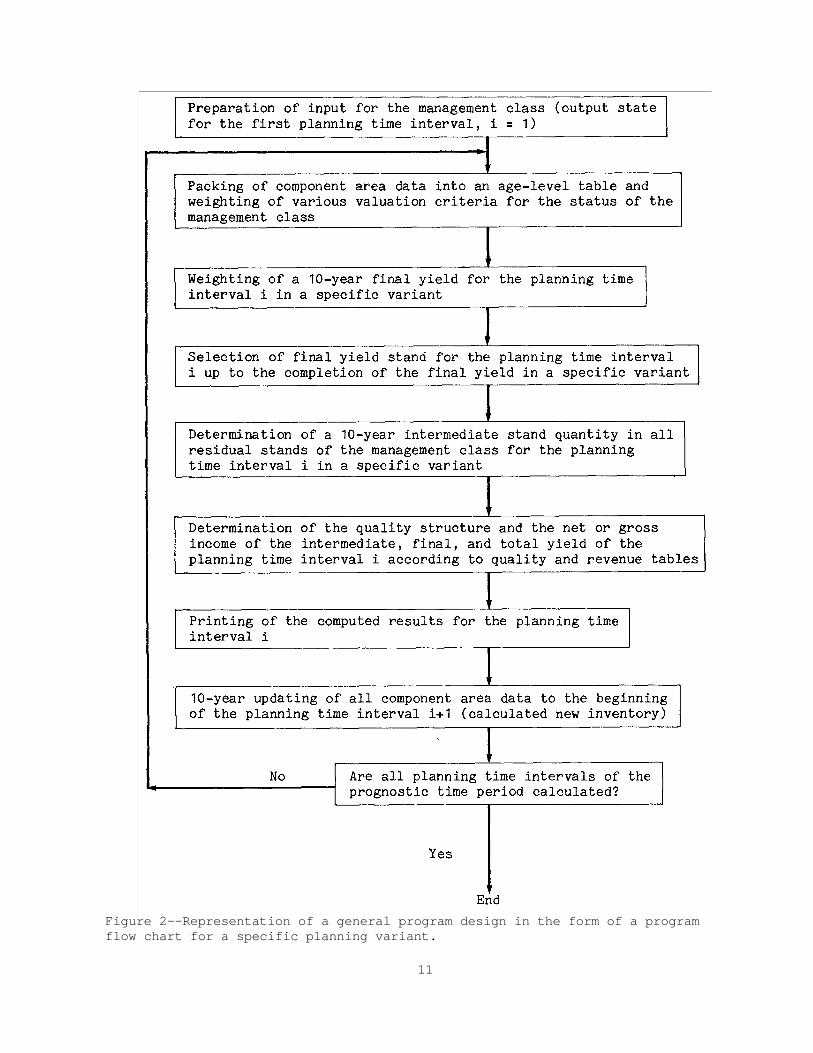
Figure 2 presents the general program design of a management class simula-tor to calculate a planning variant Any of the available variants (alterna-tives) can be simulated using this sequential scheme
DESCRIPTION OF A MANAGEMENT CLASS SIMULATION MODEL
A management class simulator was developed on the basis of the fundamen-tals presented in Figure 2 It is submitted as the program flow chart and calculation program using the program language ALGOL for the electronic data processing unit BESM-6 The Soviet large-capacity computer is suitable due to
its high calculation speed of an average of 106 operationssecond for the
generation of the simulation model The memory capacity of BESM-6 permits di-rect processing of management classes with a maximum of 3800 stands On the average this corresponds to an information scope of approximately 5000 hec-tares For larger conditional units an aggregation (see figure 2) should be used The stand data used (age land mature crop quality) are available in handbooks of forest management in the data bank of the forest fund Extensive information for various planning strategies is derived from these data duringsimulation for each 10-year period of the prognostic time span It is printedin the form of the following tables
10
Figure 2--Representation of a general program design in the form of a program flow chart for a specific planning variant
11
Age distribution table
Table for final cutting stands
Table for intermediate yields of stands
Summary of harvest and growth
Table of the range of harvest
The simulation model is constructed in a deterministic manner ie alterna-tives do not have any random features Its functional efficiency was tested in a series of real management classes (Gercld 1976 Gerold and Kurth 1977Kurth and Gerold 1977 Gerold 1978)
LITERATURE CITED
Gerold D 1978 Effect of age structure on the growth increment capacity of management classes Wiss Ztschr der Tech Univ Dresden 27(2)
Gerold D 1976 Untersuchungen zu Problemen der Verknupfung einzelner Nachhaltbegingungen mit Simulationsmodellen fur die Baumart Fichte [Investigations on the problem of decisions for individual sustained conditions using simulation models for spruce species] Dissertation ATharandt
Gerold D and H Kurth 1977 Proposals for further development of a normal forest model Wiss Ztschr der Tech Univ Dresden 26(2)497-501
Kurth H and L Gercld 1977 Simulation model for sustained yield regu-lation Paper presented at the IUFRO Symposium Subject Group S04Session Zvolen Sept 12-15 1977
12
A Computerized Tree Growth Projection System for Forest Resource Evaluation
in the Lake States
Allen L Lundgren Burton L Essex
Abstract A computerized tree growth projection sys-tem has been developed for the Lake States Region as partof a larger Forest Resources Evaluation Program (FREP) Incorporating data from more than 1500 permanent growth plots throughout the Lake States this system projects tree growth mortality regeneration and removals in stands with any mixture of tree species and sizes for the full range of sites encountered in the field It incorporates the latest published timber management guides for the Lake States It can identify silvicultural treatment opportunities now and in the future from the plot data or representative tree lists for a single stand a management unit an entire forest property oran entire state or region It can also be used to update tim-ber inventories and to project future yields and resource conditions in response to alternative silvicultural treatment opportunities for timber resource evaluation and assessment
INTRODUCTION
A comprehensive inventory of forest resources is essential for land man-agement planning but by itself is not sufficient An inventory provides a detailed picture of the resource at one point in time The forest is not a static entity but a dynamic biophysical system A full description of such a system must contain not only an estimate of its present state but also a des-cription of its potential future change Without provision for continual up-dating an inventory only produces a fading portrait of a resource that is changing with each passing year as regeneration growth death and cutting of trees takes place To be fully useful to the land manager and planner a com-plete resource inventory system should continually update the inventory toprovide current data about the condition of the resource It also should be capable of estimating future charges in the forest resource in response to a range of possible resource management alternatives including that of no tree cutting
A tree growth projection system is a necessary part of a dynamic forest
13
resource inventory system It must be capable of updating and projecting tim-ber inventories in a form suitable for evaluating resource management alter-natives for large areas with diverse forest conditions To do this it must be able to handle all species and stand conditions in a forest area require only a minimal amount of input data such as would be available from existingresource inventories and be computationally efficient
Developing a tree growth projection system capable of describing the dy-namic behavior of complex ecological communities such as the intricately mixed northern hardwood-conifer forests of the Lake States has long challenged inven tory specialists and growth modelers Stand growth models have been developedfor several single-species forest types such as Pinus resinosa Ait (Buckman 1962) Picea mariana (Perala 1971) and Populus tremuloides (Schlaegel 1971)Such models have been useful in developing stand management recommendations for even-aged stands with a single species However models have been devel-oped for only a few Lake States species and existing models fail to describe the behavior of the mixed-species mixed-sized stands common to the Lake States Stand models have been developed for some mixed-species forest types for some areas of the Lake States (for example Dale 1972 Ek 1974 and Moser 1972) but again coverage of the resource base is far from complete Individ-ual tree models for more general mixed-species stands (Ek and Monserud 1974)are expensive to run and require more data than is available from most forest inventories
Available growth models have provided valuable insights into tree andstand growth but by themselves are not adequate for a forest-wide tree growth projection system Efforts to assemble individual growth models and link them into a more comprehensive system have been frustrated by the lack of common in-put requirements and data outputs as well as incomplete coverage of theresource
TRAS a computer program for projecting timber volumes was developed and used by the US Forest Service to update inventories and project future tim-ber volumes for large forest areas (Larson and Goforth 1970) However this program was not designed as a stand model to account for interactions amongsize classes of trees in response to alternative silvicultural treatments It lacks the ability to closely model biological tree response to stand treat-ments in the mixed forest ecosystems common in the Lake States in the detail needed for evaluating treatment opportunities
The need is to develop a comprehensive tree growth projection system speci-fically designed to project tree growth for all species in all stands for largediverse forest areas in encugh detail to update forest inventories and eval-uate stand treatments
THE PROJECTION SYSTEM
After several years of work scientists at the North Central Forest Experi-ment Station of the Forest Service (US Dep Agric) have completed and tested a computerized tree growth system for the forests of the Lake States Region Developed using data from more than 1500 permanent growth plots in
14
all major forest types in the Region the projection system reliably projects stand development with or without tree cutting for several decades for all for-est conditions found in Michigan Minnesota and Wisconsin
This system inexpensively projects individual tree growth mortality and regeneration with or without tree removals for products in stands with anymixture of tree species and sizes and any density over the full range of sites encountered in the field The latest published timber management guides for the Lake States species are incorporated into the system These are used to identify silvicultural treatment and timber harvesting opportunities now and in the future from the plot data or representative tree lists used to des-cribe a single stand management unit or an entire forest property state or region The projection system has been linked to the US Forest Services national forest inventory system in the North Central Region However it can be adapted readily to other growth projection needs
Input to the projection system is a list of individual trees that represent a forest stand At a minimum the list must have the tree species and diam-eter breast high of each tree listed along with each trees expansion factor to indicate the number of trees per acre each tree represents Other infor-mation should include tree condition (alive cut or dead) and stand varia-bles such as site index and age Tree growth mortality and regeneration are projected for any time period (in increments of a year) or sequence of periods selected by the user
A major advantage of this projection system is that the integrity of the individual tree list is maintained throughout the projection period so no information about the resource is lost through aggregation At the end of each projection period the system produces an updated list of trees in the same format Thus programs available to summarize data from the initial tree list or inventory can be used to summarize data from the program output tree lists as though they were a new inventory It will be necessary to update other data that are subject to change that are not handled by the projection system at present such as land use or ownership change changes in site index due to change in forest type and special tree measurements such as merchant-able bole length log grades or cull percent
Silvicultural treatment prescribed for each acre each year or time period is identified by kind of treatment and forest type A cost algorithm deter-mines the cost of each treatment by time period for the acres indicated Trees to be cut are designated by the appropriate silvicultural treatment The system then projects stand development forward for the desired number of years with the trees left after cutting If desired the process may be repeated Timber harvested in each time period can be produced in detail in-cluding cubic foot volume by species and 2-inch diameter class within each type Mortality volumes can also be summarized in detail Inventory volumes before and after each cut can also be obtained in the same way The difference in future stand development with and without treatment can be identified from this information and can be used for economic appraisal of stand treatment opportunities either on an individual stand or forestwide basis
The timber projection system has been tested extensively and has provided results well within acceptable limits of accuracy The tests consisted of
15
projecting first occasion inventory plots which had not been used to developmodel coefficients and comparing the projected value with actual values that were recorded on sucessive [sic] plot measurements
The system was designed for inexpensive computing so thousands of surveyplots could be updated annually to provide current Regionwide inventory data Computing costs have been about 6 cents to project the tree list from a single plot for 10 years and develop summaries of inventory and harvest volumes
USE OF THE SYSTEM
This Lake States system has been used to update all the survey plots in Wisconsin from the most recent inventory (1967-69) to 1978 Removals for timber products were accounted for to provide a current inventory estimate Similar inventory updates have been done for individual national forests in the Lake States Plans are to periodically update each state-wide inventoryas needed to provide estimates of the current status of the forest resource throughout the Region in as much detail as the original inventories
The system also has been used to update and project inventories of indi-vidual national forests of all state-owned land within a state survey unitand of other forest land in response to silvicultural treatment opportunities for timber production The output showed timber volumes harvested and timber volume inventories by decade for the next fifty years
The development of individual stands in several National Forest Compart-ments in Michigan was projected for fifty years both with and without timber cutting to show how the system could be adapted to the Forest Services com-partment examination procedures These illustrate only some of the ways the system can be used
THE SYSTEMS POTENTIAL
This timber growth projection system is designed to be the core of a larger Timber Resource Evaluation System that will evaluate timber management oppor-tunities on a local state or regional basis from an economic social or eco-logic point of view The evaluation system is still being developed but the output from the projection system can be used with existing evaluation proce-dures and programs The mathematical structure underlying the timber project-tion system was designed to allow for including other components of the eco-system besides trees--for example a link between trees and understory vege-tation is now being developed
The timber projection system developed for the Lake States has tremendous potential Now for the first time we have a computerized system that can project forest resource development in response to timber cutting or no tim-ber cutting for all forest conditions in the Region It answers the long-felt need for a method to project future renewable resource supplies in re-sponse to treatment for evaluating management opportunities It will beuseful for timber management planning and program development for state and
16
regional resource assessments Further it can be used to update resource inventories to provide a reliable current estimate of present resource conditions
The concepts used in developing the timber projection system are general and have potential for wide application We plan to continue development of FREP as rapidly as possible expanding the system to the rest of the North Central Region and to other resources We also plan to work with others to test the applicability of the FREP tree growth projection system to other regions of the United States
Another exciting concept will be to incorporate the tree growth projection system into the remeasurement design of forest inventories A first step of the new inventory procedure could be to classify plots established at the time of the previous survey into disturbance classes This might be done usingLANDSAT data conventional photography or a combination of the two Undis-turbed plots could be grown to the date of the present survey using the tree growth projection system These plots could then be sampled to determine what corrections if any need to be made in the projections to represent current inventory conditions accurately Disturbed plots could be remeasured on the ground together with new plots such as might be found in agricultural areas that have reverted to forest These plots would be processed in the con-ventional way The two data sets would then be combined to form the infor-mation base for the new survey
This procedure could substantially reduce the cost of todays remeasure-ment surveys but still provide a detailed tree list of each plot that may be used in the projection system
Acknowledgment The timber growth projection system was developed jointlyby a team of researchers at the North Central Station This team included Dr Rolfe A Leary Jerold T Kahn Roland G Buchman Gary Brand Brad SmithMargaret Holdaway Jerrilyn LaVarre Thompson and Linda Christensen each of whom had responsibilities for major aspects of the study A collection of papers outlining the system in some detail is being published as USDA Forest Service General Technical Report NC-47 North Central Forest Experiment Station St Paul Minn
17
APPENDIX1
A general description is given here of the input needed how the parts are put together and what output is produced
Input
The input consists of a parameter deck and a tree list A tree list con-sists of tree species dbh crown ratio and quality class for a group of individual trees Also required are the following plot attributes site index stand age and plot size
Parameter deck
The parameter deck specifies two groups of input values (A) user selected options and (B) numerical constants needed by each portion of the growth processor
Numerical constants are used for
Assigning species group codes to individual trees Crown ratio function coefficients Silvicultural treatment specifications Volume equation coefficients Mortality equation coefficients Potential growth function coefficients A species grouping priority matrix (used for combining species when more than three species occur on a plot)
These values are determined from calibrating the model on a specific data base of permanent (remeasured) plots
Projection-related options that may be selected by the user are
Length of projection cycle (years)Number of projection cycles Type of growth projection desired (validation projection or update)
The number of years the tree list is projected is determined by the number and length of the cycles The projection is limited to a maximum of 100 years but it may be in the form of 100 cycles of one year each or one cycle of 100 years The length of the cycle determines how often summaries are made and the tree list examined for management opportunities
____________________ 1 This material is abstracted from a forthcoming publication Hahn Jerold T and Gary Brand A program for implementing a generalized forest growth projection system USDA Forest Serv Gen tech Rep NC-47 North Central Forest Exp Stn St Paul Minn
18
Three different types of growth projections can be selected validationprojection and update A validation run uses a tree list with measurements recorded for several different years The tree list is projected from the initial measurement to the final measurement Projected and actual measure-ments are compared to determine the accuracy of the model A projection run begins with initial conditions and grows the trees for a specified length of time to estimate future conditions An update run begins with initial con-ditions from the past and grows the trees to the present Known product re-movals are used to extract the trees that produce those products from the tree list
Tree list
The tree list can be in one of three different formats (1) a list format (2) a unit record format as used by the US Forest Service Renewable Resources Evaluation (forest survey) projects or (3) a computer-readable format in which the user is responsible for supplying the necessary computer code for input and output routines
PROGRAM ORGANIZATION
Besides providing inputoutput capability the program controls when the different parts of the system are used according to the options selected The listing below gives all the subroutine and funtion [sic] names their calling rou-tines and a brief statement of their purpose The program has seven parts
1 The main calling program2 A function VALUE where all mathematical equations are located 3 Input subroutines 4 A subroutine for aggregating the input tree list 5 Stand treatment subroutines 6 Stand growth subroutines 7 Output subroutines
Subsystem TRES (Timber Resource Evaluation System) of program FREP (Forest Resources Evaluation Program)
1 Main program
Program TRES Main calling routine sets up and initializes arrays performs housekeeping functions organizes calling of subroutines
2 Mathematical functions
Function Value Called from RMASTR RSURTP GROW ISUM OUTPT1 and OUTPT2 Computes values for crown ratio potential growth modifier mortality and volume
19
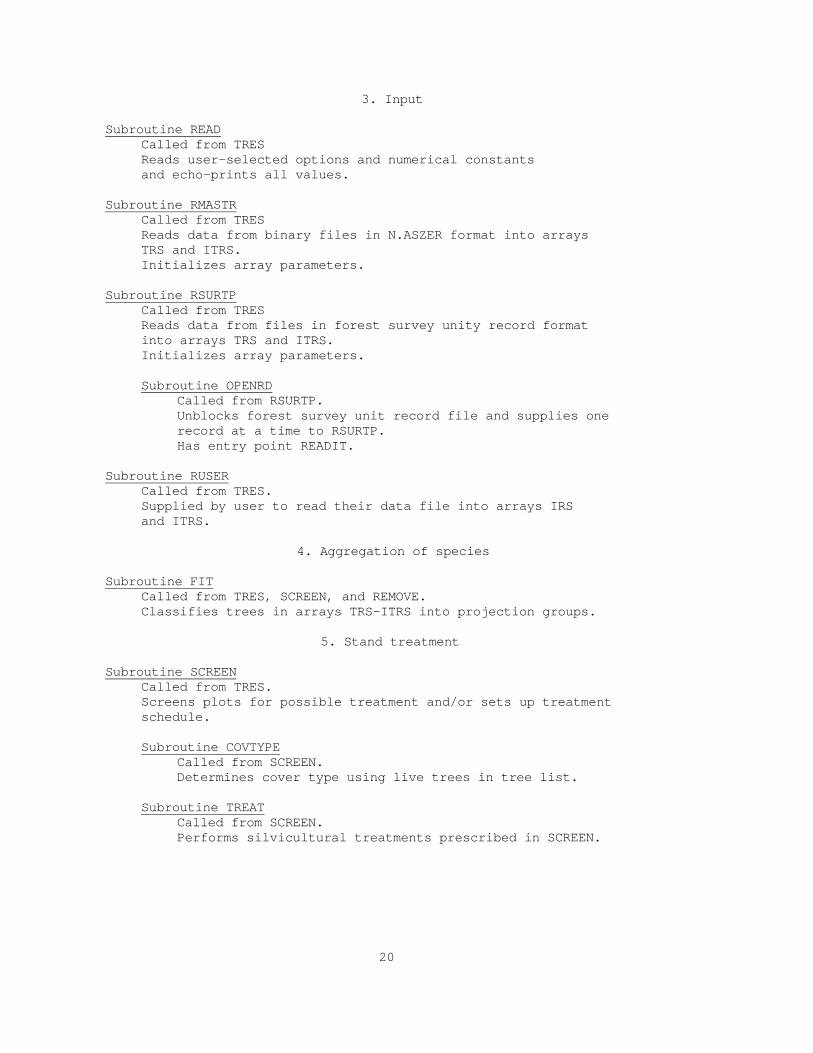
3 Input
Subroutine READ Called from TRES Reads user-selected options and numerical constants and echo-prints all values
Subroutine RMASTR Called from TRES Reads data from binary files in NASZER format into arrays TRS and ITRS Initializes array parameters
Subroutine RSURTP Called from TRES Reads data from files in forest survey unity record format into arrays TRS and ITRS Initializes array parameters
Subroutine OPENRD Called from RSURTP Unblocks forest survey unit record file and supplies one record at a time to RSURTP Has entry point READIT
Subroutine RUSER Called from TRES Supplied by user to read their data file into arrays IRS and ITRS
4 Aggregation of species
Subroutine FIT Called from TRES SCREEN and REMOVE Classifies trees in arrays TRS-ITRS into projection groups
5 Stand treatment
Subroutine SCREEN Called from TRES Screens plots for possible treatment andor sets up treatment schedule
Subroutine COVTYPE Called from SCREEN Determines cover type using live trees in tree list
Subroutine TREAT Called from SCREEN Performs silvicultural treatments prescribed in SCREEN
20
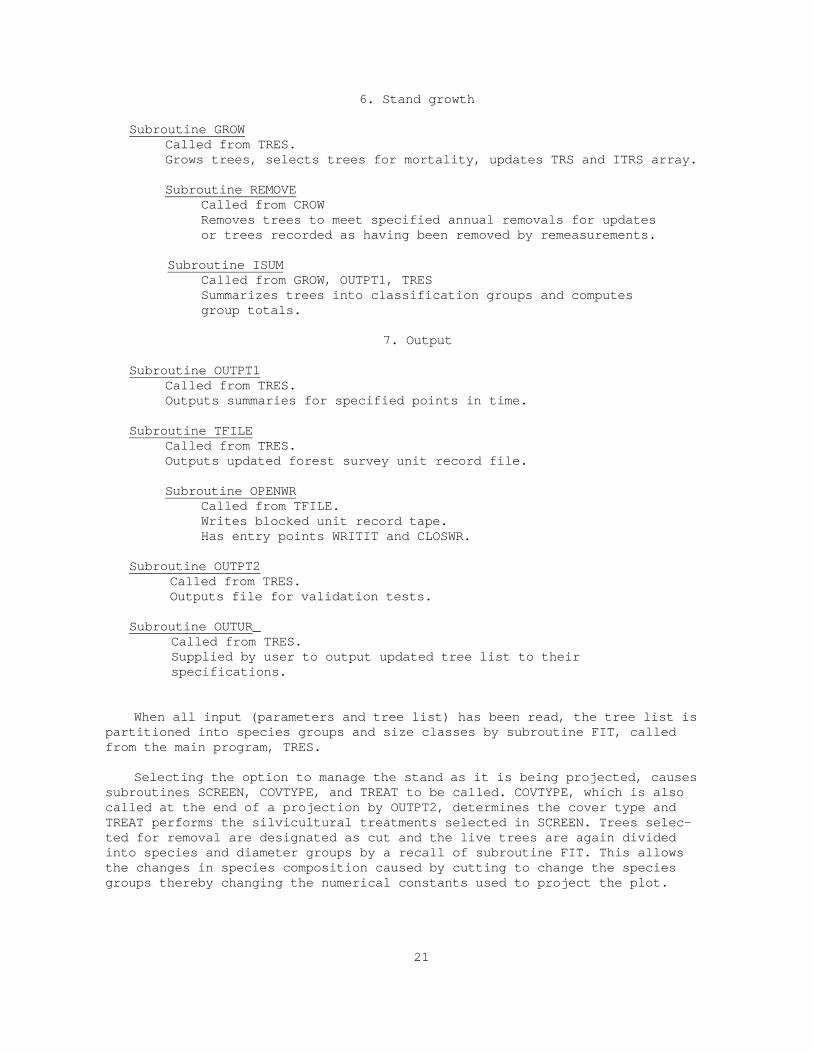
6 Stand growth
Subroutine GROW Called from TRES Grows trees selects trees for mortality updates TRS and ITRS array
Subroutine REMOVE Called from CROW Removes trees to meet specified annual removals for updates or trees recorded as having been removed by remeasurements
Subroutine ISUM Called from GROW OUTPT1 TRES Summarizes trees into classification groups and computes group totals
7 Output
Subroutine OUTPT1 Called from TRES Outputs summaries for specified points in time
Subroutine TFILE Called from TRES Outputs updated forest survey unit record file
Subroutine OPENWR Called from TFILE Writes blocked unit record tape Has entry points WRITIT and CLOSWR
Subroutine OUTPT2 Called from TRES Outputs file for validation tests
Subroutine OUTUR_ Called from TRES Supplied by user to output updated tree list to their specifications
When all input (parameters and tree list) has been read the tree list is partitioned into species groups and size classes by subroutine FIT called from the main program TRES
Selecting the option to manage the stand as it is being projected causes subroutines SCREEN COVTYPE and TREAT to be called COVTYPE which is also called at the end of a projection by OUTPT2 determines the cover type and TREAT performs the silvicultural treatments selected in SCREEN Trees selec-ted for removal are designated as cut and the live trees are again divided into species and diameter groups by a recall of subroutine FIT This allows the changes in species composition caused by cutting to change the species groups thereby changing the numerical constants used to project the plot
21
The tree list is projected one year at a time for the number of years in a cycle by subroutine GROW REMOVE and ISUM The crown ratio function poten-tial growth function and modifier function are used to determine individual tree growth Dead trees are determined using the mortality function and the pseudo-random number generator
OUTPUT
Four different output types are possible
(1) Yield table type output containing such variables as basal area and number of dead trees number of surviving trees basal area and sum of diameters on a per plot and per acre basis and cut tree volumes on a per acre basis This output is given by subroutine OUTPT1 and is available at the end of each cycle as well as at the beginning andend of the projection period
(2) A new Renewable Resources Evaluation (forest survey) unit record file (subroutine TFILE and OPENRD)
(3) A file for validating the projection system This is produced bysubroutine OUTPT2 and has meaning only if two or more measurements have been made on the plot The file produced by OUTPT2 is ordinarily stored on disk and analyzed by a separate user-written program
(4) A user-designated output file (subroutine OUTUR)(5)
LITERATURE CITED
Buckman Robert E 1962 Growth and yield of red pine in Minnesota US Dep Agric Tech Bull 1272 50 p illus Wash DC
Dale Martin E 1972 Growth and yield predictions for upland oak stands 10 years after initial thinning USDA Forest Serv Res Paper NE-241 21 pillus Northeastern Forest Exp Stn Upper Darby Pa
Ek Alan R 1974 Nonlinear models for stand table projection in northern hardwood stands Can J For Res 4(1)23-27
Ek Alan R and Robert A Monserud 1974 FOREST a computer model for simulating the growth and reproduction of mixes species forest stands Res Rep Sch Nat Resour Univ of Wis Madison Wis 85 p illus
Larson Robert W and Marcus H Goforth 1970 TRAS--a computer program for the projection of timber volume US Dep Agric Agric Handb 37724 p illus
Moser John W Jr 1972 Dynamics of an uneven-aged forest stand Forest Sci 18(3)184-191
22
Perala Donald A 1971 Growth and yield of black spruce on organic soils in Minnesota USDA Forest Serv Res Paper NC-56 16 p illus North Central Forest Exp Stn St Paul Minn
Schlaegel Bryce E 1971 Growth and yield of quaking aspen in northcentral Minnesota USDA Forest Serv Res Paper NC-58 11 p illus North Central Forest Exp Stn St Paul Minn
23
Techniques of Australian Forest Planning
Australian Forestry Council
Research Working Group No 21
Abstract Computer modeling has been extensivelyadopted for Australian forest planning over the last tenyears It has been confined almost entirely to the plan-tations of fast-growing species for which adequate inventorygrowth and experimental data are available Stand simu-lation models have replaced conventional yield tables andenabled a wide range of alternative strategies to be eval-uated for each individual stand Simulation models for entire plantations have been found invaluable for the prep-aration of 1- to 5-year cutting plans and for regulatingthe yield over 20- to 60-year periods Many models have been constructed and found to be simple and highly cost-effective Optimization models using linear programminghave been constructed for yield regulation and found to givepowerful insights into the interactions between the variousalternatives available for all stands However these modelsare expensive and require considerable data and expertiseThey are difficult to maintain especially when staff change
INTRODUCTION
This paper reviews Australian experience with the planning techniques used for plantations and some even-aged natural forests in the light of their po-tential usefulness to developing countries Australia has a century of ex-perience with industrial plantations of fast-growing exotic species such asPinus radiata which have been planted extensively in developing countries in recent years During the last 10 years planning methods have been completelychanged by the development of computer modeling techniques and it is to experi-ence gained in this change that the paper is addressed
1 Research Working Group No 2--Mensuration and Management is one of severalgroups set up by the Australian Forestry Council It consists on one or twoplanners from each of seven government forest services as well as representa-tives from industry and universities Members of the group are concerned both with developing new models and with the routine preparation of managementplans based on their results
24
The extent to which modeling has been adopted and the type of models de-veloped in each region have been determined largely by the data required and available Data collection in the mixed-species mixed-age natural hardwood forests is very difficult and has often not been warranted by the slow growth and low value of the stands very few models have been built for these forests By contrast extensive inventory growth and experimental data have been col-lected for long periods in the single-species even-aged fast-growing and valuable plantations It has been found often that the available data did not cover as wide a range as was needed to enable models to examine new options for the future In particular existing inventory data has rarely been suitable for the construction of growth models Wider ranges are being included in the designs of many new experiments
Thorough testing of the models is of great importance and is generally doneon a continual and long-term basis by comparing estimated yields with actual deliveries to mills Several effects such as errors of growth estimation or modeling thinnings quantity of residues degree of utilization and conversion factors are confounded in such comparisons However adequate performance in the tests is essential for management acceptance of the forecasts made by the models
SIMULATION OF GROWTH AND YIELD
The simulation of growth and yield with computer models has been a consid-erable advance on the use of standard yield tables because the effects of manymore silvicultural and management options can be examined quickly and because the individual conditions of each stand can be allowed for
Each model described comprises several biometric functions forecasting thedevelopment of various stand parameters which are combined into a compatible system enabling the stand as a whole to be characterized The key functions are those to forecast height and basal area or volume growth and to estimate the effects of tree breeding and alternative silvicultural options such as cul-tivation fertilization or thinning Almost all these functions were con-structed with data from repeated measurements of permanent growth plots and de-signed experiments and only a few from stem analysis or inventory data
Some other functions such as those describing stem form or volume basal area and height relationships are also needed Useful functions were often prepared initially by hand-drawn graphical analysis and early modeling was based on computerized versions Linear regression analysis has now almost en-tirely replaced graphical analysis More advanced forms of analysis are beingintroduced such as nonlinear estimations and generalized least squares As some extrapolation has almost always been necessary the forms of the growth functions have had to be chosen very carefully
There has been a gradual shift towards more intensive silviculture in Australia as elsewhere in the world The stands now being planted are ex-pected to grow differently from those which provided the data for the growth functions currently used The methodology needed to allow for this differencethe nature of interactions between effects (eg tree breeding and thinning)and the long-term upper limits to growth of stands grown under new conditions are matters requiring considerably more research
25
Stand Simulation Model 1
Organisation APM Forests Pty Ltd PO Box 37 Morwell Victoria 3840
Information JB Dargavel
Forest 40000 ha of Pradiata supplying a pulpmill and amp a sawmill There is a wide range of sites and there is very little land available for purchase economically
Objective Generate alternative strategies for each stand for subsequent selection by optimisation model
Time Span 25 years
Input Inventory plot data from existing computer system
Method Functions constructed by linear regression from permanent growth plot data forecast height and basal area increments Responses to fertiliser weed control and tree breeding estimated from experiments Volume yield by thinning and clear felling calculated by size and wood basic density classes
Output Stand development yield cash flow for each of an average of 50 alternative strategies for each of 200 stands Each strategy represents a different combination of 1 establishment method (2 alternatives) 2 thinning method (3 grades) 3 later fertilisation (YesNo) 4 clear felling age (10 possible ages)
Application Provide input to plantation optimisation model
Evaluation in Organisation Has enabled wide range of silvicultural options to be examined Major difficulties are estimation of how stands will grow under combinations of alternatives that have not yet been tried Research needed on interactions and upper limits to growth
Assessment for Developing Countries Useful for generating yield tables Tabular presentation of standard or example strategies
necessary if immediate computer access not available Accuracy depends on relevance of growth functions incorporated
Reference Turner BJ Bednarz RW and Dargavel JB (1977) A model to generate stand strategies for intensively - managed radiata pine plantations Australian Forestry 40 (4) 255-67
Stand Simulation Model 2
Organisation Queensland Forestry Department 388-400 Ann Street Brisbane Queensland 4000
Information B Stark
Forest 38000 ha of native conifers (predominantly Auracaria cunninghamii) and 60000 ha of Pinus species predominantly Pelliottii and Pcaribaea but also Pradiata Ptaeda and Ppatula
Objective To calculate both short and long term yields cash flows and standing volumes and values at any nominated time for various management alternatives
Time Span Short term up to 20 years and long term up to 60 years
Input Inventory plot data and 1 dbh strip samples from existing computer system
Method Functions constructed from inventory and experimental data forecast height and basal area increments and are used to calculate new diameter distributions Currently the model requires the alternative strategies for any given stand from a measured sample but in the future the model will generate the strategy given certain broad guide lines A wide range of alternative thinning strategies can be examined
Output The model projects and thins the stand table in 1 cm dbh classes for each cutting unit producing estimates of basal area predominant height volumes and values
A very wide range of groupings or listings is available including time period options stand conditions (basal area predominant height age etc) size assortment by quality classes for the stand and thinnings volumes and values for the stand or thinnings using current pricing and tables of predominant height volume and basal area information for direct comparison with the actual plotsgiving a continuing check on the model predictions
Evaluation in Organisation A plantation simulation is provided by aggregating the simulations of each stand The resulting short term calculation (up to 5 years) has been very successful in organising logging and new sales
Assessment for Developing Possibly the basal area increment prediction method could be very useful to countries with Countries young plantations and limited data
26
Stand Simulation Model 3
Organisation
Information
Forest
Objective
Time Span
Input
Method
Application
Evaluation in Organisation
Assessment for Developing Countries
References
Stand Simulation Model 4
Organisation
Information
Forest Objective Time Input
Method
Output
Application
Evaluation in Organisation
Assessment for Developing Countries
Woods amp Forests Department PO Box 162 Mount Gambier South Australia 5290
NB Lewis A Keeves and JW Leech
70000 ha of Pradiata plantations managed on an approximately 50-year rotation with up to six commercial thinnings and with a comparatively even distribution of age classes
To predict the yield of plantation stands of radiata pine from age 92 site quality assessment to the end of rotation
10 - 50 years
Permanent sample plots data - plots measured for volume every 2-3 years Some plot trends exceed 40 years
Graphical methods using the directing curve technique
Incorporation in long term planning models for even-aged stands
The technique has been used successfully for over 30 years to regulate the total cut from a profitable state afforestation enterprise keeping the cut as near sustainable maximum as possible The model is very nearly as precise a prediction model as the best nonlinear model developed
Advantages -1 it is simply revised as more data becomes available 2 being subjective local knowledge of data relevance and accuracy can be incorporated 3 does not need computer 4 does not need statistical expertise
Disadvantages -1 precision is unknown 2 it may be biased
Lewis NB Keeves A and Leech JW (1976) Yield regulation in South Australian Pinus radiata plantations Woods amp Forests Bulletin23 Adelaide
Woods amp Forests Department PO Box 162 Mount Gambier South Australia 5290
JW Leech
As for Model 3
An alternative to the method used in model 3 Nonlinear regression analysis using Generalised Least Squares and optionally Bayesian informative priors
It will be incorporated in a revision of the South Australian plantation simulation model for long term planning
Incorporation in long term planning models for even-aged stands
The algorithms used offer considerable advantages over the commonly used linear regression analysis using Ordinary Least Squares-1 alternative biologically sound hypothetical models can more readily be formulated as
nonlinear models than as linear models 2 Generalised Least Squares provides a statistically sound way of utilising long term trend
data 3 Bayesian statistical methods enable thinned and unthinned plot data to be incorporated
in the one analysis These complex techniques are necessary if a mathematical model for radiata pine is to be a superior predictor to yield tables developed by the directing curve trend technique Further these extensions provide a more precise prediction model that is statistically sound
The technique used requires good long term data which could be obtained only from -1 remeasured plots or 2 stem analysis
27
Stand Simulation Model 4 contd
References
Stand Simulation Model 5 Organisation
Information
Forest
Objective
Time Span
Input
Method
Output
Application
Evaluation in Organisation
Assessment for Developing Countries
Stand Simulation Model 6
STANDSIM
Organisation
Information
Forest
Objective
Time Span
Input
Method
Output
Application
Further the technique requires access to computing facilities and also requires a sound statistical knowledge
Given these factors the technique offers considerable promise for yield prediction in even-aged stands
Ferguson IS and Leech JW (1978) Generalised Least Squares estimation of stand yield functions Forest Science (in press)
Tasmanian Forestry Commission199 Macquarrie Street Hobart Tasmania 7000
PR Lawrence
29000 ha of Pradiata plantations managed for sawlog and pulpwood production on rather conservative thinning regimes delayed to varying degree because of poor current market demand
To predict thinning and clear-felling yields from stands of various ages site indices stocking class and thinned states Inclusion in forest simulation model assuming current treatment regimes
Up to 40 years in periods of up to 3 years
Either data from sample plots or when used in the forest model estimated values of mean dominant height basal area and mean dbh obtained from age site index and thinned state of each patch of forest recorded in the area information system
The three basic parameters predicted are mean dominant height basal area increment and increment in mean dbh The heightage relationship was obtained by non linear methodsthe other two by linear least squares all from permanent plots Thinning yields and the new starting point after thinning are predicted from past records of standard treatment Volumes are calculated from stand volume equations
Values required for the forest simulation model including mean dbh entire stem volumeand volume to four top diameter limits for either thinnings or clear-fellings
Simulation of a forest
The major limitation is that the results can only apply to stands treated in the same manner as in the past Since new treatment regimes are being adopted the use of these models invery limited The major source of inaccuracy of prediction was found to be in estimatingthe starting points
Few developing countries are likely to adopt the very conservative thinning regimes modelled
Forests Commission Victoria 601 Bourke Street Melbourne Victoria 3001
RB Smith
Even aged monospecific natural stands Eucalyptus regnans Edelegatensis Esieberi and approximately 75000 ha of Pradiata plantations
The future growth of a stand of any age is modelled for any period for various sites and thinning regimes
Commonly 25 -40 years with annual or 5 yearly growth cycles
Individual tree data by 10 cm size classes also rotation length site index thinning regimes
STANDSIM is a deterministic model which projects the development of a hectare of forestfor various sites and thinning regimes operating on individual tree data stored mainly as an array of tree diameters In each growth cycle the trees are grown and if necessary thinned by natural mortality or cutting Growth takes place by updating the diameters accordingto gross basal area increment and other functions
At the end of each growth cycle stand data including basal area stocking and dominant height of live trees gross increment net increment mortality and thinning information
Output from this model is used in systems for scheduling the cut from large areas of forest It can also be used to study a range of cutting options for example the number and timing of thinnings and timing of final harvest A stochastic version of this model hasbeen developed for studies of risk and uncertainity [sic]
28
Stand Simulation Model 6 contd
Evaluation in Organisation The model has been highly successful because users were involved in construction and testing
Assessment for Developing Countries A simplified form of the basic growth model would be potentially useful in even-aged forest
areas for which large scale industrial developments are proposed Advantage -1 the ability to study a whole range of thinning and clear felling options
Disadvantages -1 the model refers to monospecific stands only 2 model assumes fairly regular spacing 3 no allowance for defective stands
Reference Opie JE 1972 STANDSIM - a general model for simulating growth of even-aged stands Proc 3rd Conf Advisory Group of For Statisticians Section 25 IUFRO Jouy-en-Josas France Sept 1970
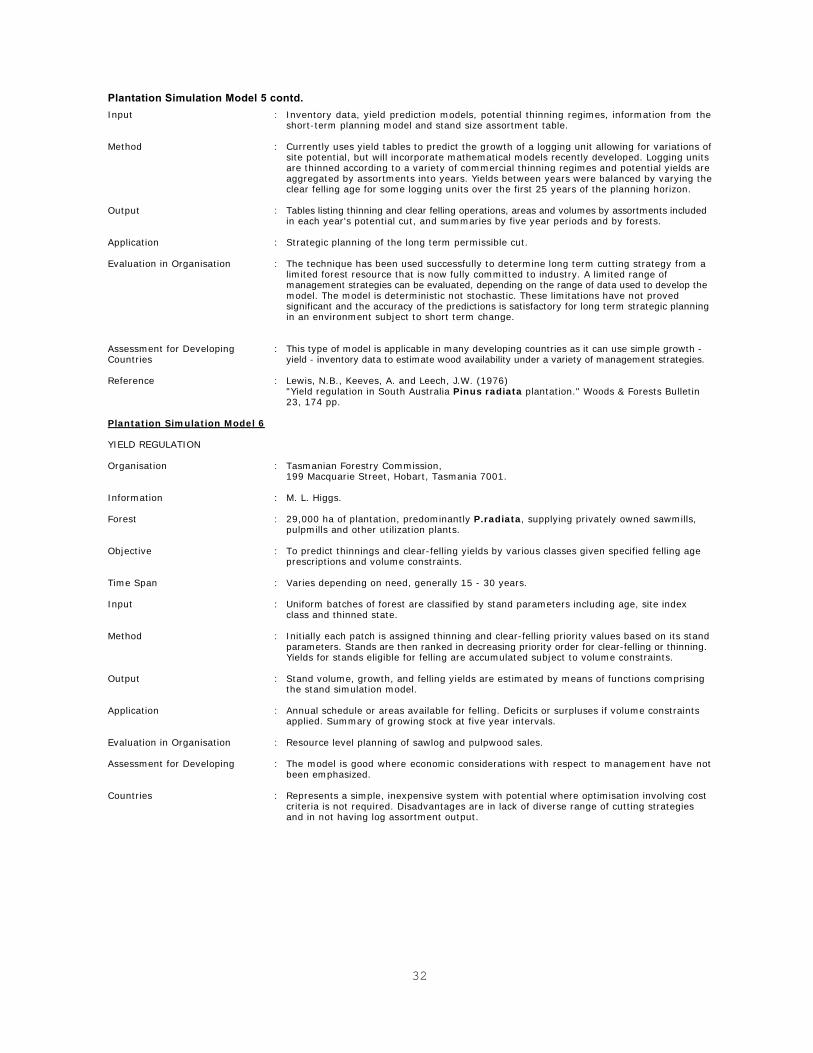
SIMULATION FOR CUTTING PLANS AND YIELD REGULATION
Computer models which simulate the future yield of entire plantationsthat is all stands considered together have become indispensable aids for preparing 1- to 5-year cutting plans and for regulating the yield over 20- to 60-year periods
The models described in this section simulate the development of the plan-tations and the production of wood according to initial starting values of such things as the area and conditions of existing stands land availabilityplanting rate and the quantities of wood demanded for industrial developmentsSome models include forecasts of cash flows and economic results
For each year of the simulation the plantation models forecast the growth of each stand using yield tables or the stand simulation models described earlier Stands are then scheduled for cutting according to built-in decision rules and the overall yield for the year calculated
By altering the starting values and repeating the simulations a range of alternatives can be generated from which the planner can select the most suitable The models are used to schedule stands for clear felling and to evaluate the timing and type of thinning operations particularly in relation to the demand for small-diameter roundwood In long-term planning the models are used to evaluate alternative planting rates and investigate how proposed new industries might be supplied
The models vary considerably in their complexity depending on the extent to which the variations in site are identified and on the nature of the deci-sion rules used for selection The simplest models consider only the averagesite and extend the areas of each age class by a standard yield table Bycontrast several of the models consider each separate stand and simulate their development with stand growth and yield models imbedded within the overall plantation model
29
Plantation Simulation Model 1 CUTTING PLAN Organisation APM Forests Pty Ltd
PO Box 37 Morwell Victoria 3840
Information JB Dargavel
Forest 40000 ha Pradiata plantations
Objective Schedule stands for cutting to supply a pulpmill and sawmill
Time Span 6 months - 3 years
Input The age basal area height and stocking of each cutting unit its area and suitability for summer or winter cutting
Method Includes a stand growth model Selects stands for cutting by priority rules based on operation due need for thinning quality of sawlogs and volume to be met
Output Schedule of stands to be cut and volume of each product
Application Preparation of operational cutting plans
Evaluation in Organisation Comparatively cheap to develop Easy to use and emend
Assessment for Developing Cost effective Scheduling could be done manually Countries
Reference Dargavel JB and Marshall PJ 1976 Annual cutting plans for developing plantations Proc IUFRO Working Group S 4024 XVI World Congress Oslo
Plantation Simulation Model 2 CUTTING PLAN
Organisation Woods amp Forests Department PO Box 162 Mount Gambier South Australia 5290
Information A Keeves and JW Leech
Forest Some 70000 ha of Pradiata plantations managed on an approximately 50 year rotation with up to six commercial thinnings and with a comparatively even distribution of age classes
Objective To predict the yield of a group of plantation stands of radiata pine in the next commercial thinning
Time Span 1 - 6 years
Input Inventory data yield prediction models proposed thinning treatment and tree size assort-ment tables
Method Linear regression analysis was used to predict tree volume and increment from tree diameter stand height site quality and stand density for both thinnings and clear felling Inventory data are from temporary 01 ha plots
Output A tabular five year cutting plan listing operations to be carried out and expected yields in a range of size assortments
Application In preparing the next 5 year cutting plan which will direct where commercial thinning and clear felling will take place to meet commitments to utilisation plants in a variety of required size and quality assortments
Evaluation in Organisation A limited test using independant data indicated the approach was satisfactory for practical use
Assessment for Developing This type of model is of use when short term (1-6 year) increment is considerable and will Countries affect planning This is of particular importance when a fast growing plantation resource is
being utilised close to its capacity
Reference Lewis NB Keeves A and Leech JW (1976) - Yield regulation in South Australia Pinus radiata plantations Woods amp Forests Bulletin 23 Adelaide
Plantation Simulation Model 3
CUTTING PLAN
Organisation Forests Department of Western Australia Barrack Street Perth Western Australia 6000
Information H Campbell
Forest 45000 ha Pradiata and Ppinaster plantations
30
Plantation Simulation Model 3 contd Objective Development of 1 and 5 year logging plans Planning the timing and extent of forest
industry expansions
Time Span Open ended but generally 1 or 5 years
Input Continuous inventory plot measurement data
Method Simulation of growth by a stochastic model Thinning operations and silvicultural and marketing priorities are set interactively
Output For each year of the planning period a list of areas to be treated and volumes by assortments is produced Also a resource summary is prepared
Application Scheduling thinning operations in pine plantations could also be used to develop strategies for input to an optimising program
Evaluation in Organisation After a slow start the model is gaining in use and acceptance in direct proportion to the degree of pressure put on the plantation resource
Assessment for Developing The growth routines are specific to radiata and pinaster pine The modifications required Countries to adapt them to other coniferous species would probably be minimal Extensive modif-
ications would probably be necessary to adapt them to hardwood species
Plantation Simulation Model 4
YIELD REGULATION (Four Models)
Organisation APM Forests Pty Ltd PO Box 37 Morwell Victoria 3840
Information JB Dargavel
Forest Plantations of Pradiata Pelliottii Eregnans and Egrandis in New South Wales Queensland and Victoria developed to supply pulpmills
Objective Development planning Determine if mills of given size can be supported from nominated land areas and planting rates
Time Span 20 - 30 years
Input 3 models assume one average site 1 model assumes 4 different sites models require areas of each age standard yield table for each site and standard costs
Method Yield table projection Areas scheduled for clear felling to meet mill demands by nominated priority rules mostly oldest first
Output Schedule of areas planted thinned felled Times at which demands can not be met or surplus available Condition of plantations at end of planning period
Application Development planning particularly at initial stages of plantation development prior to industries being established
Evaluation in Organisation Simple models easy and cheap to construct and run only require small computers Very successful when operated in inter-active mode Used when only limited data available ie before extensive inventory data base has been built up Difficulty is that they ignore real site differences and full range of opportunities that become apparent when inventory and experimental evidence has been assessed complex optimisation models then developed to evaluate
Assessment for Developing Countries Very high as models can be limited to the data available Cheap and simple to construct
and use Highly cost effective
Reference JB Dargavel 1969 Yield forecasting for industrial plantations Australian Forestry 33 (3) 153-62 gives details of an early rather more elaborate model than is currently used
Plantation Simulation Model 5
YIELD REGULATION Organisation Woods amp Forests Department
PO Box 162 Mount Gambier South Australia 5290
Information A Keeves and JW Leech
Forest 70000 ha of Pradiata plantations managed on an approximately 50 year rotation with up to six commercial thinnings and with a comparatively even distribution of age classes
Objective To predict the long term yield of the resource
Time Span 60 years
31
Plantation Simulation Model 5 contd Input Inventory data yield prediction models potential thinning regimes information from the
short-term planning model and stand size assortment table
Method Currently uses yield tables to predict the growth of a logging unit allowing for variations of site potential but will incorporate mathematical models recently developed Logging units are thinned according to a variety of commercial thinning regimes and potential yields are aggregated by assortments into years Yields between years were balanced by varying the clear felling age for some logging units over the first 25 years of the planning horizon
Output Tables listing thinning and clear felling operations areas and volumes by assortments included in each years potential cut and summaries by five year periods and by forests
Application Strategic planning of the long term permissible cut
Evaluation in Organisation The technique has been used successfully to determine long term cutting strategy from a limited forest resource that is now fully committed to industry A limited range of management strategies can be evaluated depending on the range of data used to develop the model The model is deterministic not stochastic These limitations have not proved significant and the accuracy of the predictions is satisfactory for long term strategic planning in an environment subject to short term change
Assessment for Developing This type of model is applicable in many developing countries as it can use simple growth -Countries yield - inventory data to estimate wood availability under a variety of management strategies
Reference Lewis NB Keeves A and Leech JW (1976) Yield regulation in South Australia Pinus radiata plantation Woods amp Forests Bulletin 23 174 pp
Plantation Simulation Model 6
YIELD REGULATION
Organisation Tasmanian Forestry Commission 199 Macquarie Street Hobart Tasmania 7001
Information M L Higgs
Forest 29000 ha of plantation predominantly Pradiata supplying privately owned sawmills pulpmills and other utilization plants
Objective To predict thinnings and clear-felling yields by various classes given specified felling age prescriptions and volume constraints
Time Span Varies depending on need generally 15 - 30 years
Input Uniform batches of forest are classified by stand parameters including age site index class and thinned state
Method Initially each patch is assigned thinning and clear-felling priority values based on its stand parameters Stands are then ranked in decreasing priority order for clear-felling or thinning Yields for stands eligible for felling are accumulated subject to volume constraints
Output Stand volume growth and felling yields are estimated by means of functions comprising the stand simulation model
Application Annual schedule or areas available for felling Deficits or surpluses if volume constraints applied Summary of growing stock at five year intervals
Evaluation in Organisation Resource level planning of sawlog and pulpwood sales
Assessment for Developing The model is good where economic considerations with respect to management have not been emphasized
Countries Represents a simple inexpensive system with potential where optimisation involving cost criteria is not required Disadvantages are in lack of diverse range of cutting strategies and in not having log assortment output
32
Plantation Simulation Model 7
YIELD REGULATION FORSIM
Organisation
Information
Forest
Objective
Time Span
Input
Method
Output
Application
Evaluation in Organisation
Assessment for Developing Countries
Reference
Forests Commission Victoria 601 Bourke Street Melbourne Victoria 3001
RB Smith
75000 ha of Pradiata plantations
To predict woodflows and cash flows from a forest consisting of a set of diverse even-aged stands
Up to 50 years
Inventory plot records for each section of the forest (sections uniform in age species site index)
Growth simulation of plot basal area and height and simulation of harvesting operations (thinning and clear fellings) depending on the cutting regime
For each strategy output includes volumes (by size classes) areas and section numbers for each year areas by age classes growing stock volumes for nominated years revenues and discounted revenues for each operation for each year
Planning and scheduling the cut testing and comparison of cutting strategies
Highly successful although initial problems with change of staff change of computing environment change of measurement units Ideal application for Pradiata plantations where a large number of possible cutting strategies is involved
The complex FORSIM package would have little potential for forests coming under management for the first time The simplified version ASSIM may have potential as a short term growth simulator
Gibson BF Orr RG and Paine DWM 1971 FORSIM - a computer program for planning management of even-aged forests Forests Commission Bulletin Melbourne
OPTIMIZATION FOR FOREST YIELD REGULATION
The three optimization models described in this section were designed for yield regulation The optimization models represent a significant advance on the simulation models described earlier because they enable the full combi-nation of the silvicultural alternatives for each stand times the number of stands to be explored For example if there are 50 alternative strategies for each of 200 stands an optimization model finds the best set out of the 50 x 200 = 10000 possible alternatives The best set consists of the strategyselected for each stand with a few stands being divided into 2 or 3 parts each with a different strategy Thus a little over 200 alternatives out of 10000 are selected in a single run of the model By contrast the simulation models only allow those combinations to be evaluated that are defined in the built-in decision rules
Two of the models are concerned with large fast-growing exotic plantations of P radiata and one is concerned with extensive fast-growing even-aged na-tural stands of Eregnans and Edelegatensis All the models evaluate various silvicultural alternatives for each stand while meeting overall constraintssuch as markets or budget for the plantation as a whole
Each model uses a linear program for optimization formulated along the lines originally developed by Clutter (Ware and Clutter 1971) in the Type 1 model of Johnson and Scheumans (1977) classification Standard computer pack-ages are used to solve the linear programs and obtain extensive marginal analysis
33
The models require extensive data prepares by a matrix generator pro-gram in a form suitable for input to the standard packages The source data consists of the yields cash flows etc for each alternative strategy con-sidered for each stand This extensive data is generated by stand simulation models
The optimization models have been found to be many times more expensive todevelop and operate than simulation models They require very extensive data and considerable expertise because of this they have been found difficult to maintain when specialist staff move They do however provide very power-ful insights into interactions between the alternative strategies available for different stands Their use can best be justified when forest structure and conditions are complex and the supplydemand relationship is critical
The optimization models were only constructed after substantial experience had been gained both with stand and plantation simulation models
Optimisation Model 1
Organisation APM Forests Pty Ltd PO Box 37 Morwell Victoria 3840
Information JB Dargavel
Forest 40000 ha of Pradiata in Victoria supplying a pulpmill and a sawmill There is a wide range of sites and very little land is available for purchase economically Some outside wood and chips are purchased
Objective Plan plantation development and ration capital between buying land planting and fertilisation Also find how much outside wood to buy schedule thinning and clear felling and find best silvicultural regime for each stand
Time Span 25 years
Input An average of 50 alternatives for each of 200 stands showing yields cash flows and contri-bution to objectives produced from stand model Volumes and costs of outside wood purchase options Many other data on conversion factors costs etc
Algorithm Linear programming
Output Extensive reporting of 1 silvicultural regime (planting method fertilisation thinning method clear felling age)
for each stand 2 Wood purchase schedule 3 Planting thinning and clear felling schedules 4 Rationing of capital between all plantation activities 5 Forecasts of size and density distribution to mills 6 Marginal costs of all constrained opportunities
Evaluation in Organisation Development brought all sections of organisation together Proved to be a very powerful tool in giving insights into operation of plantation system Very demanding in data requirements and staff time Expensive to construct and operate Requires ready access to large computer Difficult to modify quickly to changing conditions
Assessment for Developing Countries Considerable data and staff time required for both construction and continued modification
and maintenance of model in usable and valid condition
Reference JB Dargavel 1978 A model for planning the development of industrial plantations Australian Forestry 41 (in press)
Optimisation Model 2
RADHOP
Organisation Forestry Commission of NSW 93 Clarence Street Sydney NSW 2000
Information R Wilson and M McMullen
34
Optimisation Model 2 contd Forest
Objective
Time Span
Input
Algorithm
Output
Application
Evaluation in Organisation
Assessment for Developing Countries
Optimisation Model 3 MASH
Organisation
Information
Forest
Objective
Time Span
Input
Algorithm
Output
Application
Evaluation in Organisation
Assessment for Developing Countries
Reference
100000 ha of Pradiata plantations with irregular age-class distribution supplying 2particleboard plants and numerous sawmills One or two pulpmills are planned for the early 1980s
Rationalise yield flows through time to meet market requirements
Either short term (commonly five years) or long term (commonly 35 years)
Inventory plot data plus financial information
Stand simulation by deterministic functions constructed from research and inventory data Optimisation by linear programming which selects regimes to apply to management units to maximise returns while meeting volume constraints
Details of regime to be applied to individual areas size and time distribution of volume
Short term harvest planning and long-term prediction of quantity of industry that can be supported at various times
Successfully accepted as major management aid because of demonstrated reliability Functions continually adapted as conditions change and more data becomes available
Useful for providing estimate of plantation requirements to meet markets Operates on sample data but requires sophisticated computing capacity An aid also to planning industryestablishment Predictor functions are not an integral part of model and can be altered easily Simulation model provides much useful information and can be used alone forpredicting volumes
Forests Commission Victoria 601 Bourke Street Melbourne Victoria 3001
RB Smith
120000 ha of regrowth forest predominantly Eregnans and Edelegatensis principally 1939 origin
To define the cutting schedule that maximises the present net worth of the wood resourcesubject to woodflow constraints
Up to 100 years
Stand data including diameter distribution thinning strategy road and transport costs royalty values harvesting constraints
Parametric linear programming to maximise the present net worth subject to constraints on wood flows MASH incorporated several features of STANDSIM
Optimal cutting strategy and wood flows cash flows and present net worth associated with that strategy
The definition of sustainable woodflow levels supply area and broad harvesting strategies
The technique has been successful in broad applications over the resource as a whole There are problems with further application at district level because of change of staff and computingenvironment and intricate rules for operating the model
MASH would be a useful aid in planning the management of a forest of complex structure with respect to age density site quality and species Depends on good inventory and thismay be a drawback Also requires sophisticated computing system which may be adifficulty in applying MASH to developing countries
Weir ICA 1972 Planning of wood production using systems analysis APPITA 26 (2) 107-112
LITERATURE CITED
Johnson KN and Scheurman 1977 Techniques for prescribing optimal timber harvest and investment under different objectives--discussion and synthesis Forest Science Monograph 18
Ware KO and JL Clutter 1971 A mathematical programming system for the management of industrial forests Forest Science 17(4)428-45
35
Operations Research Techniques in the Management of Large-Scale
Reforestation Programs
Joseph Buongiorno DE Teeguarden
Abstract A reforestation planning system for the Douglas-fir region of the Western United States is described Part of the system is a simulation model to predict planta-tion growth and to determine economic thinning regimes and rotation ages as a function of site characteristics initial density reforestation costs and management constraints A second model estimates the expected value of alternative reforestation projects and determines the optimum allocation of scarce resources to these projects via linear programming The applicability of the system to developing countries is briefly considered
INTRODUCTION
This paper describes a system of computer programs developed by the au-thors to assist in the design and selection of reforestation projects Givenan initial set of resource and policy constraints the system permits managers to select the set of reforestation projects to execute the method of refores-tation to employ and the initial stocking in new plantations The system was developed for use by managers of large-scale public land reforestation pro-grams in the Douglas-fir region of the Western United States A more tech-nical and detailed description of the system as well as a discussion of the economic principles on which it is based can be found in Buongiorno and Teeguarden (1973)
Problem Definition
Every year during the months of July and August the reforestation staffof each district of the US Department of interior bureau of Land Management (BLM) in Western Oregon receives a commitment of funds seeds and seedlingsfrom the State Director Given the limited amount of resources and the avail-able land the reforestation plan which best satisfies BLM goals must be prepared The model is designed to answer for each tract of land availablefor reforestation the following interrelated questions
How many acres should be reforested
36
What site preparation should be applied
Is it better to plant or seed
How many trees or pounds of seed per acre should be used
From what sources can necessary seeds or seedlings be obtained
Management Objectives
It was determined that the Bureau of Land Management guidelines are con-sistent with the objective of maximizing present net worth (PNW) under con-straints Some constraints are explicitly stated eg minimum rotation ageallowed on BLM lands minimum number of trees to be maintained on thinned plantations minimum commercial volume extracted from thinning operations Other constraints are implicit These are reflected by the system of account-ing or by the shadow prices used in PNW computations These prices may and often should differ from market prices which cannot be the only basis for public project evaluation although they may be very useful indicators of the supply and demand of reforestation inputs and outputs
System Overview
The reforestation planning system is composed of two main computing pro-grams named FOREST and REGEN (fig 1) FOREST is a simulation model capable of predicting the growth of Douglas-fir plantations as a function of site quality and initial density FOREST also includes optimization algorithms which allow for the determination of optimum thinning regimes and optimum rotation ages as a function of site quality initial density and refores-tation costs given the objective of maximizing PNW under constraints The results obtained from program FOREST are part of the input in program REGEN This second program determines the expected PNW of reforestation alternatives applied to the various tracts of land available The program also generates and solves a linear programming model which describes the interaction of all projects competing for a limited budget and limited stocks of seed and seed-lings The program FINAL simply displays the solution in a form readily under-standable by reforestation managers
FOREST A SIMULATION MODEL FOR MAN-MADE FOREST MANAGEMENT
As indicated earlier PNW maximization under constraints is the guide to making plantation investment decisions FOREST applies this principle in deriving estimates of future plantation yields The management decisions con-sidered by FOREST are (1) initial densities in plantations (2) schedule of intermediate cuttings as the plantation matures (3) rotation age The final output of FOREST is a set of yield tables (fig 2) showing the expected PNW of a plantation as a function of site index initial density of the plantationand establishment costs PNW is always computed assuming that an optimum thin-ning regime and rotation age will be applied to the plantation within policyconstraints specified by the manager
37
Figure 1 Elements of the reforestation planning system
38
Figure 2 Present net worth of reforestation alternatives
39
FOREST is composed of two basic elements The first one simulates the growth of an even-aged stand of Douglas-fir trees The second element models the decisionmaking process (thinning regime and final harvest) Stand growth is determined by modeling the behavior of individual trees Individual tree growth is computed as a function of tree age and competition from neighboringtrees using deterministic functions Individual tree mortality is instead a random process in which the probability of death within a specific time spanis a function of tree age site index and competition Figure 3 shows the behavior of entire stands as predicted by FOREST for three different initial densities when no thinning is applied
The decisionmaking element of FOREST is designed to apply a thinning regimewhich maintains an optimum stocking in plantations ie a stocking such that the marginal value growth of the stand will be equal to the guiding rate of interest used Managerial constraints regarding the minimum volume of thinnings which should be extracted and the minimum number of trees remainingafter a thinning operation may also be specified Thinning regimes obtained from FOREST have often doubled the PNW of plantations FOREST determines the age of final harvest by maximizing soil rent but longer rotations may be specified by the user
REGEN A MODEL FOR PROJECT ANALYSIS AND RESOURCE ALLOCATION IN
REFORESTATION PROGRAMMING
This motel is designed to find the set of reforestation activities which yield the plan of maximum PNW in a given year This is done by defining the set of available alternatives and by representing mathematically the inter-action of all alternatives in their use of common resources
When a tract of land is reforested the following alternatives are avail-able (1) the tract can be partially reforested (2) the tract can be seeded or planted (3) before seeding or planting the site can be prepared in differ-ent ways (4) planting or seeding can be carried at alternative densities (5)the tract can be reforested from seeds or seedlings originating from different zone-elevation classes
The first set of operations in REGEN determines the expected PNW of each available alternative assuming all resources would be available to execute them This is cone from the yield functions resulting from FOREST (fig 2)and from other data describing the characteristics of each tract available for reforestation (including location brush cover slope area site current stocking etc) as well as the alternative reforestation techniques to be considered and their respective cost From these data REGEN determines the expected survival in plantations and the expected PNW of each alternative At this stage a simple ranking of alternatives may yield the optimum program if no resource or a single resource is constraining The ranking criterion used by REGEN may be PNW per acre or PNW per collar of available budget or PNW perpound of seed or per seedling depending upon the constraining resource In general however several resources are constraining The problem of deter-mining the optimum reforestation plan then takes the form of a linear program
40
Figure 3 Predicted and observed survival in plantations
41
in which the objective function is the total expected PNW of the plan while the constraints specify that (1) the stocks of seeds and seedlings originatingfrom each zone-elevation class (2) the available budget and (3) the land area on each tract cannot be exceeded This large linear program is generated and solved automatically by REGEN using user-supplied data on the amounts of resources available The FINAL program lists all projects recommended for reforestation in the current year method of treatment seedling density or original spacing in plantations scheduled for hand planting budget require-ments and quantity and origin of seed and seedlings stock
CONCLUSIONS AND POTENTIAL FOR DEVELOPING COUNTRIES
It has been found in applications that the system presented here may yield reforestation plans whose PNW is 25 higher than what would be obtained byusing simple ranking criteria (eg benefitcost ratios) The gain with re-spect to traditional rules of thumb may be more important However such com-parisons assume that the assumptions underlying the system in particular the system of shadow prices used are correct The reforestation technicians liked the systems simplicity In particular it requires little input A singledata card is sufficient to describe each tract available for reforestation Furthermore the required input is readily available from reforestation re-cords Nevertheless the system ran into implementation hurdles the main one being that data were prepared by field foresters while programs were run at headquarters The availability of remote terminals at field stations should decrease this problem
We believe that the basic methodology should find applications in dev-eloping countries The program FOREST in particular should be useful in deter-mining the economic effect of varying initial density in plantations in com-puting economic thinning regimes and rotation ages and in determining the economic feasibility of man-mace forests Naturally the growth functions used in the program would have to be calibrated to reflect each specific site and species combination Often this will require some informed guessing The pro-gram REGEN may have more limited applications as it was tailored to the situ-ation faced by the Bureau of Land Management in southwestern Oregon In other reforestation projects limiting resources may be very different however the principles of evaluating all alternatives and allocating resources optimallyremain universal Determining appropriate shadow prices for plantation pro-ducts interest rates wage rates and other inputs will be a very important step in a developing country where market prices are unlikely to reflect ade-quately all the objectives of a reforestation project (FAO 1974)
Acknowledgments Preparation of this manuscript was supported by the School of Natural Resources University of Wisconsin Madison and by the College of Natural Resources University of California Berkeley
42
TRACT ZONE-ELEV TREATMENT DENSITY AREA
XXXXX XXXXXXXXX XXXXXXXXX XXXXXXX XXXX
001 1 1 3 803
001 1 1 4 197
002 1 3 1 2000
SEEDLINGS FROM ZONE-ELEV 1 QUANTITY = 100000
SEEDLINGS FROM ZONE-ELEV 11 QUANTITY = 200000
SEEDS FROM ZONE-ELEV 11 QUANTITY = 1500
003 2 3 1 4000
003 2 3 2 1000
SEEDS FROM ZONE-ELEV 2 QUANTITY = 3000
SEEDS FROM ZONE-ELEV 11 QUANTITY = 1500
TOTAL AREA = 800
Figure 4 Example of a small reforestation plan as displayed by
subroutine FINAL
43
LITERATURE CITED Buongiorno J and DE Teeguarden 1973 An economic model for selecting
Douglas-fir reforestation projects Hilgardia 42(3)35-120
Duff G 1956 Yield of unthinned Douglas-fir Corsican pine and ponderosa pine in New Zealand For Res Notes New Zealand Forest Serv Wellington
Food and Agriculture Organization of` the Lnited Nations 1974 An intro-duction to planning forestry development projects FAOSWETF118 FAORome
Reukema DL 1970 Forty-year development of Douglas-fir stands planted at various spacings USDA Forest Service Res Paper PNW-100 21 p illus Pacific Northwest Forest and Range Exp Stn Portland Oreg
44
Wood Transportation Systems-A Spin-Off of a Computerized Information
and Mapping Technique
William W Phillips Thomas J Corcoran
Abstract A computerized mapping system originallydeveloped for planning the control of the spruce budworm in Maine has been extended into a tool for planning road net-work development and optimizing transportation costs A budgetary process and a mathematical linear programmingroutine are used interactively with the mapping and infor-mation retrieval capabilities of the system to determine the allocation and association of wood sources and markets
INTRODUCTION
In December 1975 a short term project (see Appendix) was completed that allowed the computerized mapping of locations and levels of spruce budworm infestation in Maine This conformed to a sampling system employed by state officials whereby data on infestation was taken periodically by a series of sample units each equal to an area of approximately 600 acres Each unit be-came the basis for a data (information) point and it became clear that the map-ping routine offers potential well beyond its original intent It is currentlyin use for the annual state budworm survey (Simmons and others 1976)
Besides the opportunity for additional informational overlays beyond bud-worm infestation indices the relational properties of each unit to another possessed the potential to be mathematically manipulated thus allowing lo-cation strategies of wood origins and potential markets to be correlated veryaccurately and rapidly Transportation phenomena is the focus of the cor-relation Existing road networks have been visually and mathematically re-lated to data points Specific requirements for new roads are integrated onto the overall system and transportation and handling cost formula are available to interpret wood movements strategies in terms of a definable optimum The system is designed to be open-ended in regard to this formulization so as to allow logical choices as to appropriate cost components Algorithms for se-lecting applicable cost configurations depending on the trafficability of various road classes andor transportation means (trucking or rail) have been developed within a framework of resource available and consumption require-ments Mathematical programming offered high potential for selection of
45
optimal transportation strategies These strategies involved not only spe-cifics on the movement of wood but also priority criteria for the resource areas on which to concentrate harvesting efforts when large wood surpluses are in excess of short-term market needs
The budgetary process as well as the mathematical programming routine is directly interactive with the mapping and information retrieval system and is designed to be a sub-system to the overall system Aspects of costing in anycategory of operating expenses for transportation or handling and those ex-penses relating to new roads can be included in the whole system and are re-latable to data points Existing road networks are known by the system and also referenced to specific data points where information on trafficabilityetc can be stored Travel patterns are developed by summarizing data points between any combination of wood origins and wood destinations which are them-selves merely data points Preliminary estimates indicate that the accuracyin measures of various forms of distance exceeds the probable accuracy of maps from which data point references were established New roads are hypothetic-cally constructed between appropriate wood origins and existing roads by log-ical rules internally maintained by the computer system Rapid and precise evaluations can then be made for given market transport possibilities when periodical levels and locations of available wood and of market requirements are offered to the system Optimal strategies can be made available directlyfrom this system which allows ready updating of information on any data point and selection of modes in costing suitable to the planner
The methodology suggested may well have wider application beyond Maine possibly on a regional basis or for other state or provincial areas in North America The techniques are structured so that implementation elsewhere can readily be facilitated and not necessitate a new total effort
THE TRANSPORTATION SPIN-OFF
Since the spacial arrangement of wood origins wood markets and trans-portation networks can be determined from the data organized by map locationit is possible to automatically develop transportation routes from each wood origin (source) to each wood market (destination) where each of these is represented by a map data point Transportation routes are developed so as to minimize transportation costs they assume cost linearity (that is the cost from A to C through B equals the cost from A to B plus the cost from B to C)
The transportation cost is composed of two elements--the cost of buildingnew roads (or transportation networks) and the unit cost of transporting the material over the transportation network New roads are generally costly both to build and maintain therefore in developing routes a goal is to approach a minimum of new road construction This is accomplished by a two-pass com-puter processing of source points During the first pass the closest road is located through an outward scanning of surrounding data points and the straight line distance to this road is calculated The source points are then sorted for reprocessing such that those points closest to a road are processed first During the second pass another search for the closest road is made When it is located a hypothetical new road connecting the source point with the road
46
is added to the map road system by the computer program This hypothetical road then becomes available to subsequent source point processing Although this method does not necessarily yield an absolute minimum amount of new road construction it should closely approximate the minimum
With roads to each source point minimum transportation cost from each source point to each destination can be calculated Computer scanning of mapdata allows transportation networks to be followed Starting from a destina-tion point and successively adding the cost of transporting to all adjacent road points a transportation cost to the destination is determined for all road points including all source points Always extending from the least cost end first produces minimum cost values with a single scanning of road points The cost of transporting to an adjacent point can either be based on a function of distance (as determined from the geometry of the area represented by a data point) or with known costs of traversing a particular area can be uniquelyspecified for each point and thus can include trafficability factors-- egroad quality average speed and traffic load
Following these methods the cost of transporting from all source points toall destination points is determined This information combined with data on wood volumes available at each source and the requirements at each market is fed into a linear programming transportation model to determine allocation and association of wood sources and markets
BACKGROUND INFORMATION
The extent and importance of the wood-using industries in Maine can be sum-arized (for 1973) as follows
(1) Three out of ten Maine workers are employed in the wood-usingindustries
(2) The industries ranked first in value of manufactured product (13 billion dollars)
(3) Eighty-six percent of Maines land area is in commercial forests (17 million acres)
(4) A total of 314 million cords of pulpwood was harvested with 56 of this in spruce-fir For sawlog harvest the total was 354 million board feet with 57 in spruce-fir
Approximately one-third of the States forest area is currently under the threat of spruce budworm devastation The epidemic can be expected to produce high mortality particularly in balsam fir and to a lesser degree in spruceif adequate control measures are not forthcoming Trees that succumb to the insects attack must be harvested within a two- or three-year period or the physical deterioration of the wood will be too advanced to allow its com-mercial use The timing of a planning effort becomes more critical consider-ing that the area represented to be approaching an epidemic stage contains ata minimum a twelve-year supply at Maines current wood consumption levels
47
Under normal harvesting procedures species present in a forest stand with fir and spruce and not affected by the budworm would also have to be removed with economical wood handling and transportation methods
Preliminary study by the Corps of Engineers on the feasibility of a majorhydroelectric project in Maine was begun this past year The associated dam and its head waters will take out of production thousands of acres of Maines timberlands Agents of the Corps of Engineers have already contacted this investigator for estimates on the market potential of salvaged timber and for information on harvesting-transportation problems relating to the salvageThese estimates represent only preliminary appraisals actual planning will eventually be required if the timber area is to contribute effectively to thisStates wood resource requirements
Considering the potential for an evaluation system such as those discussedhere at least three areas of immediate concern are benefited These include planning in regard to wood flow within the region
(1) As typical yearly wood consumption patterns are encountered
(2) As wood surplus resulting from budworm devastation occur
(3) As timber area losses in hydroelectric development are considered
The need to expand the opportunities for systematic evaluation of wood movementstrategies is most timely as the concerns for wood utilization especially in light of the budworm and the hydroelectric development are and will surelyremain key issues in the State of Maine in New England and in Eastern Canada for the remaining years of this decade
Models developed from the proposed investigation are not intended to be useful solely in the shortterm as suggested by problems like the budworm and developments that affect large forest acreages nor will they necessarily re-main local in the spread of their use Their nature fully dictates that theycan find application in the evaluation of transportation aspects inherent in marketing strategies of a long-term nature The techniques utilized if not the data structures should prove of value to other regions as well
PREVIOUS STUDIES
Past efforts of a statewide scope have proved fruitful in understandingwood distribution and the means thereof (Corcoran 1964 Schroeder and Corcoran 1965 Corcoran and others 1966) These particularly focused on truck-supported wood movements and included not only descriptive information but system planning pertinent to the times Forest road location theory continues to be advanced (Ashley and others 1973 Corcoran 1973) Appraisals of the current situation are available in regard to enterprises that produce Maines wood supply (Corcoran and Sarna 1973) to computer-based mapping routines (Phillips and others 1976) and to export market potential (Corcoran 1976)Wood movement strategies have also been explored in regard to general models
48
for regional applications (Holland and Judge 1962 Thompson and others 1968Anderssen 1971) and to the budgetary planning of a single firm (Bartelheimer 1973 Sowell and others 1975 Newham 1975 Wimble 1975 Bailey 1973) Mappingby computer has found favor in recent years (Harding 1973 Nez 1971) espe-cially for visual descriptions of use patterns vegetative cover and urban planning schemes However those for the most part were subjective in nature and have not taken advantage of mathematical potential inherent in a computer-based system Numerous other works could be listed that are commonly known and well documented in established computer bibliographies on operation-research (Martin and Sudak 1973 Field 1974) and on the budworm itself (Corcoran and Simmons 1975) Information systems and decision theory have been explored by many authors within a workshop format (Stone and Ware 1971)and in a publication supporting needs for an information bank (Wolf 1970)Information systems pertaining to Maine have received international attention (Corcoran and Simmons 1976 Corcoran 1976)
APPENDIX
Effective planning for control of the spruce budworm in Maine requires knowledge of the distribution of the budworm as well as the condition and sus-ceptibility of the trees in the areas of infestation Currently a hazard rating based on sample measurements of such factors as previous damage currentdefoliation tree vigor and egg mass density is calculated for various local-ities throughout the state A map of the state showing the location and hazard rating of each of the sampled points is prepared and areas of infestation are marked These provide a visual indication of the distribution of budworm threat to the forests of Maine and allow planning of such activities as spray-ing and salvage
In order to facilitate the production of these maps a computer program has been developed which will produce maps of the state on a computer line printer The state is divided into small sections corresponding to the state fire control divisions These sections are subdivisions of the US Geological Survey 15-minute quadrangle maps and are found by dividing each of the USGSmaps into 9 blocks and each block into 25 sections each 1 minute by 1 minute Thus a section is 1225th of a USGS quadrangle and covers approximately591 acres
A two-dimensional array is allocated within the program storage with each cell corresponding to one of the sections of the state The section of the state in which the sample was taken along with the data collected is fed into the program The rather complex designation of USGS quadrangleblock and section used in the field is converted by the program into a two-value designation indicating the row and column of the section within the stateand thus the cell of the array corresponding to the location This simpli-fication allows adjacent cells to be easily determined and examined The pro-gram calculates the hazard rating from the data and stores the computed value in the appropriate cell within the array Both the array of computed hazard ratings and the original data for additions and further analysis can be saved
49
From the data stored in the array requests can be made to print all or portions of the state Increasing integer digits indicate increased hazard value Cells which fall inside the state boundary are distinguished from those that do not This allows the portions of the state not sampled to be indicated by a printed character or characters while areas outside the state are void of such characters
The size of the map produced may be varied by specifying a scaling factor The smallest (largest scale) map produced uses one character to represent a single section This map is approximately 27 inches wide by 34 inches longwhen the entire state is printed Because the spacing on a printer is rela-tively fixed the small map distorts the state slightly making it an averageof 14 wider than it should be For most applications this level of distor-tion presents no problems since a general feeling for spatial distribution is the primary goal Specific locations can be determined from grid coordinates and the USGS maps if required The distortion can be virtually eliminated if a larger map is formed using multiple characters to represent one section This could have the additional benefit of allowing more than one piece of in-formation about a sector to be printed on a map Any of these maps may ofcourse be reduced to a more convenient size through photoreduction techniques
Although the current program would only replace the manual system beingused at present several factors make this system more desirable One is the speed with which maps can be produced This will allow the production of pre-liminary maps as the data is collected These could then be used to help de-fine areas which require more sampling to delineate spray salvage or other boundaries
Another factor is the capability for future expansion existing in the system Among some of the more interesting possibilities are extensions which would allow any specified linear combination of the current or previous years hazard rating factors to be mapped This could be used to compare visuallythe distribution of such factors as previous damage and current infestation level which might provide insight into changing trends in infestation Com-parisons of linear combinations of current and previous years samples might be used to refine the formula used to compute the hazard rating Another possibility for extension is the inclusion of fixed information about a section Such information as forest cover type might be used to modify the hazard rating The inclusion of information on road networks and market loca-tions would be used to determine the most economical and efficient salvagelocations and transportation routes in the event of high losses
A second potential capability is use of the system to display a variety ofother forest-related surveys Other forest insects and forest diseases could be mapped annually from annual survey data Annual tree mortality data could be mapped as well as forest age data or for that matter any resource data base covering the state or portions of the state Such a system might even-tually form the basis of a general resource data base display system for the entire state of Maine
50
Acknowledgments This project has been financially supported in part bythe US Department of Agriculture under Research Agreement 23-678 (Cooper-ative Agreement 16 USC 581 amp 581a-581i Northeastern Forest Experiment Sta-tion US Forest Service and the University of Maine at Orono)
LITERATURE CITED
Anderssen Stig 1971 Long-range planning of forest operations Skogsarbaten Ekonomi 2E 1971 Stockholm Sweden 8 p
Ashley Marshall D Thomas J Corcoran and James C Whittaker 1973 Remote sensing modifications for optimized logging road networks ASAE Trans 16(6)1044-1047
Bailey GR 1973 Wood allocation by dynamic programming Can Forest Serv Publ 1321 19 p
Bartelheimer P 1973 A model for the cooperation of a forest enterprise with a wood processing firm In Proc 1973 Plann Control Symp Int Union Forest Res Org [Frieburg Germany] 9 p
Corcoran Thomas J 1964 Scheduling of pallet trucks in pulpwood opera-tions a linear programming application Maine Agric Exp Stn Tech Bull T-7 22 p
Corcoran Thomas J 1973 A FORTRAN program for spacing optimization of logging roads and landings under flatland assumptions Sch Forest Resour Univ Maine Orono Tech Note 56 13 p
Corcoran TJ 1976 A briefing on the Scandinavian scene and its markets 19 p Amer Pulpwood Assoc 76-P Washington DC
Corcoran TJ 1976 Information retrieval systems and a technical associations need for dynamic information on wood-producing organi-zations Proc 16th Cong Div 3-CG4 Int Union Forest Res Org[Oslo Norway June 20-25 1976] 7 p
Corcoran Thomas J and Rudolph P Sarna 1975 Wood producer survey and an information system 24 p Amer Pulpwood Assoc Paper 76-P-2 Wash-ington DC
Corcoran Thomas J D Schroeder and D Thompson 1966 An evaluation of the distribution of trucked pulpwood in east-central Maine - a linear programming application Maine Agric Exp Stn Bull 640 11 p
Corcoran TJ and G Simmons 1975 A computer-based bibliography on spruce budworm Sch Forest Resour Univ Maine Orono
51
Corcoran TJ and GA Simmons 1976 A map-based computer storage and re-trieval system for state-wide information on spruce budworm infestations and marketing opportunities from resulting timber mortality areas Proc 16th Cong Div 3-CG4 Int Union Forest Res Org [Oslo Norway June 20-25 1976] 7 p
Field DB 1974 Applications of operations research to quantitative de-cision problems in forestry and the forest industries--a bibliographyYale University Sch For Environ Stud 30 p
Harding RA 1973 GRIDS works for DNR Dep Nat Resour Rep 25 State of Wash 48 p
Holland II and GG Judge 1962 The spacial structure of the lumber industry estimated interregional flows and price differentials Univ 111 Res Rep AERR-52 41 p
Martin AJ and PE Sudak 1973 Operation research in forestry - a bibliography USDA Forest Serv Gen Tech Rep NE-8 90 p Northeastern Forest Exp Stn Broomall Pa
Newham RM 1975 LOGPLAN - a model for planning logging operations 59 p Forest Manuf Inst Inf Rep FMR-X-77 Ottawa Ontario
Nez George 1971 A composite mapping system for practical location re-search Off Plann Program Support Econ Dev Adm Commerce DepWash DC 31 p
Phillips W G Simmons and T Corcoran 1976 Spruce budworm and a computer-based mapping and information retrieval system Maine Forest Rev 913-15
Schroeder D and Thomas J Corcoran 1965 Distribution patterns for pulpwood harvested in east-central Maine Maine Agric Exp Stn Bull 630 44 p
Simmons GA W Phillips and T Corcoran 1976 Computer mapping and processing spruce budworm survey and related data--1974 and 1975 16 p Amer Pulpwood Assoc Paper 76-P-8 Washington DC
Sowell RS TJ Corcoran and AW Anderson 1975 Mathematical programming system (MPS360) - concept and applications ASAE Trans 18(3)591-595
Stone RN and KD Ware (ed) 1971 Computer and information systems in resource management decisions In Proc USDA Forest Serv and Coop StateRes Serv [ Wash DC July 1971] 130 p
Thompson EF WB Tilghman PH Hoephner and DP Richards 1968 Linear programming over time to establish least-cost wood procurement procedures Va Polytech Inst Res Div Bull 29 70 p
52
Wimble AW 1975 The development of a hypothetical linear programmingmodel for the analysis of whole tree chips In Financial management of forest resources [Proc Sem New Orleans Louisiana] 21 p
Wolf Charles H 1970 A study of plant location procedures and the need for a data bank in West Virginia Appalach Center Res Series 15 96 p
53
Optimal Control of Raw Timber Production Processes
Ivan Kolenka
Abstract This paper demonstrates the possibilityof optimal planning and control of timber harvesting activ-ities with mathematical optimization models
The separate phases of timber harvesting are represented by coordinated models which can be used to select the optimal decision for the execution of any given phase The models form a system whose components are connected and controlled by means of information flows
A mathematical model is presented for the optimal plan-ning of harvesting activities for the forest enterprise The use of a mathematical model contributes to the balancingof supply and demand to the coordination of forest manage-ment plans with other activities of the national economy andfinally to the minimization of production costs
INTRODUCTION
Planning in Czechoslovak forestry has a long tradition and is highly de-veloped The present stage of development of the society imposes demands on the planning and control of production processes in the form of requirements for maximum utilization of production sources and for meeting the demands of the society In the process of planning and control it is necessary to follow the efficiency principle which states that (a) the planned yield must be ob-tained at the lowest cost or effort or conversely that (b) the highest yield is to be obtained from given resources
This type of planning and control requires a well-elaborated information and decision system and the use of advanced techniques for the transfer and processing of information
PROBLEMS
In this paper I shall deal with the processes of decision in planning and control of harvesting and point out the possibilities of utilizing the opti-mization models of operational research for the selection of the planningalternatives
54
The harvesting of timber in the context of Czechoslovak forestry repre-sents a complex system and requires the solution of several problems Each country has its specific conditions and requires a different approach to the formulation of the task Generally it is necessary to recognize that mathe-matical models cannot be based upon the principles of maximum utilization of the forest for this would result in the decrease of its permanent production capacity and would simultaneously affect the biological balance adverselyWith long-term planning models it is necessary to consider this principle inthe formulation of the mathematical model In short-term models this prin-ciple is observed by insuring that the forest management plan (decennial plan)is constructed so as not to allow the decrease of the production potential of the forest
The harvesting of timber is divided into felling gathering at landingsprimary conversion (production of wood assortments) and hauling of timber The structure of the harvesting process is illustrated in figure 1 Each stage of timber production is represented by coordinated models leading to theselection of the optimal decision at a given stage
The models form a system of components connected by information flow in such a way that the output from one motel represents an input into a lower model To date some of the mathematical models have been used in planning(eg optimal control of timber hauling) others have been theoreticallyvalidated or are in the process of being tested
MODEL FUR SHORT-TERM PLANNING OF HARVESTING ACTIVITIES
The model solves the problem of optimal scheduling of quarterly harvestingactivities and of controlling the management of the gravitational areas of forest enterprises Gravitational areas consist of a collection of stands which form a contiguous area and which have approximately the same production conditions The annual tasks in each stand are given by the forest management plan and the sum of these tasks represents the annual tasks for the gravita-tional area
The mathematical model for short-term planning of cutting activities must fulfill the following conditions
Coordinate sustained harvesting activities with the demand for timber assortments as specified by contracts between supplier and customers
Recognize the limited availability of labor
Take into account the capacity of landings with respect to the loggingtechniques available for gathering timber at landings
Concentrate as much as possible the harvesting and the silvicultural activities in each gravitational area
55
Figure 1--Structure of the timber harvesting process
56
Elaborate quarterly plans which minimize the costs of harvesting and of other management activities
This task can be formulates as a linear programming model
Minimize z = Σ ijk gijk xijk + Σijp rijp yijp + Σijl uijl zijl
Σ i xijk = ajk
Σ ip yijp = bj
Σ i zijl = cj1
Σ j fijp yijp le Fip
Σ j xijk ge sik
xijk yijp zijl ge 0
for j = 1 2 n k = 1 2 3 4
for j = 1 2 n
for j = 1 2 n 1 = 1 2 g
for p = 1 2 m i = 1 2 3 4
for ik = 1 2 3 4
Additional relations determining the levels of yijp must be specified to
represent the particular types of management practiced
Notation
xijk - volume harvested of assortment k in period i from area j
yijp - timber logged in m3 with method p during period i in area j
zijl - silvicultural activities 1 carried out during period i in area j expressed in various units (ha km etc)
ajk - annual volume requirement in m3 for assortment k from area j
bj - annual target volume logged--by all methods-in area j
cjl - annual target for silvicultural activity 1 on area j
i - quarter of the year i = 1 2 3 4
j - gravitational areas j = 1 2 3 n
p - kind of logging method p = 1 2 3 m
57
k - combination of the type of harvest and species group (egfinal-coniferous k = 1 intermediate-coniferous k = 2 etc)k = 1 2 3 4
l - kind of silvicultural activities 1 = 1 2 g
Fip - available inputs for logging with method p in period i
fijp - quantity of input per m3 required to log with method p inperiod i and area j
sik - total volume required by the sale plan in quarter i for the kth combination of type of harvest and species group
gijk rijp uijl - coefficients of objective function giving the costs for technical unit according to the kind of silvicultural activity
Because the planning problem has been specified as a linear program it is relatively easy to solve it with a computer in spite of the large dimension of the linear program required under real conditions
The planning problem is specified as a deterministic model in spite of the stochastic characteristics of forest production This shortcoming of the model may be compensated for by solving the model for various values of the coefficients of the LP matrix or of the objective function
A mathematical model requires information which can be divided into tech-nical and economic parameters The technical parameters include the knowledgeof possible technological alternatives for work procedures available re-sources or capacities and scheduled means of production Economic parameters represent data on costs which vary with the location of the activity and its technical characteristics
To obtain all the necessary information for the model usually requires changes in the information system Our present experience indicates that the information system must be developed concurrently with the mathematical model
CONCLUSION
The use of this mathematical model contributes the following positive elements to planning
It balances the requirements of production and technical means and workers available
It balances the sources of wood with the wood assortment requirements of the national economy
It coordinates the distributing of production over time with the require-ments of national economy
58
It realizes the plan specification at minimum costs
The results which we have obtained establish the possibility of planningand controlling production in forestry These results also indicate that byusing operations research models planning and control can be made more effective
59
Large-Scale Budget Applications of Mathematical Programming
in the Forest Service
Malcolm Kirby
Abstract Mathematical programming applications in the Forest Service US Department of Agriculture are growing They are being used for widely varying problems budgeting lane use planning timber transport road main-tenance and timber harvest planning Large-scale applica-tions are being mace in budgeting The model that is des-cribed can be used by developing economies
INTRODUCTION
Two modern techniques of optimization that can be applied to complex resource problems are ADVENT (Kirby and others 1976) and the Eldorado model (Bell and Kirby 1971 Kirby 1971a 1971b) They are so closely related that it is convenient to refer to both as the model the basic premise is that land management requires more than one input (men money) and usually results in more than one output The model uses linear programming to handle trade-off relationships and to evaluate the effects of imposing or relaxing levels of inputs outputs or both The management objectives for the model were to prepare a budget request relating outputs to inputs and once funds are allo-cated to select projects that will either meet a set of output goals at mini-mum cost or will maximize a selected output (Bell and Kirby 1971)
Traditionally work planning in the National Forests was based on specific resources functions timber range recreation watershed etc Each function used its funds to maximize specific outputs Through so-called multiple use coordination the effects of one function on anothers outputs were considered but seldom explicitly evaluated But the model does this explicitly and this is what makes some managers uncomfortable with it It requires that goals be stated in specific terms animal unit months (AUM) of forage rather than acres reseeded cubic feet of timber produced rather than acres planted specific ef-fects on all outputs as a result of building a rout rather than miles of road built
A list of outputs from a typical National Forest include timber recrea-tion water wildlife grazing and livestock grazing In addition there are
60
miles of spectacular scenery numerous lakes miles of fishing streams wilder-ness power houses summer homes ski resorts irrigation canals roadstrailsdams pipe lines organization camps and other sundry special uses such as atemporary high altitude training camp for the Olympics
National Forest planners are faced with three limitations limited landlimited funds and pressures for fulfilling the needs of an ever-increasingpopulation The planning problems are very complex Goals include meetingthe demands for outputs and maintaining the local economies maintaining a trained work force and maintaining the productivity of the larva
Work done on National Forest lands requires multiple inputs--land and money(let money here represent tools equipment supplies and manpower) These in-puts result in multiple outputs--forage water (both quantity and quality)soil stability or erosion camping picnicking fishing hunting timber growth and timber cut There are also more nebulous outputs (or effects)such as aesthetics fire risk air quality and so on These effects vary de-pending on the productive capability of the land the primary purpose of the work being done the methods used and the spatial position of the land beingtreated
The model is used for preparing proposals either for one or more future fiscal years or for the fiscal year that is about to begin It is now beingused for both budgeting and long-range planning at the local and national lev-els We have also used ADVENT for trade-off analyses in land use planningwhere long range timber yield considerations are not important
The model is designed to generate a large number of feasible alternative programs The design criteria are that the model be multiple-output orientedable to generate alternative programs that are feasible able to report the future implications of various alternatives and able to generate optimal al-ternative programs on the basis of output-oriented criteria
PROBLEMS IN INPLEMENTATION
Some of the problems in implementing such a model are these
People To begin with when you say here is a better way to pre-pare a budget request you have insulted those who have been follow-ing another system for a number of years They have two reactions Whats wrong with the way weve been doing it and Show me
Data The amount of data needed for a complex mathematical model is formidable Everything must be reduced to numbers
Goals They must be specific and quantifiable narrative statements cannot be used The manager may have to use hunches in interpretingthe results but the model cannot
The people problem is very real There is a generation gap between the topmanagers and a fast-growing group of mathematicians and economists Managers
61
are not used to thinking in terms of abstractions It behooves both the teach-ers and the practitioners to take the time and effort to strip away the mys-tery interpret the jargon into terms that can be understood forget the theory and show by actual examples what is meant If we seem to labor this point it is because we fear that if young people exposed to new methods and techniques do not recognize the problem they will be frustrated when their ideas are not received with enthusiasm
The land manager can have faith that these models work with great mathe-matical accuracy However he should scrutinize the figures make sure theyare correct and test the final answers on the basis of reasonableness
What about data After all these years of research we do not have all the information needed For example we have fairly reliable information as to the effect of a specified thinning regime on the volume growth of timber over time when we know the site class What we do not always know is the effect of the thinning on the forage output for domestic or wild grazing animals or the effects on water runoff or the tons of fuel per acre resulting from one thinning operation or whether leaving the slash on the ground is more beneficial for protecting the site than it is detrimental as a fire hazard During the development of the Eldorado model we reviewed nearly a thousand research papers and found less than 20 that were helpful in assessing effects on more than one output
What about goals Traditionally managers set goals in rather general terms--for example meet the allowable cut thin 1000 acres eradicate 500 acres of sagebrush build 5 miles of fence The model requires goals that are related directly to outputs such as cubic feet of timber growth AUMs of forage produced or tons of soil per acre that would remain in place if a pro-tective fence were built Specific goals such as these are very difficult to set The output goals that we considered included the following
Timber Cut Water QualityTimber Growth Soil StabilityTimber Regeneration Recreation Environment Livestock Grazing Recreation Visitor DaysWildlife Grazing Fire Hazard Reduction Water Runoff Fire Accessibility
The manager who is comparing two alternative forest-wide programs can scan the computer printouts and decide if one program is better or worse than the other and if the increase in output is worth the decrease in some other outputInasmuch as output information is limited at this time he cannot make his de-cision on the basis of actual physical outputs alone
BASIS FOR DECISIONS
Some managers are uncomfortable with the model because there is no singlecriterion that indicates the best choice To overcome this drawback some economists suggest converting everything to dollars and selecting projects based on benefitcost ratio or present worth or internal rate of return etcThis approach would be ideal except for four problems
62
Difficulty of measuring all of the desired outputs for each projectDifficulty of assigning dollar values to all of the outputs The specific statement in the Multiple Use Sustained Yield Act that the management of National Forest lands is not to be based upon thehighest dollar return The non-uniqueness of dollar values which give the same answer
There are many kinds of values--for example market value consumer value (a willingness to pay) producer value (the cost to produce) increasing gross national product monopoly revenue value and expenditure value Whaley (1968)defines six different value methods he points out that the value system must be appropriate for the model must use the same method for achieving values for all outputs and must allow the values to be empirically quantifiable The point is that since so many different kinds of values exist the absence of a value system means the choice of method for valuing outputs can be rather arbi-trary To date such a system has not been adopted for the Forest Service
What then is the basis for decisions Again Whaley (1966) lists four measures of program effectiveness which may be used in public resource man-agement meet established production goals at least cost establish the bud-get level and maximize some outputs claim that no rational solution exists (we dont make this claim) and maximize economic development The Annual Budget Model and ADVENT were designed for using any of these measures There-fore when values for outputs are developed by any value system they can be easily employed in the model Regardless of the managers value systems he still needs alternative programs from which to choose and the model makes it easy to generate alternative programs The models simply process informationbringing into focus the sociological economic and organizational consequencesof alternative decisions The final selection rests with the land managersand Congress who must weight the socio-economic and political impact of their decisions
The linear programming part of the model can carry out the following steps
(1) determine whether or not the problem can be solved (2) if it is solvable give an optimum solution (3) allow constraints of outputs money manpower activity types(4) maximize an output for a given budget or provide a specified
output level at minimum cost (5) provide a budget which includes all the costs of the various
projects
ADVENT also has a goal programming option to minimize the deviations from a set of goals or targets
The model has reporting capabilities to transform the original data into a series of abbreviated reports or complete reports as desired by the manager Information available for each solution includes manpower needs by skills bysub-units money needed list of projects selected and list of total outputs
One of the drawbacks in the opinion of some managers is that using it re-quires that more work be planned than there will be money to do This repre-sents extra effort which in times of tight budgets seems useless Extra pro-jects must be provided or there is no choice Another drawback is that the
63
time frame of 1 year is too short This is admittedly a disadvantage but bud-geting particularly fund allocation is a year-to-year process As alreadypointed out there is a shortage of estimates of multiple outputs and rela-tive effects are an unfamiliar substitute The model requires that goals be set in quantitative terms This has proved difficult at first
Positive advantages of the model are that it considers the joint effect of inputs on outputs it gives the manager a tool to explore a series of alter-natives and it focuses attention on specific measurable goals rather than broad overall objectives
NUMERICAL EXAMPLE
To illustrate how the model works let us consider a small hypothetical numerical example of eight projects as follows
Item 1 2 3 4 5 6 7
Land management and administration Expenditures (million dollars) 2 3 3 2 4 2 4 4Manpower (man-years) 100 100 100 50 300 100 100 100
Road construction aria maintenanceExpenditures (million dollars) 7 6 3 1 1 3 2 3Manpower (man-years) 200 100 100 100 100 200 100 100
Timber- for the next decade Average annual cut (1000 bd ft) 8 9 8 7 5 4 5 2Average annual net growth (1000 bd ft) 9 9 8 7 6 5 5 3
Benefits and costs Total value of output (million collars) 28 27 15 6 9 8 8 7Total expenditures (million dollars) 9 9 6 3 5 5 6 7
Administrative priority rating 1 1 2 3 5 4 5 5
Suppose we wish to select a project mix that meets the following specifications
(a) Include project 1 because it is already under contract (b) Include all projects with priorities 1 and 2 (c) If project 7 is included project 8 must also be included and
vice versa (d) Do not permit both projects 5 and 6 one or the other but
not both (they are close substitutes)(e) Achieve a minimum level of timber growth of 4(f) If there is a tie then choose the combination of projects
that minimizes total land management costs
64
8
(Note that in addition to constraining the level of individual inputs and out-puts or their combinations the user can control individual projects or their combinations)
The solution is as follows
Project No 1 2 3 4 5 6 7 8
Percentage Yes Yes Yes Yes No Yes Yes Yes
The solution is presented below in the format of one of the 22 reports which can be prepared with ADVENT Both the input data and the information contained in the LP solution can be displayed in these reports The user can also employ ADVENT in a pure simulation mode by selecting a set of projects on the basis of experience and intuition and call for a report detailing the corresponding costs revenues outputs activities manpower requirements etc
ADVENT report corresponding to the LP solution of the numerical example
PROJECTS SELECTED
AGGREGATE WORKACTIVITY DESCRIPTION
PLANTING amp SITE PREPARATIONSLASH REDUCTIONPRECOMMERCIAL THINNINGTIMBER SALES PREPARATIONROAD MAINTENANCEROAD CONSTRUCTION
AGGREGATE OUTPUT DESCRIPTION
DISPERSED RECREATION USETIMBER HARVESTEDTIMBER SOLD WILDLIFE HABITAT IMPROVEMENTVALUE OF TIMBER HARVESTED
AGGREGATE COST DESCRIPTION
TOTAL EXPENDITURESTOTAL ROAD CONSTRUCTION amp MAINTENANCETOTAL LAND MANAGEMENT amp ADMINISTRATION
AMOUNT
600 ACRES 1000 ACRES 400 ACRES
2000 ACRES 300 MILES 75 MILES
AMOUNT
20000 VISITS 80000 MBF 85000 MBF 5000 ACRES
47000000 $
AMOUNT
50000000 $ 25000000 $ 25000000 $
65
MATHEMATICAL FORMULATION
For the reader interested in the mathematical formulation we present a simplified version of the linear programming problem
maximize Σj djxj subject to
Σj aij xj ge fi i = 1 2 I
Σj ckj xj le bk k = 1 2 K where
xj = 1 if the project is selected and zero otherwise
aij = amount of the ith output per unit of xj
ckj = amount of the kth input per unit of xj
fi = constraint on the total amount of the ith output
bk = constraint on the total amount of the kth input
I is the set of output categories
K is the set of input categories
and where dj may be chosen as
aij if the ith output (eg timber growth) is to be maximized
or
-ckj if the kth input is to be minimized
or
-Σ KξK ckj here K is a subset of commensurable inputs such as costs or manpower
The term dj may also be specified as the discounted or undiscounted total net
revenue
Note that the problem is formulated as an integer program but it is solvedby means of a linear programming routine The reason is that the solution gen-erally turns out to be an excellent approximation to the integer solution and the computer time is very short compared to the time required to solve the cor-responding integer program It is this feature that makes ADVENT a practical tool for widespread use A discussion of why these approximations work as theydo may be found in McConnen and others
66
CONCLUSION
ADVENT can be used by developing economies for both budgeting and longrange planning It has been tested in many different uses over more than 4 years by more than 50 organizations The models flexible design permits other planning applications such as road maintenance capital investment analysis project selection and other trade-off analyses It is designed for use by relatively unskilled users of computers The cost of a typical com-puter run for 400 projects is about $50
REFERENCES
Bell F and M Kirby 1971 An example of optimization techniques in land Management The Eldorado model Forest Service US Dep AgricBerkeley Calif
Kirby MW 1971a An overview of program budgeting on a National Forest Forest Service US Dep Agric Berkeley Calif
Kirby MW 1971b The methodology of program budgeting on a National Forest The Eldorado experience Forest Service US Dep Agric BerkeleyCalif
Kirby MW 1974 A model for allocating roar maintenance funds [ Unpub-lished paper on file Pacific Southwest Forest and Range Exp StnBerkeley Calif]
Kirby MW D Wegner L Visser 1976 ADVENT A users guide 2nd Edition Forest Service US Dep Agric Berkeley Calif
NcConnen R M Kirby D Navon 1966 A planning programming budgetingsystem for National Forest Administration [ Unpublished report on filePacific Southwest Forest and Range Exp Stn Berkeley Calif]
Whaley RS 1968 Multiple use decision-making where do we go fromhere [Unpublished report on file Rocky Mountain Forest and Range Exp Stn Fort Collins Colo]
67
Forest Management Planning for Timber Production A Sequential Approach
Krishna P Rustagi
Abstract Explicit forest management planning for timber production beyond the first few years at any time necessitates use of information which can best be des-cribed as suspect The two-step approach outlined here concentrates on the planning strategy over the next few years without losing sight of the long-run productivityFrequent updating of the long-range and short-range plan makes it possible to keep a dynamic posture Instead of one single objective of maximization of discounted present net worth there are two objectives The short-run object-tive implicitly maximizes the volume or the discounted pres-ent net worth of timber harvested curing the first rotationsubject to equal area constraint the long-run objective explicitly maximizes the rate of return to the land either as timber volume (MA1) or annualized land rent The reduced size of the two problems makes this approach extremelypractical
INTRODUCTION
Timber management planning essentially involves decisions on two basic issues temporal and spatial scheduling of harvest during a planning period and the reforestation strategy that is to follow each harvest The former provides the amount of timber and income flow during the planning period Thelatter does much more It indicates the flow of timber and income one rota-tion in the future the needed reforestation investment curing the planningperiod and the rate of return to the land under the proposed alternative(s)These short and long-run flows are shapes by the management objectives spa-tial distribution of growing stock and restrictions if any on the level ofharvest andor reforestation activities
Combining harvest scheduling with reforestation planning in one model putsheavy demand on the information needs Not only are yield stumpage priceand reforestation and other costs needed for each stand but the same informa-tion must be projected for several decades and perhaps centuries The net result is an excessively large model and less than reliable input
68
If the forest schedule can be separated from the reforestation plan the resulting two models would be relatively small and need far less data The net result operatively practical models with better control on the qualityof input at far less effort The two-stage sequential approach is an attemptin this direction
UNCONSTRAINED OPTIMIZATION
The economic management objective is usually taken as a maximization of discounted present net worth over a number of rotations If there are no restrictions on the level of activities the same result could be accomplished by setting up a performance standard for each stand and evaluating its perform-ance against this standard Stands which are performing poorly should be har-vested and reforested with the alternative(s) which maximize soil expectation value (SEV) Mathematically a stand should be harvested if
MR - iR lt i(SEV)
Where
MR = marginal value growth in a stand if its harvest is postponed for one year
R = current value upon harvest
i = interest rate
SEV = maximum soil expectation value possible on that site under the given reforestation alternatives
Although this criterion for harvest scheduling looks innocently simple itis extremely difficult to apply in practice The value growth MR is affected by volume growth timber quality improvement (better diameter height and tree form) and appreciation (or depreciation) in stumpage prices due to inflation and cycling in economy In addition both R and MR are influenced by the price elasticity of stumpage demand
Adoption of this criterion would maximize the long-run discounted present net worth for the entire forest without actual use of a sophisticated model It may be pointed out however that if the forest is unbalanced to start with the uneven or interrupted yearly (or periodic) flow of timber will be perpetuated
CONSTRAINED OPTIMIZATION
In public and industrial ownerships certain restrictions are imposed on the level of activities in order to ensure long-run sustained flow of timber These restrictions usually result in regulation of harvest by equal volume or area over time Though restrictions of any kind would reduce the total dis-counted net present worth volume regulation tends to be more restrictive and gives rise to the spectacular but controversial allowable cut effect
69
(Schweitzer and others 1912) Further it is impossible to obtain strict even flow due to a variety of reasons including unbalanced initial forest struc-ture impreciseness in the estimation of growth and yield over time changes in utilization standards and technology and changes in the management intensity
Area regulation would also produce fluctuating harvest during the conversion period (first rotation) but ensure more predictable and sustainable long-term harvest Other advantages of area regulation include predictabilityand stability of reforestation investment and overall management-related activities
Linear programming models are often used for constrained optimization (Navon 1971 Clutter and others 1968) Nautiyal and Pearse (1967) also presented a theoretical model for maximizing discounted present net worth subject to area regulation Though theoretically correct these models are not very practical because of huge data needs and immense problem size Past experience has indicated that precise estimation of yield and growthoperations costs stumpage prices and interest rates are not possible beyond afew years and yet these models require this information for at least one rotation and often for more than a century
In view of this some real questions may be raised How sophisticated should a model be when the data cannot be obtained with any degree of reli-ability how intensively should such data be used by the model How far into the future should the planning horizon extend Obviously the sophistication of the model should match the sophistication of the data input if the data needs can be reduced both with respect to time and space it may be possible to direct more attention to the data collection effort thus improving the overall planning
THE SEQUENTIAL APPROACH
If the management planning problem is partitioned into two componentsthese would be (a) harvest and thinning scheduling and (b) reforestation planning In the sequential approach these two components are handled one at a time
Harvest scheduling is a disinvestment process and focuses primarily on timber and cash flow during the planning period The entire existing volume in a forest together with its growth is to be harvested before the first planned reforestations mature Any harvest scheduling strategy may be used between the performance standard approach at the one extreme and equal annual (or periodic) volume at the other extreme Because of its focus on output andincome in the near future harvest scheduling may be termed short-range planning
Reforestation implies deliberate investment of capital with land The focus here is on productivity and profitability of investment which will be realized one rotation in the future The level of investment in reforestation coupled with the productive potential of the forest lands essentially deter-mine future productivity and profitability Because of its long-range (beyond first rotation) implications reforestation planning may be termed long-rangeplanning
70
The objectives and data needs for the two components are entirely differ-ent In harvest scheduling information is needed by individual stands which may be characterized by species site age stocking and accessibility Both quantitative and qualitative data on yield and the expected stumpage prices are needed for each stand and each year of the conversion period It will be shown however that the yield and stumpage price information may be needed only for a subset of all stands and only for a fraction of the conversion period
The data needs for reforestation planning involve only operations after harvest These include reforestation cost expected total yield and stumpageprices for likely species management regimes and rotation lengths Onlyclassification of the forest area needed here is by site accessibility and perhaps conversion costs
Two assumptions are the basis for this sequential approach (1) thefuture rotation determination is not influenced by the existing growing stockand (2) the proposed reforestation planning must be optimal independently of the harvest strategy used These two assumptions enable us to partition one immense single constrained optimization problem into two relatively very small optimization problems
Rotation of the future crop--determined by the reforestation plan--indi-cates the time span in which the existing growing stock and growth thereupon has to be harvested Therefore if continuous timber flow is required the harvest scheduling should be preceded by the long-range plan In the sequen-tial approach the long-range plan is developed first The long-range plan is best summarized as follows
Long-Range Plan (Reforestation)
Objective Maximization of long-run timber output or rate of return to the land
Constraints I Reforestation of equal annual (or periodic) areas bysite
II Equal annual (or periodic) reforestation budget
Input I Area distribution by site accessibility etc II For each site and species method of regeneration
initial stocking level management regime and rotation - Total reforestation and subsequent management costs - Expected product output at rotation age - Expected annual rate of return to the land
Output I Area to be reforested annuallyII The reforestation schedule together with rotation
lengths by site III The long run annual total timber output IV The long run annual total income from the use of
forest land
71
The long-range planning problem could be handled by linear programming(LP) if the management objective is either long-run timber yield maximization or the maximization of rate of return to the land If a combination of both is desired the problem could be handled by goal programming (Rustagi 1976)As the problem size would be small--only a few hundred variables at most--therewould be scope for refining site classification and including a large number of regeneration methods and management regimes and several rotations The small size of the problem would also enable in-depth sensitivity analysis
The long-range plan gives an annual reforestation program which will maximize long-run income from the use of forest land subject to area and reforestation budget constraint If there is no constraint on reforestation budget the plan would indicate annual budget needs to implement the refores-tation program This program may be implemented as long as the input or the constraints do not change If any change does take place the problem can be easily reformulated and solved
Once the areas to be reforested by site and accessibility classes have been determined by the long-range plan their geographic location must be determined In the second stage of the sequential planning a harvest sched-ule is developed which tells where when and how much to harvest in different years of the conversion period This harvest scheduling problem may be sum-marized as follows
Short-Range Plan (Harvest Schedule)
Objective Maximization of discounted harvest income from existing stands or maximization of total timber yield during the conversion period
Constraint Area to be harvested in each year by site and accessibilityclass as given by the long-range plan
Input Estimate of yield and expected stumpage prices for each stand and for each year of the conversion period
Output For each year of the conversion period
I Geographical location of stands to be harvested II Expected harvest volume III Expected income from harvest
Though theoretically this harvest schedule should be prepared for the entire conversion period it is not really necessary to do so Those stands which are putting on the least volume or value growth in each site will be the first to be scheduled for harvest Likely candidates for this category in-clude stands past maturity grossly understocked stands or stands currentlyunder less economic species Immature stands which are growing vigorously are unlikely to be taken up for harvest for some time Thus if a harvest sched-ule is prepared for 10 years at a time using only a proportionate area com-prising the least vigorously growing stands and the plan is implemented for the first 5 years and revised the planning outcome will be as optimal as if the schedule is prepared for the entire conversion period
72
There are two significant advantages in harvest scheduling for a shorter period First only a fraction of the total forest area need be considered bythe harvest schedule thus more precise estimates of volume and value are possible for a given amount of effort Second as the harvest schedule is to be for only 10 years (maybe less) relatively reliable estimates of stumpagevalues and harvest costs are possible In short the amount of information to be collected may be as small as 10 percent of what would be needed to prepare a harvest schedule for the entire conversion period
The harvest scheduling problem may be handled by linear programming How-ever with an area constraint different management objectives or different scheduling strategies such as oldest stand first should not produce signifi-cantly different impacts on the objective function value An arbitrarily de-termined harvest schedule based on roading condition and proximity of stands to be harvested--which may not be built into an LP model--may outperform the schedule drawn by using LP
DISCUSSION
Suppose one million hectares of forest land is to be managed for sustained production with the long-run objective of maximization of income to the land Also suppose that there is a constraint on the reforestation of income to the land Also suppose that there is a constraint on the reforestation budgetFurther suppose that based on productivity accessibility administrative considerations and conversion possibilities this forest land can be divided into 10 site classes and for each site class 5 reforestation alternatives are available with information on reforestation cost rotation lengths total timber output and income from harvest at rotation age
The long-range problem if the sequential approach is used will have only50 decision variables 10 area constraints and one budget constraint The solution will include the number of hectares to be harvested and reforested and the rotation to be adopted in each site class Also total long-run timber output and income from the use of forest land can be computed
Suppose that this million hectares can be divided into 10000 homogeneous stands If the short-range plan is to be prepared for 10 years with an aver-age rotation length of 50 years yield and stumpage information will be needed for approximately 2000 stands covering 200000 hectares If formulated as an LP problem it will have about 20000 decision variables and 2050 constraints The problem size may be substantially smaller if the rotation is longer than 50 years or the planning period is shorter than 10 years For example a 5-year planning period may result in only 5000 decision variables and 1025 constraints
If however the two components are merged into one model such as Timber-RAM (Navon 1971) and a plan is prepared for the next 50 years with the same degree of spatial and temporal resolution the number of decision variables will increase to one million with number of constraints in excess of 10000 Whereas this large problem size will force aggregation further resolution is possible under the sequential approach
73
The advantages of the sequential approach to timber management planningmay be summarized as follows
1 The size of both the long and short-range problems are small This makes it possible to examine a much larger number of investment alternatives and exercise better control on the quality of input
2 The long-range plan provides long-run predictions of timber output without actually developing a management plan for a rotation or longer period
3 The investment analysis of planned reforestations is very explicit and separate from current harvest income
4 As the regulation of harvest is not by volume allowable cut effect (Schweitzer and others 1972) cannot be used for distorting investment analysis
5 Because of small problem sizes as frequent as annual updating of both long-range and short-range plans is practical
It may be argued that the long-range plan described here also uses estimates of costs and stumpage process up to the end of a rotation Un-fortunately there is no way to avoid use of these numbers if the refores-tation investments are to be evaluated according to some economic criterion These numbers will not be needed however if a biological criterion is used in establishing maturity If it is assumed that the stumpage price will main-tain the historical rising trend in the foreseeable future and that thinningand fertilization will be used increasingly the financial rotation usingFaustmanns formula may not be significantly different from the rotation of maximum volume production which can be predicted with greater accuracy and is unaffected by economic factors such as costs stumpage prices and interest rates
Though the long-range plan has equal area constraint this may be relaxed to take advantage of the timber market so long as these variations even out in the long run This flexibility of scaling harvest up and down is available only so long as some kind of long-run sustained harvest is followed
Thinnings were excluded purposely from harvest scheduling Though com-mercial thinning is income producing it is essentially a silvicultural opera-tion carried out to increase the value growth of the residual stand and to prevent mortality loss When and where to thin may be best decided after a harvest schedule has been prepared Coordination of thinnings with harvest cut in nearby areas may provide better return than may be possible otherwise
An application of the sequential two-step approach outlined here has been presented by Rustagi (1976) where the long-range reforestation planning has been handled by goal programming and the short-range harvest scheduling bylinear programming This application reveals that with equal area constraint total discounted present value of harvest during a planning period is not significantly different whether the objective is biologic or economic The actual harvest schedule however may vary with the short-run objective
74
LITERATURE CITED
Nautiyal JC and PH Pearse 1967 Optimizing the conversion to sustained yield - a programming solution Forest Sci 13(2)131-139
Navon Daniel I 1971 Timber RAM a long-range planning method for commercial timber lands under multiple-use management USDA Forest Serv Res Paper PSW-70 22 p illus Pacific Southwest Forest and RangeExp Stn Berkeley Calif
Rustagi Krishna P 1976 Forest management planning for timber production a goal programming approach Yale Univ Sch For Environ Stud Bull 89 80 p
Schweitzer DL RW Sassaman and CH Schallau 1972 Allowable cut effect - some physical and economic implications J For 70(7)415-418
University of Georgia School of Forest Resources 1968 Max-million a computerized forest management system Athens Ga 61 p
75
A Two-Phase Method for Timber Supply Analysis
Stephen Smith
Abstract There is an increasing need to clarify the long-term wood supply implications of current harvestingrates To assess the wood supply and to set timber pro-duction objectives different linear programming techniques are applied to the short and long term The transportation method is applied to the short term and the B C Forest Service computer-assisted resource planning method is applied to the long term
INTRODUCTION
Of all the decisions facing forest policymakers probably the most criti-cal because of its economic importance is the rate at which timber is to be made available for harvesting The timber-producing base is diminishingthrough increased recognition of an array of legitimate non-timber usersthrough environmental protection measures and through changes in the eco-nomics of logging The nature of the productive forests is changing from unmanaged large old-growth to young-growth forests whose products will be smaller and in different proportions by species In this changing world the British Columbia Forest Service must maintain a continuing wood supply to support a healthy competitive forest industry and ensure the productive integration of land uses All these factors generate an increasing need to clarify the long-term wood supply implications of present timber harvestingrates
In 1976 the Royal Commission on Forest Resources (Pearse 1976) recommended changes in the current methods of timber yield regulation In particular it recommended that yield controls should (1) apply to Timber Supply Areas (TSAs) serving manufacturing areas and communities (2) recognize log supplypatterns and transportation facilities within the timber supply area (3)embody reasonable expectations about future trends in forest growth and values and (4) recognize the uncertainty surrounding long-term forecasts This paper describes a small part of the response by the British Columbia Forest Service to these recommendations
76
TIMBER SUPPLY AREAS
Within the regions of the Province timber supply areas can be identified which serve manufacturing areas and communities The supply areas have large-ly evolved from establishment of forest industry and the development of associ-ated communities Insofar as public policy is to be directed toward supportingthe income and employment base of forest-dependent communities yield controls must be designed to apply to the relevant timber supply areas There should be some flexibility in setting short-term harvesting rates together with a mechanism for clearly showing their long-term implications for the future wood supply
TWO-PHASE METHOD
To meet the described requirements for revised yield controls the ap-proach has been to separate the relatively short term (the next 20 years) from the very long term (about two rotations) In defining timber production ob-jectives over the 20-year horizon the Forest Service must ensure that the short-term rate of cut will not result in an unacceptable decrease in the fu-ture wood supply Accordingly a practical conceptually simple process con-sisting of two phases has been developed from which timber supply area wood production goals can be derived
Phase 1 (Short Term)
Develop and describe 20-year production goals in the form of a simple wood flow plan The plan describes a feasible efficient movement of wood from the different localities within the timber supply area to the different broad in-dustrial sectors In practice this 20-year look ahead would be used to set 10-year objectives The 10-year production objectives are to be reviewed every 5 years
Phase 2 (Long Term)
Determine the projected timber production curve over one or two rotations for the entire timber supply area setting the overall cutting rate for the first two decades equal to that developed in phase 1
If the results of phase 1 cause the long-term rate of cut to drop below the 90 of the long-run sustainable yield then phase 1 must be modified until it is in harmony with the long term goals
FORMULATION OF THE SHORT-TERM ANALYSIS
The supply area can be described as a network in which there are local-ities (supply points) supplying industrial sectors (demand points) The20-year horizon can be divided into four 5-year periods Each supply point has an inventory of accessible usable timber each demand point has a minimum
77
demand to be satisfied and a physical capacity which cannot be exceeded The objective is to select for the duration of the horizon a routing plan which satisfies all the demands does not exceed the supplies and physical plant cap-acities and attempts to maximize the value of the routing plan
One formulation of the problem is given below
Maximize Σijk rijk xijk
Subject to the demand constraints
-Σjkxijk le Di minimum total sector demands over the 20 year horizon
(1)
-Σjkxijk ge Mi maximum total sector demands over the 20 year horizon
(2)
Σj - aijks xijk ge SDiks maximum sector demand by species and time period
(3)
where - SDiks giksPik
-Σj xijk le PDik minimum total demand by sector i in time period k
(4)
and subject to the supply constraints
Σijk xijk le T total wood supply (5)
ΣiΣk xijk le Sj total wood supply for each management unit
(6)
Σi xijk le MS jk wood supply for each management unit in each time period
(7)
Σk xijk le SSij total supply available to sector (8)i from management unit j over the 20 year horizon
xijk = volume of wood allocated to sector i from management unit j in time period k
rijk = value of a unit of wood allocated to sector i from management time unit j in time period k
Di = total minimum demand for sector i over the 20 year horizon
Mi = total maximum demand for sector i over the 20 year horizon
Pik = maximum demand for sector i in time period k
aijks = proportion of species s in a unit of wood from management unit j which can be used by sector i in time period k
78
SDiks = maximum demand by sector i for species s in time period k
giks = the average proportion of species s used by sector i in time period k
PDik = minimum total demand by sector i in time period k
T = total wood supply in the supply area available for cutting in the next 20 years
Sj = total wood supply in the jth management unit available for cutting inthe next 20 years
MSjk = total wood supply from management unit j in time period k
SS ij = total supply available to sector i from management unit j over the 20 year horizon
i = 15 j = 110 k = 14 s = 16
LONG-TERM ANALYSIS
Obviously it is not sufficient to allocate existing mature timber invent-tories from the management units within the supply area without looking atthe long-term consequences for the supply area as a whole Use of a subset of the Computer Assisted Resource Planning System (Williams and others 1975) al-lows calculation of a long-term production curve for the entire timber supplyarea constrained for the first two decades to the harvest level set in the short-term calculation In this calculation the harvest scheduling formula-tion is that produced by Timber-RAM (Navon 1971)
APPLICATION OF THE METHOD
After assessing present and projected industrial demands and the net tim-ber supply a simple question-and-answer sequence can be followed to arrive at a set of timber production goals Those questions in the order that they are addressed in the process are
Can the present cutting rates be maintained over the next twenty years
What effect will maintenance of the present cutting rate have on long-term timber supply
What are the projected increased industrial demands over the next twentyyears and can cutting rates be raised to meet them
If increased demands can be met over the next twenty years what will be the effect on the long term supply
79
The method also has the following capabilities
Likely periods of scarcity for a particular industrial sector can be highlighted
Areas that have to be developed by a certain time to meet wood supplyneeds can be pinpointed
The effects of changing sector demands on the wood supply picture can be predicted
The effects of changing the log supply pattern on the wood supplypicture can be predicted
A starting point is given for long-range strategies to ameliorate impending wood supply problems if they are indicated
RELATING TO NONTIMBER RESOURCE USES
An initial wood supply analysis provides valuable input to determiningoverall resource use policy With this information out on the table other resource managers can participate effectively in the development of alterna-tives for a timber supply area and later on for a complete region
Once alternatives are developed which express the needs of other resources one can be chosen by the decisionmakers or additional alternatives can be pre-pared prior to the decision
RESULTS OF THE PROCESS
Tables and graphs are generated showing planned rates of harvest for the timber supply area in each of the next four 5-year periods Planning harvest rates are broken down by management unit and industrial sector
For the long term graphs and tables are generated allowing an assessment of the long-term wood supply which will result from implementing the 20-year harvesting plan
These results enable the Forest Service to set timber production object-tives and are a starting basis for the development of associated reforestation and silvicultural goals
The method outlined in this paper is part of the Forest Service planningsystem (British Columbia Forest Service 1978)
80
REFERENCES
British Columbia Forest Service 1978 Planning Handbook British Columbia Forest Serv Resour Plan Div Victoria BC
Navon Daniel I 1971 Timber RAM a long range planning method for com-mercial timber lands under multiple use management USDA Forest Serv Res Paper PSW-70 22 p illus Pacific Southwest Forest and Range Exp StnBerkeley Calif
Pearse PH 1976 Timber rights and forest policy in British Columbia Rep Royal Comm Forest Resour
Williams DH JC McPhalen SM Smith MM Yamada and GG Young 1975 Computer-assisted resource planning an overview of the CARP project [Unpublished paper on file at Fac For Univ British Columbia Vancouver]
81
Timber Management Planning with Timber RAM and Goal Programming
Richard C Field
Abstract By using goal programming to enhance the linear programming of Timber RAM multiple decision criteria were incorporated in the timber management planning of a National Forest in the southeastern United States Combininglinear and goal programming capitalizes on the advantages of the two techniques and produces operationally feasible solu-tions This enhancement may also be applicable to linear programming packages other than Timber RAM
INTRODUCTION
In its timber management planning the Forest Service U S Department of Agriculture often uses a linear programming (LP) package called Timber RAM (Resources Allocation Method) to calculate the potential yield under forest regulation Regulation is defined as that future arrangement of forest treat-ments in space and time which achieves specified long-term objectives The other part of timber management planning harvest scheduling is the treatment of existing forest conditions to achieve short-term goals and make some move towards the regulated condition This planning phase is generally beingcarried out in some subjective nonoptimal manner I show here how goal pro-gramming (GP) might be used to improve the utility of Timber RAM for both forest regulation and harvest scheduling
Timber RAM
To understand this paper the reader must be somewhat familiar with the LP-based Timber RAM Space does not permit a complete description here for details on the Timber RAM package see Navon (1971) Timber RAM is a set of computer programs which (1) generate input for any of several standard LP solution packages and (2) produce final reports based on the input and the LP solutions The latest versions of these programs are written for Univac 1100-series computers using the EXEC 8 operating system However the LP matrix generated for Univacs Functional Mathematical Programming System (FMPS) can also be solved using IBMs Mathematical Programming System (MPS) Timber RAM
82
can also produce a matrix for solution by Univacs linear programming packageILONA Earlier versions of Timber RAM are available for CDC and IBM computers
Input data for Timber RAM include current stand conditions projected yields of alternative treatments regulation methods harvest flow and budget-ary constraints regeneration possibilities and limitations stand accessi-bility and associated economic data and constraints Different decision cri-teria can be entered by specifying indices of performance such as volume net revenue and cost with associated discount rates and periods of optimization The user selects a single objective function for each desired solution of the LP problem
In the United States Timber RAM has been used primarily to maximize the short-run potential yields of western National Forests where there is a prepon-derance of overmature timber Previously these forests were regulated through use of volume control formulae The linear programming with Timber RAM provided an improved approach (Hennes and others 1971) However most of these applications of RAM were formulated as harvest scheduling problems as is evident from the objective function which is to maximize first decade har-vest and from the lack of constraints on the harvest flows after the forest is assumed to be regulated Yet budgetary constraints such as are necessaryfor an operational harvest schedule were also lacking Hence the solutions merely indicated the maximum yield that would be biologically and technologi-cally possible during the short-term planning period and did not provide a solution to the regulation problem
In the southeastern United States where the National Forests are generallyunderstocked area control has been used instead of volume control as the reg-ulation method Due to the relatively small contribution of the National Forests to southeastern timber supplies Timber RAM has not been used in this region even though it can model the area control approach
The Timber RAM system is adequately documented and fully supported by the Forest Service For many National Forest planners availability and conven-ience outweigh the inflexibilities of the system enumerated by Chappelle and others (1976) Some of the technical drawbacks of RAM can be reduced by the procedures outlined in this paper
New legislation regarding the National Forests implies however that managers must seek to achieve future conditions which are optimal and which insure regulation These conditions will then limit all harvests includingthose prior to the achievement of the regulated state Strict area control cannot in general satisfy the constraints on harvest levels during conversion to the regulated state and the other procedures currently in use do not ade-quately constrain to assure regulated conditions This paper describes how Timber RAM enhanced by GP can be used to determine the required solutions to the timber management program
83
Goal Programming
GP is a special form of LP suggested by Charnes and others (1955) It permits the simultaneous treatment of multiple objectives which may be incom-mensurate Typical LP objective function rows are added to the constraint matrix as equalities Right-hand sides that reflect the desired level of each objective are included as are slack and surplus variables for each row Then a new objective function composed of the slack and surplus variables of the former objective functions (the positive and negative deviations from the de-sired goals) is constructed and minimized by a standard LP algorithm Differ-ential weights greater than or equal to zero may be attached to the deviations to reflect the decisionmakers value system
Applications of GP to natural resources problems have generally used ordi-nally weighted deviations to effect a preemptive ranking of the goals as des-cribed by Field (1973) In this study however cardinal weights were used to indicate relative values among goals rather than goal preferences Rustagi(1976) used a similar approach in applying GP to forest regulation This idea is extended here to include harvest scheduling by using GP to develop compro-mises between the several solutions available from Timber RAM
METHODS
Timber RAM Input
Forest Data
The test area for this study was Oconee National Forest in the middle Piedmont of Georgia In this forest of approximately 40000-ha about 80 of the area is in stands of loblolly pine (Pinus taeda L) and short pine (Pechinata Mill) and the remainder is in various mixtures of pine and several species of hardwoods The pine stands are categorized by three classes of site productivity and nine classes of stand age or condition The other stands (hereafter referred to as hardwoods) are categorized by only two pro-ductivity classes
For each stand class and a variety of treatments yields were estimated from published models forest inventory data and local timber sale data Local forest policies dictated the type and range of activities that had to be evaluated Generally clearcuts at several ages with or without prior thin-ning were used for the pine whereas uneven-aged management with cutting cy-cles of two different lengths were used for the hardwoods Local estimates of costs and revenues associated with harvest and regeneration were obtained These forest data were then coded for use in Timber RAM
Problem Constraints and Decision Criteria
The National Forest Management Act of 1976 and current Forest Service policy may be interpreted as prohibiting any harvest greater than the long-
84
term sustainable average and any harvest less than the level of any previous harvest Indeed the law seems to imply that a perpetually even flow of timber yield from the present cut henceforth is required The law permits these con-straints to be based on 10-year averages Under these assumptions the current cut is the lower bound for the initial harvest whereas long-term sustained yield is the upper bound on the initial and all subsequent harvests and the intervening flows must be uniform or at least nondeclining The law states that flow constraints may be relaxed only for consideration of other multipleuse objectives The requirement for even flows during the conversion to the regulated condition it may be argued may then be relaxed as necessary toachieve a high level of sustained yield a possible multiple use objective
Nondeclining and even flow constraints are easily incorporated in the Timber RAM model by using the option called volume control and regulation with sequential lower bounds only The lower bound must be set at zero for each control period during the time allowed for conversion to the regulated condition The maximum yield permitted in the last control period of conver-sion must equal the postconversion average (long-term sustained yield) Fluc-tuation in 10-year yields cannot be permitted after conversion For the Oconee forest application limits were also placed on the expenditures and on the area harvested and regenerated in each decade by using Timber RAMs interval con-straints Thus harvest scheduling as well as forest regulation constraints were included in the same model
The three decision criteria used for the Oconee application were the maxi-mization of total volume and of present net revenue and the minimization of total cost These criteria covered the entire planning horizon of 150 years economic values were discounted to the present at a 6 rate of interest
Matrix Alternatives
The single LP matrix normally generated by Timber RAM from the input de-fining the problem is usually inadequate for planning The planner may want to obtain solutions under different sets of constraints as well as different de-cision criteria Also certain modifications can improve efficiency of compu-tation and others are required to implement the GP formulation The followingmethods were used to create the necessary models for the Oconee National Forest
Alterations during Matrix Generation
Two intermediate optimization problems were generated The first was de-signed primarily to test the model Here all but one productivity class of pine was removed from the model and only clearcuts were permitted as manage-ment activities The objective was to produce a small and generally predict-able matrix Solutions to this problem were obtained under the full range of constraint and objective variations discussed below In addition some matrix coefficients were systematically changed and postoptimality analyses were per-formed
85
The second intermediate problem contained all the stand classes and con-straints that were in the full problem but the number of activities was re-duced from 2229 to 228 For each basic variation of the full problem a solu-tion was first obtained with this abbreviated model The solution was then used as an advanced basis to start the optimization phase of the full problem This proved to be an efficient way to test solution procedures and it short-ened computation times for solutions to the full problem Such an approach is useful when applying LP to any large problem
Alterations after Matrix Generation
There are two ways to change a matrix already generated by Timber RAM Simplest but not necessarily most efficient is to physically change re-place add or delete certain entries by editing This procedure is useful for correcting a few errors in a small matrix For a large matrix (the full pro-blem in this application had 77442 elements) it is usually cheaper but not necessarily quicker to correct the raw input and generate a new matrix Some form of editing or a programmed rewrite may be necessary for a large number of systematic changes which cannot be handled by these methods or others discussed below Here one FORTRAN program was used to generate test problem matrices with reduced yield coefficients and another was used to create rows in the large matrix for certain GP models
The best way to make temporary changes in an error-free matrix is with the standard revise and modify options in the LP package Typical changes in-clude relaxing certain constraints changing right-hand sides and adding or modifying rows for GP Relaxing certain flow constraint rows not only provides useful information on trade-offs but because the solution times are relativelyshort is also another good way to test solution procedures Other modifica-tions successfully tested in this study are (1) creating objective functions not available from the Timber RAM matrix generator (2) deleting redundant rows that occur with certain options and (3) creating nonconstraining rows to facilitate reading the solution
Goal Programming Formulations
In this application two basic GP models were constructed In the firstthe three single-criteria optima (volume net revenue and cost) from the LP models were the goals and the sum of the underachievement of the volume and revenue goals and the overachievement of the cost goal was minimized In sep-arate variations of this model the deviations were equally weighted weighted in favor of volume and relatively weighted In the last case each goal row was divided by the right-hand side (the goal) before the deviations were added Thus the sum of the relative or proportionate deviations from the goals as opposed to absolute deviations was minimized
The second GP formulation minimized the sum of the deviation from the total volume goal and the deviations from each periodic volume flow goal The original right-hand side of the constraint equation was used as the goal for
86
each periodic flow Thus the objective function included the underachieve-ment of the current cut by the harvest in the first period the underachieve-ment of the previous harvest by each subsequent harvest during conversion the overachievement of the long-term average by the last harvest in conversion andthe over- and under- achievements of the long-term average by each post-conver-sion harvest Variations in flow goals and economic goals with a variety of weights were tested only on the small problem
Many other combinations of weighted goals and constraints can be formulated to best meet the planning needs of the decisionmaker For goals that would normally be objectives in an LP model simply add a right-hand side that is at least as large (or small) as can be attained with single objective optimiza-tion Otherwise the row should be a constraint For goals that would be con-straints in an LP model the existing right-hand side or constraint is typi-cally used However solutions to such problems should be carefully studied and compared to fully constrained single objective solutions especially if many or all the goals are achieved There may be more acceptable solutions that are easily obtainable but go unrecognized in such goal formulations
RESULTS
The results involve LP solutions GP solutions and postoptimality anal-ysis of the small test problem The LP set were obtained from Timber RAM usingthe procedures outlined above The GP set is based on the reformulations of the Timber RAM matrix as GP models The postoptimality results are based on LP and GP solutions for the single site single rotation and uniformly managed test problem
Linear Programming Solutions
The first solution of interest used the standard Timber RAM criteria of volume maximization Typically if the solution was feasible and if the deci-sionmaker was happy with the harvest provided for the first decade (the short-term planning period) the analysis stopped there In this case however the solution contained alternative optima which indicated that there are other strategies which meet the constraints and still give the same optimal object-tive value This result implies that the analysis may not be complete because the procedure does not rank the strategies which can produce the optimum
The solutions based on economic criteria also revealed some interestingconditions The net revenue optimum was achieved by only one strategy but the total harvest and long-term average were less than those provided by the maxi-mum volume solution A long-term yield less than the maximum combined with the Forest Services reluctance to use profit as a decision criterion makes this solution less acceptable even though it met all constraints From a policy standpoint cost minimization might be more acceptable except that with this criterion only enough acres would be harvested to meet the current cut constraint In the other two solutions the first period harvest was more than double the current cut Consequently none of these three solutions provided a completely acceptable basis for a timber management plan
87
Goal Programming Solutions
Standard LP variations and postoptimality analysis might be able to improve single criterion solutions or show the cost of certain constraints Butwithout reformulation or considerable external analysis such procedures can-not effect the compromise between the alternative solutions that planningprocedures usually require GP provides for such a compromise The solution using the optima from the three LP solutions as equally weighted absolute goals achieved the same long-term sustained yield as the volume maximization solution as well as 96 of the maximum net revenue and 96 of the maximum volume for the planning period There were no alternative optima in this solution
Other goal formulations with differential weights would give differentbut still feasible and conveniently determined solutions When the deviation from the volume goal was given a weight of 10 while the others remained at one the solution nearly achieved the volume goal But the net revenue was higher than in the LP solution that maximized volume
A formulation with equal weights on all goals carries implied weights in favor of the goals of larger numerical value Relative weighting reverses this bias Such effects were demonstrated in this application by the levels of achievement for the largest and smallest goals revenue and cost respect-tively A solution using relative weights favored the cost goal In this solution the current cost was just matched as it was in the cost minimization solution but many more acres were treated because of the influence of the volume goal
Postoptimal Solutions
Sensitivity analyses to test the stability of certain solutions given spe-cified changes in inputs were limited to the small problem These iterative techniques are quite expensive when applied to large problems However the following results would seem to apply equally well to the large problem
In the first set of tests the sensitivity of the solution to changes in yield estimate was determined under the LP volume maximization criteria A uniform change in current and future yields produced no change in the strategythat gives the optimum value of the objective function Naturally levels of periodic flows and total yields varied directly with changes in input
It was next assumed that yield estimates for existing stands were correct and that the only changes that must be considered were for the yields of re-generated stands New solutions then arose but the activities selected for the first few periods were still unchanged Similar results were obtained with the GP formulations The stability of the preferred strategy reflects the de-pendence of early treatments and results on the conditions in existing stands Recall that this analysis supports a short-term planning effort and that re-planning and analysis will be required at relatively short intervals Thus considerable variation in long-term yield projections may not be detrimental to a typical timber management plan
88
Postoptimality analysis was also used in the GP formulation to systemati-cally change the weights on certain goal deviations A wide range of solutions resulted and indicated just how heavily a particular goal must be favored be-fore it will dominate all others For example the volume goal required a weight 31 times those for harvest flow goals in order to approximate the LP optimum for volume without flow constraints
CONCLUSIONS
Timber RAM may be attractive for the beginning forest planner if the necessary computer facilities are available It provides the basis for several approaches to forest regulation and scheduling of harvests on public lands A land manager can employ some of the techniques presented here to enhance the application of Timber RAM Simple reformulation as a goal model is within the capability of many users of RAM and helps to synthesize several satisfactory or nearly satisfactory solutions The combination of LP and GP can also be useful with mathematical programming packages other than Timber RAM including those used on privately owned lands Finally using GP in timber management planningsets the stage for multiple use planning because it provides the framework for the subsequent inclusion of other forest resources and products as additional objectives
Acknowledgments This study would not have been possible without the guidance of Dr Peter Dress who originally suggested the comparison of linear and goal programming Nor would my success with Timber RAM have been possible without the able assistance of Dr Daniel Jones
LITERATURE CITED
Chappelle DE M Mang and RC Miley 1976 Evaluation of Timber RAM as a forest management planning model J For 74288-293
Charnes A WW Cooper and RO Ferguson 1955 Optimal estimation of executive compensation by linear programming Manage Sci 1138-151
Field DB 1973 Goal programming for forest management Forest Sci 19125-135
Hennes LC MJ Irving and DI Navon 1971 Forest control and regu-lation a comparison of traditional methods and alternatives USDA Forest Serv Res Note PSW-231 10 p Pacific Southwest Forest and Range ExpStn Berkeley Calif
Navon DI 1971 Timber RAM -- a long-range planning method for commercial timber lands under multiple use management USDA Forest Serv Res Paper PSW-70 22 p Pacific Southwest Forest and Range Exp Stn BerkeleyCalif
89
Rustagi KP 1976 Forest management planning for timber production a goal programming approach Yale School of Forestry and Environmental Studies Bull 89 84 p New Haven Conn
90
Analytical Aids in Land Management Planning
David R Betters
Abstract Quantitative techniques may be applied to aid in completing various phases of land management planning Analytical procedures which have been used include a procedure for public involvement PUBLIC a matrix information generator MAGE5 an allocation pro-cedure linear programming (LP) and an input-output economic analysis (EA) These techniques have proven useful in the development of lane management plans for a number of National Forests in the United States
INTRODUCTION
The typical planning process used for developing land management plans follows a sequence of several phases Although this overall process might be described in many ways the major steps shown in detail in Table 1 are (1)the identification of issues and objectives (2) the development of the resource system and management options (3) the analysis of tradeoffs with the decision and feedback
Various quantitative techniques may be applied to aid in completing these basicphases The Systems Application Unit for Land Management Planning (SAU-LMP) of the Forest Service US Department of Agriculture has utilized several types of analytical procedures in the successful development of land management plans for National Forests in the United States Specifically those used most often by SAU-LMP are a procedure for public involvement abbreviated PUBLIC a matrix information generator called MAGE5 an allocation procedureknown as linear programming LP and an input-output economic analysis called EA
91
Table 1--The land management planning process
Systems ApproachTerminology Major Phases
I ISSUE IDENTI-FICATION
Set II FORMALIZATION Objectives OF PLANNING
System III DEVELOPMENT Design OF ALTERNATIVES
System IV ANALYSIS OF Analysis TRADEOFFS AND
FORMULATION OF A RECOMMENDED
SAU-LMP Detailed Phases Analytic tools
Pre-Plan Organization -Establish time frame for plan -Establish personnel require-ments for plan-Define degree of public involvement
Identify Issues and SetObjectives-Define critical issues and their source -Define assumptions concern-ing decisions environment PUBLIC -Define hierarchial set of goals -Define criteria to be usedto test performance
Define Resource System -Stratify land base to address issues -Designate management options -Define resources and products
Define the Responses-Identify information needs sources of information and detail necessary MAGE5 -Determine resources andeconomic responses to manage
activities
Analyze the Resource System-Define the processes to be used in analysis -Generate alternative management strategies -Define tradeoffs between strategies -Develop a scenario to describe tradeoffs LP -Test each alternative in terms of meeting criteria of performance EA
92
Decision and DecisionFeedback -Select a preferred alternative
-Prepare a written plan directive and draft impact statement
Feedback-Describe procedures for monitor-ing plan implementation and revision when necessary-Insure tasks are carried out effectively and efficiently-Insure work plans are developed
PUBLIC
PUBLIC is the procedure used curing the issue-identification and objective-setting phase to make quantitative estimates of public preferences and of con-flicts among those preferences (Case and others 1976) The program is used at public workshops where the participants are asked to rank ordinally the uses of various National Forest resources from what should be most emphasized to what should be least emphasized PUBLIC is then used to analyze this input to estimate agreement and disagreement in the total group and to determine the least disliked priority ranking of Forest resource uses The program constructs this ranking by creating an array of responses which indicate the votes for each preference Then through a process of elimination it as-signs preferences to an order on the base of whether a use preference re-ceives either the majority of first-place votes or the majority of the most disliked votes At the same time the procedure identifies subgroups which seem to have like interests or preferences A statistical procedure factor analysis is used to subdivide the respondents into these subgroups An estimate of the level of agreement within these subgroups is measured by the Kendal Concordance Coefficient This is a statistic which generates on a scale of 0 to 1 a measure of subgroup agreement 1 representing total agree-ment and 0 total disagreement
This type of information is useful during the workshop session to groupparticipants with like interests so they can work on specific alternative des-criptions and resource-use levels or requirements The procedure also supplies information which is useful for many different types of analyses to be conduct-ed later inducing comparisons of local preferences to overall regional pref-erences comparisons of US Forest Service staff preferences to local prefer-ences and analysis of public perception of agency priorities Further and most importantly PUBLIC helps develop the type of public involvement infor-mation necessary to construct alternatives for analysis in subsequent phases of Forest level planning The following table shows an ordering arrived at bymeans of PUBLIC
93
Overall orderingentire workshop Subgroup 1 Subgroup 2
Wildlife Watershed Wilderness Scenic beautyDispersed Rec Watershed
Range Timber Wildlife
Scenic BeautyDispersed Rec Wildlife
Timber Developed Rec Mineral Extraction
Dispersed Rec Developed Rec Mineral Extraction
Range Developed Rec Timber
Wilderness Wilderness Mineral Extraction
The preference patterns shown could be used to develop strategies which might be described in scenario form as
Strategy 1 (Overall ordering) Emphasize wildlife scenic beautyand dispersed recreation with less emphasis on watershed rangeand timber and give low priority to developed recreation mineral extraction and wilderness
Strategy 2 (Subgroup 1) Emphasize watershed range and timberwith less emphasis on wildlife scenery and dispersed recreationand give low priority to wilderness mineral extraction and devel-oped recreation
Strategy (Subgroup 2) Emphasize wilderness scenic beauty and dispersed recreation with less emphasis on wildlife watershedand range and give low priority to timber mineral extractionand developed recreation
These strategies could be used as part of the basis for construction goals and priorities for a Forest plan
MAGE5
The next planning phase involves defining various aspects of the resource system This phase of planning employs both the information concerning use preferences described above and information concerning the land base to con-struct specific management options and resource uses for each of the manage-ment strategies previously identified Once the management options have been determined the consequences of each on the environmental resource and the economic responses must be defined The US Forest Service uses MAGE5 a matrix generator to help the planner identify develop and store the nec-essary bits of information (US Dep Agric Forest Serv 1973) Since most plans cover a planning horizon of several years one of the most significant benefits of using MAGE5 is that it allows for the time factor and attendant time changes in developing the appropriate dynamic data for the matrix MAGE5 uses a concept called timestreams to adjust resource uses benefits and costs to changes which occur with time it automatically constructs a matrix whose coefficients reflect this time dimension
94
For example suppose that the planning horizon is ten years subdivided into two periods of five years A management option involving timber harvest mightbe applied either during the first period or during the second period The values calculated for MAGE5 for the matrix rows and columns are as follows
Management option involving timber harvest
applied in
Present First Second condition period period
Average sedimenthayrin the first period 04 064 04
Average sedimenthayrin the second period 04 068 064
Since the sediment yields are constant under present conditions in this land area the average yields in each period are 04 cubic meter per hectare per year provided nothing changes The average values for sediment yields where timber harvest is involved assume that the application of the option to an acre might occur at different years in the period For example the timber harvest might take place in any one of the five years of the first period The various possibilities and the subsequent timestreams for sediment yield per year during the first period are as follows
Option applied in
First year
Second year
Third year
Fourth year
Fifth year
Year 1 Year 2 Year 3 Year 4 Year 5
08 08 08 08 08
04 08 08 08 08
04 04 08 08 08
04 04 04 08 08
04 04 04 04 08
Note that if the option is not applied until a later year in the periodthe present condition yield of 04 applies to all preceding years The aver-age value 064 for the sediment yield in the first period is the sum of the possibilities divided by their number or 1625 = 064 The other matrix en-tries are calculated in a similar manner with the timestream depending onwhat period is being considered
This concept is used to develop average yearly values for resource uses or commodities and for costs and benefits These values are stored in a matrix format which can be utilized along with other tools such as LP which are used in later phases of the planning process
95
LINEAR PROGRAMMING AND ECONOMIC ANALYSIS
Once the phases described so far are completed the next step in the plan-ning process is to analyze the resource system in order to determine how to al-locate management options that best meet the preferences specified by the vari-ous strategies and in order to identify the biological and socio-economic tradeoffs among strategies In making these assessments the planner uses the information developed thus far in conjunction with two analytical aids linear programming (LP) and an input-output economic analysis (EA) in the process of land management planning a separate LP analysis is made for each management strategy so that the allocations which best meet the requirements and con-straints stated for each strategy may be determined For example a separate analysis might be mace far~ each of the three strategies specified earlier Requirement levels are typically based on both the information developed in the earlier stage of public involvement and the kind of production of which the land is capable Limiting factors might be such things as the number of acres available for possible options the available budget environmental con-straints and policy considerations such as nondeclining timber yield from the Forest The objective functions might include such considerations as the max-imization of present net benefits or minimization of costs over the term of the planning horizon
The management options are selected on the basis of lava suitability and inline with the public involvement process There is usually a wide range of possibilities inducing wilderness management big game management at various levels various types of recreation management and various kinds of timber management treatments Each of these options might require a number of activ-ities For example recreation management (type I) might require monitoringuse closing roads and constructing trails
A comparison must be made between LP results in order to show the trade-offs among allocations resource outputs constraint levels costs and bene-fits A good deal of additional information can be derived from the sensi-tivity or post-optimality analysis which indicates bow resource uses con-straints and benefit values may change without affecting the LP optimal allo-cation This is useful for a number of different purposes such as deter-mining what parameters may be most sensitive to changes in the plan and ascer-taining whether additional inventory in certain areas may be appropriate
The linear programming results are further utilized with the EA analysis package to estimate the impact which each of the possible strategies would be likely to have on local economic activity and employment levels (Palmer and Layton 1973) Given a particular strategys predicted resource use or level of output the LA analysis measures both the direct effects and the indirect or multiplier effect on various sectors of the local economy This economic analysis results in a measure of the change in economic conditions likely todevelop as a result of the application of a particular strategy The signifi-cance of this impact depends in part on the magnitude of the change from what is the present condition and in part on the degree of influence this change has on the overall local or regional economy
96
Table 2 is an example of the results of using the input-output portion of EA which shows both the sectors affected directly and others which are indi-rectly affected as the impact of the change ripples through the economy In the example this effect amounts to $131863 in total gross output The EA package also estimates the effect the change will have on local employment ac-cording to individual occupation and month of the year
Table 2--Sample results of using the input-output package of EA
FINAL TOTAL GROSS CONSUMPTIVE VALUE SECTOR DEMAND OUTPUT WATER USE LABOR INCOME ADDED
($1000) ($1000) (ACRE-FEET) MAN YEARS $1000 $1000
1 AGRICULTURE 225308 270084 0000 3884 45790 71964
2 MINING
3 CONSTRUCTION
4 LOGGING
5 SAWMILLS
6 OTHER MANUFACTURING
7 TRANSPORT amp WAREHOUSING
8 COMMUNICATION amp UTILITIES
9 AUTO DEAL amp GAS STATIONS
10 EATING amp
001 131 0000 003 071 106
9339 13495 0000 245 3517 3774
005 089 0000 004 035 049
000 206 0000 005 045 070
248 321 0000 009 088 125
530 5395 0000 179 2114 2902
3742 14806 0000 288 7618 10640
4932 6330 0000 427 4265 4855
DRINKING PLACES 3056 3291 0000 257 1038 1698
11 WHOLESALE amp OTHER RETAIL
12 FINANCEINSUR amp R E
13 LODGING
14 SKI AREAS
7251 9211 0000 544 5378 6200
2474 6638 0000 267 3669 5571
1284 1293 0000 051 511 701
000 000 0000 000 000 000
97
15 OTHER SERVICES 6454 43774 0000 1776 17672 23209
PRIVATE SEC-ICES TOTAL 264623 375064 0000 7939 91811 131863
GOVERNIIENT amp MISCELLANEOUS 000 0000 1553 000 000 TOTAL POP 26 0000
TOTAL 264623 375064 0000 9492 91811 131863
The linear programming and input-output results provide quantitative es-timates of differences between strategies which can be used to illustrate tradeoffs as well as to demonstrate compatible relationships between possible alternatives This type of information because it is presented in easilyunderstandable formats is valuable for public presentations of the various strategies illustrating what might be expected then a particular plan is im-plemented The public reaction to these strategies and tradeoffs is useful in developing a final plan which will be acceptable to the largest segment of the interested public
APPLICATION
These techniques have proven successful in aiding in development of manage-ment plans for the Beaverhead Willamette Custer Boise Nezperce Payette and Monongahela National Forests In addition to being usable as a package for Forest plans the techniques may be used individually for specific problems For example MAGE5 was used to help construct the area guides for US Forest Service Rocky Mountain Region (R-2) EA is being used for a portion of the analysis necessary for the wilderness RARE II study PUBLIC has been used in Alaska to develop local preference patterns and to compare these to prefer-ences stated by Forest Service and Congressional representatives in Washing-ton DC
The programs have been used with UNIVAC and CDC computer systems All these programs are coded in standard FORTRAN IV and as such should be readilyadaptable to other systems Most of the problems related to National Forest applications have been solved through training and personal contact with technical staff provided at the Forest Service Regional Office or at theSAU-LNP in Fort Collins Colorado
The use of these quantitative techniques in planning provides for a com-prehensive analysis of complex situations The techniques offer an effective and efficient means to develop land management plans They can handle inform-ation in large amounts of differing types and concerning diverse interrela-tionships between biological social and economic factors which would be im-possible to deal with by any other means The quantitative procedures usedhere otter a consistent systematic approach to land management planning
98
ACKNOWLEDGMENTS
In preparing this paper I received the able assistance of Lloyd J Lundeen Donald Renton and Tim Sale of the Systems Application Unit for Land Management Planning Forest Service US Department of Agriculture
REFERENCES
Case Pamela J Terry D Edgmon and Donald A Renton 1976 PUBLIC a procedure for public involvement Range Science Series 22 Colorado State University Fort Collins 138 p
Palmer Charles and Ross Layton 1973 Input-Output Analysis Research Document Economic Research Service East Lansing Michigan 61 p[ Unpublished]
US Department of Agriculture Forest Service 1973 Resource Allocation Analysis Users Manual [Unpublished ]
99
Nutzwertanalyse
A Henne
Abstract Nutzwertanalyse (NUWA) is a psychometric instrument for finding the test compromise in the multiple use planning of forestry when the multiple objectives cannot be expressed in the same physical or monetary unit It insures a systematic assessment of the consequences of proposed alternatives and thoroughly documents the decision process The method leads to a ranking of alternatives based upon weighting of the objectives and evaluation of the contribution of each alternative to these objectives The use of the method is illustrated with hypothetical data
INTRODUCTION
In management planning of multiple use forestry the situation for the planner is as follows
Many possible alternatives must be compared in the light of a great number of more or less consistent or conflicting objectives (aims goals) between which functional relations cannot be specified
In the process of comparing and assessing the consequences of the alter-natives it is unavoidable that the subjective preferences of the decision-maker and planner and of institutions play a vital role
Consequently psychometric methods have to be introduced to obtain solu-tions corresponding to objectives which cannot be expressed in physical or monetary units
To overcome these difficulties neither intuition nor mathematical models are of much help In NUTZWERTANALYSE (NUWA) an instrument is at hand with which finding the best compromise can be made easier and more rational The decision process will at the same time gain in clarity and it will be repro-ducible in all its steps
100
OUTLINE OF THE NUTZWERTANALYSE METHOD
The technique of NUWA consists of the following steps (see Abb 1)
Step 1 The objectives (aims goals) relevant to the situation are defined and arranged hierarchically according to means-objectives relations At the end of the chains of objectives will be found aims criteria (Zielkriterien)Kj sufficiently precise to serve as the basis of analysis and evaluation
Step 2 The weights gj (Gewichte der Zielkriterien) ie the importance each objective shall assume in the process of evaluation are given by the de-ciding authority according to its preferences
Step 3 The consequences of each project alternative (alternative action) Ai with respect to each aimcriterion Kj are described in a matrix (Zieler-tragsmatrix) The elements Eij of this matrix can be formulated in words or numbers
Step 4 By measuring the consequences of the alternatives each element Eijis transformed into an element Wij of the value-matrix (Zielwertmatrix)The scales (nominal ordinal or cardinal) by which the consequences are mea-sured depend on the form and the precision of their description
By these four steps the evaluation of an alternative has been divided upinto m part evaluations m being the number of criteria (objectives) to be taken into account
Step 5 For each alternative Ai the NUTZWERT Ni is found by combining theweighted values according to a set of decision rules which are consistent with the type of measurement scale used The result (Nutzwertmatrix) gives ranking of the alternatives analyzed
So NUWA may be briefly described as a method with which a number of pro-ject alternatives are analyzed and assessed with respect to a multidimen-sional system of objectives by ranking the alternatives according to thepreferences of the decisionmakers
The following considerations in using NUTZWERTANALYSE may help to clear upsome of the more difficult aspects
System of General Objectives
The first requirement for using NUWA is to formulate a complete system of well-defined and carefully arranged objectives In Abb 2 you will find a System of General Objectives in Forestry which I presented in Oslo at the XVIth IUFRO Congress These objectives are to maximize minimize conserve promote etc the criteria listed in Abb 2 This system is only a first tryand I hope a start for further joint efforts Meanwhile in our country aguide for forest regional planning has been published that contains this system in a slightly different form
101
102
103
Heights of Objectives
An example for step 2--the weighting of the objectives--is given in Abb 3 Using the presented system of objectives the weighting is simulated for the state forests of Hessia using the method of pairwise comparison You find the preliminary weights calculated in percentage numbers in column (3) of the table After a transformation by means of an interdependence factor the final general weights are given in column (6) of the table (These numbers correspond to the weights gj (Abb 1) A detailed description of the methodis given in another paper by the author (Henne 1976) Other methods are described in Zangenmeister
Evaluation Scheme
In forest management planning certain types of planning situations con-stantly recur eg planning the treatment of a stand to be harvested and regenerated (see the following simulation) In such a case an evaluation scheme (Abb 5) for use in all similar situations can be prepared in which step 3 and 4 of the NUWA logic are combined and systematized the possible consequences of alternatives are put in increasing order and a correspondingscale is put above the resulting matrix (in Abb 5 a cardinal scale is used)With respect to only four objectives can the consequences of the alter-natives can be measured in numerical units woos production in cubic meters gross receipts costs in marks and amount of labor in hours In all other cases only qualitative descriptions can be given--for the time being The vagueness of these descriptions and even some blanks show the field of re-search yet to be cultivated before intuition can be efficiently replaced byrational thinking in complex planning situations
Simulation of a NUWA
One of the most important tasks in medium and long-term multiple use management planning of unevenaged forests is to decide
When and how to cut a mature stand
How and with what species to regenerate the cleared area
In Abb 4 a planning situation of this kind involving five silvicultural alternatives (A1 - A5) is analyzed You will find the following inform-ation
In column 1 the objectives drawn from the System of General Objectives in Forestry presented in Abb 2
In column 2 the general weights of these objectives drawn from column 6 in Abb
In column 3 a transformation of the general weights to account for local conditions and in column 4 the corresponding normalized value of these adjusted weights
104
105
107
In columns 6 10 the value matrix for the five alternatives obtained by applying the given evaluation scheme
In columns 11 16 the Teilnutzwerte found by multiplying the values in columns 6 10 with the local normalized weights drawn from column 4
At the foot of columns 11 16 the Nutzwerte of the alternativesranging from 479 to 760 calculated by summing up the corresponding columnof Teilnutzwerte
The alternative with the highest numerical value A2 is assigned rank 1 This alternative will yield a mixed stand of deciduous trees and conifers pro-duced by natural regeneration of the existing beech stands using a shelter-wood method supplemented by planting larch and spruce
This solution is the best compromise under the local conditions the area being part of a nature park on the border of the Rhine-Main-Industrial Region
A look at columns 11 to 16 in the Teilnutzwerte (Abb 4) shows which ob-jectives contribute the most points to the Nutzwert of A2
On the one hand it is the high importance attributed to the objectives of site preservation stability and flexibility in which the principle of sus-tained yield--of all the benefits of forests--is reflected On the other hand it is the importance of recreation and landscape under the special circum-stances of the example
CONCLUSIONS
In conclusion I hope I have been able to show not only how much more transparent the decision processes can become by using NUWA but also how much weight the ecological hygienic and aesthetic objectives are given in the sil-viculture and forestry of our country
LITERATURE CITED
Henne A 1976 Ziele Zielgewichte und Nutzwertanalyse in der mittel-fristigen forstlichen Planung Allg Forszeitschr 32
Zangemeister C Nutzwertanalyse in der Systemtechnik Wittemannsche Buchhandlung Munchen Gesim
See for additional reference
Gundermann E 1972 Untersuchungen sur Erfassung Wertung and Ordnung der Erholungsfunktion von Waldbestanden im bayerischen HochgebirgeForschungsberichte der Forstl Versuchsanstalt Munchen
Henne A 1972 De Sozialfunktionen des Waldes in der mittelfristigen forslichen Planung Allg Forstzeitschr 24
Jacob H 1973 Zur Messung der Erlebnisqualitat von Erholungswald-bestanden Beiheft 9 zu Landschaft and Stadt Ulmer Verlag
108
A Methodology for Decisionmaking in Project Evaluation in Land
Management Planning
A Weintraub
Abstract In order to evaluate alternative planswildland management planners must consider many objectivessuch as timber production recreational use and communitystability The method presented utilizes the type of qualita-tive and intuitive information widely available to wildland management planners and structures this information into a format suitable for decisionmaking The method makes possible the determination of a measure of overall desirability for alternative plans and permits the evaluation of plans under alternative value systems Alternatives are compared througha small set of values assigned to each one Each number in the set represents a measure of desirability not directlycomparable to the others The planner assigns weights to each measure and obtains a unique number for each alternative The method is simple to use and flexible to permit modifications as planners gain expertise in its use
INTRODUCTION
The method proposed consists of a set of steps which provide a structured framework for choosing among alternatives when multiple objectives or cri-teria have to be considered and uncertainty exists At each step the method provides for the participation of decisionmakers specialists analysts and possibly the general public
The scheme requires the limited participation of decisionmakers and devi-ates little from generally used organizational patterns Several conceptswhich are essential for correct and efficient evaluation are emphasized
(a) Screening which allows the elimination of alternatives simply on the basis of rough cut general evaluations
(b) Evaluation of the accuracy and certainty of information used in the determination of the impacts of the alternatives
(c) Reduction to a manageable number of the impacts necessary for the evaluation of alternatives
109
(d) Visual presentation of results in tables and scoreboards which pre-sent information to the decisionmaker and to the public in a clearer way and with a simpler format of analysis
(e) Generation of potentially attractive new alternatives through modi-fication and combination of already defined alternatives
Concepts (c) and (d) are essential in presenting the decisionmakers with a clear summary of the impacts with respect to the declared goals Note that with this scheme there is no need for the decisionmaker to specify his utilityfunction or explicit preferences Although these weights simplify the selec-tion of the preferred alternatives they introduce serious methodological com-plications rooted in the complexity of utility functions
The scheme is applicable to a broad range of planning problems It is presently being used in the decision process for a recreation area project(skiing and summer activities) in the Tahoe National Forest in California The main goal of this project is to provide recreation facilities to satisfyincreasing demand in a location with very attractive possibilities The site will be developed by private capital but a large percentage of the land needed belongs to the Forest Service US Department of Agriculture As a public agency the Forest Service must consider when evaluating alternativesthe preservation of environmental quality as well as the socioeconomic im-pacts a recreation complex will have on neighboring communities
The steps of the scheme will be illustrated with examples most of which are drawn from this recreation project
THE SCHEME
The basic steps are the following
1 Define the boundaries of the problem the area of study the types of alternatives to be considered (eg Area--Tahoe region Types of alterna-tives--develop recreation facilities for winter use or for winter and summer use)
2 Identify decision-influencing elements criteria or goals Goals can be defined at different levels of aggregation (1) a general goal such as to preserve environmental quality which can be refined into (a) preserve air and water quality (b) maintain wilderness etc or (2) a primary goal such as to enhance social well-being of the population and secondary goals such as (a)promote acceptable patterns of employment (b) avoid overcrowding of services etc
3 Identify major forms of activities and areas in which they can be carried out (eg logging and range in unit A)
4 Define basic alternatives to be considered (eg alternatives emphasizingrecreation logging preservation of wilderness etc)
5 Define the major types of impacts of each alternative in relation to the goals established Include secondary effects only if they are important
110
6 Screen the alternatives Determine a set of criteria which would make an alternative unacceptable Based on these criteria find which alternativescan be eliminated without additional collection of data or finer analysis (eg general analysis may be sufficient to determine that a practice of in-tensive timber cutting in a given area results in unacceptable environmental and recreation impacts Then any alternative with that practice would be screened out) Screened-out alternatives will be reconsidered later in the light of the additional insights gained from the analysis
7 For those alternatives passing the screening process determine their im-pacts in a disaggregated and quantified form in relation to the declared goals Several models can be used for estimating partial impacts (ie econometric models to predict ski demand input-output models for estimating income and employment effects etc)
Impact information can appear in different forms
(A) Hard information data which is quantified relatively accurate and certain
(B) Nonquantifiable information impacts which may be estimated from accurate and certain input-output data but which are expressed as qualitative ratings and therefore depend on subjective evaluation (eg the acreage and condition of wilderness and scenic areas maybe known but the impact of management alternatives can only be assessed intuitively)
(C) Soft information insufficient information exists about conditions or about the consequences of management (eg impacts on timbered areas where no appropriate survey has been made)
(D) Uncertain information impacts that cannot be predicted with pre-cision The sources of uncertainty may be
(a) Uncertainty about the future of the world (eg what is goingto be the rate of increase on overall demand for recreation in the future)
(b) Technical uncertainty in projections that is the impossibilityof predicting exact impacts even if the setting in which theyoccur is known with certainty
(c) Uncertainty about the implementation of each phase of the project exactly as it is defined in the study
8 Reduce the number of impacts to be considered in this evaluation for each alternative by discarding and aggregating impacts according to the goals established
This step is needed to reduce the normally large number of impacts genera-ted in Step 7 to a much smaller number of representative impacts which will make the evaluation process in relation to the declared goals more manageable
111
The reduction of impacts to evaluate is accomplished by eliminating from con-sideration the impacts which are not likely to affect the decision (ie ex-clude impacts of negligible importance or those that do not vary much amongthe alternatives) and aggregating sets of impacts into one representative of the set which may be quantified through an index (ie aggregate into one those impacts which may be considered as one goal or subgoal such as differ-ent measures of water quality or which are highly correlated under all alter-natives such as wilderness and wildlife impacts)
The elimination and aggregation process may be modified as new alternativesare generated Control over this process can be maintained by reverting toStep 7 at any stage
9 Check the legal institutional environmental political and economic acceptability of each alternative
The detailed and aggregated information of Steps 7 and 8 allows for this analysis which can be carried out according to the specifics of the situa-tion For example a disaggregated impact of Step 7 such as air pollution measures allows a check for compliance with legal requirements while the aggregated use of impacts of employment in housing and community servicesregional economy etc facilitate a political evaluation of the alternatives
10 Generate new potentially attractive basic alternatives which are signi-ficantly different from those already proposed and return to Step 6 This step can be carried out through major mitigating actions (modifications of al-ternatives) or by combination of good elements of alternatives alreadyspecified
The steps for generating new alternatives are these
(A) For each basic alternative describe the main actions and their location
(B) For each action evaluate the main positive and negative impacts on the defined goals Also analyze composite effects of the global project
(C) For each impact determine which changes in primary conditions would reduce negative effects or increase positive effects
(D) For changes in primary conditions which would improve impactsdetermine which actions would bring about those changes and what are the trade-offs implied (ie which other impacts are also affected through those actions)
(E) (a) For major mitigating actions determine which actions have acceptable trade-off to improve impacts Generate new alterna-tives introducing these actions
112
(b) For combination of alternatives determine for two or more alternatives studied which actions lead from one to another in some aspects This procedure is used to determine combinations of elements of each alternative to generate a new one
Alternatives generated must be technically and economicallyfeasible
A partial example of the procedure is the following
(A) Basic alternative one action is to build a large ski facility in a designated area
(B) One negative effect overflow of visitors from the area in winter creates serious social problems in neighboring communities
(C) This negative impact can be mitigated by reducing the number of people going into the neighboring towns
(D) Actions which would bring about this reduction are to reduce the size of the planned ski facility or to increase substantially the lodgingand eating facilities in the recreation complex (to keep visitors in the area)
(E) Consider a major mitigating action with a substantial increase in lodging and eating facilities The trade-off of this action whichin this case consists of additional negative impacts is increased water usage waste disposal problems reduced attractiveness of the resort reduced profitability of the project If the trade-off seems acceptable a new basic alternative can be generated incorporatingthe new lodging and eating facilities
11 Determine if new areas of concern or types of impacts need to be defined If yes go back to Step 6 and check alternatives This step acts as a control as new knowledge is gained in the process
12 Present the summarized results in adequate visual format Impacts will be presented in tables by indexes (expected values and ranges will be used)Colors may be used to highlight differences among alternatives See tables 1 and 2 as examples
These tables show visual presentation possibilities for the described re-creation project for three proposed alternatives--A F and G
A Accept a project proposed by the Walt Disney Corporation to build a large winter and summer recreation complex in a designated area
F Leave the designated area untouched promote the expansion of exist-ing recreation sites
G Call for bids for a smaller recreation complex in the designated area
113
Table 1 Reduced Impact List
Table 1 is a list of main impacts Impacts are rated from 0 to 10 for positive impacts 0 to -10 for negative impacts (+10 -10 correspond to the most positive and the most negative respectively) In each case the circled number corresponds to the expected value of the impact the other two represent the range due to uncertainty (Note creating a recreation complex in the de-signated area will take away pressure from the Tahoe basin) Colors (notshown in table) are used to highlight differences eg most positive values are circled in blue next values in green etc
Table 2--Impact list with information about causes of uncertainty
The main causes of uncertainty are
1 Growth of Reno (Reno is a fast-growing city with high tourism which shares with the designated area the freeway linking to the main population center in the region the San Francisco Bay Area)
2 Secondary impacts on neighboring counties
3 growth of overall recreation (ski) demand
not sufficient information (soft information)
∆ technical incertainty
115
Table 2 is a more detailed list of impacts in a different format The number between vertical lines represents the expected impact The number of vertical lines indicate the level of uncertainty in each direction and the circled numbers refer to notes on the causes of this uncertainty
13 Evaluate alternatives presented in Step 12 Determine the most attractive alternatives (or the better alternatives) To make this determination sensi-tivity analysis should be carried out on uncertain soft or nonquantified data Sensitivity analysis should include two aspects
(a) The analysis of the stability--or robustness--of solutions For exam-ple an alternative may look very attractive when expected values are considered However once uncertainty is included it may look much less desirable due to a high probability of the least desirable outcome
(b) The indication on where more and better information is needed for sound decisionmaking For example an estimate with 15 error in the projection of timber demand may be sufficient in some cases In others a finer estimate may be crucial in the decision as to a pro-jects financial soundness
The overall impact of each alternative should also be considered that isbesides a comparison of each attribute it is important to view the global ef-fect of the alternatives and to include the intangible impacts in this assessment
If none of the alternatives selected appears completely satisfactory studywhat new aspects should be considered to generate new alternatives (ie newdecision-influencing elements criteria to improve overall impact or evenness of alternatives criteria to reduce uncertainty etc) Then go back to Step5 Otherwise continue to Step 14
14 Generate new potentially attractive alternatives marginally different from the ones selected in 13 This is done through proposing minor mitigatingactions or combination of characteristics of the (similar) alternative select-ed The mechanics of this step are similar to Step 10 where now detailed characteristics are considered A minor mitigating action might be a small modification in the time stream of timber logged to provide a more even supplyto nearby mills Alternatives generated at this stage should be technicallyfeasible and economically efficient Go back to Step 7 If no new alterna-tive is generated go to Step 15
15 Select preferred alternative
CONCLUSION
The scheme presented here has been well received by the professionals in charge of the Tahoe National Forest recreation project and is currently beingused in the decision process
The scheme allows for flexibility and some variations may be recommended in different applications It can be used effectively in a variety of plan-
116
ping situations For example for the Tahoe project it was determined that the screening process--Step 6--should be introduced after Step 9 to permit a thorough evaluation of the major impacts for every alternative This was done in order to avoid the adoption of intransigent opposition by interest groupswhose preferred alternative might be screened out
The method presented is designed to be used for land management planningeg alternatives which emphasize the multiple use and value of land timber range recreation wilderness ecology etc This form of decisionmaking is somewhat different from the evaluation and selection of single projects as in the case of the recreation project since it involves the determination of a combination of different forms of activities on areas with diverse character-istics which will make up a land management plan for a forest or land unit This multiplicity of activities allows for a richer variety of possibilities in combining elements forming a plan and must be considered particularly in Steps 3 8 10 and 14
117

OPERATIONAL FOREST MANAGEMENT PLANNING METHODS
proceedings meeting of Steering Systems Project Group InternationalUnion of Forestry Research Organizations
Bucharest Romania June 18-24 1978
Daniel Navon Compiler
CONTENTS Page
A Method of Forest Management for the Planned Introductionof Intensive Husbandry in Virgin Forest Stands 1
B Dolezal Theoretical and Computational Foundations of ManagementClass Simulation 7
Denie Gerold A Computerized Tree Growth Projection System for Forest Resource Evaluation in the Lake States 13
Allen L Lundgren and Burton L Essex Techniques of Australian Forest Planning 24
Australian Forestry Council Operations Research Techniques in the Management of Large-Scale Reforestation Programs 36
Joseph Buongiorno and DE Teeguarden Wood Transportation Systems-A Spin-Off of a ComputerizedInformation and Mapping Technique 45
William W Phillips and Thomas J Corcoran Optimal Control of Raw Timber Production Processes 54
Ivan Kolenka Large-Scale Budget Applications of Mathematical Programming in the Forest Service 60
Malcolm Kirby Forest Management Planning for Timber Production A Sequential Approach 68
Krishna P Rustagi A Two-Phase Method for Timber Supply Analysis 76
Stephen Smith Timber Management Planning with Timber RAM and Goal Programming 82
Richard C Field Analytical Aids in Land Management Planning 91
David R Betters Nutzwertanalyse 100
A Henne A Methodology for Decisionmaking in Project Evaluation in Land Management Planning 109
A Weintraub Pacific Southwest Forest and Range Experiment Station
PO Box 245 Berkeley California 94701
1978
Navon Daniel Compiler 1978 Operational forest management planning methods proceedings
meeting of steering systems project group International Union of For-estry Research Organizations Bucharest Romania June 18-24 1978 Gen Tech Rep PSW-32 117p illus Pacific Southwest Forest and Range Exp Stn Forest Serv US Dep Agric Berkeley Calif
These 14 papers were submitted to a conference of Project Group P407 Division IV International Union of Forestry Research Organizations Topics discussed included the uses of simulations analytical techniques and mathematical pro-gramming techniques in land management planning reforestation programs inten-sive forestry timber management and production tree growth wood transporta-tion and budgeting
Oxford 6[--0155 + 3]Retrieval Terms operations research analytical methods simulation land-use planning reforestation intensive management timber management resource analysis
Compiler _________________________________________________________________ DANIEL NAVON is an economist in the Stations land management and landscape planning methodology research unit with headquarters in Berkeley California
The Authors______________________________________________________________ AUSTRALIAN FORESTRY COUNCIL Banks Street Yarralumla ACT 2600 Aus-tralia DAVID R BETTERS Department of Forest and Wood Sciences Colorado State University Fort Collins Colorado 80521 USA JOSEPH BUONGIORNO Forestry Department University of Wisconsin Madison Wisconsin 53705 USA THOMAS J CORCORAN University of Maine Orono Maine 04473 USA B DOLEZAL School of Forestry Brno Agricultural University Brno Czechoslovakia BURTON L ESSEX North Central Forest Experiment Station 1992 Folwell Ave St Paul Minnesota 55108 USA RICHARD C FIELD Southeastern Forest Experiment Station Carlton Street Athens Georgia 30602 USA DENIE GEROLD Technische Universitat Dresden Sek-tion Forstwirschaft Tharandt DDR 8223 Tharandt Pinnerstr 8 A HENNE Hess Forsteinrichtungsanstaft Gressen Deutschland MALCOLM KIRBY Management Sci-ences Staff Forest Service PO Box 245 Berkeley California 94701 USA IVAN KOLENKA University College of Forestry and Wood Technology Zvolen Czechos-lovakia ALLEN L LUNDGREN North Central Forest Experiment Station 1992 Folwell Ave St Paul Minnesota 55108 USA WILLIAM W PHILLIPS University of Maine Orono Maine 04473 USA KRISHNA P RUSTAGI College of Forest Resources University of Washington Seattle Washington 98105 USA STEPHEN SMITH British Columbia Forest Service Victoria British Columbia DENNIS E TEEGUARDEN College of Natural Resources University of California Berkeley California 94720 USA A WEINTRAUB University of California Berkeley California 94720 USA and Departamento de Industrias University of Chile Cassilia 2777 Santiago Chile
PREFACE
At the XVIth World Congress held in Oslo Nor-way in 1976 the International Union of Forestry Re-search Organizations (IUFRO) reaffirmed its com-mitment to study forestry problems in the developing countries and to seek solutions This collection of papers is the contribution to this task made by the Steering Systems Project Group Division IV This project was established at the Congress at the sugges-tion of Hans Speidel Richard Plochman and Robert Magin to promote communication and collaboration among IUFRO scientists doing research in the devel-opment and application of forest management planning methods The Project Group is conducting two major activities First an International Directory of Comput-erized Planning and Research Tools is being estab-lished under the sponsorship of the Forest Service US Department of Agriculture Second international meetings are held to inform members of the state of the art in forest management planning and to promote the collaboration of all forestry researchers in addressing the challenges posed by forest management in develop-ing nations
The 14 papers collected here report on planning methods which have been successfully used in devel-oped countries and which―in the judgment of the members of the Project Group―may be useful in at-tacking problems in less developed nations Many of our members are deeply aware of their limited grasp of these problems Our sincere hope is the these papers will open a dialogue which will lead to better under-standing of these problems and to an effective collab-oration among researchers from all nations in an attack on these problems
The papers presented here span the spectrum of approaches used in forest management planning in recent decades In the first paper Bohumil Dolezal presents the classical approach to planning intensive forest management and establishes the validity of these principles for dealing with contemporary problems of developing economies
The remaining papers deal with specific planning techniques all of which―except two―require the use of electronic computers to conduct simulations solve mathematical programs or invert input-output ma-trices The papers by Denie Gerold and Allen Lundgren demonstrate the usefulness efficiency modest cost and versatility of electronic computers in modeling the behavior of forest stands and in provid-ing detailed estimates of outputs and of resources
needed for the diverse conditions typically encountered in commercial forest lands
The paper contributed by members of the Australian Forestry Council reports on six stand-growth and yield-simulation models which rely on functions de-rived from graphic analysis nonlinear estimation and generalized least squares This paper also reports on two linear programming (LP) methods The first of these provides an analysis of long-term cutting strategy for intensively managed Pinus radiata plantations The second combines LP with the simulation of stand yields determination of thinnings and clear felling yield for an entire plantation
Two additional papers report on methods integrating simulation and optimization methods The model de-scribed by Joseph Buongiorno and Dennis Teeguarden uses simulation to estimate future growth and to help managers select promising management alternatives and linear programming to find an optimum combina-tion of reforestation projects William W Phillips and Thomas D Corcoran present an interactive model which uses simulation to explore alternative market transport possibilities and linear programming for identifying optimal overall strategies
The next five papers report on methods which rely on the use of LP and a recent extension of LP goal programming Ivan Kolenka presents a model for planning the logging transport and distribution of wood assortments in the context of a planned eco-nomy Malcolm Kirby presents a budgeting model for large private or public forest enterprises which also provides an analytical framework for evaluation of overall management programs The two-stage LP methods discussed in separate papers by Krishna Rus-tagi and Stephen Smith provide a practical strategy for dealing with one of the most vexing limitations of LP the assumption of the availability of reliable informa-tion about future events Richard C Fields describes a goal programming model which provides a systematic method for dealing with a limitation of LP which has proved particularly bothersome in forestry the impos-sibility of specifying an objective function which re-flects adequately the incommensurable outputs of for-est management
David Betters reports on a model which integrates a computerized procedure based on factor analysis with linear programming and input-output analysis The computerized procedure is used to develop among planners consumers and managers a consensus of
resource use preferences Linear programming then provides optimal combinations of forest management alternatives and an input-output model estimates the impact on local economic activity and employment levels
The last two papers discuss systematic procedures for evaluating well-defined forest management alterna-tives without paying tribute to computers August Henne presents an operational version of Zangemeis-ters Nutzwertanalyse which retains the essential fea-tures of the original scheme for ranking a set of com-plementary projects Andres Weintraub reports on a heuristic procedure for selecting a management pro-gram from among mutually exclusive alternatives
The preparation and publication of this collection of papers was made possible through the collaboration of too many persons to permit giving them individually the acknowledgement and thanks which are due them Goran von Malmborg co-chairman of the Steering Systems Project Group and all our members join me in
expressing special thanks to Professor Robert Magin for inviting us to meet with the Forest Management Planning and Managerial Economics Working Group and to Professor Adolf Priesol and Director George Bumbu for their warm hospitality We also extend our special thanks to the Food and Agriculture Organiza-tion of the United Nations for allowing Dr Arnoldo Contreras to share with us his clear understanding of forestry problems in developing countries and for help FAO is giving us in reaching our colleagues in those countries
The publication of this collection of papers was funded by the Research and National Forest System branches of the Forest Service US Department of Agriculture
Trade names and commercial enterprises or prod-ucts are mentioned in this publication solely for infor-mation No endorsement by the sponsoring organi-zations is implied
A Method of Forest Management for the Planned Introduction of Intensive Husbandry in Virgin
Forest Stands
B Dolezal
Abstract The method proposed is derived from longexperience of intensive management in forest stands ofCentral Europe and from our proposal for management invirgin Iranian forests of the Caspian Region The methodestablishes the need for systematic planning of standconversion to insure both sustained yield and the har-vesting of sufficient timber to sustain economic develop-ment The method also recognises the need to integratethe planning of silvicultural activities with capitalinvestments in roads and machinery
INTRODUCTION
The method described in this paper is based on the realization that forest planning must be consistent with the political and economic situation of a de-veloping country as well as with the given natural and economic conditionsfinancial position market conditions and the technological procedures in-volved in the process of production which are all traditionally taken intoconsideration in forest husbandry A method of this kind is expected also toreflect the latest scientific achievements in understanding of the forest asan entity Market conditions must be considered to insure a reasonable fin-ancial return from management It must also be recognized that the forest is a national resource of special value in a countrys watershed management andin the development of an environment beneficial to its population
The principles discussed below and incorporated in the method for intro-ducing an intensive system of management into virgin forest stands were obtain-ed partly from what has been gathered during the past 250 years of intensivemanagement in the forest stands of Central Europe and partly from the experi-ence gained while compiling our proposal for forest management in virgin Iran-ian forests of the Caspian Region The method is based on the principles that(1) the introduction of an intensive system of management into the virgin-likeforest must be planned and (2) once converted the commercial forest must beable to produce sustained yields adequate in quality volume and monetaryvalue and must supply the market with sufficient amounts of timber in thespecies and assortments needed for economic development
1
The method for introducing an intensive system of management as suggested here is based on the idea of short-term credits which are required to make the virgin stands accessible for management for purchasing needed machineryand if necessary even for constructing wood-processing plants The short-term credit needed to secure accessibility of virgin-like forests can be es-timated by assuming that the stand regeneration will progress through areas that are spatially linked so that the transport of wood from the part of the forest which has just been made accessible passes through those which have al-ready been made accessible The availability of short-term credit indeed ap-pears to be an important requirement for the introduction of intensive man-agement in the forests of developing countries
The suggested method is based on scientific knowledge of the forest It utilizes data on the geographical and ecological classification of forestswhich serves to stratify forest land This stratification is needed to delim-it forest land planning and control units for management to define the quan-tities to be estimated and to elaborate the instructions needed to manage the forest
METHOD
Economic Evaluation of Wood Production
Delimitation of the Forest Land Resource
It would not be reasonable to introduce intensive management into forests which within a known period of time are intended to serve some other type of land utilization (such as fields meadows grassland dwelling estates) It is therefore urgent to determine on the basis of consultation with competent institutions in the country which of the forest areas will be left as perma-nent stands regardless of population increases This task appears to be ur-gent especially in the territories which are characterized either by a highor by a very low forest cover percentage compared to the targets planned for the years to come
Survey and Analysis of Natural and Working Conditions in the Forests
The primary concerns should be the survey and analysis of soil climateand terrain all of which are decisive for the future productivity of the forest stands Survey and analysis should also be concerned with the present condition of the forest stands (existing species diameter health conditionforest inventory data potential production of assortments suitable for com-mercial and industrial uses and the like) The remaining items to be eval-uated are conditions for management especially the character of the topo-graphy potential accessibility of the stands and timber transport delimi-tation of gravitational areas etc conditions for location of timber yards and sawmills the level of protection needed against forest fire and destruct-tive wind
Maps produced using photogrammetry are part of the surveys mentioned above
2
Marketing
An investigation is carried out to determine the opportunities for tradingtimber to assess the demand for timber assortments by local population and in-dustries and to estimate the export requirements as well finally the poten-tial for the processing of the timber harvest by woodworking plants is assessed
Organization of the Forest Stands
Working Circle
These are the frames for harvest regulation 1he areas range from 15 to 50000 ha They are designed to insure sustained even and sufficient sup-plies of timber in order to simplify management and to obtain the short-term financial credits needed to make the forest accessible to transport Workingcircles cover contiguous areas encompassing entire watershed or timbersheds which are homogeneous with respect to both natural and economic conditions These working circles permit the application of a uniform method of management and a uniform type of harvesting regulation Relatively large areas are covered by working circles This is made possible by the introduction of the concept of working complexes of stands which refer to land units homogen-eous with respect to production and management The only role left for the working circle is to insure sustained and even yields from the forest If required working circles can be drawn for forests managed for purposes other than timber production eg protection forests recreation forests nature reserves and the like
Working Complexes of Stands
These are defined as the groupings of forest stands with ecological pro-ductional and management characteristics so similar that they permit the in-troduction of a uniform system for (1) compilation of instructions for manage-ment (2) calculation of the index of harvest regulation and (3) calculation of the timing of management activities for the forest etc The reasons for introducing the working complexes of stands into forest management are to make the goals and the decisions of management concrete to facilitate real plan-ning and control of managerial actions and to simplify the managerial pro-cess Clearly the use of working complexes is indicated when a system of in-tensive management is introduced into virgin-like forests
Forest Compartments
These are defined as the permanent lard management units based on the forests biological and management typification They range in area from 30 to 100 ha Where possible the forest compartments are marked off by distinct characteristics of the terrain Their uniform morphological character should mesh with the network used for timber skidding and with the road system Moreover the forest compartments are supposed to be independent units also
3
from the point of view of forest protection For this reason preventive measures of protection are worked out for each compartment Compartments are surveyed and as a rule their boundaries are located using photogrammetry The forest compartments are the basic units of the forests spatial organi-zation both with respect to planning and with respect to the realization of the plan
Subcompartments
Under diversified natural and working conditions there are occasional cases when the compartment cannot cover all ecological and stand differencesit then follows that the compartment is not a convenient unit for the plan-ning control and realization of pertinent measures of management in the sec-tors of silviculture and forest protection Instead subcompartments are de-limited as a lower category of the forests spatial organization The sub-compartments are assumed to possess the same properties indicates above for the compartments--those necessary for the uniform planning of management act-ivities related to silviculture and forest protection In this particular case the planning of timber transport and skidding occurs within the frame of the compartment
HARVEST REGULATION
The principle observed is that optimum productivity be reached in the for-est stands within the compartment or subcompartment at the same time the yields produced within the frame of the working circle must be sustained and even In compliance with the requirement for simplicity and the conditions in developing countries harvest regulation should be based on area It is true that allowable cuts are derived on the basis of area and volume as well as on assortments and value but always so that considerations for the elements of volume are subordinated to those of area
Calculation of the Allowable Cut
The final allowable cut is determined primarily by the normal fellingarea according to the formula
e = inhu
where e denotes the volume of the allowable cut in stands for the normal
felling area in hectares and hu designates the average volume per hectare of the growing stock within the working circle at the time of stand maturity
This average stock per hectare of the working circle is obtained with the formula
hu = ΣihiFiΣiFi where hi denotes the per-hectare stock in stands of individual working com-
plexes Fi indicates the area in hectares of the ith working complex belong-ing to the working circle and
4
i = Fu
where F is the area of the working circle and u is the rotation of the work-ing circle calculated according to the formula
u= EiuiFiziFi
For the volume index of harvest regulation it is possible to use the final mean annual increment in stands of the working circle This is calculated bysumming up the final mean annual increments achieved in all the individual working complexes which constitute the working circle
The stand volumes per hectare of individual working complexes are obtained by determining the growing stock volume per hectare in sample plots distri-buted in individual working complexes Principles of systematic random selec-tion must be observed to obtain representative estimates of the characteris-tics of the stands of the working circle
Concerning the realization of the allowable cut the main object of the method proposed here is to promote the harvesting of the allowable cut in a contiguous area (French terms quartier de regeneration affectation unique)The method thus permits respecting the silvicultural requirements of stands in individual subcompartments or compartments within the frame of the ecological and production conditions characterizing individual working complexes In doing so harmony is achieved between the interests of silviculture and those of cutting regulation
For long rotations and the use of small-area harvesting sytems the allow-able cut in the quartier de regeneration is calculated from the formula
HO+ Ci bull P2 e = _____________
P
where HO denotes the total volume of stands in the quartier de regener-ation P stands for the regeneration period (cutting cycle) expressed inyears and Ci designates the current increment The number of regenerationtreatments is determined with respect to the ecological requirements of thespecies represented in or introduced into the stands Regeneration in thesubsequent quartier de regenerationn does not commence until completion ofthe stand regeneration in the quartier de regeneration immediatelypreceding
The harvesting in stands except for the quartiers de regeneration just under regeneration is dependent on the possibility of transporting the material exploited As a rule the plan is to utilize the wood for charcoal burning and only then carry it out of inaccessible stands on the backs of mules or donkeys Sanitary fellings are largely concerned with the removal of sick ill-shaped overaged and similar trees which if kept would not contri-bute to the value of the stand The cycle for these treatments is usuallyfixed at 10 or 20 years the volume of timber harvested per hectare in indi-vidual working complexes is estimated on the basis of a current survey of the condition of the stands
5
SYSTEMS OF MANAGEMENT AND EXPLOITATION
The method for introducing intensive management into virgin-like forests assumes the use of a system of management and exploitation that is consistent with the natural and economic conditions of the country concerned The main --and highly desirable--objective is to avoid the destruction of the forests sources of production--the soil above all--due to erosion waterlogging or excessive growth of woody plants The selection of the system of management is dependent also on the ecological requirements of the species in the speci-fic stand environment and on the technique of skidding to be employed In general it seems advantageous to prefer the small-area systems of managementthe better to maintain the forests production capability This howevershould not exclude the use of regeneration cuttings when conditions are suitable
CONCLUSIONS
In addition to what has been indicated above the method of introducingintensive management into virgin forests assumes thorough planning to carryout the management practices effectively and to use expensive harvesting and transporting machinery efficiently Another requirement is that all the com-plex aspects of forest management be taken into consideration The same a-mount of attention given to the harvesting of timber must be paid to afforest-ation of harvested areas and to the tending and protection of new stands The construction of a network of timber transport roads adequately dense and dulydistributed in space (about 15 kmha) is also a prerequisite
The method discussed in this paper is not only consistent with all the latest achievements in Central European forestry it is also consistent with the natural working and politico-economic conditions found in developingcountries
6
Theoretical and Computational Foundations of Management
Class Simulation
Denie Gerold
Abstract Investigations on complicated complexand not well-ordered systems are possible only with the aid of mathematical methods and electronic data processingSimulation as a method of operations research is particu-larly suitable for this purpose Theoretical and computa-tional foundations of management class simulation must be integrated into the planning systems of forest management and must provide a large number of alternatives for action A model already in wide use is described
INTRODUCTION
Research on complicated complex and not well-ordered systems is possible only with the aid of mathematical methods and electronic data processing equip-ment With analytical model analysis (eg optimization models) the solution algorithm yields a specifically defined result but computational experiments are more or less systematic test procedures for which there is no logicallycertain procedure for optimal solution The purpose of the computational ex-periment is to search for the optimal solution or the best corresponding de-cision Complete and partial searches are differentiated according to thescope of search processes within the framework of a given decision model In complete searches all possible constellations of variables are calculated and the optimum with respect to the objective concepts exists with certainty amongthe variants The partial search is limited to a sample of all possible searches It must be guaranteed that partial search procedures are directed toward the research goal Partial searches differentiate between pure simu-lation and design game plan In simulation one specifically formulates definitions for actual decisions through decision rules at the beginning of a series of searches In the design game plan the strategies for a searchseries are not fixed at the beginning of the game but develop in the course of the game as the result of chains of decisions
Simulation is suitable as a method for operations research because of its adaptability for analysis of systems with numerous input and output quantities and complicated structures It is distinguished by the following essential crite
7
1 A system can be simulated if it can be subdivided into a variety of elements for which the behavioral rules can be assigned
2 The simulation encompasses a mathematical model which runs but is not solved ie time is very important in the simulation
3 The process of system optimization is not directly contained in the simulation
4 The output of the modeled system is weighted in the simulation with respect to deterministic or stochastic modifications of the input A number of steps must be considered in the development of a simulationmodel (a) Formulation of goals(b) Formulation weighting and comparison of possible alternatives (c) Selection of the best alternative with respect to the objective
function (decision)(d) Control of the elaboration of decisions and eventual corrective
measures
The principle of the mathematical simulation is presented in figure 1
Figure 1--Principle of mathematical simulation in the form of a flow diagram
8
FOUNDAIIONS OF THE MANAGENENT CLASS SIMULATION
The significance of simulation for forestry problems is conditioned pri-marily by the long duration of the production process The extensive time differences between managerial measures and their effects on the forest neces-sitates the inclusion of future developments in present decisions The value of a measure can be interpreted only in view of its effect on long-term goals
The management class as a system within a sustained unit is decidedly sig-nificant for the complex planning of a forest evaluation Its stratified structure is only ascertainable through simulation of multiple alternatives in its combined time and space-related development A management class simulator (Gerold 1976) is a model based on the specific state of a tree species manage-ment class which includes all stands of a tree species cultivated for similar production goals and found within a sustained unit With this model the ef-fects of different variants of production and yield regulation on the develop-ment of this management class over long periods of time (the prognosis) can be analyzed Also the mutual correlation of the component problems of the sus-tained unit can be demonstrated The formulation of this type of model has the following foundations and requirements
(a) The model must be integrated into the total planning system of the forest evaluation It must have numerous alternatives and includetherefore many component problems of sustained yield regulation The time interval over which simulation takes place should be deter-mined by the user
(b) The stand is the active element in a management class The complex sustained yield regulation requires that the input information of the simulator refer to this conditional unit All management class data are derived from the aggregation of stand information during simu-lation The accuracy of stand information should be known to cor-rectly classify the results of the simulation model with respect to certainty within the framework of the decision aids
(c) Component models weighted and easily integrated into the planningsystem of forest evaluation are to be used for the generation of many alternatives (eg intermediate and final yield strategies)ie a large scope in the formulation of a model The scope of the alternatives is determined by the flexibility and quality of the man-agement class simulator
(d) An efficient updating algorithm which guarantees certain extrapo-lation is necessary for the simulation of stand information
(e) The model must make possible the processing of management classes of any stand ie of any age quality and growing stand density struc-ture If the memory capacity of the electronic data processing unit is not sufficient for calculation of larger conditional units becausestands are numerous then the stands are aggregates into computation units of a higher order In this case the criteria must be as follows
Age (eg 2-year intervals)Quality (eg have quality grades)Density stand volume (units of 10)
9
This facilitates the use of the simulator for sustained units of anygiven size
(f) On the basis of goals formulated for the stands and of management class information the actual conditions obtained in the individual stages of the prognostic time span and the planning magnitude are to be weighted according to valuation criteria for the age structure and the stand density From the weighting the deviation from the normis to be estimated This weighting facilitates the selection of certain planning alternatives by the planner in the context of the overall goals
(g) The following prerequisites apply for the preparation of the computed information (1) An electronic data processing unit with a large memory capacity
and high calculation speed must be available
(2) The simulation program is based on the block principle to provideflexible subroutine exchange thereby making possible simple con-sideration of new alternatives
(3) The presentation of results using a high speed printer must be inthe form of` clear and easily visible tables Automatic symbol equipment to represent the development of specific key numbers ofthe management class are to be used as much as possible
(4) The preparation of stand information is rationally possible onlythrough electronics An additional prerequisite is a functionallyefficient permanently actualized data memory containing infor-mation which can be recalled at any time using available sortingidentifiers
Figure 2 presents the general program design of a management class simula-tor to calculate a planning variant Any of the available variants (alterna-tives) can be simulated using this sequential scheme
DESCRIPTION OF A MANAGEMENT CLASS SIMULATION MODEL
A management class simulator was developed on the basis of the fundamen-tals presented in Figure 2 It is submitted as the program flow chart and calculation program using the program language ALGOL for the electronic data processing unit BESM-6 The Soviet large-capacity computer is suitable due to
its high calculation speed of an average of 106 operationssecond for the
generation of the simulation model The memory capacity of BESM-6 permits di-rect processing of management classes with a maximum of 3800 stands On the average this corresponds to an information scope of approximately 5000 hec-tares For larger conditional units an aggregation (see figure 2) should be used The stand data used (age land mature crop quality) are available in handbooks of forest management in the data bank of the forest fund Extensive information for various planning strategies is derived from these data duringsimulation for each 10-year period of the prognostic time span It is printedin the form of the following tables
10
Figure 2--Representation of a general program design in the form of a program flow chart for a specific planning variant
11
Age distribution table
Table for final cutting stands
Table for intermediate yields of stands
Summary of harvest and growth
Table of the range of harvest
The simulation model is constructed in a deterministic manner ie alterna-tives do not have any random features Its functional efficiency was tested in a series of real management classes (Gercld 1976 Gerold and Kurth 1977Kurth and Gerold 1977 Gerold 1978)
LITERATURE CITED
Gerold D 1978 Effect of age structure on the growth increment capacity of management classes Wiss Ztschr der Tech Univ Dresden 27(2)
Gerold D 1976 Untersuchungen zu Problemen der Verknupfung einzelner Nachhaltbegingungen mit Simulationsmodellen fur die Baumart Fichte [Investigations on the problem of decisions for individual sustained conditions using simulation models for spruce species] Dissertation ATharandt
Gerold D and H Kurth 1977 Proposals for further development of a normal forest model Wiss Ztschr der Tech Univ Dresden 26(2)497-501
Kurth H and L Gercld 1977 Simulation model for sustained yield regu-lation Paper presented at the IUFRO Symposium Subject Group S04Session Zvolen Sept 12-15 1977
12
A Computerized Tree Growth Projection System for Forest Resource Evaluation
in the Lake States
Allen L Lundgren Burton L Essex
Abstract A computerized tree growth projection sys-tem has been developed for the Lake States Region as partof a larger Forest Resources Evaluation Program (FREP) Incorporating data from more than 1500 permanent growth plots throughout the Lake States this system projects tree growth mortality regeneration and removals in stands with any mixture of tree species and sizes for the full range of sites encountered in the field It incorporates the latest published timber management guides for the Lake States It can identify silvicultural treatment opportunities now and in the future from the plot data or representative tree lists for a single stand a management unit an entire forest property oran entire state or region It can also be used to update tim-ber inventories and to project future yields and resource conditions in response to alternative silvicultural treatment opportunities for timber resource evaluation and assessment
INTRODUCTION
A comprehensive inventory of forest resources is essential for land man-agement planning but by itself is not sufficient An inventory provides a detailed picture of the resource at one point in time The forest is not a static entity but a dynamic biophysical system A full description of such a system must contain not only an estimate of its present state but also a des-cription of its potential future change Without provision for continual up-dating an inventory only produces a fading portrait of a resource that is changing with each passing year as regeneration growth death and cutting of trees takes place To be fully useful to the land manager and planner a com-plete resource inventory system should continually update the inventory toprovide current data about the condition of the resource It also should be capable of estimating future charges in the forest resource in response to a range of possible resource management alternatives including that of no tree cutting
A tree growth projection system is a necessary part of a dynamic forest
13
resource inventory system It must be capable of updating and projecting tim-ber inventories in a form suitable for evaluating resource management alter-natives for large areas with diverse forest conditions To do this it must be able to handle all species and stand conditions in a forest area require only a minimal amount of input data such as would be available from existingresource inventories and be computationally efficient
Developing a tree growth projection system capable of describing the dy-namic behavior of complex ecological communities such as the intricately mixed northern hardwood-conifer forests of the Lake States has long challenged inven tory specialists and growth modelers Stand growth models have been developedfor several single-species forest types such as Pinus resinosa Ait (Buckman 1962) Picea mariana (Perala 1971) and Populus tremuloides (Schlaegel 1971)Such models have been useful in developing stand management recommendations for even-aged stands with a single species However models have been devel-oped for only a few Lake States species and existing models fail to describe the behavior of the mixed-species mixed-sized stands common to the Lake States Stand models have been developed for some mixed-species forest types for some areas of the Lake States (for example Dale 1972 Ek 1974 and Moser 1972) but again coverage of the resource base is far from complete Individ-ual tree models for more general mixed-species stands (Ek and Monserud 1974)are expensive to run and require more data than is available from most forest inventories
Available growth models have provided valuable insights into tree andstand growth but by themselves are not adequate for a forest-wide tree growth projection system Efforts to assemble individual growth models and link them into a more comprehensive system have been frustrated by the lack of common in-put requirements and data outputs as well as incomplete coverage of theresource
TRAS a computer program for projecting timber volumes was developed and used by the US Forest Service to update inventories and project future tim-ber volumes for large forest areas (Larson and Goforth 1970) However this program was not designed as a stand model to account for interactions amongsize classes of trees in response to alternative silvicultural treatments It lacks the ability to closely model biological tree response to stand treat-ments in the mixed forest ecosystems common in the Lake States in the detail needed for evaluating treatment opportunities
The need is to develop a comprehensive tree growth projection system speci-fically designed to project tree growth for all species in all stands for largediverse forest areas in encugh detail to update forest inventories and eval-uate stand treatments
THE PROJECTION SYSTEM
After several years of work scientists at the North Central Forest Experi-ment Station of the Forest Service (US Dep Agric) have completed and tested a computerized tree growth system for the forests of the Lake States Region Developed using data from more than 1500 permanent growth plots in
14
all major forest types in the Region the projection system reliably projects stand development with or without tree cutting for several decades for all for-est conditions found in Michigan Minnesota and Wisconsin
This system inexpensively projects individual tree growth mortality and regeneration with or without tree removals for products in stands with anymixture of tree species and sizes and any density over the full range of sites encountered in the field The latest published timber management guides for the Lake States species are incorporated into the system These are used to identify silvicultural treatment and timber harvesting opportunities now and in the future from the plot data or representative tree lists used to des-cribe a single stand management unit or an entire forest property state or region The projection system has been linked to the US Forest Services national forest inventory system in the North Central Region However it can be adapted readily to other growth projection needs
Input to the projection system is a list of individual trees that represent a forest stand At a minimum the list must have the tree species and diam-eter breast high of each tree listed along with each trees expansion factor to indicate the number of trees per acre each tree represents Other infor-mation should include tree condition (alive cut or dead) and stand varia-bles such as site index and age Tree growth mortality and regeneration are projected for any time period (in increments of a year) or sequence of periods selected by the user
A major advantage of this projection system is that the integrity of the individual tree list is maintained throughout the projection period so no information about the resource is lost through aggregation At the end of each projection period the system produces an updated list of trees in the same format Thus programs available to summarize data from the initial tree list or inventory can be used to summarize data from the program output tree lists as though they were a new inventory It will be necessary to update other data that are subject to change that are not handled by the projection system at present such as land use or ownership change changes in site index due to change in forest type and special tree measurements such as merchant-able bole length log grades or cull percent
Silvicultural treatment prescribed for each acre each year or time period is identified by kind of treatment and forest type A cost algorithm deter-mines the cost of each treatment by time period for the acres indicated Trees to be cut are designated by the appropriate silvicultural treatment The system then projects stand development forward for the desired number of years with the trees left after cutting If desired the process may be repeated Timber harvested in each time period can be produced in detail in-cluding cubic foot volume by species and 2-inch diameter class within each type Mortality volumes can also be summarized in detail Inventory volumes before and after each cut can also be obtained in the same way The difference in future stand development with and without treatment can be identified from this information and can be used for economic appraisal of stand treatment opportunities either on an individual stand or forestwide basis
The timber projection system has been tested extensively and has provided results well within acceptable limits of accuracy The tests consisted of
15
projecting first occasion inventory plots which had not been used to developmodel coefficients and comparing the projected value with actual values that were recorded on sucessive [sic] plot measurements
The system was designed for inexpensive computing so thousands of surveyplots could be updated annually to provide current Regionwide inventory data Computing costs have been about 6 cents to project the tree list from a single plot for 10 years and develop summaries of inventory and harvest volumes
USE OF THE SYSTEM
This Lake States system has been used to update all the survey plots in Wisconsin from the most recent inventory (1967-69) to 1978 Removals for timber products were accounted for to provide a current inventory estimate Similar inventory updates have been done for individual national forests in the Lake States Plans are to periodically update each state-wide inventoryas needed to provide estimates of the current status of the forest resource throughout the Region in as much detail as the original inventories
The system also has been used to update and project inventories of indi-vidual national forests of all state-owned land within a state survey unitand of other forest land in response to silvicultural treatment opportunities for timber production The output showed timber volumes harvested and timber volume inventories by decade for the next fifty years
The development of individual stands in several National Forest Compart-ments in Michigan was projected for fifty years both with and without timber cutting to show how the system could be adapted to the Forest Services com-partment examination procedures These illustrate only some of the ways the system can be used
THE SYSTEMS POTENTIAL
This timber growth projection system is designed to be the core of a larger Timber Resource Evaluation System that will evaluate timber management oppor-tunities on a local state or regional basis from an economic social or eco-logic point of view The evaluation system is still being developed but the output from the projection system can be used with existing evaluation proce-dures and programs The mathematical structure underlying the timber project-tion system was designed to allow for including other components of the eco-system besides trees--for example a link between trees and understory vege-tation is now being developed
The timber projection system developed for the Lake States has tremendous potential Now for the first time we have a computerized system that can project forest resource development in response to timber cutting or no tim-ber cutting for all forest conditions in the Region It answers the long-felt need for a method to project future renewable resource supplies in re-sponse to treatment for evaluating management opportunities It will beuseful for timber management planning and program development for state and
16
regional resource assessments Further it can be used to update resource inventories to provide a reliable current estimate of present resource conditions
The concepts used in developing the timber projection system are general and have potential for wide application We plan to continue development of FREP as rapidly as possible expanding the system to the rest of the North Central Region and to other resources We also plan to work with others to test the applicability of the FREP tree growth projection system to other regions of the United States
Another exciting concept will be to incorporate the tree growth projection system into the remeasurement design of forest inventories A first step of the new inventory procedure could be to classify plots established at the time of the previous survey into disturbance classes This might be done usingLANDSAT data conventional photography or a combination of the two Undis-turbed plots could be grown to the date of the present survey using the tree growth projection system These plots could then be sampled to determine what corrections if any need to be made in the projections to represent current inventory conditions accurately Disturbed plots could be remeasured on the ground together with new plots such as might be found in agricultural areas that have reverted to forest These plots would be processed in the con-ventional way The two data sets would then be combined to form the infor-mation base for the new survey
This procedure could substantially reduce the cost of todays remeasure-ment surveys but still provide a detailed tree list of each plot that may be used in the projection system
Acknowledgment The timber growth projection system was developed jointlyby a team of researchers at the North Central Station This team included Dr Rolfe A Leary Jerold T Kahn Roland G Buchman Gary Brand Brad SmithMargaret Holdaway Jerrilyn LaVarre Thompson and Linda Christensen each of whom had responsibilities for major aspects of the study A collection of papers outlining the system in some detail is being published as USDA Forest Service General Technical Report NC-47 North Central Forest Experiment Station St Paul Minn
17
APPENDIX1
A general description is given here of the input needed how the parts are put together and what output is produced
Input
The input consists of a parameter deck and a tree list A tree list con-sists of tree species dbh crown ratio and quality class for a group of individual trees Also required are the following plot attributes site index stand age and plot size
Parameter deck
The parameter deck specifies two groups of input values (A) user selected options and (B) numerical constants needed by each portion of the growth processor
Numerical constants are used for
Assigning species group codes to individual trees Crown ratio function coefficients Silvicultural treatment specifications Volume equation coefficients Mortality equation coefficients Potential growth function coefficients A species grouping priority matrix (used for combining species when more than three species occur on a plot)
These values are determined from calibrating the model on a specific data base of permanent (remeasured) plots
Projection-related options that may be selected by the user are
Length of projection cycle (years)Number of projection cycles Type of growth projection desired (validation projection or update)
The number of years the tree list is projected is determined by the number and length of the cycles The projection is limited to a maximum of 100 years but it may be in the form of 100 cycles of one year each or one cycle of 100 years The length of the cycle determines how often summaries are made and the tree list examined for management opportunities
____________________ 1 This material is abstracted from a forthcoming publication Hahn Jerold T and Gary Brand A program for implementing a generalized forest growth projection system USDA Forest Serv Gen tech Rep NC-47 North Central Forest Exp Stn St Paul Minn
18
Three different types of growth projections can be selected validationprojection and update A validation run uses a tree list with measurements recorded for several different years The tree list is projected from the initial measurement to the final measurement Projected and actual measure-ments are compared to determine the accuracy of the model A projection run begins with initial conditions and grows the trees for a specified length of time to estimate future conditions An update run begins with initial con-ditions from the past and grows the trees to the present Known product re-movals are used to extract the trees that produce those products from the tree list
Tree list
The tree list can be in one of three different formats (1) a list format (2) a unit record format as used by the US Forest Service Renewable Resources Evaluation (forest survey) projects or (3) a computer-readable format in which the user is responsible for supplying the necessary computer code for input and output routines
PROGRAM ORGANIZATION
Besides providing inputoutput capability the program controls when the different parts of the system are used according to the options selected The listing below gives all the subroutine and funtion [sic] names their calling rou-tines and a brief statement of their purpose The program has seven parts
1 The main calling program2 A function VALUE where all mathematical equations are located 3 Input subroutines 4 A subroutine for aggregating the input tree list 5 Stand treatment subroutines 6 Stand growth subroutines 7 Output subroutines
Subsystem TRES (Timber Resource Evaluation System) of program FREP (Forest Resources Evaluation Program)
1 Main program
Program TRES Main calling routine sets up and initializes arrays performs housekeeping functions organizes calling of subroutines
2 Mathematical functions
Function Value Called from RMASTR RSURTP GROW ISUM OUTPT1 and OUTPT2 Computes values for crown ratio potential growth modifier mortality and volume
19
3 Input
Subroutine READ Called from TRES Reads user-selected options and numerical constants and echo-prints all values
Subroutine RMASTR Called from TRES Reads data from binary files in NASZER format into arrays TRS and ITRS Initializes array parameters
Subroutine RSURTP Called from TRES Reads data from files in forest survey unity record format into arrays TRS and ITRS Initializes array parameters
Subroutine OPENRD Called from RSURTP Unblocks forest survey unit record file and supplies one record at a time to RSURTP Has entry point READIT
Subroutine RUSER Called from TRES Supplied by user to read their data file into arrays IRS and ITRS
4 Aggregation of species
Subroutine FIT Called from TRES SCREEN and REMOVE Classifies trees in arrays TRS-ITRS into projection groups
5 Stand treatment
Subroutine SCREEN Called from TRES Screens plots for possible treatment andor sets up treatment schedule
Subroutine COVTYPE Called from SCREEN Determines cover type using live trees in tree list
Subroutine TREAT Called from SCREEN Performs silvicultural treatments prescribed in SCREEN
20
6 Stand growth
Subroutine GROW Called from TRES Grows trees selects trees for mortality updates TRS and ITRS array
Subroutine REMOVE Called from CROW Removes trees to meet specified annual removals for updates or trees recorded as having been removed by remeasurements
Subroutine ISUM Called from GROW OUTPT1 TRES Summarizes trees into classification groups and computes group totals
7 Output
Subroutine OUTPT1 Called from TRES Outputs summaries for specified points in time
Subroutine TFILE Called from TRES Outputs updated forest survey unit record file
Subroutine OPENWR Called from TFILE Writes blocked unit record tape Has entry points WRITIT and CLOSWR
Subroutine OUTPT2 Called from TRES Outputs file for validation tests
Subroutine OUTUR_ Called from TRES Supplied by user to output updated tree list to their specifications
When all input (parameters and tree list) has been read the tree list is partitioned into species groups and size classes by subroutine FIT called from the main program TRES
Selecting the option to manage the stand as it is being projected causes subroutines SCREEN COVTYPE and TREAT to be called COVTYPE which is also called at the end of a projection by OUTPT2 determines the cover type and TREAT performs the silvicultural treatments selected in SCREEN Trees selec-ted for removal are designated as cut and the live trees are again divided into species and diameter groups by a recall of subroutine FIT This allows the changes in species composition caused by cutting to change the species groups thereby changing the numerical constants used to project the plot
21
The tree list is projected one year at a time for the number of years in a cycle by subroutine GROW REMOVE and ISUM The crown ratio function poten-tial growth function and modifier function are used to determine individual tree growth Dead trees are determined using the mortality function and the pseudo-random number generator
OUTPUT
Four different output types are possible
(1) Yield table type output containing such variables as basal area and number of dead trees number of surviving trees basal area and sum of diameters on a per plot and per acre basis and cut tree volumes on a per acre basis This output is given by subroutine OUTPT1 and is available at the end of each cycle as well as at the beginning andend of the projection period
(2) A new Renewable Resources Evaluation (forest survey) unit record file (subroutine TFILE and OPENRD)
(3) A file for validating the projection system This is produced bysubroutine OUTPT2 and has meaning only if two or more measurements have been made on the plot The file produced by OUTPT2 is ordinarily stored on disk and analyzed by a separate user-written program
(4) A user-designated output file (subroutine OUTUR)(5)
LITERATURE CITED
Buckman Robert E 1962 Growth and yield of red pine in Minnesota US Dep Agric Tech Bull 1272 50 p illus Wash DC
Dale Martin E 1972 Growth and yield predictions for upland oak stands 10 years after initial thinning USDA Forest Serv Res Paper NE-241 21 pillus Northeastern Forest Exp Stn Upper Darby Pa
Ek Alan R 1974 Nonlinear models for stand table projection in northern hardwood stands Can J For Res 4(1)23-27
Ek Alan R and Robert A Monserud 1974 FOREST a computer model for simulating the growth and reproduction of mixes species forest stands Res Rep Sch Nat Resour Univ of Wis Madison Wis 85 p illus
Larson Robert W and Marcus H Goforth 1970 TRAS--a computer program for the projection of timber volume US Dep Agric Agric Handb 37724 p illus
Moser John W Jr 1972 Dynamics of an uneven-aged forest stand Forest Sci 18(3)184-191
22
Perala Donald A 1971 Growth and yield of black spruce on organic soils in Minnesota USDA Forest Serv Res Paper NC-56 16 p illus North Central Forest Exp Stn St Paul Minn
Schlaegel Bryce E 1971 Growth and yield of quaking aspen in northcentral Minnesota USDA Forest Serv Res Paper NC-58 11 p illus North Central Forest Exp Stn St Paul Minn
23
Techniques of Australian Forest Planning
Australian Forestry Council
Research Working Group No 21
Abstract Computer modeling has been extensivelyadopted for Australian forest planning over the last tenyears It has been confined almost entirely to the plan-tations of fast-growing species for which adequate inventorygrowth and experimental data are available Stand simu-lation models have replaced conventional yield tables andenabled a wide range of alternative strategies to be eval-uated for each individual stand Simulation models for entire plantations have been found invaluable for the prep-aration of 1- to 5-year cutting plans and for regulatingthe yield over 20- to 60-year periods Many models have been constructed and found to be simple and highly cost-effective Optimization models using linear programminghave been constructed for yield regulation and found to givepowerful insights into the interactions between the variousalternatives available for all stands However these modelsare expensive and require considerable data and expertiseThey are difficult to maintain especially when staff change
INTRODUCTION
This paper reviews Australian experience with the planning techniques used for plantations and some even-aged natural forests in the light of their po-tential usefulness to developing countries Australia has a century of ex-perience with industrial plantations of fast-growing exotic species such asPinus radiata which have been planted extensively in developing countries in recent years During the last 10 years planning methods have been completelychanged by the development of computer modeling techniques and it is to experi-ence gained in this change that the paper is addressed
1 Research Working Group No 2--Mensuration and Management is one of severalgroups set up by the Australian Forestry Council It consists on one or twoplanners from each of seven government forest services as well as representa-tives from industry and universities Members of the group are concerned both with developing new models and with the routine preparation of managementplans based on their results
24
The extent to which modeling has been adopted and the type of models de-veloped in each region have been determined largely by the data required and available Data collection in the mixed-species mixed-age natural hardwood forests is very difficult and has often not been warranted by the slow growth and low value of the stands very few models have been built for these forests By contrast extensive inventory growth and experimental data have been col-lected for long periods in the single-species even-aged fast-growing and valuable plantations It has been found often that the available data did not cover as wide a range as was needed to enable models to examine new options for the future In particular existing inventory data has rarely been suitable for the construction of growth models Wider ranges are being included in the designs of many new experiments
Thorough testing of the models is of great importance and is generally doneon a continual and long-term basis by comparing estimated yields with actual deliveries to mills Several effects such as errors of growth estimation or modeling thinnings quantity of residues degree of utilization and conversion factors are confounded in such comparisons However adequate performance in the tests is essential for management acceptance of the forecasts made by the models
SIMULATION OF GROWTH AND YIELD
The simulation of growth and yield with computer models has been a consid-erable advance on the use of standard yield tables because the effects of manymore silvicultural and management options can be examined quickly and because the individual conditions of each stand can be allowed for
Each model described comprises several biometric functions forecasting thedevelopment of various stand parameters which are combined into a compatible system enabling the stand as a whole to be characterized The key functions are those to forecast height and basal area or volume growth and to estimate the effects of tree breeding and alternative silvicultural options such as cul-tivation fertilization or thinning Almost all these functions were con-structed with data from repeated measurements of permanent growth plots and de-signed experiments and only a few from stem analysis or inventory data
Some other functions such as those describing stem form or volume basal area and height relationships are also needed Useful functions were often prepared initially by hand-drawn graphical analysis and early modeling was based on computerized versions Linear regression analysis has now almost en-tirely replaced graphical analysis More advanced forms of analysis are beingintroduced such as nonlinear estimations and generalized least squares As some extrapolation has almost always been necessary the forms of the growth functions have had to be chosen very carefully
There has been a gradual shift towards more intensive silviculture in Australia as elsewhere in the world The stands now being planted are ex-pected to grow differently from those which provided the data for the growth functions currently used The methodology needed to allow for this differencethe nature of interactions between effects (eg tree breeding and thinning)and the long-term upper limits to growth of stands grown under new conditions are matters requiring considerably more research
25
Stand Simulation Model 1
Organisation APM Forests Pty Ltd PO Box 37 Morwell Victoria 3840
Information JB Dargavel
Forest 40000 ha of Pradiata supplying a pulpmill and amp a sawmill There is a wide range of sites and there is very little land available for purchase economically
Objective Generate alternative strategies for each stand for subsequent selection by optimisation model
Time Span 25 years
Input Inventory plot data from existing computer system
Method Functions constructed by linear regression from permanent growth plot data forecast height and basal area increments Responses to fertiliser weed control and tree breeding estimated from experiments Volume yield by thinning and clear felling calculated by size and wood basic density classes
Output Stand development yield cash flow for each of an average of 50 alternative strategies for each of 200 stands Each strategy represents a different combination of 1 establishment method (2 alternatives) 2 thinning method (3 grades) 3 later fertilisation (YesNo) 4 clear felling age (10 possible ages)
Application Provide input to plantation optimisation model
Evaluation in Organisation Has enabled wide range of silvicultural options to be examined Major difficulties are estimation of how stands will grow under combinations of alternatives that have not yet been tried Research needed on interactions and upper limits to growth
Assessment for Developing Countries Useful for generating yield tables Tabular presentation of standard or example strategies
necessary if immediate computer access not available Accuracy depends on relevance of growth functions incorporated
Reference Turner BJ Bednarz RW and Dargavel JB (1977) A model to generate stand strategies for intensively - managed radiata pine plantations Australian Forestry 40 (4) 255-67
Stand Simulation Model 2
Organisation Queensland Forestry Department 388-400 Ann Street Brisbane Queensland 4000
Information B Stark
Forest 38000 ha of native conifers (predominantly Auracaria cunninghamii) and 60000 ha of Pinus species predominantly Pelliottii and Pcaribaea but also Pradiata Ptaeda and Ppatula
Objective To calculate both short and long term yields cash flows and standing volumes and values at any nominated time for various management alternatives
Time Span Short term up to 20 years and long term up to 60 years
Input Inventory plot data and 1 dbh strip samples from existing computer system
Method Functions constructed from inventory and experimental data forecast height and basal area increments and are used to calculate new diameter distributions Currently the model requires the alternative strategies for any given stand from a measured sample but in the future the model will generate the strategy given certain broad guide lines A wide range of alternative thinning strategies can be examined
Output The model projects and thins the stand table in 1 cm dbh classes for each cutting unit producing estimates of basal area predominant height volumes and values
A very wide range of groupings or listings is available including time period options stand conditions (basal area predominant height age etc) size assortment by quality classes for the stand and thinnings volumes and values for the stand or thinnings using current pricing and tables of predominant height volume and basal area information for direct comparison with the actual plotsgiving a continuing check on the model predictions
Evaluation in Organisation A plantation simulation is provided by aggregating the simulations of each stand The resulting short term calculation (up to 5 years) has been very successful in organising logging and new sales
Assessment for Developing Possibly the basal area increment prediction method could be very useful to countries with Countries young plantations and limited data
26
Stand Simulation Model 3
Organisation
Information
Forest
Objective
Time Span
Input
Method
Application
Evaluation in Organisation
Assessment for Developing Countries
References
Stand Simulation Model 4
Organisation
Information
Forest Objective Time Input
Method
Output
Application
Evaluation in Organisation
Assessment for Developing Countries
Woods amp Forests Department PO Box 162 Mount Gambier South Australia 5290
NB Lewis A Keeves and JW Leech
70000 ha of Pradiata plantations managed on an approximately 50-year rotation with up to six commercial thinnings and with a comparatively even distribution of age classes
To predict the yield of plantation stands of radiata pine from age 92 site quality assessment to the end of rotation
10 - 50 years
Permanent sample plots data - plots measured for volume every 2-3 years Some plot trends exceed 40 years
Graphical methods using the directing curve technique
Incorporation in long term planning models for even-aged stands
The technique has been used successfully for over 30 years to regulate the total cut from a profitable state afforestation enterprise keeping the cut as near sustainable maximum as possible The model is very nearly as precise a prediction model as the best nonlinear model developed
Advantages -1 it is simply revised as more data becomes available 2 being subjective local knowledge of data relevance and accuracy can be incorporated 3 does not need computer 4 does not need statistical expertise
Disadvantages -1 precision is unknown 2 it may be biased
Lewis NB Keeves A and Leech JW (1976) Yield regulation in South Australian Pinus radiata plantations Woods amp Forests Bulletin23 Adelaide
Woods amp Forests Department PO Box 162 Mount Gambier South Australia 5290
JW Leech
As for Model 3
An alternative to the method used in model 3 Nonlinear regression analysis using Generalised Least Squares and optionally Bayesian informative priors
It will be incorporated in a revision of the South Australian plantation simulation model for long term planning
Incorporation in long term planning models for even-aged stands
The algorithms used offer considerable advantages over the commonly used linear regression analysis using Ordinary Least Squares-1 alternative biologically sound hypothetical models can more readily be formulated as
nonlinear models than as linear models 2 Generalised Least Squares provides a statistically sound way of utilising long term trend
data 3 Bayesian statistical methods enable thinned and unthinned plot data to be incorporated
in the one analysis These complex techniques are necessary if a mathematical model for radiata pine is to be a superior predictor to yield tables developed by the directing curve trend technique Further these extensions provide a more precise prediction model that is statistically sound
The technique used requires good long term data which could be obtained only from -1 remeasured plots or 2 stem analysis
27
Stand Simulation Model 4 contd
References
Stand Simulation Model 5 Organisation
Information
Forest
Objective
Time Span
Input
Method
Output
Application
Evaluation in Organisation
Assessment for Developing Countries
Stand Simulation Model 6
STANDSIM
Organisation
Information
Forest
Objective
Time Span
Input
Method
Output
Application
Further the technique requires access to computing facilities and also requires a sound statistical knowledge
Given these factors the technique offers considerable promise for yield prediction in even-aged stands
Ferguson IS and Leech JW (1978) Generalised Least Squares estimation of stand yield functions Forest Science (in press)
Tasmanian Forestry Commission199 Macquarrie Street Hobart Tasmania 7000
PR Lawrence
29000 ha of Pradiata plantations managed for sawlog and pulpwood production on rather conservative thinning regimes delayed to varying degree because of poor current market demand
To predict thinning and clear-felling yields from stands of various ages site indices stocking class and thinned states Inclusion in forest simulation model assuming current treatment regimes
Up to 40 years in periods of up to 3 years
Either data from sample plots or when used in the forest model estimated values of mean dominant height basal area and mean dbh obtained from age site index and thinned state of each patch of forest recorded in the area information system
The three basic parameters predicted are mean dominant height basal area increment and increment in mean dbh The heightage relationship was obtained by non linear methodsthe other two by linear least squares all from permanent plots Thinning yields and the new starting point after thinning are predicted from past records of standard treatment Volumes are calculated from stand volume equations
Values required for the forest simulation model including mean dbh entire stem volumeand volume to four top diameter limits for either thinnings or clear-fellings
Simulation of a forest
The major limitation is that the results can only apply to stands treated in the same manner as in the past Since new treatment regimes are being adopted the use of these models invery limited The major source of inaccuracy of prediction was found to be in estimatingthe starting points
Few developing countries are likely to adopt the very conservative thinning regimes modelled
Forests Commission Victoria 601 Bourke Street Melbourne Victoria 3001
RB Smith
Even aged monospecific natural stands Eucalyptus regnans Edelegatensis Esieberi and approximately 75000 ha of Pradiata plantations
The future growth of a stand of any age is modelled for any period for various sites and thinning regimes
Commonly 25 -40 years with annual or 5 yearly growth cycles
Individual tree data by 10 cm size classes also rotation length site index thinning regimes
STANDSIM is a deterministic model which projects the development of a hectare of forestfor various sites and thinning regimes operating on individual tree data stored mainly as an array of tree diameters In each growth cycle the trees are grown and if necessary thinned by natural mortality or cutting Growth takes place by updating the diameters accordingto gross basal area increment and other functions
At the end of each growth cycle stand data including basal area stocking and dominant height of live trees gross increment net increment mortality and thinning information
Output from this model is used in systems for scheduling the cut from large areas of forest It can also be used to study a range of cutting options for example the number and timing of thinnings and timing of final harvest A stochastic version of this model hasbeen developed for studies of risk and uncertainity [sic]
28
Stand Simulation Model 6 contd
Evaluation in Organisation The model has been highly successful because users were involved in construction and testing
Assessment for Developing Countries A simplified form of the basic growth model would be potentially useful in even-aged forest
areas for which large scale industrial developments are proposed Advantage -1 the ability to study a whole range of thinning and clear felling options
Disadvantages -1 the model refers to monospecific stands only 2 model assumes fairly regular spacing 3 no allowance for defective stands
Reference Opie JE 1972 STANDSIM - a general model for simulating growth of even-aged stands Proc 3rd Conf Advisory Group of For Statisticians Section 25 IUFRO Jouy-en-Josas France Sept 1970
SIMULATION FOR CUTTING PLANS AND YIELD REGULATION
Computer models which simulate the future yield of entire plantationsthat is all stands considered together have become indispensable aids for preparing 1- to 5-year cutting plans and for regulating the yield over 20- to 60-year periods
The models described in this section simulate the development of the plan-tations and the production of wood according to initial starting values of such things as the area and conditions of existing stands land availabilityplanting rate and the quantities of wood demanded for industrial developmentsSome models include forecasts of cash flows and economic results
For each year of the simulation the plantation models forecast the growth of each stand using yield tables or the stand simulation models described earlier Stands are then scheduled for cutting according to built-in decision rules and the overall yield for the year calculated
By altering the starting values and repeating the simulations a range of alternatives can be generated from which the planner can select the most suitable The models are used to schedule stands for clear felling and to evaluate the timing and type of thinning operations particularly in relation to the demand for small-diameter roundwood In long-term planning the models are used to evaluate alternative planting rates and investigate how proposed new industries might be supplied
The models vary considerably in their complexity depending on the extent to which the variations in site are identified and on the nature of the deci-sion rules used for selection The simplest models consider only the averagesite and extend the areas of each age class by a standard yield table Bycontrast several of the models consider each separate stand and simulate their development with stand growth and yield models imbedded within the overall plantation model
29
Plantation Simulation Model 1 CUTTING PLAN Organisation APM Forests Pty Ltd
PO Box 37 Morwell Victoria 3840
Information JB Dargavel
Forest 40000 ha Pradiata plantations
Objective Schedule stands for cutting to supply a pulpmill and sawmill
Time Span 6 months - 3 years
Input The age basal area height and stocking of each cutting unit its area and suitability for summer or winter cutting
Method Includes a stand growth model Selects stands for cutting by priority rules based on operation due need for thinning quality of sawlogs and volume to be met
Output Schedule of stands to be cut and volume of each product
Application Preparation of operational cutting plans
Evaluation in Organisation Comparatively cheap to develop Easy to use and emend
Assessment for Developing Cost effective Scheduling could be done manually Countries
Reference Dargavel JB and Marshall PJ 1976 Annual cutting plans for developing plantations Proc IUFRO Working Group S 4024 XVI World Congress Oslo
Plantation Simulation Model 2 CUTTING PLAN
Organisation Woods amp Forests Department PO Box 162 Mount Gambier South Australia 5290
Information A Keeves and JW Leech
Forest Some 70000 ha of Pradiata plantations managed on an approximately 50 year rotation with up to six commercial thinnings and with a comparatively even distribution of age classes
Objective To predict the yield of a group of plantation stands of radiata pine in the next commercial thinning
Time Span 1 - 6 years
Input Inventory data yield prediction models proposed thinning treatment and tree size assort-ment tables
Method Linear regression analysis was used to predict tree volume and increment from tree diameter stand height site quality and stand density for both thinnings and clear felling Inventory data are from temporary 01 ha plots
Output A tabular five year cutting plan listing operations to be carried out and expected yields in a range of size assortments
Application In preparing the next 5 year cutting plan which will direct where commercial thinning and clear felling will take place to meet commitments to utilisation plants in a variety of required size and quality assortments
Evaluation in Organisation A limited test using independant data indicated the approach was satisfactory for practical use
Assessment for Developing This type of model is of use when short term (1-6 year) increment is considerable and will Countries affect planning This is of particular importance when a fast growing plantation resource is
being utilised close to its capacity
Reference Lewis NB Keeves A and Leech JW (1976) - Yield regulation in South Australia Pinus radiata plantations Woods amp Forests Bulletin 23 Adelaide
Plantation Simulation Model 3
CUTTING PLAN
Organisation Forests Department of Western Australia Barrack Street Perth Western Australia 6000
Information H Campbell
Forest 45000 ha Pradiata and Ppinaster plantations
30
Plantation Simulation Model 3 contd Objective Development of 1 and 5 year logging plans Planning the timing and extent of forest
industry expansions
Time Span Open ended but generally 1 or 5 years
Input Continuous inventory plot measurement data
Method Simulation of growth by a stochastic model Thinning operations and silvicultural and marketing priorities are set interactively
Output For each year of the planning period a list of areas to be treated and volumes by assortments is produced Also a resource summary is prepared
Application Scheduling thinning operations in pine plantations could also be used to develop strategies for input to an optimising program
Evaluation in Organisation After a slow start the model is gaining in use and acceptance in direct proportion to the degree of pressure put on the plantation resource
Assessment for Developing The growth routines are specific to radiata and pinaster pine The modifications required Countries to adapt them to other coniferous species would probably be minimal Extensive modif-
ications would probably be necessary to adapt them to hardwood species
Plantation Simulation Model 4
YIELD REGULATION (Four Models)
Organisation APM Forests Pty Ltd PO Box 37 Morwell Victoria 3840
Information JB Dargavel
Forest Plantations of Pradiata Pelliottii Eregnans and Egrandis in New South Wales Queensland and Victoria developed to supply pulpmills
Objective Development planning Determine if mills of given size can be supported from nominated land areas and planting rates
Time Span 20 - 30 years
Input 3 models assume one average site 1 model assumes 4 different sites models require areas of each age standard yield table for each site and standard costs
Method Yield table projection Areas scheduled for clear felling to meet mill demands by nominated priority rules mostly oldest first
Output Schedule of areas planted thinned felled Times at which demands can not be met or surplus available Condition of plantations at end of planning period
Application Development planning particularly at initial stages of plantation development prior to industries being established
Evaluation in Organisation Simple models easy and cheap to construct and run only require small computers Very successful when operated in inter-active mode Used when only limited data available ie before extensive inventory data base has been built up Difficulty is that they ignore real site differences and full range of opportunities that become apparent when inventory and experimental evidence has been assessed complex optimisation models then developed to evaluate
Assessment for Developing Countries Very high as models can be limited to the data available Cheap and simple to construct
and use Highly cost effective
Reference JB Dargavel 1969 Yield forecasting for industrial plantations Australian Forestry 33 (3) 153-62 gives details of an early rather more elaborate model than is currently used
Plantation Simulation Model 5
YIELD REGULATION Organisation Woods amp Forests Department
PO Box 162 Mount Gambier South Australia 5290
Information A Keeves and JW Leech
Forest 70000 ha of Pradiata plantations managed on an approximately 50 year rotation with up to six commercial thinnings and with a comparatively even distribution of age classes
Objective To predict the long term yield of the resource
Time Span 60 years
31
Plantation Simulation Model 5 contd Input Inventory data yield prediction models potential thinning regimes information from the
short-term planning model and stand size assortment table
Method Currently uses yield tables to predict the growth of a logging unit allowing for variations of site potential but will incorporate mathematical models recently developed Logging units are thinned according to a variety of commercial thinning regimes and potential yields are aggregated by assortments into years Yields between years were balanced by varying the clear felling age for some logging units over the first 25 years of the planning horizon
Output Tables listing thinning and clear felling operations areas and volumes by assortments included in each years potential cut and summaries by five year periods and by forests
Application Strategic planning of the long term permissible cut
Evaluation in Organisation The technique has been used successfully to determine long term cutting strategy from a limited forest resource that is now fully committed to industry A limited range of management strategies can be evaluated depending on the range of data used to develop the model The model is deterministic not stochastic These limitations have not proved significant and the accuracy of the predictions is satisfactory for long term strategic planning in an environment subject to short term change
Assessment for Developing This type of model is applicable in many developing countries as it can use simple growth -Countries yield - inventory data to estimate wood availability under a variety of management strategies
Reference Lewis NB Keeves A and Leech JW (1976) Yield regulation in South Australia Pinus radiata plantation Woods amp Forests Bulletin 23 174 pp
Plantation Simulation Model 6
YIELD REGULATION
Organisation Tasmanian Forestry Commission 199 Macquarie Street Hobart Tasmania 7001
Information M L Higgs
Forest 29000 ha of plantation predominantly Pradiata supplying privately owned sawmills pulpmills and other utilization plants
Objective To predict thinnings and clear-felling yields by various classes given specified felling age prescriptions and volume constraints
Time Span Varies depending on need generally 15 - 30 years
Input Uniform batches of forest are classified by stand parameters including age site index class and thinned state
Method Initially each patch is assigned thinning and clear-felling priority values based on its stand parameters Stands are then ranked in decreasing priority order for clear-felling or thinning Yields for stands eligible for felling are accumulated subject to volume constraints
Output Stand volume growth and felling yields are estimated by means of functions comprising the stand simulation model
Application Annual schedule or areas available for felling Deficits or surpluses if volume constraints applied Summary of growing stock at five year intervals
Evaluation in Organisation Resource level planning of sawlog and pulpwood sales
Assessment for Developing The model is good where economic considerations with respect to management have not been emphasized
Countries Represents a simple inexpensive system with potential where optimisation involving cost criteria is not required Disadvantages are in lack of diverse range of cutting strategies and in not having log assortment output
32
Plantation Simulation Model 7
YIELD REGULATION FORSIM
Organisation
Information
Forest
Objective
Time Span
Input
Method
Output
Application
Evaluation in Organisation
Assessment for Developing Countries
Reference
Forests Commission Victoria 601 Bourke Street Melbourne Victoria 3001
RB Smith
75000 ha of Pradiata plantations
To predict woodflows and cash flows from a forest consisting of a set of diverse even-aged stands
Up to 50 years
Inventory plot records for each section of the forest (sections uniform in age species site index)
Growth simulation of plot basal area and height and simulation of harvesting operations (thinning and clear fellings) depending on the cutting regime
For each strategy output includes volumes (by size classes) areas and section numbers for each year areas by age classes growing stock volumes for nominated years revenues and discounted revenues for each operation for each year
Planning and scheduling the cut testing and comparison of cutting strategies
Highly successful although initial problems with change of staff change of computing environment change of measurement units Ideal application for Pradiata plantations where a large number of possible cutting strategies is involved
The complex FORSIM package would have little potential for forests coming under management for the first time The simplified version ASSIM may have potential as a short term growth simulator
Gibson BF Orr RG and Paine DWM 1971 FORSIM - a computer program for planning management of even-aged forests Forests Commission Bulletin Melbourne
OPTIMIZATION FOR FOREST YIELD REGULATION
The three optimization models described in this section were designed for yield regulation The optimization models represent a significant advance on the simulation models described earlier because they enable the full combi-nation of the silvicultural alternatives for each stand times the number of stands to be explored For example if there are 50 alternative strategies for each of 200 stands an optimization model finds the best set out of the 50 x 200 = 10000 possible alternatives The best set consists of the strategyselected for each stand with a few stands being divided into 2 or 3 parts each with a different strategy Thus a little over 200 alternatives out of 10000 are selected in a single run of the model By contrast the simulation models only allow those combinations to be evaluated that are defined in the built-in decision rules
Two of the models are concerned with large fast-growing exotic plantations of P radiata and one is concerned with extensive fast-growing even-aged na-tural stands of Eregnans and Edelegatensis All the models evaluate various silvicultural alternatives for each stand while meeting overall constraintssuch as markets or budget for the plantation as a whole
Each model uses a linear program for optimization formulated along the lines originally developed by Clutter (Ware and Clutter 1971) in the Type 1 model of Johnson and Scheumans (1977) classification Standard computer pack-ages are used to solve the linear programs and obtain extensive marginal analysis
33
The models require extensive data prepares by a matrix generator pro-gram in a form suitable for input to the standard packages The source data consists of the yields cash flows etc for each alternative strategy con-sidered for each stand This extensive data is generated by stand simulation models
The optimization models have been found to be many times more expensive todevelop and operate than simulation models They require very extensive data and considerable expertise because of this they have been found difficult to maintain when specialist staff move They do however provide very power-ful insights into interactions between the alternative strategies available for different stands Their use can best be justified when forest structure and conditions are complex and the supplydemand relationship is critical
The optimization models were only constructed after substantial experience had been gained both with stand and plantation simulation models
Optimisation Model 1
Organisation APM Forests Pty Ltd PO Box 37 Morwell Victoria 3840
Information JB Dargavel
Forest 40000 ha of Pradiata in Victoria supplying a pulpmill and a sawmill There is a wide range of sites and very little land is available for purchase economically Some outside wood and chips are purchased
Objective Plan plantation development and ration capital between buying land planting and fertilisation Also find how much outside wood to buy schedule thinning and clear felling and find best silvicultural regime for each stand
Time Span 25 years
Input An average of 50 alternatives for each of 200 stands showing yields cash flows and contri-bution to objectives produced from stand model Volumes and costs of outside wood purchase options Many other data on conversion factors costs etc
Algorithm Linear programming
Output Extensive reporting of 1 silvicultural regime (planting method fertilisation thinning method clear felling age)
for each stand 2 Wood purchase schedule 3 Planting thinning and clear felling schedules 4 Rationing of capital between all plantation activities 5 Forecasts of size and density distribution to mills 6 Marginal costs of all constrained opportunities
Evaluation in Organisation Development brought all sections of organisation together Proved to be a very powerful tool in giving insights into operation of plantation system Very demanding in data requirements and staff time Expensive to construct and operate Requires ready access to large computer Difficult to modify quickly to changing conditions
Assessment for Developing Countries Considerable data and staff time required for both construction and continued modification
and maintenance of model in usable and valid condition
Reference JB Dargavel 1978 A model for planning the development of industrial plantations Australian Forestry 41 (in press)
Optimisation Model 2
RADHOP
Organisation Forestry Commission of NSW 93 Clarence Street Sydney NSW 2000
Information R Wilson and M McMullen
34
Optimisation Model 2 contd Forest
Objective
Time Span
Input
Algorithm
Output
Application
Evaluation in Organisation
Assessment for Developing Countries
Optimisation Model 3 MASH
Organisation
Information
Forest
Objective
Time Span
Input
Algorithm
Output
Application
Evaluation in Organisation
Assessment for Developing Countries
Reference
100000 ha of Pradiata plantations with irregular age-class distribution supplying 2particleboard plants and numerous sawmills One or two pulpmills are planned for the early 1980s
Rationalise yield flows through time to meet market requirements
Either short term (commonly five years) or long term (commonly 35 years)
Inventory plot data plus financial information
Stand simulation by deterministic functions constructed from research and inventory data Optimisation by linear programming which selects regimes to apply to management units to maximise returns while meeting volume constraints
Details of regime to be applied to individual areas size and time distribution of volume
Short term harvest planning and long-term prediction of quantity of industry that can be supported at various times
Successfully accepted as major management aid because of demonstrated reliability Functions continually adapted as conditions change and more data becomes available
Useful for providing estimate of plantation requirements to meet markets Operates on sample data but requires sophisticated computing capacity An aid also to planning industryestablishment Predictor functions are not an integral part of model and can be altered easily Simulation model provides much useful information and can be used alone forpredicting volumes
Forests Commission Victoria 601 Bourke Street Melbourne Victoria 3001
RB Smith
120000 ha of regrowth forest predominantly Eregnans and Edelegatensis principally 1939 origin
To define the cutting schedule that maximises the present net worth of the wood resourcesubject to woodflow constraints
Up to 100 years
Stand data including diameter distribution thinning strategy road and transport costs royalty values harvesting constraints
Parametric linear programming to maximise the present net worth subject to constraints on wood flows MASH incorporated several features of STANDSIM
Optimal cutting strategy and wood flows cash flows and present net worth associated with that strategy
The definition of sustainable woodflow levels supply area and broad harvesting strategies
The technique has been successful in broad applications over the resource as a whole There are problems with further application at district level because of change of staff and computingenvironment and intricate rules for operating the model
MASH would be a useful aid in planning the management of a forest of complex structure with respect to age density site quality and species Depends on good inventory and thismay be a drawback Also requires sophisticated computing system which may be adifficulty in applying MASH to developing countries
Weir ICA 1972 Planning of wood production using systems analysis APPITA 26 (2) 107-112
LITERATURE CITED
Johnson KN and Scheurman 1977 Techniques for prescribing optimal timber harvest and investment under different objectives--discussion and synthesis Forest Science Monograph 18
Ware KO and JL Clutter 1971 A mathematical programming system for the management of industrial forests Forest Science 17(4)428-45
35
Operations Research Techniques in the Management of Large-Scale
Reforestation Programs
Joseph Buongiorno DE Teeguarden
Abstract A reforestation planning system for the Douglas-fir region of the Western United States is described Part of the system is a simulation model to predict planta-tion growth and to determine economic thinning regimes and rotation ages as a function of site characteristics initial density reforestation costs and management constraints A second model estimates the expected value of alternative reforestation projects and determines the optimum allocation of scarce resources to these projects via linear programming The applicability of the system to developing countries is briefly considered
INTRODUCTION
This paper describes a system of computer programs developed by the au-thors to assist in the design and selection of reforestation projects Givenan initial set of resource and policy constraints the system permits managers to select the set of reforestation projects to execute the method of refores-tation to employ and the initial stocking in new plantations The system was developed for use by managers of large-scale public land reforestation pro-grams in the Douglas-fir region of the Western United States A more tech-nical and detailed description of the system as well as a discussion of the economic principles on which it is based can be found in Buongiorno and Teeguarden (1973)
Problem Definition
Every year during the months of July and August the reforestation staffof each district of the US Department of interior bureau of Land Management (BLM) in Western Oregon receives a commitment of funds seeds and seedlingsfrom the State Director Given the limited amount of resources and the avail-able land the reforestation plan which best satisfies BLM goals must be prepared The model is designed to answer for each tract of land availablefor reforestation the following interrelated questions
How many acres should be reforested
36
What site preparation should be applied
Is it better to plant or seed
How many trees or pounds of seed per acre should be used
From what sources can necessary seeds or seedlings be obtained
Management Objectives
It was determined that the Bureau of Land Management guidelines are con-sistent with the objective of maximizing present net worth (PNW) under con-straints Some constraints are explicitly stated eg minimum rotation ageallowed on BLM lands minimum number of trees to be maintained on thinned plantations minimum commercial volume extracted from thinning operations Other constraints are implicit These are reflected by the system of account-ing or by the shadow prices used in PNW computations These prices may and often should differ from market prices which cannot be the only basis for public project evaluation although they may be very useful indicators of the supply and demand of reforestation inputs and outputs
System Overview
The reforestation planning system is composed of two main computing pro-grams named FOREST and REGEN (fig 1) FOREST is a simulation model capable of predicting the growth of Douglas-fir plantations as a function of site quality and initial density FOREST also includes optimization algorithms which allow for the determination of optimum thinning regimes and optimum rotation ages as a function of site quality initial density and refores-tation costs given the objective of maximizing PNW under constraints The results obtained from program FOREST are part of the input in program REGEN This second program determines the expected PNW of reforestation alternatives applied to the various tracts of land available The program also generates and solves a linear programming model which describes the interaction of all projects competing for a limited budget and limited stocks of seed and seed-lings The program FINAL simply displays the solution in a form readily under-standable by reforestation managers
FOREST A SIMULATION MODEL FOR MAN-MADE FOREST MANAGEMENT
As indicated earlier PNW maximization under constraints is the guide to making plantation investment decisions FOREST applies this principle in deriving estimates of future plantation yields The management decisions con-sidered by FOREST are (1) initial densities in plantations (2) schedule of intermediate cuttings as the plantation matures (3) rotation age The final output of FOREST is a set of yield tables (fig 2) showing the expected PNW of a plantation as a function of site index initial density of the plantationand establishment costs PNW is always computed assuming that an optimum thin-ning regime and rotation age will be applied to the plantation within policyconstraints specified by the manager
37
Figure 1 Elements of the reforestation planning system
38
Figure 2 Present net worth of reforestation alternatives
39
FOREST is composed of two basic elements The first one simulates the growth of an even-aged stand of Douglas-fir trees The second element models the decisionmaking process (thinning regime and final harvest) Stand growth is determined by modeling the behavior of individual trees Individual tree growth is computed as a function of tree age and competition from neighboringtrees using deterministic functions Individual tree mortality is instead a random process in which the probability of death within a specific time spanis a function of tree age site index and competition Figure 3 shows the behavior of entire stands as predicted by FOREST for three different initial densities when no thinning is applied
The decisionmaking element of FOREST is designed to apply a thinning regimewhich maintains an optimum stocking in plantations ie a stocking such that the marginal value growth of the stand will be equal to the guiding rate of interest used Managerial constraints regarding the minimum volume of thinnings which should be extracted and the minimum number of trees remainingafter a thinning operation may also be specified Thinning regimes obtained from FOREST have often doubled the PNW of plantations FOREST determines the age of final harvest by maximizing soil rent but longer rotations may be specified by the user
REGEN A MODEL FOR PROJECT ANALYSIS AND RESOURCE ALLOCATION IN
REFORESTATION PROGRAMMING
This motel is designed to find the set of reforestation activities which yield the plan of maximum PNW in a given year This is done by defining the set of available alternatives and by representing mathematically the inter-action of all alternatives in their use of common resources
When a tract of land is reforested the following alternatives are avail-able (1) the tract can be partially reforested (2) the tract can be seeded or planted (3) before seeding or planting the site can be prepared in differ-ent ways (4) planting or seeding can be carried at alternative densities (5)the tract can be reforested from seeds or seedlings originating from different zone-elevation classes
The first set of operations in REGEN determines the expected PNW of each available alternative assuming all resources would be available to execute them This is cone from the yield functions resulting from FOREST (fig 2)and from other data describing the characteristics of each tract available for reforestation (including location brush cover slope area site current stocking etc) as well as the alternative reforestation techniques to be considered and their respective cost From these data REGEN determines the expected survival in plantations and the expected PNW of each alternative At this stage a simple ranking of alternatives may yield the optimum program if no resource or a single resource is constraining The ranking criterion used by REGEN may be PNW per acre or PNW per collar of available budget or PNW perpound of seed or per seedling depending upon the constraining resource In general however several resources are constraining The problem of deter-mining the optimum reforestation plan then takes the form of a linear program
40
Figure 3 Predicted and observed survival in plantations
41
in which the objective function is the total expected PNW of the plan while the constraints specify that (1) the stocks of seeds and seedlings originatingfrom each zone-elevation class (2) the available budget and (3) the land area on each tract cannot be exceeded This large linear program is generated and solved automatically by REGEN using user-supplied data on the amounts of resources available The FINAL program lists all projects recommended for reforestation in the current year method of treatment seedling density or original spacing in plantations scheduled for hand planting budget require-ments and quantity and origin of seed and seedlings stock
CONCLUSIONS AND POTENTIAL FOR DEVELOPING COUNTRIES
It has been found in applications that the system presented here may yield reforestation plans whose PNW is 25 higher than what would be obtained byusing simple ranking criteria (eg benefitcost ratios) The gain with re-spect to traditional rules of thumb may be more important However such com-parisons assume that the assumptions underlying the system in particular the system of shadow prices used are correct The reforestation technicians liked the systems simplicity In particular it requires little input A singledata card is sufficient to describe each tract available for reforestation Furthermore the required input is readily available from reforestation re-cords Nevertheless the system ran into implementation hurdles the main one being that data were prepared by field foresters while programs were run at headquarters The availability of remote terminals at field stations should decrease this problem
We believe that the basic methodology should find applications in dev-eloping countries The program FOREST in particular should be useful in deter-mining the economic effect of varying initial density in plantations in com-puting economic thinning regimes and rotation ages and in determining the economic feasibility of man-mace forests Naturally the growth functions used in the program would have to be calibrated to reflect each specific site and species combination Often this will require some informed guessing The pro-gram REGEN may have more limited applications as it was tailored to the situ-ation faced by the Bureau of Land Management in southwestern Oregon In other reforestation projects limiting resources may be very different however the principles of evaluating all alternatives and allocating resources optimallyremain universal Determining appropriate shadow prices for plantation pro-ducts interest rates wage rates and other inputs will be a very important step in a developing country where market prices are unlikely to reflect ade-quately all the objectives of a reforestation project (FAO 1974)
Acknowledgments Preparation of this manuscript was supported by the School of Natural Resources University of Wisconsin Madison and by the College of Natural Resources University of California Berkeley
42
TRACT ZONE-ELEV TREATMENT DENSITY AREA
XXXXX XXXXXXXXX XXXXXXXXX XXXXXXX XXXX
001 1 1 3 803
001 1 1 4 197
002 1 3 1 2000
SEEDLINGS FROM ZONE-ELEV 1 QUANTITY = 100000
SEEDLINGS FROM ZONE-ELEV 11 QUANTITY = 200000
SEEDS FROM ZONE-ELEV 11 QUANTITY = 1500
003 2 3 1 4000
003 2 3 2 1000
SEEDS FROM ZONE-ELEV 2 QUANTITY = 3000
SEEDS FROM ZONE-ELEV 11 QUANTITY = 1500
TOTAL AREA = 800
Figure 4 Example of a small reforestation plan as displayed by
subroutine FINAL
43
LITERATURE CITED Buongiorno J and DE Teeguarden 1973 An economic model for selecting
Douglas-fir reforestation projects Hilgardia 42(3)35-120
Duff G 1956 Yield of unthinned Douglas-fir Corsican pine and ponderosa pine in New Zealand For Res Notes New Zealand Forest Serv Wellington
Food and Agriculture Organization of` the Lnited Nations 1974 An intro-duction to planning forestry development projects FAOSWETF118 FAORome
Reukema DL 1970 Forty-year development of Douglas-fir stands planted at various spacings USDA Forest Service Res Paper PNW-100 21 p illus Pacific Northwest Forest and Range Exp Stn Portland Oreg
44
Wood Transportation Systems-A Spin-Off of a Computerized Information
and Mapping Technique
William W Phillips Thomas J Corcoran
Abstract A computerized mapping system originallydeveloped for planning the control of the spruce budworm in Maine has been extended into a tool for planning road net-work development and optimizing transportation costs A budgetary process and a mathematical linear programmingroutine are used interactively with the mapping and infor-mation retrieval capabilities of the system to determine the allocation and association of wood sources and markets
INTRODUCTION
In December 1975 a short term project (see Appendix) was completed that allowed the computerized mapping of locations and levels of spruce budworm infestation in Maine This conformed to a sampling system employed by state officials whereby data on infestation was taken periodically by a series of sample units each equal to an area of approximately 600 acres Each unit be-came the basis for a data (information) point and it became clear that the map-ping routine offers potential well beyond its original intent It is currentlyin use for the annual state budworm survey (Simmons and others 1976)
Besides the opportunity for additional informational overlays beyond bud-worm infestation indices the relational properties of each unit to another possessed the potential to be mathematically manipulated thus allowing lo-cation strategies of wood origins and potential markets to be correlated veryaccurately and rapidly Transportation phenomena is the focus of the cor-relation Existing road networks have been visually and mathematically re-lated to data points Specific requirements for new roads are integrated onto the overall system and transportation and handling cost formula are available to interpret wood movements strategies in terms of a definable optimum The system is designed to be open-ended in regard to this formulization so as to allow logical choices as to appropriate cost components Algorithms for se-lecting applicable cost configurations depending on the trafficability of various road classes andor transportation means (trucking or rail) have been developed within a framework of resource available and consumption require-ments Mathematical programming offered high potential for selection of
45
optimal transportation strategies These strategies involved not only spe-cifics on the movement of wood but also priority criteria for the resource areas on which to concentrate harvesting efforts when large wood surpluses are in excess of short-term market needs
The budgetary process as well as the mathematical programming routine is directly interactive with the mapping and information retrieval system and is designed to be a sub-system to the overall system Aspects of costing in anycategory of operating expenses for transportation or handling and those ex-penses relating to new roads can be included in the whole system and are re-latable to data points Existing road networks are known by the system and also referenced to specific data points where information on trafficabilityetc can be stored Travel patterns are developed by summarizing data points between any combination of wood origins and wood destinations which are them-selves merely data points Preliminary estimates indicate that the accuracyin measures of various forms of distance exceeds the probable accuracy of maps from which data point references were established New roads are hypothetic-cally constructed between appropriate wood origins and existing roads by log-ical rules internally maintained by the computer system Rapid and precise evaluations can then be made for given market transport possibilities when periodical levels and locations of available wood and of market requirements are offered to the system Optimal strategies can be made available directlyfrom this system which allows ready updating of information on any data point and selection of modes in costing suitable to the planner
The methodology suggested may well have wider application beyond Maine possibly on a regional basis or for other state or provincial areas in North America The techniques are structured so that implementation elsewhere can readily be facilitated and not necessitate a new total effort
THE TRANSPORTATION SPIN-OFF
Since the spacial arrangement of wood origins wood markets and trans-portation networks can be determined from the data organized by map locationit is possible to automatically develop transportation routes from each wood origin (source) to each wood market (destination) where each of these is represented by a map data point Transportation routes are developed so as to minimize transportation costs they assume cost linearity (that is the cost from A to C through B equals the cost from A to B plus the cost from B to C)
The transportation cost is composed of two elements--the cost of buildingnew roads (or transportation networks) and the unit cost of transporting the material over the transportation network New roads are generally costly both to build and maintain therefore in developing routes a goal is to approach a minimum of new road construction This is accomplished by a two-pass com-puter processing of source points During the first pass the closest road is located through an outward scanning of surrounding data points and the straight line distance to this road is calculated The source points are then sorted for reprocessing such that those points closest to a road are processed first During the second pass another search for the closest road is made When it is located a hypothetical new road connecting the source point with the road
46
is added to the map road system by the computer program This hypothetical road then becomes available to subsequent source point processing Although this method does not necessarily yield an absolute minimum amount of new road construction it should closely approximate the minimum
With roads to each source point minimum transportation cost from each source point to each destination can be calculated Computer scanning of mapdata allows transportation networks to be followed Starting from a destina-tion point and successively adding the cost of transporting to all adjacent road points a transportation cost to the destination is determined for all road points including all source points Always extending from the least cost end first produces minimum cost values with a single scanning of road points The cost of transporting to an adjacent point can either be based on a function of distance (as determined from the geometry of the area represented by a data point) or with known costs of traversing a particular area can be uniquelyspecified for each point and thus can include trafficability factors-- egroad quality average speed and traffic load
Following these methods the cost of transporting from all source points toall destination points is determined This information combined with data on wood volumes available at each source and the requirements at each market is fed into a linear programming transportation model to determine allocation and association of wood sources and markets
BACKGROUND INFORMATION
The extent and importance of the wood-using industries in Maine can be sum-arized (for 1973) as follows
(1) Three out of ten Maine workers are employed in the wood-usingindustries
(2) The industries ranked first in value of manufactured product (13 billion dollars)
(3) Eighty-six percent of Maines land area is in commercial forests (17 million acres)
(4) A total of 314 million cords of pulpwood was harvested with 56 of this in spruce-fir For sawlog harvest the total was 354 million board feet with 57 in spruce-fir
Approximately one-third of the States forest area is currently under the threat of spruce budworm devastation The epidemic can be expected to produce high mortality particularly in balsam fir and to a lesser degree in spruceif adequate control measures are not forthcoming Trees that succumb to the insects attack must be harvested within a two- or three-year period or the physical deterioration of the wood will be too advanced to allow its com-mercial use The timing of a planning effort becomes more critical consider-ing that the area represented to be approaching an epidemic stage contains ata minimum a twelve-year supply at Maines current wood consumption levels
47
Under normal harvesting procedures species present in a forest stand with fir and spruce and not affected by the budworm would also have to be removed with economical wood handling and transportation methods
Preliminary study by the Corps of Engineers on the feasibility of a majorhydroelectric project in Maine was begun this past year The associated dam and its head waters will take out of production thousands of acres of Maines timberlands Agents of the Corps of Engineers have already contacted this investigator for estimates on the market potential of salvaged timber and for information on harvesting-transportation problems relating to the salvageThese estimates represent only preliminary appraisals actual planning will eventually be required if the timber area is to contribute effectively to thisStates wood resource requirements
Considering the potential for an evaluation system such as those discussedhere at least three areas of immediate concern are benefited These include planning in regard to wood flow within the region
(1) As typical yearly wood consumption patterns are encountered
(2) As wood surplus resulting from budworm devastation occur
(3) As timber area losses in hydroelectric development are considered
The need to expand the opportunities for systematic evaluation of wood movementstrategies is most timely as the concerns for wood utilization especially in light of the budworm and the hydroelectric development are and will surelyremain key issues in the State of Maine in New England and in Eastern Canada for the remaining years of this decade
Models developed from the proposed investigation are not intended to be useful solely in the shortterm as suggested by problems like the budworm and developments that affect large forest acreages nor will they necessarily re-main local in the spread of their use Their nature fully dictates that theycan find application in the evaluation of transportation aspects inherent in marketing strategies of a long-term nature The techniques utilized if not the data structures should prove of value to other regions as well
PREVIOUS STUDIES
Past efforts of a statewide scope have proved fruitful in understandingwood distribution and the means thereof (Corcoran 1964 Schroeder and Corcoran 1965 Corcoran and others 1966) These particularly focused on truck-supported wood movements and included not only descriptive information but system planning pertinent to the times Forest road location theory continues to be advanced (Ashley and others 1973 Corcoran 1973) Appraisals of the current situation are available in regard to enterprises that produce Maines wood supply (Corcoran and Sarna 1973) to computer-based mapping routines (Phillips and others 1976) and to export market potential (Corcoran 1976)Wood movement strategies have also been explored in regard to general models
48
for regional applications (Holland and Judge 1962 Thompson and others 1968Anderssen 1971) and to the budgetary planning of a single firm (Bartelheimer 1973 Sowell and others 1975 Newham 1975 Wimble 1975 Bailey 1973) Mappingby computer has found favor in recent years (Harding 1973 Nez 1971) espe-cially for visual descriptions of use patterns vegetative cover and urban planning schemes However those for the most part were subjective in nature and have not taken advantage of mathematical potential inherent in a computer-based system Numerous other works could be listed that are commonly known and well documented in established computer bibliographies on operation-research (Martin and Sudak 1973 Field 1974) and on the budworm itself (Corcoran and Simmons 1975) Information systems and decision theory have been explored by many authors within a workshop format (Stone and Ware 1971)and in a publication supporting needs for an information bank (Wolf 1970)Information systems pertaining to Maine have received international attention (Corcoran and Simmons 1976 Corcoran 1976)
APPENDIX
Effective planning for control of the spruce budworm in Maine requires knowledge of the distribution of the budworm as well as the condition and sus-ceptibility of the trees in the areas of infestation Currently a hazard rating based on sample measurements of such factors as previous damage currentdefoliation tree vigor and egg mass density is calculated for various local-ities throughout the state A map of the state showing the location and hazard rating of each of the sampled points is prepared and areas of infestation are marked These provide a visual indication of the distribution of budworm threat to the forests of Maine and allow planning of such activities as spray-ing and salvage
In order to facilitate the production of these maps a computer program has been developed which will produce maps of the state on a computer line printer The state is divided into small sections corresponding to the state fire control divisions These sections are subdivisions of the US Geological Survey 15-minute quadrangle maps and are found by dividing each of the USGSmaps into 9 blocks and each block into 25 sections each 1 minute by 1 minute Thus a section is 1225th of a USGS quadrangle and covers approximately591 acres
A two-dimensional array is allocated within the program storage with each cell corresponding to one of the sections of the state The section of the state in which the sample was taken along with the data collected is fed into the program The rather complex designation of USGS quadrangleblock and section used in the field is converted by the program into a two-value designation indicating the row and column of the section within the stateand thus the cell of the array corresponding to the location This simpli-fication allows adjacent cells to be easily determined and examined The pro-gram calculates the hazard rating from the data and stores the computed value in the appropriate cell within the array Both the array of computed hazard ratings and the original data for additions and further analysis can be saved
49
From the data stored in the array requests can be made to print all or portions of the state Increasing integer digits indicate increased hazard value Cells which fall inside the state boundary are distinguished from those that do not This allows the portions of the state not sampled to be indicated by a printed character or characters while areas outside the state are void of such characters
The size of the map produced may be varied by specifying a scaling factor The smallest (largest scale) map produced uses one character to represent a single section This map is approximately 27 inches wide by 34 inches longwhen the entire state is printed Because the spacing on a printer is rela-tively fixed the small map distorts the state slightly making it an averageof 14 wider than it should be For most applications this level of distor-tion presents no problems since a general feeling for spatial distribution is the primary goal Specific locations can be determined from grid coordinates and the USGS maps if required The distortion can be virtually eliminated if a larger map is formed using multiple characters to represent one section This could have the additional benefit of allowing more than one piece of in-formation about a sector to be printed on a map Any of these maps may ofcourse be reduced to a more convenient size through photoreduction techniques
Although the current program would only replace the manual system beingused at present several factors make this system more desirable One is the speed with which maps can be produced This will allow the production of pre-liminary maps as the data is collected These could then be used to help de-fine areas which require more sampling to delineate spray salvage or other boundaries
Another factor is the capability for future expansion existing in the system Among some of the more interesting possibilities are extensions which would allow any specified linear combination of the current or previous years hazard rating factors to be mapped This could be used to compare visuallythe distribution of such factors as previous damage and current infestation level which might provide insight into changing trends in infestation Com-parisons of linear combinations of current and previous years samples might be used to refine the formula used to compute the hazard rating Another possibility for extension is the inclusion of fixed information about a section Such information as forest cover type might be used to modify the hazard rating The inclusion of information on road networks and market loca-tions would be used to determine the most economical and efficient salvagelocations and transportation routes in the event of high losses
A second potential capability is use of the system to display a variety ofother forest-related surveys Other forest insects and forest diseases could be mapped annually from annual survey data Annual tree mortality data could be mapped as well as forest age data or for that matter any resource data base covering the state or portions of the state Such a system might even-tually form the basis of a general resource data base display system for the entire state of Maine
50
Acknowledgments This project has been financially supported in part bythe US Department of Agriculture under Research Agreement 23-678 (Cooper-ative Agreement 16 USC 581 amp 581a-581i Northeastern Forest Experiment Sta-tion US Forest Service and the University of Maine at Orono)
LITERATURE CITED
Anderssen Stig 1971 Long-range planning of forest operations Skogsarbaten Ekonomi 2E 1971 Stockholm Sweden 8 p
Ashley Marshall D Thomas J Corcoran and James C Whittaker 1973 Remote sensing modifications for optimized logging road networks ASAE Trans 16(6)1044-1047
Bailey GR 1973 Wood allocation by dynamic programming Can Forest Serv Publ 1321 19 p
Bartelheimer P 1973 A model for the cooperation of a forest enterprise with a wood processing firm In Proc 1973 Plann Control Symp Int Union Forest Res Org [Frieburg Germany] 9 p
Corcoran Thomas J 1964 Scheduling of pallet trucks in pulpwood opera-tions a linear programming application Maine Agric Exp Stn Tech Bull T-7 22 p
Corcoran Thomas J 1973 A FORTRAN program for spacing optimization of logging roads and landings under flatland assumptions Sch Forest Resour Univ Maine Orono Tech Note 56 13 p
Corcoran TJ 1976 A briefing on the Scandinavian scene and its markets 19 p Amer Pulpwood Assoc 76-P Washington DC
Corcoran TJ 1976 Information retrieval systems and a technical associations need for dynamic information on wood-producing organi-zations Proc 16th Cong Div 3-CG4 Int Union Forest Res Org[Oslo Norway June 20-25 1976] 7 p
Corcoran Thomas J and Rudolph P Sarna 1975 Wood producer survey and an information system 24 p Amer Pulpwood Assoc Paper 76-P-2 Wash-ington DC
Corcoran Thomas J D Schroeder and D Thompson 1966 An evaluation of the distribution of trucked pulpwood in east-central Maine - a linear programming application Maine Agric Exp Stn Bull 640 11 p
Corcoran TJ and G Simmons 1975 A computer-based bibliography on spruce budworm Sch Forest Resour Univ Maine Orono
51
Corcoran TJ and GA Simmons 1976 A map-based computer storage and re-trieval system for state-wide information on spruce budworm infestations and marketing opportunities from resulting timber mortality areas Proc 16th Cong Div 3-CG4 Int Union Forest Res Org [Oslo Norway June 20-25 1976] 7 p
Field DB 1974 Applications of operations research to quantitative de-cision problems in forestry and the forest industries--a bibliographyYale University Sch For Environ Stud 30 p
Harding RA 1973 GRIDS works for DNR Dep Nat Resour Rep 25 State of Wash 48 p
Holland II and GG Judge 1962 The spacial structure of the lumber industry estimated interregional flows and price differentials Univ 111 Res Rep AERR-52 41 p
Martin AJ and PE Sudak 1973 Operation research in forestry - a bibliography USDA Forest Serv Gen Tech Rep NE-8 90 p Northeastern Forest Exp Stn Broomall Pa
Newham RM 1975 LOGPLAN - a model for planning logging operations 59 p Forest Manuf Inst Inf Rep FMR-X-77 Ottawa Ontario
Nez George 1971 A composite mapping system for practical location re-search Off Plann Program Support Econ Dev Adm Commerce DepWash DC 31 p
Phillips W G Simmons and T Corcoran 1976 Spruce budworm and a computer-based mapping and information retrieval system Maine Forest Rev 913-15
Schroeder D and Thomas J Corcoran 1965 Distribution patterns for pulpwood harvested in east-central Maine Maine Agric Exp Stn Bull 630 44 p
Simmons GA W Phillips and T Corcoran 1976 Computer mapping and processing spruce budworm survey and related data--1974 and 1975 16 p Amer Pulpwood Assoc Paper 76-P-8 Washington DC
Sowell RS TJ Corcoran and AW Anderson 1975 Mathematical programming system (MPS360) - concept and applications ASAE Trans 18(3)591-595
Stone RN and KD Ware (ed) 1971 Computer and information systems in resource management decisions In Proc USDA Forest Serv and Coop StateRes Serv [ Wash DC July 1971] 130 p
Thompson EF WB Tilghman PH Hoephner and DP Richards 1968 Linear programming over time to establish least-cost wood procurement procedures Va Polytech Inst Res Div Bull 29 70 p
52
Wimble AW 1975 The development of a hypothetical linear programmingmodel for the analysis of whole tree chips In Financial management of forest resources [Proc Sem New Orleans Louisiana] 21 p
Wolf Charles H 1970 A study of plant location procedures and the need for a data bank in West Virginia Appalach Center Res Series 15 96 p
53
Optimal Control of Raw Timber Production Processes
Ivan Kolenka
Abstract This paper demonstrates the possibilityof optimal planning and control of timber harvesting activ-ities with mathematical optimization models
The separate phases of timber harvesting are represented by coordinated models which can be used to select the optimal decision for the execution of any given phase The models form a system whose components are connected and controlled by means of information flows
A mathematical model is presented for the optimal plan-ning of harvesting activities for the forest enterprise The use of a mathematical model contributes to the balancingof supply and demand to the coordination of forest manage-ment plans with other activities of the national economy andfinally to the minimization of production costs
INTRODUCTION
Planning in Czechoslovak forestry has a long tradition and is highly de-veloped The present stage of development of the society imposes demands on the planning and control of production processes in the form of requirements for maximum utilization of production sources and for meeting the demands of the society In the process of planning and control it is necessary to follow the efficiency principle which states that (a) the planned yield must be ob-tained at the lowest cost or effort or conversely that (b) the highest yield is to be obtained from given resources
This type of planning and control requires a well-elaborated information and decision system and the use of advanced techniques for the transfer and processing of information
PROBLEMS
In this paper I shall deal with the processes of decision in planning and control of harvesting and point out the possibilities of utilizing the opti-mization models of operational research for the selection of the planningalternatives
54
The harvesting of timber in the context of Czechoslovak forestry repre-sents a complex system and requires the solution of several problems Each country has its specific conditions and requires a different approach to the formulation of the task Generally it is necessary to recognize that mathe-matical models cannot be based upon the principles of maximum utilization of the forest for this would result in the decrease of its permanent production capacity and would simultaneously affect the biological balance adverselyWith long-term planning models it is necessary to consider this principle inthe formulation of the mathematical model In short-term models this prin-ciple is observed by insuring that the forest management plan (decennial plan)is constructed so as not to allow the decrease of the production potential of the forest
The harvesting of timber is divided into felling gathering at landingsprimary conversion (production of wood assortments) and hauling of timber The structure of the harvesting process is illustrated in figure 1 Each stage of timber production is represented by coordinated models leading to theselection of the optimal decision at a given stage
The models form a system of components connected by information flow in such a way that the output from one motel represents an input into a lower model To date some of the mathematical models have been used in planning(eg optimal control of timber hauling) others have been theoreticallyvalidated or are in the process of being tested
MODEL FUR SHORT-TERM PLANNING OF HARVESTING ACTIVITIES
The model solves the problem of optimal scheduling of quarterly harvestingactivities and of controlling the management of the gravitational areas of forest enterprises Gravitational areas consist of a collection of stands which form a contiguous area and which have approximately the same production conditions The annual tasks in each stand are given by the forest management plan and the sum of these tasks represents the annual tasks for the gravita-tional area
The mathematical model for short-term planning of cutting activities must fulfill the following conditions
Coordinate sustained harvesting activities with the demand for timber assortments as specified by contracts between supplier and customers
Recognize the limited availability of labor
Take into account the capacity of landings with respect to the loggingtechniques available for gathering timber at landings
Concentrate as much as possible the harvesting and the silvicultural activities in each gravitational area
55
Figure 1--Structure of the timber harvesting process
56
Elaborate quarterly plans which minimize the costs of harvesting and of other management activities
This task can be formulates as a linear programming model
Minimize z = Σ ijk gijk xijk + Σijp rijp yijp + Σijl uijl zijl
Σ i xijk = ajk
Σ ip yijp = bj
Σ i zijl = cj1
Σ j fijp yijp le Fip
Σ j xijk ge sik
xijk yijp zijl ge 0
for j = 1 2 n k = 1 2 3 4
for j = 1 2 n
for j = 1 2 n 1 = 1 2 g
for p = 1 2 m i = 1 2 3 4
for ik = 1 2 3 4
Additional relations determining the levels of yijp must be specified to
represent the particular types of management practiced
Notation
xijk - volume harvested of assortment k in period i from area j
yijp - timber logged in m3 with method p during period i in area j
zijl - silvicultural activities 1 carried out during period i in area j expressed in various units (ha km etc)
ajk - annual volume requirement in m3 for assortment k from area j
bj - annual target volume logged--by all methods-in area j
cjl - annual target for silvicultural activity 1 on area j
i - quarter of the year i = 1 2 3 4
j - gravitational areas j = 1 2 3 n
p - kind of logging method p = 1 2 3 m
57
k - combination of the type of harvest and species group (egfinal-coniferous k = 1 intermediate-coniferous k = 2 etc)k = 1 2 3 4
l - kind of silvicultural activities 1 = 1 2 g
Fip - available inputs for logging with method p in period i
fijp - quantity of input per m3 required to log with method p inperiod i and area j
sik - total volume required by the sale plan in quarter i for the kth combination of type of harvest and species group
gijk rijp uijl - coefficients of objective function giving the costs for technical unit according to the kind of silvicultural activity
Because the planning problem has been specified as a linear program it is relatively easy to solve it with a computer in spite of the large dimension of the linear program required under real conditions
The planning problem is specified as a deterministic model in spite of the stochastic characteristics of forest production This shortcoming of the model may be compensated for by solving the model for various values of the coefficients of the LP matrix or of the objective function
A mathematical model requires information which can be divided into tech-nical and economic parameters The technical parameters include the knowledgeof possible technological alternatives for work procedures available re-sources or capacities and scheduled means of production Economic parameters represent data on costs which vary with the location of the activity and its technical characteristics
To obtain all the necessary information for the model usually requires changes in the information system Our present experience indicates that the information system must be developed concurrently with the mathematical model
CONCLUSION
The use of this mathematical model contributes the following positive elements to planning
It balances the requirements of production and technical means and workers available
It balances the sources of wood with the wood assortment requirements of the national economy
It coordinates the distributing of production over time with the require-ments of national economy
58
It realizes the plan specification at minimum costs
The results which we have obtained establish the possibility of planningand controlling production in forestry These results also indicate that byusing operations research models planning and control can be made more effective
59
Large-Scale Budget Applications of Mathematical Programming
in the Forest Service
Malcolm Kirby
Abstract Mathematical programming applications in the Forest Service US Department of Agriculture are growing They are being used for widely varying problems budgeting lane use planning timber transport road main-tenance and timber harvest planning Large-scale applica-tions are being mace in budgeting The model that is des-cribed can be used by developing economies
INTRODUCTION
Two modern techniques of optimization that can be applied to complex resource problems are ADVENT (Kirby and others 1976) and the Eldorado model (Bell and Kirby 1971 Kirby 1971a 1971b) They are so closely related that it is convenient to refer to both as the model the basic premise is that land management requires more than one input (men money) and usually results in more than one output The model uses linear programming to handle trade-off relationships and to evaluate the effects of imposing or relaxing levels of inputs outputs or both The management objectives for the model were to prepare a budget request relating outputs to inputs and once funds are allo-cated to select projects that will either meet a set of output goals at mini-mum cost or will maximize a selected output (Bell and Kirby 1971)
Traditionally work planning in the National Forests was based on specific resources functions timber range recreation watershed etc Each function used its funds to maximize specific outputs Through so-called multiple use coordination the effects of one function on anothers outputs were considered but seldom explicitly evaluated But the model does this explicitly and this is what makes some managers uncomfortable with it It requires that goals be stated in specific terms animal unit months (AUM) of forage rather than acres reseeded cubic feet of timber produced rather than acres planted specific ef-fects on all outputs as a result of building a rout rather than miles of road built
A list of outputs from a typical National Forest include timber recrea-tion water wildlife grazing and livestock grazing In addition there are
60
miles of spectacular scenery numerous lakes miles of fishing streams wilder-ness power houses summer homes ski resorts irrigation canals roadstrailsdams pipe lines organization camps and other sundry special uses such as atemporary high altitude training camp for the Olympics
National Forest planners are faced with three limitations limited landlimited funds and pressures for fulfilling the needs of an ever-increasingpopulation The planning problems are very complex Goals include meetingthe demands for outputs and maintaining the local economies maintaining a trained work force and maintaining the productivity of the larva
Work done on National Forest lands requires multiple inputs--land and money(let money here represent tools equipment supplies and manpower) These in-puts result in multiple outputs--forage water (both quantity and quality)soil stability or erosion camping picnicking fishing hunting timber growth and timber cut There are also more nebulous outputs (or effects)such as aesthetics fire risk air quality and so on These effects vary de-pending on the productive capability of the land the primary purpose of the work being done the methods used and the spatial position of the land beingtreated
The model is used for preparing proposals either for one or more future fiscal years or for the fiscal year that is about to begin It is now beingused for both budgeting and long-range planning at the local and national lev-els We have also used ADVENT for trade-off analyses in land use planningwhere long range timber yield considerations are not important
The model is designed to generate a large number of feasible alternative programs The design criteria are that the model be multiple-output orientedable to generate alternative programs that are feasible able to report the future implications of various alternatives and able to generate optimal al-ternative programs on the basis of output-oriented criteria
PROBLEMS IN INPLEMENTATION
Some of the problems in implementing such a model are these
People To begin with when you say here is a better way to pre-pare a budget request you have insulted those who have been follow-ing another system for a number of years They have two reactions Whats wrong with the way weve been doing it and Show me
Data The amount of data needed for a complex mathematical model is formidable Everything must be reduced to numbers
Goals They must be specific and quantifiable narrative statements cannot be used The manager may have to use hunches in interpretingthe results but the model cannot
The people problem is very real There is a generation gap between the topmanagers and a fast-growing group of mathematicians and economists Managers
61
are not used to thinking in terms of abstractions It behooves both the teach-ers and the practitioners to take the time and effort to strip away the mys-tery interpret the jargon into terms that can be understood forget the theory and show by actual examples what is meant If we seem to labor this point it is because we fear that if young people exposed to new methods and techniques do not recognize the problem they will be frustrated when their ideas are not received with enthusiasm
The land manager can have faith that these models work with great mathe-matical accuracy However he should scrutinize the figures make sure theyare correct and test the final answers on the basis of reasonableness
What about data After all these years of research we do not have all the information needed For example we have fairly reliable information as to the effect of a specified thinning regime on the volume growth of timber over time when we know the site class What we do not always know is the effect of the thinning on the forage output for domestic or wild grazing animals or the effects on water runoff or the tons of fuel per acre resulting from one thinning operation or whether leaving the slash on the ground is more beneficial for protecting the site than it is detrimental as a fire hazard During the development of the Eldorado model we reviewed nearly a thousand research papers and found less than 20 that were helpful in assessing effects on more than one output
What about goals Traditionally managers set goals in rather general terms--for example meet the allowable cut thin 1000 acres eradicate 500 acres of sagebrush build 5 miles of fence The model requires goals that are related directly to outputs such as cubic feet of timber growth AUMs of forage produced or tons of soil per acre that would remain in place if a pro-tective fence were built Specific goals such as these are very difficult to set The output goals that we considered included the following
Timber Cut Water QualityTimber Growth Soil StabilityTimber Regeneration Recreation Environment Livestock Grazing Recreation Visitor DaysWildlife Grazing Fire Hazard Reduction Water Runoff Fire Accessibility
The manager who is comparing two alternative forest-wide programs can scan the computer printouts and decide if one program is better or worse than the other and if the increase in output is worth the decrease in some other outputInasmuch as output information is limited at this time he cannot make his de-cision on the basis of actual physical outputs alone
BASIS FOR DECISIONS
Some managers are uncomfortable with the model because there is no singlecriterion that indicates the best choice To overcome this drawback some economists suggest converting everything to dollars and selecting projects based on benefitcost ratio or present worth or internal rate of return etcThis approach would be ideal except for four problems
62
Difficulty of measuring all of the desired outputs for each projectDifficulty of assigning dollar values to all of the outputs The specific statement in the Multiple Use Sustained Yield Act that the management of National Forest lands is not to be based upon thehighest dollar return The non-uniqueness of dollar values which give the same answer
There are many kinds of values--for example market value consumer value (a willingness to pay) producer value (the cost to produce) increasing gross national product monopoly revenue value and expenditure value Whaley (1968)defines six different value methods he points out that the value system must be appropriate for the model must use the same method for achieving values for all outputs and must allow the values to be empirically quantifiable The point is that since so many different kinds of values exist the absence of a value system means the choice of method for valuing outputs can be rather arbi-trary To date such a system has not been adopted for the Forest Service
What then is the basis for decisions Again Whaley (1966) lists four measures of program effectiveness which may be used in public resource man-agement meet established production goals at least cost establish the bud-get level and maximize some outputs claim that no rational solution exists (we dont make this claim) and maximize economic development The Annual Budget Model and ADVENT were designed for using any of these measures There-fore when values for outputs are developed by any value system they can be easily employed in the model Regardless of the managers value systems he still needs alternative programs from which to choose and the model makes it easy to generate alternative programs The models simply process informationbringing into focus the sociological economic and organizational consequencesof alternative decisions The final selection rests with the land managersand Congress who must weight the socio-economic and political impact of their decisions
The linear programming part of the model can carry out the following steps
(1) determine whether or not the problem can be solved (2) if it is solvable give an optimum solution (3) allow constraints of outputs money manpower activity types(4) maximize an output for a given budget or provide a specified
output level at minimum cost (5) provide a budget which includes all the costs of the various
projects
ADVENT also has a goal programming option to minimize the deviations from a set of goals or targets
The model has reporting capabilities to transform the original data into a series of abbreviated reports or complete reports as desired by the manager Information available for each solution includes manpower needs by skills bysub-units money needed list of projects selected and list of total outputs
One of the drawbacks in the opinion of some managers is that using it re-quires that more work be planned than there will be money to do This repre-sents extra effort which in times of tight budgets seems useless Extra pro-jects must be provided or there is no choice Another drawback is that the
63
time frame of 1 year is too short This is admittedly a disadvantage but bud-geting particularly fund allocation is a year-to-year process As alreadypointed out there is a shortage of estimates of multiple outputs and rela-tive effects are an unfamiliar substitute The model requires that goals be set in quantitative terms This has proved difficult at first
Positive advantages of the model are that it considers the joint effect of inputs on outputs it gives the manager a tool to explore a series of alter-natives and it focuses attention on specific measurable goals rather than broad overall objectives
NUMERICAL EXAMPLE
To illustrate how the model works let us consider a small hypothetical numerical example of eight projects as follows
Item 1 2 3 4 5 6 7
Land management and administration Expenditures (million dollars) 2 3 3 2 4 2 4 4Manpower (man-years) 100 100 100 50 300 100 100 100
Road construction aria maintenanceExpenditures (million dollars) 7 6 3 1 1 3 2 3Manpower (man-years) 200 100 100 100 100 200 100 100
Timber- for the next decade Average annual cut (1000 bd ft) 8 9 8 7 5 4 5 2Average annual net growth (1000 bd ft) 9 9 8 7 6 5 5 3
Benefits and costs Total value of output (million collars) 28 27 15 6 9 8 8 7Total expenditures (million dollars) 9 9 6 3 5 5 6 7
Administrative priority rating 1 1 2 3 5 4 5 5
Suppose we wish to select a project mix that meets the following specifications
(a) Include project 1 because it is already under contract (b) Include all projects with priorities 1 and 2 (c) If project 7 is included project 8 must also be included and
vice versa (d) Do not permit both projects 5 and 6 one or the other but
not both (they are close substitutes)(e) Achieve a minimum level of timber growth of 4(f) If there is a tie then choose the combination of projects
that minimizes total land management costs
64
8
(Note that in addition to constraining the level of individual inputs and out-puts or their combinations the user can control individual projects or their combinations)
The solution is as follows
Project No 1 2 3 4 5 6 7 8
Percentage Yes Yes Yes Yes No Yes Yes Yes
The solution is presented below in the format of one of the 22 reports which can be prepared with ADVENT Both the input data and the information contained in the LP solution can be displayed in these reports The user can also employ ADVENT in a pure simulation mode by selecting a set of projects on the basis of experience and intuition and call for a report detailing the corresponding costs revenues outputs activities manpower requirements etc
ADVENT report corresponding to the LP solution of the numerical example
PROJECTS SELECTED
AGGREGATE WORKACTIVITY DESCRIPTION
PLANTING amp SITE PREPARATIONSLASH REDUCTIONPRECOMMERCIAL THINNINGTIMBER SALES PREPARATIONROAD MAINTENANCEROAD CONSTRUCTION
AGGREGATE OUTPUT DESCRIPTION
DISPERSED RECREATION USETIMBER HARVESTEDTIMBER SOLD WILDLIFE HABITAT IMPROVEMENTVALUE OF TIMBER HARVESTED
AGGREGATE COST DESCRIPTION
TOTAL EXPENDITURESTOTAL ROAD CONSTRUCTION amp MAINTENANCETOTAL LAND MANAGEMENT amp ADMINISTRATION
AMOUNT
600 ACRES 1000 ACRES 400 ACRES
2000 ACRES 300 MILES 75 MILES
AMOUNT
20000 VISITS 80000 MBF 85000 MBF 5000 ACRES
47000000 $
AMOUNT
50000000 $ 25000000 $ 25000000 $
65
MATHEMATICAL FORMULATION
For the reader interested in the mathematical formulation we present a simplified version of the linear programming problem
maximize Σj djxj subject to
Σj aij xj ge fi i = 1 2 I
Σj ckj xj le bk k = 1 2 K where
xj = 1 if the project is selected and zero otherwise
aij = amount of the ith output per unit of xj
ckj = amount of the kth input per unit of xj
fi = constraint on the total amount of the ith output
bk = constraint on the total amount of the kth input
I is the set of output categories
K is the set of input categories
and where dj may be chosen as
aij if the ith output (eg timber growth) is to be maximized
or
-ckj if the kth input is to be minimized
or
-Σ KξK ckj here K is a subset of commensurable inputs such as costs or manpower
The term dj may also be specified as the discounted or undiscounted total net
revenue
Note that the problem is formulated as an integer program but it is solvedby means of a linear programming routine The reason is that the solution gen-erally turns out to be an excellent approximation to the integer solution and the computer time is very short compared to the time required to solve the cor-responding integer program It is this feature that makes ADVENT a practical tool for widespread use A discussion of why these approximations work as theydo may be found in McConnen and others
66
CONCLUSION
ADVENT can be used by developing economies for both budgeting and longrange planning It has been tested in many different uses over more than 4 years by more than 50 organizations The models flexible design permits other planning applications such as road maintenance capital investment analysis project selection and other trade-off analyses It is designed for use by relatively unskilled users of computers The cost of a typical com-puter run for 400 projects is about $50
REFERENCES
Bell F and M Kirby 1971 An example of optimization techniques in land Management The Eldorado model Forest Service US Dep AgricBerkeley Calif
Kirby MW 1971a An overview of program budgeting on a National Forest Forest Service US Dep Agric Berkeley Calif
Kirby MW 1971b The methodology of program budgeting on a National Forest The Eldorado experience Forest Service US Dep Agric BerkeleyCalif
Kirby MW 1974 A model for allocating roar maintenance funds [ Unpub-lished paper on file Pacific Southwest Forest and Range Exp StnBerkeley Calif]
Kirby MW D Wegner L Visser 1976 ADVENT A users guide 2nd Edition Forest Service US Dep Agric Berkeley Calif
NcConnen R M Kirby D Navon 1966 A planning programming budgetingsystem for National Forest Administration [ Unpublished report on filePacific Southwest Forest and Range Exp Stn Berkeley Calif]
Whaley RS 1968 Multiple use decision-making where do we go fromhere [Unpublished report on file Rocky Mountain Forest and Range Exp Stn Fort Collins Colo]
67
Forest Management Planning for Timber Production A Sequential Approach
Krishna P Rustagi
Abstract Explicit forest management planning for timber production beyond the first few years at any time necessitates use of information which can best be des-cribed as suspect The two-step approach outlined here concentrates on the planning strategy over the next few years without losing sight of the long-run productivityFrequent updating of the long-range and short-range plan makes it possible to keep a dynamic posture Instead of one single objective of maximization of discounted present net worth there are two objectives The short-run object-tive implicitly maximizes the volume or the discounted pres-ent net worth of timber harvested curing the first rotationsubject to equal area constraint the long-run objective explicitly maximizes the rate of return to the land either as timber volume (MA1) or annualized land rent The reduced size of the two problems makes this approach extremelypractical
INTRODUCTION
Timber management planning essentially involves decisions on two basic issues temporal and spatial scheduling of harvest during a planning period and the reforestation strategy that is to follow each harvest The former provides the amount of timber and income flow during the planning period Thelatter does much more It indicates the flow of timber and income one rota-tion in the future the needed reforestation investment curing the planningperiod and the rate of return to the land under the proposed alternative(s)These short and long-run flows are shapes by the management objectives spa-tial distribution of growing stock and restrictions if any on the level ofharvest andor reforestation activities
Combining harvest scheduling with reforestation planning in one model putsheavy demand on the information needs Not only are yield stumpage priceand reforestation and other costs needed for each stand but the same informa-tion must be projected for several decades and perhaps centuries The net result is an excessively large model and less than reliable input
68
If the forest schedule can be separated from the reforestation plan the resulting two models would be relatively small and need far less data The net result operatively practical models with better control on the qualityof input at far less effort The two-stage sequential approach is an attemptin this direction
UNCONSTRAINED OPTIMIZATION
The economic management objective is usually taken as a maximization of discounted present net worth over a number of rotations If there are no restrictions on the level of activities the same result could be accomplished by setting up a performance standard for each stand and evaluating its perform-ance against this standard Stands which are performing poorly should be har-vested and reforested with the alternative(s) which maximize soil expectation value (SEV) Mathematically a stand should be harvested if
MR - iR lt i(SEV)
Where
MR = marginal value growth in a stand if its harvest is postponed for one year
R = current value upon harvest
i = interest rate
SEV = maximum soil expectation value possible on that site under the given reforestation alternatives
Although this criterion for harvest scheduling looks innocently simple itis extremely difficult to apply in practice The value growth MR is affected by volume growth timber quality improvement (better diameter height and tree form) and appreciation (or depreciation) in stumpage prices due to inflation and cycling in economy In addition both R and MR are influenced by the price elasticity of stumpage demand
Adoption of this criterion would maximize the long-run discounted present net worth for the entire forest without actual use of a sophisticated model It may be pointed out however that if the forest is unbalanced to start with the uneven or interrupted yearly (or periodic) flow of timber will be perpetuated
CONSTRAINED OPTIMIZATION
In public and industrial ownerships certain restrictions are imposed on the level of activities in order to ensure long-run sustained flow of timber These restrictions usually result in regulation of harvest by equal volume or area over time Though restrictions of any kind would reduce the total dis-counted net present worth volume regulation tends to be more restrictive and gives rise to the spectacular but controversial allowable cut effect
69
(Schweitzer and others 1912) Further it is impossible to obtain strict even flow due to a variety of reasons including unbalanced initial forest struc-ture impreciseness in the estimation of growth and yield over time changes in utilization standards and technology and changes in the management intensity
Area regulation would also produce fluctuating harvest during the conversion period (first rotation) but ensure more predictable and sustainable long-term harvest Other advantages of area regulation include predictabilityand stability of reforestation investment and overall management-related activities
Linear programming models are often used for constrained optimization (Navon 1971 Clutter and others 1968) Nautiyal and Pearse (1967) also presented a theoretical model for maximizing discounted present net worth subject to area regulation Though theoretically correct these models are not very practical because of huge data needs and immense problem size Past experience has indicated that precise estimation of yield and growthoperations costs stumpage prices and interest rates are not possible beyond afew years and yet these models require this information for at least one rotation and often for more than a century
In view of this some real questions may be raised How sophisticated should a model be when the data cannot be obtained with any degree of reli-ability how intensively should such data be used by the model How far into the future should the planning horizon extend Obviously the sophistication of the model should match the sophistication of the data input if the data needs can be reduced both with respect to time and space it may be possible to direct more attention to the data collection effort thus improving the overall planning
THE SEQUENTIAL APPROACH
If the management planning problem is partitioned into two componentsthese would be (a) harvest and thinning scheduling and (b) reforestation planning In the sequential approach these two components are handled one at a time
Harvest scheduling is a disinvestment process and focuses primarily on timber and cash flow during the planning period The entire existing volume in a forest together with its growth is to be harvested before the first planned reforestations mature Any harvest scheduling strategy may be used between the performance standard approach at the one extreme and equal annual (or periodic) volume at the other extreme Because of its focus on output andincome in the near future harvest scheduling may be termed short-range planning
Reforestation implies deliberate investment of capital with land The focus here is on productivity and profitability of investment which will be realized one rotation in the future The level of investment in reforestation coupled with the productive potential of the forest lands essentially deter-mine future productivity and profitability Because of its long-range (beyond first rotation) implications reforestation planning may be termed long-rangeplanning
70
The objectives and data needs for the two components are entirely differ-ent In harvest scheduling information is needed by individual stands which may be characterized by species site age stocking and accessibility Both quantitative and qualitative data on yield and the expected stumpage prices are needed for each stand and each year of the conversion period It will be shown however that the yield and stumpage price information may be needed only for a subset of all stands and only for a fraction of the conversion period
The data needs for reforestation planning involve only operations after harvest These include reforestation cost expected total yield and stumpageprices for likely species management regimes and rotation lengths Onlyclassification of the forest area needed here is by site accessibility and perhaps conversion costs
Two assumptions are the basis for this sequential approach (1) thefuture rotation determination is not influenced by the existing growing stockand (2) the proposed reforestation planning must be optimal independently of the harvest strategy used These two assumptions enable us to partition one immense single constrained optimization problem into two relatively very small optimization problems
Rotation of the future crop--determined by the reforestation plan--indi-cates the time span in which the existing growing stock and growth thereupon has to be harvested Therefore if continuous timber flow is required the harvest scheduling should be preceded by the long-range plan In the sequen-tial approach the long-range plan is developed first The long-range plan is best summarized as follows
Long-Range Plan (Reforestation)
Objective Maximization of long-run timber output or rate of return to the land
Constraints I Reforestation of equal annual (or periodic) areas bysite
II Equal annual (or periodic) reforestation budget
Input I Area distribution by site accessibility etc II For each site and species method of regeneration
initial stocking level management regime and rotation - Total reforestation and subsequent management costs - Expected product output at rotation age - Expected annual rate of return to the land
Output I Area to be reforested annuallyII The reforestation schedule together with rotation
lengths by site III The long run annual total timber output IV The long run annual total income from the use of
forest land
71
The long-range planning problem could be handled by linear programming(LP) if the management objective is either long-run timber yield maximization or the maximization of rate of return to the land If a combination of both is desired the problem could be handled by goal programming (Rustagi 1976)As the problem size would be small--only a few hundred variables at most--therewould be scope for refining site classification and including a large number of regeneration methods and management regimes and several rotations The small size of the problem would also enable in-depth sensitivity analysis
The long-range plan gives an annual reforestation program which will maximize long-run income from the use of forest land subject to area and reforestation budget constraint If there is no constraint on reforestation budget the plan would indicate annual budget needs to implement the refores-tation program This program may be implemented as long as the input or the constraints do not change If any change does take place the problem can be easily reformulated and solved
Once the areas to be reforested by site and accessibility classes have been determined by the long-range plan their geographic location must be determined In the second stage of the sequential planning a harvest sched-ule is developed which tells where when and how much to harvest in different years of the conversion period This harvest scheduling problem may be sum-marized as follows
Short-Range Plan (Harvest Schedule)
Objective Maximization of discounted harvest income from existing stands or maximization of total timber yield during the conversion period
Constraint Area to be harvested in each year by site and accessibilityclass as given by the long-range plan
Input Estimate of yield and expected stumpage prices for each stand and for each year of the conversion period
Output For each year of the conversion period
I Geographical location of stands to be harvested II Expected harvest volume III Expected income from harvest
Though theoretically this harvest schedule should be prepared for the entire conversion period it is not really necessary to do so Those stands which are putting on the least volume or value growth in each site will be the first to be scheduled for harvest Likely candidates for this category in-clude stands past maturity grossly understocked stands or stands currentlyunder less economic species Immature stands which are growing vigorously are unlikely to be taken up for harvest for some time Thus if a harvest sched-ule is prepared for 10 years at a time using only a proportionate area com-prising the least vigorously growing stands and the plan is implemented for the first 5 years and revised the planning outcome will be as optimal as if the schedule is prepared for the entire conversion period
72
There are two significant advantages in harvest scheduling for a shorter period First only a fraction of the total forest area need be considered bythe harvest schedule thus more precise estimates of volume and value are possible for a given amount of effort Second as the harvest schedule is to be for only 10 years (maybe less) relatively reliable estimates of stumpagevalues and harvest costs are possible In short the amount of information to be collected may be as small as 10 percent of what would be needed to prepare a harvest schedule for the entire conversion period
The harvest scheduling problem may be handled by linear programming How-ever with an area constraint different management objectives or different scheduling strategies such as oldest stand first should not produce signifi-cantly different impacts on the objective function value An arbitrarily de-termined harvest schedule based on roading condition and proximity of stands to be harvested--which may not be built into an LP model--may outperform the schedule drawn by using LP
DISCUSSION
Suppose one million hectares of forest land is to be managed for sustained production with the long-run objective of maximization of income to the land Also suppose that there is a constraint on the reforestation of income to the land Also suppose that there is a constraint on the reforestation budgetFurther suppose that based on productivity accessibility administrative considerations and conversion possibilities this forest land can be divided into 10 site classes and for each site class 5 reforestation alternatives are available with information on reforestation cost rotation lengths total timber output and income from harvest at rotation age
The long-range problem if the sequential approach is used will have only50 decision variables 10 area constraints and one budget constraint The solution will include the number of hectares to be harvested and reforested and the rotation to be adopted in each site class Also total long-run timber output and income from the use of forest land can be computed
Suppose that this million hectares can be divided into 10000 homogeneous stands If the short-range plan is to be prepared for 10 years with an aver-age rotation length of 50 years yield and stumpage information will be needed for approximately 2000 stands covering 200000 hectares If formulated as an LP problem it will have about 20000 decision variables and 2050 constraints The problem size may be substantially smaller if the rotation is longer than 50 years or the planning period is shorter than 10 years For example a 5-year planning period may result in only 5000 decision variables and 1025 constraints
If however the two components are merged into one model such as Timber-RAM (Navon 1971) and a plan is prepared for the next 50 years with the same degree of spatial and temporal resolution the number of decision variables will increase to one million with number of constraints in excess of 10000 Whereas this large problem size will force aggregation further resolution is possible under the sequential approach
73
The advantages of the sequential approach to timber management planningmay be summarized as follows
1 The size of both the long and short-range problems are small This makes it possible to examine a much larger number of investment alternatives and exercise better control on the quality of input
2 The long-range plan provides long-run predictions of timber output without actually developing a management plan for a rotation or longer period
3 The investment analysis of planned reforestations is very explicit and separate from current harvest income
4 As the regulation of harvest is not by volume allowable cut effect (Schweitzer and others 1972) cannot be used for distorting investment analysis
5 Because of small problem sizes as frequent as annual updating of both long-range and short-range plans is practical
It may be argued that the long-range plan described here also uses estimates of costs and stumpage process up to the end of a rotation Un-fortunately there is no way to avoid use of these numbers if the refores-tation investments are to be evaluated according to some economic criterion These numbers will not be needed however if a biological criterion is used in establishing maturity If it is assumed that the stumpage price will main-tain the historical rising trend in the foreseeable future and that thinningand fertilization will be used increasingly the financial rotation usingFaustmanns formula may not be significantly different from the rotation of maximum volume production which can be predicted with greater accuracy and is unaffected by economic factors such as costs stumpage prices and interest rates
Though the long-range plan has equal area constraint this may be relaxed to take advantage of the timber market so long as these variations even out in the long run This flexibility of scaling harvest up and down is available only so long as some kind of long-run sustained harvest is followed
Thinnings were excluded purposely from harvest scheduling Though com-mercial thinning is income producing it is essentially a silvicultural opera-tion carried out to increase the value growth of the residual stand and to prevent mortality loss When and where to thin may be best decided after a harvest schedule has been prepared Coordination of thinnings with harvest cut in nearby areas may provide better return than may be possible otherwise
An application of the sequential two-step approach outlined here has been presented by Rustagi (1976) where the long-range reforestation planning has been handled by goal programming and the short-range harvest scheduling bylinear programming This application reveals that with equal area constraint total discounted present value of harvest during a planning period is not significantly different whether the objective is biologic or economic The actual harvest schedule however may vary with the short-run objective
74
LITERATURE CITED
Nautiyal JC and PH Pearse 1967 Optimizing the conversion to sustained yield - a programming solution Forest Sci 13(2)131-139
Navon Daniel I 1971 Timber RAM a long-range planning method for commercial timber lands under multiple-use management USDA Forest Serv Res Paper PSW-70 22 p illus Pacific Southwest Forest and RangeExp Stn Berkeley Calif
Rustagi Krishna P 1976 Forest management planning for timber production a goal programming approach Yale Univ Sch For Environ Stud Bull 89 80 p
Schweitzer DL RW Sassaman and CH Schallau 1972 Allowable cut effect - some physical and economic implications J For 70(7)415-418
University of Georgia School of Forest Resources 1968 Max-million a computerized forest management system Athens Ga 61 p
75
A Two-Phase Method for Timber Supply Analysis
Stephen Smith
Abstract There is an increasing need to clarify the long-term wood supply implications of current harvestingrates To assess the wood supply and to set timber pro-duction objectives different linear programming techniques are applied to the short and long term The transportation method is applied to the short term and the B C Forest Service computer-assisted resource planning method is applied to the long term
INTRODUCTION
Of all the decisions facing forest policymakers probably the most criti-cal because of its economic importance is the rate at which timber is to be made available for harvesting The timber-producing base is diminishingthrough increased recognition of an array of legitimate non-timber usersthrough environmental protection measures and through changes in the eco-nomics of logging The nature of the productive forests is changing from unmanaged large old-growth to young-growth forests whose products will be smaller and in different proportions by species In this changing world the British Columbia Forest Service must maintain a continuing wood supply to support a healthy competitive forest industry and ensure the productive integration of land uses All these factors generate an increasing need to clarify the long-term wood supply implications of present timber harvestingrates
In 1976 the Royal Commission on Forest Resources (Pearse 1976) recommended changes in the current methods of timber yield regulation In particular it recommended that yield controls should (1) apply to Timber Supply Areas (TSAs) serving manufacturing areas and communities (2) recognize log supplypatterns and transportation facilities within the timber supply area (3)embody reasonable expectations about future trends in forest growth and values and (4) recognize the uncertainty surrounding long-term forecasts This paper describes a small part of the response by the British Columbia Forest Service to these recommendations
76
TIMBER SUPPLY AREAS
Within the regions of the Province timber supply areas can be identified which serve manufacturing areas and communities The supply areas have large-ly evolved from establishment of forest industry and the development of associ-ated communities Insofar as public policy is to be directed toward supportingthe income and employment base of forest-dependent communities yield controls must be designed to apply to the relevant timber supply areas There should be some flexibility in setting short-term harvesting rates together with a mechanism for clearly showing their long-term implications for the future wood supply
TWO-PHASE METHOD
To meet the described requirements for revised yield controls the ap-proach has been to separate the relatively short term (the next 20 years) from the very long term (about two rotations) In defining timber production ob-jectives over the 20-year horizon the Forest Service must ensure that the short-term rate of cut will not result in an unacceptable decrease in the fu-ture wood supply Accordingly a practical conceptually simple process con-sisting of two phases has been developed from which timber supply area wood production goals can be derived
Phase 1 (Short Term)
Develop and describe 20-year production goals in the form of a simple wood flow plan The plan describes a feasible efficient movement of wood from the different localities within the timber supply area to the different broad in-dustrial sectors In practice this 20-year look ahead would be used to set 10-year objectives The 10-year production objectives are to be reviewed every 5 years
Phase 2 (Long Term)
Determine the projected timber production curve over one or two rotations for the entire timber supply area setting the overall cutting rate for the first two decades equal to that developed in phase 1
If the results of phase 1 cause the long-term rate of cut to drop below the 90 of the long-run sustainable yield then phase 1 must be modified until it is in harmony with the long term goals
FORMULATION OF THE SHORT-TERM ANALYSIS
The supply area can be described as a network in which there are local-ities (supply points) supplying industrial sectors (demand points) The20-year horizon can be divided into four 5-year periods Each supply point has an inventory of accessible usable timber each demand point has a minimum
77
demand to be satisfied and a physical capacity which cannot be exceeded The objective is to select for the duration of the horizon a routing plan which satisfies all the demands does not exceed the supplies and physical plant cap-acities and attempts to maximize the value of the routing plan
One formulation of the problem is given below
Maximize Σijk rijk xijk
Subject to the demand constraints
-Σjkxijk le Di minimum total sector demands over the 20 year horizon
(1)
-Σjkxijk ge Mi maximum total sector demands over the 20 year horizon
(2)
Σj - aijks xijk ge SDiks maximum sector demand by species and time period
(3)
where - SDiks giksPik
-Σj xijk le PDik minimum total demand by sector i in time period k
(4)
and subject to the supply constraints
Σijk xijk le T total wood supply (5)
ΣiΣk xijk le Sj total wood supply for each management unit
(6)
Σi xijk le MS jk wood supply for each management unit in each time period
(7)
Σk xijk le SSij total supply available to sector (8)i from management unit j over the 20 year horizon
xijk = volume of wood allocated to sector i from management unit j in time period k
rijk = value of a unit of wood allocated to sector i from management time unit j in time period k
Di = total minimum demand for sector i over the 20 year horizon
Mi = total maximum demand for sector i over the 20 year horizon
Pik = maximum demand for sector i in time period k
aijks = proportion of species s in a unit of wood from management unit j which can be used by sector i in time period k
78
SDiks = maximum demand by sector i for species s in time period k
giks = the average proportion of species s used by sector i in time period k
PDik = minimum total demand by sector i in time period k
T = total wood supply in the supply area available for cutting in the next 20 years
Sj = total wood supply in the jth management unit available for cutting inthe next 20 years
MSjk = total wood supply from management unit j in time period k
SS ij = total supply available to sector i from management unit j over the 20 year horizon
i = 15 j = 110 k = 14 s = 16
LONG-TERM ANALYSIS
Obviously it is not sufficient to allocate existing mature timber invent-tories from the management units within the supply area without looking atthe long-term consequences for the supply area as a whole Use of a subset of the Computer Assisted Resource Planning System (Williams and others 1975) al-lows calculation of a long-term production curve for the entire timber supplyarea constrained for the first two decades to the harvest level set in the short-term calculation In this calculation the harvest scheduling formula-tion is that produced by Timber-RAM (Navon 1971)
APPLICATION OF THE METHOD
After assessing present and projected industrial demands and the net tim-ber supply a simple question-and-answer sequence can be followed to arrive at a set of timber production goals Those questions in the order that they are addressed in the process are
Can the present cutting rates be maintained over the next twenty years
What effect will maintenance of the present cutting rate have on long-term timber supply
What are the projected increased industrial demands over the next twentyyears and can cutting rates be raised to meet them
If increased demands can be met over the next twenty years what will be the effect on the long term supply
79
The method also has the following capabilities
Likely periods of scarcity for a particular industrial sector can be highlighted
Areas that have to be developed by a certain time to meet wood supplyneeds can be pinpointed
The effects of changing sector demands on the wood supply picture can be predicted
The effects of changing the log supply pattern on the wood supplypicture can be predicted
A starting point is given for long-range strategies to ameliorate impending wood supply problems if they are indicated
RELATING TO NONTIMBER RESOURCE USES
An initial wood supply analysis provides valuable input to determiningoverall resource use policy With this information out on the table other resource managers can participate effectively in the development of alterna-tives for a timber supply area and later on for a complete region
Once alternatives are developed which express the needs of other resources one can be chosen by the decisionmakers or additional alternatives can be pre-pared prior to the decision
RESULTS OF THE PROCESS
Tables and graphs are generated showing planned rates of harvest for the timber supply area in each of the next four 5-year periods Planning harvest rates are broken down by management unit and industrial sector
For the long term graphs and tables are generated allowing an assessment of the long-term wood supply which will result from implementing the 20-year harvesting plan
These results enable the Forest Service to set timber production object-tives and are a starting basis for the development of associated reforestation and silvicultural goals
The method outlined in this paper is part of the Forest Service planningsystem (British Columbia Forest Service 1978)
80
REFERENCES
British Columbia Forest Service 1978 Planning Handbook British Columbia Forest Serv Resour Plan Div Victoria BC
Navon Daniel I 1971 Timber RAM a long range planning method for com-mercial timber lands under multiple use management USDA Forest Serv Res Paper PSW-70 22 p illus Pacific Southwest Forest and Range Exp StnBerkeley Calif
Pearse PH 1976 Timber rights and forest policy in British Columbia Rep Royal Comm Forest Resour
Williams DH JC McPhalen SM Smith MM Yamada and GG Young 1975 Computer-assisted resource planning an overview of the CARP project [Unpublished paper on file at Fac For Univ British Columbia Vancouver]
81
Timber Management Planning with Timber RAM and Goal Programming
Richard C Field
Abstract By using goal programming to enhance the linear programming of Timber RAM multiple decision criteria were incorporated in the timber management planning of a National Forest in the southeastern United States Combininglinear and goal programming capitalizes on the advantages of the two techniques and produces operationally feasible solu-tions This enhancement may also be applicable to linear programming packages other than Timber RAM
INTRODUCTION
In its timber management planning the Forest Service U S Department of Agriculture often uses a linear programming (LP) package called Timber RAM (Resources Allocation Method) to calculate the potential yield under forest regulation Regulation is defined as that future arrangement of forest treat-ments in space and time which achieves specified long-term objectives The other part of timber management planning harvest scheduling is the treatment of existing forest conditions to achieve short-term goals and make some move towards the regulated condition This planning phase is generally beingcarried out in some subjective nonoptimal manner I show here how goal pro-gramming (GP) might be used to improve the utility of Timber RAM for both forest regulation and harvest scheduling
Timber RAM
To understand this paper the reader must be somewhat familiar with the LP-based Timber RAM Space does not permit a complete description here for details on the Timber RAM package see Navon (1971) Timber RAM is a set of computer programs which (1) generate input for any of several standard LP solution packages and (2) produce final reports based on the input and the LP solutions The latest versions of these programs are written for Univac 1100-series computers using the EXEC 8 operating system However the LP matrix generated for Univacs Functional Mathematical Programming System (FMPS) can also be solved using IBMs Mathematical Programming System (MPS) Timber RAM
82
can also produce a matrix for solution by Univacs linear programming packageILONA Earlier versions of Timber RAM are available for CDC and IBM computers
Input data for Timber RAM include current stand conditions projected yields of alternative treatments regulation methods harvest flow and budget-ary constraints regeneration possibilities and limitations stand accessi-bility and associated economic data and constraints Different decision cri-teria can be entered by specifying indices of performance such as volume net revenue and cost with associated discount rates and periods of optimization The user selects a single objective function for each desired solution of the LP problem
In the United States Timber RAM has been used primarily to maximize the short-run potential yields of western National Forests where there is a prepon-derance of overmature timber Previously these forests were regulated through use of volume control formulae The linear programming with Timber RAM provided an improved approach (Hennes and others 1971) However most of these applications of RAM were formulated as harvest scheduling problems as is evident from the objective function which is to maximize first decade har-vest and from the lack of constraints on the harvest flows after the forest is assumed to be regulated Yet budgetary constraints such as are necessaryfor an operational harvest schedule were also lacking Hence the solutions merely indicated the maximum yield that would be biologically and technologi-cally possible during the short-term planning period and did not provide a solution to the regulation problem
In the southeastern United States where the National Forests are generallyunderstocked area control has been used instead of volume control as the reg-ulation method Due to the relatively small contribution of the National Forests to southeastern timber supplies Timber RAM has not been used in this region even though it can model the area control approach
The Timber RAM system is adequately documented and fully supported by the Forest Service For many National Forest planners availability and conven-ience outweigh the inflexibilities of the system enumerated by Chappelle and others (1976) Some of the technical drawbacks of RAM can be reduced by the procedures outlined in this paper
New legislation regarding the National Forests implies however that managers must seek to achieve future conditions which are optimal and which insure regulation These conditions will then limit all harvests includingthose prior to the achievement of the regulated state Strict area control cannot in general satisfy the constraints on harvest levels during conversion to the regulated state and the other procedures currently in use do not ade-quately constrain to assure regulated conditions This paper describes how Timber RAM enhanced by GP can be used to determine the required solutions to the timber management program
83
Goal Programming
GP is a special form of LP suggested by Charnes and others (1955) It permits the simultaneous treatment of multiple objectives which may be incom-mensurate Typical LP objective function rows are added to the constraint matrix as equalities Right-hand sides that reflect the desired level of each objective are included as are slack and surplus variables for each row Then a new objective function composed of the slack and surplus variables of the former objective functions (the positive and negative deviations from the de-sired goals) is constructed and minimized by a standard LP algorithm Differ-ential weights greater than or equal to zero may be attached to the deviations to reflect the decisionmakers value system
Applications of GP to natural resources problems have generally used ordi-nally weighted deviations to effect a preemptive ranking of the goals as des-cribed by Field (1973) In this study however cardinal weights were used to indicate relative values among goals rather than goal preferences Rustagi(1976) used a similar approach in applying GP to forest regulation This idea is extended here to include harvest scheduling by using GP to develop compro-mises between the several solutions available from Timber RAM
METHODS
Timber RAM Input
Forest Data
The test area for this study was Oconee National Forest in the middle Piedmont of Georgia In this forest of approximately 40000-ha about 80 of the area is in stands of loblolly pine (Pinus taeda L) and short pine (Pechinata Mill) and the remainder is in various mixtures of pine and several species of hardwoods The pine stands are categorized by three classes of site productivity and nine classes of stand age or condition The other stands (hereafter referred to as hardwoods) are categorized by only two pro-ductivity classes
For each stand class and a variety of treatments yields were estimated from published models forest inventory data and local timber sale data Local forest policies dictated the type and range of activities that had to be evaluated Generally clearcuts at several ages with or without prior thin-ning were used for the pine whereas uneven-aged management with cutting cy-cles of two different lengths were used for the hardwoods Local estimates of costs and revenues associated with harvest and regeneration were obtained These forest data were then coded for use in Timber RAM
Problem Constraints and Decision Criteria
The National Forest Management Act of 1976 and current Forest Service policy may be interpreted as prohibiting any harvest greater than the long-
84
term sustainable average and any harvest less than the level of any previous harvest Indeed the law seems to imply that a perpetually even flow of timber yield from the present cut henceforth is required The law permits these con-straints to be based on 10-year averages Under these assumptions the current cut is the lower bound for the initial harvest whereas long-term sustained yield is the upper bound on the initial and all subsequent harvests and the intervening flows must be uniform or at least nondeclining The law states that flow constraints may be relaxed only for consideration of other multipleuse objectives The requirement for even flows during the conversion to the regulated condition it may be argued may then be relaxed as necessary toachieve a high level of sustained yield a possible multiple use objective
Nondeclining and even flow constraints are easily incorporated in the Timber RAM model by using the option called volume control and regulation with sequential lower bounds only The lower bound must be set at zero for each control period during the time allowed for conversion to the regulated condition The maximum yield permitted in the last control period of conver-sion must equal the postconversion average (long-term sustained yield) Fluc-tuation in 10-year yields cannot be permitted after conversion For the Oconee forest application limits were also placed on the expenditures and on the area harvested and regenerated in each decade by using Timber RAMs interval con-straints Thus harvest scheduling as well as forest regulation constraints were included in the same model
The three decision criteria used for the Oconee application were the maxi-mization of total volume and of present net revenue and the minimization of total cost These criteria covered the entire planning horizon of 150 years economic values were discounted to the present at a 6 rate of interest
Matrix Alternatives
The single LP matrix normally generated by Timber RAM from the input de-fining the problem is usually inadequate for planning The planner may want to obtain solutions under different sets of constraints as well as different de-cision criteria Also certain modifications can improve efficiency of compu-tation and others are required to implement the GP formulation The followingmethods were used to create the necessary models for the Oconee National Forest
Alterations during Matrix Generation
Two intermediate optimization problems were generated The first was de-signed primarily to test the model Here all but one productivity class of pine was removed from the model and only clearcuts were permitted as manage-ment activities The objective was to produce a small and generally predict-able matrix Solutions to this problem were obtained under the full range of constraint and objective variations discussed below In addition some matrix coefficients were systematically changed and postoptimality analyses were per-formed
85
The second intermediate problem contained all the stand classes and con-straints that were in the full problem but the number of activities was re-duced from 2229 to 228 For each basic variation of the full problem a solu-tion was first obtained with this abbreviated model The solution was then used as an advanced basis to start the optimization phase of the full problem This proved to be an efficient way to test solution procedures and it short-ened computation times for solutions to the full problem Such an approach is useful when applying LP to any large problem
Alterations after Matrix Generation
There are two ways to change a matrix already generated by Timber RAM Simplest but not necessarily most efficient is to physically change re-place add or delete certain entries by editing This procedure is useful for correcting a few errors in a small matrix For a large matrix (the full pro-blem in this application had 77442 elements) it is usually cheaper but not necessarily quicker to correct the raw input and generate a new matrix Some form of editing or a programmed rewrite may be necessary for a large number of systematic changes which cannot be handled by these methods or others discussed below Here one FORTRAN program was used to generate test problem matrices with reduced yield coefficients and another was used to create rows in the large matrix for certain GP models
The best way to make temporary changes in an error-free matrix is with the standard revise and modify options in the LP package Typical changes in-clude relaxing certain constraints changing right-hand sides and adding or modifying rows for GP Relaxing certain flow constraint rows not only provides useful information on trade-offs but because the solution times are relativelyshort is also another good way to test solution procedures Other modifica-tions successfully tested in this study are (1) creating objective functions not available from the Timber RAM matrix generator (2) deleting redundant rows that occur with certain options and (3) creating nonconstraining rows to facilitate reading the solution
Goal Programming Formulations
In this application two basic GP models were constructed In the firstthe three single-criteria optima (volume net revenue and cost) from the LP models were the goals and the sum of the underachievement of the volume and revenue goals and the overachievement of the cost goal was minimized In sep-arate variations of this model the deviations were equally weighted weighted in favor of volume and relatively weighted In the last case each goal row was divided by the right-hand side (the goal) before the deviations were added Thus the sum of the relative or proportionate deviations from the goals as opposed to absolute deviations was minimized
The second GP formulation minimized the sum of the deviation from the total volume goal and the deviations from each periodic volume flow goal The original right-hand side of the constraint equation was used as the goal for
86
each periodic flow Thus the objective function included the underachieve-ment of the current cut by the harvest in the first period the underachieve-ment of the previous harvest by each subsequent harvest during conversion the overachievement of the long-term average by the last harvest in conversion andthe over- and under- achievements of the long-term average by each post-conver-sion harvest Variations in flow goals and economic goals with a variety of weights were tested only on the small problem
Many other combinations of weighted goals and constraints can be formulated to best meet the planning needs of the decisionmaker For goals that would normally be objectives in an LP model simply add a right-hand side that is at least as large (or small) as can be attained with single objective optimiza-tion Otherwise the row should be a constraint For goals that would be con-straints in an LP model the existing right-hand side or constraint is typi-cally used However solutions to such problems should be carefully studied and compared to fully constrained single objective solutions especially if many or all the goals are achieved There may be more acceptable solutions that are easily obtainable but go unrecognized in such goal formulations
RESULTS
The results involve LP solutions GP solutions and postoptimality anal-ysis of the small test problem The LP set were obtained from Timber RAM usingthe procedures outlined above The GP set is based on the reformulations of the Timber RAM matrix as GP models The postoptimality results are based on LP and GP solutions for the single site single rotation and uniformly managed test problem
Linear Programming Solutions
The first solution of interest used the standard Timber RAM criteria of volume maximization Typically if the solution was feasible and if the deci-sionmaker was happy with the harvest provided for the first decade (the short-term planning period) the analysis stopped there In this case however the solution contained alternative optima which indicated that there are other strategies which meet the constraints and still give the same optimal object-tive value This result implies that the analysis may not be complete because the procedure does not rank the strategies which can produce the optimum
The solutions based on economic criteria also revealed some interestingconditions The net revenue optimum was achieved by only one strategy but the total harvest and long-term average were less than those provided by the maxi-mum volume solution A long-term yield less than the maximum combined with the Forest Services reluctance to use profit as a decision criterion makes this solution less acceptable even though it met all constraints From a policy standpoint cost minimization might be more acceptable except that with this criterion only enough acres would be harvested to meet the current cut constraint In the other two solutions the first period harvest was more than double the current cut Consequently none of these three solutions provided a completely acceptable basis for a timber management plan
87
Goal Programming Solutions
Standard LP variations and postoptimality analysis might be able to improve single criterion solutions or show the cost of certain constraints Butwithout reformulation or considerable external analysis such procedures can-not effect the compromise between the alternative solutions that planningprocedures usually require GP provides for such a compromise The solution using the optima from the three LP solutions as equally weighted absolute goals achieved the same long-term sustained yield as the volume maximization solution as well as 96 of the maximum net revenue and 96 of the maximum volume for the planning period There were no alternative optima in this solution
Other goal formulations with differential weights would give differentbut still feasible and conveniently determined solutions When the deviation from the volume goal was given a weight of 10 while the others remained at one the solution nearly achieved the volume goal But the net revenue was higher than in the LP solution that maximized volume
A formulation with equal weights on all goals carries implied weights in favor of the goals of larger numerical value Relative weighting reverses this bias Such effects were demonstrated in this application by the levels of achievement for the largest and smallest goals revenue and cost respect-tively A solution using relative weights favored the cost goal In this solution the current cost was just matched as it was in the cost minimization solution but many more acres were treated because of the influence of the volume goal
Postoptimal Solutions
Sensitivity analyses to test the stability of certain solutions given spe-cified changes in inputs were limited to the small problem These iterative techniques are quite expensive when applied to large problems However the following results would seem to apply equally well to the large problem
In the first set of tests the sensitivity of the solution to changes in yield estimate was determined under the LP volume maximization criteria A uniform change in current and future yields produced no change in the strategythat gives the optimum value of the objective function Naturally levels of periodic flows and total yields varied directly with changes in input
It was next assumed that yield estimates for existing stands were correct and that the only changes that must be considered were for the yields of re-generated stands New solutions then arose but the activities selected for the first few periods were still unchanged Similar results were obtained with the GP formulations The stability of the preferred strategy reflects the de-pendence of early treatments and results on the conditions in existing stands Recall that this analysis supports a short-term planning effort and that re-planning and analysis will be required at relatively short intervals Thus considerable variation in long-term yield projections may not be detrimental to a typical timber management plan
88
Postoptimality analysis was also used in the GP formulation to systemati-cally change the weights on certain goal deviations A wide range of solutions resulted and indicated just how heavily a particular goal must be favored be-fore it will dominate all others For example the volume goal required a weight 31 times those for harvest flow goals in order to approximate the LP optimum for volume without flow constraints
CONCLUSIONS
Timber RAM may be attractive for the beginning forest planner if the necessary computer facilities are available It provides the basis for several approaches to forest regulation and scheduling of harvests on public lands A land manager can employ some of the techniques presented here to enhance the application of Timber RAM Simple reformulation as a goal model is within the capability of many users of RAM and helps to synthesize several satisfactory or nearly satisfactory solutions The combination of LP and GP can also be useful with mathematical programming packages other than Timber RAM including those used on privately owned lands Finally using GP in timber management planningsets the stage for multiple use planning because it provides the framework for the subsequent inclusion of other forest resources and products as additional objectives
Acknowledgments This study would not have been possible without the guidance of Dr Peter Dress who originally suggested the comparison of linear and goal programming Nor would my success with Timber RAM have been possible without the able assistance of Dr Daniel Jones
LITERATURE CITED
Chappelle DE M Mang and RC Miley 1976 Evaluation of Timber RAM as a forest management planning model J For 74288-293
Charnes A WW Cooper and RO Ferguson 1955 Optimal estimation of executive compensation by linear programming Manage Sci 1138-151
Field DB 1973 Goal programming for forest management Forest Sci 19125-135
Hennes LC MJ Irving and DI Navon 1971 Forest control and regu-lation a comparison of traditional methods and alternatives USDA Forest Serv Res Note PSW-231 10 p Pacific Southwest Forest and Range ExpStn Berkeley Calif
Navon DI 1971 Timber RAM -- a long-range planning method for commercial timber lands under multiple use management USDA Forest Serv Res Paper PSW-70 22 p Pacific Southwest Forest and Range Exp Stn BerkeleyCalif
89
Rustagi KP 1976 Forest management planning for timber production a goal programming approach Yale School of Forestry and Environmental Studies Bull 89 84 p New Haven Conn
90
Analytical Aids in Land Management Planning
David R Betters
Abstract Quantitative techniques may be applied to aid in completing various phases of land management planning Analytical procedures which have been used include a procedure for public involvement PUBLIC a matrix information generator MAGE5 an allocation pro-cedure linear programming (LP) and an input-output economic analysis (EA) These techniques have proven useful in the development of lane management plans for a number of National Forests in the United States
INTRODUCTION
The typical planning process used for developing land management plans follows a sequence of several phases Although this overall process might be described in many ways the major steps shown in detail in Table 1 are (1)the identification of issues and objectives (2) the development of the resource system and management options (3) the analysis of tradeoffs with the decision and feedback
Various quantitative techniques may be applied to aid in completing these basicphases The Systems Application Unit for Land Management Planning (SAU-LMP) of the Forest Service US Department of Agriculture has utilized several types of analytical procedures in the successful development of land management plans for National Forests in the United States Specifically those used most often by SAU-LMP are a procedure for public involvement abbreviated PUBLIC a matrix information generator called MAGE5 an allocation procedureknown as linear programming LP and an input-output economic analysis called EA
91
Table 1--The land management planning process
Systems ApproachTerminology Major Phases
I ISSUE IDENTI-FICATION
Set II FORMALIZATION Objectives OF PLANNING
System III DEVELOPMENT Design OF ALTERNATIVES
System IV ANALYSIS OF Analysis TRADEOFFS AND
FORMULATION OF A RECOMMENDED
SAU-LMP Detailed Phases Analytic tools
Pre-Plan Organization -Establish time frame for plan -Establish personnel require-ments for plan-Define degree of public involvement
Identify Issues and SetObjectives-Define critical issues and their source -Define assumptions concern-ing decisions environment PUBLIC -Define hierarchial set of goals -Define criteria to be usedto test performance
Define Resource System -Stratify land base to address issues -Designate management options -Define resources and products
Define the Responses-Identify information needs sources of information and detail necessary MAGE5 -Determine resources andeconomic responses to manage
activities
Analyze the Resource System-Define the processes to be used in analysis -Generate alternative management strategies -Define tradeoffs between strategies -Develop a scenario to describe tradeoffs LP -Test each alternative in terms of meeting criteria of performance EA
92
Decision and DecisionFeedback -Select a preferred alternative
-Prepare a written plan directive and draft impact statement
Feedback-Describe procedures for monitor-ing plan implementation and revision when necessary-Insure tasks are carried out effectively and efficiently-Insure work plans are developed
PUBLIC
PUBLIC is the procedure used curing the issue-identification and objective-setting phase to make quantitative estimates of public preferences and of con-flicts among those preferences (Case and others 1976) The program is used at public workshops where the participants are asked to rank ordinally the uses of various National Forest resources from what should be most emphasized to what should be least emphasized PUBLIC is then used to analyze this input to estimate agreement and disagreement in the total group and to determine the least disliked priority ranking of Forest resource uses The program constructs this ranking by creating an array of responses which indicate the votes for each preference Then through a process of elimination it as-signs preferences to an order on the base of whether a use preference re-ceives either the majority of first-place votes or the majority of the most disliked votes At the same time the procedure identifies subgroups which seem to have like interests or preferences A statistical procedure factor analysis is used to subdivide the respondents into these subgroups An estimate of the level of agreement within these subgroups is measured by the Kendal Concordance Coefficient This is a statistic which generates on a scale of 0 to 1 a measure of subgroup agreement 1 representing total agree-ment and 0 total disagreement
This type of information is useful during the workshop session to groupparticipants with like interests so they can work on specific alternative des-criptions and resource-use levels or requirements The procedure also supplies information which is useful for many different types of analyses to be conduct-ed later inducing comparisons of local preferences to overall regional pref-erences comparisons of US Forest Service staff preferences to local prefer-ences and analysis of public perception of agency priorities Further and most importantly PUBLIC helps develop the type of public involvement infor-mation necessary to construct alternatives for analysis in subsequent phases of Forest level planning The following table shows an ordering arrived at bymeans of PUBLIC
93
Overall orderingentire workshop Subgroup 1 Subgroup 2
Wildlife Watershed Wilderness Scenic beautyDispersed Rec Watershed
Range Timber Wildlife
Scenic BeautyDispersed Rec Wildlife
Timber Developed Rec Mineral Extraction
Dispersed Rec Developed Rec Mineral Extraction
Range Developed Rec Timber
Wilderness Wilderness Mineral Extraction
The preference patterns shown could be used to develop strategies which might be described in scenario form as
Strategy 1 (Overall ordering) Emphasize wildlife scenic beautyand dispersed recreation with less emphasis on watershed rangeand timber and give low priority to developed recreation mineral extraction and wilderness
Strategy 2 (Subgroup 1) Emphasize watershed range and timberwith less emphasis on wildlife scenery and dispersed recreationand give low priority to wilderness mineral extraction and devel-oped recreation
Strategy (Subgroup 2) Emphasize wilderness scenic beauty and dispersed recreation with less emphasis on wildlife watershedand range and give low priority to timber mineral extractionand developed recreation
These strategies could be used as part of the basis for construction goals and priorities for a Forest plan
MAGE5
The next planning phase involves defining various aspects of the resource system This phase of planning employs both the information concerning use preferences described above and information concerning the land base to con-struct specific management options and resource uses for each of the manage-ment strategies previously identified Once the management options have been determined the consequences of each on the environmental resource and the economic responses must be defined The US Forest Service uses MAGE5 a matrix generator to help the planner identify develop and store the nec-essary bits of information (US Dep Agric Forest Serv 1973) Since most plans cover a planning horizon of several years one of the most significant benefits of using MAGE5 is that it allows for the time factor and attendant time changes in developing the appropriate dynamic data for the matrix MAGE5 uses a concept called timestreams to adjust resource uses benefits and costs to changes which occur with time it automatically constructs a matrix whose coefficients reflect this time dimension
94
For example suppose that the planning horizon is ten years subdivided into two periods of five years A management option involving timber harvest mightbe applied either during the first period or during the second period The values calculated for MAGE5 for the matrix rows and columns are as follows
Management option involving timber harvest
applied in
Present First Second condition period period
Average sedimenthayrin the first period 04 064 04
Average sedimenthayrin the second period 04 068 064
Since the sediment yields are constant under present conditions in this land area the average yields in each period are 04 cubic meter per hectare per year provided nothing changes The average values for sediment yields where timber harvest is involved assume that the application of the option to an acre might occur at different years in the period For example the timber harvest might take place in any one of the five years of the first period The various possibilities and the subsequent timestreams for sediment yield per year during the first period are as follows
Option applied in
First year
Second year
Third year
Fourth year
Fifth year
Year 1 Year 2 Year 3 Year 4 Year 5
08 08 08 08 08
04 08 08 08 08
04 04 08 08 08
04 04 04 08 08
04 04 04 04 08
Note that if the option is not applied until a later year in the periodthe present condition yield of 04 applies to all preceding years The aver-age value 064 for the sediment yield in the first period is the sum of the possibilities divided by their number or 1625 = 064 The other matrix en-tries are calculated in a similar manner with the timestream depending onwhat period is being considered
This concept is used to develop average yearly values for resource uses or commodities and for costs and benefits These values are stored in a matrix format which can be utilized along with other tools such as LP which are used in later phases of the planning process
95
LINEAR PROGRAMMING AND ECONOMIC ANALYSIS
Once the phases described so far are completed the next step in the plan-ning process is to analyze the resource system in order to determine how to al-locate management options that best meet the preferences specified by the vari-ous strategies and in order to identify the biological and socio-economic tradeoffs among strategies In making these assessments the planner uses the information developed thus far in conjunction with two analytical aids linear programming (LP) and an input-output economic analysis (EA) in the process of land management planning a separate LP analysis is made for each management strategy so that the allocations which best meet the requirements and con-straints stated for each strategy may be determined For example a separate analysis might be mace far~ each of the three strategies specified earlier Requirement levels are typically based on both the information developed in the earlier stage of public involvement and the kind of production of which the land is capable Limiting factors might be such things as the number of acres available for possible options the available budget environmental con-straints and policy considerations such as nondeclining timber yield from the Forest The objective functions might include such considerations as the max-imization of present net benefits or minimization of costs over the term of the planning horizon
The management options are selected on the basis of lava suitability and inline with the public involvement process There is usually a wide range of possibilities inducing wilderness management big game management at various levels various types of recreation management and various kinds of timber management treatments Each of these options might require a number of activ-ities For example recreation management (type I) might require monitoringuse closing roads and constructing trails
A comparison must be made between LP results in order to show the trade-offs among allocations resource outputs constraint levels costs and bene-fits A good deal of additional information can be derived from the sensi-tivity or post-optimality analysis which indicates bow resource uses con-straints and benefit values may change without affecting the LP optimal allo-cation This is useful for a number of different purposes such as deter-mining what parameters may be most sensitive to changes in the plan and ascer-taining whether additional inventory in certain areas may be appropriate
The linear programming results are further utilized with the EA analysis package to estimate the impact which each of the possible strategies would be likely to have on local economic activity and employment levels (Palmer and Layton 1973) Given a particular strategys predicted resource use or level of output the LA analysis measures both the direct effects and the indirect or multiplier effect on various sectors of the local economy This economic analysis results in a measure of the change in economic conditions likely todevelop as a result of the application of a particular strategy The signifi-cance of this impact depends in part on the magnitude of the change from what is the present condition and in part on the degree of influence this change has on the overall local or regional economy
96
Table 2 is an example of the results of using the input-output portion of EA which shows both the sectors affected directly and others which are indi-rectly affected as the impact of the change ripples through the economy In the example this effect amounts to $131863 in total gross output The EA package also estimates the effect the change will have on local employment ac-cording to individual occupation and month of the year
Table 2--Sample results of using the input-output package of EA
FINAL TOTAL GROSS CONSUMPTIVE VALUE SECTOR DEMAND OUTPUT WATER USE LABOR INCOME ADDED
($1000) ($1000) (ACRE-FEET) MAN YEARS $1000 $1000
1 AGRICULTURE 225308 270084 0000 3884 45790 71964
2 MINING
3 CONSTRUCTION
4 LOGGING
5 SAWMILLS
6 OTHER MANUFACTURING
7 TRANSPORT amp WAREHOUSING
8 COMMUNICATION amp UTILITIES
9 AUTO DEAL amp GAS STATIONS
10 EATING amp
001 131 0000 003 071 106
9339 13495 0000 245 3517 3774
005 089 0000 004 035 049
000 206 0000 005 045 070
248 321 0000 009 088 125
530 5395 0000 179 2114 2902
3742 14806 0000 288 7618 10640
4932 6330 0000 427 4265 4855
DRINKING PLACES 3056 3291 0000 257 1038 1698
11 WHOLESALE amp OTHER RETAIL
12 FINANCEINSUR amp R E
13 LODGING
14 SKI AREAS
7251 9211 0000 544 5378 6200
2474 6638 0000 267 3669 5571
1284 1293 0000 051 511 701
000 000 0000 000 000 000
97
15 OTHER SERVICES 6454 43774 0000 1776 17672 23209
PRIVATE SEC-ICES TOTAL 264623 375064 0000 7939 91811 131863
GOVERNIIENT amp MISCELLANEOUS 000 0000 1553 000 000 TOTAL POP 26 0000
TOTAL 264623 375064 0000 9492 91811 131863
The linear programming and input-output results provide quantitative es-timates of differences between strategies which can be used to illustrate tradeoffs as well as to demonstrate compatible relationships between possible alternatives This type of information because it is presented in easilyunderstandable formats is valuable for public presentations of the various strategies illustrating what might be expected then a particular plan is im-plemented The public reaction to these strategies and tradeoffs is useful in developing a final plan which will be acceptable to the largest segment of the interested public
APPLICATION
These techniques have proven successful in aiding in development of manage-ment plans for the Beaverhead Willamette Custer Boise Nezperce Payette and Monongahela National Forests In addition to being usable as a package for Forest plans the techniques may be used individually for specific problems For example MAGE5 was used to help construct the area guides for US Forest Service Rocky Mountain Region (R-2) EA is being used for a portion of the analysis necessary for the wilderness RARE II study PUBLIC has been used in Alaska to develop local preference patterns and to compare these to prefer-ences stated by Forest Service and Congressional representatives in Washing-ton DC
The programs have been used with UNIVAC and CDC computer systems All these programs are coded in standard FORTRAN IV and as such should be readilyadaptable to other systems Most of the problems related to National Forest applications have been solved through training and personal contact with technical staff provided at the Forest Service Regional Office or at theSAU-LNP in Fort Collins Colorado
The use of these quantitative techniques in planning provides for a com-prehensive analysis of complex situations The techniques offer an effective and efficient means to develop land management plans They can handle inform-ation in large amounts of differing types and concerning diverse interrela-tionships between biological social and economic factors which would be im-possible to deal with by any other means The quantitative procedures usedhere otter a consistent systematic approach to land management planning
98
ACKNOWLEDGMENTS
In preparing this paper I received the able assistance of Lloyd J Lundeen Donald Renton and Tim Sale of the Systems Application Unit for Land Management Planning Forest Service US Department of Agriculture
REFERENCES
Case Pamela J Terry D Edgmon and Donald A Renton 1976 PUBLIC a procedure for public involvement Range Science Series 22 Colorado State University Fort Collins 138 p
Palmer Charles and Ross Layton 1973 Input-Output Analysis Research Document Economic Research Service East Lansing Michigan 61 p[ Unpublished]
US Department of Agriculture Forest Service 1973 Resource Allocation Analysis Users Manual [Unpublished ]
99
Nutzwertanalyse
A Henne
Abstract Nutzwertanalyse (NUWA) is a psychometric instrument for finding the test compromise in the multiple use planning of forestry when the multiple objectives cannot be expressed in the same physical or monetary unit It insures a systematic assessment of the consequences of proposed alternatives and thoroughly documents the decision process The method leads to a ranking of alternatives based upon weighting of the objectives and evaluation of the contribution of each alternative to these objectives The use of the method is illustrated with hypothetical data
INTRODUCTION
In management planning of multiple use forestry the situation for the planner is as follows
Many possible alternatives must be compared in the light of a great number of more or less consistent or conflicting objectives (aims goals) between which functional relations cannot be specified
In the process of comparing and assessing the consequences of the alter-natives it is unavoidable that the subjective preferences of the decision-maker and planner and of institutions play a vital role
Consequently psychometric methods have to be introduced to obtain solu-tions corresponding to objectives which cannot be expressed in physical or monetary units
To overcome these difficulties neither intuition nor mathematical models are of much help In NUTZWERTANALYSE (NUWA) an instrument is at hand with which finding the best compromise can be made easier and more rational The decision process will at the same time gain in clarity and it will be repro-ducible in all its steps
100
OUTLINE OF THE NUTZWERTANALYSE METHOD
The technique of NUWA consists of the following steps (see Abb 1)
Step 1 The objectives (aims goals) relevant to the situation are defined and arranged hierarchically according to means-objectives relations At the end of the chains of objectives will be found aims criteria (Zielkriterien)Kj sufficiently precise to serve as the basis of analysis and evaluation
Step 2 The weights gj (Gewichte der Zielkriterien) ie the importance each objective shall assume in the process of evaluation are given by the de-ciding authority according to its preferences
Step 3 The consequences of each project alternative (alternative action) Ai with respect to each aimcriterion Kj are described in a matrix (Zieler-tragsmatrix) The elements Eij of this matrix can be formulated in words or numbers
Step 4 By measuring the consequences of the alternatives each element Eijis transformed into an element Wij of the value-matrix (Zielwertmatrix)The scales (nominal ordinal or cardinal) by which the consequences are mea-sured depend on the form and the precision of their description
By these four steps the evaluation of an alternative has been divided upinto m part evaluations m being the number of criteria (objectives) to be taken into account
Step 5 For each alternative Ai the NUTZWERT Ni is found by combining theweighted values according to a set of decision rules which are consistent with the type of measurement scale used The result (Nutzwertmatrix) gives ranking of the alternatives analyzed
So NUWA may be briefly described as a method with which a number of pro-ject alternatives are analyzed and assessed with respect to a multidimen-sional system of objectives by ranking the alternatives according to thepreferences of the decisionmakers
The following considerations in using NUTZWERTANALYSE may help to clear upsome of the more difficult aspects
System of General Objectives
The first requirement for using NUWA is to formulate a complete system of well-defined and carefully arranged objectives In Abb 2 you will find a System of General Objectives in Forestry which I presented in Oslo at the XVIth IUFRO Congress These objectives are to maximize minimize conserve promote etc the criteria listed in Abb 2 This system is only a first tryand I hope a start for further joint efforts Meanwhile in our country aguide for forest regional planning has been published that contains this system in a slightly different form
101
102
103
Heights of Objectives
An example for step 2--the weighting of the objectives--is given in Abb 3 Using the presented system of objectives the weighting is simulated for the state forests of Hessia using the method of pairwise comparison You find the preliminary weights calculated in percentage numbers in column (3) of the table After a transformation by means of an interdependence factor the final general weights are given in column (6) of the table (These numbers correspond to the weights gj (Abb 1) A detailed description of the methodis given in another paper by the author (Henne 1976) Other methods are described in Zangenmeister
Evaluation Scheme
In forest management planning certain types of planning situations con-stantly recur eg planning the treatment of a stand to be harvested and regenerated (see the following simulation) In such a case an evaluation scheme (Abb 5) for use in all similar situations can be prepared in which step 3 and 4 of the NUWA logic are combined and systematized the possible consequences of alternatives are put in increasing order and a correspondingscale is put above the resulting matrix (in Abb 5 a cardinal scale is used)With respect to only four objectives can the consequences of the alter-natives can be measured in numerical units woos production in cubic meters gross receipts costs in marks and amount of labor in hours In all other cases only qualitative descriptions can be given--for the time being The vagueness of these descriptions and even some blanks show the field of re-search yet to be cultivated before intuition can be efficiently replaced byrational thinking in complex planning situations
Simulation of a NUWA
One of the most important tasks in medium and long-term multiple use management planning of unevenaged forests is to decide
When and how to cut a mature stand
How and with what species to regenerate the cleared area
In Abb 4 a planning situation of this kind involving five silvicultural alternatives (A1 - A5) is analyzed You will find the following inform-ation
In column 1 the objectives drawn from the System of General Objectives in Forestry presented in Abb 2
In column 2 the general weights of these objectives drawn from column 6 in Abb
In column 3 a transformation of the general weights to account for local conditions and in column 4 the corresponding normalized value of these adjusted weights
104
105
107
In columns 6 10 the value matrix for the five alternatives obtained by applying the given evaluation scheme
In columns 11 16 the Teilnutzwerte found by multiplying the values in columns 6 10 with the local normalized weights drawn from column 4
At the foot of columns 11 16 the Nutzwerte of the alternativesranging from 479 to 760 calculated by summing up the corresponding columnof Teilnutzwerte
The alternative with the highest numerical value A2 is assigned rank 1 This alternative will yield a mixed stand of deciduous trees and conifers pro-duced by natural regeneration of the existing beech stands using a shelter-wood method supplemented by planting larch and spruce
This solution is the best compromise under the local conditions the area being part of a nature park on the border of the Rhine-Main-Industrial Region
A look at columns 11 to 16 in the Teilnutzwerte (Abb 4) shows which ob-jectives contribute the most points to the Nutzwert of A2
On the one hand it is the high importance attributed to the objectives of site preservation stability and flexibility in which the principle of sus-tained yield--of all the benefits of forests--is reflected On the other hand it is the importance of recreation and landscape under the special circum-stances of the example
CONCLUSIONS
In conclusion I hope I have been able to show not only how much more transparent the decision processes can become by using NUWA but also how much weight the ecological hygienic and aesthetic objectives are given in the sil-viculture and forestry of our country
LITERATURE CITED
Henne A 1976 Ziele Zielgewichte und Nutzwertanalyse in der mittel-fristigen forstlichen Planung Allg Forszeitschr 32
Zangemeister C Nutzwertanalyse in der Systemtechnik Wittemannsche Buchhandlung Munchen Gesim
See for additional reference
Gundermann E 1972 Untersuchungen sur Erfassung Wertung and Ordnung der Erholungsfunktion von Waldbestanden im bayerischen HochgebirgeForschungsberichte der Forstl Versuchsanstalt Munchen
Henne A 1972 De Sozialfunktionen des Waldes in der mittelfristigen forslichen Planung Allg Forstzeitschr 24
Jacob H 1973 Zur Messung der Erlebnisqualitat von Erholungswald-bestanden Beiheft 9 zu Landschaft and Stadt Ulmer Verlag
108
A Methodology for Decisionmaking in Project Evaluation in Land
Management Planning
A Weintraub
Abstract In order to evaluate alternative planswildland management planners must consider many objectivessuch as timber production recreational use and communitystability The method presented utilizes the type of qualita-tive and intuitive information widely available to wildland management planners and structures this information into a format suitable for decisionmaking The method makes possible the determination of a measure of overall desirability for alternative plans and permits the evaluation of plans under alternative value systems Alternatives are compared througha small set of values assigned to each one Each number in the set represents a measure of desirability not directlycomparable to the others The planner assigns weights to each measure and obtains a unique number for each alternative The method is simple to use and flexible to permit modifications as planners gain expertise in its use
INTRODUCTION
The method proposed consists of a set of steps which provide a structured framework for choosing among alternatives when multiple objectives or cri-teria have to be considered and uncertainty exists At each step the method provides for the participation of decisionmakers specialists analysts and possibly the general public
The scheme requires the limited participation of decisionmakers and devi-ates little from generally used organizational patterns Several conceptswhich are essential for correct and efficient evaluation are emphasized
(a) Screening which allows the elimination of alternatives simply on the basis of rough cut general evaluations
(b) Evaluation of the accuracy and certainty of information used in the determination of the impacts of the alternatives
(c) Reduction to a manageable number of the impacts necessary for the evaluation of alternatives
109
(d) Visual presentation of results in tables and scoreboards which pre-sent information to the decisionmaker and to the public in a clearer way and with a simpler format of analysis
(e) Generation of potentially attractive new alternatives through modi-fication and combination of already defined alternatives
Concepts (c) and (d) are essential in presenting the decisionmakers with a clear summary of the impacts with respect to the declared goals Note that with this scheme there is no need for the decisionmaker to specify his utilityfunction or explicit preferences Although these weights simplify the selec-tion of the preferred alternatives they introduce serious methodological com-plications rooted in the complexity of utility functions
The scheme is applicable to a broad range of planning problems It is presently being used in the decision process for a recreation area project(skiing and summer activities) in the Tahoe National Forest in California The main goal of this project is to provide recreation facilities to satisfyincreasing demand in a location with very attractive possibilities The site will be developed by private capital but a large percentage of the land needed belongs to the Forest Service US Department of Agriculture As a public agency the Forest Service must consider when evaluating alternativesthe preservation of environmental quality as well as the socioeconomic im-pacts a recreation complex will have on neighboring communities
The steps of the scheme will be illustrated with examples most of which are drawn from this recreation project
THE SCHEME
The basic steps are the following
1 Define the boundaries of the problem the area of study the types of alternatives to be considered (eg Area--Tahoe region Types of alterna-tives--develop recreation facilities for winter use or for winter and summer use)
2 Identify decision-influencing elements criteria or goals Goals can be defined at different levels of aggregation (1) a general goal such as to preserve environmental quality which can be refined into (a) preserve air and water quality (b) maintain wilderness etc or (2) a primary goal such as to enhance social well-being of the population and secondary goals such as (a)promote acceptable patterns of employment (b) avoid overcrowding of services etc
3 Identify major forms of activities and areas in which they can be carried out (eg logging and range in unit A)
4 Define basic alternatives to be considered (eg alternatives emphasizingrecreation logging preservation of wilderness etc)
5 Define the major types of impacts of each alternative in relation to the goals established Include secondary effects only if they are important
110
6 Screen the alternatives Determine a set of criteria which would make an alternative unacceptable Based on these criteria find which alternativescan be eliminated without additional collection of data or finer analysis (eg general analysis may be sufficient to determine that a practice of in-tensive timber cutting in a given area results in unacceptable environmental and recreation impacts Then any alternative with that practice would be screened out) Screened-out alternatives will be reconsidered later in the light of the additional insights gained from the analysis
7 For those alternatives passing the screening process determine their im-pacts in a disaggregated and quantified form in relation to the declared goals Several models can be used for estimating partial impacts (ie econometric models to predict ski demand input-output models for estimating income and employment effects etc)
Impact information can appear in different forms
(A) Hard information data which is quantified relatively accurate and certain
(B) Nonquantifiable information impacts which may be estimated from accurate and certain input-output data but which are expressed as qualitative ratings and therefore depend on subjective evaluation (eg the acreage and condition of wilderness and scenic areas maybe known but the impact of management alternatives can only be assessed intuitively)
(C) Soft information insufficient information exists about conditions or about the consequences of management (eg impacts on timbered areas where no appropriate survey has been made)
(D) Uncertain information impacts that cannot be predicted with pre-cision The sources of uncertainty may be
(a) Uncertainty about the future of the world (eg what is goingto be the rate of increase on overall demand for recreation in the future)
(b) Technical uncertainty in projections that is the impossibilityof predicting exact impacts even if the setting in which theyoccur is known with certainty
(c) Uncertainty about the implementation of each phase of the project exactly as it is defined in the study
8 Reduce the number of impacts to be considered in this evaluation for each alternative by discarding and aggregating impacts according to the goals established
This step is needed to reduce the normally large number of impacts genera-ted in Step 7 to a much smaller number of representative impacts which will make the evaluation process in relation to the declared goals more manageable
111
The reduction of impacts to evaluate is accomplished by eliminating from con-sideration the impacts which are not likely to affect the decision (ie ex-clude impacts of negligible importance or those that do not vary much amongthe alternatives) and aggregating sets of impacts into one representative of the set which may be quantified through an index (ie aggregate into one those impacts which may be considered as one goal or subgoal such as differ-ent measures of water quality or which are highly correlated under all alter-natives such as wilderness and wildlife impacts)
The elimination and aggregation process may be modified as new alternativesare generated Control over this process can be maintained by reverting toStep 7 at any stage
9 Check the legal institutional environmental political and economic acceptability of each alternative
The detailed and aggregated information of Steps 7 and 8 allows for this analysis which can be carried out according to the specifics of the situa-tion For example a disaggregated impact of Step 7 such as air pollution measures allows a check for compliance with legal requirements while the aggregated use of impacts of employment in housing and community servicesregional economy etc facilitate a political evaluation of the alternatives
10 Generate new potentially attractive basic alternatives which are signi-ficantly different from those already proposed and return to Step 6 This step can be carried out through major mitigating actions (modifications of al-ternatives) or by combination of good elements of alternatives alreadyspecified
The steps for generating new alternatives are these
(A) For each basic alternative describe the main actions and their location
(B) For each action evaluate the main positive and negative impacts on the defined goals Also analyze composite effects of the global project
(C) For each impact determine which changes in primary conditions would reduce negative effects or increase positive effects
(D) For changes in primary conditions which would improve impactsdetermine which actions would bring about those changes and what are the trade-offs implied (ie which other impacts are also affected through those actions)
(E) (a) For major mitigating actions determine which actions have acceptable trade-off to improve impacts Generate new alterna-tives introducing these actions
112
(b) For combination of alternatives determine for two or more alternatives studied which actions lead from one to another in some aspects This procedure is used to determine combinations of elements of each alternative to generate a new one
Alternatives generated must be technically and economicallyfeasible
A partial example of the procedure is the following
(A) Basic alternative one action is to build a large ski facility in a designated area
(B) One negative effect overflow of visitors from the area in winter creates serious social problems in neighboring communities
(C) This negative impact can be mitigated by reducing the number of people going into the neighboring towns
(D) Actions which would bring about this reduction are to reduce the size of the planned ski facility or to increase substantially the lodgingand eating facilities in the recreation complex (to keep visitors in the area)
(E) Consider a major mitigating action with a substantial increase in lodging and eating facilities The trade-off of this action whichin this case consists of additional negative impacts is increased water usage waste disposal problems reduced attractiveness of the resort reduced profitability of the project If the trade-off seems acceptable a new basic alternative can be generated incorporatingthe new lodging and eating facilities
11 Determine if new areas of concern or types of impacts need to be defined If yes go back to Step 6 and check alternatives This step acts as a control as new knowledge is gained in the process
12 Present the summarized results in adequate visual format Impacts will be presented in tables by indexes (expected values and ranges will be used)Colors may be used to highlight differences among alternatives See tables 1 and 2 as examples
These tables show visual presentation possibilities for the described re-creation project for three proposed alternatives--A F and G
A Accept a project proposed by the Walt Disney Corporation to build a large winter and summer recreation complex in a designated area
F Leave the designated area untouched promote the expansion of exist-ing recreation sites
G Call for bids for a smaller recreation complex in the designated area
113
Table 1 Reduced Impact List
Table 1 is a list of main impacts Impacts are rated from 0 to 10 for positive impacts 0 to -10 for negative impacts (+10 -10 correspond to the most positive and the most negative respectively) In each case the circled number corresponds to the expected value of the impact the other two represent the range due to uncertainty (Note creating a recreation complex in the de-signated area will take away pressure from the Tahoe basin) Colors (notshown in table) are used to highlight differences eg most positive values are circled in blue next values in green etc
Table 2--Impact list with information about causes of uncertainty
The main causes of uncertainty are
1 Growth of Reno (Reno is a fast-growing city with high tourism which shares with the designated area the freeway linking to the main population center in the region the San Francisco Bay Area)
2 Secondary impacts on neighboring counties
3 growth of overall recreation (ski) demand
not sufficient information (soft information)
∆ technical incertainty
115
Table 2 is a more detailed list of impacts in a different format The number between vertical lines represents the expected impact The number of vertical lines indicate the level of uncertainty in each direction and the circled numbers refer to notes on the causes of this uncertainty
13 Evaluate alternatives presented in Step 12 Determine the most attractive alternatives (or the better alternatives) To make this determination sensi-tivity analysis should be carried out on uncertain soft or nonquantified data Sensitivity analysis should include two aspects
(a) The analysis of the stability--or robustness--of solutions For exam-ple an alternative may look very attractive when expected values are considered However once uncertainty is included it may look much less desirable due to a high probability of the least desirable outcome
(b) The indication on where more and better information is needed for sound decisionmaking For example an estimate with 15 error in the projection of timber demand may be sufficient in some cases In others a finer estimate may be crucial in the decision as to a pro-jects financial soundness
The overall impact of each alternative should also be considered that isbesides a comparison of each attribute it is important to view the global ef-fect of the alternatives and to include the intangible impacts in this assessment
If none of the alternatives selected appears completely satisfactory studywhat new aspects should be considered to generate new alternatives (ie newdecision-influencing elements criteria to improve overall impact or evenness of alternatives criteria to reduce uncertainty etc) Then go back to Step5 Otherwise continue to Step 14
14 Generate new potentially attractive alternatives marginally different from the ones selected in 13 This is done through proposing minor mitigatingactions or combination of characteristics of the (similar) alternative select-ed The mechanics of this step are similar to Step 10 where now detailed characteristics are considered A minor mitigating action might be a small modification in the time stream of timber logged to provide a more even supplyto nearby mills Alternatives generated at this stage should be technicallyfeasible and economically efficient Go back to Step 7 If no new alterna-tive is generated go to Step 15
15 Select preferred alternative
CONCLUSION
The scheme presented here has been well received by the professionals in charge of the Tahoe National Forest recreation project and is currently beingused in the decision process
The scheme allows for flexibility and some variations may be recommended in different applications It can be used effectively in a variety of plan-
116
ping situations For example for the Tahoe project it was determined that the screening process--Step 6--should be introduced after Step 9 to permit a thorough evaluation of the major impacts for every alternative This was done in order to avoid the adoption of intransigent opposition by interest groupswhose preferred alternative might be screened out
The method presented is designed to be used for land management planningeg alternatives which emphasize the multiple use and value of land timber range recreation wilderness ecology etc This form of decisionmaking is somewhat different from the evaluation and selection of single projects as in the case of the recreation project since it involves the determination of a combination of different forms of activities on areas with diverse character-istics which will make up a land management plan for a forest or land unit This multiplicity of activities allows for a richer variety of possibilities in combining elements forming a plan and must be considered particularly in Steps 3 8 10 and 14
117