Precision LiDAR Mapping of Transportation Corridors Using LiDAR
28/08/2006
1
1
LiDAR in operational LiDAR in operational forest management forest management
-- efforts to improve and extend productsefforts to improve and extend products
UMB, 22.08 2006UMB, 22.08 2006
Dr. Tord AaslandDr. Tord Aasland
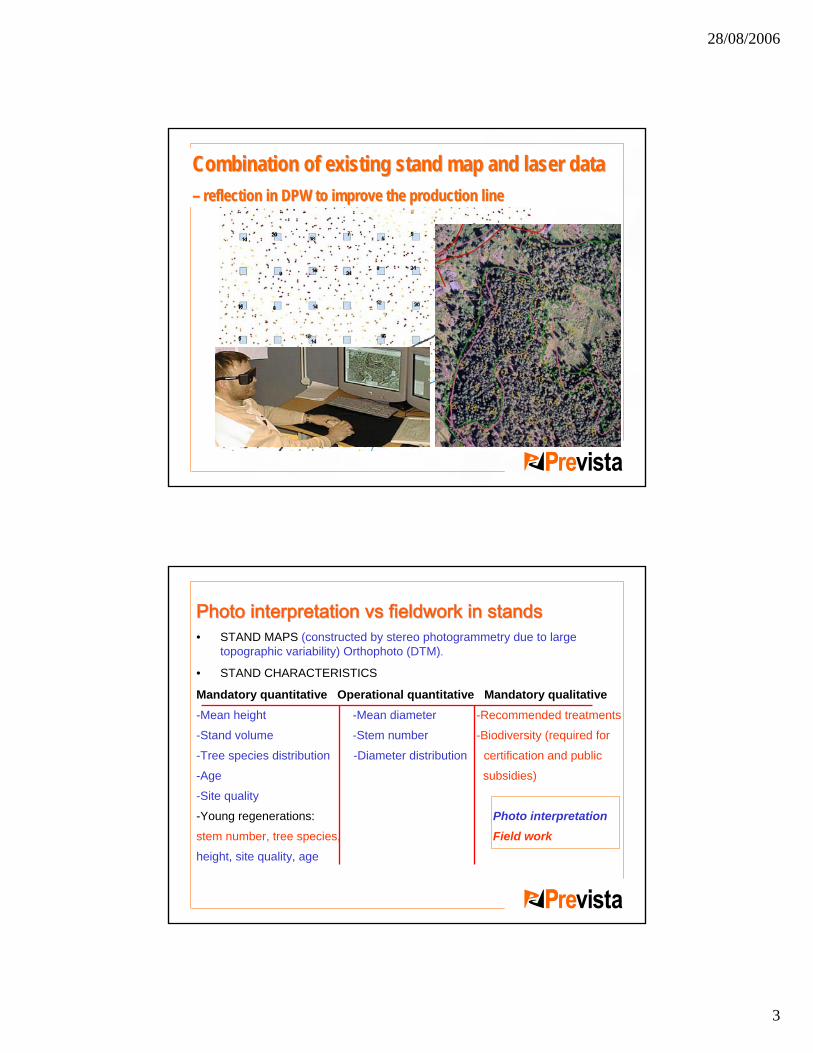
Outline of the presentation:Outline of the presentation:• Products• Technical solutions• Tools• Results• New LiDAR activities
– Compartment borders– Tree species– Quality parameters– Updating of existing FMP
2

28/08/2006
2
PrevistaPrevistaThe largest forest management planning enterprise in Scandinavia with a century-long experience in forest planning and remote sensing
Introduced LiDAR based forest inventory as an operational method in 2002
One of the only worldwide providers
Methods and procedures based on collaboration with UMB (University of Life Sciences)
In total 15 projects in Scandinavia
LIDAR parameters:• First and last pulse reflection
• 33.000-100.000 pulses per sec
• 1.100-2.000 m altitude
• 20-30 cm footprint size
• 0.9-1.5 m spacing
• 500-1000 m swath
28/08/2006
3
Combination Combination of of existingexisting stand stand mapmap and laser data and laser data –– reflection in DPW to improve the production linereflection in DPW to improve the production line
PhotoPhoto interpretationinterpretation vsvs fieldworkfieldwork in standsin stands• STAND MAPS (constructed by stereo photogrammetry due to large
topographic variability) Orthophoto (DTM).
• STAND CHARACTERISTICS
Mandatory quantitative Operational quantitative Mandatory qualitative-Mean height -Mean diameter -Recommended treatments
-Stand volume -Stem number -Biodiversity (required for
-Tree species distribution -Diameter distribution certification and public
-Age subsidies)
-Site quality
-Young regenerations: Photo interpretationstem number, tree species, Field workheight, site quality, age
28/08/2006
4
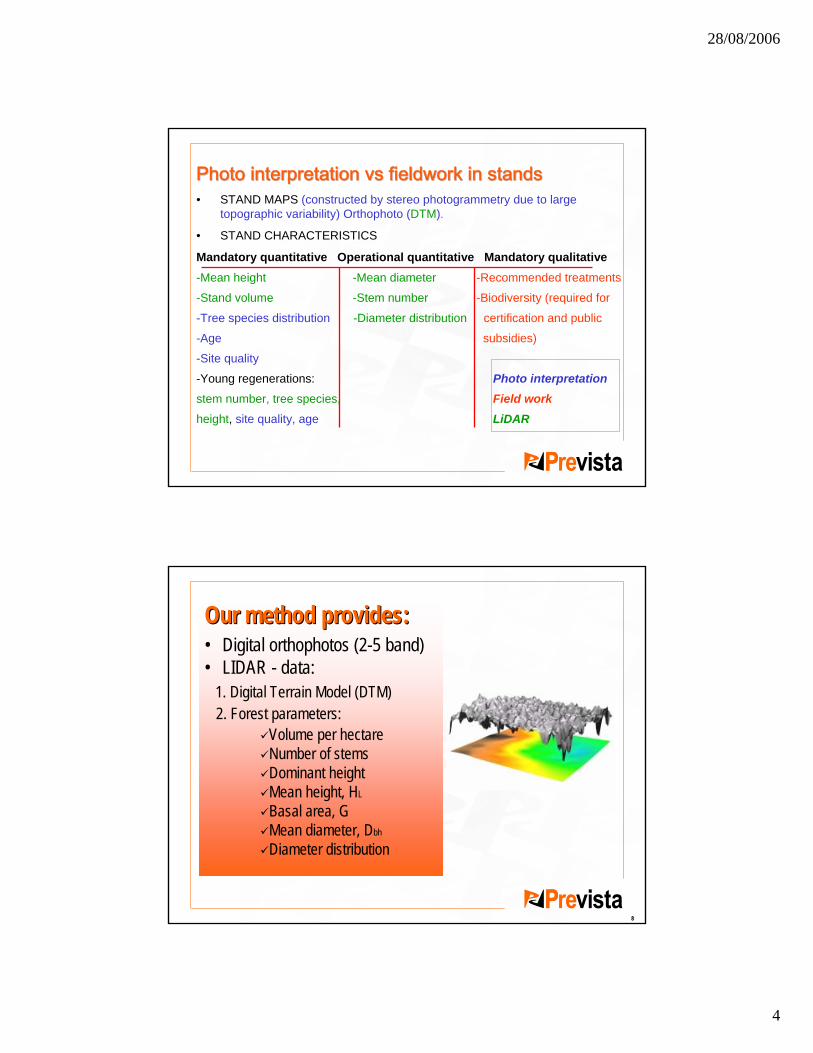
PhotoPhoto interpretationinterpretation vsvs fieldworkfieldwork in standsin stands• STAND MAPS (constructed by stereo photogrammetry due to large
topographic variability) Orthophoto (DTM).
• STAND CHARACTERISTICS
Mandatory quantitative Operational quantitative Mandatory qualitative-Mean height -Mean diameter -Recommended treatments
-Stand volume -Stem number -Biodiversity (required for
-Tree species distribution -Diameter distribution certification and public
-Age subsidies)
-Site quality
-Young regenerations: Photo interpretationstem number, tree species, Field workheight, site quality, age LiDAR
Our method provides:Our method provides:• Digital orthophotos (2-5 band)
8
• LIDAR - data:1. Digital Terrain Model (DTM)2. Forest parameters:
Volume per hectareNumber of stemsDominant heightMean height, HL
Basal area, GMean diameter, Dbh
Diameter distribution
28/08/2006
5
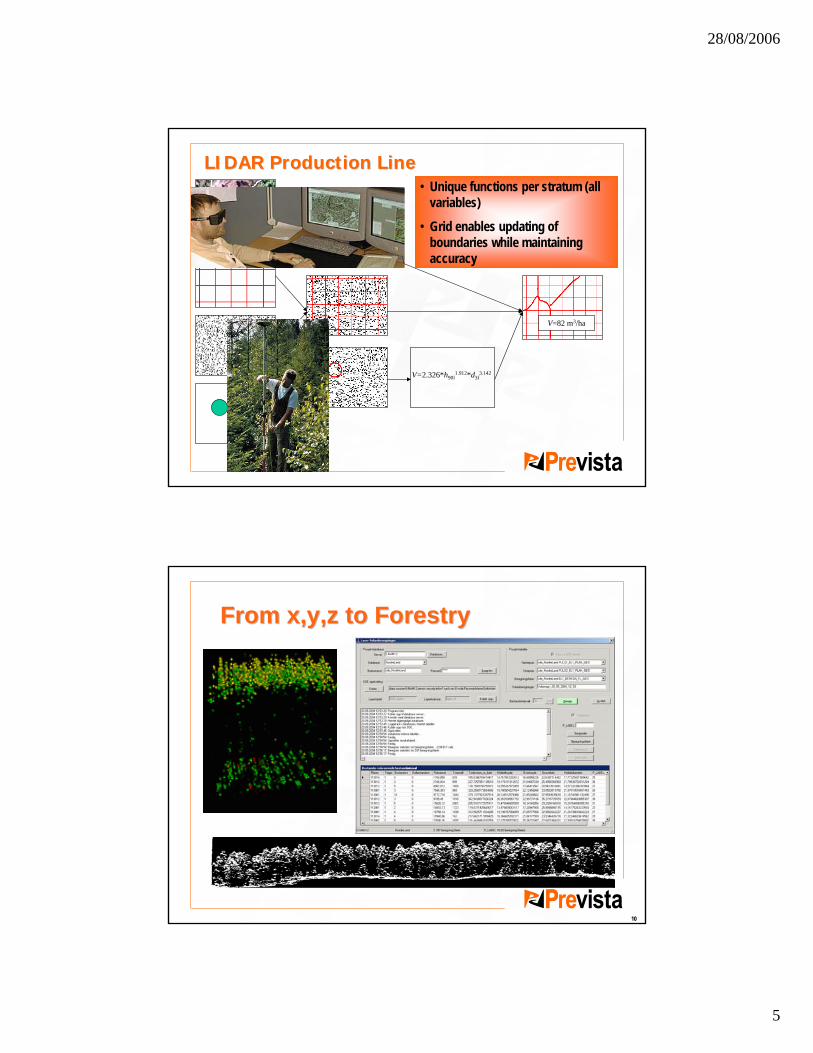
V=2.326*h90l1.912*d3f
3.142
V=82 m3/ha
LIDAR Production LineLIDAR Production Line• Unique functions per stratum (all
variables)
• Grid enables updating ofboundaries while maintainingaccuracy
From x,y,z to From x,y,z to ForestryForestry
10
28/08/2006
6
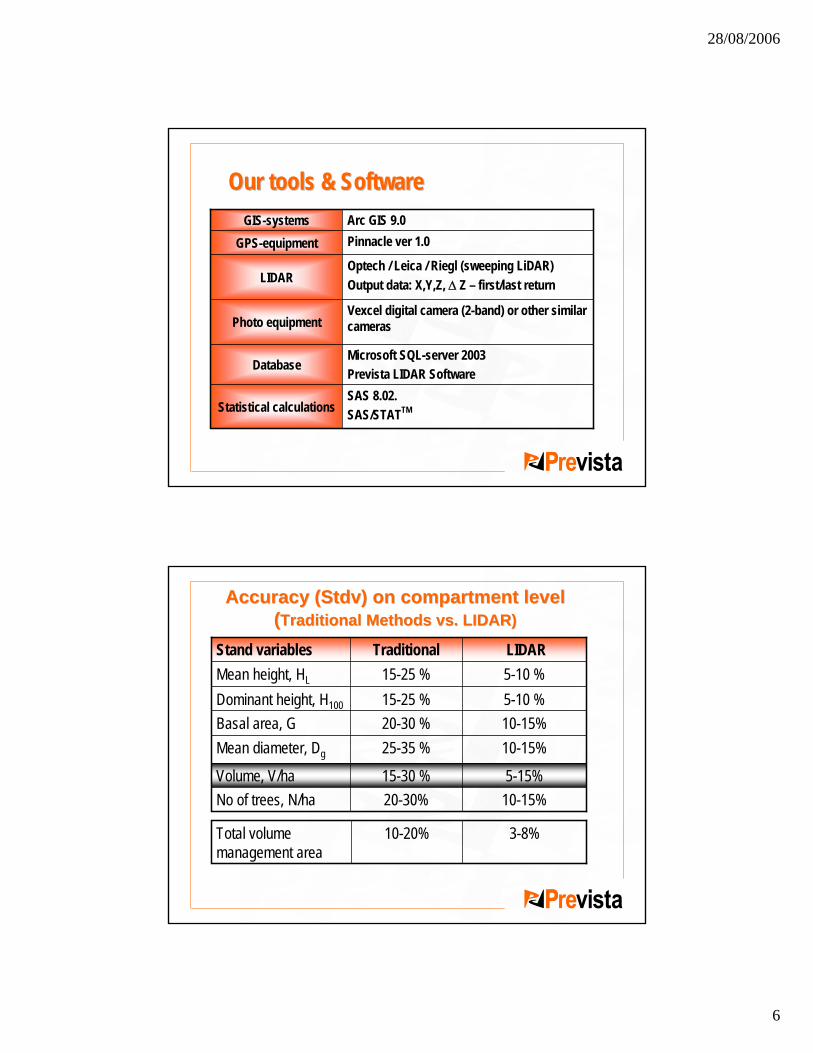
Vexcel digital camera (2-band) or other similar camerasPhoto equipment
Pinnacle ver 1.0GPS-equipmentOptech / Leica / Riegl (sweeping LiDAR)Output data: X,Y,Z, Δ Z – first/last returnLIDAR
SAS 8.02.SAS/STATTMStatistical calculations
Microsoft SQL-server 2003Prevista LIDAR SoftwareDatabase
Arc GIS 9.0GIS-systems
Our toolsOur tools & Software& Software
10-15%20-30%No of trees, N/ha
10-15%25-35 %Mean diameter, Dg
5-15%15-30 %Volume, V/ha
10-15%20-30 %Basal area, G5-10 %15-25 %Dominant height, H100
5-10 %15-25 %Mean height, HL
LIDARTraditionalStand variables
AccuracyAccuracy ((StdvStdv) ) on compartment level on compartment level ((TraditionalTraditional MethodsMethods vs. LIDAR)vs. LIDAR)
3-8%10-20%Total volume management area

28/08/2006
7
NorwaySweden
NorwaySweden
Norway
Norway
Norway
Project
60.00020.00
200642
90.0006.000
200521
15.00020043
40.00020032
50.0002002 1
Area, haYearNo.
LiDAR LiDAR projectsprojects -- referencesreferences
13
• Delivery of data into grid cells instead of compartments?
• Delineation of compartments/units based on LiDAR data?
• Is it possible to find tree species composition based on LiDAR data and images?
• Use of LiDAR for updating of existing FMP?
Future developmentFuture development (1)(1)

28/08/2006
8
Mean volumeMean volume (V/ha)(V/ha) in grid cells based on LiDAR data
Mean diamterMean diamter (D(Dgg) in grid cells based on LiDAR data

28/08/2006
9
LIDAR data for LIDAR data for automaticautomatic delineation into compartmentsdelineation into compartments (1)(1)
HeightHeight--percentilespercentiles from first return and DensityDensity ofLiDAR pulses in canopy gives suggestion todeliniation using eCognitionimage analyses
Density h variables
d9=(n>((max-2)/10*9))/N
d5=(n>((max-2)/10*5))/N
d0=(n>2)/N
f
LIDAR data for LIDAR data for automaticautomatic delineation into compartmentsdelineation into compartments (2)(2)
Stand Stand heightsheightsin 2 min 2 m classesclasses

28/08/2006
10
LIDAR data and digitalLIDAR data and digital photophoto toto find tree speciesfind tree species? ?
IRIR OrthophotoOrthophoto and LiDAR and LiDAR HeightHeight--percentilespercentiles
FieldField sample plots sample plots ++ orthophotoorthophoto+ LiDAR+ LiDAR densitydensity datadata+ image analyses+ image analyses
== Tree speciesTree species in % forin % for different density classesdifferent density classes
28/08/2006
11
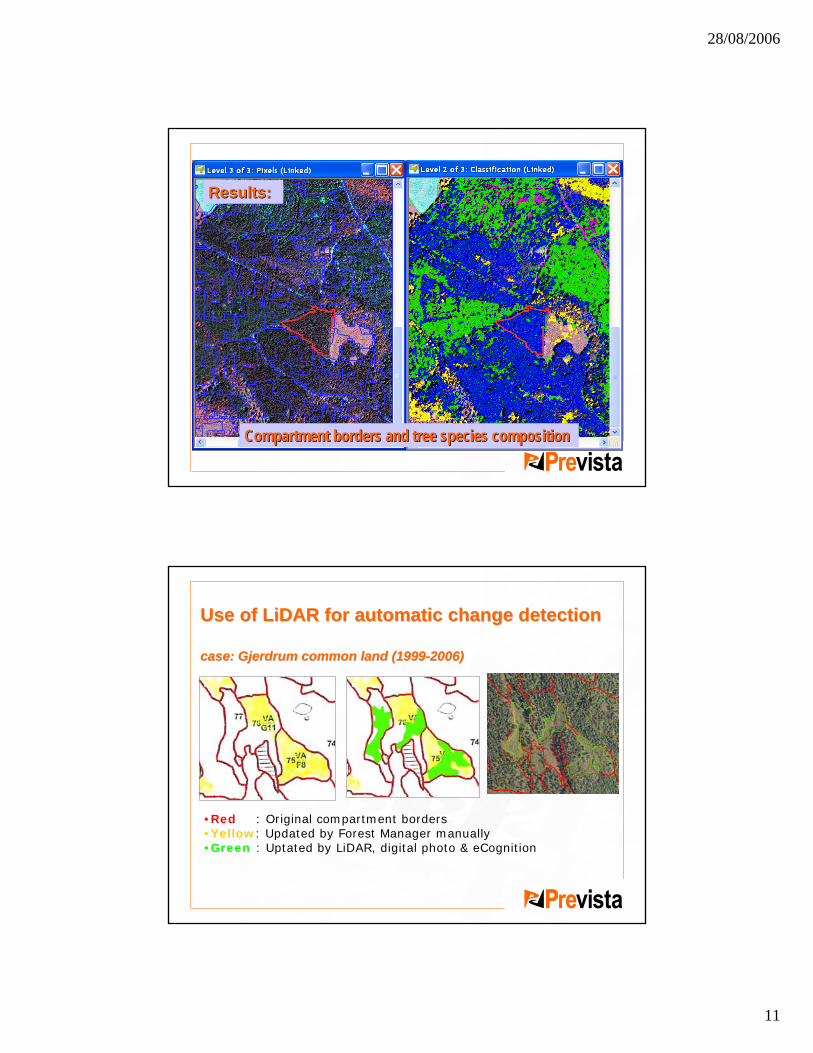
ResultsResults::
CompartmentCompartment borders andborders and tree species compositiontree species composition
Use of Use of LiDAR for LiDAR for automatic change detectionautomatic change detection
case: Gjerdrum case: Gjerdrum common common land (1999land (1999--2006)2006)
•Red : Original compartment borders •Yellow: Updated by Forest Manager manually•Green : Uptated by LiDAR, digital photo & eCognition

28/08/2006
12
FutureFuture development development (2)(2)
• Quality parameters– Diameter distribution– Tree crown height and size (3-D)
• C/B-analyses of optimal flight altitude – eg. point density on the ground
• Use of LiDAR for other purposes than estimation of volume
ExampleExample ofof standstand--wisewise diameter diameter distributiondistribution
0
50
100
150
200
1 3 5 7 9 11 13 15 17 19
0
50
100
150
200
1 3 5 7 9 11 13 15 17 19
0
50
100
150
200
1 3 5 7 9 11 13 15 17 19
Source: Tron Eid, UMB
Photo intepretation
Relascope sample plots
LIDAR
5 7 9 11 13 15 17 19 21 23 25 27 29 31 33 35 37 39 41 43
5 7 9 11 13 15 17 19 21 23 25 27 29 31 33 35 37 39 41 43
5 7 9 11 13 15 17 19 21 23 25 27 29 31 33 35 37 39 41 43
28/08/2006
13
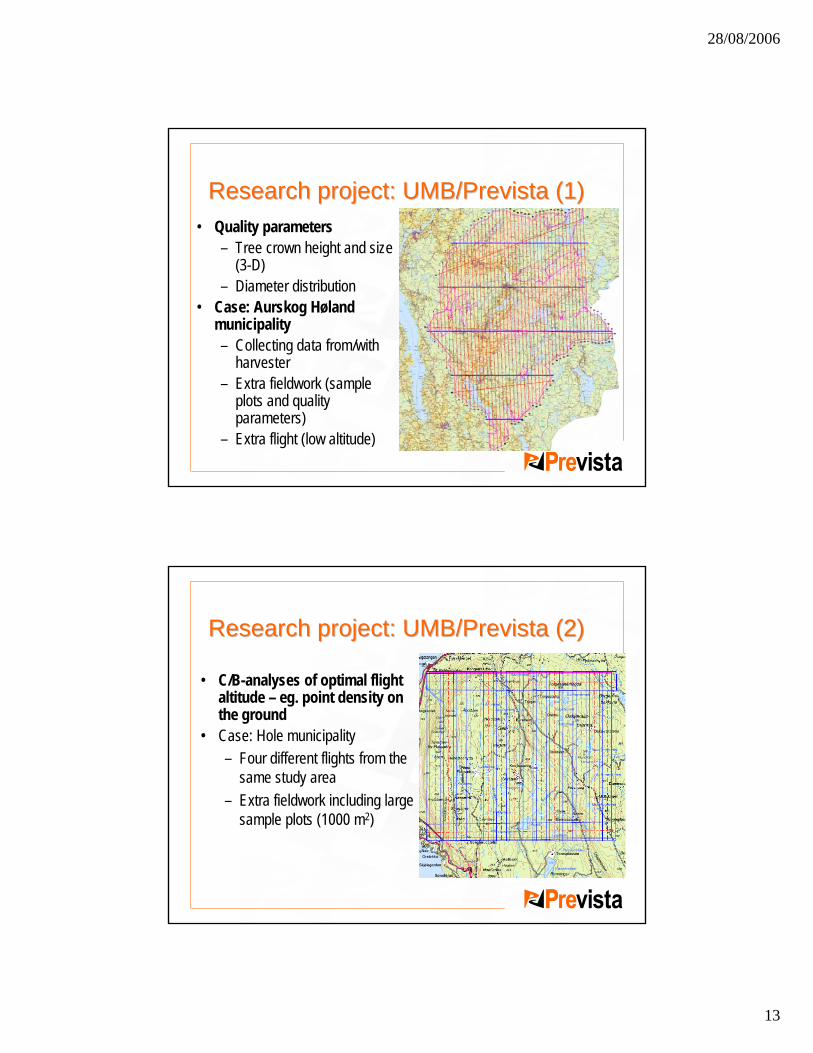
Research projectResearch project: UMB/Prevista (1): UMB/Prevista (1)• Quality parameters
– Tree crown height and size (3-D)
– Diameter distribution• Case: Aurskog Høland
municipality– Collecting data from/with
harvester– Extra fieldwork (sample
plots and qualityparameters)
– Extra flight (low altitude)
Research projectResearch project: UMB/Prevista (2): UMB/Prevista (2)
• C/B-analyses of optimal flight altitude – eg. point density on the ground
• Case: Hole municipality– Four different flights from the
same study area– Extra fieldwork including large
sample plots (1000 m2)