Open Research Online Atta-Ankomah.pdf · Richards Ogunda, Bridget Nyabuto and Gaverse Kitoto) I...
328
Open Research Online The Open University’s repository of research publications and other research outputs China’s Presence in Developing Countries’ Technology Basket: The Case of Furniture Manufacturing in Kenya Thesis How to cite: Atta-Ankomah, Richmond (2014). China’s Presence in Developing Countries’ Technology Basket: The Case of Furniture Manufacturing in Kenya. PhD thesis The Open University, UK. For guidance on citations see FAQs . c 2014 The Author Version: Version of Record Copyright and Moral Rights for the articles on this site are retained by the individual authors and/or other copyright owners. For more information on Open Research Online’s data policy on reuse of materials please consult the policies page. oro.open.ac.uk
Transcript of Open Research Online Atta-Ankomah.pdf · Richards Ogunda, Bridget Nyabuto and Gaverse Kitoto) I...
Open Research OnlineThe Open University’s repository of research publicationsand other research outputs
China’s Presence in Developing Countries’ TechnologyBasket: The Case of Furniture Manufacturing in Kenya
ThesisHow to cite:
Atta-Ankomah, Richmond (2014). China’s Presence in Developing Countries’ Technology Basket: The Case ofFurniture Manufacturing in Kenya. PhD thesis The Open University, UK.
For guidance on citations see FAQs.
c© 2014 The Author
Version: Version of Record
Copyright and Moral Rights for the articles on this site are retained by the individual authors and/or other copyrightowners. For more information on Open Research Online’s data policy on reuse of materials please consult the policiespage.
oro.open.ac.uk

China’s Presence in Developing Countries’
Technology Basket: The Case of Furniture
Manufacturing in Kenya
Thesis submitted for the degree of Doctor of Philosophy
(Development Economics)
Development Policy and Practice
Department of Engineering and Innovation
Faculty of Mathematics, Computing and Technology
The Open University
Richmond Atta-Ankomah
(MPhil, BA Economics, Ghana)
August 2014


i
DEDICATION
To my mother, Charlotte

ii
ACKNOWLEDGMENT
First and foremost, I thank God for strength and the gift of life.
Next, I acknowledge the contribution of Professor Raphael Kaplinsky to my academic life in
last three years. He did not only accept to supervise my thesis but also encouraged me to
apply for the PhD programme. He took keen interest in my research, providing all the
directions and advice a student would require. I also thank Professor George Owusu of
University of Ghana, who introduced me to Professor Kaplinsky, and Professor Mike Morris
who also encouraged me to apply to the Open University, UK.
I am also very grateful to Dr. Rebecca Hanlin, my second supervisor, whose role in my work
and life as a student deserves a lot of acknowledgment. Her detailed and constructive
criticisms helped to a great extent and I will never forget the short holiday I spent with her
and her family (Chris and Georgina) in Mombasa during my data collection exercise.
My sincere gratitude also goes to all members of staff and research fellows/lecturers at the
Development Policy and Practice Unit of the Open University, particularly Dr. Dinar Kali, Dr.
Julius Mugwagwa, Dr. Ben Lampert, Prof. Hezel Johnson and Dr. Sue Oreszczyn. Although
they are senior fellows, they created a collegial working environment, which positively
affected my work as a student. My special thanks go to Sue for serving as my third party
monitor. I also thank the DPP/MCT secretaries especially Marlene Gordon, Jenny Wright,
Donna Deacon and Olivia Acquah, who offered administrative support as well as
encouraging words and an amiable environment to work in. My gratitude also goes to the
staff of the Research School Office of the Open University, particularly Paula Piggott.
My thanks also go to the Institute for Development Studies of the University of Nairobi, where
I served as a research associate for one year during my data collection exercise in Kenya. I
am grateful to the staff, particularly Prof. Dorothy McCormick, William Abungu and Symon
Njenga for the help and advice they provided during my data collection excercise. For similar

iii
reasons, I am also grateful to Dr. Lilac Odhiambo of the School of Arts and Design,
University of Nairobi. I also acknowledge the research assistants (Benjamin Sewe, Jerry
Richards Ogunda, Bridget Nyabuto and Gaverse Kitoto) I worked with during the data
collection exercise in Kenya. My warm gratitude also goes to all individuals, companies and
public institutions in Kenya, who participated in my study as respondents.
Last but not the least, I owe a great debt of gratitude to Andrew Agyei-Holmes, David
Botchie, Dr. Geoff Banda and Dr. Patrick Assuming for being supportive friends that one
needs during a PhD. I also thank my brothers (Eric, Prince and Kakra) for taking care of
home affairs while I was away from Ghana.
May God bless us all!

iv
“The world is very different now. For man holds in his mortal hands the power to abolish all forms of human poverty and all forms of human life”.
(Inaugural Address of John F. Kennedy, White House, Washington, USA, Friday, January 20, 1961)
v
ABSTRACT
China has emerged as the leading source of capital goods for Kenya and Sub Saharan
Africa as a whole, which before the noughties depended largely on advanced countries for
capital goods. Thus, there is a disruption of the pattern of technology transfer to Sub
Saharan Africa including Kenya. A significant aspect of this disruption is that the capital
goods are being produced within a developing country context (China) and for other
developing countries. This issue motivated this research, which contributes to the literature
by exploring the potential impact of Chinese technologies (capital goods) on the development
of other developing countries vis-à-vis the impact of technologies from advanced countries
and the domestic economy. The study used both qualitative and quantitative research
approaches and data from Kenya’s furniture manufacturing firms, including both formal and
informal sector firms.
It was found that the technologies from China (and also Kenya) are more amenable for
inclusive industrial development especially with respect to employment creation and poverty
reduction. These technologies are more labour intensive, compared to the advanced country
technologies. They allow poor entrepreneurs to start their own businesses with a relatively
high degree of automation, which they would not be able to afford if the only available
technology were the technology from advanced countries. They are also pro-poor in terms of
producing goods to meet the consumption needs of the poor. It was also found that the
diffusion of the Chinese technology is higher among informal sector firms than among formal
sector firms. However, the Chinese technology is less common than the Kenyan technology
in the informal sector while the formal sector firms mainly rely on the advanced country
technology. All the three technologies are transferred/ diffused mainly through arm’s length
trade.
The fact that the Chinese and Kenyan technologies yield a more inclusive development
outcome than those from advanced countries indicates that industrial policies for developing
countries should take into consideration the critical issue of technology choice.

vi
TABLE OF CONTENT
DEDICATION ..........................................................................................................................i
ACKNOWLEDGMENT ........................................................................................................... ii
ABSTRACT ............................................................................................................................v
TABLE OF CONTENT ........................................................................................................... vi
LIST OF TABLES .................................................................................................................. xi
LIST OF FIGURES .............................................................................................................. xiii
LIST OF ACRONYMS .......................................................................................................... xv
CHAPTER 1 : RESEARCH MOTIVATION ............................................................................. 1
1.0 Introduction .................................................................................................................. 1
1.1 Knowledge gap and research questions....................................................................... 5
1.2 Structure of the thesis ................................................................................................ 10
CHAPTER 2 : KENYA’S DEVELOPMENT TRAJECTORY AND ISSUES ............................ 12
2.0 Introduction ................................................................................................................ 12
2.1 Politics and ethnicity................................................................................................... 12
2.2 Economic development .............................................................................................. 15
2.2.1 Economic growth performance ............................................................................ 15
2.2.2 Major Sectors and structural changes .................................................................. 21
2.2.3 The manufacturing sector .................................................................................... 22
2.2.4 The informal economy and employment .............................................................. 29
2.2.5 International trade pattern and relations .............................................................. 30
2.3 Social and infrastructural development ...................................................................... 34
2.3.1 Demography ........................................................................................................ 34
2.3.2 Poverty, inequality and unemployment ................................................................ 35
2.3.3 Education and human resource ........................................................................... 36
2.3.4 Infrastructure ....................................................................................................... 37
2.4 Technology in industrial/development policies ........................................................... 39
vii
2.5 Conclusion ................................................................................................................. 43
CHAPTER 3 : LITERATURE REVIEW .................................................................................44
3.0 Introduction ................................................................................................................ 44
3.1 What is technology? ................................................................................................... 45
3.2 Technology choice ..................................................................................................... 48
3.2.1 The neoclassical approach .................................................................................. 49
3.2.2 Stewart’s Approach ............................................................................................. 54
3.2.3 Appropriate Technology ...................................................................................... 56
3.2.4 Inclusive Innovation ............................................................................................. 64
3.3 Sources of technical change ...................................................................................... 65
3.3.1 Induced technical change and biases in technical change ................................... 65
3.3.2 Path dependence ................................................................................................ 70
3.4 Determinants of technology choice/ adoption ............................................................. 71
3.4.1 Firms’ characteristics and target market .............................................................. 72
3.4.2 Government policy/regulation and macroeconomic conditions ............................ 75
3.5 Technology transfer/diffusion ..................................................................................... 77
3.5.1 Technology transfer types and the mechanisms of transfer ................................. 77
3.5.2 Choosing a mode of technology transfer ............................................................. 83
3.6 Conclusion ................................................................................................................. 84
CHAPTER 4 : METHODOLOGY ..........................................................................................86
4.0 Introduction ................................................................................................................ 86
4.1 Operational definition of technology ........................................................................... 86
4.2 Conceptual framework ............................................................................................... 87
4.3 Research Approach (The mixed methods research) .................................................. 91
4.3.1 Mixed methods approach for answering the research questions ......................... 94
4.4 Why Kenya, the selected geographic areas in Kenya and furniture manufacturing? .. 96
4.5 Data collection approach and sampling methods ....................................................... 99
4.5.1 First round of interview with the manufacturing firms ........................................... 99
4.5.2 Second round of interviews with the manufacturing firms ...................................103
4.5.3 Sales and distribution firms of the technologies ..................................................105
viii
4.5.4 Other key informants ......................................................................................... 106
4.6 Other field challenges .............................................................................................. 107
4.6.1 Language issues ............................................................................................... 107
4.6.2 Earning the trust of prospective respondents ..................................................... 108
4.6.3 Getting interview appointments .......................................................................... 109
4.6.4 Elections and electioneering campaigns ............................................................ 109
4.7 Tools for data analysis ............................................................................................. 110
4.8 Conclusion ............................................................................................................... 111
CHAPTER 5 : BUSINESS AND ENTREPRENEURIAL PROFILE ..................................... 112
5.0 Introduction .............................................................................................................. 112
5.1 Cluster-level dynamics or features ........................................................................... 113
5.1.1 Business registration and tax obligation ............................................................. 114
5.1.2 Nature of housing and infrastructure .................................................................. 115
5.1.3 Trust and social relations ................................................................................... 124
5.2 Firm-level characteristics ......................................................................................... 126
5.2.1 Age of firms ....................................................................................................... 126
5.2.2 Ownership structure .......................................................................................... 128
5.2.3 Products, customer expectations and target market .......................................... 129
5.2.4 Linkages with other firms ................................................................................... 134
5.2.5 Nature of employment ....................................................................................... 136
2.5.6 Relationship with financial institutions ................................................................ 138
5.3 Characteristics of entrepreneurs .............................................................................. 140
5.3.1 Sex and age ...................................................................................................... 140
5.3.2 Educational background .................................................................................... 141
5.3.3 Ethnicity ............................................................................................................. 142
5.4 Conclusion ............................................................................................................... 143
CHAPTER 6 : TECHNICAL AND ECONOMIC CHARACTERISTICS OF THE
TECHNOLOGIES .............................................................................................................. 145
6.0 Introduction .............................................................................................................. 145
6.1 Functional description of machines .......................................................................... 146
ix
6.1.1 Planer/Thicknesser .............................................................................................146
6.1.2 Band saw ...........................................................................................................149
6.1.3 Saw bench .........................................................................................................150
6.1.4 Lathe machine ....................................................................................................151
6.2 Durability and quality, purchasing and maintenance costs ........................................152
6.2.1 Durability and quality ..........................................................................................153
6.2.2 Purchasing cost and annual capital consumption per worker ..............................163
6.2.3 Maintenance and repair ......................................................................................167
6.3 Scale, infrastructure requirement, and modification of Chinese machines .................170
6.3.1 Scale and infrastructure requirement of machines ..............................................170
6.3.2 Modification of Chinese machines – “Innovation over innovation” .......................173
6.4 Skill requirement for operation and repair .................................................................175
6.5 Availability of parts (usable and machine parts) ........................................................177
6.6 Conclusion ................................................................................................................179
CHAPTER 7 : FACTOR PRODUCTIVITIES, RETURNS ON INVESTMENT AND TRANSFER
MODES .............................................................................................................................. 180
7.0 Introduction ...............................................................................................................180
7.1 Production coefficients ..............................................................................................180
7.1.1 Measuring physical output ..................................................................................181
7.1.2 Interpretations of the production coefficients ......................................................184
7.2 Returns on investment in the technologies ................................................................188
7.3 Transfer modes .........................................................................................................189
7.3.1 Transfer mode for Chinese and advanced country machines .............................190
7.3.2 Mode of acquisition for Kenyan (jua kali) machines ............................................195
7.3.3 Payment terms and financing .............................................................................196
7.4 Conclusion ................................................................................................................200
Annex to Chapter 7: Indicators of returns on investment .................................................203
Total cost streams .......................................................................................................204
Revenue stream ..........................................................................................................207
Interpretation of calculated indicators of returns ..........................................................208

x
CHAPTER 8 : PENETRATION AND DETERMINANTS OF ADOPTION ............................ 213
8.0 Introduction .............................................................................................................. 213
8.1 Level of penetration ................................................................................................. 213
8.1.1 Investment in machines and market-based cooperation .................................... 213
8.1.2 Level of penetration of the three technology types ............................................. 216
8.1.3 Penetration of the four types of machines by sources (technology types) .......... 221
8.2 Firm and operator characteristics’ influence on choice/adoption .............................. 223
8.2.1 The regression models ...................................................................................... 223
8.2.2 Estimation method and results ........................................................................... 229
8.2.3 Bivariate/multivariate probit models for testing complementarity ........................ 236
8.3 Conclusion ............................................................................................................... 239
Annex to Chapter 8: PCA and regression results ........................................................... 241
8A Measuring access to finance using principal component analysis ............................. 241
8B Regression results for sequential logit model and bivariate/multivariate probit models
...................................................................................................................................... 243
CHAPTER 9 : CONCLUSION ............................................................................................ 247
9.0 Introduction .............................................................................................................. 247
9.1 Summary ................................................................................................................. 247
9.2 Optimality of technology choice and policy implications ........................................... 256
9.2.1 Optimality of technology choice and Kenya’s development imperatives ............. 256
9.2.2 Policy implications ............................................................................................. 260
9.3 Contribution to the literature ..................................................................................... 263
9.4 Reflections and further research .............................................................................. 266
REFERENCES .............................................................................................................. 270
APPENDIX .................................................................................................................... 294
A1: Consent forms for respondents ............................................................................ 294
A2: Questionnaire for first round of interviews the furniture making firms.................... 295
A3: Questions for second round of interviews with the furniture making firms ............. 304
A4: Questions for interviews with firms trading/supplying the machines ..................... 308

xi
LIST OF TABLES
Table 2.1: Real GDP growth (annual %) and real per capita GDP (PPP, constant 2011
international $) .................................................................................................................... 20
Table 2.2: Manufacturing subsectors’ percentage share in value added and employment in
the manufacturing sector ..................................................................................................... 23
Table 2.3: Value of furniture sector output in US Dollars (current prices) ............................. 25
Table 2.4: Population data for some selected years between 1948 and 2010 ..................... 34
Table 2.5: Trends in poverty and inequality ......................................................................... 35
Table 2.6: Power and road infrastructure for Kenya and Africa's LICs and MICs ................. 38
Table 2.7: Patent & trademark applications and scientific & technical journal articles .......... 40
Table 2.8: Kenya's production and imports of machinery and equipment in million US Dollars
............................................................................................................................................ 41
Table 4.1: Sampling strategy for firms in Ngong’, Gikomba and Kibuye clusters ................101
Table 5.1: Average age of firms by clusters/ sector ............................................................126
Table 5.2: Age groups of firms by cluster/sector in percentage (%) ....................................127
Table 5.3: Ownership structure by cluster/sector in percentages (%) .................................129
Table 5.4: Type of furniture by clusters/sector in percentages (%) .....................................130
Table 5.5: Proportion (%) for office furniture in production ..................................................131
Table 5.6: Nature of manufacturing by clusters/sectors in percentages (%) .......................135
Table 5.7: Average number of employees by firms’ age and sector/cluster ........................137
Table 5.8: Respondents’ perception about their access to finance (% of firms in cluster) ...139
Table 5.9: Number (n) of owners by sex of owner and cluster/sector .................................140
Table 5.10: Level of education by clusters/sectors .............................................................141
Table 6.1: Number of years of use and lifespan of machines .............................................154
Table 6.2: Purchasing cost, annual total and per worker capital consumption and labour input
...........................................................................................................................................164
Table 6.3: Motor breakdowns of planers .............................................................................167
Table 6.4: Scale/ capacity characteristics of planer ............................................................170
Table 6.5: Scale/ capacity characteristics of band saw .......................................................171
Table 6.6: Scale/ capacity characteristics of lathe ..............................................................172
Table 6.7: Scale/ capacity characteristics of saw bench .....................................................172
Table 7.1: Production level of the planers per day ..............................................................183
Table 7.2: Production coefficients for rated capacity operation of PLANERS, BAND SAWS
AND LATHES .....................................................................................................................185
Table 7.3: Production coefficients for actual daily run (three hours) of PLANERS, BAND
SAWS AND LATHES .........................................................................................................186

xii
Table 7.4: Modes of acquisition of machines (planer, band saw, lathe and saw bench) used
by the firms ........................................................................................................................ 192
Table 7.5: Working at rated capacity – Informal sector ...................................................... 209
Table 7.6: Working at rated capacity – Formal sector ........................................................ 209
Table 7.7: Working at actual daily demand-driven run (three hours) – Informal sector ....... 210
Table 7.8: Working at actual daily demand-driven run (three hours) – Formal sector......... 210
Table 7.9: Actual daily run with additional maintenance cost for Chinese planer ............... 212
Table 8.1: Results of principal component analysis ........................................................... 242
Table 8.2: Test for sampling adequacy of the PCA ............................................................ 242
Table 8.3: Regression results for sequential logit models .................................................. 243
Table 8.4: Results of bivariate probit models and tetrachoric (rho) correlation ................... 244
Table 8.5: Multivariate probit regression results and tetrachoric (rho) correlation .............. 245
Table 8.6: Correlation between independent variables ...................................................... 246
xiii
LIST OF FIGURES
Figure 1.1: SSA's major sources of machinery and transport equipment imports .................. 8
Figure 1.2: Kenya's major sources of machinery and transport equipment import ................. 9
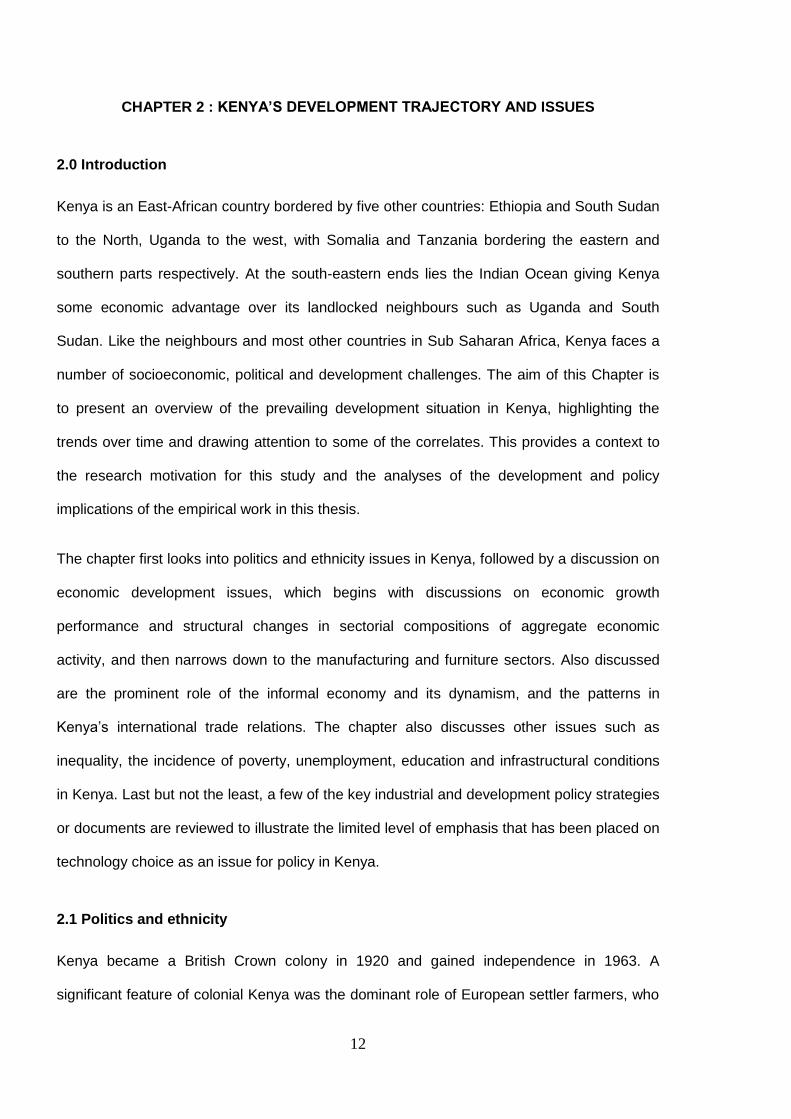
Figure 2.1: GDP and GDP per capita (annual growth), 1961-2012 ...................................... 16
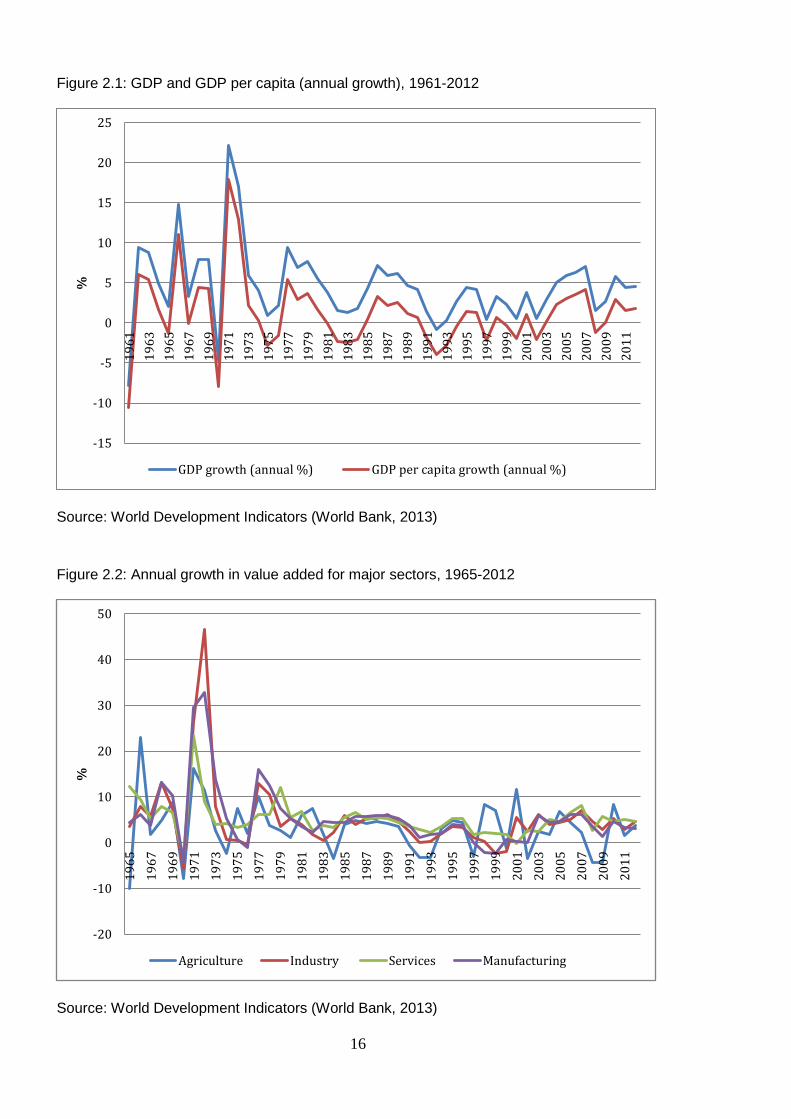
Figure 2.2: Annual growth in value added for major sectors, 1965-2012 ............................. 16
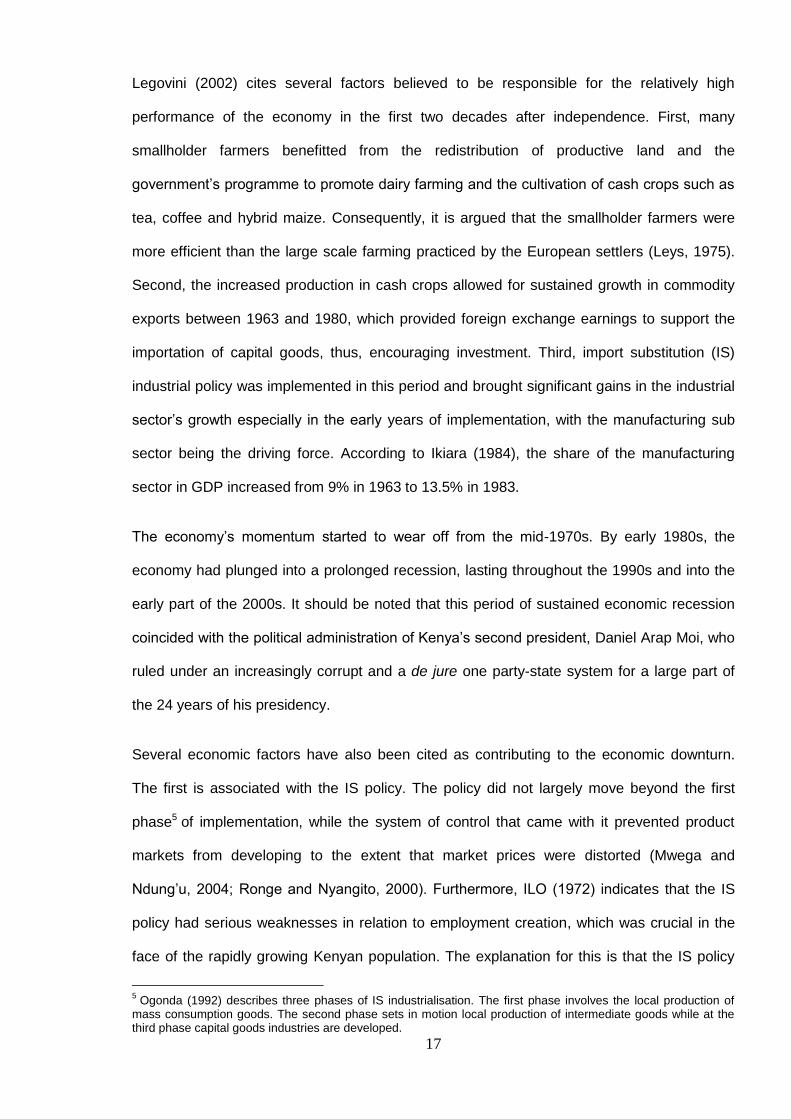
Figure 2.3: CPI inflation, lending rates and real interest rates .............................................. 19
Figure 2.4: Value added for major sectors as a percentage (%) of GDP, 1960-2012 ........... 22
Figure 2.5: Value of Kenya's total imports and total exports of furniture .............................. 26
Figure 2.6: Kenya's furniture imports from major sources .................................................... 27
Figure 2.7: Output and value added for Kenya's furniture sector ......................................... 28
Figure 2.8: Kenya's furniture exports by major destination .................................................. 29
Figure 2.9: Total imports and exports of goods and services as a percentage (%) of GDP.. 31
Figure 2.10: Major destinations for exports .......................................................................... 32
Figure 2.11: Major sources of imports ................................................................................. 32
Figure 2.12: Kenya's import of woodworking machines by major sources ........................... 33
Figure 2.13: Internet users and mobile phone subscription .................................................. 38
Figure 3.1: Technical and economic efficiency .................................................................... 50
Figure 3.2: Scale of production and average cost ................................................................ 53
Figure 3.3: Technological choice process ............................................................................ 56
Figure 3.4: Neutrality and bias of technical change with constant factor prices .................... 68
Figure 4.1: Conceptual framework ....................................................................................... 89
Figure 4.2: Graphic of major research paradigms and subtypes of mixed methods research
............................................................................................................................................ 96
Figure 4.3: Map of Kenya with the selected study areas encircled in red ............................. 98
Figure 5.1: Back view of a section of Gikomba clusters ......................................................117
Figure 5.2: Front view of a section of Gikomba cluster .......................................................117
Figure 5.3: A section of Ngong’ furniture cluster .................................................................120
Figure 5.4: Examples of permanent structures at Ngong’ cluster ........................................120
Figure 5.5: An example of sheds at Kibuye cluster .............................................................122
Figure 5.6: Premises of a highly formal sector firm .............................................................124
Figure 5.7: Respondent’s impression about customers’ expectations and preferences ......132
Figure 5.8: Average number of employees by clusters/sectors ...........................................137
Figure 5.9: Bank account and loan application status .........................................................139
Figure 5.10: Average age of the owners by cluster/sector ..................................................141
Figure 5.11: Ethnic background of owners of formal sector firms ........................................142
Figure 6.1: Photographs of planers from the three sources of machines ............................147
Figure 6.2: Photographs of band saws from the three sources of machines .......................149

xiv
Figure 6.3: Photographs of saw benches from Kenya and advanced country .................... 151
Figure 6.4: Photographs of lathe machines from the three sources of machines ............... 152
Figure 6.5: An example of modified Chinese planers ......................................................... 174
Figure 6.6: A repairer in Gikomba market fixing a broken motor ........................................ 177
Figure 8.1: Proportion of firms (%) having a machine by sectors (N=131) ......................... 214
Figure 8.2: Penetration (%) of the technology types (sources) by clusters/sectors ............ 217
Figure 8.3: Respondents’ ordinal evaluation of factors influencing choice ......................... 219
Figure 8.4: Penetration (n) by each type of machines for the three sources ...................... 222
Figure 8.5: Nature of dependent variables ......................................................................... 224
Figure 8.6: Probability of adoption by the log of firms’ age ................................................. 231
xv
LIST OF ACRONYMS
AD Asian Drivers
AERC African Economic Research Consortium
AIC Akaike Information Criterion
AICD Africa Infrastructure Country Diagnostic
AT Appropriate Technology
BCR Benefit Cost Ratio
BIC Bayesian Information Criterion
BOP Balance of Payment
BRICs Brazil, Russia, India and China
CBS Central Bureau of Statistics
CNC Computerised and Numerically Controlled
DR Democratic Republic
EU European Union
FDI Foreign Direct Investment
FOCAC Forum on China Africa Cooperation
GDP Gross Domestic Product
GVC Global Value Chain
ICT Information, Communication and Technology
ILO International Labour Organisation
IMF International Monetary Fund
IS Import Substitution
K/L Capital labour ratio
KAM Kenya Association of Manufacturers
KMO Kaiser-Meyer Olkin
LICs Low Income Countries
MATRADE Malaysian External Trade Development Corporation
xvi
MDGs Millennium Development Goals
MICs Middle Income Countries
MSEs Micro and Small Scale Enterprises
NPV Net Present Value
O/K Output capital ratio
O/L Output labour ratio
ODA Official Development Assistance
OECD Organisation for Economic Cooperation and Development
PCA Principal Component Analysis
PhD Doctor of Philosophy
PPP Purchasing Power Parity
R&D Research and Development
ROSCA Rotating Savings and Credit Associations
SAPs Structural Adjustment Programmes
SSA Sub Saharan Africa
STI Science, Technology and Innovation
TIVET Technical, Industrial, Vocational and Entrepreneurship Training
UK United Kingdom
UN United Nations
UNIDO United Nations Industrial Development Organisation
US United States
USA United States of America
USAID United States Agency for International Development
USD United States Dollars
WDI World Development Indicators
WW II World War II
WWF World Wide Fund

1
CHAPTER 1 : RESEARCH MOTIVATION
1.0 Introduction
Economic growth in Sub Saharan Africa (SSA) has more than doubled between the early
1990s and the end of the first decade of this millennium, with the growth rate averaging 5%
per annum between 2001 and 2010 (World Bank, 2011). Nevertheless, a large part of the
same period witnessed “an increase in the incidence and absolute number of people living in
income poverty”, with almost half of the region’s population still living on less than US$1
dollar a day (Handley et al., 2009 p 1). This has however occurred at a time, when global
absolute poverty level has declined (Chen and Ravallion, 2013). Careful analysis of the
global poverty profile rather shows that aside from China, the rest of the world experienced
an increase in absolute poverty cases during the noughties compared to the 1990s
(Kaplinsky, 2011a, Chataway et al., 2013). Kaplinsky (2011a) shows that although the global
number of people living in absolute poverty fell by 339 million between 1998/1999 and
2007/2008, China alone accounted for 516 million out of the 339 million, suggesting that 177
million people were actually pushed below the poverty line when China is not included in the
computations. SSA is a major contributor to the increases as the number of people living in
absolute poverty in SSA soared by 59% between 1990 and 2008 (Chataway et al., 2013).
The poverty situation in Kenya reflects these developments: Estimates based on available
data show that the number of people living in absolute poverty increased by 9.6 million1
people between 1997 and 2005. Relative poverty has also increased as a result of worsening
inequality (World Bank, 2013). While it will be difficult to fully attribute this development
impasse to the trajectory of policy and development related to technology choice,
industrialisation and agricultural mechanisation efforts since independence have largely
relied on imported technologies especially those from advanced countries (Meilink, 1982;
Ikiara, 1984; Mutai, 2011). Such efforts may have not contributed to inclusive growth and
1 The figure was estimated by the author using data from World Development Indicators (World Bank, 2013)

2
development in Kenya. As pointed out by an International Labour Organisation’s (ILO) report
on Kenya in the early 1970s, the high industrial growth in Kenya in the 1960s largely served
the interest of a few people in the formal sectors of the economy, much to the disadvantage
of the majority in the informal sectors (ILO, 1972). This outcome is associated with the fact
that industrial policies in the 1960s and 1970s supported import substitution industrialisation,
which inadvertently promoted the use of imported technology (Ikiara et al., 2004; Coughlin
and Ikiara; 1988).
At the global level, it is argued that the trajectory of innovation and technical change is a
major factor which has allowed the high and increasing absolute poverty levels to prevail in
an era of improved economic growth (Kaplinsky, 2011a). This argument questions the
appropriateness of technologies emanating from high-income economies for promoting pro-
poor economic growth in developing countries. It is argued that these technologies target
high-income consumers, are highly capital and skill intensive and are for realising scale
economies, with much reliance on sophisticated infrastructure (Kaplinsky et al., 2009).
Meanwhile, income levels are generally low in developing countries, labour particularly
unskilled is more abundant, and infrastructure is much less developed, compared to the
advanced countries from where the technologies originate.
Thus, when technologies from advanced countries are transferred “wholesale” to developing
countries, as it has occurred over the years (for example, under Kenya’s import substitution
industrialisation), several structural problems are created in the recipient economies
(Stewart, 1982). The characteristics of the technologies reduce the much needed
employment creation, lead to a limited use of local inputs and sub-optimal growth outcomes,
and make inefficient use of local factors (Bhalla, 1985; Stewart, 1982). It is further argued
that such technologies also skew production to meeting the needs of high-income consumers
who form an insignificant proportion of a developing country’s population. Moreover, the
industries using such technologies cluster in enclaves in urban areas, as they tend to have
limited linkages with traditional sectors and in their developed stages of operations they
undermine informal and/ or traditional sectors (Kabecha, 1999). Consequently, it is perhaps

3
no surprise that industrialisation efforts in most developing economies have not yielded much
success, either in terms of output growth (limited share in global manufacturing value added)
or in terms of fostering inclusive growth and development.
Within the last three decades, however, China (a developing country) has experienced a
phenomenal rise in economic power, contributing significantly to global manufacturing value
added and trade in manufactures including capital goods. This new trend may be associated
with China’s substantial and growing contribution to developing countries’ increasing share in
global research and development (R&D) activities. Developing countries’ share in global
R&D expenditure was estimated at 21% at the beginning of the 21st century compared to 2%
in late 1960s (Ely and Bell, 2009). A significant share of this expenditure occurred in China,
where R&D increased 21% annually in the last decade (Atkinson, 2012), with
manufacturing’s share in business R&D being 87% in 2008 (McKinsey, 2012). Current
estimates of R&D expenditure indicate that China is the third largest R&D performer after
United States and Japan (Kim, 2014).
The high growth in R&D activities in China and its associated increases in China’s share in
global manufacturing value added have been accompanied by innovative capability building
in China (OECD, 2007; Atkinson and Ezell, 2012; Orr and Roth; 2012) and significant
reductions in poverty numbers in China as was pointed out earlier. Casual empiricism
asserts that at the heart of the innovation path in China is the development of technologies
that appear to be suitable for the operating conditions in China as well as other developing
countries:
Spurred by demand from low income consumers, low labour prices and often poor infrastructure, China is becoming a source of appropriate technology, that is, appropriate for the operating conditions of low income economies. But unlike previous vintages of appropriate technology which were diffused by NGOs and were often inefficient, this new generation of appropriate technologies coming out of China … is a result of profit-seeking capitalist entrepreneurship (Kaplinsky, 2011a p. 7).
Interestingly, this is occurring at a time when there is a better understanding of the innovation
system and the role of technical change in economic growth and development. Against the
orthodox belief that technology is like manna from heaven, technical change/ innovation is

4
now understood to be endogenous to the economic/production system (Heertje, 1977;
Gibbons et. al., 1994; Greenwood and Jovanovic, 2001). Underpinning the new paradigm is
the theory of induced technical change, which holds that the nature of demand, factor
endowments, and other economic factors can influence the direction of technical change
(Binswanger, 1978; Kline and Rosenberg, 1986; Thirtle and Ruttan, 1987). Thus, different
socioeconomic settings can lead to different patterns of technical change such that
technologies produced in a developing country, for example China, may possess
characteristics that are different from those produced in advanced economies. Relatedly, it
has been recognised that innovation does not only result from disinterested activities taking
place in universities and research institutions (i.e. supply side), but the role that firms and
consumers (i.e. demand side) play in the nature and direction of innovation as well as their
interactions with the supply side are also important (Kline and Rosenberg, 1986; Pavitt,
1984; von Hippel, 2005).
The issues discussed in the preceding paragraphs provided the main motivation behind this
research. The thesis studies technological innovations from China in the context of other
developing countries by making comparisons with technologies from other sources
particularly advanced countries. The objective is to move beyond assertion and casual
empiricism to rigorously ascertain the extent to which the Chinese technologies are relatively
more amenable for pro poor economic growth and development strategies for developing
countries especially those in Sub Saharan Africa. Data collected from manufacturing firms in
Kenya’s furniture industry is used for the needed empirical analysis; hence, the focus of the
study is limited to technologies (machinery and equipment) used for manufacturing furniture.
The rationale behind selecting Kenya and the furniture sector for the empirical work is
outlined later in Chapter 4.
The focus on manufacturing technology is born out of the fact that manufacturing in many
developing countries has been a struggling sector, hardly delivering the expected returns or
benefits such as opportunities for employment for their growing youth population (Dinh et al.,
2012). Moreover, most developing countries particularly those in Sub Saharan Africa depend
5
on imports even for basic manufactured goods. However, manufacturing is part and parcel of
China’s success story of lifting millions from poverty and doubling her per capita GDP in 12
years, a feat that took Great Britain 150 years to achieve (McKinsey, 2012). As Brautigam
has indicated, “Manufacturing – more than microfinance – will be a central route out of
poverty for most countries. That is why it is so important to discern whether engagement with
China will catalyse or crush manufacturing in Africa” (2009 p 191). Undoubtedly, transfer of
technologies from China to African countries and other developing countries may be one of
the important ways by which China’s engagement with Africa might impede or offer impetus
to manufacturing on the continent.
1.1 Knowledge gap and research questions
China’s relationship with Africa has grown enormously, especially in the last two decades
with important implications for economic growth, distribution and policy (Kaplinsky et al.,
2007). An earlier documentation of China in SSA by Jenkins and Edwards (2006) also
suggested that the impact of China and generally Asian Drivers2 on SSA had not been and
will not be negligible, calling for detailed research on individual countries in SSA.
In fact, recent data indicate a growing relationship between China and Africa. According to a
White Paper from the Chinese Government, China-Africa trade as a percentage of Africa's
total foreign trade increased from 3.82% in 2000 to 16.13% in 2012 (People’s Republic of
China, 2013). The same White Paper shows that there has been an accelerated growth in
foreign direct investment (FDI) from China to Africa, with Chinese FDI increasing from
US$1.44 billion to US$2.52 billion between 2009 and 2012, although there was a general
decline in total FDI to Africa in the same period. Moreover, there has been a surge in
Chinese development finance to Africa since the beginning of this century, with pledges of
assistance doubling at each FOCAC summit: In 2006, US$ 5 billion was pledged and
pledges for 2009 and 2012 were US$ 10 billion and US$ 20 billion respectively (Strange et
al., 2013). Associated with the upsurge in trade, FDI and development finance is the
2 This phrase is used in the literature to jointly describe China and India as emerging Asian economies with major
implications for both the developing and developed world.
6
intensification of migration from China to Africa (Kuang, 2008; Mohan and Tan-Mullin, 2009;
Park, 2009).
From trade to FDI and official development assistance (ODA) to migration, there are many
myths surrounding the relationship between China and Africa, some of which are being
dispelled. For example, research has shown that China’s increasing interest in African
economies is not solely driven by its quest for natural resources but much of it also lies in
other factors such as the search for final markets, diplomatic support in international politics
and its principle of mutual economic development partnership (Brautigam, 2009; Zweig,
2008; Dent, 2011). Specifically on FDI, Kaplinsky and Morris (2009) point out the distinctive
character of large state-owned Chinese enterprises’ investment in SSA and the opportunities
it creates for bilateral and multilateral aid and economic cooperation between China and
SSA. Research analysing the influence of China on trade and economic relations between
African countries have also begun (e.g. Morris and Einhorn, 2008; Edwards and Jenkins,
2014). Morris and Einhorn (ibid) and other studies such as Khan et al. (2009) have also
focused on the employment and welfare implications of cheap consumer goods from China.
Moreover, studies on the motivations, relationships, and impact of Chinese migrants in Africa
and the perceptions of their African hosts are emerging (e.g. Mohan et al., 2014; Lampert
and Mohan, 2014).
However, the academic community is still at an early stage in researching this evolving
relationship and its impact on African economies. A significant gap remains in the literature.
For example, while the impact of cheap Chinese consumer goods on SSA economies has
been analysed, little is known in the literature about the effect of capital goods importation
from China on SSA economies. Generally, a large gap exists in the literature on technology
transfer from China to other developing countries, and in particular those in SSA, and the
distinctiveness of such technologies especially with reference to their development impact.
The literature on this subject appears sketchy, patchy and casual and has largely remained
in the domain of media commentary. A lot of the focus has also been on specific investment
projects. For example, in a web blog, Nordling (2012) provides a cursory discussion of the

7
technology transfer elements of investments in Africa by Chinese telecommunication
companies such as Huawei and ZTE.
However, this gap in the literature exists in the presence of a plethora of studies on
technology transfer, which has rather concentrated on technologies from advanced
economies (such as The United Kingdom, Germany and Japan) that are transferred via
direct investment activities of multinational firms. Examples of such studies include Mansfield
(1975), Teece (1977), Contractor and Sagafi-Nejad (1981), Grosse (1996) and Chen (2005).
As it will be shown in Chapter 3, a section of the literature has focused on the transfer
process and the mechanisms of transfer while others have examined the appropriateness of
these technologies for developing countries.
For technologies embodied in capital goods or machinery and equipment, the reason for this
trend in the literature is obvious. Traditionally, China was not a major source of capital goods
importation for SSA and other developing countries. This is because China’s increasing role
in the manufacturing and trade of equipment and machinery is a recent phenomenon, as can
be seen in the information presented in Figure 1.1. The figure shows that China only recently
emerged as a major source of capital goods importation, compared to countries such as the
United States and Japan. Interestingly, China has become the largest source of SSA’s
imports of machinery and transport equipment since 2007, with substantial increases in
importation occurring year after year particularly during the 2000s. The implication is that
there is a general disruption of the pattern of technology transfer to developing countries. We
now observe a situation where capital goods are being developed within a developing
country (China) context and for developing countries, which hitherto depended extensively
on capital goods from advanced countries.

8
Figure 1.1: SSA's major sources of machinery and transport equipment imports
Source: UN COMTRADE accessed on 27 March 2012
Being a sub Saharan African country, Kenya is no exception to China’s strengthening
economic ties with developing countries. Chinese ODA to Kenya increased consistently from
less than one percent (1%) of total ODA to Kenya in 2002 to about 8.25% in 2005, making
China Kenya’s second largest source of ODA after the European Union in 2005 (Onjala,
2008). In 2010, China emerged as the Kenya’s leading source of FDI, with investment in that
year totalling US $26.6 million (Juma, 2011; Patroba, 2012)3. Data from UN COMTRADE4
shows that Kenya’s trade with China has seen a significant rise from the year 2000, with
Kenya recording an increasing trade deficit against China. China’s exports to Kenya
increased by more than tenfold in the last decade, with China emerging as the second
largest source of imports for Kenya in 2010. The increase occurred in most of Kenya’s major
import items including machinery and transport equipment. Figure 1.2 depicts the dramatic
increases in China’s machinery export to Kenya in the last decade. The figure shows that
3 The Kenya Investment Authority is the primary source of the information provided in the secondary sources
indicated. 4 The data was accessed on 27 March 2012 via https://wits.worldbank.org/
0
2000
4000
6000
8000
10000
12000
14000
16000
18000
20000
Mil
lio
n U
S$
China Germany Korea, Rep. Japan United States
9
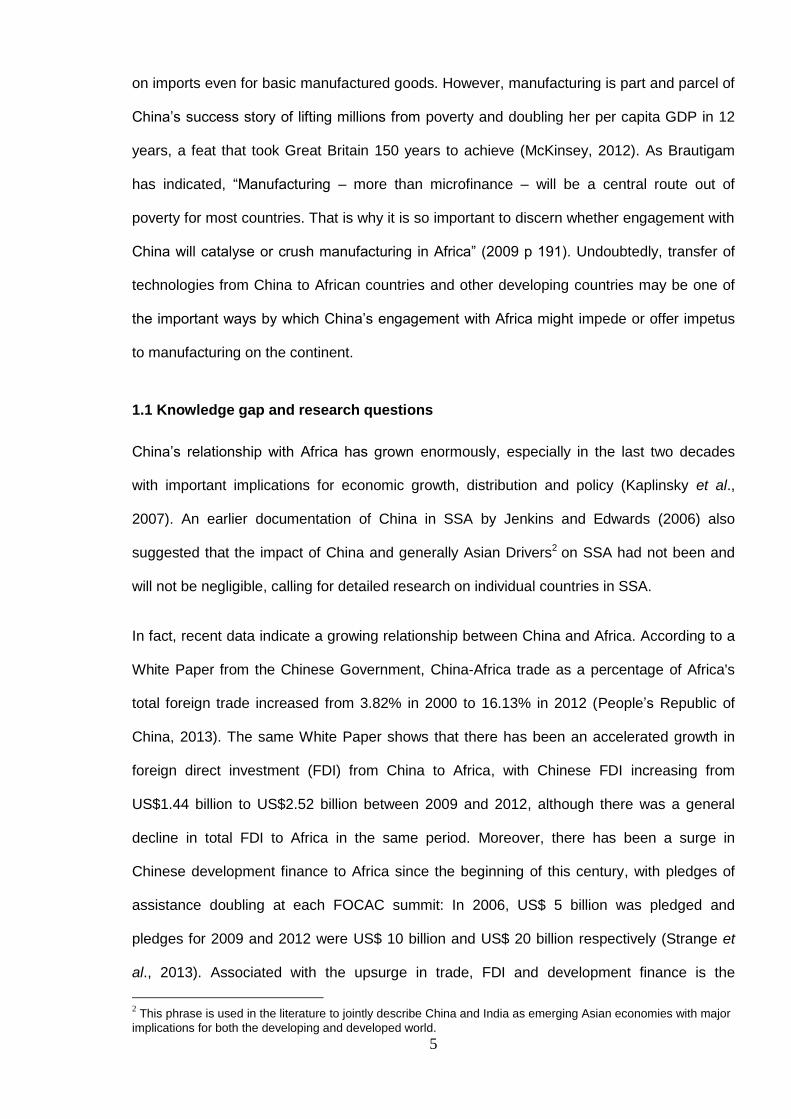
China’s exports saw steady increases in the 2000s, and as in the case of sub Saharan
Africa, has emerged as the highest exporter of machinery to Kenya.
Figure 1.2: Kenya's major sources of machinery and transport equipment import
Source: UN COMTRADE accessed on 27 March 2012
The new trend in economic relations between Kenya and SSA on one hand and China on the
other, particularly that observed in Figures 1.1 and 1.2 tells a compelling story about the
changing mix of technology available to Kenya, and SSA more generally. It raises multiple
questions especially in view of the fact that the empirical literature on the subject is patchy
and anecdotal. In this regard, this thesis attempts to contribute to bridging the gap in the
literature by finding answers to the following specific research questions:
How distinctive are Chinese technologies used in Kenya’s furniture making industry
with respect to their technical and economic/social characteristics?
How are the Chinese technologies transferred from China to the Kenyan firms
compared to the advanced country technologies?
To what extent have the firms adopted the Chinese technologies, compared to those
from advanced countries and Kenya and what factors influence adoption?
0
100
200
300
400
500
600
700
Mil
lio
n U
S$
China Japan India United Kingdom Germany

10
The answers to the above research questions, generated through the empirical research on
Kenya, will help determine the extent to which the Chinese technology may create more
inclusive growth and development vis-à-vis the technologies from advanced countries.
1.2 Structure of the thesis
The thesis is divided into nine Chapters. Chapter 2 discusses Kenya’s development
trajectory and issues. The main points highlighted in the chapter converge around politics
which has been largely “tribalised”, economic performance and social developments as well
as the level of attention given to technology choice in the industrial and development policies
of the country.
Chapter 3 presents a review of the literature related to the subject areas of the thesis. Four
main sets of literature are discussed: technology choice, appropriate technology, sources of
technical change and technology transfer.
Chapter 4 presents a conceptual framework developed based on ideas from the literature
reviewed in Chapter 3. The framework provides a guide to analysing the relationship
between the concepts/variables studied in this thesis, of which the empirical data were
collected from furniture manufacturing firms in Kenya. The chapter also discusses the data
collection methods used and the various challenges in the data collection exercise.
Chapters 5 to 8 present the analyses of the empirical data. Chapter 5 presents information
on the business and entrepreneurial profile of the firms studied. The main aim of the chapter
is to provide an understanding about the nature and character of the firms. This helps to gain
more understanding about the behavioural patterns of the firms particularly with regards to
technology adoption/ choice and the transfer modes they use. Thus, this chapter does not
directly answer any of the research questions. Its role in the thesis is to provide a
background to the other three empirical chapters that directly answer the research questions.
Answers to the three research questions are presented chronologically in Chapters 6 to 8 to
reflect the order of the research questions, as specified in Section 1.1. This is because,
11
chronologically, it makes sense to think of what/how the technologies are before thinking
about how they get to the Kenyan furniture manufacturing firms. Similarly, it makes sense to
think of how they get to the firms before thinking about the extent to which they have diffused
in the furniture industry in Kenya. Chapter 6 therefore discusses the technical and economic
characteristics of Chinese technology but in comparison with those from advanced countries
and Kenya. As it will be noted later, the Chinese, advanced country and Kenyan technologies
largely constitute the dominant technology types used in Kenya’s furniture making industry.
The discussion on the technical characteristics focuses on the functions of the machines, the
run of the machines and their physical characteristics such as size and capacity. The
discussion on the economic/social characteristics examines factors such as the purchasing
and maintenance cost of the machines, skill and infrastructure requirements for investing in
the technologies and the economic implications of some of the technical characteristics.
Chapter 7 examines the relative efficiency and factor intensities of the technologies. Also
discussed are the returns on investment in the technologies, the modes of transfer and the
financing options available for acquiring the technologies.
Chapter 8 presents findings on the level of penetration (or diffusion) of the technologies from
China, advanced countries and Kenya in the furniture industry. The chapter also highlights
several explanations for the observed patterns of penetration, based on evidence presented
in Chapters 5 to 7 and additional information presented in Chapter 8. Also, the firms’ and
their operators’ characteristics are examined as factors influencing adoption, thus
penetration. Complementarities between the adoptions of the technologies are also
examined.
Chapter 9 presents a summary of the previous chapters, outlining the major findings. It also
examines what the findings suggest concerning an optimal technology choice for Kenya,
based on the prevailing development imperatives of Kenya. The policy implications of the
findings and the contribution of the study to the literature are also presented. The chapter
ends the thesis with the author’s reflections, culminating in several ideas for further research.
12
CHAPTER 2 : KENYA’S DEVELOPMENT TRAJECTORY AND ISSUES
2.0 Introduction
Kenya is an East-African country bordered by five other countries: Ethiopia and South Sudan
to the North, Uganda to the west, with Somalia and Tanzania bordering the eastern and
southern parts respectively. At the south-eastern ends lies the Indian Ocean giving Kenya
some economic advantage over its landlocked neighbours such as Uganda and South
Sudan. Like the neighbours and most other countries in Sub Saharan Africa, Kenya faces a
number of socioeconomic, political and development challenges. The aim of this Chapter is
to present an overview of the prevailing development situation in Kenya, highlighting the
trends over time and drawing attention to some of the correlates. This provides a context to
the research motivation for this study and the analyses of the development and policy
implications of the empirical work in this thesis.
The chapter first looks into politics and ethnicity issues in Kenya, followed by a discussion on
economic development issues, which begins with discussions on economic growth
performance and structural changes in sectorial compositions of aggregate economic
activity, and then narrows down to the manufacturing and furniture sectors. Also discussed
are the prominent role of the informal economy and its dynamism, and the patterns in
Kenya’s international trade relations. The chapter also discusses other issues such as
inequality, the incidence of poverty, unemployment, education and infrastructural conditions
in Kenya. Last but not the least, a few of the key industrial and development policy strategies
or documents are reviewed to illustrate the limited level of emphasis that has been placed on
technology choice as an issue for policy in Kenya.
2.1 Politics and ethnicity
Kenya became a British Crown colony in 1920 and gained independence in 1963. A
significant feature of colonial Kenya was the dominant role of European settler farmers, who

13
with the support of the colonial government appropriated much of Kenya’s arable land for
agricultural plantation. The indigenes remained peasant farmers and a large proportion of the
rural population had to work compulsorily on settler farms as wage labourers. To make
cheap labour available on settler farms, a poll tax was introduced and Africans were also
barred from commercial agriculture and this is believed to have had negative effect on
African entrepreneurship (Leys, 1975). The impact of settler farming on Africans took several
forms: unequal distribution of land; landlessness; economic and social discrimination; and
economic repression (Leys, 1975; Sundet and Moen, 2009). While Europeans monopolised
commercial agriculture, Asians particularly Indians, who came to Kenya mainly to provide
labour for the construction of the Kenya-Uganda Railway, dominated real estate and trade
sectors. The Indians were able to accumulate considerable wealth and entrepreneurial
experience, which later enabled them to upgrade or diversify their businesses into varied
areas of manufacturing (Leys, 1975). These factors largely contributed to the struggle for
independence, which climaxed with the popular Kikuyu-dominated Mau Mau uprising, which
began in 1952 and lasted for almost a decade (Leys, 1975).
However, little or no restructuring occurred in political administration after independence. The
colonial political system practically continued with the following key characteristics: a
centralised state with powerful executives, political conflicts based on issues of inequality
particularly with reference to land, and the persistence of violent confrontation between the
state and popular movements in the opposition (McSherry and Brass, 2007). According to
Sundet and Moen (2009), instead of correcting anomalies in the political administration,
Jomo Kenyatta (Kenya’s first president) used patron-clientele network to woo opponents into
his government so that as early as 1964 Kenya had become a de facto one party state.
However, it was not until 1982 that Kenya became a de jure one party state, which remained
until 1991. Daniel Arap Moi, who took over the presidency after Jomo Kenyatta’s demise in
1978, sought to weaken decentralised institutions and other arms of government at the
national level, with the executive appropriating more power and control (Sundet and Moen,
2009). The result was an inherently unstable political system, which manifested in several

14
forms including the coup d’état attempt of 1982 (Sundet and Moen, 2009). However, unlike
many other independent Africa countries, there was no successful coup d’état and Kenya
enjoyed a relatively stable political environment under one party system.
With pressure from the international community, multi-party democracy was restored in 1992,
but a change in the presidency only took place in 2002. The multi-party system became the
litmus test for the apparent political stability in Kenya, which had thrived behind subdued
tribal tensions arising from unequal distribution of land and unequal access to public goods
and services. Mwai Kibaki became the president from 2002 to 2007, at the end of which
another election was held. The run up to this election was noticeably violence free, much like
what happened in 2002. However, flawed electoral processes led to a post-election violence,
in which thousands lost their lives. A power-sharing deal between the incumbent president
(Mwai Kibaki) and the major opposition leader (Raila Odinga) helped to restore peace.
The major catalyst for the post-election violence was tribal sentiments linked to social
injustices, regional inequality, high unemployment and unequal access to land. Gutiérrez-
Romero (2010) specifically points out that land disputes arising from unequal redistribution of
land that was reclaimed from the settler farmers has been a key reason for tribal sentiment in
Kenya, which politicians have preyed on to achieve their short term goals. Consequently,
politics in Kenya has become ethno-centric to the extent that even church leaders openly
campaign and support camps of their ethnic groups (Gumo et al., 2012). Several other
studies such as Kimenyi (1997), Apollos (2001), Orvis (2001) and Bratton and Kimenyi
(2008) show that ethnicity plays a central role in Kenya’s politics influencing patterns of
political mobilisation and voting, resource allocation and public service appointments.
Gutiérrez-Romero’s (2010) study further shows that ethnicity was the main determinant of
voting in the 2007 elections in Kenya and the reason was that people believed voting for their
tribal representatives would guarantee an improved access to public services.
Kenyans went to the electoral polls again in 2013, which according to international observers
were free and fair. Uhuru Kenyatta (a first generation progeny of Jomo Kenyatta) emerged as

15
the president. Although, the main opponent (Raila Odinga) contested the results, the dispute
was calmly settled through the judicial system, which appears strengthened with the
promulgation of a new constitution in 2010 which replaced that of 1969.
2.2 Economic development
2.2.1 Economic growth performance
Like the political institutions, the inherited economic structures from colonisation were largely
preserved especially in the early years of independent Kenya (Leys, 1975; Holmquist et al,
1994). At the dawn of independence, the economy was highly controlled and regulated and
based on a monopolistic private enterprise system and private property ownership, all of
which formed a significant part of the colonial legacy (Leys, 1975; Legovini, 2002; Mwega
and Ndung’u, 2004). According to Leys (ibid), if any significant change took place, it was
‘Africanisation’ of the economy, which ensured the transfer of the White Highlands to
indigenes and the relatively gradual indigenisation of the civil service, some sectors of
commerce and some positions in the corporate sector.
Nevertheless, the economy performed robustly until the mid-1970s. Real GDP recorded
annual growth of 9.5% and 8.7% in 1962 and 1963 respectively, up from negative 7.7% in
1961 (Figure 2.1). This robustness continued through the first two decades of independent
Kenya. Between 1963 and 1972, GDP grew at an annual average of 8.4%, translating into an
average real per capita GDP growth of 4.8% per annum. The next decade saw the figures
plummet although they were still relatively good: GDP and per capita GDP respectively
recorded annual average growth rates of 4.8% and 0.9%. This development was reflected in
the performance of all the major sectors of the economy: Agriculture; Industry (of which
manufacturing has been the backbone); and Services sectors (Figure 2.2).
16
Figure 2.1: GDP and GDP per capita (annual growth), 1961-2012
Source: World Development Indicators (World Bank, 2013)
Figure 2.2: Annual growth in value added for major sectors, 1965-2012
Source: World Development Indicators (World Bank, 2013)
-15
-10
-5
0
5
10
15
20
251
96
1
19
63
19
65
19
67
19
69
19
71
19
73
19
75
19
77
19
79
19
81
19
83
19
85
19
87
19
89
19
91
19
93
19
95
19
97
19
99
20
01
20
03
20
05
20
07
20
09
20
11
%
GDP growth (annual %) GDP per capita growth (annual %)
-20
-10
0
10
20
30
40
50
19
65
19
67
19
69
19
71
19
73
19
75
19
77
19
79
19
81
19
83
19
85
19
87
19
89
19
91
19
93
19
95
19
97
19
99
20
01
20
03
20
05
20
07
20
09
20
11
%
Agriculture Industry Services Manufacturing
17
Legovini (2002) cites several factors believed to be responsible for the relatively high
performance of the economy in the first two decades after independence. First, many
smallholder farmers benefitted from the redistribution of productive land and the
government’s programme to promote dairy farming and the cultivation of cash crops such as
tea, coffee and hybrid maize. Consequently, it is argued that the smallholder farmers were
more efficient than the large scale farming practiced by the European settlers (Leys, 1975).
Second, the increased production in cash crops allowed for sustained growth in commodity
exports between 1963 and 1980, which provided foreign exchange earnings to support the
importation of capital goods, thus, encouraging investment. Third, import substitution (IS)
industrial policy was implemented in this period and brought significant gains in the industrial
sector’s growth especially in the early years of implementation, with the manufacturing sub
sector being the driving force. According to Ikiara (1984), the share of the manufacturing
sector in GDP increased from 9% in 1963 to 13.5% in 1983.
The economy’s momentum started to wear off from the mid-1970s. By early 1980s, the
economy had plunged into a prolonged recession, lasting throughout the 1990s and into the
early part of the 2000s. It should be noted that this period of sustained economic recession
coincided with the political administration of Kenya’s second president, Daniel Arap Moi, who
ruled under an increasingly corrupt and a de jure one party-state system for a large part of
the 24 years of his presidency.
Several economic factors have also been cited as contributing to the economic downturn.
The first is associated with the IS policy. The policy did not largely move beyond the first
phase5 of implementation, while the system of control that came with it prevented product
markets from developing to the extent that market prices were distorted (Mwega and
Ndung’u, 2004; Ronge and Nyangito, 2000). Furthermore, ILO (1972) indicates that the IS
policy had serious weaknesses in relation to employment creation, which was crucial in the
face of the rapidly growing Kenyan population. The explanation for this is that the IS policy
5 Ogonda (1992) describes three phases of IS industrialisation. The first phase involves the local production of
mass consumption goods. The second phase sets in motion local production of intermediate goods while at the third phase capital goods industries are developed.

18
relied heavily on capital intensive/ labour saving technologies, which hindered employment
creation and encouraged inefficient and rent seeking behaviour in the industrial sector
(Meilink, 1982; Legovini, 2002). Ikiara (1984) also indicates that the manufacturing sector
became largely dependent on foreign inputs, with production being highly skewed towards
consumer goods, which further discouraged the production of intermediate and capital
goods. It also led to the creation of excess capacity and low technical efficiency, and
negatively affected the ability of firms to penetrate foreign markets (Bigsten, 2001).
The second factor is related to the poor policy response to a series of oil price shocks in the
1970s and 1980s, which culminated in balance of payment (BOP) crises and inflationary
pressures. According to Mwega and Ndung’u, “…the easy reaction to the crises in the early
1970s prevented the policy makers from formulating and adopting stabilisation and
adjustments measures and policies … that could re-orient the economy in the phase of
internal and external shocks” (2004 p 14).
Third, government’s role in the economy expanded: Government expenditure skyrocketed in
1970s and 1980s, leading to fiscal imbalances and putting extreme pressure on domestic
credit and inflation (Legovini, 2002). As Figure 2.3 shows, inflation moved swiftly from very
low rate (near-zero range) in the 1960s to double digits in the 1970s. Inflation in the years
after the 1960s has generally remained high, becoming an attendant feature of Kenya’s
economy and largely pulling along lending rates and raising the real cost of borrowing
(Figure 2.3). Figure 2.3 shows that real interest rate still remains high with an estimate of
12% and 9% in 2010 and 2012 respectively.
In order to reverse the imbalances in the economy, policy reforms started in the 1980s, and
followed the World Bank-International Monetary Fund (IMF) Structural Adjustment
Programmes (SAPs). SAPs required product and financial markets liberalisation,
international trade liberalisation, government budget rationalisation, divestiture and
privatisation of parastatal industries and civil service reforms. However, the implementation
of structural reforms embodied in SAPs did not achieve the expected results. Mwega and
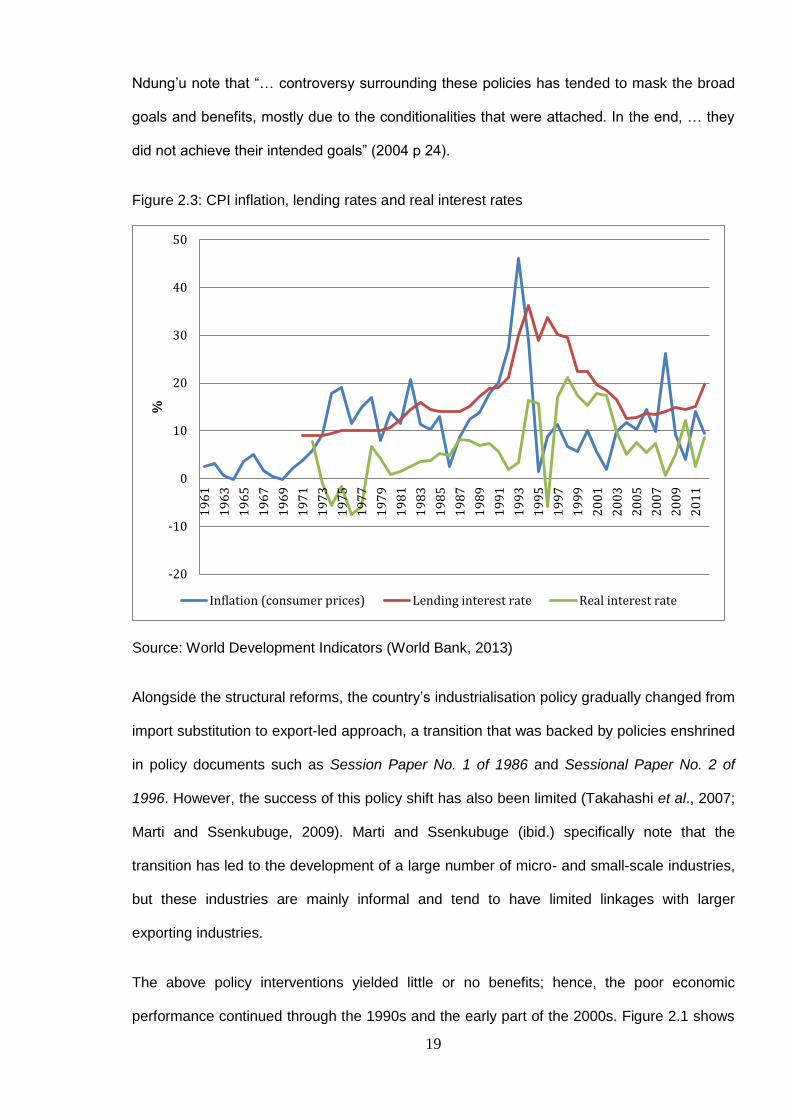
19
Ndung’u note that “… controversy surrounding these policies has tended to mask the broad
goals and benefits, mostly due to the conditionalities that were attached. In the end, … they
did not achieve their intended goals” (2004 p 24).
Figure 2.3: CPI inflation, lending rates and real interest rates
Source: World Development Indicators (World Bank, 2013)
Alongside the structural reforms, the country’s industrialisation policy gradually changed from
import substitution to export-led approach, a transition that was backed by policies enshrined
in policy documents such as Session Paper No. 1 of 1986 and Sessional Paper No. 2 of
1996. However, the success of this policy shift has also been limited (Takahashi et al., 2007;
Marti and Ssenkubuge, 2009). Marti and Ssenkubuge (ibid.) specifically note that the
transition has led to the development of a large number of micro- and small-scale industries,
but these industries are mainly informal and tend to have limited linkages with larger
exporting industries.
The above policy interventions yielded little or no benefits; hence, the poor economic
performance continued through the 1990s and the early part of the 2000s. Figure 2.1 shows
-20
-10
0
10
20
30
40
50
19
61
19
63
19
65
19
67
19
69
19
71
19
73
19
75
19
77
19
79
19
81
19
83
19
85
19
87
19
89
19
91
19
93
19
95
19
97
19
99
20
01
20
03
20
05
20
07
20
09
20
11
%
Inflation (consumer prices) Lending interest rate Real interest rate

20
that real GDP growth remained relatively low in this period and value added in all the major
sectors of the economy were also relatively low (Figure 2.2).
The economy began recovering from the protracted recession in 2003. By and large, the
recovery has continued up to today, a period that largely coincides with Mwai Kibaki’s
presidency. However, it is important to note that the global food and financial crisis of 2008
together with the post-election violence and a drought in 2008 nearly truncated the recovery
process. Real GDP grew at 1.6% in 2008, down from 7% in 2007, the pre-crisis year. The
recovery has however resumed as conditions have started to normalise: Real GDP growth
stood at 5.3% and 4.6% in 2010 and 2012 respectively.
Table 2.1: Real GDP growth (annual %) and real per capita GDP (PPP, constant 2011
international $)
Country Variable 1980-1989 1990-1999 2000-2009 2000-2012
Kenya
GDP growth 4.2 2.2 3.6 4.9
GDP per capita
1846.7 1863.5 2073.1
Uganda
GDP growth 3.0 6.9 7.2 5.3
GDP per capita
753.3 1048.9 1320.7
Tanzania
GDP growth
3.3 6.8 6.8
GDP per capita
988.4 1257.5 1598.5
Low income
GDP growth 2.7 2.5 5.1 6.2
GDP per capita
1034.6 1231.4 1527.0
Sub-Saharan Africa
GDP growth 1.7 1.9 5.1 4.5
GDP per capita
2241.9 2598.5 3101.4
World
GDP growth 3.1 2.7 2.6 3.1
GDP per capita 9046.9 11266.2 13227.0
Source: World Development Indicators (World Bank, 2013)
Generally, as a result of the chequered economic performance since the mid-1970s, growth
in per capita real GDP (PPP, measured in constant 2011 international dollars) has been low.
Between 1990s and 2000s, for example, real per capita GDP increased by only 1% from an
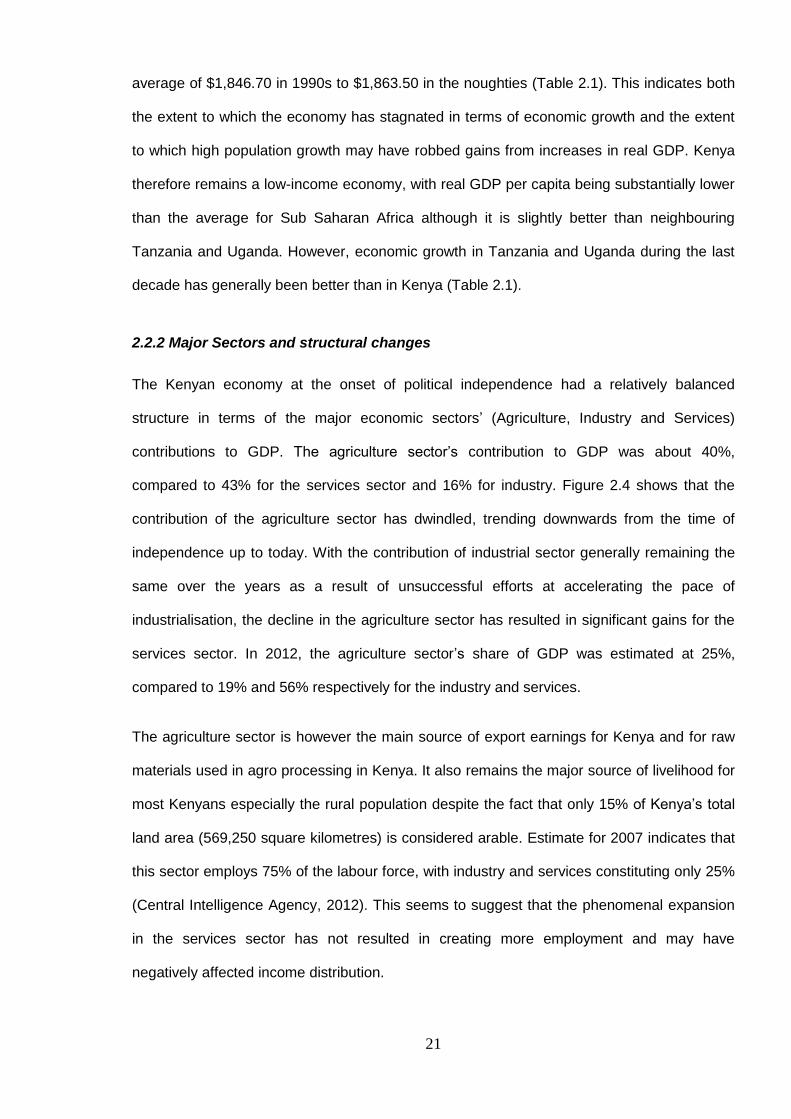
21
average of $1,846.70 in 1990s to $1,863.50 in the noughties (Table 2.1). This indicates both
the extent to which the economy has stagnated in terms of economic growth and the extent
to which high population growth may have robbed gains from increases in real GDP. Kenya
therefore remains a low-income economy, with real GDP per capita being substantially lower
than the average for Sub Saharan Africa although it is slightly better than neighbouring
Tanzania and Uganda. However, economic growth in Tanzania and Uganda during the last
decade has generally been better than in Kenya (Table 2.1).
2.2.2 Major Sectors and structural changes
The Kenyan economy at the onset of political independence had a relatively balanced
structure in terms of the major economic sectors’ (Agriculture, Industry and Services)
contributions to GDP. The agriculture sector’s contribution to GDP was about 40%,
compared to 43% for the services sector and 16% for industry. Figure 2.4 shows that the
contribution of the agriculture sector has dwindled, trending downwards from the time of
independence up to today. With the contribution of industrial sector generally remaining the
same over the years as a result of unsuccessful efforts at accelerating the pace of
industrialisation, the decline in the agriculture sector has resulted in significant gains for the
services sector. In 2012, the agriculture sector’s share of GDP was estimated at 25%,
compared to 19% and 56% respectively for the industry and services.
The agriculture sector is however the main source of export earnings for Kenya and for raw
materials used in agro processing in Kenya. It also remains the major source of livelihood for
most Kenyans especially the rural population despite the fact that only 15% of Kenya’s total
land area (569,250 square kilometres) is considered arable. Estimate for 2007 indicates that
this sector employs 75% of the labour force, with industry and services constituting only 25%
(Central Intelligence Agency, 2012). This seems to suggest that the phenomenal expansion
in the services sector has not resulted in creating more employment and may have
negatively affected income distribution.

22
Figure 2.4: Value added for major sectors as a percentage (%) of GDP, 1960-2012
Source: World Development indicators, World Bank (2013)
2.2.3 The manufacturing sector
Figure 2.4 shows that developments in the manufacturing subsector drives developments in
the industrial sector; the trend for industry’s contribution to GDP mirrors that for the
manufacturing subsector. Throughout Kenya’s economic history, manufacturing has
accounted for over half the size of the industrial sector. In 2010, for example, the subsector
accounted for about 11 percentage points of the industry’s 19% share in GDP.
Table 2.2 presents data on the contributions to value added and employment by the
subsectors within the manufacturing sector in Kenya. The table shows that in terms of
contribution to value added, four of the 14 subsectors dominate manufacturing, contributing a
total of over 55% of value addition in each of the years provided in the table. Food
processing remains the largest contributor with 19% share in 2008, followed by petroleum
refinery, oil and vaseline (15%), non-metallic mineral products (13%), and tobacco and
beverages (9%) in that order. Textile and clothing, and wood and furniture subsectors are
0
10
20
30
40
50
601
96
1
19
63
19
65
19
67
19
69
19
71
19
73
19
75
19
77
19
79
19
81
19
83
19
85
19
87
19
89
19
91
19
93
19
95
19
97
19
99
20
01
20
03
20
05
20
07
20
09
20
11
%
Agriculture Industry Services Manufacturing

23
typical examples of the subsectors with relatively insignificant contributions to manufacturing
value added in Kenya.
Table 2.2: Manufacturing subsectors’ percentage share in value added and employment in
the manufacturing sector
Source: Chege et al. (2013)
However, the data on shares in the manufacturing sector’s employment in Table 2.2 indicate
that the textile and furniture subsectors create higher opportunities for employment than the
subsectors that account for significantly higher proportion of output particularly the petroleum
refinery sector. This sector contributes less than 0.1% to employment compared to about
5.4% for the wood and furniture sector and 23% for textile and clothing (Table 2.2). It should
be noted that food processing dominates not only in terms of contribution to value added but
also in terms of employment. However, a careful study of the numbers in the table shows
that in relative terms the employment intensity of food processing is less than the textiles and
furniture subsectors.
Another important feature of manufacturing in Kenya is the dominance of micro and small
enterprises in the sector. Although the sector is made of firms of varied sizes, it is estimated
% share of
value added
% share in
employment
% share of
value added
% share in
employment
% share of
value added
% share in
employment
Total food
manufacturing 20.37 30.68 19.34 30.62 21.81 30.62
Tobacco and beverages 9.04 3.44 9.19 3.26 10.06 3.26
Textiles and clothing 3.25 23.48 2.73 23.43 2.16 23.14
Leather and footwear 1.75 0.94 1.67 0.99 1.88 0.99
Wood and furniture 1.39 5.46 1.43 5.39 1.77 5.39
Paper and printing 6.51 6.66 6.4 6.6 4.75 6.6
Industrial chemicals,
paint and soap 1.42 5.8 1.38 5.72 1.59 5.72
Petroleum
refineries,oils, vaseline 15.38 0.09 15.32 0.09 10.62 0.09
Rubber products 1.34 1.26 1 1.41 1.05 1.41
Plastic products 1.93 3.15 1.39 3.27 1.52 3.27
Clay and glass products 1.46 2.58 1.76 2.75 2.04 2.73
Metal products 4.58 9.46 4.07 9.52 4.15 9.52
Non metallic mineral
products 11.08 0.9 13.47 1.19 15.46 1.19
Transport equipment 1.76 3.57 1.53 3.09 2.02 3.09
Subsector
2006 2008 2010

24
that informal micro and small-scale enterprises (MSEs) constitute about 85% of firms
producing manufactured products in Kenya (Marti and Ssenkubuge, 2009). The products of
MSEs meet the basic needs of the low and middle-income rural and urban people in Kenya
who normally cannot afford products from formal manufacturing enterprises (Bigsten et al.,
2000).
The manufacturing firms especially the MSEs contend with many challenges, which
negatively affect their growth. The challenges range from stiff competition from cheap
imports and narrow export base to informality and the scourge of HIV/AIDS pandemic
(Republic of Kenya, 2008a; Kenya Association of Manufacturers, 2006). Other challenges
include limited access to financial services, high taxes, corruption and red tape, limited and
costly physical infrastructure, and inadequate managerial, technical and entrepreneurial skills
(Republic of Kenya, 1996; Soderbom, 2001; Bowen et al. 2009; Bigsten et al., 2011).
The furniture subsector
Kenya’s furniture industry has expanded significantly within the last decade. Data from
United Nations Industrial Development Organisation (UNIDO) shows that in 2010 the value
of total output of the furniture making industry in Kenya was US$ 172 million, compared to
US$ 59 million a decade earlier6. This suggests that, in terms of output, the size of the sector
has nearly tripled within a decade. Correspondingly, the UNIDO data further show that the
sector achieved an average growth of 12% per annum between 2001 and 2010, making the
furniture industry one of the fastest growing subsectors within Kenya’s manufacturing sector.
Within the East African Sub Region, Kenya appears to have one of the most vibrant furniture
manufacturing sectors. The data presented in Table 2.3 compares the production level of
Kenya’s furniture sector with those of other East African countries including Democratic
Republic (DR) of Congo, for which data on furniture output were available from the UNIDO
database. The data show that the furniture making industry in Kenya is much larger than
those in the other countries. In fact, it is striking to find that Kenya’s furniture production is far
6 The values for output and value added from UNIDO are in current prices

25
higher than DR Congo’s production, given that DR Congo has a larger forest cover7, and
produces a lot of hard timber for exports to other countries. Currently, the furniture industry in
Kenya depends greatly on hard wood (Mahogany) imported from DR Congo, an imperative
that resulted from Kenya’s Government’s ban on indiscriminate logging in public forest in
1999. A report by World-Wide Fund on Eastern DR Congo’s timber export to East Africa sub
region, published in 2012, indicated that exports to Kenya constituted 55% of the total
exports to East Africa.
Table 2.3: Value of furniture sector output in US Dollars (current prices)
Source: UNIDO online database, accessed on 11 October 2014
Like the manufacturing sector as a whole, Kenya’s furniture making industry constitutes a
major activity area for informal MSEs as well as formal manufacturing establishments, which
together produce a wide range of furniture products. The informal MSEs largely produce
cheap and poor quality products although some of them are able to manufacture high quality
furniture, which attracts demand from formal sector of the economy (Bigsten et al., 2000).
These informal enterprises generally specialise in the production of domestic furniture while
the firms operating in the formal sector produce both office and domestic furniture
(MATRADE-Nairobi, 2005). According to Schneider (1999), local manufacturers have played
7 Source: World Bank online database, http://data.worldbank.org/indicator/AG.LND.FRST.ZS
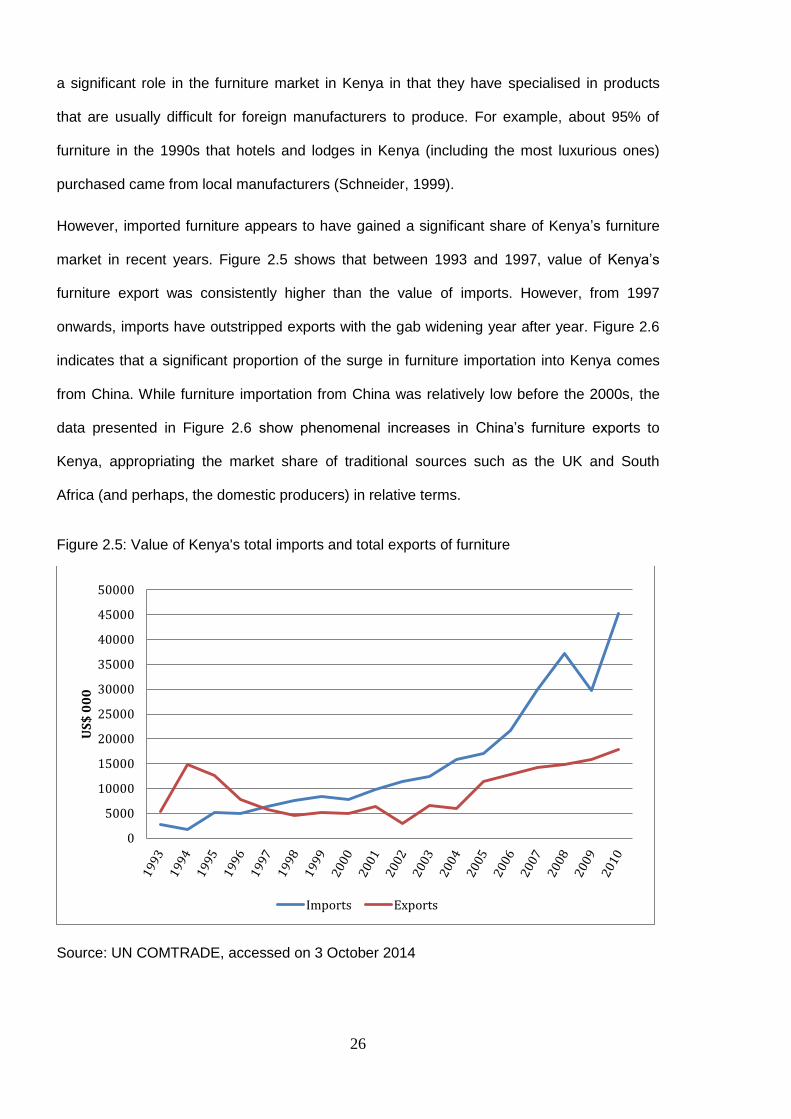
26
a significant role in the furniture market in Kenya in that they have specialised in products
that are usually difficult for foreign manufacturers to produce. For example, about 95% of
furniture in the 1990s that hotels and lodges in Kenya (including the most luxurious ones)
purchased came from local manufacturers (Schneider, 1999).
However, imported furniture appears to have gained a significant share of Kenya’s furniture
market in recent years. Figure 2.5 shows that between 1993 and 1997, value of Kenya’s
furniture export was consistently higher than the value of imports. However, from 1997
onwards, imports have outstripped exports with the gab widening year after year. Figure 2.6
indicates that a significant proportion of the surge in furniture importation into Kenya comes
from China. While furniture importation from China was relatively low before the 2000s, the
data presented in Figure 2.6 show phenomenal increases in China’s furniture exports to
Kenya, appropriating the market share of traditional sources such as the UK and South
Africa (and perhaps, the domestic producers) in relative terms.
Figure 2.5: Value of Kenya's total imports and total exports of furniture
Source: UN COMTRADE, accessed on 3 October 2014
0
5000
10000
15000
20000
25000
30000
35000
40000
45000
50000
US
$ 0
00
Imports Exports

27
Figure 2.6: Kenya's furniture imports from major sources
Source: UN COMTRADE, accessed on 3 October 2014
The trend shown in Figure 2.6 seem to offer some support to Namale’s (2012) report that
high importation of cheap furniture from China has recently displaced some of the local
manufacturers (Namale, 2012). Namale (2012) reported that the advantage of the imported
furniture from China over the made-in-Kenya furniture is that the furniture from China tend
have better finishing. He however noted that consumers in Kenya have recognised that the
imported furniture from China usually break often and are difficult to repair; hence, the
consumers have started changing their preference back towards local products. This
supports Schneider (1999) who found that the local manufacturers of furniture have
significant advantage over imported products in Kenya’s domestic market because they offer
opportunity for maintenance, repairs and replacement.
The reversion of consumer preference towards locally made furniture reported by Namale
(2012) appears to reflect in the growth of output and value addition in the furniture sector,
which can be seen in the data presented in Figure 2.7. The figure shows that the sector has
seen significant increases in production and value addition between 2005 and 2010, while
0
2000
4000
6000
8000
10000
12000
14000
16000
18000
20000
US
$ 0
00
China Malaysia South Africa UK US
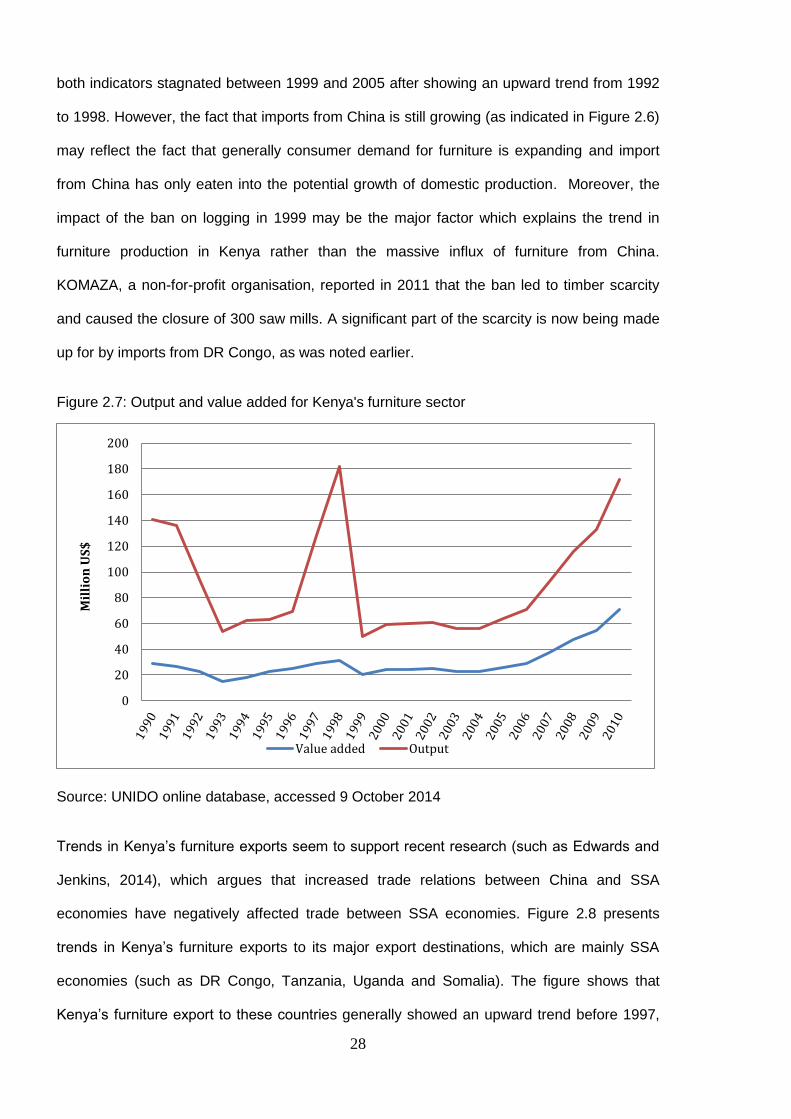
28
both indicators stagnated between 1999 and 2005 after showing an upward trend from 1992
to 1998. However, the fact that imports from China is still growing (as indicated in Figure 2.6)
may reflect the fact that generally consumer demand for furniture is expanding and import
from China has only eaten into the potential growth of domestic production. Moreover, the
impact of the ban on logging in 1999 may be the major factor which explains the trend in
furniture production in Kenya rather than the massive influx of furniture from China.
KOMAZA, a non-for-profit organisation, reported in 2011 that the ban led to timber scarcity
and caused the closure of 300 saw mills. A significant part of the scarcity is now being made
up for by imports from DR Congo, as was noted earlier.
Figure 2.7: Output and value added for Kenya's furniture sector
Source: UNIDO online database, accessed 9 October 2014
Trends in Kenya’s furniture exports seem to support recent research (such as Edwards and
Jenkins, 2014), which argues that increased trade relations between China and SSA
economies have negatively affected trade between SSA economies. Figure 2.8 presents
trends in Kenya’s furniture exports to its major export destinations, which are mainly SSA
economies (such as DR Congo, Tanzania, Uganda and Somalia). The figure shows that
Kenya’s furniture export to these countries generally showed an upward trend before 1997,
0
20
40
60
80
100
120
140
160
180
200
Mil
lio
n U
S$
Value added Output
29
but stagnated between 1997 and 2004 (and even declined in the case of Tanzania).
However, the exports to these countries have trended upward since 2005. This upward trend
coincides with the recent upsurge in production and value addition in Kenya’s furniture
manufacturing sector, which Figure 2.7 portrays. This may suggest that consumers in
Kenya’s furniture export market have also realised that made-in-Kenya furniture offers some
advantages, which may lead to higher consumer benefits than the imported furniture from
China. Again, we should be mindful that the likely impact of the ban on logging on furniture
production might have had a more significant effect on the trends in exports, compared to
any likely changes in consumer preference in the export market.
Figure 2.8: Kenya's furniture exports by major destination
Source: UN COMTRADE, accessed on 3 October 2014
2.2.4 The informal economy and employment
ILO (1972) first delineated Kenya’s informal sector, which has since attracted much interest
both in Kenya and globally. Also referred to as jua kali, which means hot sun, the informal
sector is made up of activities characterised by “ease of entry; reliance on indigenous
resources; family ownership of enterprises; small scale of operation; labour-intensive and
0
2000
4000
6000
8000
10000
12000
US
$ 0
00
Congo DR Tanzania Sudan Uganda Somalia
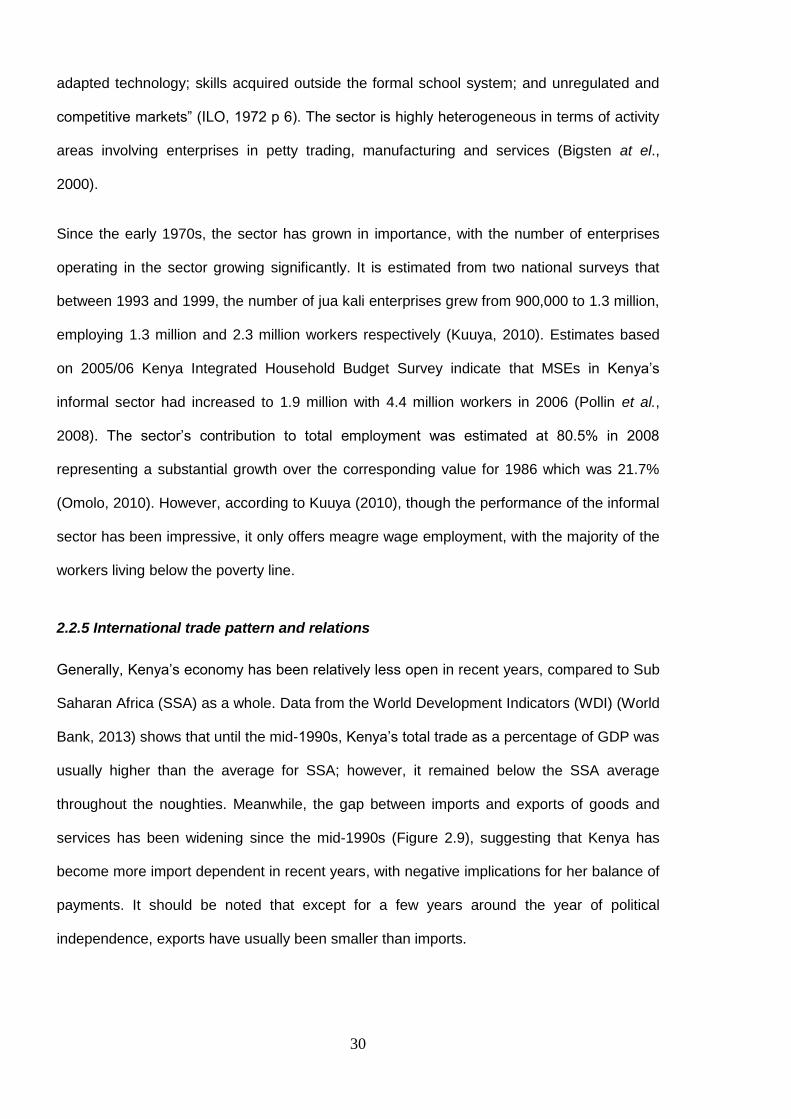
30
adapted technology; skills acquired outside the formal school system; and unregulated and
competitive markets” (ILO, 1972 p 6). The sector is highly heterogeneous in terms of activity
areas involving enterprises in petty trading, manufacturing and services (Bigsten at el.,
2000).
Since the early 1970s, the sector has grown in importance, with the number of enterprises
operating in the sector growing significantly. It is estimated from two national surveys that
between 1993 and 1999, the number of jua kali enterprises grew from 900,000 to 1.3 million,
employing 1.3 million and 2.3 million workers respectively (Kuuya, 2010). Estimates based
on 2005/06 Kenya Integrated Household Budget Survey indicate that MSEs in Kenya’s
informal sector had increased to 1.9 million with 4.4 million workers in 2006 (Pollin et al.,
2008). The sector’s contribution to total employment was estimated at 80.5% in 2008
representing a substantial growth over the corresponding value for 1986 which was 21.7%
(Omolo, 2010). However, according to Kuuya (2010), though the performance of the informal
sector has been impressive, it only offers meagre wage employment, with the majority of the
workers living below the poverty line.
2.2.5 International trade pattern and relations
Generally, Kenya’s economy has been relatively less open in recent years, compared to Sub
Saharan Africa (SSA) as a whole. Data from the World Development Indicators (WDI) (World
Bank, 2013) shows that until the mid-1990s, Kenya’s total trade as a percentage of GDP was
usually higher than the average for SSA; however, it remained below the SSA average
throughout the noughties. Meanwhile, the gap between imports and exports of goods and
services has been widening since the mid-1990s (Figure 2.9), suggesting that Kenya has
become more import dependent in recent years, with negative implications for her balance of
payments. It should be noted that except for a few years around the year of political
independence, exports have usually been smaller than imports.

31
Figure 2.9: Total imports and exports of goods and services as a percentage (%) of GDP
Source: World Development Indicators (World Bank, 2013)
Kenya’s main export products are tea, horticulture, coffee, and manufactured goods. Major
export destinations are Uganda, Tanzania, Netherlands, United Kingdom and United States
(Figure 2.10). Data from UN COMTRADE show that in 2012, Uganda, Kenya’s neighbour
emerged as the highest trading partner in terms of Kenya’s export, followed by Tanzania and
then the UK. A comparison of the values of exports to the major destinations for the different
years, shown in Figure 2.10, indicates that Kenya’s export trade is shifting away from
traditional destinations such as the UK and the Netherlands towards its neighbours (Uganda
and Tanzania). The African Economic Outlook (African Development Bank et al., 2011)
recognises this new trend, noting that nearly half of Kenya’s export (46%) in the first eight
months of 2010 went to African countries, with the main destinations being Uganda,
Tanzania, Egypt and Sudan.
0
5
10
15
20
25
30
35
40
45
50
%
Imports Exports
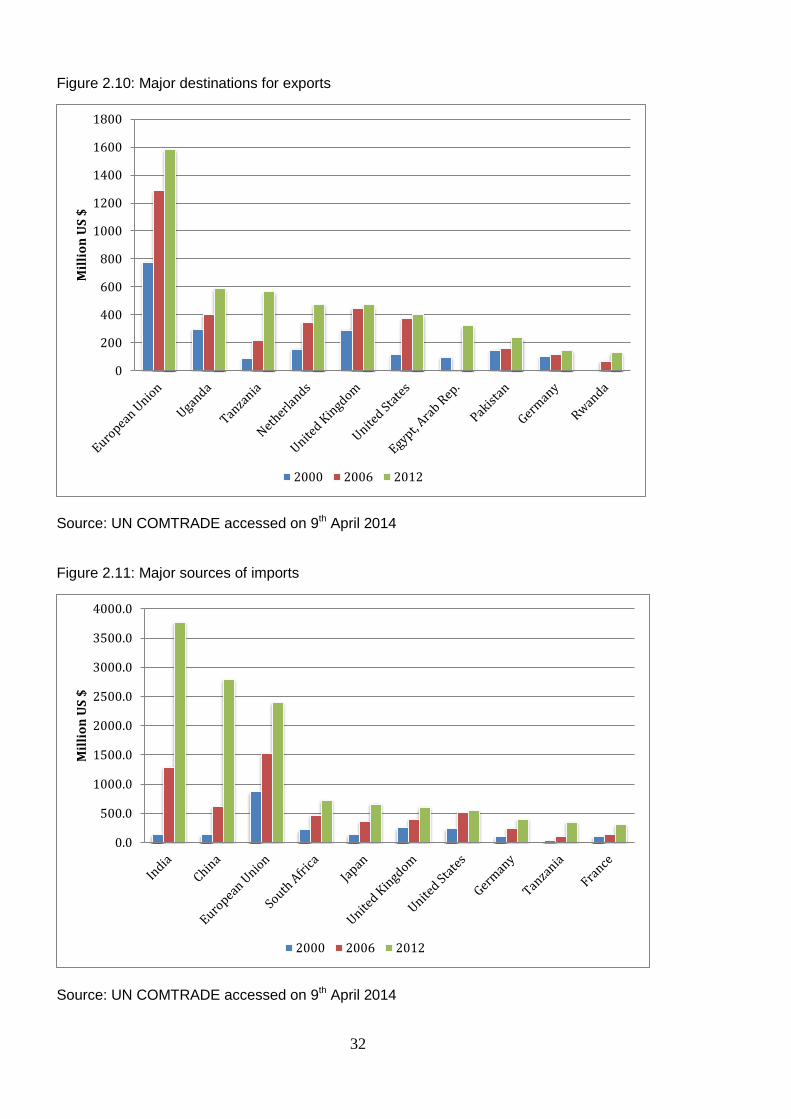
32
Figure 2.10: Major destinations for exports
Source: UN COMTRADE accessed on 9th April 2014
Figure 2.11: Major sources of imports
Source: UN COMTRADE accessed on 9th April 2014
0
200
400
600
800
1000
1200
1400
1600
1800
Mil
lio
n U
S $
2000 2006 2012
0.0
500.0
1000.0
1500.0
2000.0
2500.0
3000.0
3500.0
4000.0
Mil
lio
n U
S $
2000 2006 2012

33
Relatively, a small proportion of Kenya’s export goes to Asian Driver (AD) economies (China
and India). However, Kenya’s imports from these economies have been very substantial
especially in recent years. In 2012, the value of imports from India and China respectively
stood at US $3.77 billion and US $2.79 billion, both surpassing the value of total imports from
the European Union (EU) in that year, which was US $2.39 billion (Figure 2.11). Similar to
the trend in exports, Figure 2.11 further shows that the AD economies have taken the place
of the United States of America (USA), the UK and other advanced economies as the main
sources of Kenya’s imports.
Figure 2.12: Kenya's import of woodworking machines by major sources
Source: UN COMTRADE, accessed on 6 October 2014
The shift in Kenya’s import trade relations permeates several disaggregated import items,
particularly machinery and transportation equipment (as was emphasised in Chapter 1),
which in addition to petroleum products, iron and steel constitute Kenya’s major import items.
Figure 2.12 presents data on the trends in Kenya’s importation of woodworking machinery
from the main sources. The figure shows that the importation of woodworking machines from
China has seen substantial growth from 2002 to 2010. A similar trend can also be observed
for importation from India although the influx of Chinese woodworking machine on Kenya’s
0
500
1000
1500
2000
2500
US
$ 0
00
China UK India Germany Italy Japan

34
market starkly stands out. Importation from advanced countries particularly UK is still high
and increasing although the trends in the data clearly indicates that imports from China now
dominate Kenya’s market for woodworking machines.
2.3 Social and infrastructural development
2.3.1 Demography
Kenya’s population in 2010 was about 40.5 million people compared to 5.4 million in 1948
(Table 2.4). Unsurprisingly, the country had the fastest growing population globally in 1992
with a growth rate of 3.6 (Republic of Kenya, 2005a). The growth rate has however been
falling with recent estimate pegged at 2.4% (Central Intelligence Agency, 2012).
Table 2.4: Population data for some selected years between 1948 and 2010
Year
Total
population
Age Distribution (% of Total) Rural/Urban Dist. Female (% of
Total) 0-14 15-64 65+ Rural Urban
1948 5,400,000*
1960 8,105,435 46.4 49.9 3.7 92.6 7.4 49.8
1980 16,267,558 50.0 47.0 3.0 84.3 15.7 50.2
2000 31,253,701 44.3 52.9 2.8 80.3 19.7 50.1
2010 40,512,682 42.5 54.9 2.7 77.8 22.2 50.1
Source: World Development Indicators (World Bank, 2011) *This figure was taken from Ikiara
(1984)
The population is largely rural-based. Current estimates show that about 78% of the
population live in rural areas, down from over 92% and 82% in 1960 and 1990 respectively.
Consistent decline in the agricultural sector among other factors such as food, droughts,
nomadic lifestyles and insecurity is largely responsible for rural-urban migration, which is
high among the youth (Republic of Kenya, 2005a). The youth also constitutes a major
proportion of Kenya’s population. The median age for Kenya’s population is estimated at
18.9 years (Central Intelligence Agency, 2012). Estimates from the WDI (World Bank, 2011)
for 2010 indicate that 42.5% and 55% of the population respectively fall into 0-14 years and
15-64 years of age (Table 2.4). The high youth population together with rural-urban migration

35
can be linked to the level of unemployment problem in Kenya, which has over the decades
largely been a youth phenomenon (ILO, 1972; Omolo, 2012).
2.3.2 Poverty, inequality and unemployment
As noted earlier, Kenya achieved high economic growth in the first two decades after
independence. It has however been argued that this achievement only represented a
significant stride at the macroeconomic level in that the success did not reflect in social and
other development indicators. According to Ikiara (1984), not only did high levels of
unemployment and increasing incidence of poverty characterise the growth process but
growing inequalities, rising debt burden and slow pace of economic diversification had also
become attendant features of the economy in the 1970s. Rural and urban inequalities,
measured by the GINI coefficient, were respectively estimated at 38.2 and 51.8 in 1974
(Ikiara, 1984). Comparing these figures to what was reported for 1992 (see Table 2.5) shows
that inequality worsened in later years. Although there was a significant reduction in the
index during the 1990s, the 2005 figure presented in Table 2.5 suggests that the
improvement is being reversed.
Table 2.5: Trends in poverty and inequality
Indicator Years
1992 1994 1997 2005
Poverty headcount ratio at $2 a day (PPP) (%
of population) 59.32 53.65 42.7 67.21
Poverty headcount ratio at $1.25 a day (PPP)
(% of population) 38.42 28.5 19.57 43.37
GINI index 57.46 42.07 42.51 47.68
Income share held by the highest 10% 47.87 32.76 33.83 37.99
Income share held by the lowest 10% 1.12 2.11 2.5 1.96
Source: World Bank Development Indicators (World Bank, 2013)
Similarly, the incidence of poverty has also worsened after significant improvements in
1990s. Table 2.5 shows that the proportion of Kenya’s population living on less than US
$1.25 and US $2 a day fell substantially between 1992 and 1997 but increased substantially

36
after that period, as the 2005 figures show. As much as 43% and 67% respectively live on
less than US $1.25 and US $2 per day as of 2005. This implies that the incidence of poverty
has increased in absolute terms and relative poverty has also risen as inequality worsens.
With respect to the first goal of the Millennium Development Goals (MDGs), Kenya is said to
be off-track because a relatively high proportion of its population is still below the poverty
line: Not much has been achieved in terms of halving poverty since the MDGs were adopted
(African Development Bank et al., 2011).
Closely related to the problem of high poverty and inequality is the high levels of
unemployment, which has long been a feature of the Kenya’s economy with many socio
economic implications. The unemployment rate was officially estimated at 12.7% in 2005/06,
compared to 14.6% in 1998/99 (Wambugu et al., 2009). However, a broader definition of
unemployment, which includes those who would like to work but have given up looking for
work, indicates that the unemployment rate was 40% in 2008 (Central Intelligence Agency,
2012). Of this figure, an estimated 64% are youth (Sauder School of Business, 2009).
According to Wambugu et al. (2009), the high unemployment, particularly among the youth,
was a major factor that fuelled the post-election violence in 2008.
Associated with the high unemployment is the fact that the country’s GDP-employment
elasticity has declined from an estimate of 1.28 for 1992-1996 to 0.5 for 2004-2008 (Omolo,
2012). This means that the amount of employment created from a given percentage increase
in GDP has diminished substantially between the two periods. The implication is that
economic growth in recent years has delivered relatively limited opportunities for absorbing
the increasing number of the unemployed youth in Kenya. This trend may partly account for
the bleak and worsening poverty and inequality profile of the country in recent years.
2.3.3 Education and human resource
One likely reason for the high levels of unemployment in Kenya is the limited access of the
youth to formal education. Data from the WDI (World Bank, 2013) indicates that the literacy

37
rate among persons over 15 years old was 72% in 2007, which is 10 percentage points down
from the figure in 2000 (82%). It is also estimated that only 55% of about 600,000 pupils who
complete primary school each year are able to enter secondary schools and the number that
proceeds from secondary schools to universities greatly diminishes (Nyerere, 2009). To deal
with this problem, the government has in recent years promoted Technical, Industrial,
Vocational and Entrepreneurship Training (TIVET) to absorb the large number of people who
are not able to progress to secondary and higher level education. Special institutions such as
Youth Polytechnics, Technical Training Institutes, Institutes of Technology and National
Polytechnics run TIVET programmes in Kenya. Enrolment in these programmes increased
from 62,439 in 2003 to 76, 516 in 2007, representing 22.5% increase within that period
(Nyerere, 2009).
2.3.4 Infrastructure
Kenya has a significant infrastructural deficit, which requires a sustained expenditure of
nearly US$ 4 billion per annum for at least a decade (World Bank, 2010; Briceño-Garmendia
and Shkaratan; 2011). The available infrastructure is also not equitably distributed across the
country’s regions. With the population and agricultural activities being highly concentrated in
the southern part of the country, infrastructural development (especially road, power
transmission, and ICT) have considerably favoured the southern sector (World Bank, 2010).
Power supply remains highly unreliable because the installed power generating capacity is
limited, making electricity supply the country’s greatest infrastructural challenge (World Bank,
2010). As indicated in Table 2.6, the installed capacity is very low, over 20 times less than
the average for middle income countries (MICs) in Africa, which has translated into high
levels of power outages with high losses for firms operating in Kenya. Road density in Kenya
is also significantly less than the average for MICs in Africa although Kenya appears to be
better than its low income country (LIC) counterparts (Table 2.6).
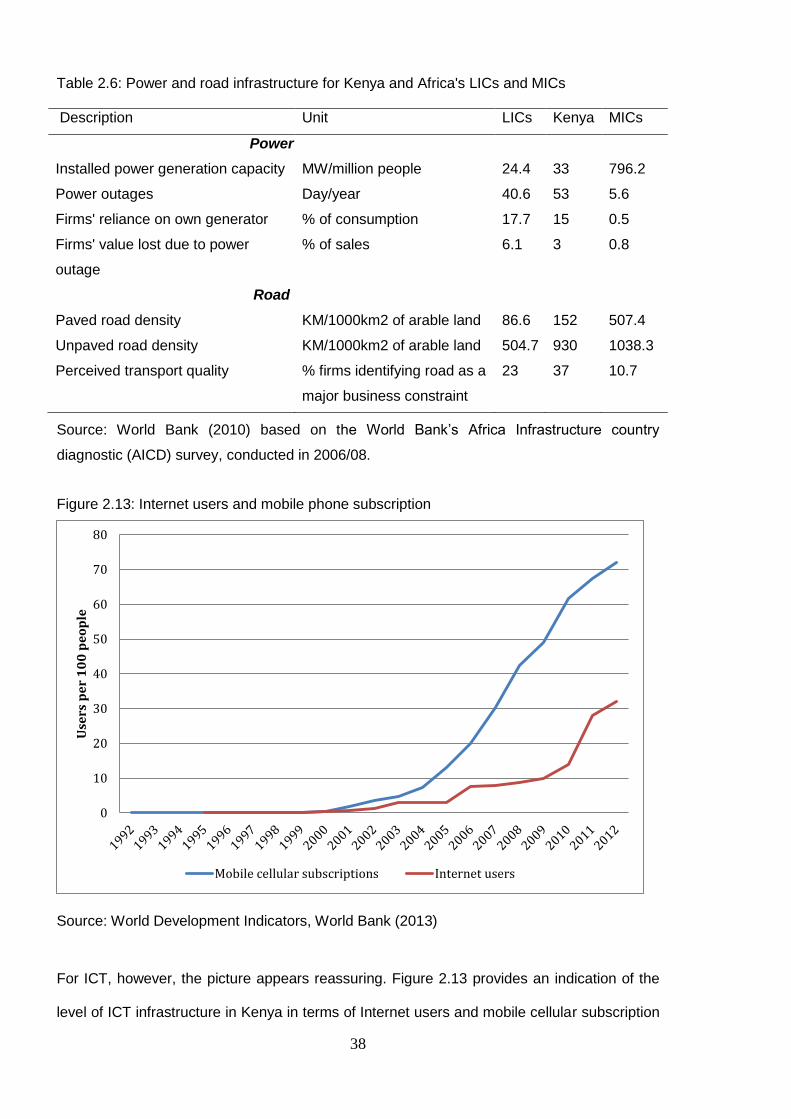
38
Table 2.6: Power and road infrastructure for Kenya and Africa's LICs and MICs
Description Unit LICs Kenya MICs
Power
Installed power generation capacity MW/million people 24.4 33 796.2
Power outages Day/year 40.6 53 5.6
Firms' reliance on own generator % of consumption 17.7 15 0.5
Firms' value lost due to power
outage
% of sales 6.1 3 0.8
Road
Paved road density KM/1000km2 of arable land 86.6 152 507.4
Unpaved road density KM/1000km2 of arable land 504.7 930 1038.3
Perceived transport quality % firms identifying road as a
major business constraint
23 37 10.7
Source: World Bank (2010) based on the World Bank’s Africa Infrastructure country
diagnostic (AICD) survey, conducted in 2006/08.
Figure 2.13: Internet users and mobile phone subscription
Source: World Development Indicators, World Bank (2013)
For ICT, however, the picture appears reassuring. Figure 2.13 provides an indication of the
level of ICT infrastructure in Kenya in terms of Internet users and mobile cellular subscription
0
10
20
30
40
50
60
70
80
Use
rs p
er
10
0 p
eo
ple
Mobile cellular subscriptions Internet users

39
per 100 people. The data show significant increases in both indicators especially mobile
cellular subscription over the last decade. Over 70% of the population have subscribed to
mobile cellular networks as of 2012, compared to less than 2% in 2001. Thirty-two percent
(32%) of the population uses the Internet, representing a substantial increase over the 2001
figure which was less than 1%.
2.4 Technology in industrial/development policies
Employment creation and poverty reduction have together constituted a major theme of
policy objectives enshrined in Kenya’s development and industrial policy documents. From
the first National Development Plan, 1966-1970 to the Economic Recovery Strategy for
Wealth and Employment Creation, 2003-2007 and Vision 2030 (First Medium Term Plan,
2008-2012), the government has sought to implement policies to fight unemployment and
extreme poverty. Industrialisation has been seen as the major means to address the main
development challenges of unemployment and extreme poverty (Ronge and Nyangito,
2000). The emphasis on industrialisation is more pronounced in the Sessional Paper No.2 of
1996 on Industrial Transformation to the Year 2020 and Kenya National Industrialisation
Policy Framework, 2011-2015 (which is anchored on the Vision 2030 – the current policy and
long-term development plan), compared to previous policy strategies such as those
prescribed in the Sessional Paper No. 10 of 1965, which appears to give prominence to both
industry and agriculture.
A major downside of the earlier policy strategies is that the level of attention given to
technology choice appears to have been limited, suggesting that little recognition has been
given to the implication of suboptimal technology choices for development. This can be seen
in the effect of the IS policy regime. In addition to the disadvantages mentioned earlier in
subsection 2.2.1, there is a belief that the IS policy largely neglected technological capability
building in micro and small enterprises while favouring large scale manufacturing firms that
used imported and relatively capital intensive technologies and were mostly established with
private foreign capital – foreign direct investment (FDI). Such FDI-based firms operate in the
40
formal sector and tend to have limited linkages with the informal sector leading to minimal
technology spill-over effects (Meilink, 1982). They also constitute a threat to indigenous
entrepreneurship especially in later stages of their development, partly explaining why
indigenous firms do not grow into large enterprise (Kabecha, 1999; Nyong’o 1988; Meilink;
1982). Accordingly, studies have shown that about a third of the micro and small enterprises
fold within three years after establishment (Kuuya, 2010).
The limited attention given to indigenous entrepreneurship, and technology and innovative
capacity development clearly reflects in the data on patent and trademark application in
Kenya (Table 2.7). The table shows that patent applications have been generally low since
independence, with most of the applications coming from non-residents. Similarly, for
trademarks, the number of applications from residents has been consistently lower than that
from non-residents since independence except for the period 2005-2010. The data in Table
2.7 therefore point to a generally low degree of innovative activities in Kenya.
Table 2.7: Patent & trademark applications and scientific & technical journal articles
Year
Scientific and
technical journal
articles
Patent application Direct trademark application
Non-residents Residents Non-resident Resident
1965-1974 114
714 170
1975-1984 99
661 424
1985-1994 275 70 8 561 415
1995-2004 251 45 24 909 608
2005-2010 260 81 45 734 1344
Note: Figures are computed averages for the specified period.
Source: Calculated from WDI, World Bank (2013).
Information presented in Table 2.8 on Kenya’s production of machinery and equipment and
the level of importations of the same items seems to confirm the belief that innovative
activities or capabilities are relatively in Kenya. For all the items presented in the table,
domestic production was considerably lower than imports for each year. For medical,
precision and optical instruments, there are no production values for Kenya in the UNIDO
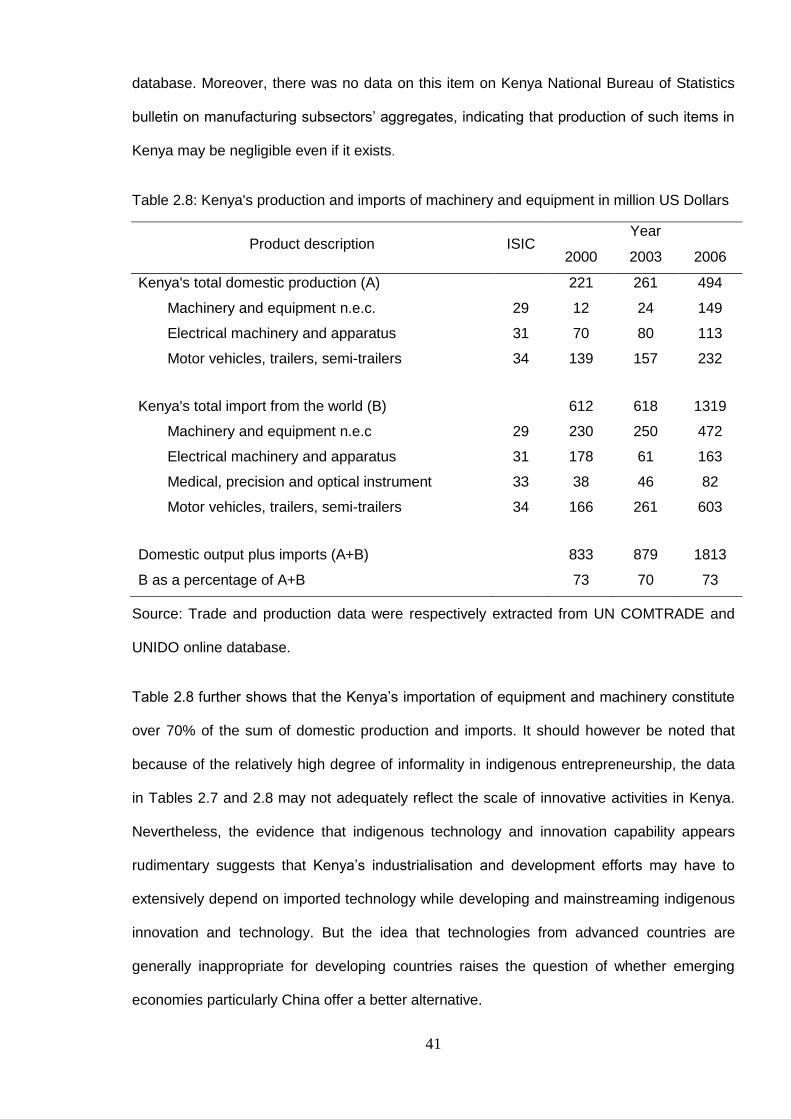
41
database. Moreover, there was no data on this item on Kenya National Bureau of Statistics
bulletin on manufacturing subsectors’ aggregates, indicating that production of such items in
Kenya may be negligible even if it exists.
Table 2.8: Kenya's production and imports of machinery and equipment in million US Dollars
Product description ISIC Year
2000 2003 2006
Kenya's total domestic production (A)
221 261 494
Machinery and equipment n.e.c. 29 12 24 149
Electrical machinery and apparatus 31 70 80 113
Motor vehicles, trailers, semi-trailers 34 139 157 232
Kenya's total import from the world (B)
612 618 1319
Machinery and equipment n.e.c 29 230 250 472
Electrical machinery and apparatus 31 178 61 163
Medical, precision and optical instrument 33 38 46 82
Motor vehicles, trailers, semi-trailers 34 166 261 603
Domestic output plus imports (A+B)
833 879 1813
B as a percentage of A+B 73 70 73
Source: Trade and production data were respectively extracted from UN COMTRADE and
UNIDO online database.
Table 2.8 further shows that the Kenya’s importation of equipment and machinery constitute
over 70% of the sum of domestic production and imports. It should however be noted that
because of the relatively high degree of informality in indigenous entrepreneurship, the data
in Tables 2.7 and 2.8 may not adequately reflect the scale of innovative activities in Kenya.
Nevertheless, the evidence that indigenous technology and innovation capability appears
rudimentary suggests that Kenya’s industrialisation and development efforts may have to
extensively depend on imported technology while developing and mainstreaming indigenous
innovation and technology. But the idea that technologies from advanced countries are
generally inappropriate for developing countries raises the question of whether emerging
economies particularly China offer a better alternative.

42
In recent years, policy has given some attention to indigenous technology and how to
harness it for development. An example is the Science, Technology and Innovation (STI)
Policy Strategy (Republic of Kenya, 2008b), which is an addendum to Kenya’s Vision 2030.
The STI strategy emphasises the need to:
Exploit the full potential of science, technology and innovation to protect, preserve, evaluate, update, add value to, and utilise the extensive indigenous resources and traditional knowledge available in the formal and informal sectors of the economy for enhanced livelihoods for various Kenyan communities (Republic of Kenya, 2008 p 33).
Unlike the IS regime, recent policy strategies also appear to recognise that the nature of
technology choice matters if industrial growth and development will create or enhance
employment opportunities in Kenya. For example, the Sessional Paper No. 2 1996 asserts
that “Kenya must be selective in acquiring its technology … the pursuit of technology that is
efficient but creates little or no employment is not appropriate” (Republic of Kenya, 1996 p
63). For technology transferred through FDI, the document notes: “the Government would
give attention to the nature and conditionalities surrounding the importation of technology”
(Republic of Kenya, 1996 p 64).
Furthermore, more recent policy documents particularly Sessional Paper No. 2 of 2005 on
Development of Micro and Small Enterprises for Wealth and Employment Creation for
Poverty Reduction has also given prominence to the development of the technological
capacity of MSEs. The goal is to enhance the ability of MSEs to adopt and adapt new
technology and to improve their access to available technology. For this category of
businesses, the government appears to have recognised the potential of technologies from
emerging economies. According to the Sessional Paper No. 2 of 2005, “…Government will
provide steady alternative sources of technological inputs into the sector [MSEs] through the
importation of relevant technologies from other countries such as India, South Korea,
Pakistan and China” (Republic of Kenya, 2005b p 30).
43
2.5 Conclusion
The above discussions show that Kenya is a low-income economy, and high levels of
extreme poverty, inequality and unemployment have characterised the economy since
political independence. Rather than improving, the unhealthy socioeconomic circumstances
appear to have worsened in recent years particularly with regards to poverty and inequality.
This undesirable state of affairs is associated with several factors such as poor economic
growth performance and major infrastructural deficits especially with respect to power supply.
Other factors include the lack of pro-poor industrialisation process and proper policy attention
to micro and small enterprise especially those operating in the informal sector, which
accounts for about 80.5% of employment in Kenya. Another important correlate of the ills has
been a political system that is not robust and fuels ethnic sentiments while conditioning the
nature of policy configuration and negatively affecting trends in socio economic development.
The discussion has also shown that indigenous technology and innovative capacity in Kenya
appears low, suggesting that the country may have to depend extensively on imported
technology while developing and mainstreaming indigenous technology. The need for
importing technology and the choice set for the sources of importation bring to the fore the
issue about the changing pattern of Kenya’s international trade relations. The new pattern is
that there is a rapidly growing trade relation with other developing or emerging economies,
particularly India and China as major sources of imports, and the neighbouring countries
such as Uganda and Tanzania as major export destinations, positions that were initially for
advanced countries.
Lastly, recent industrial and development policy appears to give relatively more attention to
technology choice, recognising the distinctive technology needs of micro and small
enterprises although in a sketchy manner. Also, the current policy environment generally
appears to have a relatively higher consideration for micro and small enterprises than what
existed earlier. The next chapter presents a review of the literature relevant to the subject
matter of this thesis.

44
CHAPTER 3 : LITERATURE REVIEW
3.0 Introduction
Despite pessimism such as those from Thomas Malthus8 and the writers of “The Limits to
Growth”9 (and more recently rejuvenated by Richard Heinberg10) about the constraints nature
places on economic development, global per capita income has seen significant increases,
particularly in the last century, thanks to technological progress. Thus, one cannot
overemphasise the role of advances in technology in mankind’s effort to overcome significant
and life-threatening challenges. But what is technology and how can it be harnessed to
overcome the persisting global challenges particularly poverty, unemployment and
inequality? With this broad question in mind, this chapter presents a review of the literature
on several issues on technology with a view of isolating concepts and facts that will provide a
conceptual or theoretical background to the empirical work used for answering the three
basic research questions raised in Chapter 1.
The chapter first explores ambiguities surrounding what the term technology is associated
with. This is followed by a discussion on the question of whether some technologies may
produce desirable socioeconomic outcomes, for example, with respect to poverty and
employment, compared to others. Hence, the discussion mainly addresses the literature on
technology choice, its associated concept of appropriate technology as well as the
determinants of technology choice. After this follows a discussion on the sources of technical
change and inducement to technical change, which among other factors represent a
rationalisation of the likelihood that inappropriate technologies may exist. The discussion
then moves into issues surrounding technology transfer and transfer mechanisms. The
8 In his book, “An Essay on the Principle of Population”, published in 1798, Malthus questioned the capacity of the
earth to allow for increasing standard of living. 9 At the instigation of the Club of Rome on its project “The Predicament of Mankind”, Meadows et al. produced a
report titled, “The Limits to Growth”, in 1972. The report laid emphasis on the earth as an ecological system having limited potential to meet the growing economic demands placed on it, hence, the need to place limits on the extent to which man exploits the gift of nature. 10
In his book titled, “The End of Growth: Adapting to the New Economic Reality”, published in 2011, Heinberg
argues that further growth in the global economy is not possible and only relative growth (i.e. growth in certain regions or countries) is possible, with the global economy playing a zero-sum game.
45
chapter ends with a summary of the salient issues and a highlight of the gap in the empirical
literature, which this thesis aims to fill.
3.1 What is technology?
The term technology has been used loosely to describe different but related concepts in the
literature to the extent that the use of the term is shrouded in ambiguities. Thus, it is not
surprising that Norman Clark, based on Cooper and Sercovitch’s (1971) work, indicated that
“…‘technology’ is not a homogenous concept but is rather a term connoting a wide range of
heterogeneous forms or ‘elements’…”(Clark, 1985 p. 183). Writing in the late 1970s,
however, Winner noted that in the decades before the time of his writing, technology had a
specific and unproblematic meaning in academic and everyday discourse, being used to
refer to “practical arts” either individually or in a collective sense and the study of them
(Winner, 1978). He further noted that this had changed at the time of his writing such that the
term had lost its precision and taken on a ubiquitous nature, leading him to assert: “There is
a tendency for those who write or talk about technology in our time to conclude that
technology is everything and everything is technology … the word has come to mean
everything and anything … [and] threatens to mean nothing” (Winner, 1978 p 9-10). In
corroborating Winner’s observation, Willoughby (1990) indicated that the last century has
seen the term expand from something of a limited meaning to one characterised as an all-
embracing symbol or concept.
The evolution of the broad meaning associated with technology, according to Winner (1978),
may have started with a definition by the 1909 Webster’s Second International unabridged
dictionary, in which technology is said to be “industrial science, the science or systematic
knowledge of the industrial art, especially of the more important manufactures” (cited in
Winner, 1978 p 8). It should however be noted that an earlier characterisation of technology
by Karl Marx was also relatively broad but to the extent that Winner did not mention it may
indicate its relative unpopularity compared to the Webster’s definition. Marx in his book,
Capital: Critiques of Political Economy, first published in 1887, said “Technology discloses

46
man’s mode of dealing with nature, the processes of production by which he sustains his life,
and thereby also lays bare the mode of formation of his social relations, and of the mental
conceptions that flow from them” (Marx, 1887 p. 326). Whomever the broad definition
originated from, by the 1950s and 1960s many writers had started propounding definitions,
which significantly extended the scope of the term. Most of those studies therefore tended to
depict technology as a concept with a meaning much greater than the hardware, machines
or individual apparatus normally associated with technology in earlier popular thinking
(Willoughby, 1990).
For example, Ellul defines technology as the “totality of methods rationally arrived at and
having absolute efficiency (for a given stage of development) in every field of human activity”
(1964 p 26). Although Ellul (1964) specifically mentioned using the above phrase to describe
technique rather than technology, his description is generally consistent with significant
aspects of definitions of technology offered by other authors such as Stewart (1982). Stewart
(1982) describes technology in a broad sense although no emphasis is explicitly placed on
the nature of efficiency as an essential condition. Stewart identifies technology not only with
the hardware of production which includes knowledge about machines and processes, but as
a concept which encapsulates the skills, knowledge and procedures for ‘making, using and
doing useful things’. For Stewart, technology includes methods used in both marketing and
non-marketing activities: production, managerial and marketing techniques; product design
and how they are produced; manufacturing, agriculture and services (e.g. administration,
education, banking and the law); and the organisation of productive units (Stewart, 1982).
Others have stressed knowledge as the main defining characteristic of technology.
MacDonald (1983) for example refers to technology as the sum of knowledge, which allows
things to be done but frequently through the use of machines (not always, though) and the
information the machines possess. In a more recent work, Mokyr starkly observes that
“Technology is knowledge” (2005 p 1120), essentially reducing the relationship between
technology and knowledge to a mathematical equality. However, Mokyr further notes that the
basic unit of analysis of technology is the technique, which he defines as the set of

47
instructions for producing goods and services, and decoupled the techniques from artefacts
or machines. In his example, a piano is an artefact; however, what one can do with it
depends on the technique the user employs, suggesting that a technique is never the same
as the artefact, which aids the deployment of the technique. Contrarily, Willoughby defines
technology as the “ensemble of artefacts intended to function as relatively efficient means”
(Willoughby, 1990 p 38). He shows that the phrase “function as relatively efficient means”
helps to avoid the tendency of equating technology to artefacts and helps to isolate artefacts
that are technological from those that are not.
Thus far, artefact-based and procedure/ technique-based definitions have been mainly
identified. Rather than being competing ways of defining technology, Dosi and Grazzi (2009)
have suggested that the latter representation in many ways complements the former and
emphasised the usefulness of the artefact-based definition in two respects: (1) it allows for
the dynamic study of innovations which takes place by improving or modifying the
performance characteristics of each component of the artefact and the whole artefact; and
(2) it helps to identify the technical and economic characteristics of specific products,
machines, components and intermediate inputs. They however acknowledge the broader
scope of the procedure-centred definition by observing that it applies even when technology
cannot be represented in the form of a tangible artefact.
The apparent ambiguity, also fuelled by semantic difficulties, led Winner (1978) to avoid any
attempt to define technology in any concrete or selected terms. Rather, he provided a
typology for the term, based on the different emphases highlighted by different writers. In his
typology, technology refers to apparatus, technique, or organisation (and even the network
between organisations). Apparatus represents all objects described as technological such as
tools, instruments, machines, appliances, weapons and gadgets, which are used for
performing a variety of activities. This description corresponds with what other writers have
referred to as artefacts. Techniques refer to the body of activities involving skills, methods,
procedures and/or routines used for accomplishing tasks. This definition closely aligns with
Stewart’s and Ellul’s conceptions about techniques discussed above. In a similar fashion to
48
Stewart, Winner represents organisations as diversities of technical, rational and productive
social arrangements; however, Winner (1978) recognises the network between different
productive units as an essential organisational form.
As a result of the lack of consensus on what technology stands for, Chapter 4, among other
things, provides an operational definition of technology as used in the empirical work of this
thesis.
3.2 Technology choice
Apart from being somewhat elusive to define, controversies have existed about the benefits
of technology for human existence and ecosystems in both academic and policy circles.
Referring to those who hold up the positives of technology as “boomsters” and their
opponents as “doomsters”, Ruttan (2001) indicates that commentators (especially those
across disciplines) on technological change have largely not agreed on its actual and
potential impacts. According to Heertje (1977 p 1-2), “some authors stress the prosperity that
technical change brings, whiles other stress its horrors … terrifying wars that modern
sophisticated weapons permit”. Broadly, however, it is within this controversy that the
concept of technology choice appears to derive its essence (Willoughby, 1990). Willoughby
indicates that technology choice “may be seen as an attempt to get beyond the simplistic
options of either uncritical acceptance or uncritical rejection of technology” (1990 p 5) and
that its use as a focus for analysis acknowledges the existence of inappropriate technologies,
around which critical issues converge. In the subsections that follow, a few of the analytical
framework for technology choice identified in the literature are reviewed, with a view to
addressing the specific elements of technology and techniques which are relevant to this
thesis’ enquiry. The subsequent discussions therefore focus on the representation of
technology and technique in the economics literature.
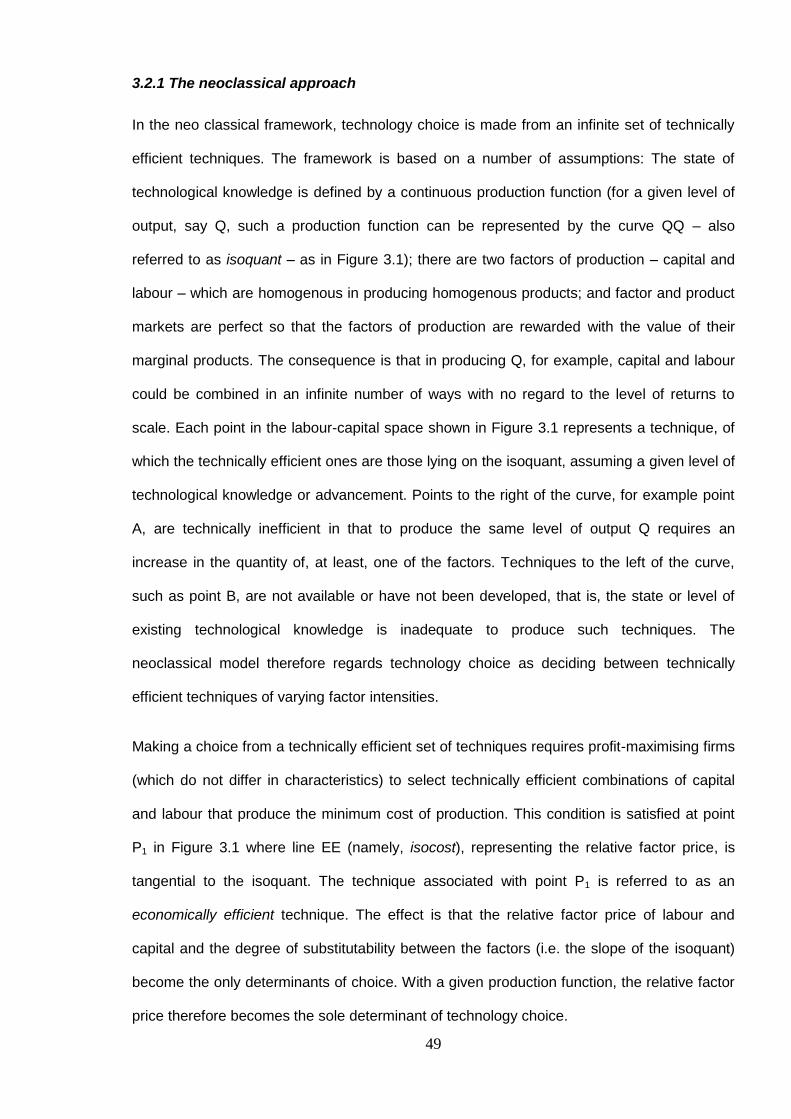
49
3.2.1 The neoclassical approach
In the neo classical framework, technology choice is made from an infinite set of technically
efficient techniques. The framework is based on a number of assumptions: The state of
technological knowledge is defined by a continuous production function (for a given level of
output, say Q, such a production function can be represented by the curve QQ – also
referred to as isoquant – as in Figure 3.1); there are two factors of production – capital and
labour – which are homogenous in producing homogenous products; and factor and product
markets are perfect so that the factors of production are rewarded with the value of their
marginal products. The consequence is that in producing Q, for example, capital and labour
could be combined in an infinite number of ways with no regard to the level of returns to
scale. Each point in the labour-capital space shown in Figure 3.1 represents a technique, of
which the technically efficient ones are those lying on the isoquant, assuming a given level of
technological knowledge or advancement. Points to the right of the curve, for example point
A, are technically inefficient in that to produce the same level of output Q requires an
increase in the quantity of, at least, one of the factors. Techniques to the left of the curve,
such as point B, are not available or have not been developed, that is, the state or level of
existing technological knowledge is inadequate to produce such techniques. The
neoclassical model therefore regards technology choice as deciding between technically
efficient techniques of varying factor intensities.
Making a choice from a technically efficient set of techniques requires profit-maximising firms
(which do not differ in characteristics) to select technically efficient combinations of capital
and labour that produce the minimum cost of production. This condition is satisfied at point
P1 in Figure 3.1 where line EE (namely, isocost), representing the relative factor price, is
tangential to the isoquant. The technique associated with point P1 is referred to as an
economically efficient technique. The effect is that the relative factor price of labour and
capital and the degree of substitutability between the factors (i.e. the slope of the isoquant)
become the only determinants of choice. With a given production function, the relative factor
price therefore becomes the sole determinant of technology choice.
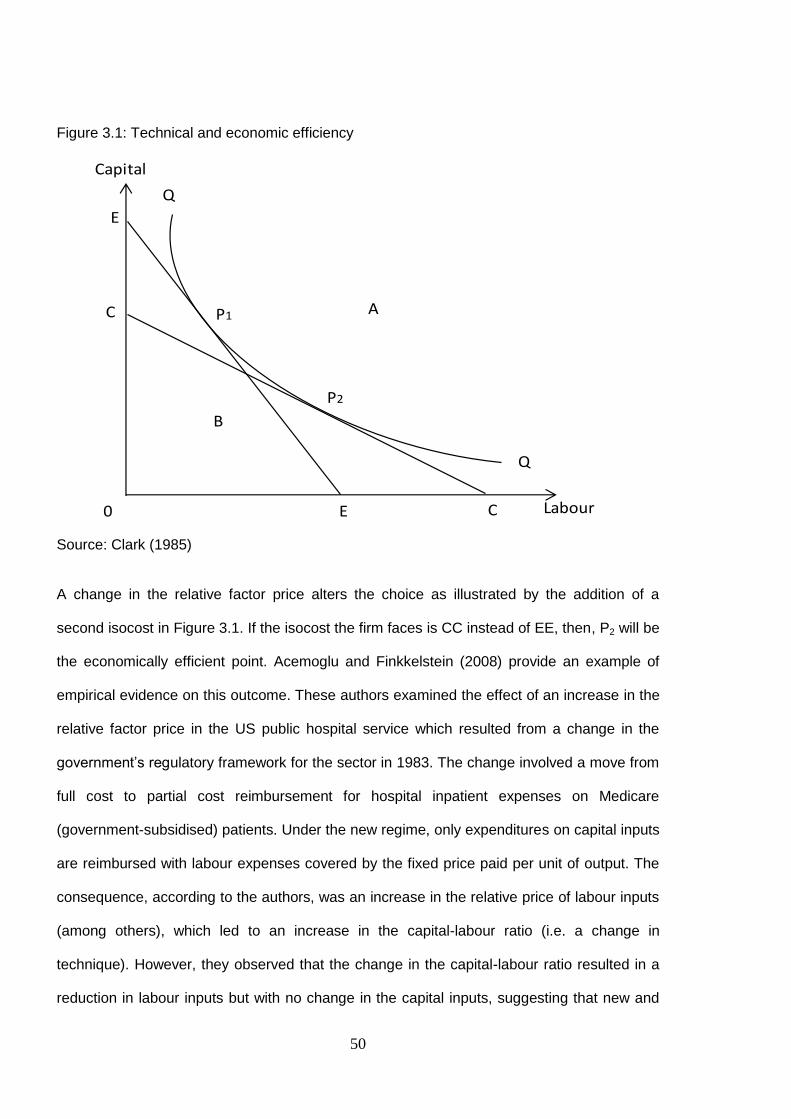
50
Figure 3.1: Technical and economic efficiency
Source: Clark (1985)
A change in the relative factor price alters the choice as illustrated by the addition of a
second isocost in Figure 3.1. If the isocost the firm faces is CC instead of EE, then, P2 will be
the economically efficient point. Acemoglu and Finkkelstein (2008) provide an example of
empirical evidence on this outcome. These authors examined the effect of an increase in the
relative factor price in the US public hospital service which resulted from a change in the
government’s regulatory framework for the sector in 1983. The change involved a move from
full cost to partial cost reimbursement for hospital inpatient expenses on Medicare
(government-subsidised) patients. Under the new regime, only expenditures on capital inputs
are reimbursed with labour expenses covered by the fixed price paid per unit of output. The
consequence, according to the authors, was an increase in the relative price of labour inputs
(among others), which led to an increase in the capital-labour ratio (i.e. a change in
technique). However, they observed that the change in the capital-labour ratio resulted in a
reduction in labour inputs but with no change in the capital inputs, suggesting that new and
Q
Q
Labour
Capital
C
C
E
E
P1
P2
A
B
0
51
more efficient technologies (capital goods) were adopted to replace labour inputs in the face
of the change in the relative price of labour. Diagrammatically, this involves a movement to a
new isoquant to the left of QQ.
An additional important implication of the outcome of the neoclassical framework is that
insofar as relative factor prices reflect factor endowment, countries with different factor
endowments will choose different techniques. That is, capital-endowed countries will select
capital-intensive techniques while labour-endowed countries will select labour-intensive
techniques (Clark, 1985).
Shortfalls of the neoclassical approach
The neo classical model has been described as a special case, which has limited relevance
in practice (Stewart, 1982). Many of the criticisms are associated with the realism of some of
the assumptions underlying the model. Some of the shortfalls are discussed in the
paragraphs that follow. While the discussion highlights these shortcomings, it also helps
unravel other factors, which in addition to relative factor price are important to understanding
the nature and outcome of a technology choice.
1. Factor prices may not be perfect in the real world, with the effect that the prevailing
relative factor price may deviate from that of the perfect competition scenario. Reasons
cited for this includes information asymmetry in factor markets, monopoly control of
resources and minimum wage legislation (Clark, 1985). For similar reasons, product
markets may also not be perfect. Moreover, with the recent trend of firms pursuing
product differentiation engineered through several marketing, advertising and branding
strategies, products themselves cannot be homogenous. The breakdown of these
assumptions compromises the economic or allocative efficiency of the choice with the
implication that developing countries, for example, may select capital-intensive
techniques in the presence of relatively high labour abundance or unemployment.

52
Another factor identified as being a culprit for distortion in relative factor price is
shirking – a moral-hazard situation where workers do less than what they agreed on
with their employers. Using empirical data on private farms, operating in Jewish
Palestine, Depken II et al. (2001) show that while shirking is a likely reason for
distorted relative factor prices, it also leads to greater labour hoarding, an evidence for
technical inefficiency. They concluded that when shirking causes allocative inefficiency,
then technical inefficiency arises endogenously as a rational response.
2. The model tends to ignore any influence that scale of production may have on choice
of techniques. Scale can lead to an important difference between the efficiency of
different techniques even if factor prices remain unchanged or are not distorted
(Stewart, 1982; Kaplinsky, 1990). Consider two techniques of different scales – A and
B – as shown in Figure 3.2. The minimum cost of A is higher than that of B. However,
an important relationship between them is that the minimum cost of B is associated
with relatively high output level (Q3) compared to that of A (Q2). For output levels less
than Q2, for example Q1, technique A produces a lower cost than technique B. This
suggests that for firms operating in smaller markets (especially those in developing
countries) technique A is economically more efficient than technique B. A recent study
by He et al. (2012) confirms that market size affects the choice of technology. In a
game theoretic framework for a duopoly, they found that an increase in market size
increases a firm’s willingness to invest in a more expensive but flexible technology that
produces differentiated products.

53
Figure 3.2: Scale of production and average cost
Source: Kaplinsky (1990)
3. Obviously, capital and labour are not the only input in production and may not be
homogenous. Other factors such as materials, energy, general infrastructure (e.g. good
roads and telecommunication network), land, semi-processed materials and services
are also important (Stewart, 1982). The homogeneity assumption also renders the
decision-making problem too simple because it “helps” to neglect the qualitative
differences within the broad categories of inputs (capital and labour) we observe in the
real world. Such differences should not be ignored although they pose empirical
difficulties in measuring or aggregating the factors of production (Robinson, 1953).
4. Moreover, the assumption of a continuous production function, which allows for an
unlimited range of efficient techniques for producing a particular product, has been
contested (Rosenberg, 1976; Nelson; 1980; Stewart, 1982). Stewart (ibid) provides a
number of reasons to justify why this does not reflect reality. First, techniques available
for selection at any point in time consist of techniques which have been developed at
different time period in the past, with earlier techniques being more labour intensive
and having less scientific and technical knowledge and relatively low technical
C3
C2
C1
Q1 Q2 Q3 Scale of production
Cost per unit of output
A
B
0

54
efficiency. Consequently, “… far from there being a complete isoquant corresponding
to each moment of time, for each scientific and technical age, … there is a series of
techniques developed at different times with a tendency for the earlier ones to become
technically inefficient” (Stewart, 1982 p 27). Second, later techniques tend to be scale
intensive and demand relatively high quality inputs; hence, it is unlikely for new and old
techniques for producing a particular output to lie on the same isoquant. Third, process
techniques vary over time with resultant products also going through systematic
changes with time; hence, later process techniques produce more efficient and higher
income products than earlier ones. The implication is therefore that techniques of
varying factor intensities that produce the same product with the same technical
efficiency may not exit in the real world. Stewart’s argument aligns with Rosenberg’s
position that “the notion of a wide range of …[techniques], as implied by the drawing of
smooth, continuous isoquants, is largely a fiction” (1976 p. 63).
5. The model is also based on an unrealistic assumption that the choice is made by only
one type of decision maker (the firm), which has the sole objective of maximising profit
(Ruttan, 2001). In reality, however, decision makers may differ in terms of motive,
knowledge (especially in the world of information asymmetry) and may face different
constraints (Stewart, 1982).
3.2.2 Stewart’s Approach
In response to the limitations of the neoclassical model, Stewart (1982) provided a theoretical
framework for analysing the determinants of technology choice. Following her definition, as
mentioned in Section 3.1, Stewart distinguished between technology available to a particular
country and technology in use in that country. Technology available to a country refers to the
body of techniques that the country potentially has knowledge about and would be able to
acquire. These techniques constitute a subset of all known techniques in the world.
Technology in use, on the other hand, consists of a subset of the available techniques the
country has acquired. A country may not have access to all known techniques in the world
55
and that is usually the result of weak communication restricting the international diffusion of
some of the world’s techniques. Another reason is that techniques may be known but they
may not be available to a country because no one is producing the machinery or other inputs
required. These two factors, according to Stewart (1982), limit the options in the technology
basket available to a country.
However, the diffusion of certain techniques may also be limited by other factors such as
institutional protection (property rights) and corporate secrecy. This omission however does
not limit the main conclusion from Stewart’s analysis, which is: “If the technology in use is
thought to be inappropriate, it may be inappropriate because world technology is
inappropriate or because inappropriate subset is available to the country or because
inappropriate selection is made or for some combination of the three reasons” (Stewart, 1982
p 3).
How the above conclusion was reached is illustrated in Figure 3.3. From the figure,
technology available to a country depends on the technology known in the whole world. The
actual technology adopted is then determined by the available set of technologies and other
factors, which constrain the selection mechanism. Each technique in the available set is
associated with a set of characteristics, which have been conditioned by historical processes
that underpin technology development. The historical processes reflect changes in the
organisation of production, income levels (and distribution) and technical factors, which vary
with time and across places. The entities which make technology choice in any given period
are not homogenous: They differ with respect to their objectives, knowledge and
circumstances relating to scale of production, market, access to finance etc. The aim of each
decision maker is to maximise an objective function, subject to some constraints (available
technology, markets, scale, factor availability and price, and other prevailing economic
conditions).

56
Figure 3.3: Technological choice process
Source: Stewarts (1982)
3.2.3 Appropriate Technology
The concept of technology choice finds meaning in the idea that some technologies may not
be appropriate, thus, the term appropriate technology, which according to Kaplinsky (2011a)
evolved as a response to the pitfalls of the neoclassical framework. Its evolution has roots in
the development philosophies of India’s Mahatma Ghandi (Akubue, 2000). However, it was
Schumacher’s seminal work “Small is beautiful”, published in 1973, that popularised the
concept and guaranteed it a place in policy and development thinking, particularly during the
1970s and a greater part of the 1980s (Kaplinsky, 1990).
With inspiration from his progenitors, particularly Ghandi, and his professional experience as
an economist advising several governments of developing countries (Willoughby, 1990;
Schumacher, 2011), Schumacher recognised that production in advanced countries was
largely driven by capital-intensive technologies that suited large-scale mass production. This
form of production, according to him and his many sympathisers (McRobie, Jequier, Stewart,
Kaplinsky, Willoughby, just to mention a few), were unsuitable for developing country
economies due to factors such as low income levels, limited market size, high unemployment
and limited infrastructure; hence, it was a major culprit for underdevelopment. To remedy this
problem, Schumacher insisted on the development and application of what he termed
intermediate technologies:
If we define the level of technology in terms of 'equipment cost per workplace', we can call the indigenous technology of a typical developing country - symbolically speaking - a £ l -technology, while that of the developed countries could be called a £1,000- technology. … If effective help is to be brought to those who need it most, a technology [a £100- technology] is required which would range in some intermediate position between the £1-technology and the £1,000- technology. … Such an intermediate
World knowntechniques
Technologyavailable to a country
Technology in use in a country
Availability
Communications
Selection mechanism
57
technology would be immensely more productive than the indigenous technology (which often in a condition of decay), but would also be immensely cheaper than the sophisticated, highly capital-intensive technology of modern industry”. (Schumacher, 1973 p 148)
The ideas of Schumacher resonated among academics and policy think tanks so much so
that appropriate technology became a movement, but with several strands, which reflect the
multiple meanings attached to the concept (Kaplinsky, 1990). A survey of the literature for
this thesis reveals various definitions, indicating that the understanding of the concept
depends on what technology stands for, but more importantly, on the connotation and/or
denotation attached to the word “appropriate”. The latter reason for the multiplicity of
meanings given to the concept spins off into three main lenses of appropriateness: social,
economic and environmental. The consequence is that appropriateness becomes relative
and shrouded in the dynamic of the political economy of the country concerned (Kaplinsky,
1990). Thus, the critical question is: whose interest or what end defines the appropriateness
of the means – technology – and the choice to be made? The subsections below present a
review of a few of the definitions and highlight the basic conceptual ideas behind the three
main strands.
Appropriate technology variously defined
In the United States Agency for International Development’s (USAID) 1976 proposal to the
US congress on appropriate technology for development in the Third World, the concept was
described as:
In terms of available resources, appropriate technologies are intensive in the use of the abundant factors, labour, economical in the use of scarce factors, capital and highly trained personnel, and intensive in the use of domestically produced inputs. In terms of small production units, appropriate technologies are small-scale but efficient, replicable in numerous units, readily operated, maintained and repaired, low-cost and accessible to low-income persons. In terms of the people who use or benefit from them, appropriate technologies seek to be compatible with local cultural and social environments. (USAID, 1976 p 11-12)
This characterisation emphasises several important objectives to which appropriate
technology should serve; however, appropriateness with respect to preserving the natural
environment appears missing. Contrarily, a definition by Harrison’s (1980) gives some room

58
for the natural environment. According to him, “appropriate technology means simply any
technology that makes the most economical use of a country’s natural resources and its
relative proportions of capital, labour and skills, and that furthers national and social goals”
(1980, p 140). Wicklein and Kachmar’s definition appears to be more concerned with the
physical environment. They see appropriate technology as that which “... seeks to aid
humans and support human ability to understand, operate and sustain technological systems
to the benefits of humans while having the least negative societal impact on communities
and the planet” (2001, p 4). However, they gave little attention to the employment and
distributional concerns, which seem quite highlighted in USAID’s definition.
Morawetz argues that appropriate technology consists of a “set of techniques which makes
optimum use of available resources in a given environment. For each process and project, it
is the technology which maximises social welfare if factors and products are shadow priced”
(1974, p 517). Like some of the definitions already mentioned, this definition tries to
incorporate the social imperativeness of an appropriate technology, however, it ignores the
idea that society is usually made of different groups of varied interest and objectives. How do
we aggregate these interests such that the powerless are well represented?
Jequier and Blanc’s (1983) definition appears more holistic but generally follow the approach
by USAID and Schumacher. According to these authors, appropriate technology is:
… the generic term for a wide range of technologies characterised by any one or several of the following characteristics: low investment cost per workplace, low capital investment per unit of output, organisational simplicity, high adaptability to a peculiar social or environment, sparing use of natural resources, low cost of final products or high potential for employment. (Jequier and Blanc, 1983 p 10)
This definition however generally associates the term with some desirable features of
technology that are favourable to a specified context. On the other hand, writers such as
Willoughby (1990) and Pellegrini (1979) have adopted a more general perspective: For
Willoughby, appropriate technology consists of “artefacts which have been tailored to
function as relatively efficient means and to fit the psychosocial and biophysical context
prevailing in a particular location and period” (1990, p 43). In Pellegrini’s view, technology is
appropriate “when its introduction into a community creates a self-reinforcing process internal

59
to the same community, which supports the growth of the local activities and the
development of indigenous capabilities as decided by the community itself” (1979, p 2).
A careful examination of the various definitions including those discussed above reveals two
main approaches to defining appropriate technology: specific-characteristics and general-
principles definitions (Willoughby, 1990). Willoughby notes that the former assigns “specific
and tangible operational criteria to the definition”, based on a preconceived notion about the
context in which the technology is applied and the desired ends. Thus, such definitions are
normative because they are based on one’s judgment about what ends are relatively more
important. Examples of such definitions are those provided by Jequier and Blanc (1983), and
USAID. The general-principles approach however suggests “no specific and tangible
content” for technology that is appropriate but stresses the general importance of the
technology being suitable for a set of circumstances. This approach therefore seeks to make
the concept of appropriate technology universal and applicable to different contexts across
nations and within nations. The implication is that “… there can be no unique appropriate
technology to fit all circumstances. The technology which is appropriate will differ according
to the nature of the country, its resources and opportunities” (Stewart and Ranis, 1990 p 4).
The definitions by Harrison, Morawetz and Willoughby are examples of the general-principles
definitions.
Underpinning the general-principles approach is the recognition in the literature that the use
of inappropriate technologies happens in developed countries also. We can observe this in
the writings of McRobie (an ardent follower of Schumacher) in his book “Small is Possible”,
published in 1981. He noted:
… the first people in rich countries to discern that they too needed something on the lines of intermediate technology were those living and working in the hinterlands of large metropolitan economies… It is characteristic of such territories that they closely resemble colonies (which produce, as someone put it what they do not consume and consume what they do not produce) … if they are to do more than merely survive with the aid of welfare payments, such communities need technologies appropriate to their resources and lifestyle. (McRobie, 1981 p 76)

60
Economic appropriateness
Economic appropriateness can be readily determined in the neoclassical framework for
technology choice (Kaplinsky, 1990): A choice is economically appropriate if the chosen
technique is technically efficient and yields the minimum cost of production given the relative
factor prices. Due to the shortcomings of this approach, as discussed earlier, additional
criteria have been suggested in the literature for economic appropriateness. These include
the scale of production, income levels or size of markets and how productive units are
organised, particularly in the context of developing countries (Stewarts, 1982; Kaplinsky,
1990; Bhala, 1981).
Following Schumacher, the above authors argue that most production techniques developed
in advanced countries are relatively large in relation to developing countries’ market size. In
many developing countries, much of production is at a relatively low scale and operated by
family owned enterprises with little division of labour and specialisation. In developed
countries, however, production has gone through several phases of development with
current production techniques having a high degree of division of labour, specialisation and
capital intensity. Techniques developed to suit a particular type of organisation, say family
owned enterprise in developing countries, may be incompatible with organisational forms in
advanced countries and vice versa. It is therefore argued that because of the small size of
markets in developing countries, the use of techniques from advanced countries lead to
excess capacity and tends to promote monopolies with limited employment potential.
Social appropriateness
The main argument here is that a technology should not conflict with the social objectives of
the nation or community it is meant for but rather promote it. This was one of the major
concerns of the USAID 1976 report to the US Congress on appropriate technology
mentioned earlier. The idea of social appropriateness as enshrined in the USAID report has
been expanded to incorporate social life in a more comprehensive manner, as captured by

61
Reddy (1979) (cited in Kaplinsky, 1990). According to Reddy, a technique is socially
appropriate if it satisfies the following criteria:
A preference for technologies which will enhance the quality of life, rather than merely
lead to an increase in the consumption of goods.
A preference for production technologies, which demands creative work that satisfies,
rather than boring routine labour.
A preference for production technologies in which machines are subordinated to,
rather than dominate the lives of people.
A preference for technologies based on communal, rather than individual use of
goods and services.
A preference for technologies which blend with, rather than disrupt traditional
technologies and the fabric of social order.
A preference for technologies which increase, rather than diminish the possibility and
effectiveness of social participation and control.
A preference for technologies, which facilitate the devolution of power to the people,
rather than its concentration in the hands of elites.
Environmental appropriateness
An appropriate technology should have limited negative environmental externalities. That is,
technologies adopted should not be those which lead to environmental degradation, but
those that help conserve the gift of nature, allowing for its sustainable use. For example,
using the environmental criterion, solar energy technology may be preferred to hydro-power
technology in countries with tropical climates. For developing countries, environmental
appropriateness of a technology is largely captured in Schumacher’s words:
The technology of mass production is inherently violent, ecologically damaging, self-defeating in terms of non-renewable resources, and stultifying for the human person. The technology of production by the masses, making use of the best of modern knowledge and experience, is conducive to decentralisation, compatible with the laws of ecology, gentle in its use of scarce resources, and designed to serve the human person instead of making him the servant of machines (Schumacher, 1973 p 127).

62
Schumacher makes a clear distinction between the environmental impact of large-scale
production technology, which underpinned mass production in advanced countries and
hardly serves the needs of the masses, and small-scale production technologies used by the
masses and for the masses. As noted earlier, Schumacher referred to the latter as
intermediate which, according him, “… is vastly superior to the primitive technology of
bygone ages but at the same time much simpler, cheaper, and freer than the super-
technology of the rich” (1973 p 127).
The environmental criterion for appropriateness is not only about mass productions, which
was a major concern of Schumacher. It has been argued that technology should also reflect
the climatic conditions of the country or area for which it is developed or applied (Stewarts,
1982). Stewart argues that the reason is that climatic conditions (temperature, humidity, and
season) vary significantly across places, resulting in differences in natural vegetation and
patterns of production and consumption.
Criticism of appropriate technology
The appropriate technology approach/movement met opposition from several critics,
particularly Eckaus (1955) and Emmanuel (1982). Eckaus’s challenge was that the idea
about the existence of a set of efficient techniques from which an appropriate choice could
be made was a mirage. Instead, at any point in time, there is only one efficient technique,
which is usually capital intensive mainly because global division of labour in R&D has been
extremely skewed towards advanced countries where the technologies were produced.
Emmanuel corroborated Eckaus’s assertion and further indicated that the efficient techniques
are predominantly available to multinational companies. Coincidentally, the success of
appropriate technology as a development strategy has been limited: Its influence started
dwindling from the mid-1980s, with the above shortcoming being cited as one of the reasons
for its failure (Kaplinsky, 1990).
However, several empirical studies have provided evidence contrary to Echaus’s assertion.
For example, Cooper et al. (1981a) studied production technologies for can making in Kenya,

63
Tanzania and Thailand and found that more than one efficient technique existed for
producing cans in these countries, some of which were relatively old and labour intensive
techniques. Similarly, with data on block making techniques in Kenya, Stewart (1982) also
demonstrated the existence of more than one efficient technique. By comparing old
machines (most of which were second hand) with new machines used in the UK’s textile
industry, Pack (1981) also showed that the old machines offer efficient labour-intensive
alternatives. Consequently, Kaplinsky (2009) argues that the much more likely reason for the
failure of appropriate technology strategy was its reliance on Mode I innovation paradigm11
rather those found in Eckaus’s assertion. Mode I is used to connote an innovation system
that specifies a linear relationship between science, invention and innovation, with these
activities mainly carried out in universities, and research and technology organisations
(RTOs) (Gibbons et. al., 1994). Kaplinsky (2011b) further makes the allusion that the
negative effect of this innovation paradigm was to make appropriate technology unattractive
to profit seeking organisations, with its diffusion mainly occurring through acts of charity
rather than the market.
Largely based on mode I type of innovation, the appropriate technology (AT) movement,
however, unintendedly contributed to unravelling the problem in the neoclassical analysis of
technical progress. This contribution is embedded in the argument of the AT proponents that
the demand and consumption patterns in advanced economies had led to the development
of large-scale production technologies. The neo classicists however view technology as
manna from heaven and technical change as a function of processes that are exogenous to
the production/economic system. Also worth mentioning in respect of other significant
contributions to the above recognition is the seminal work by Singer et al. (1969), an
influential policy document that was named The Sussex Manifesto. Also based on Mode I
innovation, the manifesto came to challenge the then widely accepted trend, where research
11
Mode I innovation is contrasted with Mode II (a newer paradigm), of which innovation, in simple terms, is thought to result from the interactions or nonlinear relationship between actors and processes in the generation and application of knowledge (Gibbons et al., 1994). Mode II emphasises user-producer interactions especially
the role of users in the innovation process (Pavitt, 1984; Kaplinsky, 2009). In relation to this, von Hippel in his book “Demcratising Innovation” places much emphasis on users’ and consumers’ ability to innovate and the supremacy of such innovations: “Users that innovate can develop exactly what they want, rather than relying on manufacturers to act as their (often very imperfect) agents” (von Hippel, 2005 p 1).
64
for technological innovations were mainly conducted in advanced countries and were grossly
transferred to developing countries (Ely and Bell, 2009). Hence, it recognised the importance
of technology to be developed from within the social, economic and political environment of
its users, inadvertently suggesting that technical progress should be viewed as resulting from
endogenous processes. Section 3.3 discusses the sources of technical change and the
theory of induced innovation, which provide further rationale for technical change being
endogenous.
3.2.4 Inclusive Innovation
Much in the spirit behind the development of appropriate technology concept, a new concept
called “inclusive innovation” has emerged. Innovation is described as any useful new means
or end that could be technological or non-technological. The non-technological aspect of
innovation represents one way by which inclusive innovation departs from appropriate
technology concept, which just focuses on technology. This new concept largely emerged
after 2011 although it has been implicitly given attention in academia for a number of years
(Heeks et al., 2013). Terminologies such as “below the radar innovations” which can be
found in the work by Kaplinsky et al. (2009), “grassroot innovation”, written about by Verma
et al. (2004), Seyfang and Smith (2007) and “frugal innovation” have also existed, attempting
to describe almost the same idea (Heeks et al. 2013).
Although it is new and relatively amorphous, several authors such as George et al. (2012)
Chataway et al. (2013), Foster and Heeks (2014), Heeks et al. (2013) and Kaplinsky (2013)
have attempted to delineate inclusive innovation as a development concept. In Kaplinsky’s
words:
Inclusive innovations may be new to the sector, new to a country or new to the world and may involve a variety of excluded populations. These innovations may foster inclusion in production, in consumption, in the innovation process itself and by promoting the agency of the excluded. They may also contribute to environmental and social sustainability. (Kaplinsky, 2013)
The basic element of inclusive innovation that can be gleaned from the above definition and
also emphasised in other studies mentioned above is that innovation should provide the

65
excluded with access to consumption and production of goods and services. Similarly,
Cozzens and Sutz (2012) argue that an innovation is inclusive if the process of achieving it,
and the problems it is intended to address and the solutions are inclusive.
It is believed that inclusive innovation as a development strategy provides a way by which
the unhealthy co-existence of high economic growth and growing poverty levels that has
occurred globally over the last two decades could be addressed (Chataway et. al., 2013).
3.3 Sources of technical change
An understanding of the sources of technical change can help rationalise the existence of
inappropriate technologies (and innovations that are not inclusive) and emphasise the need
for choices which favour technologies that are inclusive or appropriate. Attempts in the
literature to understand these sources have led to the development of concepts (or theories)
such as induced innovation/technical change and path dependence.
3.3.1 Induced technical change and biases in technical change
Induced technical change as a theory holds that market demand plays a key role in the
advancement of technical knowledge, thus, demand is a major driving force behind technical
change. This argument proceeds as follows:
…demand for technical change in the form of product and process innovations is derived from the demand for commodities; the demand for inventive activities including research and development is derived from the demand for technical change; and the demand for advances in scientific knowledge is in turn derived from the demand for inventive activities. (Thirtle and Ruttan, 1987 p 8)
The above view challenges the initial belief that supply factors in the form of activities
originating from basic science, which generate scientific knowledge determine advances in
technology and in a linear fashion – the mode I type of innovation process. This belief in the
supply factors is based on the assumption that the market is able to passively absorb all the
innovations or technical change (Crespi, 2004). Other studies, however, emphasise the
important role of both demand and supply and their interactions, highlighting a nonlinear
relationship between science, invention, innovation and production (Nowery and Rosenberg,

66
1979; Walsh, 1984; Kline and Rosenberg, 1986; Popp, 2002; von Hippel, 1994, 2005). The
emphasis on the nonlinearity can be seen in Kline and Rosenberg’s words:
Models that depict innovation as a smooth, well-behaved linear process badly misspecify the nature and direction of the causal factors at work. Innovation is complex, uncertain, somewhat disorderly, and subject to changes of many sorts. … The process of innovation must be viewed as a series of changes in a complete system not only of hardware, but also of market environment, production facilities and knowledge, and social context of the innovation organisation. (Kline and Rosenberg, 1986 p 275)
The nonlinearity and the importance of demand factors stress the fact that rather than
technology being a given, changes in the economic environment matter for advances in
technology, hence, technology is not like manna from heaven, contradicting the neo
classicists’ and early growth theorists’ conceptualisation. Based on a review of the work of
many writers, including empirical studies (such as Hicks, 1932; Griliches, 1957; Schmookler,
1962, 1966; and Vernon, 1979), Ruttan shows that market demand is an important factor
determining the supply of knowledge and technology although supply factors can never be
ignored.
In the search for empirical evidence to support the hypothesis that the demand factors are
important, Schmookler (1966) analysed the relationship between patented capital goods
invention and investment in the US and found a significant positive association. Scherer
(1982) revisited Schmookler’s analysis with improved data and confirmed the relationship
although he found a relatively less strong association. Geroski and Waters (1995) also found
innovative activities at the macro level tend to be pro-cyclical and that variations in economic
activity (in other words, aggregate demand) granger cause innovations. Accordingly,
Kaplinsky (2011a) suggests that demand factors make less surprising the observation that
high income markets tend to stimulate technical change in favour of quality and
differentiation while in low income markets consumers would usually want to trade quality
and differentiation for lower prices.
In addition to demand, factor prices and several other economic factors are also important in
the theory of induced technical change. As Binswanger has indicated, models of induced
67
technical change represent “… an attempt to discover the roles played by factor prices,
goods prices, and other economic variables in determining the rate and direction of technical
change” (1978 p 13). The direction of technical change indicates whether the new
technologies favour the production of certain goods and services, as Kaplinsky (2011a)
argues, and/or exhibit biases in the use of the factors of productions. For the latter case,
technical change is said to be bias if new technologies (techniques) in comparison with the
old techniques tend to economise on the use of a factor of production relative to the other
factors.
Figure 3.4, which is based on the same assumptions underpinning Figure 3.1, illustrates the
concept of factor biased technical change. It should be noted however that all the four
isoquants in Figure 3.4 represent the same level of a homogenous output, that is, output is
fixed and hence the different isoquants respectively represent different states of
technological knowledge where I1, I2 and I3 are new technologies superior to I0. Moreover,
factor prices are constant, hence, the movement from isocost PP to P’P’ represents resource
savings rather than being the results of increases in the factor prices by similar proportions.
The initial equilibrium before any technical change occurs is at point A. If a new technology
results in a new equilibrium at point B on isoquant I1, then technical change brings about
equal proportionate savings in both factors. Note that the capital-labour ratio, represented by
the slope of the line 0k0, is the same for the two equilibria. This condition is referred to as the
neutrality of technical change, of which the above specific form12 is attributed to Hicks (1932),
as indicated by many writers such as Thirtle and Ruttan (1987) and Barro and Sala-i-Martin
(1995).
Bias in technical change is defined with reference to the neutrality scenario. For example, if
the new equilibrium occurs at point C, then technical change is labour saving while it is
capital saving if the new equilibrium is at point D. The capital-labour ratio at point C,
measured by the slope of the line 0k1, is higher than that at point B, suggesting that the
12
Other types of neutrality of technical change are also found in the literature. These include Harold neutrality and Solow neutrality. Readers interested in these other forms should see Barro and Sala-i-Martin (1995). For the present purpose, which is to illustrate the existence of biases, the discussion on Hicks neutrality suffices.

68
technical change led to a reduction in the amount of labour units required for producing the
output. Conversely, the capital-labour ratio at point D will be lower than at point B, indicating
that the new technology is capital saving.
Figure 3.4: Neutrality and bias of technical change with constant factor prices
Source: Thirtle and Ruttan (1987)
The implication of biases in technical change for income distribution and employment is
obvious. For example, technical change that is labour saving increases unemployment while
redistributing income from labour to owners of capital. Bias in technical change in itself can
also produce changes in relative factor price in favour of the factor that received the positive
bias of the technical change by increasing the demand for that factor, further worsening the
income redistribution effect (Acemoglu, 2001, 2002; Krugman, 2012a, 2012b). Krugman
(2012a) shows that the increasing use of robots in production in recent years has shifted
income away from labour to capital in the US.
Interestingly, and as alluded to earlier, an important aspect of the theory of induced technical
change is the emphasis placed on the impact of changes in factor prices. Academic interest
A
B
C
D
Labour
Capital
0 C' A' P'
P'
P
P
k0
k1
I0
I3
I2
I1
69
in the effect of factor prices on technical change began with Hicks (1932), who indicated that
“A change in relative prices of the factors of production is itself a spur to invention, and to
invention of a particular kind – directed to economising the use of a factor which has become
relatively expensive” (p 124-5, cited in Acemoglu (2002 p 784)). Fellner (1961) and Kennedy
(1964) theoretically formalised Hicks’ ideas. The implication of this theory is that factor
endowments, which determine movements in relative factor price, can be responsible for the
direction or bias in technical change (Ruttan, 2001). In other words, if a particular factor of
production (say, labour) has become or is expected to become relatively more expensive or
scarce, then this will lead to labour-saving technical change, as shown in the empirical
example by Acemoglu and Finkkelstein (2008) mentioned earlier in Section 3.2.1.
Many other studies also provide empirical tests for technical change that results from
changes in relative factor prices. Examples are Hayami and Ruttan (1970), Binswanger
(1974), Cain and Paterson (1986), Kawagoe et al. (1986), Clark and Youngblood (1992),
Lambert and Shonkwiler (1995), and Liu and Shumway (2003). Mainly relying on time series
data, most of these studies have found the data to be highly consistent with induced
technical change. Using 1880-1960 aggregate data from US and Japan, Hayami and Ruttan
(ibid) regressed the log of factor ratios on the log of factor price ratio and provided strong
evidence for the existence of induced technical change. Similarly, Cain and Paterson (ibid)
found the presence of biased technical change in US manufacturing data which occurred as
a response to factor price movements. Liu and Shumway (ibid) also found evidence for
induced technical change at the regional level but not at the national level using time series
data from the US. Contrarily, Clark and Youngblood’s (ibid) study found little evidence for
induced technical change for central Canadian agriculture using time series data, concluding
that technical change had been neutral.
However, it should be noted that changes in relative factor prices can result in two effects:
factor substitution and technical change which may be neutral or biased. According to Thirtle
and Ruttan (1987), Hicks’s (1932) definition of induced innovation sought to distinguish factor
substitution from technical change; however, confusion about the theory of induced technical

70
change is as a result of the fact that it is conceptually difficult to untangle the two effects of
changes in relative factor prices. Thirtle and Ruttan (ibid) argue that the confusion stems
from the fact the theoretical distinction between factor substitution that occurs along a given
isoquant and technical progress represented by a shift in the isoquant is “… a poor
description of a more complex reality …” (1987, p 20). Nelson (1980) suggests that the
distinction presupposes the idea that learning and doing are two different activities, which
does not reflect reality because technical change at the firm level may require investment in
research and development and learning-by-doing. This problem reflects the empirical
difficulties in estimating factor-price induced technical changes as discussed in Oniki (2000).
The literature also indicates several other economic factors which underpin induced
innovation process. Acemoglu (2001, 2002; 2007) analyses the effect of market size on
biases in technical change. He draws a distinction between market size effect and price
effect: The latter encourages innovations directed at scarce factors; however, the former
leads to technical change that favours abundant factors. Acemoglu’s analyses suggest that
the relative strength of these two effects depends on the elasticity of substitution between the
factors, indicating that “When the elasticity of substitution is low, scarce factors command
much higher price and the price effect is relatively more powerful” (Acemoglu, 2002 p 783).
On the other hand, a sufficiently large elasticity of substitution can produce induced bias in
technical change towards the factor that has become more abundant, finally leading to an
increase in the reward to that factor. He used this result to explain why there was an
increasing wage premium for college graduates in the post-war US economy although the
relative supply of skills in the US increased rapidly over the same period.
3.3.2 Path dependence
Kaplinsky (2011a) treats path dependence as another reason for induced technical change,
though Ruttan (2001) treats it as an independent source of technical change in general.
From whichever perspective, the main import is that technical change may be path-
dependent, that is, the nature of existing technologies (in use) determines the direction or

71
features of the next generation of technologies. As explained in Ruttan (ibid), this happens as
a result of the limited reversibility of investment, economies of scale associated with highly
accepted innovations and the fact that technical change may have to produce outcomes that
are compatible with existing systems.
These factors leading to path dependence can cause inefficient technologies to be
introduced and become successful or lock-in. Studies by David (1985, 1986; 1997) on the
typewriter keyboard provides an example of how an inefficient technology (QWERTY
typewriter keyboard technology in his studies) can be developed and become widely
adopted, as a result of the factors influencing path dependence. By similar logic, path
dependence can explain the existence of inappropriate technologies (Kaplinsky, 2011a). This
issue becomes crucial if technologies developed in one place, say advanced countries, are
being transferred to and applied in other contexts, say developing countries.
3.4 Determinants of technology choice/ adoption
Daniels and Robles (1992) argue that technology choice occurs in a multivariate setting
where many factors at the country and industry level as well as product and innovation
specific variables are important and this viewpoint is supported by the discussions presented
in this chapter thus far. As was noted earlier, the neoclassical model of technology choice
places emphasis on relative factor price (and/ or factor endowment) and the extent of factor
substitutability. Stewart’s framework for technology choice discussed in Section 3.2.2
highlighted other important factors such as the heterogeneous nature of firms and scale
factors. In this section, the determinants of a firm’s technology choice are further discussed
with the aim of providing more details on how firm characteristics and other factors such as
macro and meso policies or regulatory environment may affect a firm’s decision to adopt a
technology. The characteristics of the technology, which are also important determinants of
choice, are not given attention in this subsection since those factors featured prominently in
the discussions in all the preceding sections in this chapter.
72
3.4.1 Firms’ characteristics and target market
In reality, firms are not homogenous but may differ in many ways. They may differ with
respect to their objectives, size, knowledge about available technologies, resources available
to the firm, which include material inputs, labour of various skills, and capital equipment
(Stewart, 1982, 1987; and Stewart and Ranis, 1990). For example, a government-owned
corporation may have other aims apart from profit maximisation (e.g. employment expansion)
compared to a locally owned public enterprise, and this may have implications for technology
choice (Stewart, 1982). Thus, the characteristics of firms may influence technology choice
since firms are not homogenous in reality.
Many other studies including empirical work point to the fact that firms’ heterogeneity has
important implications for technology choice. Using empirical data on looms for cotton textile
weaving in Korea, Rhee and Westphal (1977) found evidence that firm characteristics (such
as size, ownership and location) have implications for the choice between semi-automatic
and automatic loom technologies and between domestic looms and imported looms. A recent
empirical study by Bertschek et al. (2013) on German firms also confirms that firms’
heterogeneity can lead to different technology choice. Brandt and Zhu (2005) used survey
data on 250 firms in Shanghai and found that a firm’s attributes such as age, size and human
capital influence its technical capacity, which in turn affects the firm’s decision to adopt a
technology or not. Brandt and Zhu’s study further shows that among firms with the same
technical capacity, the ones with better access to cheap bank credit are more likely to
embark on larger technology projects and invest more in imported equipment from
technologically advanced countries. Similarly, with an empirical analysis based on data from
five Latin American countries, Hasan and Sheldon (2013) confirm that firms face credit
constraints in technology adoption.
Negri and Brooks (1990) examined the determinants of farmers’ choice between two
irrigation technologies with a national cross sectional data on farms in the US by relating the
probability of choosing the technologies to the physical and economic attributes of the farms.
73
They found that size had a significant and differing impact on the selection of the two
irrigation technologies, although soil characteristics of the farm appear to dwarf the impact of
all other factors for the two technologies including size. Moreno and Sunding (2005)
examined how a farm characteristics and technology characteristics affect the adoption of
irrigation technology in a nested logit model, using data from Kern County in California. Their
results indicated that farm characteristics affect technology choice. Although these studies
were on farms rather than manufacturing firms, they show that the characteristics of the unit
for which the technology choice is made influence the choice outcome or that the
characteristics of the unit making the choice influence the outcome.
Much earlier studies on technology adoption (such as Ryan and Cross, 1950; Griliches,
1957; and Mansfield, 1961) showed that the extent of contact between users and potential
adopters of a technology has a major influence on the potential adopters’ choice in favour of
that technology. While these earlier studies’ main focus was to explore the rate of diffusion of
innovations, the factors they identified to influence diffusion inherently underpins technology
choice or adoption (at the micro level) by firms. Other studies on diffusion such as Salter
(1960), Davies (1979) and Karshenas and Stoneman, (1993) have also emphasised the
importance of firm heterogeneity particularly with respect to factors such as the firms’ age,
size, capital vintage, corporate status and R&D expenditure. It has also been recognised that
firms may also differ in terms of their access to a fixed critical input needed for a technology
(Ireland and Stoneman, 1985; Fundenberg and Tirole, 1985). Moreover, strategic
interactions between firms are also important for adoption behaviour (Reinganum, 1981;
Quirmbach, 1986).
Many other studies have also emphasised the importance of a firm’s size as a determinant of
technology choice. Hannan and McDowell (1984) studied factors which influence banks’
adoption of ATM technology and found that larger banks had a higher probability of adopting
ATM technology, all things being equal. Dorfman (1987) suggested that firm size plays a key
and positive role in the level of innovative activities of firms, an argument that Hall and Khan
(2003) believe is applicable to the adoption of a new technology.

74
The discussion thus far shows that firms’ size, which is related to scale and the degree of the
firm’s market power, is important for technology choice or adoption. Reasons given in the
literature include: (1) large size allows for appropriating the benefits of scale economies
given that the new technologies may be scale-enhancing (Hannan and McDowell, 1984;
Dofman, 1987), (2) the possible differences in managerial attitudes and risk exposure for
firms of different sizes (Hannan and McDowell, 1984). However, Hall and Khan (2003) note
that large size and market power can negatively affect a firm’s adoption decision because
larger firms tend to have sophisticated bureaucracies that may also slow down the adoption
decision.
Other factors that may affect a firm’s adoption of technology include the target market of the
firm, which may also be considered as an attribute of the firm. Daniels and Robles (1992)
examined the relationship between export commitment of textile firms in Peru and their
adoption of capital-intensive technologies. These authors found a positive relationship, for
which their explanation was that exporters appear to be more concerned with product quality
perceptions and reliable delivery outcomes. Stewart (1987) also argues the nature of
markets (with regards to size, industry and type) that a firm faces also affect technology
choice. By “type” of market, she referred to the various segment of the consuming market
that a firms produces for, which could be high-income or low-income market on one hand
and local or international markets on the other hand. She however noted “… the market is
also a variable that can be changed by the activities of the firms” (Stewart, 1987 p 6).
Relatedly, a study by Hall and Khan (2003) suggests that a secure customer base for a firm
may positively affect its technology adoption decisions. Similarly, in a study on the adoption
of CNC machines by firms in the auto component supply industry in the US, Helper (1995)
found that a firm’s relationship with customers (a form of guarantee for future demand)
influences the firms’ choice in favour of the CNC machines.
75
3.4.2 Government policy/regulation and macroeconomic conditions
The external environment of a firm influences its technology choice although the actual
decision usually takes place at micro level (i.e. by the firms) (Stewart, 1987). Government
may directly intervene in particular investment decisions on technology as well as indirectly
influence the technology choice of micro units (or firms) by using macro and meso policies to
alter the external environment within which the firm operates (Stewart, 1987; Stewart and
Ranis, 1990).
According to Stewart (1987), the macro-policies that may affect firms’ technology choice
range from those that are geared towards major economic aggregates such as money supply
and credit creation, interest rates, budget deficits and trade protection to policies that
influence technology supply and market access. Meso policies are however concerned with
the distributional and sectorial implications of macro policies and are also used as a tool to
influence technology choice (Stewart and Ranis, 1990). Based on the results from many
empirical studies, Stewart and Ranis (1990) show how macro and meso policies indirectly
affect firms’ technology choice through their impact on the firms’ objectives, resource
availability and cost, markets in which they operate, and technology availability. For example,
government policies to increase interest rate will lead to an increase in the cost of borrowing
to finance machine acquisition while government-subsidised credit facility for investment in
farm machinery, for example, may encourage farmers to invests more in mechanisation
techniques.
Other empirical studies that have found a significant influence of the regulatory environment
on technology choice or adoption include Hannan and McDowell (1984) and Gray and
Shadbegian (1998). Hannan and McDowell’s study shows that the regulatory environment for
banks affects their decision to adopt a technology. In Gray and Shadbegian’s study, they
found that technology choice by firms in the US paper and pulp industry was affected by
changes in environmental regulations that took place in the US between the 1970s and
1980s.

76
Government policy and regulations cannot be overemphasised but also important is nature of
the macroeconomic environment, which is in part conditioned by government policies. For
example and as noted earlier, a firm’s access to finance is critical for technology choice;
however, credit constraint at the micro level is also embedded or conditioned by the
dynamics within the aggregate financial system, of which the neoclassical framework for
technology choice pays no attention to. Interestingly, studies such as Hicks (1969) and
Bencivenga et al. (1995) showed that the behaviour of financial markets can affect the
equilibrium choice of technology. Hicks (ibid) argued that it was the financial revolution in the
first half of the 18th century Britain that paved the way for the industrial revolution, which
started in the second half of that century, and that the latter revolution did not happen merely
due to the advent of newly discovered technologies. He observed that a highly significant
part of the technical innovations associated with the industrial revolution had already existed
before the start of the industrial revolution. However, they were not in use because they
required large-scale illiquid capital investments, which were unattractive because well-
functioning financial markets were absent. According to him, England by the 1750s had
developed financial markets, which would support the adoption of technologies with high
sunk cost. Bencivenga et al (1995) formally examined the theoretical implications of Hicks’
observation in an overlapping generations model with production and shows how the cost of
financial market transactions affect the set of technologies in use and the equilibrium growth
rate of the economy.
Munro (1989) places much emphasis on the importance of macroeconomic conditions on
technology choice. He argues that “… the whole gamut of macro economic structures are
relevant to the choice of techniques” (1989 p 22). His study on Bhutan found that
macroeconomic and environmental conditions of Bhutan have important implications for
technology choice and that labour intensive technologies generally deemed appropriate for
developing country were inappropriate in the context of Bhutan.

77
3.5 Technology transfer/diffusion
Largely, technology transfer and technology diffusion have been used interchangeably in the
literature and definitions of technology transfer often embody the term “diffusion”
(Ramanathan, undated). For example, Grosse (1996) defines technology transfer as the
diffusion of a technology from the place of its introduction to another. Eneh (2010) however
shows a subtle but an important difference between the two concepts. He refers to
technology diffusion as the spread of technology for general use and application within a
given social system while technology transfer involves specific and intended processes
occurring between the transferor and the transferee. Along similar lines, Nichols (undated)
argues that technology transfer involves communication between a specific donor and a
specific recipient or group of recipients while in the case of diffusion the donor may not be
aware of whom the recipient may be. Hameri (1996) and Ramanathan (undated) have
sharpened the distinction: transfer involves a proactive process and presupposes
agreements unlike diffusion, which occurs in a passive manner.
Both transfer and diffusion concepts may also assume an international character when
technology is transferred or diffused beyond national borders. For example,
Papaconstantinou et al (1996) in their attempt to study the diffusion process of embodied
technology in selected OECD countries distinguish between diffusion across industries and
that across countries. Similarly, Teece (1977) classified technology transfer into domestic
and international types.
3.5.1 Technology transfer types and the mechanisms of transfer
Having emerged in the late 1960s, this subject has received much attention especially in
academic circles; hence, the literature on the subject is vast and varied (Contractor and
Sagafi-Nejad, 1981). Technology transfer can either be vertical or horizontal, as discussed in
Mansfield (1975) and Grosse (1996). Souder (1987) refers to the former as internal
technology transfer and the latter as external technology transfer.

78
Vertical technology transfer occurs when knowledge from basic science is used in applied
research and that from applied research results in product development and finally
production (Mansfield, 1975). Mansfield further notes that the transmission of information
from basic science through production may not be linear and unidirectional, thus, information
may also flow in the reverse order. Amsden (1989) and Habibie (1990) provide additional
insight by indicating that in the context of developing countries, vertical technology transfer
start or should start from production and move backward to research. Moreover, the nature
of the information may be changing as it moves along each dimension or across each unit
within the transfer process (Mansfield, 1975). The process by which the famous US hybrid
corn technology13 was developed and applied for commercial maize production encapsulates
the idea of vertical technology transfer. The hybrid corn was developed in the laboratory of
the Iowa State Agricultural Experiment Station in 1928 and was later adopted by the majority
of corn growers in Iowa. Another but more recent example is how the study of genetics has
led to the introduction of genetically modified food crops.
Horizontal technology transfer, on the other hand, involves transferring a technology used in
a place, organisation or context for use in another place, organisation or context (Mansfield,
1975). The type of technology transfer which occurs when multinational corporations set up
subsidiaries in foreign countries is a specific form of horizontal technology transfer. A study
by Noisi and Zhegu (2010) provides a good example of this type of technology transfer within
the commercial aircraft manufacturing industry. They showed that commercial aircraft
manufacturing technologies from their places of origin (Western Europe and North America)
have been transferred to newly industrialising countries such as Brazil, Russia, India and
China (BRICs). They further noted that these new entrants into the aircraft manufacturing
industries are doing so well that the North American and Western European industries risk
losing their dominance to their developing countries’ counterparts.
Both vertical and horizontal transfers incite much inquiry. However, by following the
objectives of this study, the rest of this subsection focuses on horizontal transfer of
13
Details on the hybrid corn technology are provided in Ruttan (2001) and Ryan and Cross (1943)

79
technology. Analysing mainly from the perspective of firms, particularly multinational
companies (MNCs), a strand of the literature on horizontal technology transfer has focused
on the transfer process and the effectiveness of the transfer. Examples are the work by Al-
Ghailani and Moor (1995), Djeflat (1988), Godkin (1988), Kumar (1995), Dahlman and
Westphal (1981), Mockler (1995), just to mention a few. Another set of the literature has
however concentrated on the mode (or mechanism) of the transfer and factors determining
the choice of a particular transfer mode. This thesis focuses on the latter set of the literature,
of which the survey for this thesis shows that the mode of technology transfer can take
several forms, depending on the governance structure between the transferor and the
transferee (Contractor and Sagafi-Nejad, 1981; Grosse, 1996; Steenhuis and de Bruijn,
2005; Chen, 2005). Generally, the transfer can take place through arm’s length market/trade,
direct investment and more generally through the network forms between firms, which may
be global in the case of international technology transfer.
Arm’s length market
Arm’s length market as a mode of transfer involves a firm selling a product, process or skill to
another (Grosse, 1996). For transfer across international borders, the arm’s length
arrangement involves importation or more generally trade. Many studies therefore consider
trade as a mode of technology transfer (examples include Saggi, 2002; Das, 2000; Groizard,
2002; Mayanja 2003; Le, 2008; de la Tour et al., 2011), which is generally synonymous with
the arm’s length market mode.
Trade in both consumption and capital goods can serve as a means of technology transfer
because domestic firms get the opportunity to absorb technological knowledge embodied in
the imported goods (Saggi, 2004; Hoekman et al., 2004). The literature however shows that
trade in capital goods that are used for the manufacture of consumer and intermediate goods
produce higher benefits than trade in consumption goods (Saggi, 2004; Xu and Wang, 1999).
Kim (1991) showed that capital goods importation served as a major channel for technology
transfer from Japan, the US and other advanced economies to Korea between the 1960s

80
and 1980s, with the imports from these sources increasing significantly throughout that
period. A more recent study by Munemo (2013) also provides empirical evidence supporting
the idea that trade in capital goods serves as a significant technology transfer channel. Using
trade flow data from UN COMTRADE, the author found that increases in SSA countries’
importation of capital goods from China enhances economic growth in Africa, advocating for
trade liberalisation policies that attract Chinese capital goods on a non-preferential basis. By
examining trends in capital goods importation from China to other developing countries, a
report by UNCTAD (2012) has also emphasised the importance of technology transfer
element of this trade flow.
For other forms of technology (aside from equipment and machinery or artefacts), that is,
technology items such as process techniques, patents, trade secret and industrial designs,
the transfer usually involves licensing agreements between the buyer and the seller of the
technology item. Chen (2005) however suggests that even where licensing is used, it is not
the only market arrangement through which the technology can be transferred but represents
only one option under market based governance structures underpinning technology
transfer. He argues that the transferor or technology developer and the recipient (or
transferee) may have complementary capabilities in the sense that marketing the final
product (manufactured by the transferee) may provide opportunity for the transferor to also
market its technology as if it were a separate product. In this way, the two parties can carry
out co-marketing to customers and at the same time establish an arm’s length relationship
between them.
Though not emphasised by Chen, an important concept underpinning co-marketing
relationships is modularity – a characterisation for a functional unit of an embodied
technology that is capable of maintaining its intrinsic properties with no regard to what is
connected to (Noisi and Zhegu, 2010). Modularity therefore allows a component of a product
to be produced by a firm other than the producer of the final product.
81
An alternative to co-marketing pointed out by Chen (2005) is for the firms to engage in
contractual manufacture, where the transferor buys back the output of the transferee in a
market transaction without any resort to licensing contracts. According to Chen, “Unless all
these market arrangements have failed simultaneously, it is unnecessary to internalise
technology development and product manufacture within the same hierarchical
establishment through direct investment” (2005 p 232).
Direct investment
In addition to arm’s length market arrangement, internalisation theory of the firm with its
focus on transaction cost analysis suggests that technology transfer can take place within a
firm through direct investment (including foreign direct investment in the case of international
technology transfer) where the transferor establishes a subsidiary. Many studies such as
Contractor (1984), Anderson and Gatignon (1986), Gatignon and Anderson (1988), Chen et
al. (2001), Rugman and Verbeke (2003) and Niosi and Zhegu (2010) have emphasised direct
investment as an important entry mode for firms seeking opportunities in foreign markets and
at the same time transferring technologies to those markets.
Network modes and GVC governance structures
The arm’s length market/trade and direct investment were the modes initially emphasised in
the literature. For example, Contractor’s (1984) examination of the factors influencing mode
of transfer only focused on the choice between licensing (an example of arm’s length trade)
and direct investment. A major difference between these two modes relates to the degree of
control exercised by the transferor over the transferee. At one extreme of the spectrum (of
control) is licensing, which involves very little or no control, and at the other extreme is direct
investment, representing absolute control. In other words, the governance structure between
the transferor and transferee is what delineates the different modes of transfer (Saliola and
Zanfei, 2007). Between these extremes are hybrid forms of governance relationship, defining
other modes of transfer such as joint venture and crossing licensing (Anderson and
Gatignon, 1986; Hernnat; 1988; Chen; 2005; Eneh, 2010).

82
The role of the governance structure between the transferor and transferee in defining the
different modes of transfer has been emphasised in the global value chain (GVC) framework.
A GVC is a value chain14 whose various links are fragmented over different parts of the
world. Gereffi et al. (2005) identifies five GVC governance types – hierarchy, captive,
relational, modular and market. These different structures reflect the varying degrees of
“explicit coordination” and “power asymmetry” between the firms that are participating in the
different links and sub links within the chains. Characterised by a high degree of explicit
coordination and power asymmetry, hierarchy structures involve vertical integration through
direct investment, thus, hierarchy is synonymous direct investment channel discussed
earlier. For captive structures, suppliers in the chain become dependent on lead firms, who
monitor and control their activities while a relational structure is usually characterised by a
high degree of mutual dependence and asset specificity. In the case of modular structures,
the suppliers in the chain make products to customer’s specification, taking responsibility for
technology usage and investment. The market structure involves arm’s length relationship,
as described earlier, with very low explicit coordination and power asymmetry. Though it is
arm’s length, Gereffi et al. (2005) indicate that repeat purchases are not ruled out.
After the seminal work of Gereffi et al., more recent studies (e.g. Palit, 2006; Saliola and
Zanfei, 2007; Brach and Kappel; 2009; Pietrobelli and Rabellotti, 2011) have specifically
attempted to understand international technology transfer mechanism using the governance
structure in GVC framework, as outlined above. Saliola and Zanfei (2007) suggest that all the
types of governance structures correspond with different modes by which international
technology transfer can occur. Brach and Kappel (2009) show that long term contracts and
subcontracting within global value chains have emerged as important forms of transnational
cooperation, hence, as important channels for technology transfer. They indicate that for
non-OECD countries these channels are critically important since such countries attract
14
Kaplinsky and Morris describe a value chain as “…the full range of activities which are required to bring a product or service from conception, through the different phases of production (involving a combination of physical transformation and the input of various producer services), delivery to final consumers, and final disposal after use” (2001 p 4). Production for example forms a link within the chain and each link within the chain may also have sub-links.

83
limited amount of foreign direct investment and undertake little to no original research and
development. Pietrobelli and Rabellotti (2011) corroborate this observation by noting that
participating in GVC is important for small firms, operating in developing countries because it
provides “…crucial means of obtaining information on the type and quality of products and
technologies required by global markets and of gaining access to those markets” (2011, p
1262). In Niosi and Zhegu’s (2010) study, they provide empirical evidence on GVCs as a
major channel for the transfer of commercial aircraft manufacturing technology from North
America and Western Europe to the BRICs.
Other modes of transfer
In addition to the modes already discussed, other modes of transfer can be identified in the
literature. These include migration, franchising, turnkey projects, technical consultancy and
official development assistance between nations (Jafarieth, 2001; and Buckley, 1985; Kim,
1991). Thus, a thorough survey of the literature reveals many different modes of transfer,
which are partly due to the existence of a variety of technology forms, as discussed earlier in
Section 3.1. For specific forms of technology, therefore, some of the modes discussed may
not apply. Unsurprisingly, Maskus (2004) suggests that the bulk of technology transfer mainly
occurs through FDI, trade and licensing contracts.
3.5.2 Choosing a mode of technology transfer
Dating back to the work of writers such as Mansfield (1975), Teece (1977), Contractor and
Sagafi-Nejad (1981) and Contractor (1984), the literature shows that the primary
determinants of the choice of a transfer mode are the cost associated with the technology
transfer and the degree of appropriability of the proprietary advantage associated with the
technology at the destination. Rather than referring to the royalty costs or rents that must be
incurred merely to gain access to the technology, Teece (1977) defined transfer cost as the
cost of transmitting and absorbing all of the relevant disembodied knowledge, that may either
be associated with embodied technology or may represent the entire transfer object.
Appropriability involves the extent to which the transferor can maximise and extract the

84
returns including any likely monopoly rents (Contractor, 1984). Contractor further indicates
that the corporate choice amounts to a comparison of the risk-adjusted net present values of
the income stream realisable from a destination under the various modes applicable.
The transfer cost and returns are in turn determined by many factors relating to the
characteristics or type of technology, the characteristics of the firms (transferor and
transferee) involved, the characteristics of the industry, the characteristics of countries of
both the transferor and transferee with respect to government policies, markets, and
economic, political and cultural conditions in general (Caves, 1971; Davies, 1977; Contractor
1984; Davidson and McFetridge, 1985; Grosse, 1996, Teece 1977). For example, Davidson
and McFetridge (1985) suggest that internal transfer mechanisms through direct investment
may be preferred to arm’s length market transaction if the technology being transferred is
new with limited transfer history and the parties involved have little or no experience in
similar transactions. With regards to GVC governance modes, Gereffi et al. (2005)
specifically mentioned three factors – the complexity of transactions, ability to codify
transactions and the capabilities in the supply base – as the determinants of the choice or
the evolution of a particular governance mode.
3.6 Conclusion
The discussion in this chapter began with a review of the various meanings given to the term
technology in the literature. It has been shown that technology can stand for an artefact, a
technique (or a process), a form of organisation and the network between organisations.
The chapter also reviewed theories on technology choice, of which emphases were placed
on the neoclassical theory and an approach from Stewart, with the discussion addressing the
concept of appropriate technology. Another significant aspect of the literature review has to
do with the theory of induced technical change which emphasises the need to view technical
change as the outcome of endogenous processes within a given economic system, hence,
biases in technical change can occur as a response to the nature of demand, factor
endowments and other socioeconomic factors. Other major points that can be gleaned from

85
the review is that while relative factor price is an important determinants of technology
choice, there are other important factors such as scale, income levels, who is making the
choice, the type of product or service to be produced with the technology, infrastructure, and
the nature of final (consumer) market. These factors are crucial to the extent that they can
lead to the selection of inappropriate technologies although efficient and appropriate ones
may exist. Such choices could lead to a development trajectory that is not “inclusive”, as
pointed out by the literature on inclusive innovation.
The review has also shown that technology transfer can occur through a multiple of channels
such as arm’s length trade or licensing, direct investment and the network structures that
characterise value chains. The selection of a transfer mode depends on the characteristics of
the technology being transferred, the characteristics of the transferor and transferee, and
also the socio-economic and political conditions in the transferor’s and the transferee’s
environment (nations in case of international technology transfer).
It should be noted that none of the studies cited in the review specifically focused on the
transfer of technologies including capital goods (machinery and equipment) from China to
Sub Saharan Africa and the appropriateness of such technologies in relation to those from
advanced countries. Moreover, the empirical work on appropriate technology reviewed is old,
with most of the data dating back to the 1960s and 1970s. Meanwhile, a lot may have
changed as a result of incremental innovations and the fact that innovations are conditioned
by demand factors, which are dynamic in nature. This thesis aims to contribute to filling this
gap in the literature by using recent field data from furniture manufacturing firms in Kenya.
The next chapter presents a conceptual framework guiding the empirical analyses in this
thesis. Given that the term technology has various meanings, the Chapter provides an
operational definition for technology as used in the empirical work for this thesis. The chapter
also discusses the research approach adopted, how the data were collected, and the
sampling procedure used for selecting the study participants.

86
CHAPTER 4 : METHODOLOGY
4.0 Introduction
This chapter discusses the conceptual framework and the research method employed for
collecting and analysing the empirical data. The conceptual framework draws on ideas from
the literature reviewed in Chapter 3. The research method adopted is a combination of both
qualitative and quantitative approaches to data collection and analyses. The principles of
pragmatism provide the philosophical anchor for the research approach adopted in this
study. As a reminder, this research approach was used to find answers to the following
research questions:
1. How distinctive are Chinese technologies used in Kenya furniture making industry
with respect to their technical and economic/social characteristics?
2. How are the Chinese technologies transferred from China to the Kenyan firms
compared to the advanced country technologies?
3. To what extent have the firms adopted the Chinese technologies, compared to those
from advanced countries and Kenya and what factors influence adoption across the
firms?
Due to the ambiguities surrounding the meaning of technology, as discussed in Chapter 3,
this chapter first provides an operational definition for technology before presenting the
conceptual framework used in this thesis, followed by the discussions on the research
method, the justifications for studying furniture manufacturing in Kenya and then the
challenges encountered in the data collection exercise.
4.1 Operational definition of technology
As the last chapter showed, technology can refer to many different things, making it
important to provide an operational definition which helps narrow the focus of the study. In
this regard, technology in this study refers to equipment or machines and the technological
knowledge embodied in them. Primarily, the definition adopted is artefact based. However,

87
equipment or machines used in production to some extent may be associated with a specific
process technique. In other words, the adoption of a process technique may require
investment in specific types of equipment and vice versa.
In this study, however, I focus on the artefact aspect of technology without trying to
disentangle the impacts of the types of technology (which are defined in terms of the sources
of the artefacts – China, advanced countries and Kenya) on the process techniques used by
the firms. This is because I do not expect that for a specific type of machines or artefacts, the
different sources would lead to significant variations in the process techniques of the firms. A
rationale for this is that the machines from China and Kenya are developed mainly through
reverse engineering of similar machines from advanced countries. This however does not
rule out possible differences in some of the technical and economic characteristics of the
machines such as cost, scale and quality. Such differences may be the result of cost
innovation underpinned by factors such as demand, factor endowment and technological
path dependence that determine the direction of technical change as discussed in Chapter 3.
I therefore start on the premise that if there are major differences in the process technology
used by the firms, then that may be attributed to other factors or the differences in the level of
investment in other aspects of the firms’ technological capabilities and not the type (sources)
of technology (artefacts) used.
4.2 Conceptual framework
By using the literature reviewed in Chapter 3 as a guide, this section presents a conceptual
framework that is used to help answer the three research questions and to examine the
development implications of the findings. Figure 4.1 diagrammatically depicts the framework.
Indicated in the figure are the likely determinants of technology choice, the extent of
penetration or diffusion (which is shown in the figure as the aggregate level of adoption) and
the transfer mode. The factors influencing technology choice can be grouped into five
categories: the characteristics of the decision maker (the firm); the characteristics of the

88
technology; the nature of final markets; government policies; and macroeconomic conditions
that may affect the operations of the firms.
The diagram shows the three types of technology studied in this research (Chinese, Kenyan
and advanced country technologies). Chinese and advanced country technologies are
imported while that from Kenya is indigenous. An oval has been placed around the Chinese
and advanced country technologies in the figure to indicate that they are imported. Advanced
country technology generally referred to machines from any of the member states of the
Organisation of Economic Cooperation and Development (OECD). It should be noted that
while this research focuses on these three technology types, the framework could easily
accommodate other types of technology, whether it is a single country or a group of
countries. The Chinese technology is compared to these other two sources mainly because
of the following two reasons: The first is that my preliminary field observation indicated that
these sources or technology types appear to dominate Kenya’s furniture making industry and
the second was the need to limit the scope of the study to a manageable degree.
The figure also shows that the factors which influence technology choice can also determine
the choice of a transfer mode, that is, whether a technology is transferred through arm’s
length market, direct investment or through the transferee’s participation in the global value
chain (that is, governed GVC structures) or any form of network between firms such as joint
venture. Conceptually, these factors can influence the choice of a transfer mode in two main
ways: They can directly affect the choice of a transfer mode or indirectly through the choice
of technology. A decision maker may think about these factors in the relation to the
technology options and the various transfer modes simultaneously, in which case these
factors have direct impact on the choice of the transfer mode. On the other hand, another
decision maker may first decide on the technology after which he/she will decide on the
mode or channel to use. In this case, the technology choice mediates the factors and the
choice of the transfer mode.

89
Figure 4.1: Conceptual framework
Source: Author
Firm characteristics (e.g. age, sector and size)
Characteristics of tech.• Cost• Scale• Availability• Infrastructure• Quality & durability • Functionality• Factor intensities
Nature of final market
Government policies
Macroeconomic conditions (e.g. interest rates& nature of financial markets)
Chinese
Tech..
Advancedcountry Tech.
• Arm's length market
• Network
• Directinvestment
Employment
Barrier to entry
Nature of output (price vs quality)
Income dist.
Poverty reduction
Aggregate level of adoption
Factors influencing choice
Choice of technology
Mode of transfer
Developmentoutcomes
Kenya Tech.
90
While the choice of technology may influence the choice of the mode of transfer, it should be
noted that the availability or accessibility of a particular mode may also influence technology
choice, as indicated by the two arrows pointing back to the technology choice in the diagram.
Thus, there could be an endogenous relationship between technology choice and the choice
of transfer mode. This is true for instances where the decision maker thinks simultaneously
about the technology options and the transfer modes. The reason for the endogenous effect
is that the nonexistence or inaccessibility of a transfer mode may make certain technologies
unattractive for some of the firms. In the case where the decision making process is largely
linear and unidirectional, the endogenous effect of the transfer mode on technology choice
may not exist.
In terms of development implications, the chosen technology with its characteristics may
directly influence development outcomes such as employment, income distribution and
poverty reduction as indicated in the diagram. At the same time, the choice of technology
may indirectly affect development outcomes through the mode of transfer used. This is
because the choice of technology, as noted earlier, may determine the mode of transfer
selected while each mode of transfer may independently lead to different development
outcomes.
If we make allowance for choices or decision making to be carried out in more than one time
horizon (i.e. inter-temporal choice process), then, the resulting development outcomes of
choices, say, in the first period may affect the choices in the second period via government
policies/programmes. Another likely channel for such feedback effect is the firm’s social
responsibility programmes if they are built into the firm’s technology choice. For example, in
order to create more employment a firm may choose to use labour intensive technologies
particularly if such technologies are not less efficient than capital intensive ones available.
This study does not intend to examine choice or decision making in more than one time
horizon, and hence, the dynamic relationship between choice and the development
outcomes. The reason is that the data requirement for such exercise is demanding. One

91
would need to collect panel data spanning at least several time horizons, an exercise limited
by the time constraint on my PhD work, where fieldwork was limited to just about one year.
The study therefore focuses on one time horizon, relying on a cross sectional data, which is
indicated by the broken lines in the diagram.
The factors affecting firms’ choice will essentially determine the extent of diffusion or the
aggregate adoption of a technology within the industry. The framework highlights the
aggregate level of adoption because it indicates the extent to which the use of a particular
technology is affecting aggregate development outcomes. For example, if it is found that the
Chinese technologies are distinctive and produce desirable development outcomes, then the
level of adoption will inform us about the potential aggregate development impact within the
industry. It therefore gives additional insight into the findings obtained from whether a firm
has adopted the Chinese technology or not and why. If very few firms use the technology
that produces the desirable development outcomes then that may prompt policies to
encourage the adoption of that technology.
It should be mentioned in respect of the above conceptual framework that the intention is not
to quantitatively test any hypotheses in this research based on the framework. The main
purpose is to use it as a signpost for guiding data collection and analysis, and to help make
meaning out of relationships between the concepts or variables that are embedded in the
data. Thus, the logic of inquiry, a terminology used by Blaikie (2000) and adopted by Potter
(2006), for this study is largely inductive rather than that based on hypothetico-deduction.
The next section describes the broad research approach adopted for the study.
4.3 Research Approach (The mixed methods research)
Many research approaches have emerged so much so that inquirers have many choices, of
which three broad examples are qualitative, quantitative and mixed methods approaches
(Creswell, 2003). Creswell further notes that the most recent among these three is the mixed
methods approach, which is “… still developing in form and substance” (2003 p. 3).
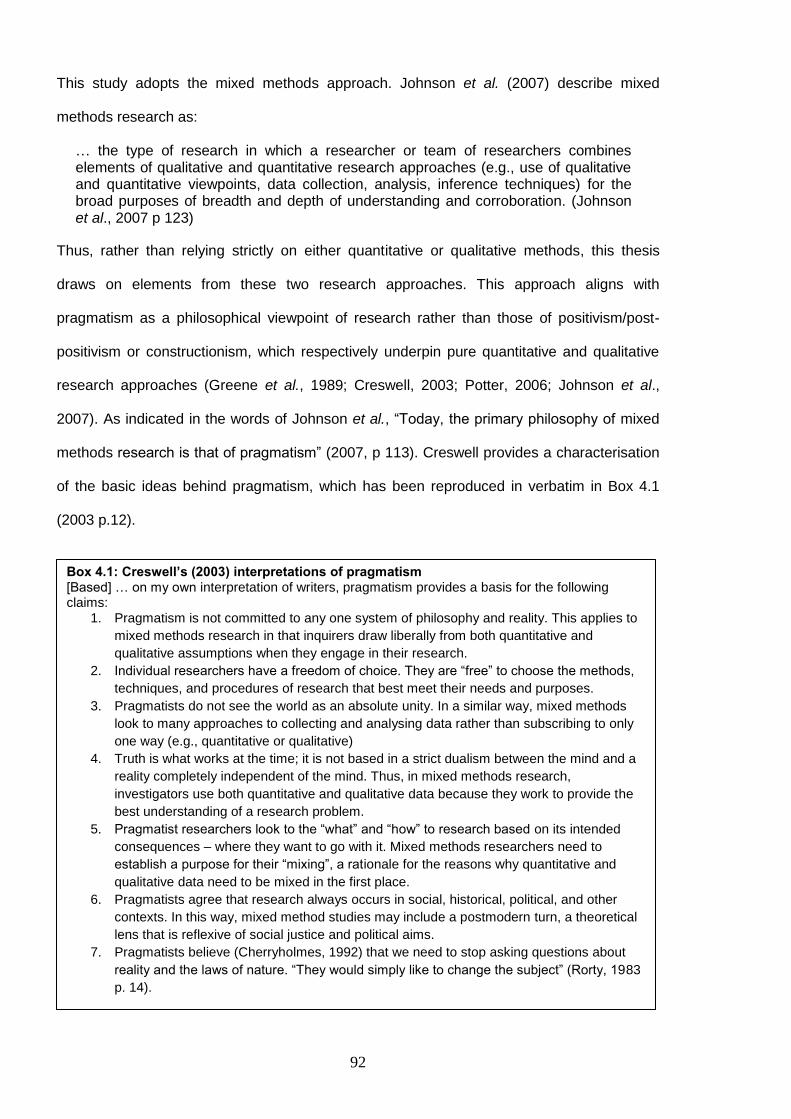
92
This study adopts the mixed methods approach. Johnson et al. (2007) describe mixed
methods research as:
… the type of research in which a researcher or team of researchers combines elements of qualitative and quantitative research approaches (e.g., use of qualitative and quantitative viewpoints, data collection, analysis, inference techniques) for the broad purposes of breadth and depth of understanding and corroboration. (Johnson et al., 2007 p 123)
Thus, rather than relying strictly on either quantitative or qualitative methods, this thesis
draws on elements from these two research approaches. This approach aligns with
pragmatism as a philosophical viewpoint of research rather than those of positivism/post-
positivism or constructionism, which respectively underpin pure quantitative and qualitative
research approaches (Greene et al., 1989; Creswell, 2003; Potter, 2006; Johnson et al.,
2007). As indicated in the words of Johnson et al., “Today, the primary philosophy of mixed
methods research is that of pragmatism” (2007, p 113). Creswell provides a characterisation
of the basic ideas behind pragmatism, which has been reproduced in verbatim in Box 4.1
(2003 p.12).
Box 4.1: Creswell’s (2003) interpretations of pragmatism [Based] … on my own interpretation of writers, pragmatism provides a basis for the following claims:
1. Pragmatism is not committed to any one system of philosophy and reality. This applies to
mixed methods research in that inquirers draw liberally from both quantitative and
qualitative assumptions when they engage in their research.
2. Individual researchers have a freedom of choice. They are “free” to choose the methods,
techniques, and procedures of research that best meet their needs and purposes.
3. Pragmatists do not see the world as an absolute unity. In a similar way, mixed methods
look to many approaches to collecting and analysing data rather than subscribing to only
one way (e.g., quantitative or qualitative)
4. Truth is what works at the time; it is not based in a strict dualism between the mind and a
reality completely independent of the mind. Thus, in mixed methods research,
investigators use both quantitative and qualitative data because they work to provide the
best understanding of a research problem.
5. Pragmatist researchers look to the “what” and “how” to research based on its intended
consequences – where they want to go with it. Mixed methods researchers need to
establish a purpose for their “mixing”, a rationale for the reasons why quantitative and
qualitative data need to be mixed in the first place.
6. Pragmatists agree that research always occurs in social, historical, political, and other
contexts. In this way, mixed method studies may include a postmodern turn, a theoretical
lens that is reflexive of social justice and political aims.
7. Pragmatists believe (Cherryholmes, 1992) that we need to stop asking questions about
reality and the laws of nature. “They would simply like to change the subject” (Rorty, 1983
p. 14).

93
Creswell’s interpretations of pragmatism provided in Box 4.1 show how the mixed methods
approach is anchored on pragmatism. Also emphasised in his interpretations is the
implication of this philosophical viewpoint for data collection and analysis – both quantitative
and qualitative data are used. Later sections of this chapter explain how the mixed methods
approach has been adopted for this study with regards to data collection methods employed
and analytical tools used.
The mixed methods approach provides many advantages, which rationalise the use of this
method. Based on an extensive review of the reasons that are normally cited in
methodological writings and research articles for using mixed methods approach, Bryman
(2006) provides a long list of justifications for combining quantitative and qualitative research
approaches. Of the long list, the following are reproduced here since they informed the
decision to adopt the mixed methods approach for this study:
Triangulation or greater validity – Quantitative and qualitative researches may be
combined to triangulate findings because the two approaches may mutually
corroborate.
Offset – This is based on the idea that the research methods used under both
quantitative and qualitative research have their own advantages and disadvantages.
Combining them therefore allows the researcher to offset their disadvantages while
benefiting from their advantages.
Completeness – The belief is that the researcher can establish a more
comprehensive account of the area of enquiry if both quantitative and qualitative
research methods are used.
Process – The basic notion is that quantitative research gives an account of
structures in social life while qualitative research deals with processes within/between
structures.
Different research questions – The argument is that quantitative and qualitative
researches can each answer different research questions.
Explanation – Each may be used to help explain findings generated by the other.
94
Unexpected results – The belief is that the researcher can combine quantitative and
qualitative researches to gain more understanding in situations where the researcher
generates surprising results from any one approach.
Sampling – refers to situations in which one approach is used to facilitate the
sampling of respondents or cases for the other approach.
While all the above reasons underpin the use of mixed methods approach in this study in one
way or the other, the most important ones for this study are different research questions,
sampling, explanation and completeness.
4.3.1 Mixed methods approach for answering the research questions
As mentioned above the different research questions necessitated the use of a mixed
methods approach; hence, this subsection describes the specific approach used for each
research question. The first research question, which is on the characteristics of the
technologies, is answered by using data generated from a semi-structured interview with key
informants from a purposive sample of the furniture manufacturing firms. The interviews
involved collecting data on the technologies (machines) used by the firms such as acquisition
and replacement cost, scale in terms of capacity, maintenance/repair and infrastructure
requirements to explore the distinctive nature of the Chinese technology vis-à-vis the others.
Data on output and other production inputs such as labour, energy and materials were also
collected. The study also relied on observation based on regular visits to the production sites
or workshops of the firms. These data collection approaches generated both qualitative and
quantitative data. Data that are specific to the technologies (e.g. acquisition costs, output and
inputs) are largely quantitative while data relating to respondents’ perception, born out of
their experience with or exposure to the technologies, are largely qualitative.
For the second research question, the main focus was to determine the mode or mechanism
by which the Chinese technologies are transferred in comparison with the technologies from
advanced countries. This also relies largely on the semi-structured interviews with the
95
manufacturing firms, and firms operating in the sales and distribution network of the
technologies. These interviews largely generated qualitative data.
The third question requires an approach that would help determine the level of
penetration/diffusion of the technologies in the furniture making industry. A structured
research instrument (questionnaire)15 was used to collect data from a cross section of the
manufacturing firms. Among other things, but most importantly, the firms were asked to
indicate whether they use any of the three technologies (that is, Chinese, advanced country
and Kenyan technologies). Information concerning the characteristics of the businesses and
their entrepreneurs were also collected. The data collected for this purpose is largely
quantitative, based on preconceived categorised responses presented to the respondents.
The proportion of the firms that said they use a particular technology, say Chinese
technology, provides an indication of the extent of penetration of that technology.
The approach for answering each research question may fall under one of the different
typologies of mixed methods approach described by Johnson et al. (2007), as shown in
Figure 4.2. The figure shows that between pure qualitative and pure quantitative research
methods lies a spectrum of approaches that combines the two main approaches but at
varying degrees in the two strands. At the middle of the spectrum is the pure mixed method
where both quantitative and qualitative strands are given equal importance. Off this middle
point lie other forms where “… a second method is embedded or nested within the primary
research approach” (Creswell and Plano Clark, 2010 p 10).
Generally, the approach adopted in this study may be located at the middle or very close to
the middle of the spectrum shown in Figure 4.2. However, the locations on the spectrum for
the approaches used for answering each of the research questions vary. The approach for
the first question can be located around qualitative mixed method while that for the second
seems to lie well with qualitative dominant method. However, the approach for the third
15
All the research instruments used in the data collection have been provided in the appendix section of the
thesis.
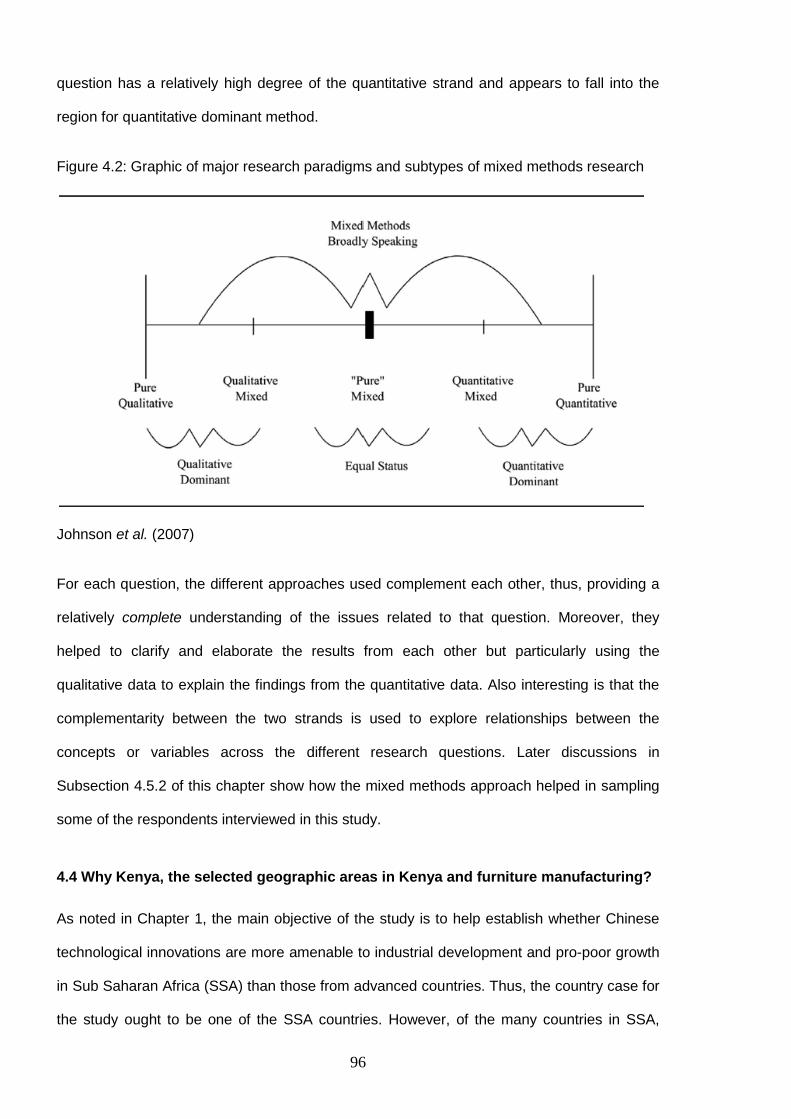
96
question has a relatively high degree of the quantitative strand and appears to fall into the
region for quantitative dominant method.
Figure 4.2: Graphic of major research paradigms and subtypes of mixed methods research
Johnson et al. (2007)
For each question, the different approaches used complement each other, thus, providing a
relatively complete understanding of the issues related to that question. Moreover, they
helped to clarify and elaborate the results from each other but particularly using the
qualitative data to explain the findings from the quantitative data. Also interesting is that the
complementarity between the two strands is used to explore relationships between the
concepts or variables across the different research questions. Later discussions in
Subsection 4.5.2 of this chapter show how the mixed methods approach helped in sampling
some of the respondents interviewed in this study.
4.4 Why Kenya, the selected geographic areas in Kenya and furniture manufacturing?
As noted in Chapter 1, the main objective of the study is to help establish whether Chinese
technological innovations are more amenable to industrial development and pro-poor growth
in Sub Saharan Africa (SSA) than those from advanced countries. Thus, the country case for
the study ought to be one of the SSA countries. However, of the many countries in SSA,

97
Kenya was selected for two reasons. The first is that being the largest economy in East
Africa, Kenya has one of the most vibrant manufacturing sectors in SSA. This has a history in
colonisation, particularly the effect of the World War II (WW II) on the policies of the colonial
administration on industrialisation in Kenya (Leys, 1975) and stiff international competition to
expand international capital after the WW II (Gachino, 2009). Leys (ibid) shows that Kenya
was made a “periphery centre” in East Africa, particularly during the WW II, manufacturing
basic consumer products to meet the needs of Europeans in East Africa during the war time
when it was difficult to import from England.
The second is personal: I did not want to do the data collection in a country I was too familiar
with (for example, my home country, Ghana) nor a country I knew very little about in terms of
my exposure to the way of life of the people. I lived in Kenya for about 4 months in 2006 so I
had a good idea about the likely challenges in the data collection exercise in Kenya. At the
same time, I knew that working in a place like Kenya would help me to avoid a lot of
distraction from friends, family and other social pressures I would have had to contend with if
I had collected the data from a more familiar environment like Ghana.
Two geographic areas (towns) in Kenya were selected for this study: Nairobi and Kisumu.
Kisumu is the capital of Nyanza Province in the south western part of Kenya while Nairobi is
the national capital located in the central part of southern Kenya. Figure 4.3 shows the map
of Kenya and the selected study areas have been encircled in red. These areas were
selected because they are known to be major hubs for many formal and informal enterprises.
For example, a census of informal enterprises conducted by the Kenya’s Central Bureau of
Statistics in 1979 shows that Nairobi had the highest number of informal enterprises (nearly
half of informal enterprises in Kenya were located in Nairobi), followed by Mombasa (9%)
and then Kisumu (7%) (Hosier, 1987). Although this data is old, I believe that the two
selected areas still have significant proportions of the firms. Kisumu was selected over
Mombasa because Kisumu appears to be a relatively less developed area especially in
terms of infrastructure and economic activities, compared to Mombasa while Nairobi is in turn
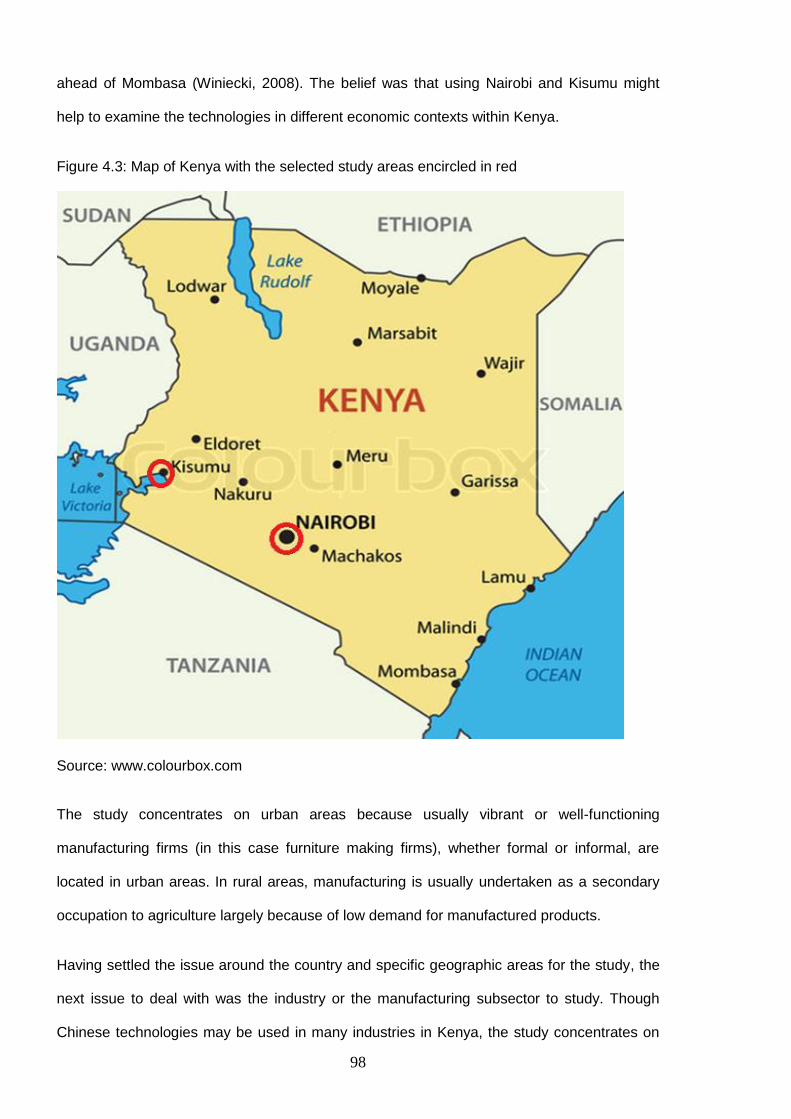
98
ahead of Mombasa (Winiecki, 2008). The belief was that using Nairobi and Kisumu might
help to examine the technologies in different economic contexts within Kenya.
Figure 4.3: Map of Kenya with the selected study areas encircled in red
Source: www.colourbox.com
The study concentrates on urban areas because usually vibrant or well-functioning
manufacturing firms (in this case furniture making firms), whether formal or informal, are
located in urban areas. In rural areas, manufacturing is usually undertaken as a secondary
occupation to agriculture largely because of low demand for manufactured products.
Having settled the issue around the country and specific geographic areas for the study, the
next issue to deal with was the industry or the manufacturing subsector to study. Though
Chinese technologies may be used in many industries in Kenya, the study concentrates on

99
the furniture making industry. The rationale is as follows: This industry plays a central role in
informal sector manufacturing and in the manufacture of products for the poor, as was
indicated in Chapter 2 Subsection 2.2.3. It also has an active formal sector. It therefore
allows comparison between formal and informal sector usage of Chinese technology vis-à-
vis the other types of technologies. Moreover, it is one of the manufacturing subsectors in
Kenya with a very high employment creation potential, as was noted under Subsection 2.2.3
of Chapter 2.
4.5 Data collection approach and sampling methods
Two rounds of data collection were carried out. The first round involved collecting largely
quantitative data with a structured questionnaire from a sample of the firms operating in the
identified locations. As alluded to earlier, this was mainly to generate data to answer the third
research question. Though the main purpose was to collect quantitative data, I also observed
the production processes of the firms, the conditions of the firms’ location, the technologies
they use and market dynamics. The second round of interviews involved collecting largely
qualitative data from a purposively selected subsample of the firms interviewed in the first
round but with much focus on the economic and technical characteristics of the technology
types and the transfer modes. The subsections that follow describe how the firms were
selected in each round of the data collection as well as the sampling approaches adopted for
other participants in the study.
4.5.1 First round of interview with the manufacturing firms
A key issue here relates to how the firms were identified, particularly with respect to the
formal or informal status of the firms. Theoretically or conceptually, there appears be to a
limited consensus on how to characterise the informal sector. Consequently, more than one
criterion for identifying informal sector firms is usually adopted in many studies (e.g. ILO,
1972; Bigsten et al., 2000; Becker, 2004). This research did not rely on any strict operational
definition or criteria for informal sector firms to inform the data collection, thus, the data
collection approach adopted largely refrained from tagging any firm or groups of firms as

100
informal. The reason for this approach was to allow the data to tell which firms are formal or
informal based on their characteristics. However, it should be noted that the informal status
of most of the firms was obvious, even based on casual observation. This is in accordance
with Altman’s statement that “Many researchers say ‘you know it when you see it, but it can’t
be defined’” (Altman, 2008 p 5).
The strategy adopted for the sampling was to identify groups of firms by their locations (that
is, whether they are clustered at specific locations) and then sample from the firms operating
in these locations or clusters. Four locations were identified for the study: Gikomba cluster,
Ngong’ cluster, Kibuye cluster, and another group of firms mainly operating in Nairobi’s
Industrial Area (and surroundings) and along the Mombasa Highway in Nairobi, which are
relatively large in scale. (From now on, the last set of firms will be referred to as Industrial
Area firms in order to simplify discussions).
Compared to the Gikomba, Ngong’ and Kibuye cluster, the Industrial Area firms are sparsely
located within the identified location. Apart from the Kibuye cluster which is located in Kisumu
and along the road connecting Kondele and Kisumu’s city centre, the rest are in Nairobi. The
Gikomba cluster occupies the thin stretch of land between the Kamkuji Road and the Nairobi
River, which passes through the Gikomba market in Nairobi. The Ngong cluster is opposite
Nairobi’s Race Course, and stretches along a portion of the shoulders of the neatly tarred
Nairobi-Ngong’ Road. It should be noted that two other locations in Nairobi – along Juja
Road and in Githurai – were also identified but they were not included in the study. They
were excluded because of the limited time and other resources for data collection. Moreover,
the Juja Road and Githurai clusters look much like the Gikomba and Ngong’ clusters
respectively though both are much smaller than their respective comparators. The
subsections below describe how the firms in these locations were selected for the first round
of the data collection.

101
Gikomba, Ngong’ and Kibuye Clusters
Using a systematic random sampling technique, the firms in the above clusters were
selected from a sampling frame for each cluster that I developed by listing all the firms in
each clusters. The reason for using systematic random sampling was to ensure sample
representativeness for each cluster. The listing was done in the absence of an already
existing database or register on these firms. Basic information about the firms such as the
name of the firm (if available) or the name of the operator, contact number of the operator (if
the operator did not mind giving it out) and a description of the firm’s specific location were
obtained.
Table 4.1: Sampling strategy for firms in Ngong’, Gikomba and Kibuye clusters
Clusters Number of listed
firms (N)
Number of firms
selected (n)
Number of firms actually
interviewed (n)
Ngong’ 149 50 53
Gikomba 91 30 25
Kibuye 98 33 33
Total 338 113 111
The total numbers of firms listed in the clusters were 149, 89, and 98 respectively for the
Ngong’, Gikomba and Kibuye clusters. Had it not been for limited time and resources, all the
firms that would agree to take part in the study should have been interviewed given that
these numbers are not large. In the light of the above challenge, the strategy adopted was to
interview about a third of the listed firms in these clusters, which appears to be an adequate
representation for each cluster. Table 4.1 shows the actual number of firms interviewed in
these cluster.
It should be noted in respect of the Gikomba cluster that the number of firms listed as shown
in the table represents the number of sheds rather than the firms. I found during the listing

102
exercise that some of the sheds or working areas accommodate more than one than person,
who operate independently but are involved in the same activity or product lines. For a lot of
such cases, the operators had similar backgrounds, particularly in terms of age and tribe.
The strategy was therefore to list the sheds and interview an operator or any firm within each
shed or working area that was ready to take part in the study. This strategy helped especially
in the light of the fact that a relatively large number of the prospective respondents in this
cluster shied away from participating in this research for reasons discussed later under
Section 4.6.
Industrial Area
For the relatively large-scale firms operating in the Industrial area and along the Mombasa
Highway in Nairobi, the initial strategy was to obtain a list from the office of Kenya’s Registrar
of Businesses, from which to select systematically a sample of those firms. This, however,
proved futile as information obtained from the Registrar of Businesses indicated that the
register of firms does not categorise firms by sector of operation. Unlike the other firms, the
sparse nature of the specific locations of the Industrial Area firms also made listing daunting
if not impossible especially without any knowledge of their specific addresses. I therefore
resorted to two sources of information about the firms and their addresses: Kenya Yellow
Pages Online and Kenya Association of Manufacturing (KAM) – the office16 and their annual
directory of manufacturing firms in Kenya.
Putting the sets of list from these sources together gave a total of 47 firms. Of this number,
14 came from KAM while the rest were from the Yellow Pages. It is difficult to say that this list
was exhaustive. However, the 2006 KAM report titled “Manufacturing in Kenya” suggested
that as of 2002, Kenya as a whole had 68 furniture-manufacturing firms of the scale or
calibre of the firms operating in the Industrial Area. The report further suggested that not all
the firms were operational as of 2006 as a result of a ban on logging that took place in the
early 2000s.
16
I wrote a letter to Kenya Association of Manufacturing requesting them for a list of furniture manufacturing firms
operating in Nairobi. What was available from them was the list of firms that were part of their membership.
103
With this list, I attempted tracing all the firms. In the end, I was able to trace 31 firms, of
which 20 were interviewed. Some of the firms on the list could not be located with the
addresses from the Yellow Pages because the page had not been updated for a while. The
firms had either moved locations or folded. For example, on one of my data collection
rounds, as I stood in front of the shut gate of what used to be the premises of one of the
firms, a passer-by informed me that the firm had collapsed not long ago. Some of the firms
were also not willing to take part in the study, which they indicated right from my first visit to
them while others clandestinely avoided me. Two additional firms I visited (whose addresses
were obtained from the Yellow Pages) were also in retail rather than manufacturing. The
consequence was that instead of following a strict systematic random sampling method, I
ended up interviewing those I could find and were interested in participating in the study.
4.5.2 Second round of interviews with the manufacturing firms
As noted earlier, data (largely qualitative) from a purposive sample 17 of the firms were
collected for exploring the distinctive characteristics of Chinese technologies and the transfer
mode in relation to the other technologies. This constituted the second round of interviews, of
which the participants were purposively selected from those that took part in the first round of
interviews. In fact, all the respondents in the first round were asked to indicate whether they
were interested in the second round, of which everybody said they were interested. The first
round of interviews therefore provided an avenue to solicit the firms’ consent for the second
round of interviews, thanks to the mixed methods research approach. The consent was
sought at the end of each interview. The firms were however informed that their participation
in the second round was not automatic but depended on the findings from the first round of
the research.
The first round of the data collection also helped the second round in a more important way.
Furniture manufacturing is characterised by the production of a wide range of heterogeneous
products with equipment and machines that vary in nature and in use. The implication for the
17
Purposive sampling, also called judgment sampling, is a non-probability sampling technique, which involves
selecting study participants deliberately because of some qualities/characteristics they possess (Tongco, 2007; Burgess, 1984).

104
study was that it was crucial to identify some specific areas of the production activities and
equipment used in performing these activities which lend themselves to comparison across
firms in the different clusters. The first round of interviews and visits to the firms therefore
provided information that helped to deal with the above-mentioned challenge. It provided
answers to questions like which kind of machines are common across the different firms and
technology types (sources), what are they used for and in what clusters do the firms that use
these machines operate? The answers to these questions formed a significant component of
the criteria used for selecting the purposive sample of the firms.
The first round of interviews with the firms and my observations therewith showed that the
production activities of the firms could be broken down into four parts: Designing; preparing
components or parts; joinery; and finishing and upholstery. I found that preparing
components was the most technology (equipment) intensive of all the activities, involving
planing, ripping, crosscutting, turning etc. Moreover and in general, these activities
particularly planing also produce outputs that are relatively easy to measure and compare
across firms and the technology types. The machines used for these activities, which were
the commonest across the majority of the firms and the technology types were planing
machines/thicknesser, saw bench, lathe and band saw, which are all automated “light-duty”
machines. Hence, the second round of interviews focused on these light-duty machines and
each of the firms selected had at least one of these machines.
It should be noted that not all the firms interviewed in the first round of the interviews had
invested in these automated light-duty machines. While they produce furniture, some have
only invested in manual and/or power hand tools and relied on machining services provided
by other firms. (Detailed discussion on this issue has been provided in Chapters 5 and 8). In
order to limit this PhD to a manageable scope, the thesis pays little attention to hand tools
especially with respect to the detailed study of the characteristics of the technologies from
China and the other sources. The first round of the interviews therefore helped to identify
firms that have invested in the automated light-duty equipment considered in this thesis. At
same time, the random inclusion of those that have invested only in hand tools in the first

105
round of the survey helps to determine the extent of penetration among all the furniture
manufacturing firms in the study area rather than simply the sub population that has invested
in the automated equipment.
Another criterion that informed the selection, though to a more limited extent, was the scale
of operations of the firms (that is, whether micro, small, medium or large enterprises). In
Kenya, scale is normally defined in terms of the number of employees working in an
enterprise: Micro enterprises are those with 10 or fewer workers, small enterprises have from
11 to 50 workers, and medium enterprises have from 51 to 100 workers while large
enterprise have over 100 workers (Gray et al., 1996).
Of a total of 131 firms interviewed in the first round, 41 were selected for the second round of
interviews, of which eight were from the Industrial Area category of firms and the rest were
from the Ngong’, Gikomba and Kibuye clusters.
4.5.3 Sales and distribution firms of the technologies
Based on anticipated challenges such as lack of geographic clustering of these firms and a
relatively low interest on the part of these firms to participate in the study, the initial plan was
to use a snowball sampling approach to recruit these participants. Snowball sampling is a
type of purposive sampling method in which the researcher depends on the social networks
of participants he has already interviewed or contacted, where such participants refer the
researcher to other people who could potentially participate in the study (Wilson, 2005).
Hence, it is also referred to as chain referral sampling. The specific strategy was to ask the
firms that took part in the second round of interviews to give referral to the firms that supply
the machines.
The above strategy however did not work perfectly. While many of the firms mentioned the
names of the suppliers and their locations, they could not or would not introduce me to any of
the sales and distribution firms. The reason was that for most of them the machines of the
kind under study are not items they purchase on a regular basis; hence, they do not have

106
strong ties with the suppliers so that they could introduce to those suppliers a researcher
who might pester them for an interview appointment. Some of the machines were also
bought straight from foreign dealers. The information the manufacturing firms provided on the
names and locations of the suppliers was however valuable in the sense that it helped to
trace the firms. I visited many of the supplier firms but only four granted interviews, of which
three operate in Nairobi and the other one in Kisumu.
4.5.4 Other key informants
Interviews with other key informants such as officials of associations of the firms, government
ministries and agencies were part of the data collection plan. The aim was to determine if
they play any role in the transfer of the technologies and for that matter the technology
choice by the firms. My interactions with the firms during the first round of interviews showed
that associations had virtually no role to play in their access to technologies. However, I had
a relatively short interview with an official of the jua kali association in Kisumu because that
was where I found a relatively vibrant jua kali association, of which some of the furniture
making firms in Kibuye were members. I also had another short interview with an official of
KAM over the phone. Both confirmed that the associations play little or no role in the firm’s
technology matters. The information from these interviews therefore does not feature in the
discussions in the analytical chapters of this thesis.
Similarly, interviews (also short) were held with three officials of government ministries
(Ministry of State for Planning, National Development and Vision 2030, Ministry of
Industrialisation and Ministry of Labour), an official from the Kenya Industrial Property
Institute and another one from the Kenya Industrial Research and Development Institute.
These interviews showed that government does not play any direct role in the technology
choice and technology transfer for the firms in the furniture making industry. When asked
about government policies and their implication for manufacturing in Kenya, they produced
several government policy documents for me to study. I had already chanced on some of
those documents when I was writing Chapter 2 of this thesis, which was initially drafted

107
before the fieldwork. The new documents were used to improve the Chapter 2 during the
latter part of this thesis preparation.
The official from the Ministry of Industrialisation however noted that the Kenyan Government
has taken a special interest in furniture manufacturing in the country with a presidential
directive that procurement of furniture for public offices be restricted to furniture made in
Kenya. He indicated that the volume of this procurement is estimated to be around 2 billion
Kenyan Shillings18 per annum; hence, the aim of the directive is to shore up the furniture
making businesses to create more wealth and employment. With a policy guideline on this
directive in place, he noted that plans were far advanced to implement the directive of the
President. It should be noted that this development adds to the attractiveness of studying the
furniture industry rather than any other manufacturing subsector.
Another group of informants for the study were repairers and/or fabricators of locally made
machines. Five of these informants were interviewed, of which four were among many others
operating in a close vicinity to the Gikomba cluster in Nairobi while the remaining one
operated in Kisumu. It was relatively difficult to find fabricators around Kibuye and in Kisumu.
The purpose of these interviews was to obtain a second opinion on some of the data
collected from the manufacturing firms during the second round such as cost of repairs,
quality and robustness of machines and the availability of skills for repairing the machines.
4.6 Other field challenges
Several challenges including sampling difficulties faced during the data collection have
already been mentioned. This section however highlights a few additional challenges.
4.6.1 Language issues
Though Kenya is an English-speaking country, some of the respondents especially those in
Gikomba and Kibuye clusters could not communicate well in English but in Kiswahili, which I
was not very familiar with. Hence, I had to hire a research assistant who helped me to
18
The exchange between the US dollar and Kenya Shilling was 85 shillings per one US dollar at time of the data collection.

108
communicate with both prospective and actual respondents who could not speak English to a
satisfactory level. I practiced with the assistant on how to translate the interview questions/
questionnaire into Kiswahili in order to ensure that the right responses were solicited during
the interviews. Instead of allowing him to conduct the interviews, he only served an
interpreter while I conducted all the interviews. This strategy offered me the opportunity to
ask follow-up questions specific to each respondent but were not written on the interview
guide or questionnaire. The research assistant could not have asked the right follow-up
questions because he did not have in-depth knowledge about the subject area under study.
Another language challenge was the difference in my Ghanaian English accent and that of
the Kenyan people. However, I became very used to the Kenyan English accent after a brief
period (about one to two weeks) while some of my respondents struggled with my accent.
The research assistant did a good job by intervening any time accent problems arose. He
also helped in locating places and offices I had to visit during the data collection.
4.6.2 Earning the trust of prospective respondents
Gaining the trust of prospective respondents was difficult, particularly in the Gikomba cluster.
While an introductory letter from the Institute for Development Studies (IDS) of the University
of Nairobi (my affiliate institution in Kenya) and my student ID card generally helped, it was
still difficult for some of the prospective respondents (especially the Gikomba firms and sales
and distribution firms) to grant me audience, particularly at the first instance of my
interactions with them. An account of one of my experiences with a prospective respondent
in the Gikomba cluster is instructive: When we (the research assistant and I) approached
him, he asked to be excused for a minute. After a few minutes he came back to us but with
an amulet on his wrist, something he did not have on him when we approached him.
It should be noted that the relatively high difficulty in gaining the trust of the prospective
respondents in the Gikomba cluster was largely responsible for the relatively large non-
response rate for this cluster as the figures in Table 4.1 indicate. For the sales and
distribution firms, some of them were not sure about our credibility and some believed that

109
we were looking for business secrets. One of them said that he could only talk to us after 4
pm, by which time they had sent his daily sales or revenues to the bank.
There was also some problem of trust with the officials from the government
ministries/agencies. While they had little or no doubt about my student status and that I was
collecting data for school work, only one person allowed voice recording of the interview.
They gently declined by asking: “Are you sure you are not from the media?” and then
suggested that I take notes instead of recording the conversation.
4.6.3 Getting interview appointments
Apart from the difficulty in locating the firms operating in Industrial Area, there were also
challenges with respect to gaining their consent to participate in the study. The security
personnel and/or receptionists of the firms appeared to avoid appointments with the
managers/ directors of the firms especially when the purpose for the appointment seemed to
provide little or no business opportunities. They would normally take the letter officially asking
for appointment or their participation in the study and either refused or failed to fix any
appointment. Some of them gave out email addresses to reach the managers or directors but
I did not receive any reply to my emails on many of those instances. For some of the firms,
however, persistent or repeated visits to them proved beneficial while others never gave in.
4.6.4 Elections and electioneering campaigns
The data were collected between August 2012 and January 2013. This period coincided with
the run up of electioneering campaigns of the 2013 Presidential and Parliamentary Elections
in Kenya. Particularly in Kisumu, some of the campaigns ran at the same time I was
conducting interviews. While this might have some implications for the data, those
implications are much less significant in that the subject area for the study did not appear to
be politically sensitive for the respondents. The only difficulty was that it affected the attention
of the respondents who were interested in politics. There were several instances where I had
110
to discontinue an on-going interview and asked for a second appointment because the
respondents’ attention was drawn to a political campaign at a nearby location.
4.7 Tools for data analysis
The qualitative data (interviews and field observations) were analysed by the thematic
approach. This involved identifying patterns in the data and organising them into coherent
themes, which does not involve assigning numerical codes as it is done in quantitative
analysis. This was very labour intensive, involving reading and re-reading to summarise and
bring meaning to the text. Rather than relying on preconceived themes, the themes used in
the analysis emerged from working with data. Descriptive narrations including reference to
specific statements from the respondents were then used to discuss and present the data
under each theme, sub themes and relationships within and between the themes. All the
interviews (i.e. qualitative or narrative data) were transcribed before the analyses were done.
Numeric data gathered on outputs and inputs (labour and capital) of the firms at the
preparation stage of the production process (and specifically in relations to planing) were
also used to compute technical coefficients of production. Three coefficients calculated were
capital-labour ratio, output-labour ratio and output-capital ratio, which give indication about
the relative factor intensity and relative efficiency of the different technology types considered
in this study. With additional data such as unit charge on planing a foot of a given dimension
of timber and other input costs incurred from using the planing machine, discounting
measures such as net present value (NPV) and benefit cost ratio (BCR) were calculated to
determine the profitability or return on investment in the technology types. Specific details
about how the production coefficients and the indicators on returns on investment were
calculated are discussed in Chapter 7, which among other things examines these concepts.
Descriptive statistics and regression models were also applied to analyse the quantitative
data from the first round of interviews. This data analysis was done using STATA.
Descriptive statistics such as means, frequencies and percentages were generated. Chapter
5, which discusses the profile of the firms and their operators, relies extensively on

111
descriptive statistics. The regression models were used to analyse the relationship between
the firms’ technology adoption decisions and their characteristics including those of the
operators. It was also used to examine the complementarity between the adoption of
Chinese technology and the others. Specific details about the regression models used are
presented in Chapter 8 where the analyses and discussions have been presented.
4.8 Conclusion
This chapter has focused on the conceptual framework and the research method employed
to answer the three research questions. The chapter has provided justifications for the use of
a mixed methods research approach and elaborated on the specific sampling techniques
used to recruit the various respondents. Among the respondents are the furniture
manufacturing firms, sales and distribution firms of the technologies, and fabricators of locally
made machine, who also repair the other machines. The data collection techniques and
analytical tools employed have also been explained. The next chapter present a discussion
on the business and entrepreneurial profile of the firms interviewed.
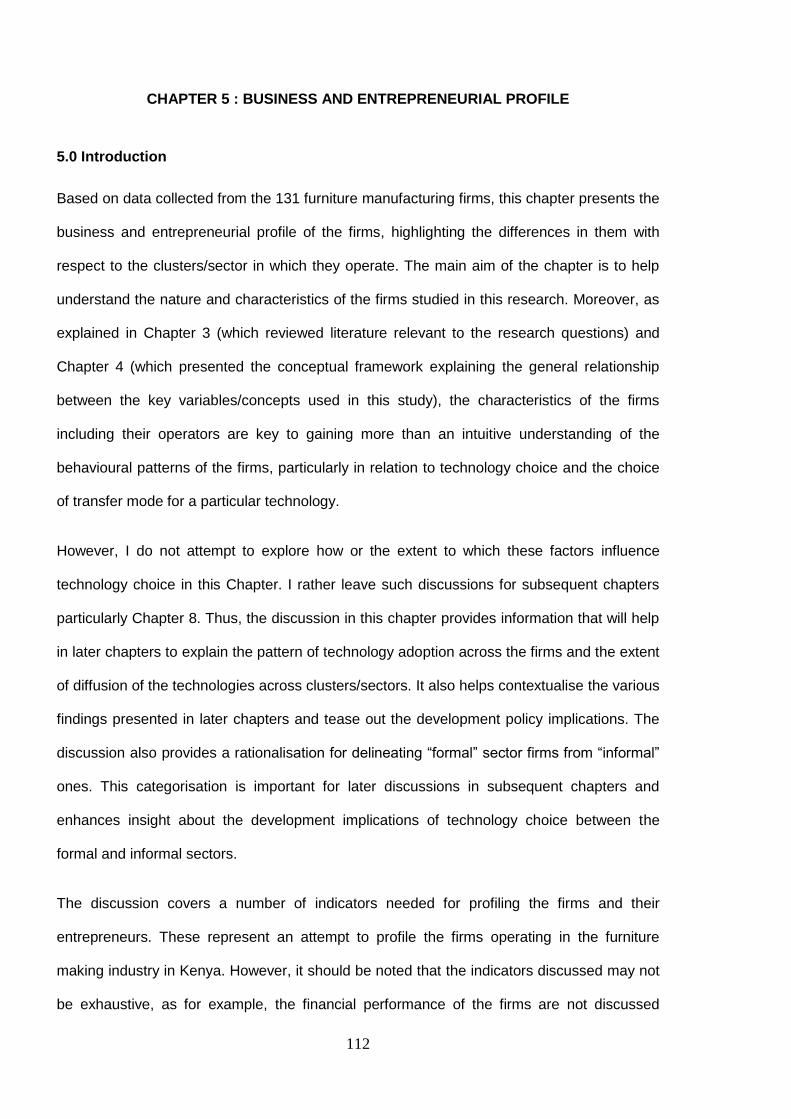
112
CHAPTER 5 : BUSINESS AND ENTREPRENEURIAL PROFILE
5.0 Introduction
Based on data collected from the 131 furniture manufacturing firms, this chapter presents the
business and entrepreneurial profile of the firms, highlighting the differences in them with
respect to the clusters/sector in which they operate. The main aim of the chapter is to help
understand the nature and characteristics of the firms studied in this research. Moreover, as
explained in Chapter 3 (which reviewed literature relevant to the research questions) and
Chapter 4 (which presented the conceptual framework explaining the general relationship
between the key variables/concepts used in this study), the characteristics of the firms
including their operators are key to gaining more than an intuitive understanding of the
behavioural patterns of the firms, particularly in relation to technology choice and the choice
of transfer mode for a particular technology.
However, I do not attempt to explore how or the extent to which these factors influence
technology choice in this Chapter. I rather leave such discussions for subsequent chapters
particularly Chapter 8. Thus, the discussion in this chapter provides information that will help
in later chapters to explain the pattern of technology adoption across the firms and the extent
of diffusion of the technologies across clusters/sectors. It also helps contextualise the various
findings presented in later chapters and tease out the development policy implications. The
discussion also provides a rationalisation for delineating “formal” sector firms from “informal”
ones. This categorisation is important for later discussions in subsequent chapters and
enhances insight about the development implications of technology choice between the
formal and informal sectors.
The discussion covers a number of indicators needed for profiling the firms and their
entrepreneurs. These represent an attempt to profile the firms operating in the furniture
making industry in Kenya. However, it should be noted that the indicators discussed may not
be exhaustive, as for example, the financial performance of the firms are not discussed

113
mainly because the necessary data were not obtainable from the majority of the firms. The
discussion proceeds by first presenting a description of some of the social and economic
dynamics within the clusters since the cluster in which a firm operates is indicative of some
inherent attributes of the firm. This is followed by a discussion about specific characteristics
of the firms, which may vary across firms between and within clusters. Last but not the least,
the characteristics of the firms’ operators are discussed before turning to a series of
concluding remarks.
5.1 Cluster-level dynamics or features
Industrial clustering has been well studied and the literature (e.g. McCormick, 1999;
Rabelloti, 1999; Schmitz, 1999; Bell and Albu, 1999) suggests that clustering influences the
nature of firms’ operations. With a theoretical framework, Bell and Albu (ibid) suggest that
cluster dynamics can influence the technological capabilities of firms, which include
investment in machinery and equipment. This section therefore discusses cluster-level
characteristics of the furniture making firms while highlighting some of the challenges they
pose to the operations of the firms.
To a large extent, the magnitude of the challenges that the cluster characteristics or factors
pose can be easily ‘normalised’ across firms within a particular cluster. However, the actual
effect of the challenges at the firm level may depend on the varying levels of the firms’
capabilities to respond to the same magnitude of threats or opportunities. For firms operating
in different clusters, however, not only do their individual capabilities to manage threats or
embrace opportunities matter but also important is the different degrees of threats and
opportunities they may have to face. The discussions in the subsections that follow will
centre on three headings: business registration and tax obligations; the nature of
infrastructure; and trust and social relations.
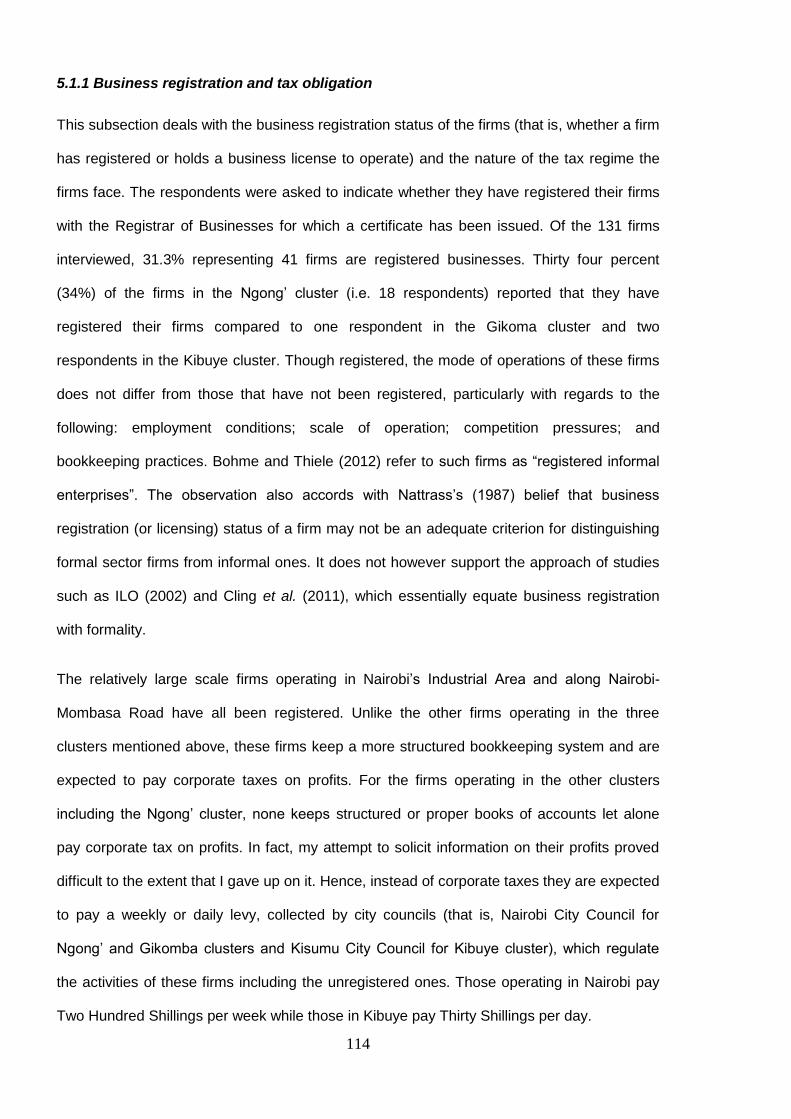
114
5.1.1 Business registration and tax obligation
This subsection deals with the business registration status of the firms (that is, whether a firm
has registered or holds a business license to operate) and the nature of the tax regime the
firms face. The respondents were asked to indicate whether they have registered their firms
with the Registrar of Businesses for which a certificate has been issued. Of the 131 firms
interviewed, 31.3% representing 41 firms are registered businesses. Thirty four percent
(34%) of the firms in the Ngong’ cluster (i.e. 18 respondents) reported that they have
registered their firms compared to one respondent in the Gikoma cluster and two
respondents in the Kibuye cluster. Though registered, the mode of operations of these firms
does not differ from those that have not been registered, particularly with regards to the
following: employment conditions; scale of operation; competition pressures; and
bookkeeping practices. Bohme and Thiele (2012) refer to such firms as “registered informal
enterprises”. The observation also accords with Nattrass’s (1987) belief that business
registration (or licensing) status of a firm may not be an adequate criterion for distinguishing
formal sector firms from informal ones. It does not however support the approach of studies
such as ILO (2002) and Cling et al. (2011), which essentially equate business registration
with formality.
The relatively large scale firms operating in Nairobi’s Industrial Area and along Nairobi-
Mombasa Road have all been registered. Unlike the other firms operating in the three
clusters mentioned above, these firms keep a more structured bookkeeping system and are
expected to pay corporate taxes on profits. For the firms operating in the other clusters
including the Ngong’ cluster, none keeps structured or proper books of accounts let alone
pay corporate tax on profits. In fact, my attempt to solicit information on their profits proved
difficult to the extent that I gave up on it. Hence, instead of corporate taxes they are expected
to pay a weekly or daily levy, collected by city councils (that is, Nairobi City Council for
Ngong’ and Gikomba clusters and Kisumu City Council for Kibuye cluster), which regulate
the activities of these firms including the unregistered ones. Those operating in Nairobi pay
Two Hundred Shillings per week while those in Kibuye pay Thirty Shillings per day.

115
If one characterises formality as involving business registration and payment of corporate
taxes then all the firms in the Gikomba, Ngong’ and Kibuye clusters are not formal
enterprises while their counterparts are. On the other hand, one can also say that all the
firms have some degree of formality to the extent that they pay some form of taxes and are
somewhat regulated. As noted in Chapter 4, the literature on the definition of informality is
not conclusive. Becker (2004) argues that this arises from the intrinsic heterogeneity of the
informal sector, which has been documented in the literature (e.g. Brand, 1986; Granstrom,
2009; Grimm et al., 2011). With respect to the firms studied in this research, I will provide a
dichotomy between the formal and informal sectors and emphasise the heterogeneity of the
latter in the light of the data and the literature on informality at the concluding section of this
chapter. The reason for this deferral is that some of the discussions in later sections of this
chapter provide further information, which helps in the attempt to obtain a better
characterisation of what I will refer to as the informal sector throughout this study.
In the meantime, I will loosely refer to all the firms in Gikomba, Kibuye and Ngong’ clusters
as informal sector firms and their counterparts operating in the Industrial Area and along the
Nairobi-Mombasa road as formal sector firms. Suffice it to say that this approach has been
adopted at this stage mainly as a way to help nuance the discussions with comparisons
between what I now refer to as the formal sector firms and the others. However, the major
differences and similarities in the firms across the different clusters are highlighted
throughout the discussions.
5.1.2 Nature of housing and infrastructure
The quality of shed or premises and infrastructure (access roads and power supply) may
influence the nature of business activities in the clusters. Similarly, it is likely that the nature
of housing and infrastructure in these clusters can also influence technology choice of the
firms. Stewart (1982) shows that infrastructure is critical for technology choice. Hence, the
discussion in this subsection examines the quality of infrastructure/housing in each cluster
while highlighting the major differences across the clusters.

116
Gikomba cluster
The operators in this cluster hire spaces from ‘squatters’ on a thin stretch of land lying
between the Nairobi River and the Kamkuji Road. A part of this land may have been left for a
pedestrian walkway and the other part for accommodating the river when it overflows its
banks, giving some indication of the ‘temporary’ nature of the location of this cluster although
it has existed for several decades. Another indication of the temporariness of this location
relates to the nature of the sheds in which the firms operate. Almost all the sheds are made
from wood and/or dilapidated aluminium sheets as it can be seen from Figures 5.1 and 5.2.
My interaction with the operators shows that they usually have to raise the money for
mounting the sheds or refurbishing an old one. Such costs are then set off against a fixed
monthly rent for the space until the operators fully recover the expenses, after which they
have to pay a monthly rent to the landlords for the rest of the period they will operate in the
shed. For potential entrepreneurs, the initial cost of constructing the shed can become an
entry barrier or a challenge especially when the entrepreneur is unable to find an already-
built shed.
A careful look at Figure 5.1 and 5.2 reveals many more challenges the firms operating in this
cluster face on a daily basis. First, these sheds have open entrances (that is, they have no
doors), indicating that security is a serious challenge in this cluster. Interestingly, the
operators leave their tools, machines and wares in these sheds after work. While hand tools
are normally locked up in toolboxes, light duty machines are left openly in the sheds. The
operators indicated that they have had to endure high degrees of theft and pilferage which
happen at night. Often, they wake up to find parts of their light-duty machines stolen or
someone has made away with hand tools after breaking into the toolbox or both. As a way of
resolving this problem, the operators contribute money which is used to hire guards to watch
over the sheds at night. This has only provided a partial antidote in the sense that their total
contribution is usually not enough to hire an adequate number of guards needed to deter
thieves from the sheds.
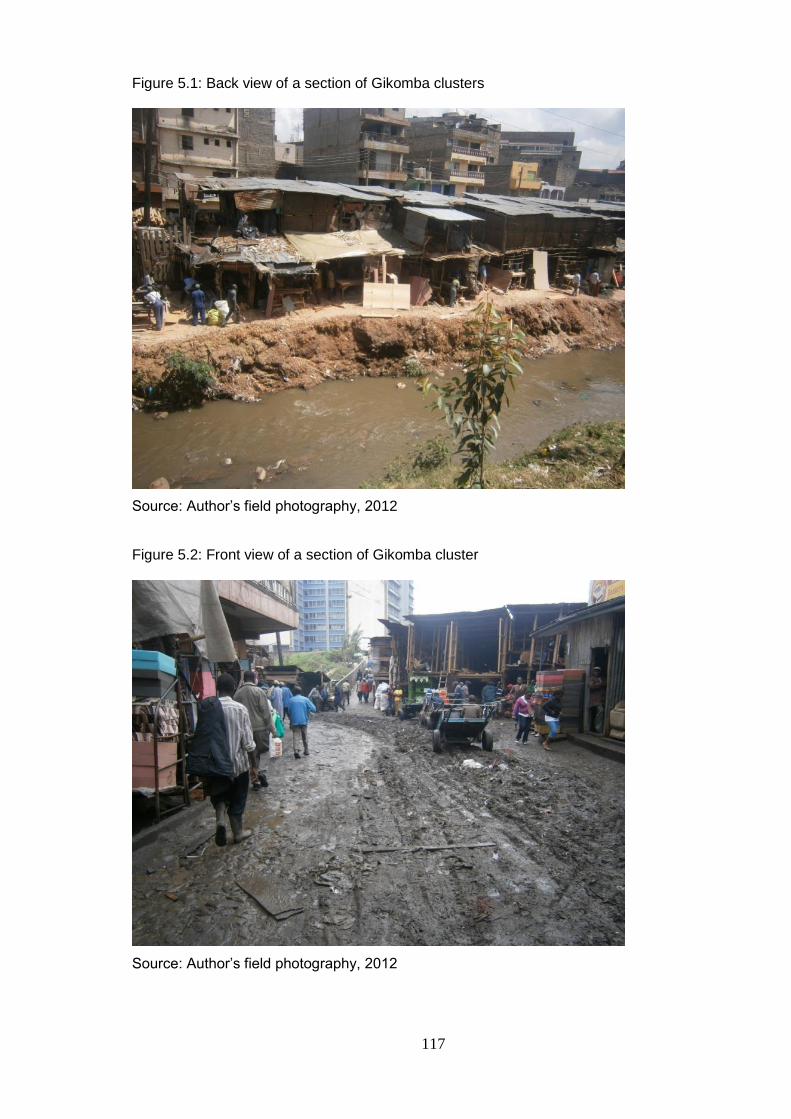
117
Figure 5.1: Back view of a section of Gikomba clusters
Source: Author’s field photography, 2012
Figure 5.2: Front view of a section of Gikomba cluster
Source: Author’s field photography, 2012

118
Second, the sheds are prone to fire outbreaks. The operators reported that fire outbreaks
have repeatedly destroyed their sheds including their equipment (tools and machines) and
wares. One of them reported that in the last five years alone, they have had three fire
outbreaks and he has been a victim in each case, which has significantly affected the growth
of his business. His words make this point more graphic:
I always come… to square one after each fire outbreak. I lose my materials, the furniture I have made and even some of my tools and machines. See, the planing machine [over] there is no longer in use because the main [essential] parts such as the motor, capacitors and switches were burnt in the last fire outbreak. … losing materials and wares is serious than the machines because the machines I buy with my own savings, [while] the money invested in materials normally come from customers who have order with me” (Field interview, 2012).
Another person reported that he lost so much in a fire outbreak that occurred in 2008 to the
extent the thought of it had adverse impact on his health: “…after the fire, I became sick and
the doctor said my blood pressure is high and now I take medicine every day because of the
pressure” (field interview, 2012).
The third challenge is that the firms operating in this cluster experience difficulties when it
rains heavily. Though the rains normally offer a temporary relief from the effect of the hot
sun, it introduces them to another form of hardship. The rains turn the major access route
(the dusty Kamkuji Road which passes in front of the sheds) into a mud trap as can be seen
in Figure 5.2. Whenever it rains, vehicles experience difficulty in plying this road and the
popular two-wheel handcarts pictured in Figure 5.2 become less useful. The muddy road
does not only affect the work of the handcart operators but also the carpenters. The reasons
are that the carpenters rely extensively on these handcarts for moving materials to their
workshops and for transporting furniture to their customers. Additionally, the muddy road
deters customers from visiting the carpenters’ workshops.
Another effect of the rains worth mentioning, and evident in Figure 5.1, is that the Nairobi
River floods from continuous or heavy downpours, usually inundating the sheds with water
and sometimes sweeping away wares, tools and machines. Figure 5.1 was taken a day after
a little downpour which caused a significant rise in the water level, indicating the extent of
disruption a heavy downpour can cause. Moreover, with floors buried under wet sawdust and
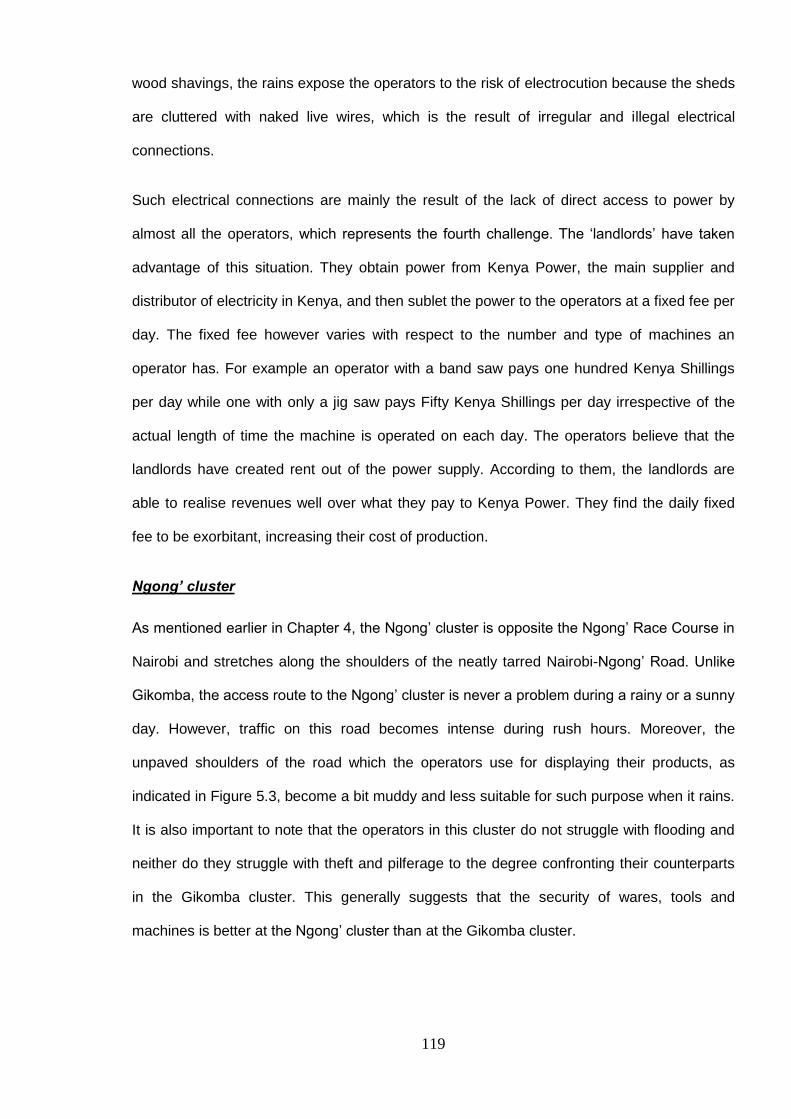
119
wood shavings, the rains expose the operators to the risk of electrocution because the sheds
are cluttered with naked live wires, which is the result of irregular and illegal electrical
connections.
Such electrical connections are mainly the result of the lack of direct access to power by
almost all the operators, which represents the fourth challenge. The ‘landlords’ have taken
advantage of this situation. They obtain power from Kenya Power, the main supplier and
distributor of electricity in Kenya, and then sublet the power to the operators at a fixed fee per
day. The fixed fee however varies with respect to the number and type of machines an
operator has. For example an operator with a band saw pays one hundred Kenya Shillings
per day while one with only a jig saw pays Fifty Kenya Shillings per day irrespective of the
actual length of time the machine is operated on each day. The operators believe that the
landlords have created rent out of the power supply. According to them, the landlords are
able to realise revenues well over what they pay to Kenya Power. They find the daily fixed
fee to be exorbitant, increasing their cost of production.
Ngong’ cluster
As mentioned earlier in Chapter 4, the Ngong’ cluster is opposite the Ngong’ Race Course in
Nairobi and stretches along the shoulders of the neatly tarred Nairobi-Ngong’ Road. Unlike
Gikomba, the access route to the Ngong’ cluster is never a problem during a rainy or a sunny
day. However, traffic on this road becomes intense during rush hours. Moreover, the
unpaved shoulders of the road which the operators use for displaying their products, as
indicated in Figure 5.3, become a bit muddy and less suitable for such purpose when it rains.
It is also important to note that the operators in this cluster do not struggle with flooding and
neither do they struggle with theft and pilferage to the degree confronting their counterparts
in the Gikomba cluster. This generally suggests that the security of wares, tools and
machines is better at the Ngong’ cluster than at the Gikomba cluster.

120
Figure 5.3: A section of Ngong’ furniture cluster
Source: Author’s field photography, 2012
Figure 5.4: Examples of permanent structures at Ngong’ cluster
Source: Author’s field photography, 2012
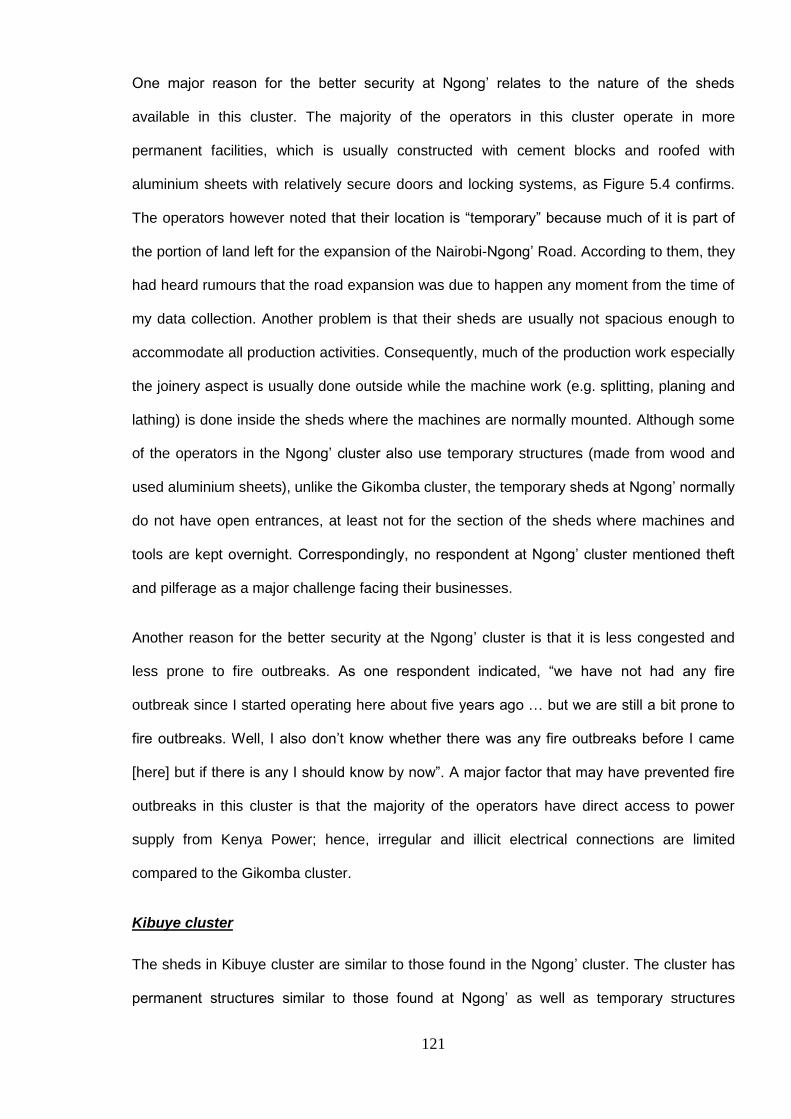
121
One major reason for the better security at Ngong’ relates to the nature of the sheds
available in this cluster. The majority of the operators in this cluster operate in more
permanent facilities, which is usually constructed with cement blocks and roofed with
aluminium sheets with relatively secure doors and locking systems, as Figure 5.4 confirms.
The operators however noted that their location is “temporary” because much of it is part of
the portion of land left for the expansion of the Nairobi-Ngong’ Road. According to them, they
had heard rumours that the road expansion was due to happen any moment from the time of
my data collection. Another problem is that their sheds are usually not spacious enough to
accommodate all production activities. Consequently, much of the production work especially
the joinery aspect is usually done outside while the machine work (e.g. splitting, planing and
lathing) is done inside the sheds where the machines are normally mounted. Although some
of the operators in the Ngong’ cluster also use temporary structures (made from wood and
used aluminium sheets), unlike the Gikomba cluster, the temporary sheds at Ngong’ normally
do not have open entrances, at least not for the section of the sheds where machines and
tools are kept overnight. Correspondingly, no respondent at Ngong’ cluster mentioned theft
and pilferage as a major challenge facing their businesses.
Another reason for the better security at the Ngong’ cluster is that it is less congested and
less prone to fire outbreaks. As one respondent indicated, “we have not had any fire
outbreak since I started operating here about five years ago … but we are still a bit prone to
fire outbreaks. Well, I also don’t know whether there was any fire outbreaks before I came
[here] but if there is any I should know by now”. A major factor that may have prevented fire
outbreaks in this cluster is that the majority of the operators have direct access to power
supply from Kenya Power; hence, irregular and illicit electrical connections are limited
compared to the Gikomba cluster.
Kibuye cluster
The sheds in Kibuye cluster are similar to those found in the Ngong’ cluster. The cluster has
permanent structures similar to those found at Ngong’ as well as temporary structures
122
although the temporary structures are slightly fewer. Normally, those operating in permanent
structures also build temporary extensions in front of their sheds, as Figure 5.5 depicts. Like
the Ngong’ cluster, a lot of the joinery work is done outside the shed, usually under the
extensions, while the finished product, work in progress and materials are kept inside the
sheds. In most cases, the light-duty machines are operated outside the sheds as depicted in
Figure 5.5 and moved into the shed after the day’s work. Thus, like the Ngong’ cluster but in
contrast to Gikomba, the sheds in Kibuye are relatively solid.
Figure 5.5: An example of sheds at Kibuye cluster
Source: Author’s field photography, 2013
However, with regards to fire outbreaks, Kibuye is not so different from Gikomba. The
operators reported a number of fire outbreaks at Kibuye, with many of them having been
victims. Again, illegal and irregular electrical connections could be a major explanation for the
rampant fire outbreaks at Kibuye since a lot of the operators do not have direct access to
power supply from Kenya Power. To forestall further fire outbreaks and prevent loss of
property, the landlords at the Kibuye cluster are converting the temporary structures into
123
permanent structures, which are less prone to fire. This has led to an increase in the cost of
production of the firms because the rent for a permanent structure is about three times that of
a temporary structure.
Another good feature of the Kibuye cluster is that the structures are better organised
compared to those in Gikomba, making it less congested and the major access route to the
cluster is also less muddy when it rains. This route is a minor branch of the dual-carriage
street connecting Kondele and Kisumu city centre.
Formal sector
As noted in Chapter 4, the formal sector firms are generally located in Nairobi’s Industrial
Area and along the Mombasa highway, which together cluster formal manufacturing and
industrial activities in Nairobi. The premises of these businesses are fenced with tall concrete
walls, and sometimes, the concrete walls are extended with an electric fence. These gated
premises almost always have a security post with 24-hour security surveillance, at least, at
the entrances. The first point of call of any visitor is the security post where suspecting
individuals are either denied entry or allowed entry after a brief questioning and security
checks. Figure 5.6 shows a picture of a formal sector furniture manufacturing firm, depicting
the relatively magnificent nature of the kind of edifice in which these firms operate in. It
should however be noted that not all the formal sector firms interviewed have premises of
this standard and size, although all of them operate in premises that are far better than those
in the Ngong’ cluster.
None of the problems facing the informal sector clusters discussed above appears to be a
major concern for the formal sector enterprises operating in Nairobi. For example, unlike the
informal sector firms, the formal ones generally operate in areas officially demarcated for
industrial activities in Nairobi; hence, they tend to have better power infrastructure than the
informal sector firms. The challenges these firms face are the usual challenges affecting
manufacturing in Kenya and developing countries in general, which were mentioned in
Chapter 2. These challenges also affect the informal sector enterprises. Probably, the impact

124
of these challenges may be worse for the informal sector enterprises than the formal sector
enterprises, given the relatively high degree of haplessness, voicelessness and general lack
of influence that characterise entrepreneurship in the informal sector.
Figure 5.6: Premises of a highly formal sector firm
Source: The picture was taken from the webpage of a formal sector firm
5.1.3 Trust and social relations
Interpersonal trust in a given social system may facilitate information transfer, knowledge
sharing and transactions (Granovetter, 1985; Uzzi, 1997; Wu et al., 2009; Hsu and Chang,
2014). However, I found interpersonal trust in Kenya to be low, particularly in Nairobi where
cases of trickery, dupery and mugging are rampant. Usually, it takes a long time to gain
someone’s trust, and as a result, tribal/ethnic ties and longstanding acquaintances largely
drive personal association and social relations. This is reflected in the difficulty I encountered
125
in gaining the trust of prospective respondents especially in the Gikomba cluster, which was
a major challenge to my data collection exercise, as discussed earlier in Chapter 4.
Whereas I perceive the level of trust to be generally low, the Gikomba cluster appears to be
the worst among all the clusters. Circles of social relations at Gikomba are largely made up
of people of the same or close tribal backgrounds. For example, the Luos operate in their
own circles, which are entirely different from those of the Kikuyus. These circles are used for
providing social protection in the form of welfare benefits and initiatives, pooling and sharing
of funds as well as production sharing. The operators in Gikomba believe in these “informal”
circles more than the formal structures of the ‘jual kali’ associations as almost all of the
operators I spoke with do not belong to any such association. They specifically mentioned
lack of trust as the main challenge refraining them from participating effectively in jua kali
associations. To flesh this out I recount what one of them said: “We don’t trust each other but
some people also envy others … everybody here is careful if you don’t know the other
person well, we always want to work with our tribe man” (Field work, 2012).
At Ngong’, the operators are generally individualistic and assume a more capitalist posture
and tribalism does not appear to drive any form of personal association. However, it appears
lack of trust is one of the factors that drive the individualism and makes it difficult for them to
be part of or establish a local wing of one of the jua kali associations in Kenya. Contrarily, the
Kibuye cluster can boast of a relatively vibrant jua kali association, of which some of the
operators of the furniture making firms are members. This may be the result of the relatively
good degree of trust that exists among the operators in Kibuye cluster. A likely explanation
for this degree of trust is that the operators at Kibuye are predominantly from the Luo tribe
compared to the two clusters in Nairobi, which is much more cosmopolitan in nature with a
relatively high incidence of fraudulent activities. The dominance of the Luos in the Kibuye
cluster may arise from the fact that Kibuye is located in Kisumu, which is administrative
capital of Western Province and constitutes the traditional land and home of the Luo people
in Kenya.

126
5.2 Firm-level characteristics
The discussion on firm level characteristics deals with factors, which directly relate to the firm
and its operations such as the firm’s age, ownership structure, target markets and products.
For firms operating in the same cluster, these characteristics can distinguish one from the
other and may lead to different technology choices.
5.2.1 Age of firms
Table 5.1 presents the mean age of the firms. The table shows that the average age for all
the firms (both formal and informal) is 12.8 years. However, there is a large difference
between the average age of the informal sector firms and that for the formal sector firms. The
table indicates that the formal sector firms have an average age of 31.4 years, which is over
three times longer than the average for the informal sector firms (9.5 years). The average
age of the informal sector firms compares well with the results of some recent studies. For
example, Grimm et al. (2011) found an average age of 8.7 years for informal sector firms in
Madagascar and Granstrom (2009) found nine years for those in Darkar. The figures from
these studies were however estimated for informal sector firms in general and not for any
specific industry or sector.
Table 5.1: Average age of firms by clusters/ sector
Informal sector clusters Informal
sector
Formal
sector Total
Ngong’ Gikomba Kibuye
Mean 7.8 12.0 10.3 9.5 31.4 12.8
Min 0.3 1.0 2.0 0.3 8.0 0.3
Max 20.0 29.0 28.0 29.0 70.0 70.0
Range 19.8 28.0 26.0 28.8 62.0 69.8
Source: Field data, 2012/2013
The distribution of the firms across different age categories provided in Table 5.2 further
highlights the huge age difference between the informal sector firms and the formal sector
firms. The distribution for the latter is skewed toward the older age groups with more than
half of the firm (55%) having existed for over 29 years, none of them being less than five

127
years and only 5% of them fall within the 5-9 age bracket. Contrarily, the distribution of the
informal sector firms is comparatively skewed towards the younger age brackets. Over
twenty percent (22.5%) of the informal sector firms are less than five years and the majority
of them (about 30%) fall within the 5-9 age group, followed by those within 10-14 years,
which forms 26.1% of the informal sector firms. None of the informal sector firms has been in
operation for more than 29 years and only 3.6% and 6.3% respectively fall into 25-29 and 20-
24 age brackets.
A factor that may account for the large age difference between the formal and informal sector
firms is the lack of continuity of the informal sector businesses beyond the life or retirement
of the owners. That is, there is a high likelihood that an informal sector business will collapse
when the owner dies or retires. Moreover, for some of the operators of the informal sector
firms, particularly those who have been employed in the formal sector before, self-
employment in this sector offers an opportunity to eke out a livelihood while waiting for
greener opportunities in the formal sector (Field interview, 2012). Hence, such firms are likely
to wind up when the owners or operators find better jobs in the formal sector. Another likely
reason is the limited barrier to entry and exit due to relatively low capital and skill
requirements needed to start an informal sector firm.
Table 5.2: Age groups of firms by cluster/sector in percentage (%)
Age
groups
Informal sector clusters Informal
sector
Formal
sector All
Ngong' Gikomba Kibuye
0-4 24.5 20.0 21.2 22.5 0.0 19.1
5-9 35.9 20.0 27.3 29.7 5.0 26.0
10-14 26.4 24.0 27.3 26.1 15.0 24.4
15-19 11.3 16.0 9.1 11.7 5.0 10.7
20-24 1.9 12.0 9.1 6.3 10.0 6.9
25-29 0.0 8.0 6.1 3.6 10.0 4.6
> 29 0.0 0.0 0.0 0.0 55.0 8.4
Total 100 100 100 100 100 100
Source: Field data, 2012/2013

128
Within the informal sector, the average age also varies across the clusters. Table 5.1
indicates that the firms in Ngong’ cluster (with an average age of 7.8 years) are younger than
those in Kibuye and Gikomba clusters, whose average ages are 10.3 years and 12 years
respectively. Further evidence is provided by maximum and minimum ages of the firms in the
three clusters. While Ngong’ has the youngest of all the informal sector firms (approximately
four months old), Gikomba can boast of the oldest informal sector firm (29 years old),
followed by Kibuye (28 years old). What may partly explain this variation is that my
interaction with the operators of the firms in these different clusters showed that the Ngong’
cluster sprang up recently, whereas the Gikomba and Kibuye clusters have been in
existence since the early 1980s. Thus, given that most of the firms were born in the clusters
in which they operate, firms in the Ngong’ cluster on average should be younger than those
in the other two clusters.
5.2.2 Ownership structure
Each of the firms including the formal sector ones fall into one of three ownership categories:
partnership, family business or sole proprietorship. Table 5.3 reports the proportion of the
firms that fall into each of these categories by cluster/sector. The table shows that the
majority of the firms (71.8%) are sole proprietorships, followed by partnerships (16.8%) and
then family-owned businesses (11.5%). Interestingly, a comparison of the distributions
between the sectors shows an important difference between the formal and informal sector
firms. As Table 5.3 indicates, sole proprietorships form about 85% of the informal sector
firms while none of the formal sector firms is solely owned. The majority of the formal sector
firms (70%) are family owned businesses compared to less than 1% for the informal sector
firms while the proportion for partnerships (30%) within the formal sector is about twice that
for the informal sector firms. Thus, contrary to ILO’s (1972) belief that informal sector firms
are more likely to be family-owned than formal ones, it has been found that many more of the
supposedly formal sector firms studied in this research are family owned compared to the
others.

129
Table 5.3: Ownership structure by cluster/sector in percentages (%)
Nature of
ownership
Informal sector clusters Informal
sector
Formal
sector All Ngong’ Gikomba Kibuye
Partnership 7.6 16.0 24.2 14.4 30.0 16.8
Family owned 0.0 4.0 0.0 0.9 70.0 11.5
Sole proprietorship 92.5 80.0 75.8 84.7 0.0 71.8
Total 100 100 100 100 100 100
Source: Field data, 2012/2013
Some differences in ownership structure also exist among firms across the informal sector
clusters although such differences do not offset the high degree of similarities across the
informal sector clusters. For example, Ngong’ and Kibuye clusters do not have any family-
owned businesses while just 4% of the firms in Gikomba are family businesses. Moreover, a
large proportion of the firms across all the clusters are sole proprietorships although the
proportion for Ngong’ is higher than those for the other clusters particularly Kibuye. Table 5.3
indicates that 92.5% of the firms in Ngong cluster are sole proprietorships, with Gikomba
following with 80% and Kibuye comes last with 75.8%. Conversely, Kibuye has the highest
proportion for partnership (24.2%), followed by Gikomba and then Ngong’ with 16% and
7.6% respectively. Kibuye having the highest proportion for partnership might have roots in
the relatively high degree of trust that exists between operators in the Kibuye cluster.
5.2.3 Products, customer expectations and target market
The majority of the firms interviewed specialise in making wood furniture. Table 5.4 indicates
that 68.7% of the firms produce only wood furniture while 29% produce wood furniture and
metal furniture and/or combine wood and metal in their production. Less than 3% of the firms
do only metal furniture. The table also shows that the informal sector firms in Gikomba and
Kibuye clusters do not produce metal furniture at all and neither do they combine metal with
wood to make any product. Contrarily, only 37.7% of the firms in the Ngong’ cluster
specialise in making only wood furniture and nearly 60% produce both wood and metal
furniture or combine wood and metal to produce furniture items. Thus, the material
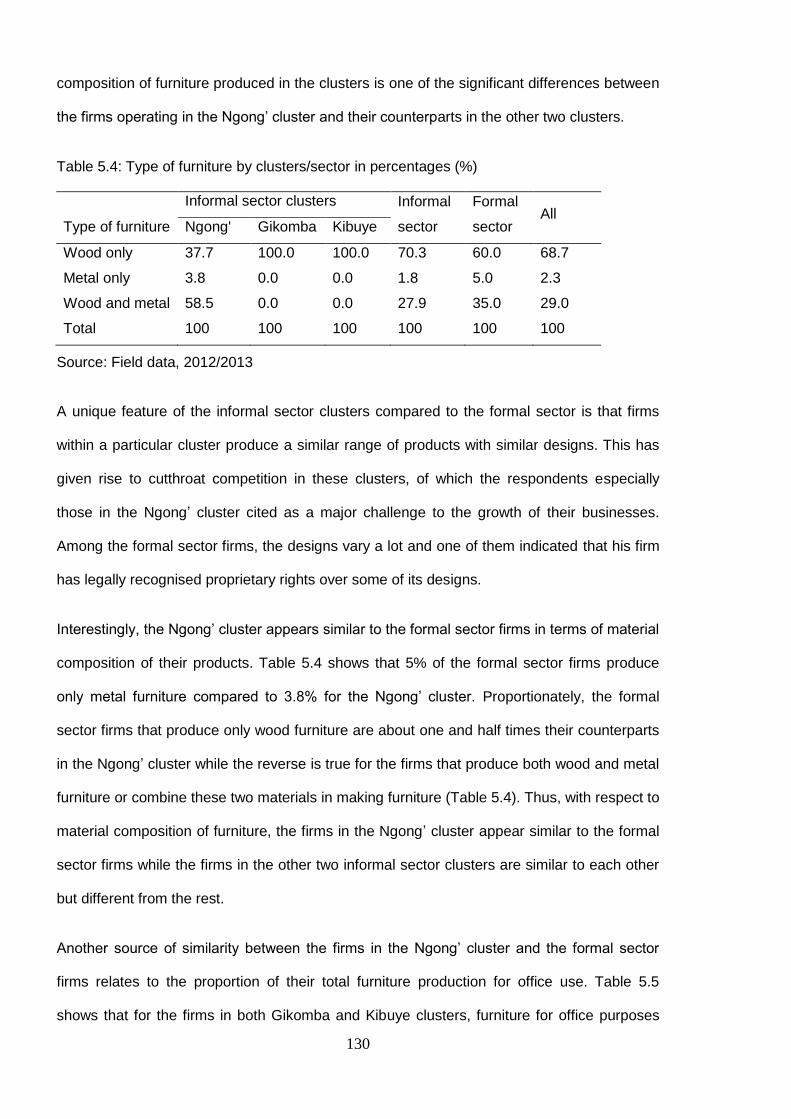
130
composition of furniture produced in the clusters is one of the significant differences between
the firms operating in the Ngong’ cluster and their counterparts in the other two clusters.
Table 5.4: Type of furniture by clusters/sector in percentages (%)
Type of furniture
Informal sector clusters Informal
sector
Formal
sector All
Ngong' Gikomba Kibuye
Wood only 37.7 100.0 100.0 70.3 60.0 68.7
Metal only 3.8 0.0 0.0 1.8 5.0 2.3
Wood and metal 58.5 0.0 0.0 27.9 35.0 29.0
Total 100 100 100 100 100 100
Source: Field data, 2012/2013
A unique feature of the informal sector clusters compared to the formal sector is that firms
within a particular cluster produce a similar range of products with similar designs. This has
given rise to cutthroat competition in these clusters, of which the respondents especially
those in the Ngong’ cluster cited as a major challenge to the growth of their businesses.
Among the formal sector firms, the designs vary a lot and one of them indicated that his firm
has legally recognised proprietary rights over some of its designs.
Interestingly, the Ngong’ cluster appears similar to the formal sector firms in terms of material
composition of their products. Table 5.4 shows that 5% of the formal sector firms produce
only metal furniture compared to 3.8% for the Ngong’ cluster. Proportionately, the formal
sector firms that produce only wood furniture are about one and half times their counterparts
in the Ngong’ cluster while the reverse is true for the firms that produce both wood and metal
furniture or combine these two materials in making furniture (Table 5.4). Thus, with respect to
material composition of furniture, the firms in the Ngong’ cluster appear similar to the formal
sector firms while the firms in the other two informal sector clusters are similar to each other
but different from the rest.
Another source of similarity between the firms in the Ngong’ cluster and the formal sector
firms relates to the proportion of their total furniture production for office use. Table 5.5
shows that for the firms in both Gikomba and Kibuye clusters, furniture for office purposes

131
constitutes less than 15% of their total furniture production (13.3% for Gikomba and 12.3%
for Kibuye). The corresponding figure for the Ngong’ cluster (31.4%) is more than twice the
respective figures for Gikomba and Kibuye clusters while being relatively close to that for the
formal sector firms (42%).
Table 5.5: Proportion (%) for office furniture in production
Cluster/ Sector
Type of product All
Wood only Metal only Metal & wood
Ngong 29.3 22.5 33.4 31.4
Gikomba 13.3 13.3
Kibuye 12.3 12.3
Formal 27.9 80.0 60.7 42.0
Total 20.5 41.7 38.4 27.4
Source: Field data, 2012/2013
The type and quality of wood used for making the furniture in these clusters/sectors (which
can be used as a gauge for product quality) provides another source of similarity or
dissimilarity between the firms across the different clusters. There is a good degree of
similarity between the Gikomba and Kibuye clusters on one hand, and between the Ngong’
cluster and the formal sector firms on the other hand. At Kibuye, the wood normally used for
furniture comes from Blue Gum, White Gum19 and Cypress trees which are soft rather than
hard wood. Almost the same can be said about the Gikomba cluster although there are few
instance where the operators at Gikomba make use of hard wood from the Mahogany tree,
which is almost two times more expensive than Blue Gum wood. Firms in the Ngong’ cluster
predominantly use Mahogany wood as in the case of the formal sector firms. The major
difference between the formal sector firms and the Ngong’ cluster in terms of quality of
product is that the formal sector firms are able to achieve high quality joinery and finishing
with more intricate designs, of which the operators at Ngong’ cluster attribute to the relatively
high quality and specialised machinery available in the formal sector firms.
19
Blue gum and white gum are common names for variants of Eucalyptus species.

132
Although demand and the degree of competition may be key factors that determine product
price in these clusters/sectors, the differences in the quality of products seem to have greatly
influenced price variation across the cluster/sectors. Products from the formal sector firms
are the most expensive, followed by those from the Ngong’ cluster and then the Gikomba
cluster while Kibuye trails. For example, a seven-sitter, partially-stuffed, living-room chair, of
which variants can be easily found in the three informal clusters, sells for at least Fifteen
Thousand Kenya Shillings at Kibuye and for at least Twenty Five Thousand Shillings and
Sixty Thousand Shillings at Gikomba and Ngong’ respectively. The kind of sitting room chairs
sold at the above prices in these clusters is hard to find in formal sector firms. The closest I
found sells for about Two Hundred and Fifty Thousand Shillings. It should be noted that the
firms in the informal sector cluster are able to make furniture items that are relatively more
expensive than the figures produced above and so do the formal sector ones. However,
customer demand is clustered in cheaper products.
Figure 5.7: Respondent’s impression about customers’ expectations and preferences
Source: Field data, 2012/2013
0.0
1.0
2.0
3.0
4.0
5.0
6.0
7.0Price
Promptdelivery
Quality &Durability
Aesthetics
Opportunityfor
maintenance
Warrantee orguarrantee
Ngong
Gikomba
Kibuye
Formal

133
Unsurprisingly, the respondents’ subjective judgment about their customers’ expectations
and/or preferences with regards to a number of factors shows that the customers of the
formal sector firms place more importance on the quality of the products than customers of
the informal sector clusters including the Ngong’ cluster (Figure 5.720). Figure 5.7 further
shows that within the informal sector, the Kibuye cluster trails, with regards to quality and
durability of the products, followed by Gikomba cluster and then Ngong’ cluster.
Correspondingly, the customers of the formal sector firms give the least consideration to
product price compared to those of the informal sector firms.
From the foregoing discussion about product quality (and price) and when taking into
account customer expectations (as perceived by the operators), one can conclude that, to a
large extent, the formal and informal sector firms target or serve different segments of the
furniture market in terms of income levels. While the formal sector firms mainly produce for
the top end of the market (rich individuals and the corporate and public sector offices), the
informal sector largely produce to meet the demand from low income categories of the
population. A statement from a respondent in a formal sector firm which specialises in home
furniture provide support for this argument: “We target home owners, that is, rich
people….eh, for poor people they go to Gikomba market to buy their furniture. They just can’t
afford us” (Field interview, 2012). Interestingly, the very poor also can’t afford furniture from
the Ngong’ cluster. An operator from this cluster noted: “People from Kibera21 can’t buy from
here ... They don’t come here and I think most of them who can afford household furniture
must [will] go to Gikomba market” (Field interview, 2012).
It should be noted that market segments for the Ngong’ cluster and the formal sector firms
slightly overlap especially for the middle-income category of consumers. Given the relatively
high quality of products produced in the Ngong’ cluster and with a huge price difference
between their products and those of the formal sector firms, they are able to attract
20
The figure presents factors that customers consider as important when buying furniture. On the Likert scale, the value of one (1) means customers do not consider the factor at all and seven (7) means that that factor is very important to customers. 21
Kibera is the largest slum in Africa.
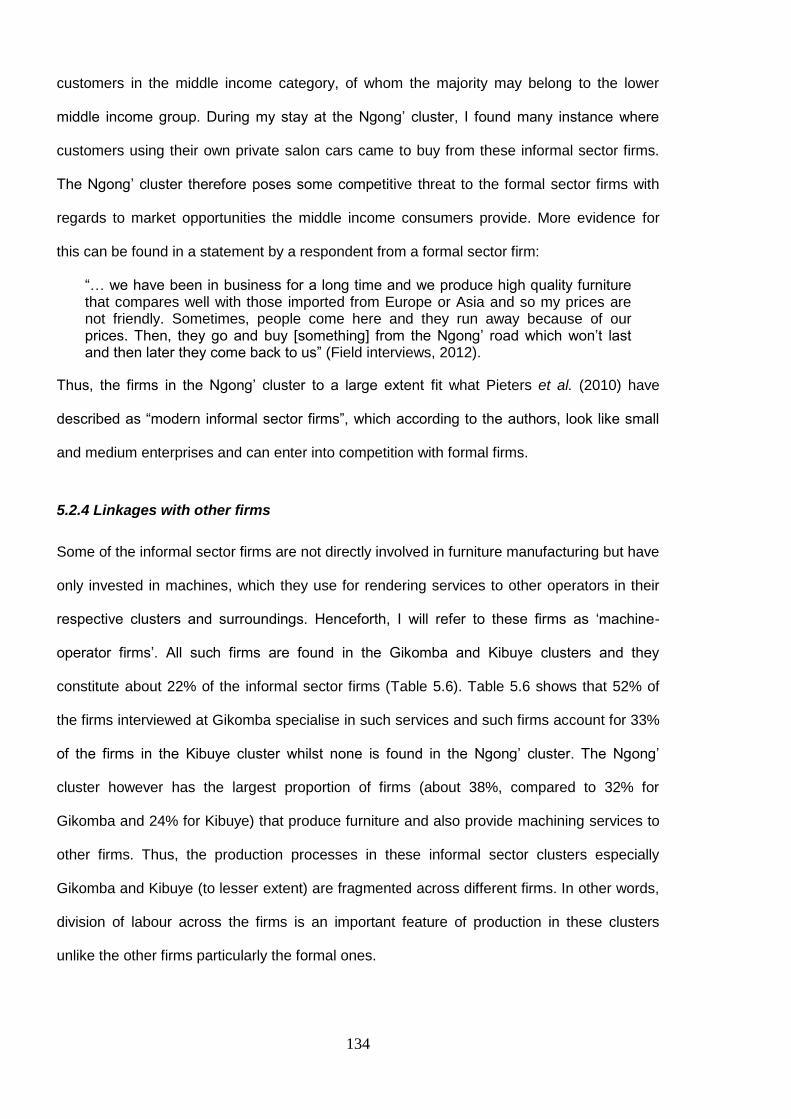
134
customers in the middle income category, of whom the majority may belong to the lower
middle income group. During my stay at the Ngong’ cluster, I found many instance where
customers using their own private salon cars came to buy from these informal sector firms.
The Ngong’ cluster therefore poses some competitive threat to the formal sector firms with
regards to market opportunities the middle income consumers provide. More evidence for
this can be found in a statement by a respondent from a formal sector firm:
“… we have been in business for a long time and we produce high quality furniture that compares well with those imported from Europe or Asia and so my prices are not friendly. Sometimes, people come here and they run away because of our prices. Then, they go and buy [something] from the Ngong’ road which won’t last and then later they come back to us” (Field interviews, 2012).
Thus, the firms in the Ngong’ cluster to a large extent fit what Pieters et al. (2010) have
described as “modern informal sector firms”, which according to the authors, look like small
and medium enterprises and can enter into competition with formal firms.
5.2.4 Linkages with other firms
Some of the informal sector firms are not directly involved in furniture manufacturing but have
only invested in machines, which they use for rendering services to other operators in their
respective clusters and surroundings. Henceforth, I will refer to these firms as ‘machine-
operator firms’. All such firms are found in the Gikomba and Kibuye clusters and they
constitute about 22% of the informal sector firms (Table 5.6). Table 5.6 shows that 52% of
the firms interviewed at Gikomba specialise in such services and such firms account for 33%
of the firms in the Kibuye cluster whilst none is found in the Ngong’ cluster. The Ngong’
cluster however has the largest proportion of firms (about 38%, compared to 32% for
Gikomba and 24% for Kibuye) that produce furniture and also provide machining services to
other firms. Thus, the production processes in these informal sector clusters especially
Gikomba and Kibuye (to lesser extent) are fragmented across different firms. In other words,
division of labour across the firms is an important feature of production in these clusters
unlike the other firms particularly the formal ones.
135
Table 5.6: Nature of manufacturing by clusters/sectors in percentages (%)
Nature of
manufacturing
Informal sector clusters Informal
sector
Formal
sector All
Ngong’ Gikomba Kibuye
Furniture only 62.3 16.0 42.4 46.0 100.0 54.2
Machine work only 0.0 52.0 33.3 21.6 0.0 18.3
Furniture and
machine work 37.7 32.0 24.2 32.4 0.0 27.5
Total 100 100 100 100 100 100
Source: Field data, 2012/2013
Two main reasons account for this division of labour: First, some of the firms, which
patronise the services of the machine operator firms, cannot mobilise resources to cover the
high cost of mechanisation. Second, some of those firms do not find this investment
economically viable even if they can organise resources for such investment. The latter
explanation is consistent with literature on value chains, which suggests that firms specialise
in order to take advantage of the relatively high efficiency of each other across the nodes in
the production (value) chains (Gereffi et al. 2005; Kaplinsky and Morris, 2001; Gereffi, 1994).
The value chain literature, however, does not explain fragmentation brought about by the
resource gap that exists in firms that are unable to mobilise resources for investment in
machinery. Thus, the motive for or the driver of specialisation in these clusters goes beyond
the efficiency such specialisation can offer. I revisit this issue in Chapter 8 in the light of
some of the literature on industrial clustering mentioned earlier and in the context of the
firms’ technology adoption decisions.
For the formal sector firms, all machines are for internal use only. Table 5.6 shows that none
of the firms provide machining services to other firms. There is a relatively high degree of
integration within these firms to the extent that a few of them have their own tree plantation to
feed their furniture production (two of such firms took part in this study). Nevertheless, they
obtain a very high proportion of their raw materials (e.g. wood, metal and fabrics) from other
firms.
136
Moreover, the firms have weak linkages with foreign markets. None of them reported
supplying furniture or components to any lead firm in foreign markets. For the informal
sector, the firms generally do not have the capacity to export furniture. The firms in the
Ngong’ cluster noted that they occasionally get people they believe to be foreigners to
purchase one or two items from them but they cannot tell whether they are for use in Kenya
or overseas. According to the interviewees from the formal sector firms, the furniture industry
in Kenya has an extremely small export market and the small proportion of their production,
which lands on foreign soil, is never through their own initiatives. On rare occasions, they get
orders from foreign customers (mostly from East Africa Sub-region) who usually take care of
the shipment and even local transportation (from the workshop to the port) of the wares.
5.2.5 Nature of employment
While employment in the formal sector firms is relatively high (about 67 workers per firm on
average), the number of employees per firm in the informal sector is low (Figure 5.8).
Employment in the informal sector clusters is also largely casual, based on piece rate system
of remuneration. Figure 5.8 indicates that the average number of employees (excluding the
operators/owners) for the informal sector firms is 3.4 people. Of this number, 2.3 are casual
workers and the remainder is for “permanent” workers. Only with reference to the informal
sector firms, the word “permanent” is used here to describe casual but regular workers that
have worked continuously for a firm for at least three months. While a few of those workers
receive monthly wages, this is without pension benefits and an opportunity or motivation to
join any kind of labour union.
For the formal sector, however, permanent employees refer to workers who hold
appointment letters, have been enrolled in social security and insurance scheme, and are
entitled to other benefits per the requirements of Kenya labour laws. The figure shows that
on average each formal sector firms employs 52.8 permanent workers, compared to an
average of 15.5 casuals, who are also paid based on the piece rate system. Moreover, unlike
the informal sector, the permanent workers in the formal sector have attained relatively high
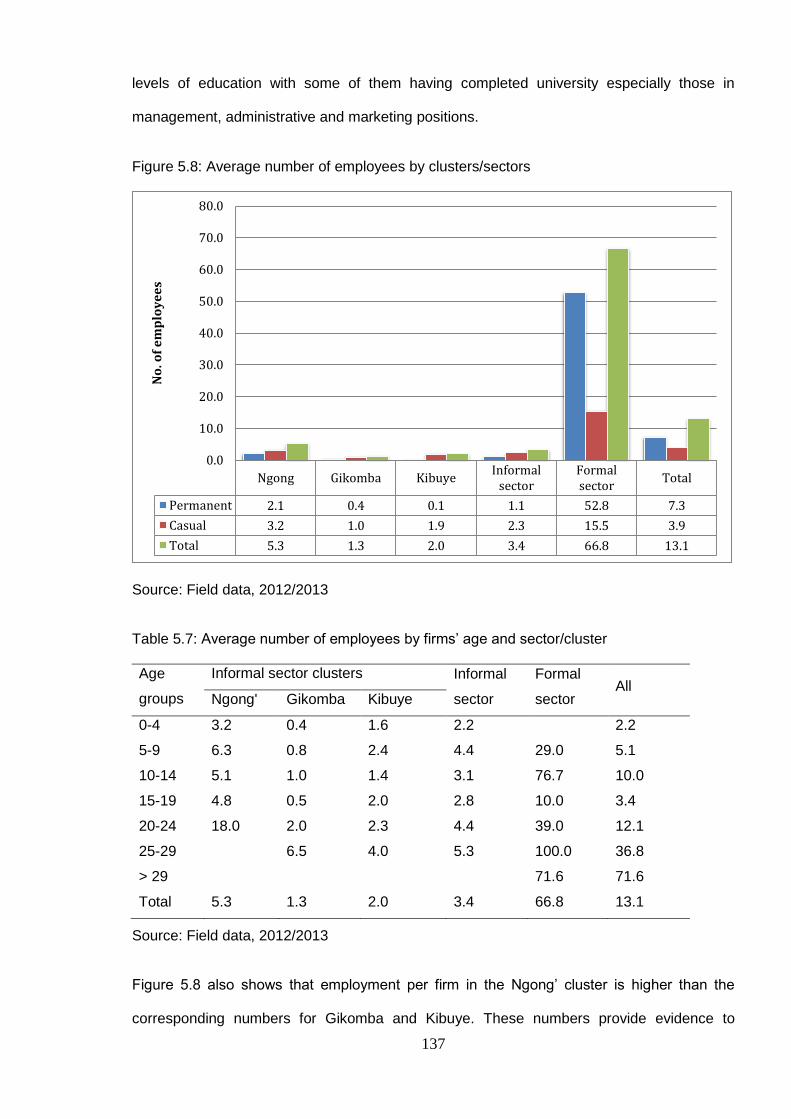
137
levels of education with some of them having completed university especially those in
management, administrative and marketing positions.
Figure 5.8: Average number of employees by clusters/sectors
Source: Field data, 2012/2013
Table 5.7: Average number of employees by firms’ age and sector/cluster
Age
groups
Informal sector clusters Informal
sector
Formal
sector All
Ngong' Gikomba Kibuye
0-4 3.2 0.4 1.6 2.2
2.2
5-9 6.3 0.8 2.4 4.4 29.0 5.1
10-14 5.1 1.0 1.4 3.1 76.7 10.0
15-19 4.8 0.5 2.0 2.8 10.0 3.4
20-24 18.0 2.0 2.3 4.4 39.0 12.1
25-29 6.5 4.0 5.3 100.0 36.8
> 29 71.6 71.6
Total 5.3 1.3 2.0 3.4 66.8 13.1
Source: Field data, 2012/2013
Figure 5.8 also shows that employment per firm in the Ngong’ cluster is higher than the
corresponding numbers for Gikomba and Kibuye. These numbers provide evidence to
Ngong Gikomba KibuyeInformal
sectorFormalsector
Total
Permanent 2.1 0.4 0.1 1.1 52.8 7.3
Casual 3.2 1.0 1.9 2.3 15.5 3.9
Total 5.3 1.3 2.0 3.4 66.8 13.1
0.0
10.0
20.0
30.0
40.0
50.0
60.0
70.0
80.0
No
. of
em
plo
ye
es

138
support the micro nature of informal sector enterprises that has been well articulated in the
literature on informal sector. This finding is further reinforced by the numbers in Table 5.7
which shows that although informal sector firms below age five employ the least number of
people among all the informal sectors clusters, the number of employees per firm in these
clusters generally does not seem to increase with age.
2.5.6 Relationship with financial institutions
The nature of a firm’s relationship with financial institutions can affect its operations including
choice of technology, as noted in Chapter 3. Formal sector firms tend to have a relatively
high degree of access to financial institutions compared to their informal counterparts. Figure
5.9 presents the proportion of the firms that have at least an account22 with a bank or
microfinance institution and the proportion that have applied for loan in the last two years
from any of these sources. Needless to say, all the formal sector firms have accounts
compared to 61% for the informal sector firms. Within the informal sector, the Ngong cluster
recorded the highest proportion for firms with accounts (74%), and Gikomba and Kibuye
follow in that order with 52% and 48.5% respectively. It should be noted that for the informal
sector, the accounts are generally used for business as well personal purposes, unlike the
formal sector firms which have accounts in the name of the businesses. Another difference
between formal and informal sector firms is that while formal sector firms deal with formal
banks, the informal sector firms normally do business with micro finance institutions
particularly with respect loan acquisition.
The proportion of the firms which have applied for loans in the last two years varies greatly
between the formal and informal sector firms. As shown in Figure 5.9, 50% of the formal
sector firms interviewed applied for loans while just about 23% of informal sector firms made
such applications. Within the informal sector, the Kibuye cluster recorded the lowest
proportion (18%), followed by Gikomba (24%), and then Ngong’ (26%).
22
The accounts referred to in this thesis do not include Mpesa accounts – mobile money account. The exclusion of Mpesa was the result of an oversight on the part of the researcher
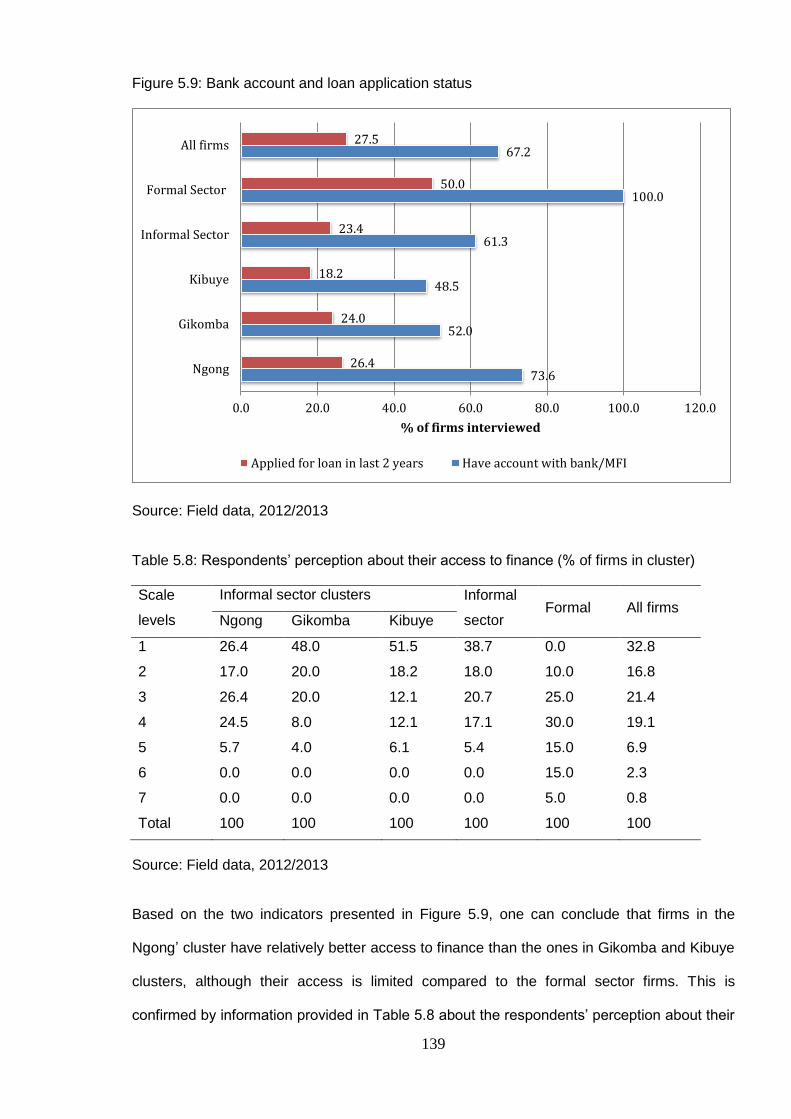
139
Figure 5.9: Bank account and loan application status
Source: Field data, 2012/2013
Table 5.8: Respondents’ perception about their access to finance (% of firms in cluster)
Scale
levels
Informal sector clusters Informal
sector Formal All firms
Ngong Gikomba Kibuye
1 26.4 48.0 51.5 38.7 0.0 32.8
2 17.0 20.0 18.2 18.0 10.0 16.8
3 26.4 20.0 12.1 20.7 25.0 21.4
4 24.5 8.0 12.1 17.1 30.0 19.1
5 5.7 4.0 6.1 5.4 15.0 6.9
6 0.0 0.0 0.0 0.0 15.0 2.3
7 0.0 0.0 0.0 0.0 5.0 0.8
Total 100 100 100 100 100 100
Source: Field data, 2012/2013
Based on the two indicators presented in Figure 5.9, one can conclude that firms in the
Ngong’ cluster have relatively better access to finance than the ones in Gikomba and Kibuye
clusters, although their access is limited compared to the formal sector firms. This is
confirmed by information provided in Table 5.8 about the respondents’ perception about their
73.6
52.0
48.5
61.3
100.0
67.2
26.4
24.0
18.2
23.4
50.0
27.5
0.0 20.0 40.0 60.0 80.0 100.0 120.0
Ngong
Gikomba
Kibuye
Informal Sector
Formal Sector
All firms
% of firms interviewed
Applied for loan in last 2 years Have account with bank/MFI
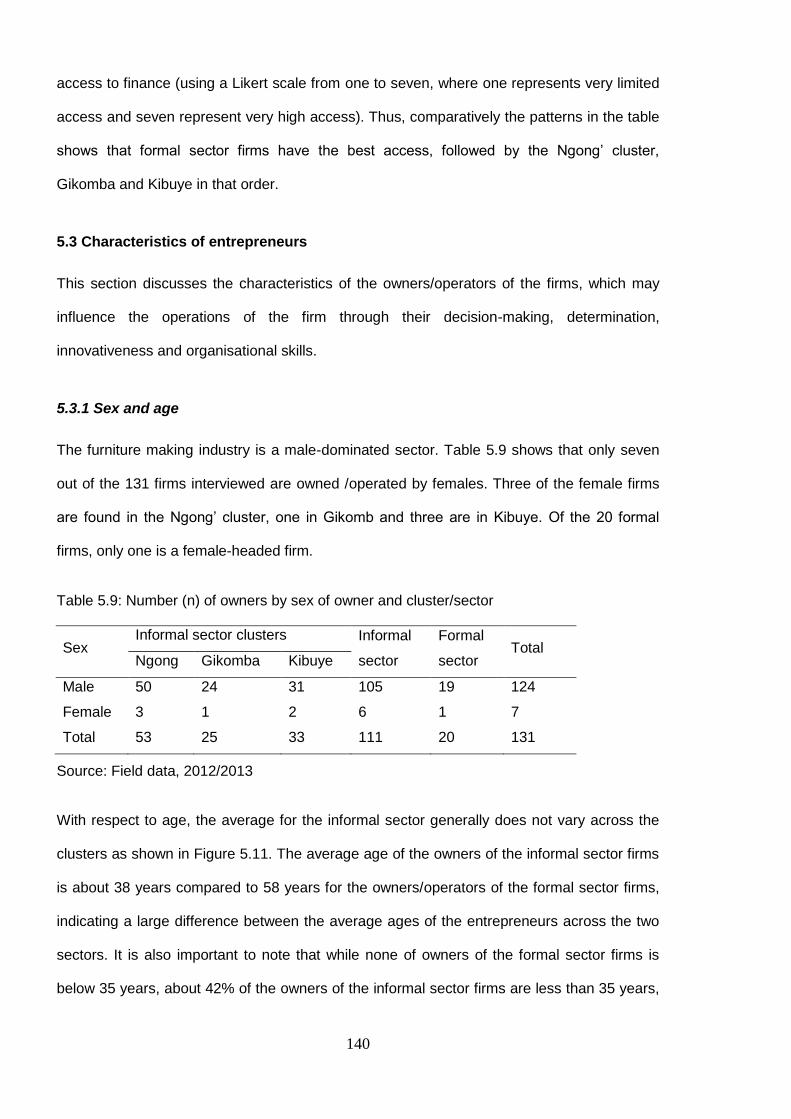
140
access to finance (using a Likert scale from one to seven, where one represents very limited
access and seven represent very high access). Thus, comparatively the patterns in the table
shows that formal sector firms have the best access, followed by the Ngong’ cluster,
Gikomba and Kibuye in that order.
5.3 Characteristics of entrepreneurs
This section discusses the characteristics of the owners/operators of the firms, which may
influence the operations of the firm through their decision-making, determination,
innovativeness and organisational skills.
5.3.1 Sex and age
The furniture making industry is a male-dominated sector. Table 5.9 shows that only seven
out of the 131 firms interviewed are owned /operated by females. Three of the female firms
are found in the Ngong’ cluster, one in Gikomb and three are in Kibuye. Of the 20 formal
firms, only one is a female-headed firm.
Table 5.9: Number (n) of owners by sex of owner and cluster/sector
Sex Informal sector clusters Informal
sector
Formal
sector Total
Ngong Gikomba Kibuye
Male 50 24 31 105 19 124
Female 3 1 2 6 1 7
Total 53 25 33 111 20 131
Source: Field data, 2012/2013
With respect to age, the average for the informal sector generally does not vary across the
clusters as shown in Figure 5.11. The average age of the owners of the informal sector firms
is about 38 years compared to 58 years for the owners/operators of the formal sector firms,
indicating a large difference between the average ages of the entrepreneurs across the two
sectors. It is also important to note that while none of owners of the formal sector firms is
below 35 years, about 42% of the owners of the informal sector firms are less than 35 years,
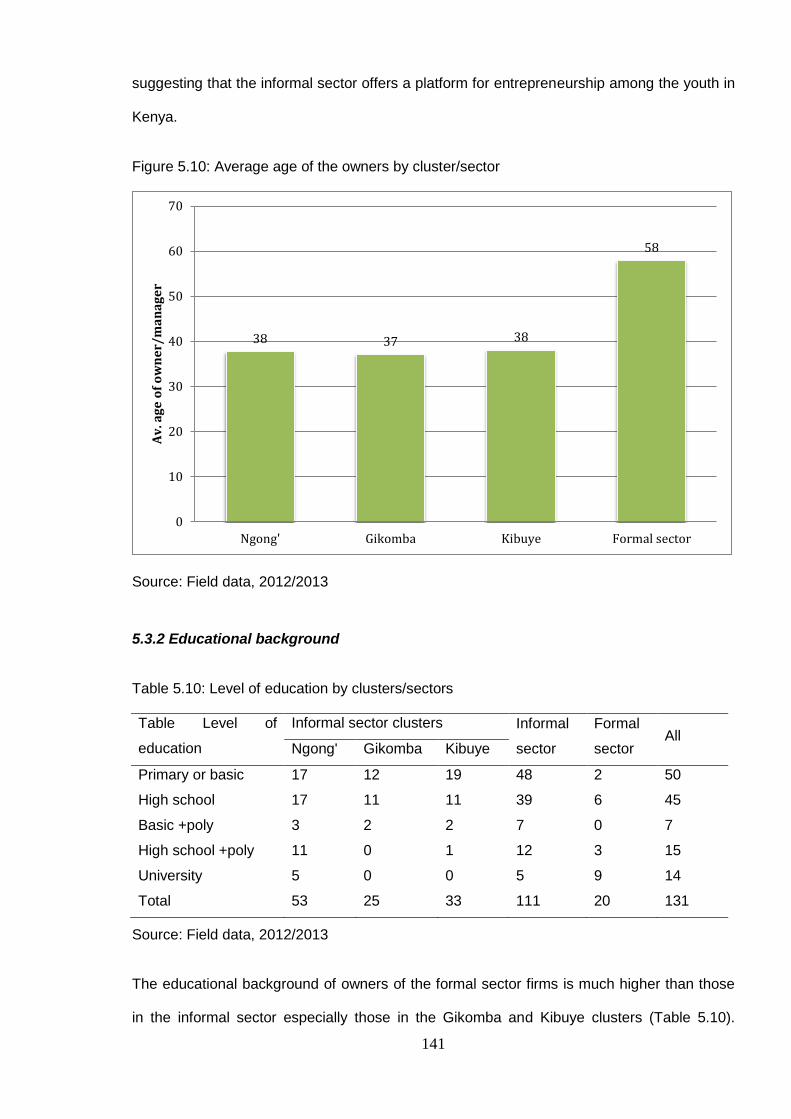
141
suggesting that the informal sector offers a platform for entrepreneurship among the youth in
Kenya.
Figure 5.10: Average age of the owners by cluster/sector
Source: Field data, 2012/2013
5.3.2 Educational background
Table 5.10: Level of education by clusters/sectors
Table Level of
education
Informal sector clusters Informal
sector
Formal
sector All
Ngong' Gikomba Kibuye
Primary or basic 17 12 19 48 2 50
High school 17 11 11 39 6 45
Basic +poly 3 2 2 7 0 7
High school +poly 11 0 1 12 3 15
University 5 0 0 5 9 14
Total 53 25 33 111 20 131
Source: Field data, 2012/2013
The educational background of owners of the formal sector firms is much higher than those
in the informal sector especially those in the Gikomba and Kibuye clusters (Table 5.10).
38 37 38
58
0
10
20
30
40
50
60
70
Ngong' Gikomba Kibuye Formal sector
Av
. ag
e o
f o
wn
er/
ma
na
ge
r
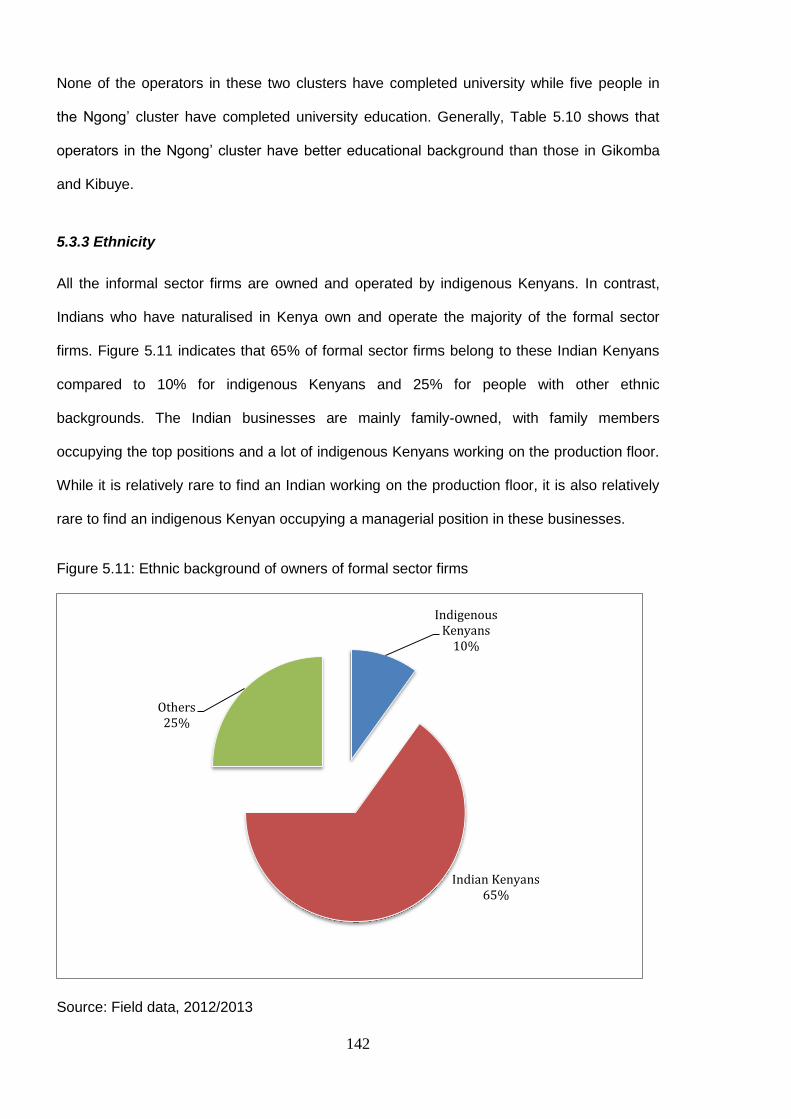
142
None of the operators in these two clusters have completed university while five people in
the Ngong’ cluster have completed university education. Generally, Table 5.10 shows that
operators in the Ngong’ cluster have better educational background than those in Gikomba
and Kibuye.
5.3.3 Ethnicity
All the informal sector firms are owned and operated by indigenous Kenyans. In contrast,
Indians who have naturalised in Kenya own and operate the majority of the formal sector
firms. Figure 5.11 indicates that 65% of formal sector firms belong to these Indian Kenyans
compared to 10% for indigenous Kenyans and 25% for people with other ethnic
backgrounds. The Indian businesses are mainly family-owned, with family members
occupying the top positions and a lot of indigenous Kenyans working on the production floor.
While it is relatively rare to find an Indian working on the production floor, it is also relatively
rare to find an indigenous Kenyan occupying a managerial position in these businesses.
Figure 5.11: Ethnic background of owners of formal sector firms
Source: Field data, 2012/2013
Indigenous Kenyans
10%
Indian Kenyans 65%
Others 25%
143
5.4 Conclusion
This chapter has presented a description of the firms and their operators in relation to the
clusters in which they operate. The chapter began by discussing the business registration
and tax obligation status of the firms, the nature of infrastructure/housing and social relations
in the clusters. Other equally important factors such as the age of the firms, their ownership
structure, products and target markets, linkages with other firms, employment by the firms
and their operators’ characteristics have been discussed.
An important conclusion from the discussion is that the firms I loosely referred to as formal
sector firms are distinctive from the others operating in the Gikomba, Ngong and Kibuye
clusters on almost all the characteristic indicators overviewed. However, the firms in the
Ngong’ cluster tend to exhibit (though to a limited extent) a few of the characteristics of the
formal sector firms especially with respect to the middle income consumer’s patronage for
their products, the education level of the operators and their access to finance. Although the
Ngong’ cluster firms appear distinctive from the rest of informal sector firms, they are
generally much more similar to those in Gikomba and Kibuye clusters than they are to the
formal sector firms. Based on his personal interaction with some of the operators in the
Ngong’ cluster, Christopher Bull described them as “jua kali” in a foreword to Steve Daniels’
book titled “Making Do”, published in 2010. By and large, the discussions in the subsequent
chapters of this thesis, thus, maintain the differentiation between the formal and informal
sectors as purported at the beginning of this chapter.
It should however be noted that the findings in this chapter generally seem to lend credence
to the structuralists’ belief particularly that of Moser (1978) and Portes et al. (1989): They
believe that informality is a continuum with varying degrees among firms. This view is
contrary to the dualist’s conceptualisation, discussed by Swaminathan (1991), which
maintains a strict dichotomy. The discussion in this chapter suggests that the degree of
informality is relatively high among firms operating in the Gikomba and Kibuye cluster,
compared to those in the Ngong’ cluster firms while it is relatively low among the firms I have
144
described as formal sector firms. The results also shed some light on the fact that the
informal sector is heterogeneous as pointed out by Becker (2004) and other authors. This
heterogeneity can occur even among firms in the same line of activity, as in the case of the
furniture making firms studied in this research. Whether the between-firm, between-cluster
and between-sector heterogeneities or differences are important for choice of technology and
transfer mode will be a central element of the discussions in the subsequent chapters
particularly Chapter 8. If such differences matter then the nature of technology choice in itself
may also serve as a defining characteristic of informality as suggested by writers such as
Joshi and Joshi (1976, cited in Swaminathan, 1991) and ILO (1972).
The next chapter examines the technical and economic characteristics of the technologies
studied in this research.

145
CHAPTER 6 : TECHNICAL AND ECONOMIC CHARACTERISTICS OF THE
TECHNOLOGIES
6.0 Introduction
This chapter discusses the technical and economic characteristics of the technologies. The
discussion on the technical characteristics focuses on the functions of the machines, the run
and physical characteristics such as size and capacity. The discussion on the economic
characteristics examines factors such as the purchasing and maintenance costs of the
machines, skill and infrastructure requirements for investing in the machines and the
economic implications of some of the technical characteristics. Because some of the
technical characteristics are closely linked to those that are economic, rather than neatly
drawing a line between what is technical and what is economic the discussions on these
broad themes are melded.
As argued in Chapters 3 and 4 which respectively discusses literature on technology choice
and the conceptual framework for this study, the choice or adoption of a particular technology
does not only depend on the factors relating to the decision maker (which have been
extensively discussed in Chapter 5) but also the characteristics of the technologies. The aim
of this chapter is to therefore provide information on the technical and economic
characteristics of the technologies, which will enable a greater understanding of the firms’
adoption or choice pattern between the three types of technologies, namely, Chinese
machines, Kenyan machines and advanced country machines. (It should be noted here that
the Kenyan technology refers to locally fabricated machines that are manufactured by
artisans operating in the jua kali or informal sector). The discussions in this chapter will also
help to identify the technology that may produce the desired development outcomes,
particularly in the context of Kenya’s development imperatives.
146
6.1 Functional description of machines
The discussions in this section are based on my field data and information from operating
manuals of machines from Wadkin, an English manufacturer of woodworking machines/tools
and Encyclopaedia Britannica. The section briefly describes the types of woodworking
machines studied in this thesis. As indicated in Chapter 4, the commonest woodworking
machines found in both the formal and informal sectors of Kenya’s furniture making industry
are the planer, band saw, saw bench and lathe. Other types of machines (e.g. panel saws,
sanders, mortisers and binders), which are more complicated than the machines studied in
this research, are also used in the formal sector but I could not find any of such complicated
machines in the informal sector including the Ngong’ cluster. Hence, the discussions in this
chapter only focus on planers, band saws, saw benches and lathes from China, Kenya and
advanced countries in order to allow for comparisons across the formal and informal sectors.
Later in the Chapter, locally modified Chinese planers are distinguished from those that are
not modified. Another distinction that will be discussed later is that between new and second
hand advanced country machines.
6.1.1 Planer/Thicknesser
Figure 6.1 presents photographs of planing machines from the three different sources
(China, Kenya and advanced countries). Panel A gives a typical example of the Chinese
planing machine found in Kenya’s furniture making industry while B is an advanced country
machine (specifically, it is an English-made machine) and C is a locally-made planing
machine. Strictly, the machines should be described as “multipurpose woodworking
machines” because they can perform several functions such as planing (i.e. surfacing and/or
thicknessing), ripping, crosscutting and sometimes other auxiliary functions such as boring
and grinding. Although, they may perform several functions, surfacing and/or thicknessing
are the main functions of these machines. (In order to simplify discourse around this type of
machine it is henceforth referred to as “planer”). The subsections below describe the main
functions of the planer in detail.

147
Figure 6.1: Photographs of planers from the three sources of machines
Source: Author’s field photography, 2012
Planing (Surfacing and thicknessing)
Planing simply involves smoothing the surface of a piece of wood through the use of a tool or
machine, herein referred to as planer. Depending on the flexibility of the functions of the
planer, planing can be done in two main ways: surfacing and thicknessing. Surfacing
involves placing the workpiece on the surfacing table – the smooth table-like surface of the
planer which is visible in all the pictures in Figure 6.1 – and pushing the workpiece over the
cutterblock (fixed at the indentation in middle of the surfacing table) which holds the cutter or
tool. Driven by an electric motor, as the cutterblock rotates, the cutter removes the rough
surface of the wood. For a long workpiece, two people are required to perform this function;
a. Chinese planer b. English planer
c. Kenyan planer
An appended saw bench
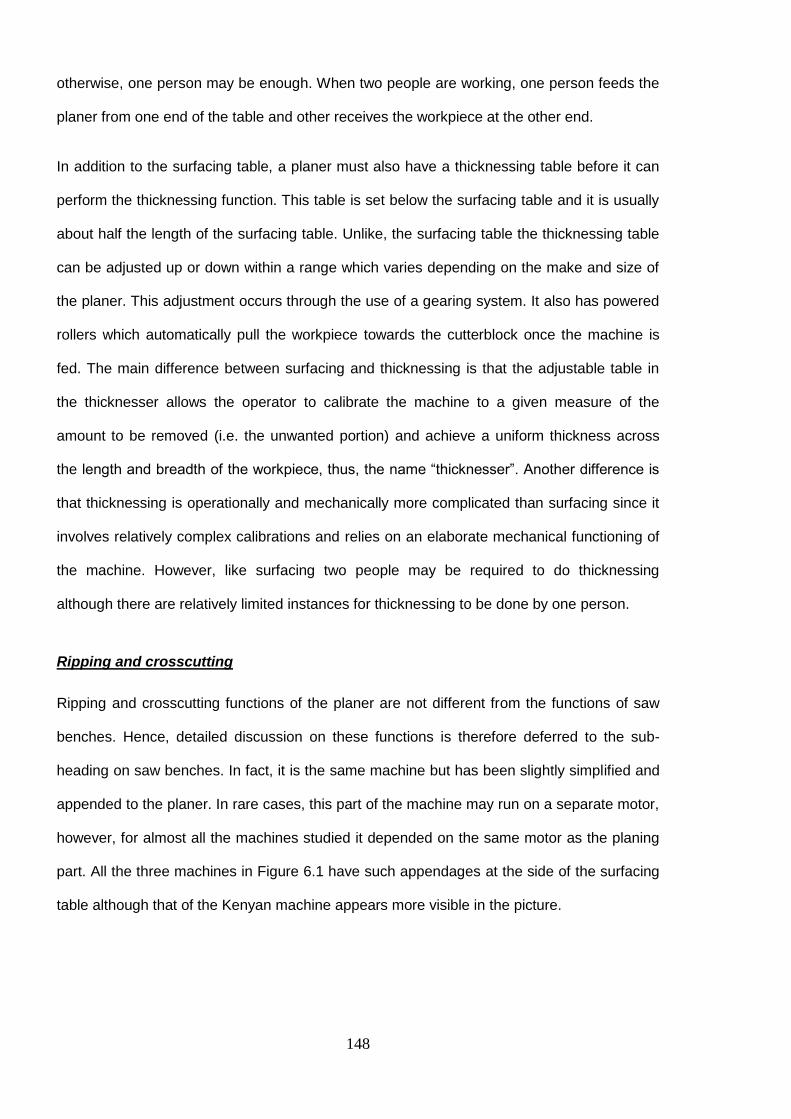
148
otherwise, one person may be enough. When two people are working, one person feeds the
planer from one end of the table and other receives the workpiece at the other end.
In addition to the surfacing table, a planer must also have a thicknessing table before it can
perform the thicknessing function. This table is set below the surfacing table and it is usually
about half the length of the surfacing table. Unlike, the surfacing table the thicknessing table
can be adjusted up or down within a range which varies depending on the make and size of
the planer. This adjustment occurs through the use of a gearing system. It also has powered
rollers which automatically pull the workpiece towards the cutterblock once the machine is
fed. The main difference between surfacing and thicknessing is that the adjustable table in
the thicknesser allows the operator to calibrate the machine to a given measure of the
amount to be removed (i.e. the unwanted portion) and achieve a uniform thickness across
the length and breadth of the workpiece, thus, the name “thicknesser”. Another difference is
that thicknessing is operationally and mechanically more complicated than surfacing since it
involves relatively complex calibrations and relies on an elaborate mechanical functioning of
the machine. However, like surfacing two people may be required to do thicknessing
although there are relatively limited instances for thicknessing to be done by one person.
Ripping and crosscutting
Ripping and crosscutting functions of the planer are not different from the functions of saw
benches. Hence, detailed discussion on these functions is therefore deferred to the sub-
heading on saw benches. In fact, it is the same machine but has been slightly simplified and
appended to the planer. In rare cases, this part of the machine may run on a separate motor,
however, for almost all the machines studied it depended on the same motor as the planing
part. All the three machines in Figure 6.1 have such appendages at the side of the surfacing
table although that of the Kenyan machine appears more visible in the picture.

149
6.1.2 Band saw
Figure 6.2: Photographs of band saws from the three sources of machines
Source: Author’s field photography, 2012
a. Chinese bandsaw
b. Adv. bandsaw
c. Kenya bandsaw
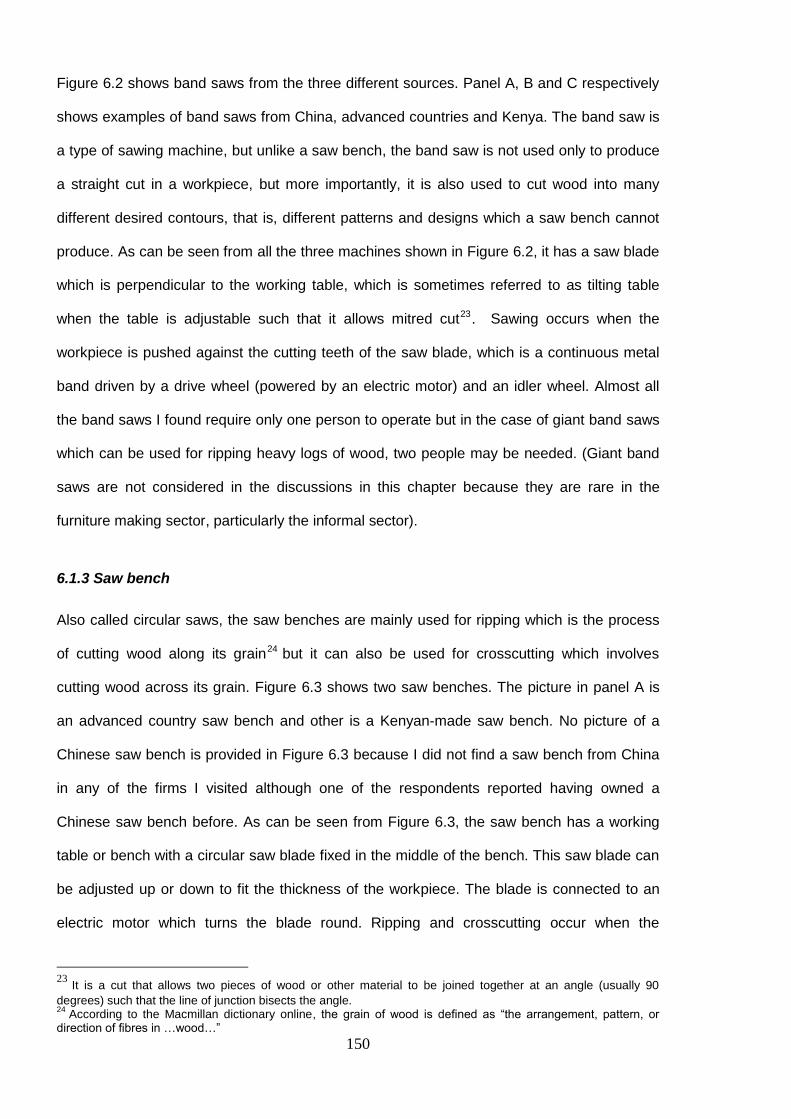
150
Figure 6.2 shows band saws from the three different sources. Panel A, B and C respectively
shows examples of band saws from China, advanced countries and Kenya. The band saw is
a type of sawing machine, but unlike a saw bench, the band saw is not used only to produce
a straight cut in a workpiece, but more importantly, it is also used to cut wood into many
different desired contours, that is, different patterns and designs which a saw bench cannot
produce. As can be seen from all the three machines shown in Figure 6.2, it has a saw blade
which is perpendicular to the working table, which is sometimes referred to as tilting table
when the table is adjustable such that it allows mitred cut23. Sawing occurs when the
workpiece is pushed against the cutting teeth of the saw blade, which is a continuous metal
band driven by a drive wheel (powered by an electric motor) and an idler wheel. Almost all
the band saws I found require only one person to operate but in the case of giant band saws
which can be used for ripping heavy logs of wood, two people may be needed. (Giant band
saws are not considered in the discussions in this chapter because they are rare in the
furniture making sector, particularly the informal sector).
6.1.3 Saw bench
Also called circular saws, the saw benches are mainly used for ripping which is the process
of cutting wood along its grain24 but it can also be used for crosscutting which involves
cutting wood across its grain. Figure 6.3 shows two saw benches. The picture in panel A is
an advanced country saw bench and other is a Kenyan-made saw bench. No picture of a
Chinese saw bench is provided in Figure 6.3 because I did not find a saw bench from China
in any of the firms I visited although one of the respondents reported having owned a
Chinese saw bench before. As can be seen from Figure 6.3, the saw bench has a working
table or bench with a circular saw blade fixed in the middle of the bench. This saw blade can
be adjusted up or down to fit the thickness of the workpiece. The blade is connected to an
electric motor which turns the blade round. Ripping and crosscutting occur when the
23
It is a cut that allows two pieces of wood or other material to be joined together at an angle (usually 90
degrees) such that the line of junction bisects the angle. 24
According to the Macmillan dictionary online, the grain of wood is defined as “the arrangement, pattern, or direction of fibres in …wood…”

151
workpiece is pushed against the saw blade with the appropriate side of the grain. For smaller
workpiece, one person can perform any of the functions but when working on heavy
workpiece two persons are always needed especially in the case of ripping.
Figure 6.3: Photographs of saw benches from Kenya and advanced country
Source: Author’s field photography, 2012
6.1.4 Lathe machine
The Encyclopaedia Britannica online defines lathe as a “machine tool that performs turning
operations in which unwanted material is removed from a workpiece rotated against a cutting
tool”. Figure 6.4 shows pictures of the lathe machines from the different sources. Panel A is
the Chinese lathe machine, Panel B shows an example of advanced country lathe machine
while Panel C shows a locally fabricated lathe machine. This machine is also power-driven
by an electric motor, which connects to a rotating horizontal spindle. The workpiece is held
between the two ends of the machine called the headstock which holds the horizontal spindle
and the tailstock which can be moved or adjusted along the bed of the machine. The bed of
the machine is the horizontal metal frame on which the headstock and the tailstock sit.
During turning, a hand-held cutter is firmly positioned against the workpiece, with the cutter
lying on a tool rest which may be adjustable along the bed. The non-adjustable tool rest
normally takes the full length of the allowable space between the two ends, which are also
called centres. This machine is used to turn a wood into cylindrical and cone-like shapes
a. Adv. circular saw a. Kenya circular saw

152
which are sometimes variegated along the length of the workpiece. A careful look at the
lower right corner of the picture in panel C of Figure 6.4 shows examples of finished
workpiece from the Kenyan lathe machine. Unlike the other machines particularly the planer
and the saw bench, the lathe machine always require only one person to operate it.
Figure 6.4: Photographs of lathe machines from the three sources of machines
Source: Author’s field photography, 2012
6.2 Durability and quality, purchasing and maintenance costs
This section discusses the purchasing cost, quality, durability and the daily run of the
machines. The lifespan (actual life and expected life) of the machines are used as the
indicator for durability. The actual life is the number of years a firm has had or used the
machine while the expected life is the actual life of the machine plus any additional number
of years the firm expect to use the machine before the machine is discarded or scrapped.
a. Chinese lathe
b. Adv. Lathe c. Kenya lathe

153
Also discussed in this section is the capital consumption (or investment) per annum for the
technologies, which have been estimated, based on the expected life of the machines and
the current purchasing cost.
6.2.1 Durability and quality
Table 6.1 presents the lifespan of the machines. Also in the table are the numbers of
machines (N) studied for each type. These numbers roughly indicate the extent of
penetration of the different sources for each type of machines, which is extensively
discussed in Chapter 8. The table shows that the advanced county machines used in
Kenya‘s furniture making industry are very old compared to those from the other two
sources, particularly the Chinese machines. Most of the advanced country machines I found
in the workshops of the furniture making firms in Kenya (particularly the four types of
machines studied in this chapter) could be regarded as vintage machines. Popular brands I
found include Wadkin, Robinson, Dominion, and Startrite. Some of these companies are no
longer in existence. Information gathered from the Internet 25 shows that Robinson and
Dominion have folded while Dalton Ltd acquired the financially distressed Wadkin in the early
part of the 2000s (Dalton Ltd, 2013).
Table 6.1 indicates a huge age difference between the Chinese and the advanced country
planers (especially those that were bought new). With an average of 4.2 years, the minimum
number of years of use for the Chinese machines is one year and the maximum is 10 years.
The corresponding average, minimum and maximum values for the advanced country
planers which were new from factory when purchased are 35, 12 and 46 years respectively.
Using the year in which the current users purchased the second hand machines26 as the
reference or starting year, the table further shows that the new Chinese planers are much
younger than the used or second hand planers from advanced countries and the locally
fabricated planer. The information provided on band saws, saw benches and lathe in Table
25
Brighouse Echo (2012) and http://www.woodmachinery.f9.co.uk/robinson.html (accessed on 26 July 2013) 26
I use the term second hand machines to refer to all used machines irrespective of the number of times they have been passed down from one person to another between the first owner and the current owner.
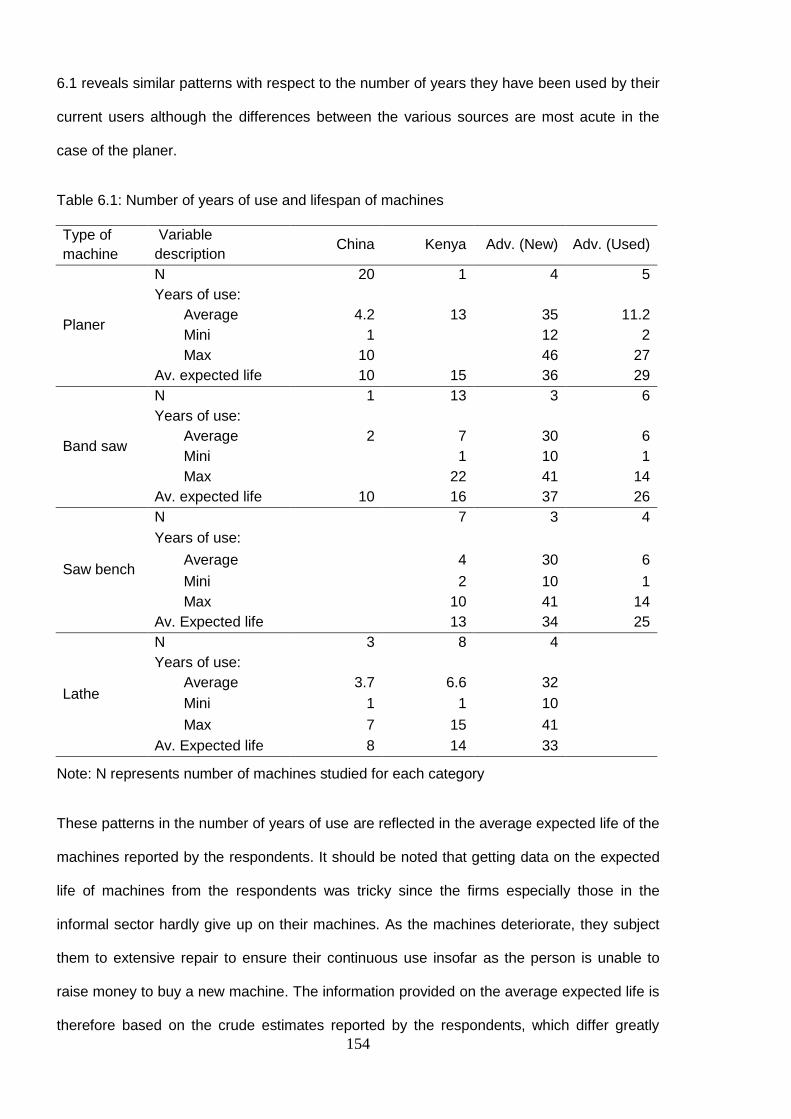
154
6.1 reveals similar patterns with respect to the number of years they have been used by their
current users although the differences between the various sources are most acute in the
case of the planer.
Table 6.1: Number of years of use and lifespan of machines
Type of
machine
Variable
description China Kenya Adv. (New) Adv. (Used)
Planer
N 20 1 4 5
Years of use:
Average 4.2 13 35 11.2
Mini 1
12 2
Max 10
46 27
Av. expected life 10 15 36 29
Band saw
N 1 13 3 6
Years of use:
Average 2 7 30 6
Mini
1 10 1
Max
22 41 14
Av. expected life 10 16 37 26
Saw bench
N 7 3 4
Years of use:
Average
4 30 6
Mini
2 10 1
Max
10 41 14
Av. Expected life 13 34 25
Lathe
N 3 8 4
Years of use:
Average 3.7 6.6 32
Mini 1 1 10
Max 7 15 41
Av. Expected life 8 14 33
Note: N represents number of machines studied for each category
These patterns in the number of years of use are reflected in the average expected life of the
machines reported by the respondents. It should be noted that getting data on the expected
life of machines from the respondents was tricky since the firms especially those in the
informal sector hardly give up on their machines. As the machines deteriorate, they subject
them to extensive repair to ensure their continuous use insofar as the person is unable to
raise money to buy a new machine. The information provided on the average expected life is
therefore based on the crude estimates reported by the respondents, which differ greatly

155
across the respondents mainly due to differences in their maintenance and handling culture.
Moreover, respondents’ whose machines are relatively new in terms of the date of purchase
appeared to be more conservative on the estimates they provided than the others,
particularly with respect to advanced country machines.
In spite of the above shortcomings, the data on expected life of the machines provide an
insight into the differences in the lives of the machines from the three sources. While a brand
new advanced country planer might last for 36 years if it was purchased new and 29 years if
it was a second hand machine, as shown in Table 6.1, a brand new Chinese planer is
expected to last for about 10 years, which is less than the expected life of the single planer
from Kenya (15 years). Also, for the other machines, those from China have the lowest
expected life, followed by those fabricated locally and then the advanced country machines.
Thus, with respect to expected life, there are stark differences between advanced country
machines and the other two sources and this is true for each type of the machines.
A major reason for the differences in the years of use and expected life of the machines is
quality differences in the machines from the various sources. The quality differences do not
only relate to the longevity or run of the machines but also important are factors such as
functionality, particularly the precision and flexibility embedded in the functions of the
machines, as discussed later in this subsection. Such quality differences might explain the
differences in the number of years of use observed for the three sources and between the
four types of machines. For example, the interviewees generally believe that the Chinese
lathe machine is poorer in quality compared to the locally fabricated lathe whilst the Chinese
planer is better than the locally fabricated planer, specifically in terms of functions such as
surfacing and thicknessing (Field interviews, 2012). It should be noted here that if the quality
differences were not real, the respondents would still report lower years of use and expected
life for the Chinese machines, although, not to the extent reported. The reason is that the
influx of Chinese machines into Kenya is a recent phenomenon which became relatively
apparent in the early 2000s, with importation still surging year after year, as discussed in
156
Chapter 1. The implication is that Chinese machines used in Kenya would be relatively new
in terms of age even if their quality were comparable to those from advanced countries.
By the average expected life, it can be concluded that the advanced country machines are
the most durable among the three types of technologies studied. A respondent from the
informal sector confirms this in a statement with particular reference to machines from
England: “England machines are the best, when you buy one, you can give it to your child
and even your child can also give it to his child” (Field interview, 2012). All the respondents
from both formal and informal sector firms noted that the advanced country machines last
much longer than Chinese machines. According to them, the reason is that the machines
from advanced countries, particularly England, are well constructed with good materials. This
is evident in what a respondent who had invested in Chinese planer noted: “This one is not a
perfect [machine], I bought it because I don’t have the money to buy the best one [England-
made machine]. Even if you buy the one from jua kali they last longer … but they don’t give a
good work like the China one”. All the respondents from the informal sector made similar
comments concerning the durability of Chinese machines, except two people with Chinese
planers, of whom one said “… in terms of durability, the jua kali is not better than China but
because they [jua kali machines] are cheap, we buy them and they are able to perform”
(Field interview, 2012). The two however acknowledged that for band saws and lathe
machines, those from Kenya last longer than those from China.
Further information on other aspects of quality (such as precision and flexibility of functions
and run are discussed in the subsections that follow) provides more evidence about the
differences between these three sources of machines used in the furniture making industry in
Kenya.
Precision of functions/quality of work done
According to the Oxford Dictionary (online), precision in this context refers to technical
refinement in producing measurements or specifications. Thus, in literal terms, it is the ability
of a machine (for example a band saw) to exactly produce intended shapes or cuts baring
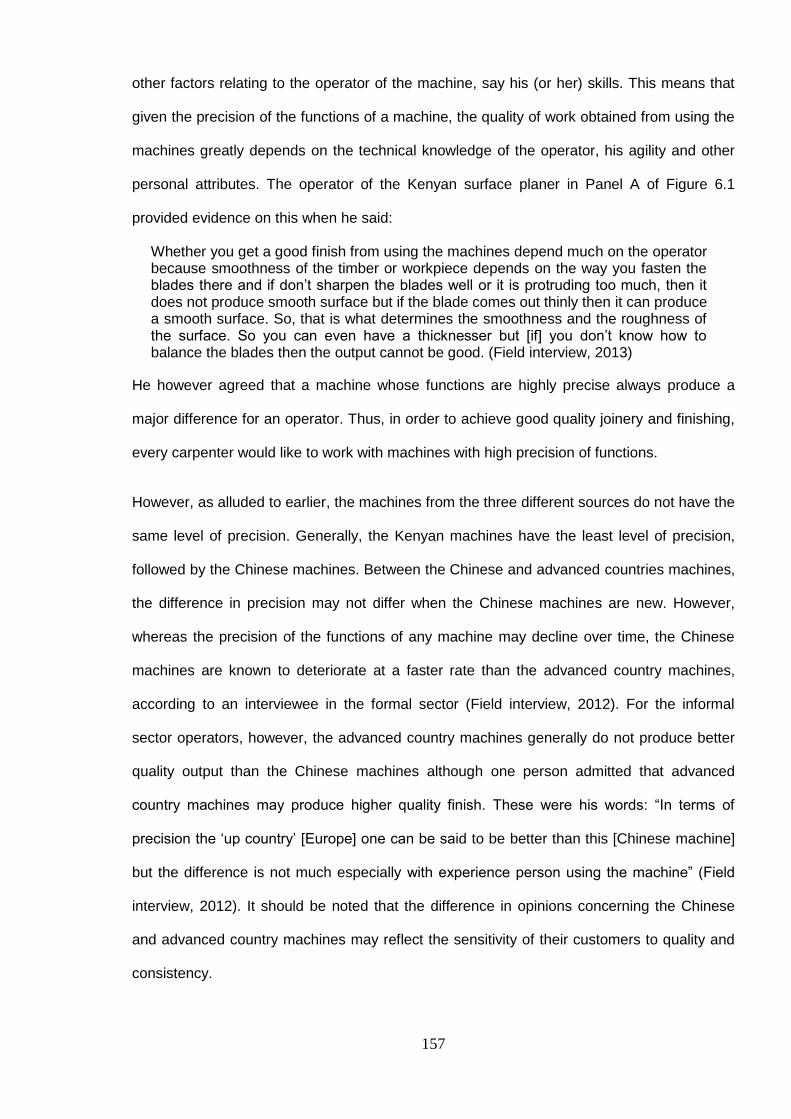
157
other factors relating to the operator of the machine, say his (or her) skills. This means that
given the precision of the functions of a machine, the quality of work obtained from using the
machines greatly depends on the technical knowledge of the operator, his agility and other
personal attributes. The operator of the Kenyan surface planer in Panel A of Figure 6.1
provided evidence on this when he said:
Whether you get a good finish from using the machines depend much on the operator because smoothness of the timber or workpiece depends on the way you fasten the blades there and if don’t sharpen the blades well or it is protruding too much, then it does not produce smooth surface but if the blade comes out thinly then it can produce a smooth surface. So, that is what determines the smoothness and the roughness of the surface. So you can even have a thicknesser but [if] you don’t know how to balance the blades then the output cannot be good. (Field interview, 2013)
He however agreed that a machine whose functions are highly precise always produce a
major difference for an operator. Thus, in order to achieve good quality joinery and finishing,
every carpenter would like to work with machines with high precision of functions.
However, as alluded to earlier, the machines from the three different sources do not have the
same level of precision. Generally, the Kenyan machines have the least level of precision,
followed by the Chinese machines. Between the Chinese and advanced countries machines,
the difference in precision may not differ when the Chinese machines are new. However,
whereas the precision of the functions of any machine may decline over time, the Chinese
machines are known to deteriorate at a faster rate than the advanced country machines,
according to an interviewee in the formal sector (Field interview, 2012). For the informal
sector operators, however, the advanced country machines generally do not produce better
quality output than the Chinese machines although one person admitted that advanced
country machines may produce higher quality finish. These were his words: “In terms of
precision the ‘up country’ [Europe] one can be said to be better than this [Chinese machine]
but the difference is not much especially with experience person using the machine” (Field
interview, 2012). It should be noted that the difference in opinions concerning the Chinese
and advanced country machines may reflect the sensitivity of their customers to quality and
consistency.

158
For Kenyan machines, their precision is comparatively low right from when they are new
except the lathe machine, which according to the respondents is able to produce good
quality work. A respondent with many years of experience in woodwork and who has been
using both Chinese and Kenyan machines explained the low precision of the Kenyan
machines as follows:
For all jua kali machines, the material used is a malleable metal while the ones from Europe or China are from cast iron and you see cast materials are right more than other irons [materials], that means there is not much expansions occurring in the metal over time. But with these jua kali machines, because of the looseness of these joints, they easily knock the blades out of place. It is not easy for a jua kali to cast steel so they use plates and weld them together; that is not like the cast iron or steel. So in terms of the precision, you can’t get it up to the level of China or England made machines. (Field interview, 2012)
A careful comparison between the Kenyan machines and the others, shown in Figures 6.1 to
6.4, particularly the planers, confirms what the respondent said. The bodies or frame of the
Kenyan machines are constructed by welding patterned pieces of metal sheets and bars
together while the frames for the others have been cast.
Another statement from a different respondent in the informal sector lays more emphasis on
the extent to which Chinese machines are superior to the Kenyan machines with respect to
precision:
The Chinese machines have helped us a lot. You know when we used to work with these jua kali machines [only], the work we were doing were not accurate especially planing. When somebody brings you his timber, maybe six-by-one and you want to reduce it by half inch … the jua kali machines we used to plane it on the top [surfacing], and there was no gauge. So after planing, you will realise that it was not accurate, somewhere will be one inch, another half and another three-quarters [you won’t get the same thickness across the length of the wood]. So with the introduction of these modern machines from China, our work has improved because it gives you what you want. And it makes the joinery and finishing work easier, you don’t do a lot of hand planing and sanding; the smoothness is fine and our work has become faster because during those time it was slow, very much slow. (Field interview, 2012)
Flexibility of functions
According to Sethi and Sethi, “Machine flexibility refers to the various types of operations that
the machine can perform without requiring a prohibitive effort in switching from one operation
to another” (1990 p 298). High flexibility of woodworking machines may therefore be crucial
because it permits a range of different cuts, shapes or patterns to be achieved with less
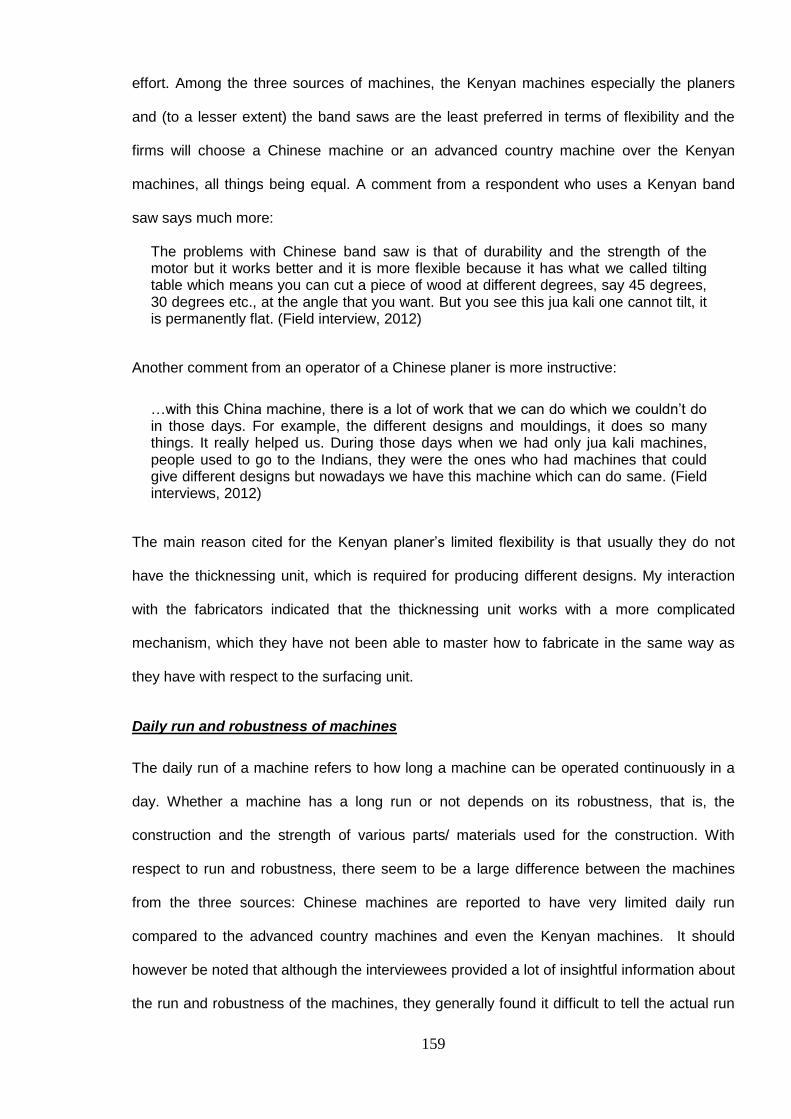
159
effort. Among the three sources of machines, the Kenyan machines especially the planers
and (to a lesser extent) the band saws are the least preferred in terms of flexibility and the
firms will choose a Chinese machine or an advanced country machine over the Kenyan
machines, all things being equal. A comment from a respondent who uses a Kenyan band
saw says much more:
The problems with Chinese band saw is that of durability and the strength of the motor but it works better and it is more flexible because it has what we called tilting table which means you can cut a piece of wood at different degrees, say 45 degrees, 30 degrees etc., at the angle that you want. But you see this jua kali one cannot tilt, it is permanently flat. (Field interview, 2012)
Another comment from an operator of a Chinese planer is more instructive:
…with this China machine, there is a lot of work that we can do which we couldn’t do in those days. For example, the different designs and mouldings, it does so many things. It really helped us. During those days when we had only jua kali machines, people used to go to the Indians, they were the ones who had machines that could give different designs but nowadays we have this machine which can do same. (Field interviews, 2012)
The main reason cited for the Kenyan planer’s limited flexibility is that usually they do not
have the thicknessing unit, which is required for producing different designs. My interaction
with the fabricators indicated that the thicknessing unit works with a more complicated
mechanism, which they have not been able to master how to fabricate in the same way as
they have with respect to the surfacing unit.
Daily run and robustness of machines
The daily run of a machine refers to how long a machine can be operated continuously in a
day. Whether a machine has a long run or not depends on its robustness, that is, the
construction and the strength of various parts/ materials used for the construction. With
respect to run and robustness, there seem to be a large difference between the machines
from the three sources: Chinese machines are reported to have very limited daily run
compared to the advanced country machines and even the Kenyan machines. It should
however be noted that although the interviewees provided a lot of insightful information about
the run and robustness of the machines, they generally found it difficult to tell the actual run

160
of their machines because the nature of their production and/ or market demand rarely
necessitate continuous use of the machines throughout the day.
Box 6.1 provides illustrations of the comments from the respondents concerning planers from
the three sources. A glance through the comments shows that a Chinese planer can barely
operate continuously for three hours. Apart from resting throughout the night, it needs to rest
Box 6.1: Respondents’ comments about the run of the planers
China planer
“You know it depends on the motor. If you have a high capacity motor, then it even work for 24 hours. Right now for me it does about three hours and it has to stop because it may overheat. You see, what I have is a Chinese motor but if I had an England motor of the same horse power, it could go for longer hours. After each three hours, I have to wait for about 30 minutes before starting again. So I only can operate for about seven to eight hours a day”.
“It could work for only three hours continuously if I did not change the motor. Now, it can work from morning till evening if there is work without stopping. That is why I did the overhaul. If I did not do the overhaul it could work for three hours and you will have to stop for the motor cool for about 30 minutes to 1 hour, then you work for three hours then you stop again”.
“It cannot work for one hour continuously because that motor cannot contain the amount of pressure…it cannot work for long hours like the England machines”.
“I am able to operate for about six hours per day. But you have to stop for it rest half an hour after each two hours”. “It work for about eight hours in a day but within the eight hours you will have to allow it to rest for about 30 minutes after every one hour”.
“This planing machine before I changed [the motor], I could not even use continuously for an hour unless you plane for 20 minutes and then you wait for it to cool down. Now that I changed the motor, it can even work for five hours continuous”.
“I think 6 hours is enough because if you use for long hours it can affect the motor; it will ruin the motor. Then within the six hours I will have to give it about 30 minutes to cool down after about every two hours”.
“The Chinese machines, they cannot work in a mass production area because of their motors, their make… you find them they are not very strong … and we people sometimes we work at high rates…”.
Advanced country planers
“This one of ours, it can work all the time without overheating. It can work on a whole lorry of timber. When it is overloaded, it goes off by itself; that is how it has been made to work”.
“…this planer can work for four to five hours continuously without any problem. I haven't had any problem”.
“This machine can work for 24 hours per day but you have to stop for it to cool for about 30 minutes to an hour. Within 24 hours, you will have to stop for about two times to allow the motor to cool down a bit. But it actually depends on the motor; if you have weak motor then you cannot operate it for long hours”.
Jua kali
“…the motor on the jua kali planing machine is bigger than those from China. So the more you are using that one there is a time that the temperature starts rising after working for long hours. It has a fan to cool but this is normal for that machine after operating for long”.
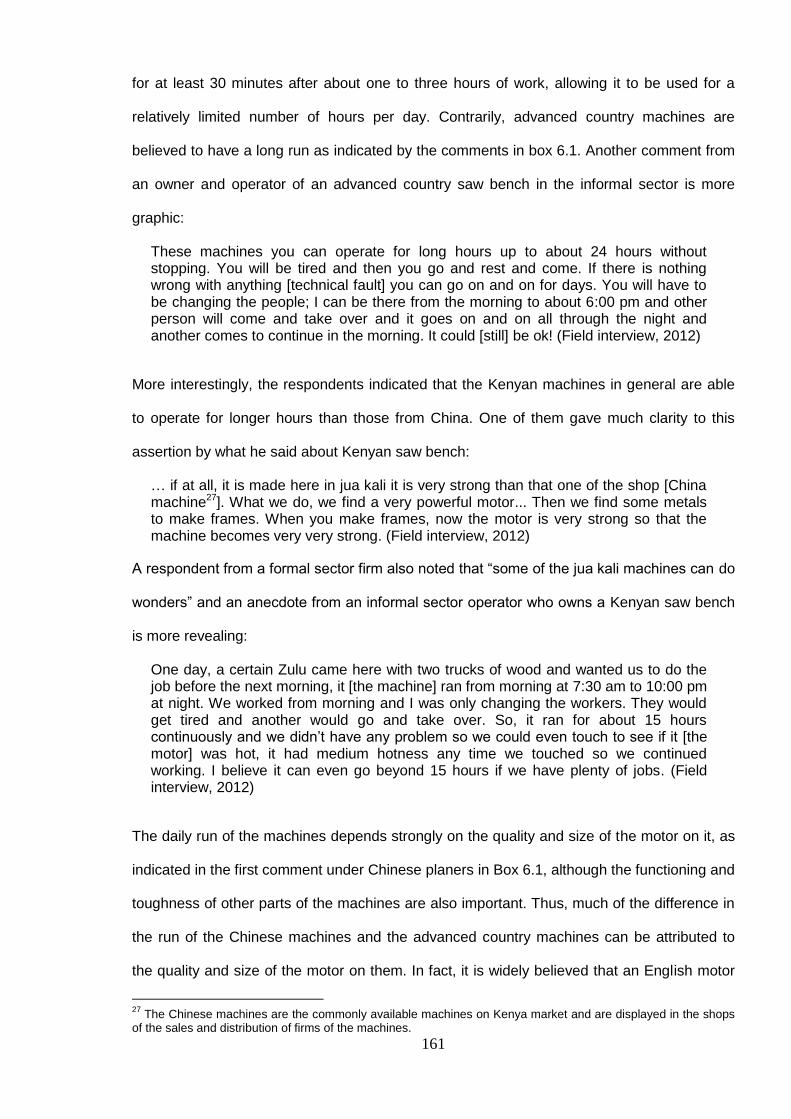
161
for at least 30 minutes after about one to three hours of work, allowing it to be used for a
relatively limited number of hours per day. Contrarily, advanced country machines are
believed to have a long run as indicated by the comments in box 6.1. Another comment from
an owner and operator of an advanced country saw bench in the informal sector is more
graphic:
These machines you can operate for long hours up to about 24 hours without stopping. You will be tired and then you go and rest and come. If there is nothing wrong with anything [technical fault] you can go on and on for days. You will have to be changing the people; I can be there from the morning to about 6:00 pm and other person will come and take over and it goes on and on all through the night and another comes to continue in the morning. It could [still] be ok! (Field interview, 2012)
More interestingly, the respondents indicated that the Kenyan machines in general are able
to operate for longer hours than those from China. One of them gave much clarity to this
assertion by what he said about Kenyan saw bench:
… if at all, it is made here in jua kali it is very strong than that one of the shop [China machine27]. What we do, we find a very powerful motor... Then we find some metals to make frames. When you make frames, now the motor is very strong so that the machine becomes very very strong. (Field interview, 2012)
A respondent from a formal sector firm also noted that “some of the jua kali machines can do
wonders” and an anecdote from an informal sector operator who owns a Kenyan saw bench
is more revealing:
One day, a certain Zulu came here with two trucks of wood and wanted us to do the job before the next morning, it [the machine] ran from morning at 7:30 am to 10:00 pm at night. We worked from morning and I was only changing the workers. They would get tired and another would go and take over. So, it ran for about 15 hours continuously and we didn’t have any problem so we could even touch to see if it [the motor] was hot, it had medium hotness any time we touched so we continued working. I believe it can even go beyond 15 hours if we have plenty of jobs. (Field interview, 2012)
The daily run of the machines depends strongly on the quality and size of the motor on it, as
indicated in the first comment under Chinese planers in Box 6.1, although the functioning and
toughness of other parts of the machines are also important. Thus, much of the difference in
the run of the Chinese machines and the advanced country machines can be attributed to
the quality and size of the motor on them. In fact, it is widely believed that an English motor
27
The Chinese machines are the commonly available machines on Kenya market and are displayed in the shops of the sales and distribution of firms of the machines.
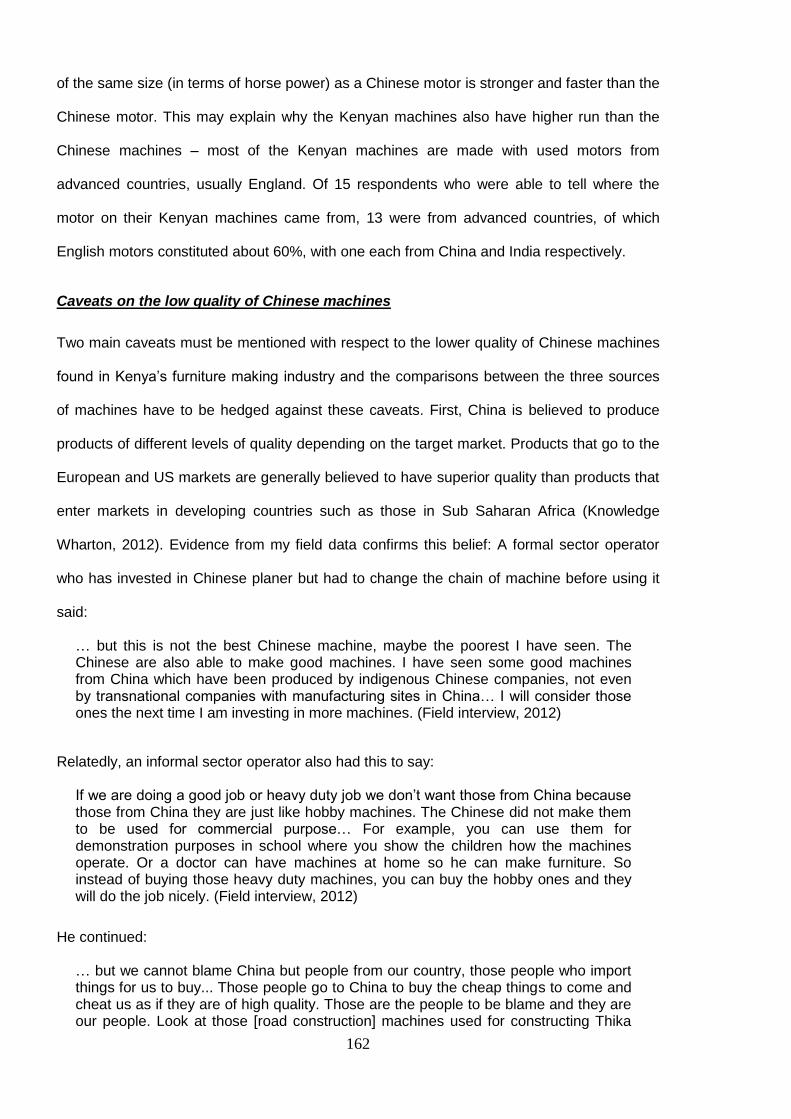
162
of the same size (in terms of horse power) as a Chinese motor is stronger and faster than the
Chinese motor. This may explain why the Kenyan machines also have higher run than the
Chinese machines – most of the Kenyan machines are made with used motors from
advanced countries, usually England. Of 15 respondents who were able to tell where the
motor on their Kenyan machines came from, 13 were from advanced countries, of which
English motors constituted about 60%, with one each from China and India respectively.
Caveats on the low quality of Chinese machines
Two main caveats must be mentioned with respect to the lower quality of Chinese machines
found in Kenya’s furniture making industry and the comparisons between the three sources
of machines have to be hedged against these caveats. First, China is believed to produce
products of different levels of quality depending on the target market. Products that go to the
European and US markets are generally believed to have superior quality than products that
enter markets in developing countries such as those in Sub Saharan Africa (Knowledge
Wharton, 2012). Evidence from my field data confirms this belief: A formal sector operator
who has invested in Chinese planer but had to change the chain of machine before using it
said:
… but this is not the best Chinese machine, maybe the poorest I have seen. The Chinese are also able to make good machines. I have seen some good machines from China which have been produced by indigenous Chinese companies, not even by transnational companies with manufacturing sites in China… I will consider those ones the next time I am investing in more machines. (Field interview, 2012)
Relatedly, an informal sector operator also had this to say:
If we are doing a good job or heavy duty job we don’t want those from China because those from China they are just like hobby machines. The Chinese did not make them to be used for commercial purpose… For example, you can use them for demonstration purposes in school where you show the children how the machines operate. Or a doctor can have machines at home so he can make furniture. So instead of buying those heavy duty machines, you can buy the hobby ones and they will do the job nicely. (Field interview, 2012)
He continued:
… but we cannot blame China but people from our country, those people who import things for us to buy... Those people go to China to buy the cheap things to come and cheat us as if they are of high quality. Those are the people to be blame and they are our people. Look at those [road construction] machines used for constructing Thika

163
Road 28 . They come from their country [China] and they are very strong. (Field interview, 2012)
After visiting many sales and distribution points, I found that the “hobby” Chinese machines
are the most available on the Kenyan market.
The second caveat is that current or recent generation of machines whether from China or
advanced countries are believed to be of inferior quality compared to the vintage machines.
Hence, given that the advanced country machines used in Kenya’s furniture making industry
are much older than those from China, they will tend to possess higher desirable qualities
particularly in terms of durability, run and robustness. An interview with a sales and
distribution firm confirmed this as does the following comment from informal sector operator,
who owns a very old band saw from one of the advanced countries:
You can’t make it for today; it is very strong, very good; nobody can… even Mzungu29 they can’t make it now because that will mean they will be killing their job. Because in those days, they made them to make their names forever; to be remembered forever. They were not making them because of money or whatever but your name. If at all, you are called Robinson you may still now be remembered. But for today, nobody can agree to do this high quality machines. (Field interview, 2012)
6.2.2 Purchasing cost and annual capital consumption per worker
Table 6.2 indicates the annual capital consumption per worker and the purchasing cost of the
four machines from the three sources. Rather than relying on the historical data on
acquisition cost, the current purchasing costs of the machines are used for the computations
and comparisons. I obtained the current purchasing cost through a triangulation between
data on perceived replacement cost of the machines from the manufacturing firms, prevailing
market prices from marketing and distribution firms and the Internet. These sources helped
to provide estimates about how much the machines would cost if they were to be purchased
at time of the survey. This triangulation was done because the relevant decision making
variable when choosing between different sources of machines is the amount the firm
28
Thika Road is an eight-lane super high way in Nairobi that has been recently constructed by a Chinese Company. 29
Muzungu is a local terminology for Europeans.

164
perceive to incur on the basis of the prevailing internal and market information about cost at
the time of making such decisions.
Table 6.2: Purchasing cost, annual total and per worker capital consumption and labour input
Type of
machines Variable description China Kenya
Adv.
(New)
Adv.
(Used)
Planer
Current purchasing cost (USD) 1118 1000 11765 7647+
Investment (capital consumption
per year - USD)** 111.8 67 327 264
Annual capital consumption/worker 55.9 33.5 163.5 132
No. of workers required 2 2 2 2
Band saw
Current purchasing cost (USD) * 588 471 5765 2941
Investment (capital consumption
per year - USD) 59 29 156 113
No. of workers required 1 1 1 1
Saw bench
Current purchasing cost (USD) 941 8824 4706
Investment (capital consumption
per year - USD)
72 260 188
Annual capital consumption/worker
36 130 94
No. of workers required 2 2 2
Lathe
Current purchasing cost (USD) 588 471 7647
Investment (capital consumption
per year - USD) 74 34 232
No. of workers required 1 1 1
+The value is for the price of a machine with 16-inch wide thicknesser while the
corresponding values for the other sources are for planers with 12-inch thicknesser.
*The values are the current purchasing price of the small size band saw (about 400x500 mm
table size.
**This is derived by assuming straight-line depreciation and with the lives of the machines as specified in Table 6.1.
For the four machines studied, large differences exist between the purchasing cost of
Chinese machines and those of the advanced country machines while Kenyan machines are
slightly cheaper than the Chinese machines. For example, a planer from England might cost
USD 11,765 in Kenya which is more than ten times what a Chinese machine of a similar size
165
might cost (USD1, 118), which is slightly higher than the cost of a Kenyan machine (USD
1,000) of a similar size (Table 6.2).
The Chinese machines are not only far cheaper than the advanced country machines but
they also serve as viable alternatives to the Kenyan machines especially given that they tend
to have a higher degree of precision and flexibility of functions than the Kenyan machines.
This is evident in a statement by an informal sector operator, who has invested in a Chinese
planer:
This Chinese machine has really helped me and I cannot regret in any way having spent my money on it. This is the machine for the poor man or carpenter. The English ones are out of reach. An English machine of about this standard will go for about 600,000 [Kenyan] shillings and this is just around 80,000 [Kenyan] shillings so you see that much difference and I recommend other people to go for it and I will buy another one if I had the money. (Field interview, 2012)
Another person in the Ngong’ cluster also said:
The best for us is the second hand ones from England but they are very expensive... But when you start with the cheapest, you can go saving small, small until you get enough money to buy the best. So, I am hoping to buy the England second hand planing machine one day. (Field interview, 2012)
Thus, the cheap Chinese machines particularly the planer has been helpful to the informal
sector operators who cannot afford second hand machines from advanced countries let
alone the brand new.
However, for the other machines (that is, other than the planer), particularly saw bench and
lathe, they seem to prefer the Kenyan machines to those from China. The main reasons are
that they perceive the real value of the additional precision and flexibility the ones from China
offer may not outweigh the additional investment cost, the cost associated with their relatively
short lifespan and regular repair and maintenance, and other factors related to scale or
capacity of the machines which are discussed later in this chapter.
Information on the annual capital consumption per worker (a loose measure of the capital
labour ratio of the different machines or technologies, derived by dividing the acquisition cost
by the expected life and the number of workers required for operating the machine) suggests

166
that the Kenyan machines employ the least capital per worker, followed by Chinese
machines and then the advanced country machines. Detailed discussions on capital labour
ratios and production coefficients are provided in Chapter 7. For now, it is enough to say that
this data reinforces the fact that the amount of investment requirement for Chinese and
Kenyan machines is much lower than that for advanced country machines. This is still true
even when we take into account the large differences in the expected lifespans of the
machines.
The cost advantage of second hand machines
The high cost of the new advanced country machines pushes some operators to invest in
second hand machines which last longer than the Chinese and Kenyan machines. As
indicated in Table 6.2, all the Chinese planers and the planer from Kenya were purchased
new while less than half of the advanced country machines were new when purchased.
Similarly, for band saws and saw benches, three of the nine machines and three of the seven
machines from advanced countries were respectively bought new while all the machines
from China and Kenya were new when purchased. For the lathe machines, however, all the
machines from the three sources were bought new. Although these numbers may not be
representative, they still tell a story about the important role second hand machines from
advanced countries play in the industry.
This finding aligns with studies such as Castillo et al. (2012), Janischweski et al. (2003),
Cooper et al. (1981b) and Pack (1981). In particular, Janischweski et al. (ibid) indicated the
great extent to which developing countries depend on second hand machines by noting that
over 100 billion US dollars of second machines and equipment are exported every year to
developing and emerging economies. The study by Castillo et al. (ibid) investigated the
relationship between second hand machines (and equipment) and technical efficiency in
South Africa’s industrial firms. They found that the use of second hand machines is positively
associated with both economic and technical efficiency of the firms studied. Relatedly, the
study by Cooper et al. (ibid) found that in comparison to new machines, second hand
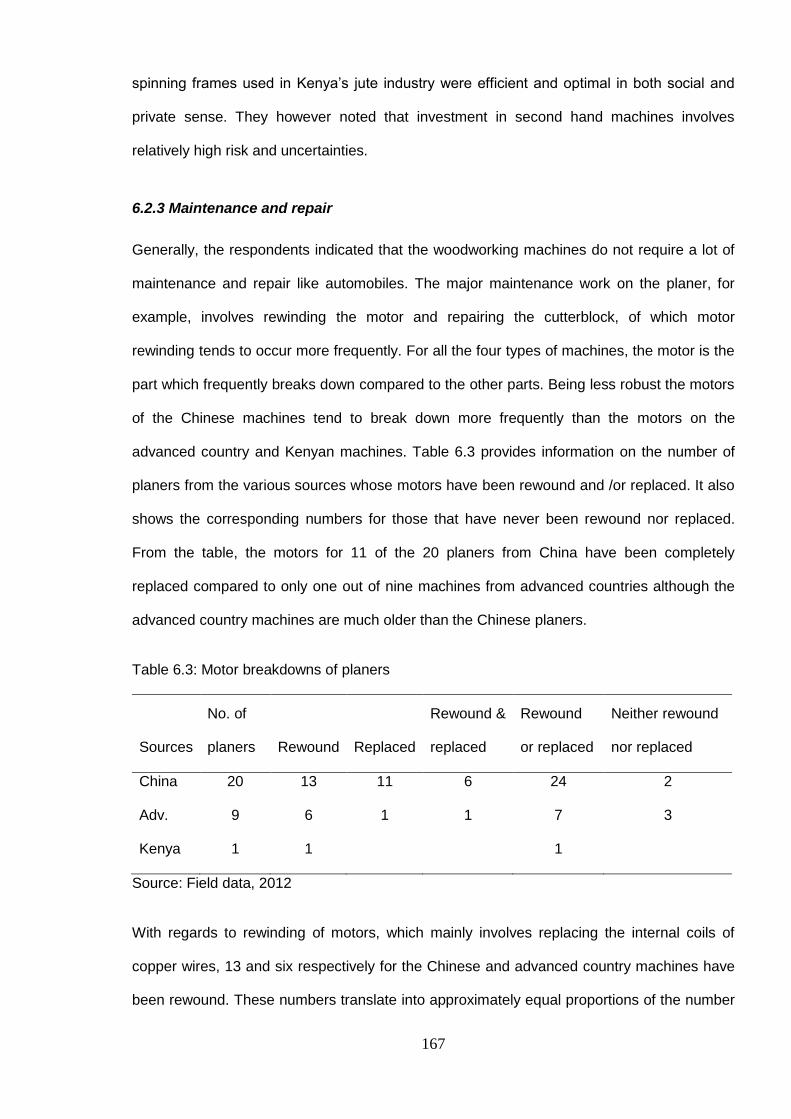
167
spinning frames used in Kenya’s jute industry were efficient and optimal in both social and
private sense. They however noted that investment in second hand machines involves
relatively high risk and uncertainties.
6.2.3 Maintenance and repair
Generally, the respondents indicated that the woodworking machines do not require a lot of
maintenance and repair like automobiles. The major maintenance work on the planer, for
example, involves rewinding the motor and repairing the cutterblock, of which motor
rewinding tends to occur more frequently. For all the four types of machines, the motor is the
part which frequently breaks down compared to the other parts. Being less robust the motors
of the Chinese machines tend to break down more frequently than the motors on the
advanced country and Kenyan machines. Table 6.3 provides information on the number of
planers from the various sources whose motors have been rewound and /or replaced. It also
shows the corresponding numbers for those that have never been rewound nor replaced.
From the table, the motors for 11 of the 20 planers from China have been completely
replaced compared to only one out of nine machines from advanced countries although the
advanced country machines are much older than the Chinese planers.
Table 6.3: Motor breakdowns of planers
Sources
No. of
planers Rewound Replaced
Rewound &
replaced
Rewound
or replaced
Neither rewound
nor replaced
China 20 13 11 6 24 2
Adv. 9 6 1 1 7 3
Kenya 1 1
1
Source: Field data, 2012
With regards to rewinding of motors, which mainly involves replacing the internal coils of
copper wires, 13 and six respectively for the Chinese and advanced country machines have
been rewound. These numbers translate into approximately equal proportions of the number
168
of machines reported for each source in Table 6.3 although most of the advanced country
machines are many years older than the Chinese machines. The motor on the Kenyan
planer which came from one of the advanced countries has also not been replaced although
it has been rewound (but) only once after about 13 years of use. Rewinding becomes
necessary when the coiling system in the motor burns mainly as a result of power
fluctuations and overloading the machines (that is, running the machine continuously for too
long and /or forcing the machine to accommodate a workpiece larger what it can normally
accommodate.
Moreover, the rewinding of the motor on Chinese machines occurs much earlier in the life of
the machine than the advanced country machines. For all the Chinese machines which have
been rewound this happened in less than a year of use. For 10 of the 13 Chinese machines,
the operators were able to report how long they used the machines before the first rewinding,
of which the average is 4.6 months with minimum and maximum values of one and eight
months respectively. The corresponding average figure for advanced country machines for
which data were provided (that is, three of the six machines) is 34 months. In fact, this figure
may underestimate how long a typical advanced country motor may last especially in the
light of testimonies such as this one from a machine operator (an employee) of an advanced
country planer in a formal sector firm: “Since the time I started working here from 1982 to
now the motor of this machine has broken down only four times … it is a very good machine”
(Field interview, 2012).
Other parts of the Chinese planer such as the cutterblock, gears, rollers, chains and bearings
are also not as robust as those from advanced countries. For example, a formal sector
operator who has invested in a Chinese planer noted that his machine came with a chain
which never worked and had to be replaced before using the planer. This led him to make
the following statement when I asked him about how the Chinese planer compares with the
advanced country planer: “Don’t compare the Chinese machine to the England machine;
they are not comparable at all!” (Field interview, 2012).
169
Cost of maintenance and repair
The cost of rewinding a motor varies positively with the horse power and number of phases
the machine has but does not differ across the different sources. Information from the
repairers shows that rewinding a three horse power motor with three phases (i.e. the
interface for electric input) costs about USD 58.82 while a five horse power with three phases
costs about USD 94.12. Thus, for a given rewinding, the original motor on Chinese machines
costs less than that on the advanced country machines although the Chinese motor have to
be rewound more frequently over time.
Data on seven Chinese planers whose motors have been rewound show that on average
they are rewound two to three times a year, while the corresponding average for four of the
advanced country machines is less than one. In fact, the biennial average is still less than
one. However, the high frequency of repairing Chinese machines still does not make
investment in them less viable particularly for the informal sector firms. In support of this, one
of them noted:
… it is cheap and the England one is more expensive just that it needs more maintenance. But if you look at the cost of maintenance plus the purchase, it is still more economical than the England machine. So it is better to go for this one. I am comfortable with this planing machine and next time when I want to buy a planing machine of this type I will still buy the one from China. (Field interviews, 2012)
However, it appears that the respondent did not take in account the cost of the production
downtime, in terms of the revenues that the firm is likely to lose, due to frequent breakdown
of the motor or other parts of the Chinese machine. I do not have data on the cost associated
with downtimes but there is a good reason to believe that such production losses, particularly
for the informal sector firms, may be negligible. That is because they firms can rely on other
firms providing machining services in their clusters while a machining service provider can
refer his customers to trusted competitors, who may be less inclined to poach his customers
during downtimes.
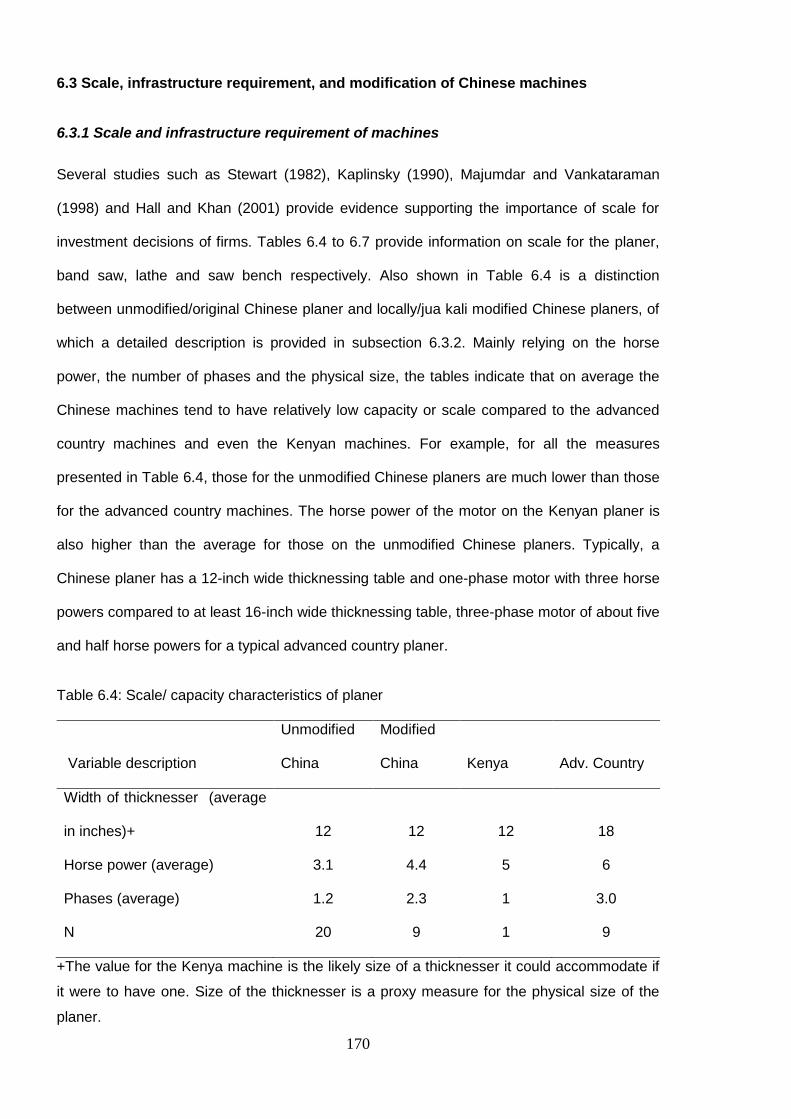
170
6.3 Scale, infrastructure requirement, and modification of Chinese machines
6.3.1 Scale and infrastructure requirement of machines
Several studies such as Stewart (1982), Kaplinsky (1990), Majumdar and Vankataraman
(1998) and Hall and Khan (2001) provide evidence supporting the importance of scale for
investment decisions of firms. Tables 6.4 to 6.7 provide information on scale for the planer,
band saw, lathe and saw bench respectively. Also shown in Table 6.4 is a distinction
between unmodified/original Chinese planer and locally/jua kali modified Chinese planers, of
which a detailed description is provided in subsection 6.3.2. Mainly relying on the horse
power, the number of phases and the physical size, the tables indicate that on average the
Chinese machines tend to have relatively low capacity or scale compared to the advanced
country machines and even the Kenyan machines. For example, for all the measures
presented in Table 6.4, those for the unmodified Chinese planers are much lower than those
for the advanced country machines. The horse power of the motor on the Kenyan planer is
also higher than the average for those on the unmodified Chinese planers. Typically, a
Chinese planer has a 12-inch wide thicknessing table and one-phase motor with three horse
powers compared to at least 16-inch wide thicknessing table, three-phase motor of about five
and half horse powers for a typical advanced country planer.
Table 6.4: Scale/ capacity characteristics of planer
Variable description
Unmodified
China
Modified
China Kenya Adv. Country
Width of thicknesser (average
in inches)+ 12 12 12 18
Horse power (average) 3.1 4.4 5 6
Phases (average) 1.2 2.3 1 3.0
N 20 9 1 9
+The value for the Kenya machine is the likely size of a thicknesser it could accommodate if
it were to have one. Size of the thicknesser is a proxy measure for the physical size of the
planer.
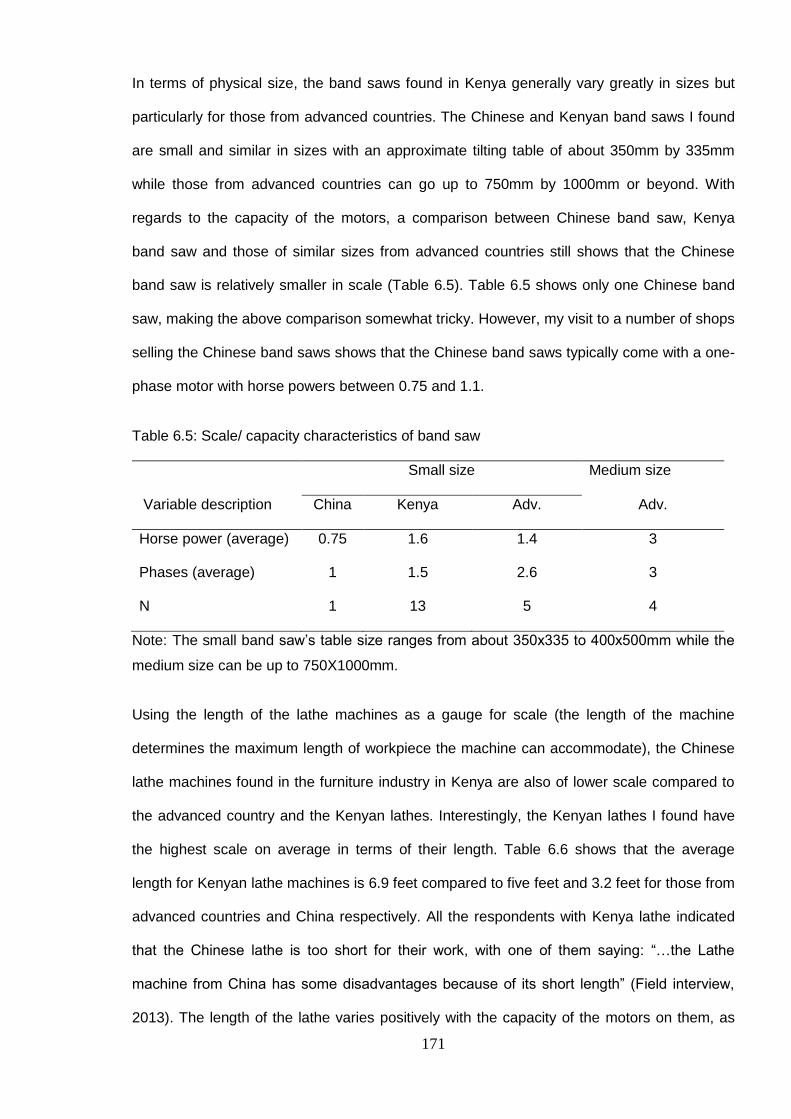
171
In terms of physical size, the band saws found in Kenya generally vary greatly in sizes but
particularly for those from advanced countries. The Chinese and Kenyan band saws I found
are small and similar in sizes with an approximate tilting table of about 350mm by 335mm
while those from advanced countries can go up to 750mm by 1000mm or beyond. With
regards to the capacity of the motors, a comparison between Chinese band saw, Kenya
band saw and those of similar sizes from advanced countries still shows that the Chinese
band saw is relatively smaller in scale (Table 6.5). Table 6.5 shows only one Chinese band
saw, making the above comparison somewhat tricky. However, my visit to a number of shops
selling the Chinese band saws shows that the Chinese band saws typically come with a one-
phase motor with horse powers between 0.75 and 1.1.
Table 6.5: Scale/ capacity characteristics of band saw
Variable description
Small size Medium size
China Kenya Adv. Adv.
Horse power (average) 0.75 1.6 1.4 3
Phases (average) 1 1.5 2.6 3
N 1 13 5 4
Note: The small band saw’s table size ranges from about 350x335 to 400x500mm while the
medium size can be up to 750X1000mm.
Using the length of the lathe machines as a gauge for scale (the length of the machine
determines the maximum length of workpiece the machine can accommodate), the Chinese
lathe machines found in the furniture industry in Kenya are also of lower scale compared to
the advanced country and the Kenyan lathes. Interestingly, the Kenyan lathes I found have
the highest scale on average in terms of their length. Table 6.6 shows that the average
length for Kenyan lathe machines is 6.9 feet compared to five feet and 3.2 feet for those from
advanced countries and China respectively. All the respondents with Kenya lathe indicated
that the Chinese lathe is too short for their work, with one of them saying: “…the Lathe
machine from China has some disadvantages because of its short length” (Field interview,
2013). The length of the lathe varies positively with the capacity of the motors on them, as
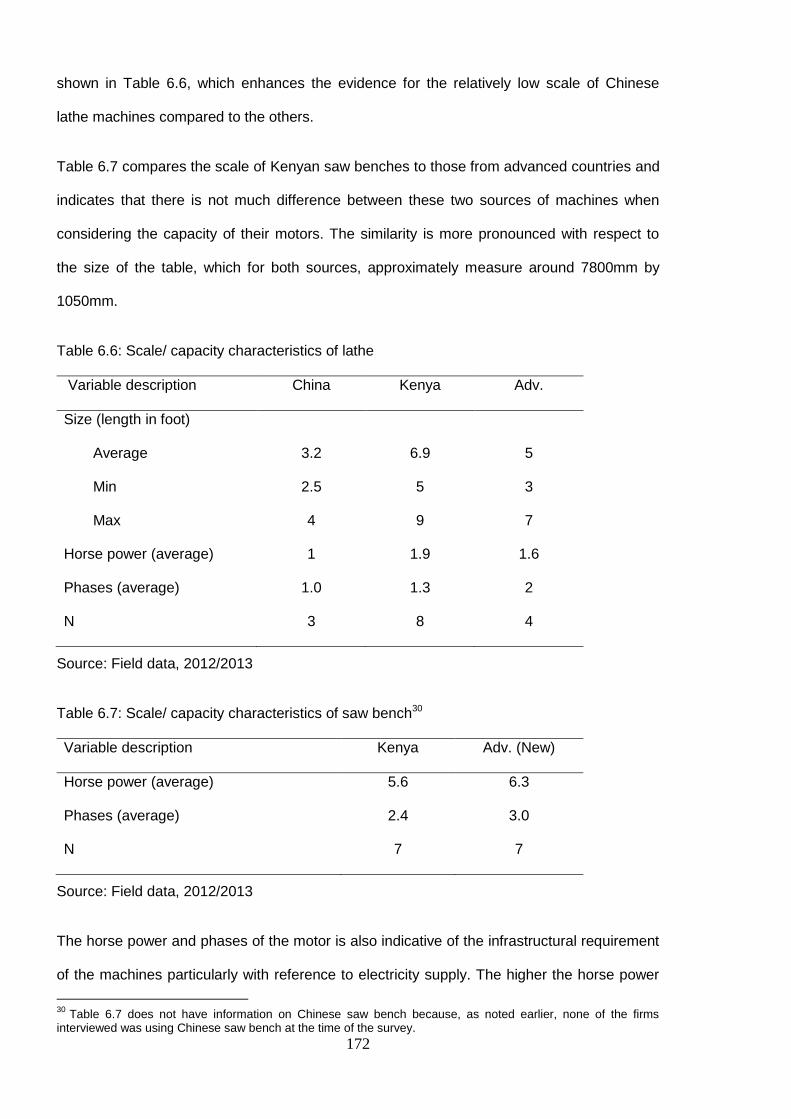
172
shown in Table 6.6, which enhances the evidence for the relatively low scale of Chinese
lathe machines compared to the others.
Table 6.7 compares the scale of Kenyan saw benches to those from advanced countries and
indicates that there is not much difference between these two sources of machines when
considering the capacity of their motors. The similarity is more pronounced with respect to
the size of the table, which for both sources, approximately measure around 7800mm by
1050mm.
Table 6.6: Scale/ capacity characteristics of lathe
Variable description China Kenya Adv.
Size (length in foot)
Average 3.2 6.9 5
Min 2.5 5 3
Max 4 9 7
Horse power (average) 1 1.9 1.6
Phases (average) 1.0 1.3 2
N 3 8 4
Source: Field data, 2012/2013
Table 6.7: Scale/ capacity characteristics of saw bench30
Variable description Kenya Adv. (New)
Horse power (average) 5.6 6.3
Phases (average) 2.4 3.0
N 7 7
Source: Field data, 2012/2013
The horse power and phases of the motor is also indicative of the infrastructural requirement
of the machines particularly with reference to electricity supply. The higher the horse power
30
Table 6.7 does not have information on Chinese saw bench because, as noted earlier, none of the firms interviewed was using Chinese saw bench at the time of the survey.
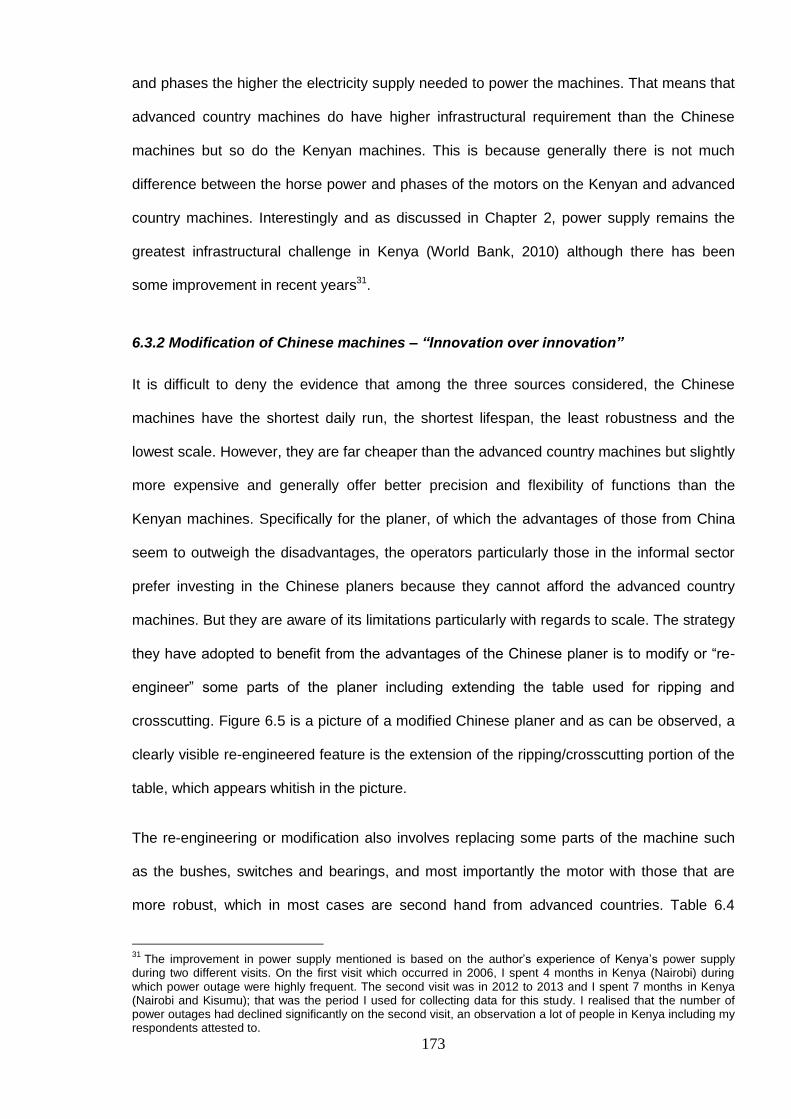
173
and phases the higher the electricity supply needed to power the machines. That means that
advanced country machines do have higher infrastructural requirement than the Chinese
machines but so do the Kenyan machines. This is because generally there is not much
difference between the horse power and phases of the motors on the Kenyan and advanced
country machines. Interestingly and as discussed in Chapter 2, power supply remains the
greatest infrastructural challenge in Kenya (World Bank, 2010) although there has been
some improvement in recent years31.
6.3.2 Modification of Chinese machines – “Innovation over innovation”
It is difficult to deny the evidence that among the three sources considered, the Chinese
machines have the shortest daily run, the shortest lifespan, the least robustness and the
lowest scale. However, they are far cheaper than the advanced country machines but slightly
more expensive and generally offer better precision and flexibility of functions than the
Kenyan machines. Specifically for the planer, of which the advantages of those from China
seem to outweigh the disadvantages, the operators particularly those in the informal sector
prefer investing in the Chinese planers because they cannot afford the advanced country
machines. But they are aware of its limitations particularly with regards to scale. The strategy
they have adopted to benefit from the advantages of the Chinese planer is to modify or “re-
engineer” some parts of the planer including extending the table used for ripping and
crosscutting. Figure 6.5 is a picture of a modified Chinese planer and as can be observed, a
clearly visible re-engineered feature is the extension of the ripping/crosscutting portion of the
table, which appears whitish in the picture.
The re-engineering or modification also involves replacing some parts of the machine such
as the bushes, switches and bearings, and most importantly the motor with those that are
more robust, which in most cases are second hand from advanced countries. Table 6.4
31
The improvement in power supply mentioned is based on the author’s experience of Kenya’s power supply during two different visits. On the first visit which occurred in 2006, I spent 4 months in Kenya (Nairobi) during which power outage were highly frequent. The second visit was in 2012 to 2013 and I spent 7 months in Kenya (Nairobi and Kisumu); that was the period I used for collecting data for this study. I realised that the number of power outages had declined significantly on the second visit, an observation a lot of people in Kenya including my respondents attested to.

174
provides information on the capacity of nine modified Chinese planers, indicating that the
average horse power of the motor on the modified Chinese planer is 4.4, with an average of
2.3 phases compared to 3.1 horse power and 1.2 phases for the unmodified machines. As
evidenced in the second statement in Box 6.1, the informal sector operators refer to this
process as “overhauling”, which is done immediately or some few months after purchase.
Thus, the “hobby machines” are customised (particularly with the aim of enhancing the scale)
to suit the needs of the operators or to meet the requirement for commercial use.
Figure 6.5: An example of modified Chinese planers
Source: Author’s field photography, 2012
However, there is a limit to the extent to which the machines can be modified. For example it
cannot take a motor of more than 5.5 horse power. According to the respondents, when the
motor is too large the small body of the machine cannot absorb the amount of vibration from
the motor. Thus, according to the respondents, a more powerful motor makes the whole
machine jerk to the extent that it negatively affects the quality of output.
A corollary following from the above discussion is this: If the Chinese machines are
innovation for the poor, as one of the respondent asserted and quoted in subsection 6.2.2,
An extended section of the table for ripping and crosscutting
175
then the poor in Kenya are also doing further innovation on the machines. This innovation
seems to take two forms rather than being uniform. The first is obvious and involves only the
kind of overhauling or modification described above. The second however appears more
subtle: What the firms do is that instead of overhauling, they deactivate the
ripping/crosscutting function so that the work pressure on the machine is reduced and then
invest in the Kenyan saw bench. This is an indication of a complementarity between
investment in the Chinese and Kenyan machines. While the first type of innovation is most
popular in Kibuye cluster, the second is more popular in the Ngong’ and Gikomba clusters.
6.4 Skill requirement for operation and repair
Caselli and Coleman II (2001) and Kennickell and Kwast (1997) provide empirical evidence
supporting the fact that the level of skills required to operate, maintain and repair a machine
is important for anyone deciding to invest in a particular machine. Generally, for the four
machines considered in this study which are used in the Kenya furniture making industry, the
level of skill requirement for operating and repairing is low especially when compared to
computerised and numerically controlled (CNC) machines. The skill requirement also does
not differ greatly across the different sources.
The respondents noted that it is not difficult to find people with the relevant skills to operate
the machines. Moreover, it takes a short time for someone to acquaint himself with how to
execute the basic functions of the machines although they acknowledged that the advanced
country machines are slightly more complicated. This is evident in a statement by one of
them: “It is easy [to operate]! Even you, we can just go there right now and I will show you
how to use it within a short period of time. It doesn’t take too long to learn how to operate it.
The only thing is that you should be very careful because they are sharp machines and it is
rotating” (Field interview, 2012). Another person also had this to say:
Almost all the machines are easy to operate. It takes a short time to learn how to operate them except for band saw and lathe which may take a bit more time. The band saw can take about a week to learn and maybe one month for the lathe but with any of the planing machines, even one or two days will be enough for some to learn how to operate it. ... because the work we normally do with the band saw and lathe are more technical. (Field interview, 2012)
176
Thus, the band saw and lathe require more time because they are used to make intricate
designs, shapes and patterns.
It should however be noted that the Chinese machines need more care because they are
less robust but it does not take a long time for someone to get acquainted with the needed
precautionary measures. Moreover, the Chinese machines and more especially the Kenyan
machines may require a good hands-on experience with them before one can achieve a
comparable level of precision for the output as the advanced country machines. However,
the advanced country machines, and to a relatively limited extent, the Chinese machines are
more complicated because of the high degree of flexibility embodied in their functions,
hence, requiring relatively higher expertise to operate them. However, these differences are
more or less minor with regards to the demand they place on the machine operators and
may even out between the different sources of the technologies. More importantly, my
interactions with the operators did not show that such differences influence the choice
between these sources of technologies.
Finding repairers is also not difficult particularly for the Kenyan machines since the
fabricators are in Kenya and especially for the informal sector firms operating in the Gikomba
clusters. Besides this furniture cluster is a cluster of metalworking artisans who fabricate the
Kenyan machines and also do repair work on all other machines. For the other informal
sector clusters and the formal sector firms, finding a repairer does not pose any worry though
the repairers are not close to them as the firms in the Gikomba clusters.
Figure 6.6 is a picture of a jua kali repairer rewinding a broken motor for a band saw,
indicating the availability of skills for repairing the machines in Kenya. This is also evident in
a statement from an operator in the formal sector: “When it breaks, we look for engineers in
town who repair it usually in a day” (Field interviews, 2012). In fact, for the Kenyan and
Chinese machines, some of the operators who have long experience with woodworking
machines said that they are able to fix some of the repair work easily by themselves. One of
them however said that “The England planing machine is a bit complicated and for any little

177
thing you will need the attention of a technician” (Fieldwork, 2012). Repairing the motor of the
machines is however not simple, something the firms always outsource to technicians or
electricians usually those operating in the informal sector, who reported that complications
associated with rewinding motors do not differ across the different sources.
Figure 6.6: A repairer in Gikomba market fixing a broken motor
Source: Author’s field photography, 2012
6.5 Availability of parts (usable and machine parts)
The availability of parts (both usable parts such as blades and machine parts such as the
cutterblock and bearings) is important for investment decisions. All things being equal, it
seems natural for firms to want to invest in machines for which they can easily find parts to
replace those that are worn out. The availability of parts also makes repairers work easy and
create demand for their services. For all the machines, irrespective of their source, finding
usable parts does not seem to be a serious concern. Such parts are available on the Kenyan
market and for the informal sector clusters there are always retailers of such parts operating
within the clusters or in close vicinities. It however appears that finding usable parts for the
advanced country machines in Kisumu where the Kibuye cluster is located is slightly difficult.

178
Unlike their counterparts in Nairobi, the respondents in Kisumu noted that it is sometimes a
problem getting the usable parts of the advanced country machines. What may explain this is
that Kisumu cannot boast of one formal sector furniture making firm while these firms are the
main users of advanced country machines (as discussed in detail in Chapter 8) and might be
the major source of demand for usable parts of the advanced country machines.
The big problem with the availability of parts has to do with machine parts, which is true for
all the sources, perhaps except the Kenyan machines. The respondents indicated that some
of the machines parts are difficult to get from the Kenyan market. For example, cutterblock
and rollers of the planers are difficult to find on the local market. This is clarified by a
statement from a respondent in the informal sector who has invested in a Chinese planer:
If the part get lost, they are not easy to get but things like blades and belts [usable parts] you can find them. If something like the shaft [cutterblock] is broken, you can’t get another original one to replace. What you can do is to send it to the jua kali engineers for them take the measurement and make one for you or go and buy a new machine. (Field interview, 2013)
Operators in the formal sector also rely on the local fabricators of machine parts as
evidenced in the following comment from a respondent in a formal sector firm: “… whatever
bearings or shaft that we require we have very good engineering workshops that are able to
produce the items we need to replace; they are able to fabricate them here. Also, these are
old machines; those agents who would sell parts are no longer there” (Field interview, 2012).
Replacing an expensive advanced country machine because spare parts are not available
locally pushes some of the formal sector firms to directly source machine parts from dealers
abroad, usually the machine’s country of origin. On this, a respondent from a formal sector
firm noted:
At other times, we make contacts with the foreign suppliers through email, they give us quotations and if we can afford we buy and they send them direct to our factory. You know, these machines are very old, so when we get such problems we first try to find out if the manufacturers still exist or they have a sister company that can help us. (Field interview, 2012)
Importing machine parts is obviously not a good option for the informal sector firms because
they may not have the financial capacity and general knowledge about how to do the

179
importation given that the educational level of the operators are generally low, as indicated in
Chapter 5. This may be one of the reasons (but probably remote) why informal sector firms
do not have effective demand for advanced country machines.
6.6 Conclusion
Focusing on the technical and economic characteristics of the machines, this chapter has
identified many salient factors which may influence a firm’s decision to invest in machines
from the three sources. The chapter has shown that durability and quality of machines
(precision and flexibility of functions, run and robustness) have a crucial influence on choice.
In terms of these characteristics, the Chinese machines found in Kenya’s furniture making
industry to a great extent lag behind the advanced country machines and they are better than
the Kenyan machine only in areas of precision and flexibility of the functions. However, the
Chinese machines are far cheaper than the advanced country machines but slightly more
expensive than the Kenyan machines, making them attractive to the informal sector firms
particularly the planer. They perceive the Chinese planer offer a real net value over the
Kenyan planer when the benefit of its precise and flexible functions is weighed against the
extra purchasing and modification cost incurred when a firm invests in a Chinese planer
instead of a Kenyan planer.
It has also been demonstrated that the scale of the Chinese machines found in Kenya’s
furniture making industry is the lowest among the three sources (followed by the Kenyan
machines), a major reason for the modification of the Chinese planer. In terms of skill
requirement and availability of parts, however, there seem not to be any major differences
between the three sources of machines.
This next chapter examines in detail the output levels, productivity and factor intensities of
the technologies, which provide an indication of their relative efficiency. Another issue for
discussion is the returns on investment in the technologies from these sources. Also
discussed are the transfer modes by which the technologies from the different sources reach
the firms and the financing options available for the acquisition of the technologies.

180
CHAPTER 7 : FACTOR PRODUCTIVITIES, RETURNS ON INVESTMENT AND
TRANSFER MODES
7.0 Introduction
In this chapter, the modes of transfer for the different technologies as well as the financing
options for acquiring the technologies are examined and compared. Another central theme
for discussion in the chapter, which precedes the discussion on transfer modes and the
financing options, addresses factor productivities and the returns on investment in these
technologies across the formal and informal sectors. The factor productivities, measured by
the coefficients of production for the different technologies, help to illuminate the relative
efficiency of the technologies and the degree of factor intensities embodied in them. The
returns on investment, measured using two main indicators – net present value (NPV) and
benefit cost ratio (BCR) – show the extent to which investment in these technology are
profitable.
However, due to inadequacy of data on several variables (including the output levels of the
different machines, output prices and other service inputs such as maintenance costs)
needed for computing the indicators on returns for all the machines studied, the analysis on
returns on investment only focuses on planers for illustration purposes and has been
presented in the annex to this chapter. This is because gauging the output of the planer and
other input variables was empirically less difficult to achieve compared to the other
machines.
7.1 Production coefficients
The production coefficients are measures, which help determine the relative (technical)
efficiency of the technologies as well as the level of their factor intensities. Three coefficients
are estimated which are output-capital ratio, output-labour ratio and capital-labour ratio. The
estimation of these coefficients requires having knowledge about the physical units of output
the machines (planer) can produce within a given time period and the quantity of inputs

181
(labour and capital) used to achieve that production level. The labour input is measured in
labour hours per year spent in producing a given level of output while the measure for capital
is the annual capital consumption, which is derived by dividing the acquisition cost of the
machines by their respective expected lifespans.
7.1.1 Measuring physical output
As alluded to introductory section of this chapter, gauging the output level of the planer was
empirically tractable despite needing some restrictive assumptions while it was difficult to
gauge the output levels of the other machines. The reason is that the other machines such
as band saws and lathes are used for producing diverse products or designs, which place
varying demands on the machines such that determining equivalent units for measuring total
output of the machines was difficult.
The procedure for measuring the production levels of the planers begins with the number
feet of a given timber (whether hard or soft wood) that can be planed in a day, given the daily
run of the planers and assuming that the timber is six inches in breadth and one inch in
thickness (i.e. 6x1). Across the formal and informal sector firms, the most common type of
timber used for making furniture is the Mahogany tree, although as noted in Chapter 5, the
use of Mahogany is much more common in the formal sector than in the informal sector. Per
evidence presented in Chapter 6, I assume a daily run of six hours for Chinese planer, twelve
hours and eight hours for those from advanced countries and Kenya respectively as the
“rated operating capacity” levels. Although the respondents noted that the advanced country
planer can operate for well over 12 hours, I assume that that is not realistically sustainable
over a long period of time especially if the machine is expected to stay in operation for 36
years or more. In fact, the actual and expected lifespan of all the machines recorded in
Chapter 6 may be determined by the actual daily demand-driven run of the machines which
are well below the above-assumed rated capacity levels. Based on my daily field observation
over the seven months of the data collection exercise the machines in both the formal and
informal sectors on average may not be continuously operated for more than three hours per

182
day. Realistically, I therefore assume “actual daily run” of three hours for all three types of
machines and for the two sectors, while allowing for differences in hourly production rates
between the three types of machines. This provides a second scenario (i.e. actual daily run)
for comparison with the ideal situation (i.e. rated capacity).
With regards to the number of feet of the 6X1 Mahogany timber that can be planed in a day, I
did not get the opportunity to see any of the planers plane this kind of timber or any other
type continuously for six hours. However, I got the chance to see the Chinese planer plane
this type of wood for about 20 minutes, and the operator indicated that it may be able to do
about 50 feet when it is operated continuously for an hour. This was consistent with my 20
minutes observation and implies that when it is operated for three hours per day it may be
able to plane about 150 feet. I rely on the empirical data on the Chinese planer to determine
the daily output levels for the other planers. Based on the horse power of the advanced
country machines (six horse power) and the production rate of the Chinese planer, two
scenarios are created for the advanced country machines – when it produces at one and half
(1.50) times the rate of Chinese planer and when it operates at twice the rate of the Chinese
planer. A scenario is also created for Kenya and the modified Chinese planer, that is, they
operate at one and a third (1.33) times the rate of the original Chinese planer. All these
assumptions lead to the total production levels for the various planers and scenarios
presented in Table 7.1. The table presents two types of planers for China: the
original/unmodified and modified planer. As was noted in Chapter 6, the modified planer is
the original planer, which has been locally modified to suit the operating conditions of the
firms.

183
Table 7.1: Production level of the planers per day
Type of planer
Assumption
Rated-capacity
(hours per day)
Rated-capacity (feet per
day)
Actual daily run (feet for 3
hours)
China
Original (unmodified) 6 300 150
Modified China working at 1.33 times original China's rate 6 399 199.5
Advanced Country
Working at 1.5 times original China's rate 12 900 225
Working at 2 times original China's rate 12 1200 300
Kenya Working at 1.33 times original China's rate 8 532 199.5
The information on the output levels of the planers can help determine equivalent output
levels for the other machines from the same source (i.e. China, advanced countries or
Kenya) as a given planer, based on the relationship between the horse powers of the motor
on the planer and those of the other machines from the same source as the planer. For
example, the output level for the advanced country band saw is determined based the
relationship between horse power of the motor on the band saw and that on the advanced
country planer, given that the output level of the planer has already been determined. Thus, if
the planer has a six horse power motor and can produce 1200 feet within 12 hours, then, the
equivalent output for the saw bench, which has an average of 2.2 horse power motor and
also operates for 12 hours, can be determined as follows: First, we determine the output
level of a one horse power motor for advanced country machines by dividing 1200 feet by
six, and second, we multiply the result from the first stage (which is 200 feet) by the horse
power of the band saw (which is 2.2) to get the daily output level for the band saw when it
operates for 12 hours. The same procedure is used for deriving equivalent units for the other
machines and the results for the output per annum for the various machines are presented in
the Table 7.2 and 7.3.
The rationale for the approach used for determining equivalent output levels for the other
machines is derived from the analyses in Chapter 6 which suggest that for a particular
technology source, say China, the characteristics of the machines such as quality, durability,

184
scale and functionality generally do not differ across the different types of machines (i.e.
planer, band saw, lathe and saw bench). For instance, the extent to which an advanced
country planer differs from the Chinese planer in terms of durability and scale (measured by
the size of motor on them) is similar to that between Chinese band saw and advanced
country band saw.
7.1.2 Interpretations of the production coefficients
Production coefficients can be generated for the two scenarios depicted in Table 7.1, which
are production at rated capacity and production at actual (daily demand-driven) capacity
utilisation. Table 7.2 therefore presents the coefficients when daily production is at rated
capacity while Table 7.3 shows the coefficients for the case of the actual (daily demand-
driven) production level. The tables do not present indicators for saw benches because there
was no Chinese comparator for this category of machines, as was emphasised in Chapter 6.
It should also be noted that the analysis or discussion in this subsection does not make any
distinction between the formal and informal sectors since the same assumptions on the daily
run of the machines are used for both sectors.
Four caveats are needed to qualify the coefficients presented in the tables. First, the annual
capital consumptions for the machines are denominated in monetary units, based on the
market values of the machines. This may introduce some bias given that the market value
may not reflect the true economic value of the machines or capital because of price
distortions associated with deviation of markets from their competitive equilibrium (Bhalla,
1985; Stewart, 1982).
Second, the labour used for operating the machines is taken to be homogenous across the
formal and informal sectors. This is less problematic than the first caveat. The reason is that
my interaction with the operators of the machines considered in this study in the formal and
informal sectors did not reveal much difference in terms of their level of education except that
those in the formal sector generally seem to have been in this vocation for a longer period of
time.
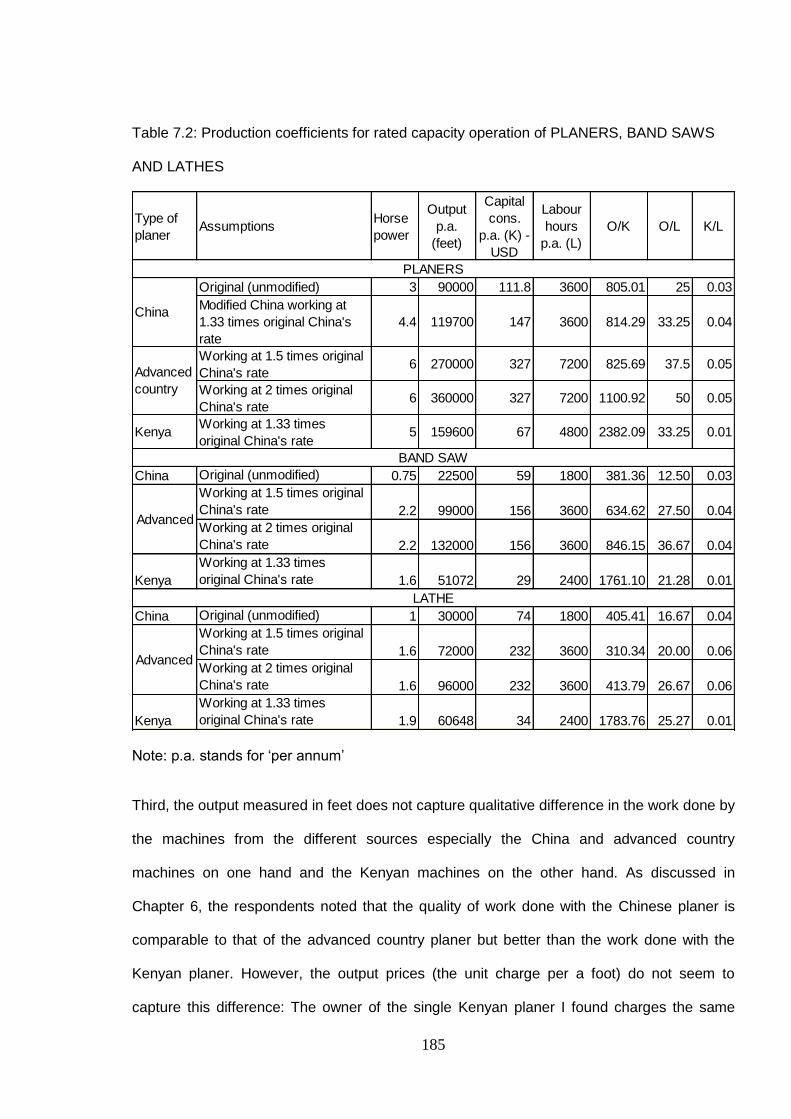
185
Table 7.2: Production coefficients for rated capacity operation of PLANERS, BAND SAWS
AND LATHES
Note: p.a. stands for ‘per annum’
Third, the output measured in feet does not capture qualitative difference in the work done by
the machines from the different sources especially the China and advanced country
machines on one hand and the Kenyan machines on the other hand. As discussed in
Chapter 6, the respondents noted that the quality of work done with the Chinese planer is
comparable to that of the advanced country planer but better than the work done with the
Kenyan planer. However, the output prices (the unit charge per a foot) do not seem to
capture this difference: The owner of the single Kenyan planer I found charges the same
Type of
planerAssumptions
Horse
power
Output
p.a.
(feet)
Capital
cons.
p.a. (K) -
USD
Labour
hours
p.a. (L)
O/K O/L K/L
Original (unmodified) 3 90000 111.8 3600 805.01 25 0.03
Modified China working at
1.33 times original China's
rate
4.4 119700 147 3600 814.29 33.25 0.04
Working at 1.5 times original
China's rate6 270000 327 7200 825.69 37.5 0.05
Working at 2 times original
China's rate6 360000 327 7200 1100.92 50 0.05
KenyaWorking at 1.33 times
original China's rate5 159600 67 4800 2382.09 33.25 0.01
China Original (unmodified) 0.75 22500 59 1800 381.36 12.50 0.03
Working at 1.5 times original
China's rate 2.2 99000 156 3600 634.62 27.50 0.04
Working at 2 times original
China's rate 2.2 132000 156 3600 846.15 36.67 0.04
Kenya
Working at 1.33 times
original China's rate 1.6 51072 29 2400 1761.10 21.28 0.01
China Original (unmodified) 1 30000 74 1800 405.41 16.67 0.04
Working at 1.5 times original
China's rate 1.6 72000 232 3600 310.34 20.00 0.06
Working at 2 times original
China's rate 1.6 96000 232 3600 413.79 26.67 0.06
Kenya
Working at 1.33 times
original China's rate 1.9 60648 34 2400 1783.76 25.27 0.01
Advanced
China
Advanced
country
Advanced
PLANERS
BAND SAW
LATHE
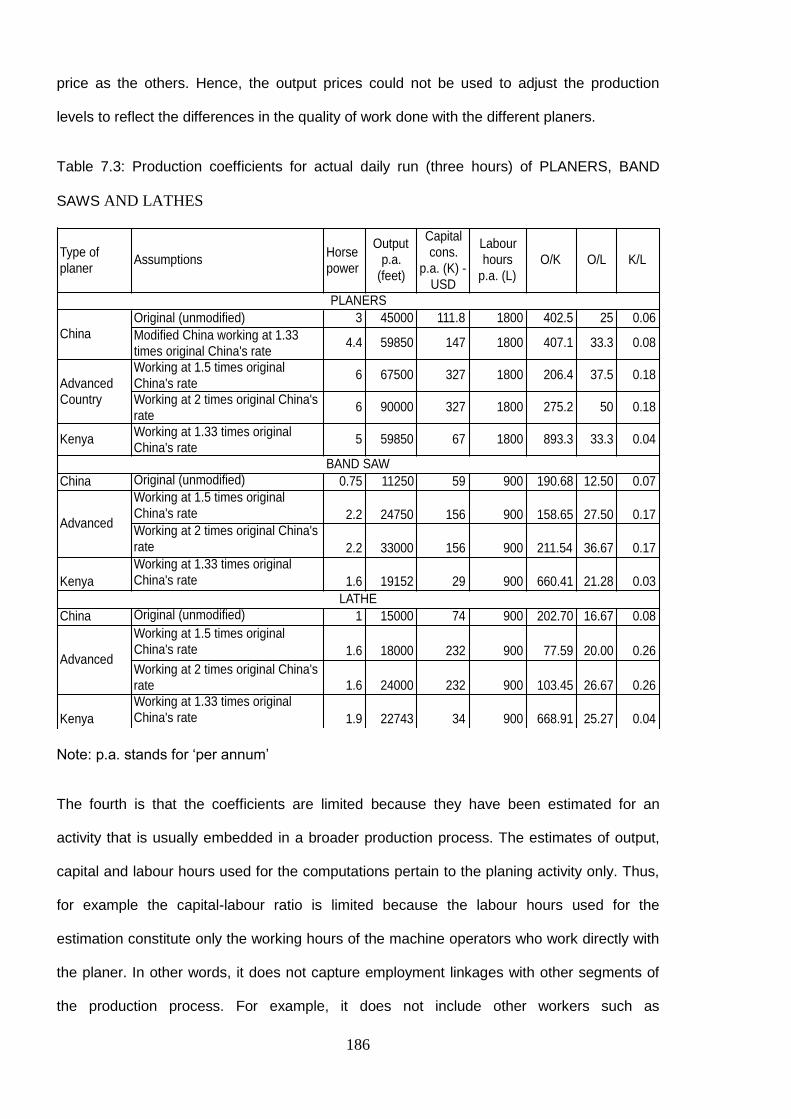
186
price as the others. Hence, the output prices could not be used to adjust the production
levels to reflect the differences in the quality of work done with the different planers.
Table 7.3: Production coefficients for actual daily run (three hours) of PLANERS, BAND
SAWS AND LATHES
Note: p.a. stands for ‘per annum’
The fourth is that the coefficients are limited because they have been estimated for an
activity that is usually embedded in a broader production process. The estimates of output,
capital and labour hours used for the computations pertain to the planing activity only. Thus,
for example the capital-labour ratio is limited because the labour hours used for the
estimation constitute only the working hours of the machine operators who work directly with
the planer. In other words, it does not capture employment linkages with other segments of
the production process. For example, it does not include other workers such as
Type of
planerAssumptions
Horse
power
Output
p.a.
(feet)
Capital
cons.
p.a. (K) -
USD
Labour
hours
p.a. (L)
O/K O/L K/L
Original (unmodified) 3 45000 111.8 1800 402.5 25 0.06
Modified China working at 1.33
times original China's rate4.4 59850 147 1800 407.1 33.3 0.08
Working at 1.5 times original
China's rate6 67500 327 1800 206.4 37.5 0.18
Working at 2 times original China's
rate6 90000 327 1800 275.2 50 0.18
KenyaWorking at 1.33 times original
China's rate5 59850 67 1800 893.3 33.3 0.04
China Original (unmodified) 0.75 11250 59 900 190.68 12.50 0.07
Working at 1.5 times original
China's rate 2.2 24750 156 900 158.65 27.50 0.17
Working at 2 times original China's
rate 2.2 33000 156 900 211.54 36.67 0.17
Kenya
Working at 1.33 times original
China's rate 1.6 19152 29 900 660.41 21.28 0.03
China Original (unmodified) 1 15000 74 900 202.70 16.67 0.08
Working at 1.5 times original
China's rate 1.6 18000 232 900 77.59 20.00 0.26
Working at 2 times original China's
rate 1.6 24000 232 900 103.45 26.67 0.26
Kenya
Working at 1.33 times original
China's rate 1.9 22743 34 900 668.91 25.27 0.04
PLANERS
BAND SAW
LATHE
Advanced
China
Advanced
Country
Advanced
187
management/sales staff whose employment may be linked to the type of technology the firm
has adopted
In spite of the above caveats, the coefficients can be informative. The capital-labour ratio
(K/L) is indicative of the level of factor intensities embodied in the technologies from the
different sources. A relatively high capital-labour ratio for a particular technology indicates
that that technology is relatively more capital intensive. That is, the amount of capital
measured in US dollars required for each hour spent on operating the machine is higher
compared to the other technologies, suggesting that that technology relatively offers less
employment to people than to machines. The capital-labour ratios presented in the tables
show that advanced country machines are more capital intensive than the Chinese machines
while the Kenyan machines are the least capital intensive. This is true under the two main
scenarios although the differences are more acute when capacity is underutilised with three-
hour daily demand-driven run. For example, at this level of capacity utilisation, Table 7.3
shows that the capital-labour ratio of advanced country planer (0.18) is three times that of the
Chinese planer (0.06), compared to 0.03 for Chinese planer and 0.05 for advanced country
planer when operation is at rated capacity (Table 7.2). The tables also show that modifying
(or overhauling) the Chinese planer, as described in Chapter 6, increases the capital
component in production but not up to the level for the advanced country planers particularly
when the daily capacity utilisation is at three hours.
While capital-labour ratio gauges the factor intensities, the output ratios (output-capital ratio
(O/K) and output-labour ratio (O/L)) indicate the relative efficiency of the various
technologies. If the machines were operating at the rated capacities, Table 7.2 shows that
the Chinese planer, whether original or modified, is inefficient compared to the others
particularly the Kenyan planer. They reported lower output-capital ratio and output-labour
ratio than the other technologies. The relative efficiency between the advanced country
planer and Kenyan planer is indeterminate: The Kenyan planer reported higher output-capital
ratio while the advanced country planer reported higher output-labour ratios (Table 7.2). For
both band saws and lathes, the Chinese machines are inefficient compared to the others
188
while the relationship between the advanced country machines and Kenyan machines are
generally indeterminate.
However, at the actual daily production rate, Table 7.3 shows that the Chinese planer may
be as efficient as the advanced country planer. Between these two technologies, the relative
efficiency becomes indeterminate at the actual daily production rate. The Kenyan planer is
still more efficient than the Chinese planer at the actual daily production level while its
relationship with advanced country machine is indeterminate. For band saws, Table 7.3
shows that the advanced country machine and more especially the Kenyan machines are
relatively more efficient than the Chinese machines at the demand-driven capacity utilisation.
In the case of lathe machines, however, the relationship between the Chinese machine and
the advanced country machine is indeterminate while the Kenyan machine is still superior to
the Chinese machines in terms of efficiency suggested by the indicators.
The above analyses show that the level of capacity utilisation or the scale of operation of a
firm has important implication for efficiency realisable from the different technologies
particularly between Chinese and advanced country machines. The findings generally
indicate that the advanced country technologies, which are more capital intensive, may have
no advantage over the Chinese machines in terms of efficiency if we take into account the
level of actual capacity utilisation. The Kenyan machine appears superior over the Chinese
machines but it is important we do not lose sight of the fact that the Chinese machines
produce better quality output and are more functionally flexible, and these two features have
not been captured in the computations.
7.2 Returns on investment in the technologies
The annex to this chapter presents how profitability indicators – net present value (NPV) and
benefit-cost ratio (BCR) – are derived for investment in planers for the different sources and
across the formal and informal sectors. It is worth reiterating that these calculated indicators
are largely illustrative of the kind of calculations that could have been done if the required
data had been available. Hence, the present calculations are based on some restrictive
189
assumptions, which have been discussed in the chapter annex. Although these assumptions
are based on my field observation rather being mere conjectures, the results derived from
the analyses should be used with some caution particularly the policy implications thereof.
Detailed discussions of the results are also provided in the annex. However, the core findings
from the analyses are summarised here as follows: The BCR indicates that the returns on
investment in advanced country planers (and Kenyan planer) are better than Chinese
planers at rated capacity utilisation for both formal and informal sector firms. However, the
BCRs at actual capacity utilisation show that only the modified Chinese and Kenyan planers
are profitable in the informal sector while all investments are viable in the formal sector with
the modified Chinese planer yielding the greatest returns.
So far, the chapter has analysed the relative efficiency, factor intensities and the returns on
investment in these technologies. However, while it may be worthwhile (in terms of
profitability) to commit resources for investment in certain technologies, the accessibility to
the modes by which the technologies are transferred and the nature of financing options for
acquisition can limit the technology choice set for some of the firms. The discussions in the
next section therefore turn to the transfer modes and the financing options that are available
to the firms for acquiring the machines.
7.3 Transfer modes
As shown in Chapter 3, the literature provides many different means by which technology
can be transferred from its place of origin to another, a process that depends on the nature of
the technology, that is, whether it is a physical asset, a process, the technical knowledge of
people or a combination of these. In this section, the mechanism by which the technologies
studied in this research are transferred or diffuse to the firms in Kenya’s furniture making
industry is empirically examined and compared to those of the other technologies particularly
the advanced country technology. As a reminder, the technology objects for the transfer or
diffusion considered in this study are physical assets, that is, machines.

190
The transfer of the Chinese and advanced country technologies involves the movement of
the technologies across international borders. For the Kenyan technology, however, the
transfer involves the modes by which the technology moves from the workshops of the local
fabricators to the furniture making firms. As noted in Chapter 3, the expectation is that the
technologies studied in this thesis may be transferred through three broad channels: direct
investment; network between firms (i.e. joint ventures and governed GVC channels); and
arm’s length market/trade.
7.3.1 Transfer mode for Chinese and advanced country machines
Characteristically and legally, FDI is a formal sector phenomenon; hence transfer of foreign
technology to the informal sector firms in Kenya’s furniture making industry is not expected to
take place through direct investment. This study confirms this since, as indicated in Chapter
5, none of the informal sector firms interviewed has foreign ownership. The FDI component
of investment in the formal sector also seems very limited. Of the 20 formal sector firms
interviewed on the first round of interviews, only one involves direct investment with Turkish
origin. This confirms a study by the United Nations Conference on Trade and Development
(UNCTAD) (2005) which suggests that, unlike agro-processing, furniture making does not
constitute a part of Kenya’s manufacturing sector which is attractive to foreign investors. It is
however interesting to note that the Turkish firm mentioned above has invested in Turkish
machines which suggest that if I had found/interviewed a Chinese firm, there would have
been a high likelihood that that firm would have some investment in Chinese machines.
Generally, therefore, direct investment is not a major channel through which technologies
from both China and advanced countries are transferred to the furniture making firms in
Kenya.
Moreover, the field data indicate that governed GVC networks as well as joint venture do not
serve as channels by which the technologies from both China and advanced countries are
transferred to the firms operating in Kenya’s furniture making industry. As mentioned in
Chapter 5, Kenya’s furniture making firms including the formal sector ones have an

191
insignificant export market and weak linkages with foreign firms. Thus, unlike the Kenya’s
tourism industry which has relatively strong connections with foreign firms in the tourism
GVCs (Staritz and Reis, 2013), the firms in the furniture making industry are not integrated
into the global furniture production or value chains, of which according to Kaplinsky et al.
(2003) is mainly buyer-driven. Unsurprisingly, none of the firms interviewed had embarked on
any investment in machines from China or any of the advanced countries based on an
influence or initiative from a foreign or lead firm in the global furniture value chains.
Consequently, the firms including the formal sector ones obtain the technologies through
arm’s length market/trade, which involves purchasing the machines from the shelves of
market traders. The trade arrangement is such that there is no or very limited relationship or
contact between the manufacturer of the machinery and the firms in Kenya. All the firms
interviewed in this study purchased their Chinese and advanced country machines through
such arrangements.
The arm’s length trade does not involve explicit and active transfer of any process
technology associated with the machines. This is contrary to what would happen if, say, a
multinational company were to transfer its technology to another firm in a foreign country.
Technology transfer of the type seen in this hypothetical example would likely involve explicit
licensing contract between the parties. Such agreement does not characterise purchasing
machines from the shelves of market traders as in the case of the furniture making firms in
Kenya. This finding generally supports a report by UNCTAD (2005) on Kenya which indicates
that firms in Kenya have resorted less to foreign technology contracts with the local firms
generally investing in technologies embodied in second hand equipment which (as noted in
Chapter 6) is typical of the furniture making firms’ investment in advanced country machines.

192
Table 7.4: Modes of acquisition of machines (planer, band saw, lathe and saw bench) used by the firms
Sources
Formal firms Informal Firms
New machine Used machine New machine Used machine
China Buy locally from
traders (1)
- Buy locally from
traders (19)
-
Kenya
(Jua Kali)
Buy directly from local
fabricators (2)
- Buy directly from
local fabricators
(29)
-
Adv.
countries
Import directly from
source through foreign
agents (3)
Import from source through foreign
agents (3)
Buy locally from traders (2)
Buy from liquidating local formal firms (2)
Buy from local formal firms disposing old
machines because they have invested in
new or modern machines (3)
- Buy locally from traders (4)
Buy from liquidating formal
firms (1)
Buy from government
Technical training institutions
through auction (1)
Note: The numbers in the brackets represent number of firms which have used the respective modes of acquisition
Source: Field data, 2012/13
193
Although the Chinese and advanced country machines broadly use the same entry channel
into Kenya, the modes of acquisition used by the firms generally differ. Table 7.4 presents
the different modes of acquisition used by the formal and informal sector firms for both
Chinese and advanced country machines. In the table are also the numbers of firms that
have used a particular mode of acquisition. The table was compiled based on the second
round of interviews involving 41 firms, of which eight are formal sector firms. Five out of the
eight formal firms were able to provide information on how the specific machines studied
were purchased. It should also be noted that the different modes are not mutually exclusive
to any given firm, that is, a firm may have used more than one mode of acquisition.
The table shows that all the Chinese machines including those purchased by the formal
sector firms were bought from local traders who import from China. However, in addition to
buying from local traders, there are other important modes of acquisition for second hand
advanced country machines. These include buying directly from foreign agents, from
liquidating formal sector firms, from local firms scrapping old machines for newer ones as
well as from government technical training institutions. Purchasing from training institutions is
however relatively rare. As indicated in the table, only one respondent reported purchasing
machines, which were used in a government school but were being auctioned by the school.
The data also shows that unlike the Chinese machines, which were all bought locally, the
brand new machines from advanced countries for which information was available were
imported directly from the advanced countries through foreign agents.
Also worth mentioning is an important difference in the modes of acquisition used by the
formal sector firms and their informal sector counterparts. That is, the informal sector firms
appear to rely exclusively on the local traders (or importers) while the formal sector firms are
able to directly access foreign markets for both brand new and second hand advanced
country machines. The likely explanation for this difference is that aside from the advanced
country machines being unaffordable to the informal sector firms, these firms generally do

194
not have the financial, administrative and intellectual capacity to manage the relatively
complex transactions associated with the importation of machines.
The inability of informal sector firms to directly source machines from abroad may partly
explain why there appears to be only one mode of acquisition for Chinese machines as
against the diverse means of acquisition for advanced country machines. As observed in
Chapter 6, with Chinese machines selling at about a tenth of the price of advanced country
machines, the informal sector firms find them highly affordable. The low cost has
consequently created a relatively high effective demand for Chinese machines in Kenya
especially among the informal sector firms. Since these firms cannot import by themselves,
profit-seeking trading entrepreneurs are exploiting this opportunity by importing the Chinese
machines.
However, effective demand for advanced country machines particularly the brand new ones
is relatively limited because they are very expensive. Coupled with this is the fact that some
of the formal sector firms may want to do their own importation, making the sales and
distribution of the advanced country machines less attractive to the traders/importers.
Consequently, availability of advanced country machines on the Kenyan market is relatively
limited which in turn may also lead the formal sector firms to do their own importation.
Interviews with four sales and distribution firms of the machines in Kenya confirm the
relationship between demand and the existence of specific modes of acquisition. The firms
generally noted that furniture making machines have low turnover, compared to other
equipment such as generators, compressors and agro machines and this problem is more
acute with respect to machines from advanced countries. One of the firms, a veteran trader
in furniture making machines, indicated that it diversified away from furniture making
machines a decade ago because they offered low turnover. A respondent from another firm
noted that his firm has almost moved away from selling furniture making machines, including
those from China. In fact, there was not a single furniture making machine in the main shop
at the time of the interview although he indicated that a few pieces might still be available in

195
other branches. For the other two firms, which still deal in furniture making machines,
significant proportions of their wares including non-furniture making machines are imported
from China. One of these two, a large firm employing 108 workers, imports about 90% of its
machines from China. The other which does not directly engage in importation but only
retails the machines had about 50% of its wares having been imported from China. The
respondent from the retail firm, which has been in operation for 30 years, indicated that her
company started with only Japanese machines but because they are relatively more
expensive with low turnover they started diversifying into Chinese machines in the early part
of the 2000s.
Another likely reason for the single mode of acquisition for the Chinese machines is a
language barrier. Kenya is an English speaking country, which means doing business with
Chinese who may not be able to speak English can be challenging. A respondent from one
of the local traders (a sale and distribution firm) in Chinese machines interviewed confirmed
this problem by noting that in order to overcome language problems, his firm has employed a
Chinese agent in China who helps handle their transactions in China. The language barrier
therefore makes direct sourcing of machines from China by the furniture making firms
unattractive and more so for the informal ones. The reason is that the volume and the one-off
nature of the firms’ purchases may not warrant the cost associated with hiring or using the
services of a Chinese broker or agent.
7.3.2 Mode of acquisition for Kenyan (jua kali) machines
Unlike the Chinese and advanced country machines, acquisition of locally made machines by
the firms does not involve any form of cross-border transactions. More interestingly, the
furniture making firms purchase directly from the fabricators, as indicated in Table 7.9,
instead of market intermediaries (that is, sales and distribution firms) as in the case of
Chinese and advanced country machines. The purchase, according to all the respondents in
the second round of the survey who have invested in Kenyan machines including the formal

196
ones, involves placing an order with the fabricators before the machine is fabricated. (The
terms for placing order from the fabricators are discussed in Section 7.3.3).
An important feature of the mode of acquisition for Kenyan machines is that the direct
contact with the fabricators allows their customers to place orders for customised machines.
This kind of customisation relates to the quality of materials and the robustness of imported
parts such as the motor used for fabricating the machines. The room for customisation also
allows for a high degree of price negotiation and reduction, which influences the quality and
durability of the machines or at least some of its parts. I did not find this customisation or any
of its kind as a feature of investment in machines from China and advanced countries.
However, like the Chinese and advanced country machines, arm’s length trade arrangement
characterise the mode of acquisition of the Kenyan machines used by the firms. While repeat
purchases from a fabricator are not ruled out, the firms buy from any fabricator they can trust.
7.3.3 Payment terms and financing
The payment terms available for the acquisition of machines, if they differ across the sources
of machines, may influence investment decision between machines from the different
sources. In this section I discuss the payment terms and also how the firms finance the
acquisition of the machines, that is, whether from internal sources or through bank loans.
Terms of payment for machines
Generally, two main terms of payments exist: The first is “cash and carry” which is more
popular and involves making outright payment of the total cost of the machines before being
allowed to move the machine away. The second is a flexible system where the firms are
allowed to make a deposit and then to pay the remaining balance in instalments over a short
period of time, usually three months. Purchasing Chinese and advanced country machines
mainly involves the former approach while a handful (i.e. four of the informal sector firms
interviewed in the second round of the survey) reported having used the latter for purchasing
Kenyan machines.
197
Generally, placing an order for a Kenyan machine, whether customised or not, involves
paying an initial deposit, which based on negotiation may vary from 30% to 65% of the full
cost of the machine. The remaining balance is cleared when the machine is ready for
delivery but in the instances of flexible payment approach, the remaining balance is spread
over an agreed period of time. The availability of such a facility is however based on personal
and trust relations between the buyer and the fabricator, which as noted in Chapter 5, is
largely driven by tribal ties especially in the informal sector and particularly in the Gikomba
cluster.
With limited access or resort to external financing, as discussed in the next subsection, the
flexible payment approach appears valuable to the informal sector firms. In an attempt to
boost sales, some of the local traders of the Chinese machines have tried this approach but
not without failure: Two of the four traders interviewed indicated that they tried this approach
but it did not work well for them because of abuse of trust by their customers, pushing them
to resort to only the “cash and carry” method.
Financing options for investment in machines
One of the challenges to doing business in Kenya is access to finance especially from formal
financial institutions which is more acute in the case of informal sector firms (Bowen et al.,
2009; Atieno; 2009; Obeng et al., 2012). Atieno (ibid) specifically noted that most of formal
financial institutions do not lend themselves to doing business with micro and small scale
enterprises. Obeng et al. (ibid) studied the Sokoban informal woodworking cluster in Ghana
and found that the lack of access to finance is one of the major challenges facing artisans in
this cluster. The field interviews with informal sector furniture making firms also confirm this
as can be seen in the following statement from one of the operators:
I don’t have the capacity to borrow from the bank. Moreover, my friend, the bank cannot loan you when you are operating in a structure like this. Where is the security of the money they want to give you? Banks consider a lot, so many things, before giving a loan. After looking at your savings, they also ask for collateral and inspect your workshop. They will come here and find that this workshop is a debris. They want someone operating in permanent building so that they are assured that if they help to invest in machines or any other thing, it won't be destroyed by sun, rain or fire until you have fully recoup the investment. So, it is not easy for us to get financial help

198
from banks. If someone will come here today and offer us machines, I tell you we can do wonders. (Field interview, 2012)
For a lot of the firms, perceived and/or real lack of access to bank financing leaves them with
few alternatives for financing machine acquisition such as savings (i.e., internal financing),
microfinance loans, and financial support from relatives. The commonest among these
alternatives is, however, savings or internal financing which appears popular not only for the
informal sector firms but also for the formal sector firms. Of the 33 informal sector firms
interviewed in the second round of the survey, almost all had purchased a machine with
savings while few (seven of the 33) had purchased machines with loans, mainly from
microfinance companies. Two of these firms that had purchased machines with loan actually
borrowed to top up savings, meaning the machines were not entirely purchased with loans.
Specifically for the informal sector, savings are sometimes organised through what has been
referred to in the literature as rotating savings and credit associations (ROSCA) (e.g.
Ardener, 1964; Bouman and Harteveld, 1976; Shanmugam, 1989; Hevener, 2006). ROSCA
is a system where a group of informal sector operators save together and give their total
savings at the end of a given period (say, a month) to one of the members. The process is
repeated until all the members in the groups have had their turn. Three of the firms
interviewed had raised money to buy machines through ROSCA.
For the eight formal sector firms interviewed on the second round of survey, data obtained on
how they finance machine acquisition was less adequate. The main reason for this is that the
machines these firms have were purchased many years ago and people who are now in
charge of the companies’ operation or management (i.e. the respondents) could not provide
information about how the acquisition was financed. Four of the eight firms were able to
provide information although the information was relatively less detailed. Two of the four,
which were able to provide information, had purchased machines using bank loans although
these firms tend to depend on internal financing as well. This finding aligns with that of
Banda (2013) who studied pharmaceutical companies in Zimbabwe and found that the firms
tend to rely mostly on internal funds for investment in machinery and equipment. Though the

199
industry Banda studied may be very different from what this thesis focuses on, the findings of
these two studies highlight the limited financing options available to firms operating in
developing countries.
Aside from the lack of access to external financing because firms are not able to meet the
requirement of the financial institutions, internal financing or savings appears more attractive
for two more reasons: First, the firms find the interest rates charged on the loans to be high
especially in terms of effective rate of interest32 charged, particularly loans from microfinance
companies. That means that the opportunity cost of using savings (that is, interest forgone) is
lower than the cost of borrowing given that interest rates or earnings on savings are lower
than the interest rate on loans. More worrying is that for the informal sector firms the loans
obtainable from microfinance companies have virtually no grace period. A respondent
explained why he does not want loans as follows:
Well, well, well … you see with us around here we are very careful. We don’t go for loans easily because we have seen so many businesses flopping because of loans … I have never tried going for loan. No, no ... I don't, I don't. It has never been an option for me. I have seen so many people around, like there is one guy who is our friend, an old friend but he depended on the very loans. Now they came back and they auctioned everything he owned and he went home [to the village]. It was very sad. The microfinance come around to us but whatever the interest they are looking for is too much. If somebody will give 10,000 Shillings, he will give you a grace period of say one month and then you start paying back. Now, if you sit down to calculate the amount of money you will pay back, you will find that you will be paying back 12,500 Shillings or even 15,000 Shillings. So we simply depend on our daily savings on our sales. (Field interview, 2013)
Another person had this to say: “You know, we normally fear [loans] because you don’t know
whether you are going to get a lot of jobs after getting the loan so you can pay the loan back
… each and every month you to have sign how much you will be giving them” (Field
interview, 2013).
Another person who had invested in a Chinese planer with a loan from a microfinance
company described how he copes with the conditions on loans from microfinance institutions
including the repayment terms as follows:
32
This is the simple interest rate that produces the same amount of interest as the compound interest rate.
200
For thicknesser, I bought just a year ago through loan because before buying the machine I sat down and realise the maximum revenue I can get from a machine in a day. After realising how much I get from the machine in a day, I had to stick to my budget knowing that I will be able to raise the amount I have to pay at end of every week ... As I speak with you I should be going to pay loan now. In fact, I am already delayed that is why I was telling you I can only have 30 minutes with you. (Field interview, 2013)
Second, the firms generally do not buy all the machines at a go but they purchased one after
the other reducing the need for external financing or allowing them to depend on their
savings. In relation to this, a respondent from a formal sector firm indicated: “I raised funds
for purchasing machine out of my savings/sales. I have never borrowed money from banks
for machines. This is because I have never bought a lot of machine at once; I normally buy
one after the other as we continue the business” (Field interview, 2012).
7.4 Conclusion
This chapter has focused on the mode of transfer of the three technologies to the firms,
financing options for machine acquisition, factor intensity and relative efficiency of the
technologies as well as the return on (or profitability of) investment in the technologies. Of
the modes of transfer identified in the literature, the study has found that the most common
for the firms is arm’s length trade. For the informal sector, this seems to be a truism as they
lack the capacity to engage in any other transfer method such as joint venture. Moreover, no
foreign direct investment could possibly go to the informal sector and they also do not
participate in the furniture global value chains (GVCs). The formal sector firms also do not
have any meaningful participation in GVCs and only one of the 20 formal firms interviewed in
the first round of the survey can be classified as a foreign direct investment while no joint
venture was found.
The firms, both formal and informal, rely mainly on internal funds for acquiring machines
while the mode of acquisition within the arm’s length trade differs across the three technology
types and between the informal and formal sectors. The firms acquire the Chinese machines
from sales and distribution firms in the domestic market while for advanced country machines
the formal sector firms may purchase them directly from foreign markets. For second-hand

201
advanced country machines, however, the firms buy some locally, which is the only way by
which an informal sector firm can purchase a second-hand machine from advanced
countries. Obviously, in the case of Chinese and advanced country machines the transfer
involves importation. The importation is done by either domestic sales and distribution firms
especially in the case of Chinese machines or the firms themselves, specifically, the formal
sector ones and in the case of the advanced country machines.
The analyses on the production coefficients show that the Chinese machines are inefficient
compared to the advanced country and Kenyan machines if the machines were operating at
rated capacity utilisation. However, at actual daily production rate, the efficiency of the
Chinese machines is generally comparable to that for the advanced country machine while
the Kenya machines still appears superior to the Chinese machines. Similarly, the indicators
on returns show that at actual capacity utilisation the Chinese and Kenyan machines may
yield higher returns (and are viable) for the informal sector firms than the advanced country
machines while the reverse is true if capacity could reach the rated level. For the formal
sector, all investments appear viable whether capacity is underutilised or not although the
returns may be much higher if the firms are able to achieve rated capacity utilisation,
particularly in the case modified Chinese planer. These results seem to highlight the
importance of scale in determining the appropriateness of a technology for a given context or
firm.
Finally, the Kenyan machine does not only seem to offer relatively high efficiency and return
but it is the most labour intensive, followed by the Chinese machine. However, it is important
to note that the apparent superiority of the Kenyan machines over the others may disappear
if quality differences in the output of the machines had been captured in the computation of
the production coefficients. For the Chinese and advanced country machines such quality
differences appear to be very minimal as highlighted in Chapter 6.

202
In the next chapter, I examine the extent of penetration of the machines from the three
sources in the furniture industry and the determinants of the adoption of the technologies by
the firms.

203
Annex to Chapter 7: Indicators of returns on investment
As mentioned in the introductory section, two indicators of return on investment are used in
this study. The net present value (NPV) and benefit cost ratios (BCR) are derived for
investment in each type of planer for both the formal and informal sectors. The NPV is
defined as:
𝑵𝑷𝑽(𝒔) = ∑ 𝜶𝒕
𝒏
𝒕=𝟎
𝒔𝒕 =𝒔𝟎
(𝟏 + 𝒊)𝟎+
𝒔𝟏
(𝟏 + 𝒊)𝟏+ ⋯ +
𝒔𝒏
(𝟏 + 𝒊)𝒏 (𝟏)
Where n represents the lifespan of the machines, α is the discount factor and t is a given
year during the life of the machine. i is referred to as the discount rate which is assumed to
be invariant with time and s is the annual revenue the machine generates less the cost
incurred in a given year. At t equals zero the cost incurred is the acquisition cost of the
machines while for the subsequent years the costs incurred represent the operating cost of
using the machine to generate income. The formula reflects the basic principle behind NPV
analysis, which says that streams of benefit or costs (i.e., negative benefits) occurring in the
future are of lesser economic value or provide lesser utility than present streams (Mishan,
1972; Dasgupta and Pearce, 1972). In other words, a dollar in hand today is worth more than
a dollar to be realised a year from now, thus, the need to discount the future streams. This is
important especially when dealing with investments that last for different time periods. By
NPV, an investment is deemed viable if the calculated NPV is positive.
To follow the NPV principle, a discount rate of 10% has been adopted. This is the real
lending rate for the Kenyan economy I obtained by simply subtracting inflation from the
nominal lending rate of 20%. This nominal lending rate is a 12-month simple average of the
commercial banks’ weighted average of monthly lending rates for January to December
2012, published on the official website of the Central Bank of Kenya. The inflation rate is also
a simple average of monthly (year-on-year) inflation figures for January to December 2012,
published on the official website of the Kenya National Bureau of Statistics.

204
The rationale behind discounting also underpins the BCR. Being the ratio of the discounted
benefits to the discounted costs over the life of the machine, BCR is directly related to NPV
in the sense that investments with negative NPV always have BCR of less than one. Unlike
NPV, the BCR provides an added advantage of being amenable for ranking the investments
of different magnitude in terms of their viability (Dasgupta and Pearce, 1972). By BCR, viable
investments are supposed to have BCR greater than one and the greater it is the higher the
returns on the investment and the more preferable the investment is to the ones with
relatively smaller BCRs.
The subsections that follow describe the components of the revenue and the cost streams
associated with operating the machines per year during the life of the machine and how they
are derived for the computations in this thesis. The revenues and costs are the main
ingredients for calculating the indicators for the returns on investment.
Total cost streams
Two aspects of the total costs of operating the various planers – acquisition and
maintenance costs – were discussed in Chapter 6. The acquisition costs were presented
Table 6.2 in Chapter 6. With regards to maintenance and repair costs, the respondents were
not able to provide reliable information on how much they spend seasonally except for the
cost of rewinding broken motors. As noted in Chapter 6, the cost of rewinding Chinese motor
is USD 58.82 which accrues about two to three times a year and that for advanced country
planer is USD 94.12 which happens once in about every three years. That for a Kenyan
planer is not different from advanced country cost because they tend to have second hand
motors from advanced countries. Being pessimistic about the Chinese machines, I assume
for the case of the Chinese planer that the motor rewinding happens four times a year. This
gives a total maintenance cost of USD 235.28 per year for Chinese planer while that for both
advanced country and Kenyan machines is USD 94.12 per triennium. Further maintenance
costs such as repairing or replacing machine parts such as chains, bearings and cutter
blocks may be incurred for all the machines especially the Chinese machine. However they
205
are not captured in the total cost stream because the respondents could not provide
consistent and reliable information about such costs. Hence, the analysis starts with the
assumption that such maintenance costs are nil but later relaxes this assumption by adding
an annual fixed maintenance cost of USD 100 per annum for the Chinese planer. The reason
is that apart from the motor, other parts of the Chinese machines breakdown much more
frequently than those of the other machines.
Also, an important element of the operating cost is the rental cost of sheds or premises.
However, I leave this cost out of the computation in order to avoid complications associated
with apportioning rental cost to a machine. Such detailed apportionment does not happen in
practice. In terms of the calculated indicators presented in this chapter, this omission may
favour the formal sector because of the large difference between rental costs of the rickety
sheds of the informal sector operators and the well-built premises of the formal sector firms,
as discussed in Chapter 5. In addition to the other operating costs mentioned so far, running
the planers also involves labour and electricity cost. The details on how these costs are
measured for the purpose of computing the indicators are discussed as follows.
Labour cost
The labour hours used in machine operator firms in the informal sector are compensated for
on commission basis. Information obtained from the machine operator firms in the informal
sector indicates that they (two people – the main operator and an assistant) receive 30% to
50% of the daily proceeds in wages. For the needed computation, I assume 40% for the daily
compensation rate for labour, which is an average of the indicated bounds. The reward
system in the formal sector is however different. Usually, the operators receive a monthly
salary. However, of the 8 firms interviewed in the second round, only one operator for an
advanced country planer gave out his monthly salary of 18,000 Kenya Shillings. Apparently,
this employee had worked for that firm for over 25 years; hence, his salary appears to be a
poor representation of the average for the sector. I therefore rely on the official minimum

206
monthly wage for Kenya in 2012 which was 9,724.30 Kenya Shillings33. With five working
days in a week and eight working hours per day, this figure comes to 60.78 Kenya Shillings
hourly rate for a worker. On the basis that two people are required to operate the planer, the
total hourly wage cost for operating the planer is 121.55 Kenya Shillings, which converts to
about 1.43 US dollars.
Cost of electricity
The cost of electricity for the firms is generally recorded as a lump sum as in the case of
rental cost of sheds or premises and the firms have no system of apportioning the cost to
individual machines. However, knowledge of the capacity of the machines’ motor (horse
power or kilowatt per hour – kwh), the daily run of the machines and the tariff rates of the
power supplier makes it possible to estimate the cost of electricity consumed for a particular
level of production with the planers. Chapter 6 showed that a typical Chinese planer has a
three horse power (2.206 kwh) motor while that for advanced countries has 6 horse power
(4.413 kwh). The corresponding figures for Kenyan and modified Chinese planers are five
(3.677 kwh) and 4.4 (3.309 kwh) respectively.
Two different tariff rates from the power supplier are used in this study. Kenya Power
provides varying tariff rates for different categories of consumers. I make use of the first two
of the commercial tariff rates, which correspond with 240V and 415V supply, as defined in
the company’s tariff guide, published online by Ray of Solaris. The rates for the former and
latter are respectively used for the computations for the informal and formal sectors. The rate
recorded for November 2012, the time around which the data were collected, are 19.78
Kenya Shillings per kilowatt hour for 240V and 16.34 Kenya Shillings per kilowatt hour for
415V.
33
This is the minimum monthly wage rate for machine attendants/operators reported by Legal Notice 71 of 2012, under Kenya’s labour Institution Act 2007 (No. 12 of 2007), published online by the Kenya Laws (2012)

207
Revenue stream
This section provides the monetary measure of the level of production that the various
planers can achieve in each year of the life of the machine. This measure is obtained by
multiplying the output of the machines in terms of the number of feet they can plane, as
determined in Section 7.1.1, by the unit charge (price) for a foot. The monetary value of
production could then be added to the scrap value to obtain the total revenue realisable from
the machine. However, I assume zero scrap values for all the planers. The reason can be
found in the relatively long actual and expected life of the machines especially the ones from
advanced countries. As noted in Chapter 6, the firms do not give up on the machines easily,
thus, they seem to exact benefits beyond what the normal economic life of the machines
should offer.
Money value of physical output
Obtaining the money value of output is quite simple for the informal sector. The machining
operator firms charge Three Kenya Shillings per foot. Using 300 working days34 per year, the
total revenue per annum is easily obtained by multiplying the daily production level by the
unit charge and the number of working days in a year. It should be noted that the fact that the
unit charge does not capture the qualitative differences in the work done with the different
planers pose some limitation on the calculated indicators particularly with regards to the
social value placed on the various investments.
Unlike the informal sector, there is no directly observed unit charge or market price for
machining services in the formal sector because such activities are fully integrated in the
individual firms. I therefore assume the unit charge for the formal sector to be one and half
(1.5) times that of the informal sector based on the fact that products/services from the
formal sector are normally much more expensive than those from the informal sector. As
noted in section 5.2.3 of Chapter 5, products from the formal sector could sell for over four
times the prices of those in the informal sector including the Ngong’ cluster. However,
34
I use 300 working days instead of 312 (6 days a week times 52 weeks) because of various festive periods such as Christmas and national holidays.

208
machining work (i.e. preparation stage of the furniture manufacturing process35) is less skill-
demanding, compared to the other stages such as designing, joinery and upholstery, which
together constitutes a major determinant of quality difference between products from the two
sectors. In other words, value added at the preparation stage appears to be much less than
the other stages. Thus, much of the price difference in the final products from the formal and
informal sectors seem to emanate from the designing, joinery upholstery work as well as
differences in the quality and cost of other inputs such as raw materials and rental cost of
premises. This rationalises the notion that although the unit charge for planing in the formal
sector should be higher than that for the informal sector but not proportionately related to the
price of the final products (furniture).
Interpretation of calculated indicators of returns
The indicators of the returns on investments are presented separately for the two sectors.
This separation is necessary because the firms in these two sectors face different output and
input prices. Like the discussion on production coefficients, for each sector, the indicators are
provided for the two scenarios presented in Table 7.1, that is, production at rated capacity
and production at actual (daily demand-driven) capacity utilisation. The subsection further
presents indicators on the Chinese planer for both formal and informal sectors when
additional maintenance and repair cost of USD 100.00 are incurred every year. However,
indicators for the Kenyan planer are not reported for the formal sector because none of the
formal sector firms interviewed had invested in the Kenyan planer.
Working at rated capacity
At the rated capacity, all the machines are profitable in both the informal and formal sectors.
As Table 7.5 and 7.6 indicate, all the machines yield positive NPVs. However, the tables also
show that for both sectors the advanced country and Kenyan machines produce higher BCR
than Chinese machines, whether modified or original. For the informal sector, the advanced
country planer when operating at twice the hourly rate of the original Chinese planer
35
The various stages in the process were discussed in Chapter 4 in section 4.5.2

209
produces a BCR of 1.27, which is close to that for the Kenyan machine (1.26) but higher than
1.22 and 1.21 for the original and modified Chinese planers respectively. The corresponding
figures for the advanced country planers and Chinese planers in the formal sector are
respectively 2.02 and 1.27 (1.54 for the modified machine). The modified Chinese planer
appears to yield better returns than the unmodified particularly in the formal sector. The
tables show that the modified yields higher NPV for both formal and informal sectors.
The NPV and BCR also show that investments in the formal sector yield higher returns than
that in the informal sector. It is also important to note that within the informal sector, the
Kenyan planer seems to offer better returns than the Chinese planer. This however depends
on the operator’s ability to charge the same price on a relatively inferior output, as the
operators of the Chinese planer, with no negative impact on demand.
Table 7.5: Working at rated capacity – Informal sector
Type of planer
Assumptions Capacity (daily run in hours) NPV BCR
China Original (unmodified) 6 3,471.09 1.22
Modified China working at 1.33 times original China's hourly rate 6 4,070.06 1.21
Advanced country
Working at 1.5 times original China's hourly rate 12 7,020.82 1.09
Working at 2 times original China's hourly rate 12 2,3730.49 1.27
Kenya Working at 1.33 times original China's hourly rate 8 8,064.58 1.26
Table 7.6: Working at rated capacity – Formal sector
Type of planer
Assumptions Capacity (daily run in hours) NPV BC ratio
China
Original (unmodified) 6 5644.22 1.27
Modified China working at 1.33 times original China's hourly rate 6 12427.19 1.54
Advanced Countries
Working at 1.5 times original China's hourly rate 12 41896.06 1.50
Working at 2 times original China's hourly rate 12 84243.76 2.02

210
Working at actual (daily demand-driven) run
Working at the demand-driven capacity utilisation has a major negative effect on the returns,
suggesting that under capacity utilisation is a challenge to investment in this sector. Under
capacity utilisation is not a characteristic of only the furniture making industry but a feature of
Kenya’s manufacturing sector as whole. A report by Kenya Association of Manufacturers
(2006) indicated that close to 90% of manufacturing firms in Kenya are underutilising
installed capacities.
Table 7.7: Working at actual daily demand-driven run (three hours) – Informal sector
Type of planers
Assumptions Capacity (daily run in hours) NPV BCR
China
Original (unmodified) 3 413.24 1.05
Modified China working at 1.33 times original China's hourly rate 3 1,292.05 1.12
Advanced country
Working at 1.5 times original China's hourly rate 3 -6,266.38 0.77
Working at 2 times original China's hourly rate 3 -2,088.97 0.93
Kenya Working at 1.33 times original China's hourly rate 3 2,333.31 1.19
Table 7.8: Working at actual daily demand-driven run (three hours) – Formal sector
Type of planer
Assumptions Capacity (daily run in hours) NPV BC ratio
China
Original (unmodified) 3 1657.58 1.14
Modified China working at 1.33 times original China's hourly rate 3 5470.62 1.45
Advanced Countries
Working at 1.5 times original China's hourly rate 3 3910.80 1.14
Working at 2 times original China's hourly rate 3 12854.06 1.44
At the actual daily run, the NPVs show that investments in the Chinese planer (modified) and
Kenyan planer in informal sector are still viable while the advanced country machine
becomes unprofitable (Table 7.7). Correspondingly, the table shows that the BCR for the
advanced country planer, even when it is operating at twice the rate of the original Chinese
planer, is less than one. The BCRs show that the Kenyan machine is again preferred to the
modified Chinese planer while the modified Chinese planer is in turn preferred to original
211
Chinese planer. It therefore appears that when capacity is underutilised, investment in
planers in informal sector is viable only for the modified Chinese and Kenyan planers. For the
formal sector, the Chinese planer (both original and modified) and advanced country planer
are profitable although the modified Chinese planer produces a slightly higher BCR than the
advanced country planer (Table 7.8). Obviously, the reason for the relatively low profitability
of advanced country machines at this rate of production in both sectors is that the advanced
country machines are more capital intensive and thus suffer disproportionately from capacity
underutilisation given that all other costs are variable.
Additional maintenance cost for Chinese planers
Table 7.9 reports the indicators when additional maintenance cost of USD 100.00 per annum
is assumed for the Chinese planer (both original and modified). The indicators are calculated
for actual daily (demand-driven) capacity for both formal and informal sector. The
corresponding indicators for rated capacity production levels are not reported because the
advanced country machines already yield better return than the Chinese when there is no
extra maintenance cost for the Chinese machines. The table shows that the NPVs and BCRs
are better in the formal sector than in the informal sector. In fact, the original Chinese planer
produces a negative NPV with a BCR less than one in the informal sector while the BCR for
investment in the modified planer in the informal sector is only slightly greater than one.
Interestingly, the BCRs for both the original and modified Chinese planers reported in Table
7.9 for the informal sectors are better than the corresponding figures for the advanced
country machine reported in Tables 7.7. Thus, even when the Chinese machine is not
modified, it appears as a relatively more viable investment option for the informal sector firms
when production at the actual daily demand-driven rate.
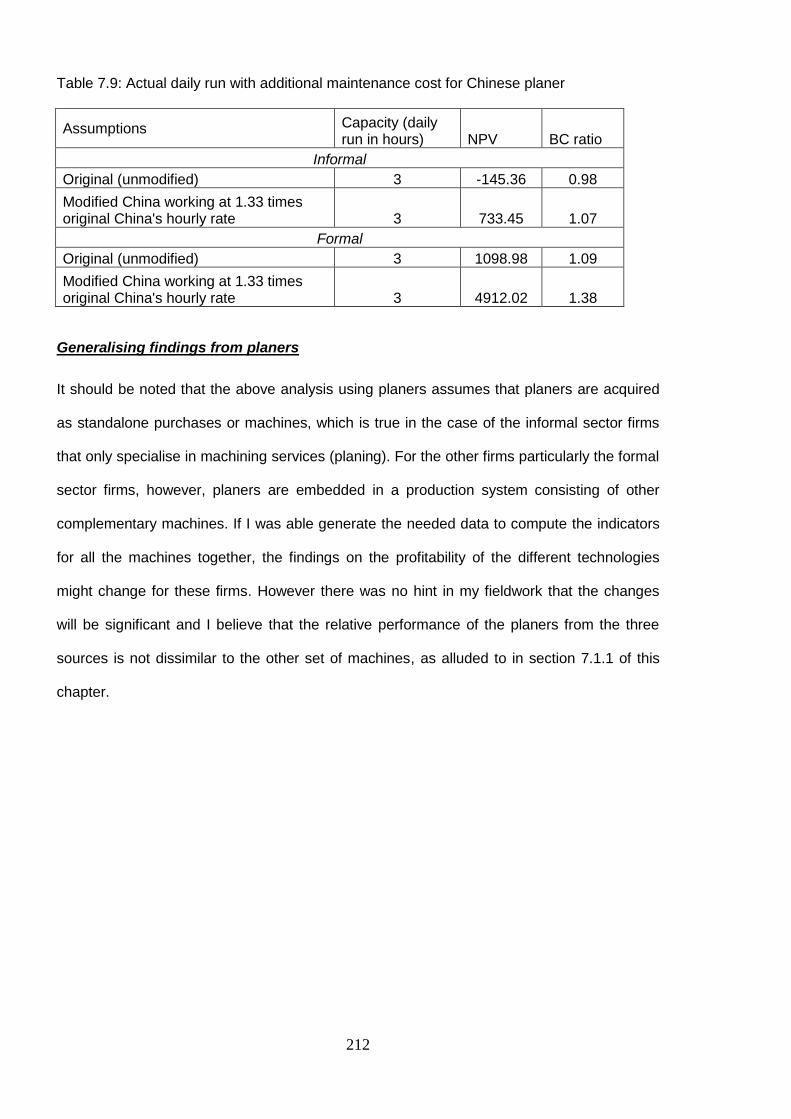
212
Table 7.9: Actual daily run with additional maintenance cost for Chinese planer
Assumptions Capacity (daily run in hours) NPV BC ratio
Informal
Original (unmodified) 3 -145.36 0.98
Modified China working at 1.33 times original China's hourly rate 3 733.45 1.07
Formal
Original (unmodified) 3 1098.98 1.09
Modified China working at 1.33 times original China's hourly rate 3 4912.02 1.38
Generalising findings from planers
It should be noted that the above analysis using planers assumes that planers are acquired
as standalone purchases or machines, which is true in the case of the informal sector firms
that only specialise in machining services (planing). For the other firms particularly the formal
sector firms, however, planers are embedded in a production system consisting of other
complementary machines. If I was able generate the needed data to compute the indicators
for all the machines together, the findings on the profitability of the different technologies
might change for these firms. However there was no hint in my fieldwork that the changes
will be significant and I believe that the relative performance of the planers from the three
sources is not dissimilar to the other set of machines, as alluded to in section 7.1.1 of this
chapter.
213
CHAPTER 8 : PENETRATION AND DETERMINANTS OF ADOPTION
8.0 Introduction
The aim of this chapter is to present findings on the level of penetration of the technologies
from China, advanced countries and Kenya (jua kali) in the furniture industry. The chapter
begins with a discussion on the level of investment in the machines by the firms before
delving into the patterns of penetration of the three types of technologies across the formal
and informal sector as well as between the different informal sector clusters. It also highlights
several possible explanations for the observed patterns of penetration based on evidence
presented in Chapters 5 to 7 and further information presented in this chapter with regards to
factors such as the characteristics of the machines, target market of the firms and
infrastructural conditions of their premises or sheds. Moreover, firm and operator
characteristics are examined as factors influencing choice (or adoption), thus penetration, in
a sequential logit model. Using bivariate/multivariate probit models, complementarities
between the adoption of Chinese technology and the others are also examined.
8.1 Level of penetration
8.1.1 Investment in machines and market-based cooperation
As alluded to in Chapter 4 under section 4.5.2, not all the firms interviewed in the first round
of the survey (i.e. the 131 firms of which 20 were formal sector firms) have invested in the
automated “light-duty” machines studied in this research: Some of them specifically those in
the informal sector have invested only in hand tools and/ or power tools. Figure 8.1 indicates
that 61% of the 131 firms interviewed have invested in the automated light-duty machines,
which have been simply referred to as “machines”. For the informal sector firms, 54% have
invested in these machines compared to 100% for the formal sector firms. Moreover,
between the informal sector firms and the formal sector firms that have invested in the
machines, there is a large difference in the number of the machines mounted in their

214
workshops. Walking through the workshops of these firms, I found that a typical informal
sector firm that has invested in these machines normally has one or two while its counterpart
in the formal sector has assorted machines that perform many differentiated functions. This
observation aligns with findings by Bigsten et al. (2000). In a study of 109 firms in Kenya’s
manufacturing sector they found that the formal sector firms are seven to eight times more
capital-intensive than their informal sector counterparts. This may be associated with the fact
that the informal sector firms have relatively limited access to finance compared to the formal
sector firms, as was noted in Chapters 5 and 7.
Figure 8.1: Proportion of firms (%) having a machine by sectors (N=131)
Source: Field data, 2012/2013
The informal sector firms that have invested in machines tend to invest in complementary
machines so that, for example, if firm A has invested in a Chinese planer, firm B (A’s
neighbour) would factor this into his investment decision and buy a different machine, say a
band saw from Kenya. More evidence on this can be found in the following statement from
an informal sector operator in the Kibuye cluster:
… we here we cannot afford all the machines, so we share the machines we have with other people. You cannot purchase all the machines, they are very expensive
54.05
100
61.07
0
20
40
60
80
100
120
Informal sector Formal sector All
%

215
and as per our production rate…even the one machine [planer from China] I have I cannot dwell on it all by myself. People bring their timber so I can plane for them to get money to do servicing [maintenance] and pay my rent … (Field interviews, 2013)
The opportunity to specialise and forge such complementarity therefore allows the firms to
specialise and provide reciprocal machining services, albeit, through the market mechanism
(arm’s length) rather than non-market cooperative structures. This kind of cooperation exists
mainly in the informal sector, whereas the formal sector firms rely extensively on their
internal capacity or capabilities. The opportunity for this complementarity also explains why
the firms invest in fewer machines compared to the formal sector ones. This finding generally
supports the literature on cooperation and collective efficiency of industrial clusters
(Rabelloti, 1999; Schmitz, 1999; and Nadvi, 1999). However, this form of cooperation can be
described as passive especially in relation to the active character of cooperation emphasised
in the above studies where joint actions by the firms lead to joint projects or investment (e.g.
joint investment in equipment), information sharing and labour training.
The use of market mediated forms of cooperation within the informal sector, specifically
between firms that manufacture furniture and also provide machining services, to a limited
extent, may be associated with the relatively low degree of trust between the operators
especially those in Gikomba cluster, which was highlighted in Chapter 5. As Uzzi (1997) has
indicated, arm’s length relationship in exchange tends to rely much less on trust compared to
other forms of exchanges.
An explanation for the large difference between the formal and informal sector in terms of
investment in machines can also be found in the quotation from the informal sector operator
in the last but two paragraphs. That is, while some of the informal sector firms do not have
financial resource to embark on this investment, others find it economically unviable because
their production level is too low to exhaust the capacity such investment will create. They
also believe that the supply of machining services within their clusters has reached saturated
levels. Thus, rather than acquiring any machine they rely on other furniture making firms
which have undertaken such investment or firms which specialise only in machining services

216
in their clusters. The decision to invest in machines is therefore made within a framework of
strategic interactions between the firms operating within the same informal sector cluster.
8.1.2 Level of penetration of the three technology types
Figure 8.2 presents the penetration rate by the technology types (machines from China,
advanced countries and Kenya) across the two sectors and the informal sector clusters.
These rates have not been calculated for the entire sample but for the 61% of the firms, who
have invested in machines. The rates also do not indicate the extent to which a firm has
invested in any of the technologies but are based on whether a firm has invested in at least a
machine belonging to any of the three categories of technologies. (Further details on the
firms’ degree of investment in a machine from a given source are provided in Figure 8.4
under subsection 8.1.3). It should also be noted that for any of the firms, investment in any
one type of the technologies does not exclude investment in the other types if the firm has
the resources to do so or finds such investment economically viable.
Of the firms that have invested in machines, Figure 8.2 shows that 61% have invested in at
least one Kenyan machine, compared to 45% for Chinese machines and 37% for advanced
country machines. However, the formal sector firms mainly rely on advanced country
machines. While all of formal sector firms have machines from advanced countries, 25% and
20% of these firms have invested in Chinese and Kenyan machines respectively. The
informal sector firms however tend to rely more extensively on Kenyan machines (75%),
followed by Chinese machines (52%) and less on advanced country machines (15%).
Within the informal sector, the Ngong’ cluster has the highest penetration rate for Chinese
machines (75%), followed by Kibuye (68%) and then Gikomba with a low rate of 12%. For
Kenyan machines, however, Gikomba has the highest level of penetration (88%), closely
followed by Ngong’ with 71% and then Kibuye with 63%.
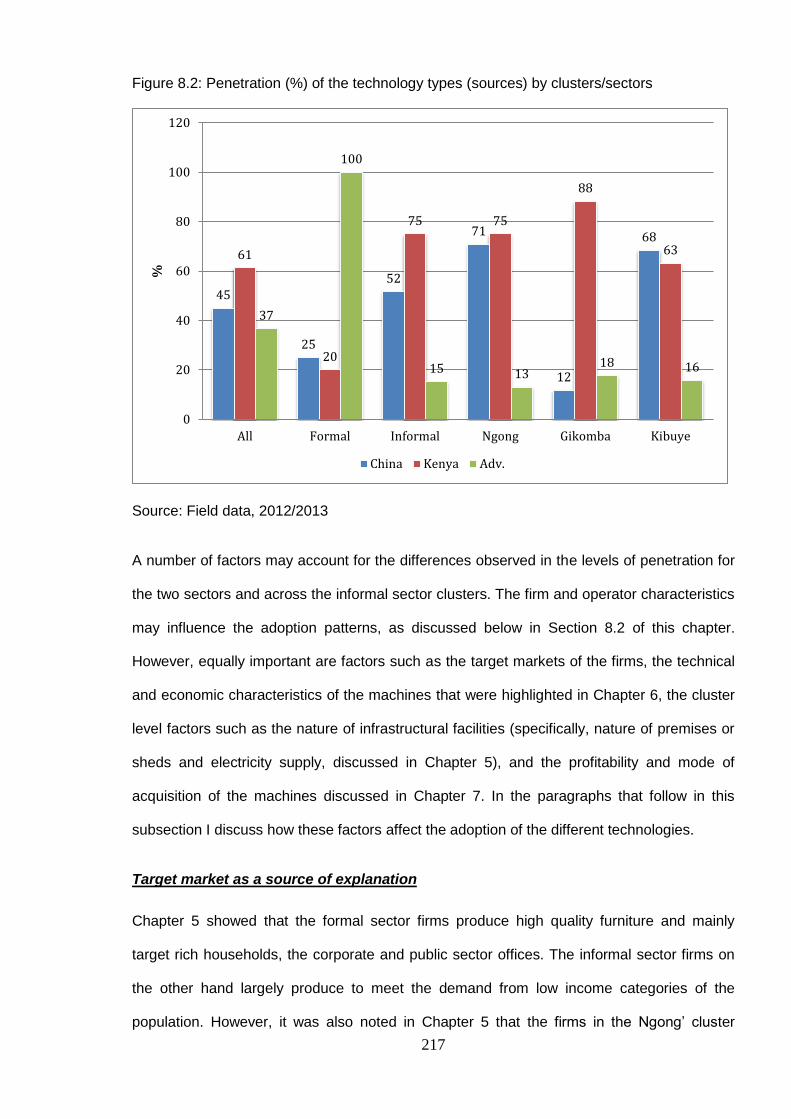
217
Figure 8.2: Penetration (%) of the technology types (sources) by clusters/sectors
Source: Field data, 2012/2013
A number of factors may account for the differences observed in the levels of penetration for
the two sectors and across the informal sector clusters. The firm and operator characteristics
may influence the adoption patterns, as discussed below in Section 8.2 of this chapter.
However, equally important are factors such as the target markets of the firms, the technical
and economic characteristics of the machines that were highlighted in Chapter 6, the cluster
level factors such as the nature of infrastructural facilities (specifically, nature of premises or
sheds and electricity supply, discussed in Chapter 5), and the profitability and mode of
acquisition of the machines discussed in Chapter 7. In the paragraphs that follow in this
subsection I discuss how these factors affect the adoption of the different technologies.
Target market as a source of explanation
Chapter 5 showed that the formal sector firms produce high quality furniture and mainly
target rich households, the corporate and public sector offices. The informal sector firms on
the other hand largely produce to meet the demand from low income categories of the
population. However, it was also noted in Chapter 5 that the firms in the Ngong’ cluster
45
25
52
71
12
68
61
20
75 75
88
63
37
100
15 13 18 16
0
20
40
60
80
100
120
All Formal Informal Ngong Gikomba Kibuye
%
China Kenya Adv.
218
appear to pose a competitive threat to the formal sector firms with respect to market
opportunities in the middle income segment of the market. Producing high quality furniture to
satisfy sophisticated consumers who may also place relatively more emphasis on prompt
delivery and warrantee requires investment in machines with the needed level of functionality
and reliability. Contrarily, satisfying less demanding consumers allows firms to make do with
lower quality machines, particularly with regards to precision and flexible of the functions and
the run of the machines. Thus, for the formal sector firms the advanced country machines
show up as the best choice while the nature of demand facing the informal sector firms
generally allows them to accommodate the disadvantages associated with the Kenyan and
Chinese machines.
Between the informal sector clusters, the Ngong’ cluster firms produce the highest quality of
products, which find patronage among some middle income consumers. Thus, customers of
the Ngong’ cluster are more demanding in terms of product quality, designs and finishing
than their counterparts in the other informal sector clusters. The Chinese machines offer
better precision and flexibility of functions than those from Kenya, as explained in Chapter 6.
Consequently, the need for the firms in Ngong’ cluster to meet the demand of relatively
sophisticated customers may explain why relatively more of the firms in Ngong’ cluster have
invested in Chinese machines compared to the others, particularly those in the Gikomba
cluster.
Characteristics of machines as a source of explanation
Many technical and economic characteristics of the machines may influence the level of
adoption. However, as established in the Chapter 6, the most important of these factors for a
choice between the three sources of machines are durability, functionality (precision and
flexibility of functions) and the acquisition costs of the machines. Firms in the informal sector
generally cannot afford advanced country machines in spite of their desirable qualities with
regards to durability and functionality, making these firms to settle for Kenyan and/or Chinese
machines. They (especially those operating in Gikomba cluster) prefer the Kenyan machines

219
to Chinese machines mainly due to the relatively high durability of Kenyan machines. They
however choose Chinese machine specifically the planer over Kenyan ones in situations
where they have higher requirement for precision and flexibility of functions. To a limited
extent, this explanation for the informal sector firms’ investment into Kenyan and Chinese
machines is also true for a few of the formal sector firms that have invested in Kenyan
machines. However, affordability of advanced country machines (particularly second hand
machines) for these formal sector firms to a great extent is less problematic.
Figure 8.3: Respondents’ ordinal evaluation of factors influencing choice
Source: Field data, 2012/2013
Generally, the above explanation for the patterns observed in Figure 8.2 accords with the
respondents’ self-reported evaluation of different factors that influence their choice between
the different sources of machines or technologies which have been presented in Figure 8.3.
On a scale of one to seven (where one means no influence and seven means very high
influence), they were asked to indicate the extent to which each of the factors presented in
the figure affects their choice between the different technology types. The figure shows that
for informal sector firms, price (a proxy for purchasing cost) is the most important factor,
0
1
2
3
4
5
6
7Price
Durability&quality
Functionality
Capacity/scalePower consumption
Maintenance&repair cost
Skill required
Informal Formal

220
followed by durability and then functionality (precision and flexibility) of the machines. For the
formal sector firms, however, durability comes first, followed by functionality and then
maintenance and repair costs, and in fact price is less important than the capacity/scale of
the machine. Thus, the characteristics of the machines and the firms’ self-ranking on the
factors which influence their choice help explain the pattern of penetration or adoption across
the formal and informal sector firms.
Profitability and mode of acquisition of machines as sources of explanation
Chapter 7 showed that Chinese machines and particularly Kenya machines appears to yield
higher returns than the advanced country machines particularly for the informal sector when
the machines operate at actual demand-driven daily capacity utilisation. In fact, the
calculations presented in the annex to Chapter 7 show that at the actual capacity utilisation,
the advanced country machines may yield negative net present values for the informal sector
firms. While I did not collect information on whether the firms did computations similar to
those in Chapter 7 before investing in the machines, it is not difficult to believe that the firms’
perspective about the amount of returns realisable from the machines will have a major
influence on their decision to choose a technology over other alternatives.
Also noted in Chapter 7 was the fact that purchasing advanced country machines may imply
that the firm has to buy directly from foreign markets and manage the complexities
surrounding the importation process. This makes the advanced country machines generally
unattractive to the informal sector firms. The reason is that not only may such process be
financially cumbersome for the firms but also given their limited educational background (as
discussed in Chapter 5) they may lack the technical knowhow and the courage to engage in
such processes. However, it should be noted that if there had been a large demand for these
machines, then surely traders would have emerged in Kenya.
Clustering and nature of infrastructure as sources of explanation
Cluster level characteristics such as infrastructural conditions may matter for the choice
between the three types of technologies. As shown in Chapter 5, infrastructural conditions in
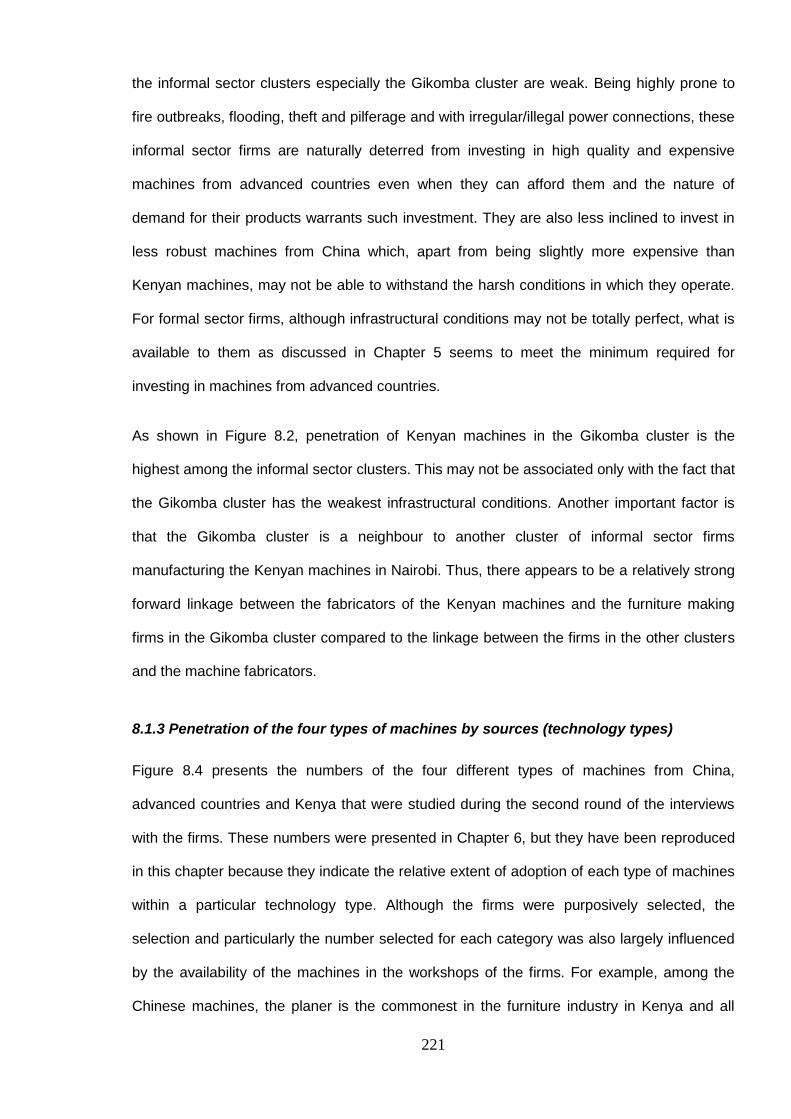
221
the informal sector clusters especially the Gikomba cluster are weak. Being highly prone to
fire outbreaks, flooding, theft and pilferage and with irregular/illegal power connections, these
informal sector firms are naturally deterred from investing in high quality and expensive
machines from advanced countries even when they can afford them and the nature of
demand for their products warrants such investment. They are also less inclined to invest in
less robust machines from China which, apart from being slightly more expensive than
Kenyan machines, may not be able to withstand the harsh conditions in which they operate.
For formal sector firms, although infrastructural conditions may not be totally perfect, what is
available to them as discussed in Chapter 5 seems to meet the minimum required for
investing in machines from advanced countries.
As shown in Figure 8.2, penetration of Kenyan machines in the Gikomba cluster is the
highest among the informal sector clusters. This may not be associated only with the fact that
the Gikomba cluster has the weakest infrastructural conditions. Another important factor is
that the Gikomba cluster is a neighbour to another cluster of informal sector firms
manufacturing the Kenyan machines in Nairobi. Thus, there appears to be a relatively strong
forward linkage between the fabricators of the Kenyan machines and the furniture making
firms in the Gikomba cluster compared to the linkage between the firms in the other clusters
and the machine fabricators.
8.1.3 Penetration of the four types of machines by sources (technology types)
Figure 8.4 presents the numbers of the four different types of machines from China,
advanced countries and Kenya that were studied during the second round of the interviews
with the firms. These numbers were presented in Chapter 6, but they have been reproduced
in this chapter because they indicate the relative extent of adoption of each type of machines
within a particular technology type. Although the firms were purposively selected, the
selection and particularly the number selected for each category was also largely influenced
by the availability of the machines in the workshops of the firms. For example, among the
Chinese machines, the planer is the commonest in the furniture industry in Kenya and all

222
those I saw were of similar design: The only difference a casual observer will notice has to
do with the differences in brand names, of which the most popular are LIDA and AICO. The
other types of machines from China (lathe, band saw and particularly saw bench) were rare
to find as the numbers in Figure 8.4 show. In fact, the figure does not present any saw bench
from China because I did not find one in any of the workshops I visited (including those of the
informal sector firms) throughout the seven months of fieldwork.
Figure 8.4: Penetration (n) by each type of machines for the three sources
Source: Field data, 2012/2013
Kenyan planers were relatively hard to find. I chanced on only two during my fieldwork, of
which one is pictured in Figure 6.1 and was found in the workshop of an informal sector
operator while the other was found going through refurbishment in the workshop of a
repairer. The respondents, especially those in Kibuye cluster, indicated that the Kenyan
planers were once common in their workshops. However, with the advent of the cheap
Chinese planer, the operators started moving away from the Kenyan planers to those from
China mainly because Chinese planers offer higher precision and flexibility than the Kenyan
planers. One of the respondents reported:
20
1
3
1
13
7
8
9
9
7
4
0 5 10 15 20 25
Planer
Bandsaw
Circular saw
Lathe
No. of machines
Adv. Kenya China
223
… it [Chinese planer] is cheap, machines from England are too expensive and the jua kali planing machine does not work very better. Because the table for surface planing it is zigzag [not smooth] so when you are planing it does not give smooth surface, a perfect finish and they have not assembled it in good order and it makes a lot of noise because it is not heavy. (Field interview, 2013)
An anecdote from another person in the same cluster is very informative:
… there was a time that the planing machine, the band saw and the lathe machine we had here were all jua kali made machines. Then something changed; we started seeing these advanced ones from China and people started changing. You know our customers, when you work with the advanced machines, the finish is very better than the jua kali ones. So customers started rejecting the jua kali so people started rushing for the advanced planing machine from China. But [for] the lathe and this band saw, the ones from jua kali are still ok and that is why they are still around… (Field interview, 2013)
Thus, the other machines from Kenya such as the band saw and lathe are quite popular, as
shown in Figure 8.4. In addition, a few of the formal sector firms have invested in one or two
of these Kenyan machines (Figure 8.2).
8.2 Firm and operator characteristics’ influence on choice/adoption
The section presents the statistical and econometric analysis of the influence of the firm and
operator characteristics on the firm’s adoption decisions concerning the technologies. The
subsection also quantitatively tests for the complementarity between the adoption of Chinese
machine and Kenyan machines, which was highlighted in Section 6.3.2 of Chapter 6 and
alluded to in Section 8.1 of this chapter, as well as that between the advanced country
technology and the others.
8.2.1 The regression models
Investing in technologies (machines) from any of the three sources generally involves a two-
stage decision making process where the firm is confronted with a set of choices at each
stage. In the first stage, the firms decide on whether to invest in machines. Those that
choose to invest in machines then decide on whether to buy machines from a particular
source or type of technology. Thus, investing in Chinese technology for example generally
involves two stages of decision making as described in Figure 8.5.

224
Figure 8.5: Nature of dependent variables
The two stages correspond to two questions the firms were asked during the first round of
the survey, which is used in the regression analysis in this section. They were initially asked
to indicate whether they have invested in machines. The outcomes can be diagrammatically
represented (as Figure 8.5 shows) as INV and NINV which respectively represent the
situations where the firm has undertaken such investment and where the firms has not
embarked on such investment. Those who have invested in machines were then asked
whether they have invested in Chinese technology or not with the outcomes represented in
the figure as CM if the firm has undertaken such investment and NCM if it has not invested in
Chinese machines. These two decision making process also generally characterise
investment in other technologies. The analysis takes account of each technology type (i.e.
the source) but not the machine types. In other words, no distinction (for example) is made
between investment in Chinese planer and investment in Chinese band saw.
Based on the above description of the sequence of decision making, the firm’s adoption of
technologies from any of the three sources can be examined in a sequential logit model. Also
referred to as sequential response model, continuation ratio logit, model for nested
dichotomies or Mare model (Buis, 2011), sequential logit involves estimating a separate
logistic regression for each stage of the decision making. The stages are sometimes referred
to as transitions since only a proportion of the sample at the previous stage moves to the
HM
INV
NINV
CM
NCM

225
ensuing stage. In this study, only those who have chosen to invest in machines move to the
next stage of deciding whether to invest in a technology from a particular source, say China.
As shown in Figure 8.5, each of the stages involves dichotomous or binary outcomes, of
which “success” (i.e. adoption) and “failure” (i.e. non adoption) are respectively ascribed a
value of one and a value of zero, and serve as the dependent variables in the various
regressions. Hence, for this study they produce the following logit regression models where
the outcome depends on a set of independent variables:
𝒑𝟏 =𝐞𝐱 𝐩(𝑿𝜷𝟏 + 𝜺𝟏)
𝟏 + 𝐞𝐱 𝐩(𝑿𝜷𝟏 + 𝜺𝟏) (1)
𝒑𝟐 =𝐞𝐱𝐩 (𝑿𝜷𝟐 + 𝜺𝟐)
𝟏 + 𝐞𝐱𝐩 (𝑿𝜷𝟐 + 𝜺𝟐) (𝟐)
𝒑𝟑 =𝐞𝐱𝐩 (𝑿𝜷𝟑 + 𝜺𝟑)
𝟏 + 𝐞𝐱𝐩 (𝑿𝜷𝟑 + 𝜺𝟑) (𝟑)
Equation 1 corresponds to the first stage for which a firm chooses to invest in machines while
equation 2 also corresponds to the first stage but for the situation where the firm chooses not
to invest in machines. Equation 3 represents the second stage where a firm that has chosen
to invest in machines decides to invest in machines from a given source, say China. The
number subscripts represent the different equations. β and X respectively represent the
matrices for the coefficients and independent variables. P is the matrix of probability of
success such that an element of P1 in equation 1 is the probability that a firm chooses to
invest in machines, an element of P2 is the probability that a firm chooses not to invest in
machines and an element of P3 is probability that a firm which has invested in machines
chooses to invest in machines from a particular source, say China machine. ε in each of the
equations is a matrix of error terms for each of the equations.
The sequential logit regression assumes that the characteristics of alternatives at the second
stage of the choice process do not affect the outcome at the first stage (Ophem and Schram,
1997; Nagakura and Kobayashi; 2009). According to Ophem and Schram (ibid), this
assumption is realistic if the effort (by the firms) to find out about the differences in the
226
alternatives at the second stage is costly or when choice at the first stage “touches other
issues than the choice [at the second stage]” (1997 p 134).
Equations 1 to 3 model the adoption of a technology as a function of the characteristics of
the firms and their operators only, which means that the matrix X contains only variables
measuring the characteristics of the firms and their operators. Thus, the characteristics of the
technologies or alternatives (including the transfers mode) in the choice set do not enter the
regression equations. This is because some of the characteristics such as acquisition and
maintenance costs are only observed after the firm has chosen to invest in a machine from a
particular source. Moreover, the characteristics of the machines or factors specific to a
technology type do not seem to vary across respondents. As alluded to in Chapter 6, quality
(flexibility and precision) and durability of machines from a particular source found in the
furniture industry generally do not vary across firms. Similarly, purchasing cost cannot vary if
the market functions well, and in fact I observed only slight variations of the prices of a
machine from a particular source across the sales and distribution firms. Consequently, it is
assumed in this study that the effects of the characteristics of the technologies on an
individual’s choice do not deviate substantially from the average for the sample or population.
Hence, rather than being used as independent determinants of the alternatives as in the
case of nested logit models (Greene, 2003), the characteristics of the alternatives are
regarded as purely intrinsic determinants of the alternatives in the models.
However, the weakness of the model is that the effect of unobserved heterogeneity resulting
from variables that may influence the choice but are not included in the model cannot be
accounted for (Cameron and Heckman, 1998). In this regard, it should be mentioned that
many variables, which may influence the choice do not enter the regression analysis
because of two reasons. First, data were not collected on some of the variables because
they were difficult to measure (e.g. firm level profit and financial performance in the informal
sector). Second and more importantly, the sample size (131) for the regression and
particularly for the second stage (80) is not large enough to accommodate a large number of
regressors (independent variables), even if all the data were available. The minimum sample

227
size for logit regression should satisfy the condition that the sample size divided by the
number of parameters (β) to be estimated should not be less than 10 (Hosmer and
Lemeshow, 2000). This means that the second stage regression cannot take more than eight
regressors. The consequence is that some of the variables for which data is available
(including possible interactions between some of them) will also not enter the regression
equations.
The impact of the above problem is that it becomes difficult to derive causal relationships
between the dependent variables and the regressors used in the analysis. The relationships
derived from the analysis should be observed as correlations and any causality implied in the
interpretations of the regression results is assumed. However, the advantage of the
regression analysis over simple correlation analysis is that it helps control for some of the
extraneous variables that may confound the correlation between the variables.
The independent variables used for the various regression models are measured as
described in turns as follows:
a. Log36 of firm age: Firm age is a continuous variable, which means it takes metric
values instead of discrete values. All the regression models use the logs of the firms’
ages. This variable is represented in the tables of the results as Agelog.
b. Log of firm age squared: Shown in the results as Agelog2, this variable is included to
capture the likely nonlinear impact that experience which comes through age may
have on adoption of technology.
c. Firm size: The size of firm is measured using the total number of employees the firm
has, which was also collected as a continuous variable. The log of the variable enters
the regression models and it is represented as firmsize.
d. Firm’s access to finance: Firm’s access to credit, which is represented in the tables of
the results as Acc_Fin enters the regression equations as an index of six variables.
That is, six questions measuring access to finance were combined to form a single
36
This transformation does not change the extent of variation in the variable and its association with the
dependent variables. It is used here just to improve the appearance of graphs from the regression analysis, for example, those in Figure 8.6 particularly with regards to the scale of the x-axis.

228
index measuring access to finance. The index is the First Principal Component, which
is a linear combination of weighted values of the six variables, derived using Principal
Component Analysis (PCA). The list of the six variables has been provided in the
annex to this chapter, which also provides a detailed discussion on the PCA concept.
e. City: The city (Nairobi or Kisumu) in which the firms operate enters the models as a
dummy variable with a value of one if the firm operates in Kisumu; otherwise zero. It
shows up in the tables of results as Kisumu.
f. Log of operator’s age: Also a continuous variable, the log of the age of the operators
are used in the regression models and it is represented in the tables of results as
log_dage.
g. Sex of operator/director: Represented in results by female, sex also enters the
regression models as a dummy variable with a value of one when the operator is a
female, otherwise zero.
h. Education of operator: This variable is represented in the table of the results by
above_basic_sch and enters the regression models as a dummy variable with a value
of one when the operator has more than primary (or basic) education, otherwise zero.
i. Marketing and administrative orientation of operator: Whether the operator has a
business card or not is used as a proxy measure for the marketing and administrative
orientation of the operator/director. Represented in the tables of results as
No_bus_card, it is also a dummy variable which takes a value of one if the operator
does not have a business card and zero if otherwise.
j. Ownership structure: This is a discrete variable which enters the regression models
with a value of one if the firm is a sole proprietorship, otherwise zero and it is
represented in the results as Sole.
An additional qualification regarding the model is worth mentioning, and that is, the
categorisation of firms into formal and informal sectors does not enter any of the regression
equations. The reason is that that variable perfectly predicts the probability of a formal sector
firm having invested in machines and advanced country machines; thus, it assumes the

229
answer which I would like to test. It is also highly correlated with other explanatory variables
particularly firmsize (Table 8.6 in the annex). Indicators for the clusters and registration
status of the firms also do not enter the equations because they are also highly correlated
with No_bus_card and/or firmsize. This is done mainly to reduce the impact of
multicollinearity of the regressors while there is an added advantage of helping to meet the
minimum sample size requirement for the logit regression.
8.2.2 Estimation method and results
The parameters (β) of the regression equations are estimated using the maximum likelihood
method. Table 8.3 in the annex to this chapter shows the regression results. Results on two
variants of the regression models for having invested in machines and for having invested in
a machine from a particular source (China, Kenya and advanced countries) are presented.
Each equation is first estimated with only the log of the firm’s age and its square, and in the
second case, the other independent variables are included in each of the models. In order to
satisfy the minimum sample-size requirement for logit regression, eight regressors are used
in the regression at the second transition since the number of firms that passed from the first
transition to the second transition is 80 as shown in Table 8.3. The eight regressors used
represent the combination out of the ten that generally produces the best fit for the models
based on Aikaike Information Criterion (AIC) and Bayesian Information Criterion (BIC). AIC
and BIC favour the regression model/result with the lowest AIC and BIC values. With the
sample size of 131 at the first transition, all the 10 variables listed above are included in the
regression for this transition without compromising the minimum sample-size requirement.
Robust standard errors based on the sandwich estimator of variance (StataCorp, 2009) are
obtained for all the regression results reported in Table 8.3 in the annex. Below are the
interpretations/ discussions of the results.
Firm age
From Table 8.3 in the annex to this chapter, the influence of firm’s age in all the models with
only the log of firm’s age and its square generally do not differ from those with all of the other

230
independent variables. The table shows that the both Agelog and its square (Agelog2) are
not statistically significant for a firm having investment in machines (columns 1 and 2) but are
significant for the investment in machines from China (columns 3 and 4), investment in
Kenyan machines (columns 5 and 6) and investment in advanced country machines
(columns 7 and 8). This result suggests that age may not have much influence on a firm’s
decision to invest in machines but it is important for the choice between the various sources
for those firms that have invested in machines. A plausible explanation for why age does not
significantly affect the decision to invest in machines can be found in the total integration of
machining work by the formal sector firms and the relatively high degree of outsourcing and
specialisation in machining work in the informal sector clusters. No matter how young a
formal sector firm may be, it has to invest in machines in order not to outsource machining
work. For the informal sector firms, however, a relatively old firm may choose not to invest in
machines but depend on other firms that supply machining services.
Except for investment in machines, the results also indicate that the age of the firm has
statistically significant and quadratic relationship with the probability that a firm that has
invested in machines will invest in machines from China, Kenya and advanced countries. For
investment in Chinese machines, with Agelog having a positive sign and its square being
negative implies that the probability of investing in Chinese machines on average increases
with age up to a given point (about 4.5 years) and falls thereafter as shown in Panel B of
Figure 8.637. Similarly and as shown in Panel C of Figure 8.6, the probability of investing in
Kenyan machines on average increases with age up to about seven years after which it
begins to decline. Contrarily, as Panel D of Figure 8.6 portrays, the probability of investing in
advanced country machines initially falls with age and start rising after the firm is about five
years old, at around the same age at which the probability for investing in Chinese machines
starts to fall.
37
Each panel in Figure 8.5 plots the predicted probability from the regression analysis against the log of the firms’ age. Taking antilog of the log of firm’s age at the optimum of each quadratic produces the actual age of the firm at the various optima. The log of the firm’s ages at the respective optima are obtained by taking the first differential of equation 3 with respect to agelog (i.e. the slope of the function with respect to agelog), setting the resultant equation to zero and solving for agelog in the resultant equation.
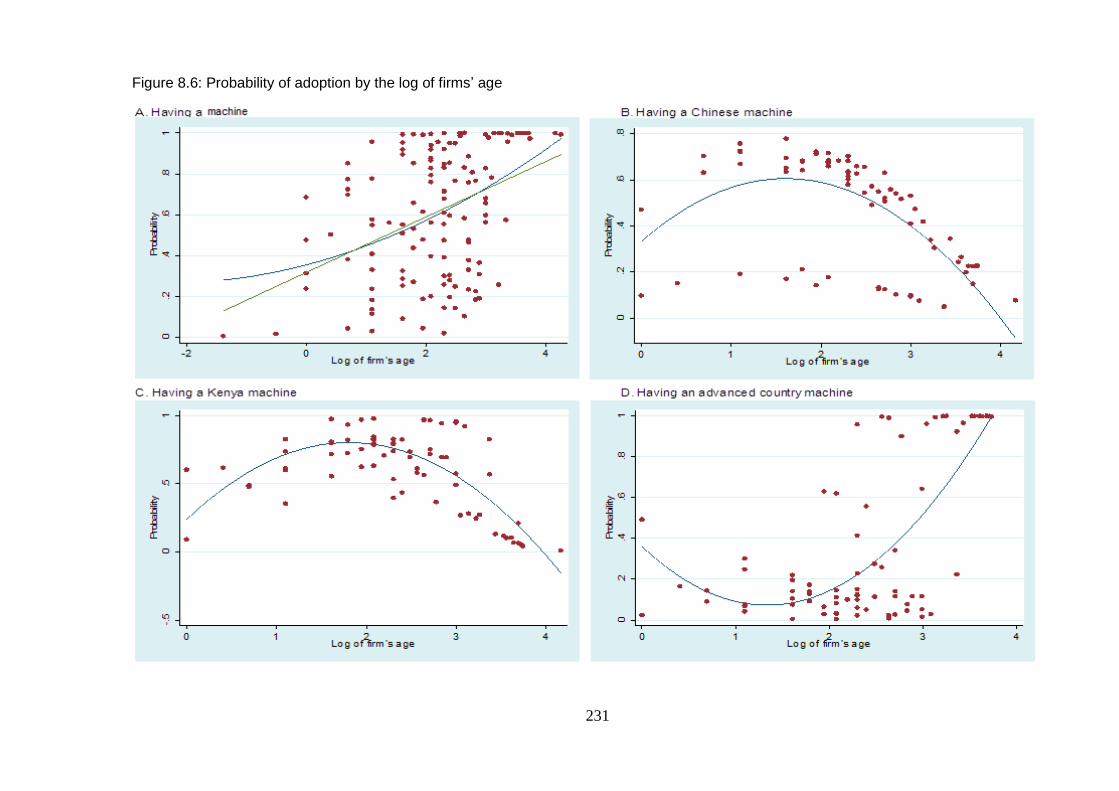
231
Figure 8.6: Probability of adoption by the log of firms’ age
232
The above findings have three important implications concerning the role the Chinese and
Kenyan technologies play in the furniture making industry. First, the similar effects of age on
the probabilities of investing in the Chinese and Kenyan machines may suggest that
generally the technologies from China and Kenya play similar roles and tend to complement
each other as discussed earlier in this chapter. (Further discussion on this complementarity
is provided in section 8.2.3).
Second, the role of these two technologies in the industry has been to lessen the entry
barrier for new entrepreneurs wanting to enter into the furniture making industry or to
enhance the degree of automation in the production processes of the firms particularly the
informal sector firms. Many of such new operators especially those starting businesses in the
informal sector are likely to be relatively poor and may not be able to afford the advanced
country machines. As noted in Chapter 6, the informal sector firms invest in China and Kenya
machines because of their low acquisition cost but with the wish to later diversify away from
these machines to those from Europe. Additional information from the second round of
interviews, specifically, a formal sector operator who employs about 90 workers adds more
weight to this argument: “I started more or less as jua kali and I had only jua kali machines.
But as the work progressed I was able to buy second hand machines from Europe. Now I
have only two jua kali machines at my workshop” (Field interviews, 2012).
Third, the optimum age for the Kenyan machines is higher than that for the Chinese
machines. This may be the result of the fact that Kenyan machines tend to last longer than
the Chinese machines as noted in Chapter 6. It however also implies that the Chinese
technology tend to serve as an entry mode to a greater extent than the Kenyan machines.
City (Kisumu)
This variable is statistically significant for investment in machines and negatively associated
with the probability of a firm investing in machines. The variable is also significant in results
for investment in machines from China and Kenya. It shows up with a positive sign in the
233
results for machines from China but a negative sign for machines from Kenya. This means
that being in Kisumu is associated with a higher probability of investing in Chinese machines
but with a lower probability of investing in Kenyan machines compared to the firms in Nairobi.
As suggested earlier in section 8.1.3, firms in the Kibuye cluster seem to have embraced the
Chinese technology more than those in Nairobi while those in Nairobi especially Gikomba
cluster seem to still have relatively high confidence in the Kenyan machines. Unsurprisingly
and as I pointed out earlier in Chapter 4 and in this chapter, I found many fabricators of the
Kenyan machines in a close vicinity to the Gikomba furniture cluster while it was relatively
more difficult to find any in Kibuye.
Firm size
Firm size is statistically significant for the decision to invest in machines but insignificant for
the decision to invest in the technologies from a particular source. It has a positive sign in the
results for investing in machines suggesting that as the size of the firm (in terms of the
number of employees) increases the probability of investing in machines also increase.
However, firm size is not significantly associated with the probability of investing in a
machine from any of the three sources.
Access to finance
As mentioned in Chapter 7, bank loans (and loans from microfinance companies in the case
of the informal sector firms) are not a popular means of financing machine acquisition.
Rather, the firms tend to depend on internally generated funds. However, it should be noted
that a positive relationship with financial institutions such as having a bank account and
receiving short-term loans can make some important difference. The results show that
access to finance (Acc-Fin) is statistically significant in the model for investment in machines
but not for all the others. The coefficient in the results for investment in machines has a
positive sign, which means that firms with high access to finance, as measured by Acc-Fin,
have high probability of investing in machines. The intuitive explanation is that having a bank
account for example may help a firm to save more, thus, with an account a firm may be able

234
to accumulate savings faster to invest in machines. It may also simply reflect the fact that
firms with bank accounts tend to have greater financial resources.
For firms deciding to invest in machines from a particular source, such relationship with
financial institutions does not significantly influence the decision. This result appears
counterintuitive and may have resulted from the fact that the measure for access to finance
did not capture how much a firm is able to leverage from external sources. I must confess
that I did not collect any data (including proxies) on the amount of loans the firms had taken
from financial institutions in any given period. However, to the extent that firms do not
depend much on external financing for acquiring machines suggests that the result would not
change much even if the access to finance index or variable captured information about the
volume of funds the firms are able leverage from financial institutions. Rather, what could
make a major difference would be if the financial institutions could lend to the firms including
the informal sector ones at a lower interest cost and with more flexible repayment terms than
what they currently offer. Under such circumstances and assuming the influence of all other
factors are muted, one could expect that the firms including those in the informal sector will
invest more in advanced country machines, compared to the others.
Ownership structure
Ownership structure (Sole) is only statistically significant in the results for Kenya machines
and advanced country machines. This means that being a sole proprietorship rather than a
partnership or family-owned business is not significantly associated with the decision to
invest in machines and also the decision to invest in Chinese machines. However, it is
significantly associated with a higher probability of investing in Kenya machines and a lower
probability of investing in advanced country machines. This finding is intuitively intelligible:
Kenyan machines are very cheap, thus, an individual can more easily organise financial
resources to purchase them while advanced country machines are very expensive, and
hence, pooling resources from different individuals who may be relatives makes it easy to
undertake such investment. Moreover, given that all the sole proprietorships are informal
235
sector firms and constitute about 85% of the informal sector firms (see Table 5.3 in Chapter
5), the results confirm the fact that the advanced country machines are relatively less
attractive to the informal sector firms. This is not only because advanced country machines
are relatively expensive but also important is the weak infrastructural condition in the various
clusters particularly the Gikomba cluster. In other words, I least expect a typical informal
sector firm particularly those in Gikomba to mount an advanced country machine in fire-
prone, flood-prone and theft-prone environment even if the firm could afford such investment.
Operator’s marketing and administrative orientation
As noted earlier in this Chapter, No_bus_card, which stands for an operator not having a
business card is used to proxy the operator’s marketing and administrative orientation. It has
a positive coefficient and statistically significant result for investment in machines indicating
that not having a business card increases the probability of investing in machines. This result
appears counterintuitive and should be interpreted with care, as one would expect that not
having a business card should be negatively associated with the probability of investing in
machines. However, what it means is that there are a lot of informal sector firms whose
operators have business cards but have not invested in machines as well as those whose
operators have invested machines but have no business cards. The result is also plausible
given that the dependent variable does not take into account the number of machines a firm
has got especially considering the fact that a lot of the informal sector firms have invested in
either one or two machines while all the formal sector firms have many machines.
For those firms that have invested in machines, not having a business card is significantly
and positively related with the probability of investing in Kenya machines while it is
significantly associated with a lower probability of investing in Chinese machines. Although
not significant, it also reduces the probability of investing in advanced country machines.
What this may suggest is that operators with relatively “modernised” marketing and
administrative orientation prefer investing in Chinese and probably advanced country
machines to investing in Kenyan machines. Generally, such operators may serve relatively

236
high income segments of the market which require high degree of precision, and of which the
Kenyan machines may not be able to achieve.
Operator’s level of education
Director’s educational level (that is, having more than basic education) is not statistically
significant in any of the results, indicating that the educational level of an operator does not
significantly influence the decision to invest in machines and also machines from any of the
three sources.
Operator’s age and sex
The age and gender of the operator appear only in the regression model for investing in
machines because the sample sizes for the others are relatively small with limited degrees of
freedom. Age has a positive coefficient and it is significantly associated with the decision to
invest in machines. Thus, older entrepreneurs tend to have investment in machines more
than their younger counterparts. This result may be explained in the sense that older
operators might have accumulated savings if they have been in their current business for a
long time or from their previous vocation, which could be used for investing in machines.
Moreover, older people generally tend to have better access to family resources or
inheritance and wider social networks, all of which can be used to mobilise resource for
investment in machines. The results however show that being a female operator has no
significant relationship with whether a firm will invest in machines or not.
8.2.3 Bivariate/multivariate probit models for testing complementarity
In order to quantitatively test the complementarity between investment in Chinese machines
and Kenyan machines, the regression equations for the second transition of the choice
process depicted in Figure 8.5 is reestimated for having a Chinese machine and having a
Kenyan machine but in a bivariate/multivariate probit model. The bivariate model starts with
the idea that the error terms in the regression equations for two dichotomous variables (for
example, in this case of this thesis, having a Chinese machine and having a Kenya machine)
237
are correlated (Greene, 2012). Hence, under normality assumption, the two variables are
simultaneously modelled (Maddala, 1983). Since we have a third dichotomous dependent
variable (i.e. having an advanced country machine), a generalised form of the bivariate
model, that is, the multivariate probit model38 is also applicable or may be more appropriate. I
therefore reestimate the regression equations for the second transition using both bivariate
probit models (results are reported in Table 8.4) and multivariate probit models (results
reported in Table 8.5). For the bivariate models, the equations are estimated using the
maximum likelihood technique while a simulated likelihood method is used for the
multivariate model and robust standard errors are obtained for both results in a way similar to
the previous regressions.
Several methods such as simple Chi-square test and simple (product moment) correlation
analysis can be used to examine this relationship. What makes the bivariate/multivariate
probit models most attractive for this study is that they allow for the calculation of tetrachoric
correlation coefficient, examining its significance and making the tetrachoric correlation
coeficient conditional on a set of independent variables that may confound the relationship
between the two variables (Greene, Undated; Greene, 2012). The tetrachoric correlation
coefficient is the correlation coefficient for two binary variables calculated as if the variables
involved were continuous variables, based on the idea that the values of both variables are
respectively determined by latent continuous variables (Uebersax, 2006). A significant
positive coefficient suggests that investment in the Chinese machines and Kenyan machines
are complementary and statistically significant.
The above test is also a test for exogeneity of all the dependent variables, thus, serving as
robustness check on the logit models. Thus, although complementarity between investment
in Chinese and Kenyan machines is of the most concern in this section, I use the same
approach to diagnose the exogeneity and the extent of substitutability (negative
complementarity) between investment in Kenyan machines and advanced country machines
and then between advanced country machines and Chinese machines.
38
For further insight, see Greene (2012) and Cappellari and Jenkins (2003)
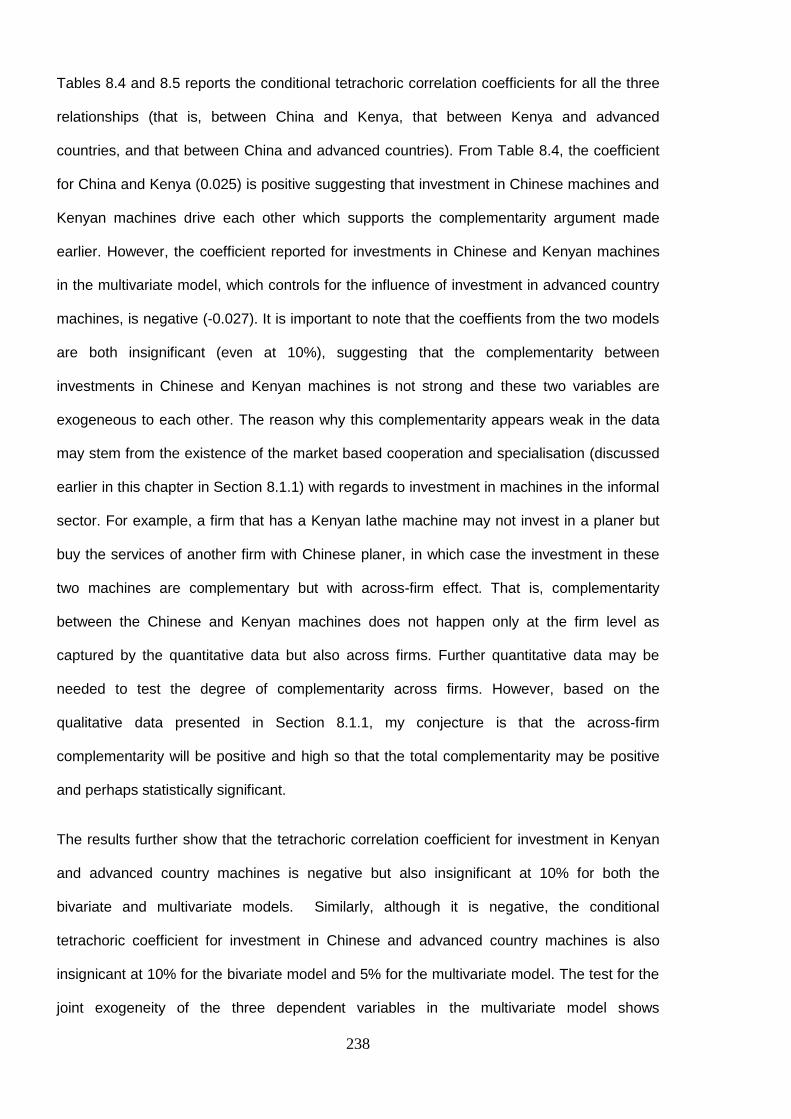
238
Tables 8.4 and 8.5 reports the conditional tetrachoric correlation coefficients for all the three
relationships (that is, between China and Kenya, that between Kenya and advanced
countries, and that between China and advanced countries). From Table 8.4, the coefficient
for China and Kenya (0.025) is positive suggesting that investment in Chinese machines and
Kenyan machines drive each other which supports the complementarity argument made
earlier. However, the coefficient reported for investments in Chinese and Kenyan machines
in the multivariate model, which controls for the influence of investment in advanced country
machines, is negative (-0.027). It is important to note that the coeffients from the two models
are both insignificant (even at 10%), suggesting that the complementarity between
investments in Chinese and Kenyan machines is not strong and these two variables are
exogeneous to each other. The reason why this complementarity appears weak in the data
may stem from the existence of the market based cooperation and specialisation (discussed
earlier in this chapter in Section 8.1.1) with regards to investment in machines in the informal
sector. For example, a firm that has a Kenyan lathe machine may not invest in a planer but
buy the services of another firm with Chinese planer, in which case the investment in these
two machines are complementary but with across-firm effect. That is, complementarity
between the Chinese and Kenyan machines does not happen only at the firm level as
captured by the quantitative data but also across firms. Further quantitative data may be
needed to test the degree of complementarity across firms. However, based on the
qualitative data presented in Section 8.1.1, my conjecture is that the across-firm
complementarity will be positive and high so that the total complementarity may be positive
and perhaps statistically significant.
The results further show that the tetrachoric correlation coefficient for investment in Kenyan
and advanced country machines is negative but also insignificant at 10% for both the
bivariate and multivariate models. Similarly, although it is negative, the conditional
tetrachoric coefficient for investment in Chinese and advanced country machines is also
insignicant at 10% for the bivariate model and 5% for the multivariate model. The test for the
joint exogeneity of the three dependent variables in the multivariate model shows
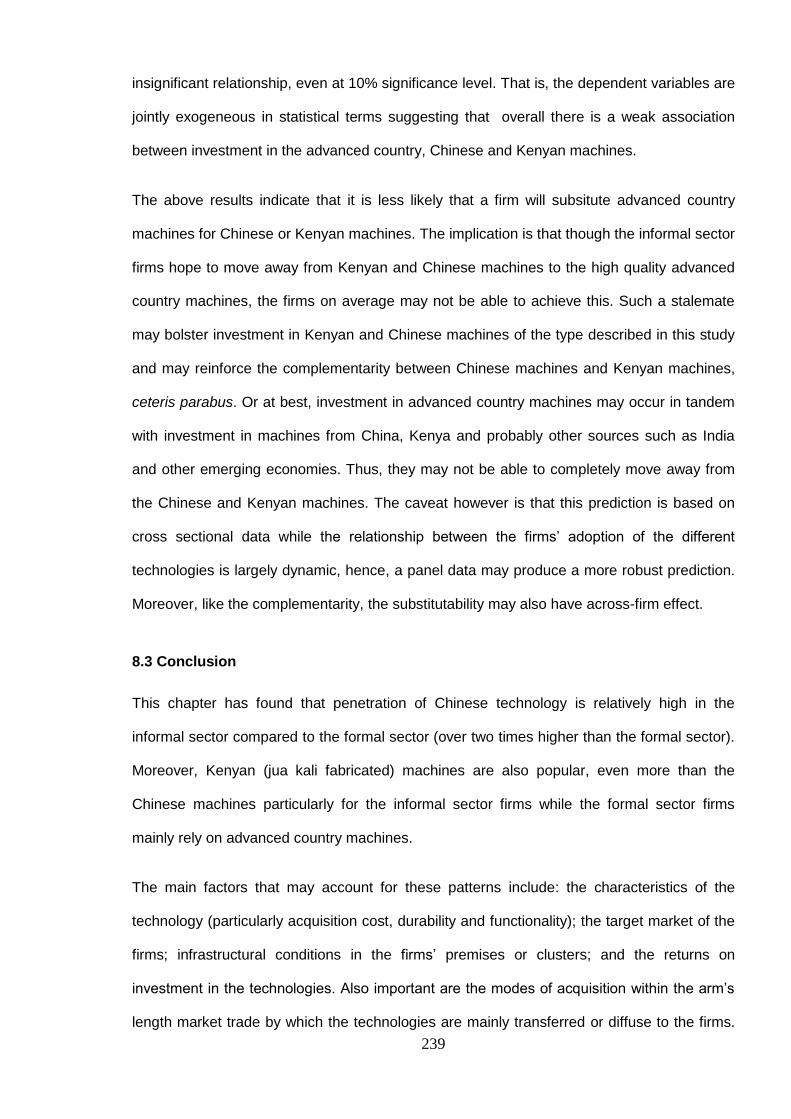
239
insignificant relationship, even at 10% significance level. That is, the dependent variables are
jointly exogeneous in statistical terms suggesting that overall there is a weak association
between investment in the advanced country, Chinese and Kenyan machines.
The above results indicate that it is less likely that a firm will subsitute advanced country
machines for Chinese or Kenyan machines. The implication is that though the informal sector
firms hope to move away from Kenyan and Chinese machines to the high quality advanced
country machines, the firms on average may not be able to achieve this. Such a stalemate
may bolster investment in Kenyan and Chinese machines of the type described in this study
and may reinforce the complementarity between Chinese machines and Kenyan machines,
ceteris parabus. Or at best, investment in advanced country machines may occur in tandem
with investment in machines from China, Kenya and probably other sources such as India
and other emerging economies. Thus, they may not be able to completely move away from
the Chinese and Kenyan machines. The caveat however is that this prediction is based on
cross sectional data while the relationship between the firms’ adoption of the different
technologies is largely dynamic, hence, a panel data may produce a more robust prediction.
Moreover, like the complementarity, the substitutability may also have across-firm effect.
8.3 Conclusion
This chapter has found that penetration of Chinese technology is relatively high in the
informal sector compared to the formal sector (over two times higher than the formal sector).
Moreover, Kenyan (jua kali fabricated) machines are also popular, even more than the
Chinese machines particularly for the informal sector firms while the formal sector firms
mainly rely on advanced country machines.
The main factors that may account for these patterns include: the characteristics of the
technology (particularly acquisition cost, durability and functionality); the target market of the
firms; infrastructural conditions in the firms’ premises or clusters; and the returns on
investment in the technologies. Also important are the modes of acquisition within the arm’s
length market trade by which the technologies are mainly transferred or diffuse to the firms.

240
Moreover, the firm and operator characteristics such as the age of the firm, access to
finance, and ownership structure are important. Particularly, the age of the firms has been
found to exhibit a nonlinear effect on the adoption of technologies from the three sources.
Increases in a firm’s age initially increases the probability of investing in Chinese and Kenyan
machines but the probabilities decrease after a given age (4.5 years for Chinese machines
and 7 years for Kenyan machines). The reverse relationship is true for advanced country
machines, of which the optimum occurs at age 5. The major implication is that Chinese and
Kenyan technologies have improved new firms’ access to machines, particularly those in the
informal sector, reducing entry barrier into furniture making industry while enhancing
automation in the industry. The effect is more crucial for poor entrepreneurs who want to
avoid looking for non-existing wage employment in the formal sector. Also worth noting is the
potential complementarity between the adoption of machines from China and Kenya in
removing the entry barrier..
The next chapter concludes the thesis by providing an overall summary of the findings and
an examination of the implications of the findings in the light of the development imperatives
of Kenya while highlighting the implications for policy, the literature and further research.

241
Annex to Chapter 8: PCA and regression results
8A Measuring access to finance using principal component analysis
Principal component analysis (PCA) is a nonparametric statistical tool, which can be used to
create an index to represent an unobservable variable (a variable that is not directly
measurable) from a set of observed variables (Shlens, 2009; Wall, 2006; Cahill and
Sanchez, 2001; Ram, 1982). It is therefore a good tool that can be used to measure firm’s
access to finance, which is also not directly measured or observed. To do this, the firms
were asked to answer six questions, of which each gives some indication about the firms’
level of access to finance from financial institutions including micro finance institutions. The
questions were as follows:
a. Does your firm have a bank account or save with a micro finance institution?
b. How many of such accounts does your firm have?
c. Have you applied for any loan for your business in the last two years?
d. Have you received any loan for your business from a bank or micro finance institution
in the last two years?
e. How many times in the last two years have you received such loans?
f. On a scale of 1-7 (where 1 means no access to finance and 7 means very high
access to finance), how do you rate your access to finance?
PCA works with the principle that the unobserved variable, also called the latent variable, is
correlated with a set of directly measured variables (in this study the variables measured
using the above six questions) by examining the correlations between these observed
variables (Cahill and Sanchez, 2001). The procedure reduces the information in the many
variables by decomposing the variance in the data into factors or components. Each
component is the sum of each of the observed variables multiplied by its weight, which is the
proportion of the variance in the data accounted for by each of the observed variables. One
of the components is usually chosen to be the index measuring the observed variables
based on the criteria that the chosen component should have the highest eigenvalue or
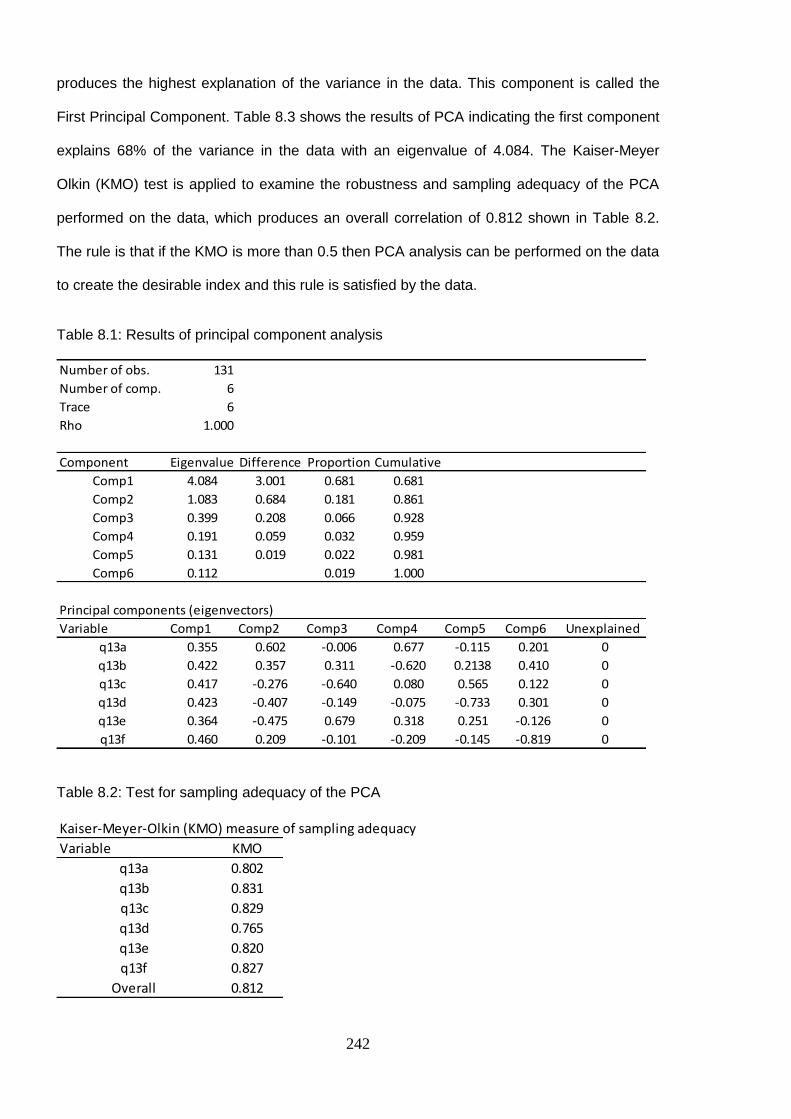
242
produces the highest explanation of the variance in the data. This component is called the
First Principal Component. Table 8.3 shows the results of PCA indicating the first component
explains 68% of the variance in the data with an eigenvalue of 4.084. The Kaiser-Meyer
Olkin (KMO) test is applied to examine the robustness and sampling adequacy of the PCA
performed on the data, which produces an overall correlation of 0.812 shown in Table 8.2.
The rule is that if the KMO is more than 0.5 then PCA analysis can be performed on the data
to create the desirable index and this rule is satisfied by the data.
Table 8.1: Results of principal component analysis
Table 8.2: Test for sampling adequacy of the PCA
Number of obs. 131
Number of comp. 6
Trace 6
Rho 1.000
Component Eigenvalue Difference Proportion Cumulative
Comp1 4.084 3.001 0.681 0.681
Comp2 1.083 0.684 0.181 0.861
Comp3 0.399 0.208 0.066 0.928
Comp4 0.191 0.059 0.032 0.959
Comp5 0.131 0.019 0.022 0.981
Comp6 0.112 0.019 1.000
Principal components (eigenvectors)
Variable Comp1 Comp2 Comp3 Comp4 Comp5 Comp6 Unexplained
q13a 0.355 0.602 -0.006 0.677 -0.115 0.201 0
q13b 0.422 0.357 0.311 -0.620 0.2138 0.410 0
q13c 0.417 -0.276 -0.640 0.080 0.565 0.122 0
q13d 0.423 -0.407 -0.149 -0.075 -0.733 0.301 0
q13e 0.364 -0.475 0.679 0.318 0.251 -0.126 0
q13f 0.460 0.209 -0.101 -0.209 -0.145 -0.819 0
Kaiser-Meyer-Olkin (KMO) measure of sampling adequacy
Variable KMO
q13a 0.802
q13b 0.831
q13c 0.829
q13d 0.765
q13e 0.820
q13f 0.827
Overall 0.812
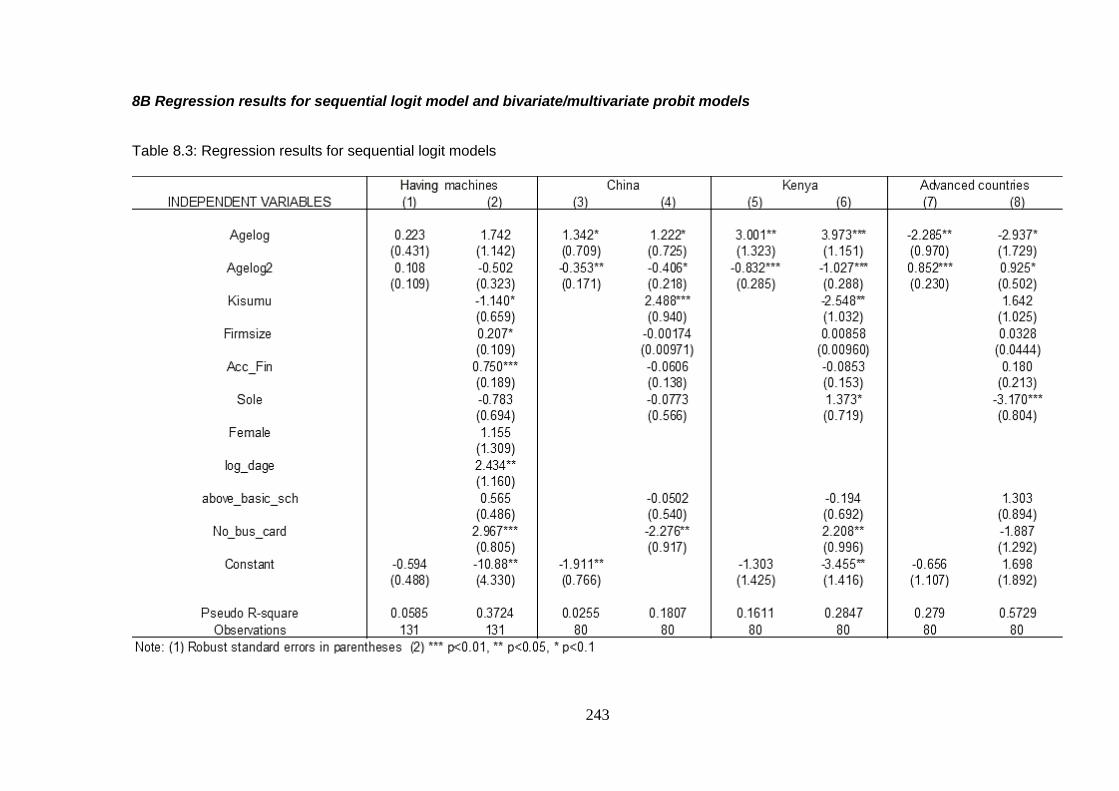
243
8B Regression results for sequential logit model and bivariate/multivariate probit models
Table 8.3: Regression results for sequential logit models

244
Table 8.4: Results of bivariate probit models and tetrachoric (rho) correlation
China Kenya China Kenya China
Adv.
Countries China
Adv.
Countries Kenya
Adv.
Countries Kenya
Adv.
Countries
Agelog 0.924 1.782** 0.708 2.411*** 0.927* -1.409** 0.700 -1.800 1.780*** -1.477** 2.401*** -1.707*
(0.562) (0.699) (0.444) (0.672) (0.555) (0.617) (0.437) (1.101) (0.673) (0.623) (0.660) (1.031)
Agelog2 -0.293** -0.501*** -0.233* -0.628*** -0.294** 0.518*** -0.231* 0.573* -0.500*** 0.540*** -0.625*** 0.535*
(0.128) (0.152) (0.129) (0.166) (0.128) (0.141) (0.128) (0.299) (0.148) (0.146) (0.164) (0.277)
Kisumu 1.462*** -1.521*** 1.445*** 0.924 -1.533*** 0.970*
(0.526) (0.552) (0.528) (0.566) (0.558) (0.565)
Firmsize -0.00187 0.00509 -0.00190 0.0169 0.00504 0.0158
(0.00558) (0.00579) (0.00565) (0.0253) (0.00576) (0.0228)
Acc_Fin -0.0311 -0.0514 -0.0303 0.0940 -0.0514 0.0958
(0.0808) (0.0920) (0.0802) (0.0919) (0.0924) (0.0932)
Sole -0.0490 0.808* -0.0462 -1.842*** 0.807* -1.821***
(0.344) (0.413) (0.339) (0.463) (0.414) (0.462)
above_basic_sch -0.0100 -0.0914 -0.00525 0.784* -0.0875 0.782*
(0.324) (0.391) (0.321) (0.421) (0.390) (0.437)
No_bus_card -1.309*** 1.311** -1.289** -1.098* 1.319** -1.167*
(0.500) (0.515) (0.502) (0.641) (0.525) (0.653)
Constant -0.435 -0.729 -2.073*** -0.433 -0.317 1.030 -0.730 -0.279 -2.062*** 1.002
(0.612) (0.759) (0.804) (0.599) (0.691) (1.207) (0.718) (0.687) (0.793) (1.130)
rho
LR test [Chi2(1)] for rho
P-value for Chi2
Observations 80 80 80 80 80 80 80 80 80 80 80 80
INDEPENDENT VARIABLES
-0.4278474
4.10598
0.0427
-0.1806312
0.428391
0.5128
-0.0113023
0.002936
0.9568
-0.2062326
0.637676
0.4246
(5) (6)
Note: (1) Robust standard errors in parentheses (2) *** p<0.01, ** p<0.05, * p<0.1
Kenya and Adv. Countries
-0.1262214
0.422161
0.5159
0.0254766
0.014605
0.9038
China and Kenya
(1) (2)
China and Adv. countries
(3) (4)

245
Table 8.5: Multivariate probit regression results and tetrachoric (rho) correlation
China Kenya Adv.Countries
(1) (2) (3)
Agelog 0.689 2.363*** -1.984**
(0.434) (0.586) (1.004)Agelog2 -0.230* -0.618*** 0.628**
(0.128) (0.151) (0.277)
Kisumu 1.394*** -1.569*** 0.964*
(0.518) (0.557) (0.508)Firmsize -0.002 0.005 0.012
(0.006) (0.006) (0.014)
Acc_Fin -0.032 -0.056 0.205
(0.083) (0.091) (0.136)Sole -0.045 0.808* -1.940***
(0.340) (0.413) (0.478)
above_basic_sch 0.004 -0.054 0.668*
(0.321) (0.383) (0.363)No_bus_card -1.262** 1.333** -1.166*
(0.489) (0.520) (0.623)
Constant -2.019*** 1.369
(0.728) (1.111)Observations 80 80 80
rho21_China&Kenya -0.027
(0.180)rho31_China&Adv -0.355*
(0.192)
rho32_Kenya&Adv -0.409
(0.299)
Chi2 3.637
P-value 0.303
INDEPENDENTVARIABLES
LRTest(Ho:rho21=rho31=rho32=0)
Note:(1)Robuststandarderrorinparentheses(2)***p<0.01,**p<0.05and*p<0.1

246
8C. Correlation analysis for checking multicollinearity between independent variables
Table 8.6: Correlation between independent variables
Agelog Kisumu Firmsize Acc_Fin Sole Female log_dage above_basic_schNo_bus_cardinformality RegistrationNgong Gikomba Kibuye
Agelog 1
Kisumu -0.039 1
Firmsize 0.418 -0.214 1
Acc_Fin 0.235 -0.157 0.502 1
Sole -0.274 0.052 -0.497 -0.185 1
Female -0.210 0.019 -0.006 -0.105 0.074 1
log_dage 0.529 -0.137 0.456 0.213 -0.316 0.073 1
above_basi
c_sch -0.001 -0.232 0.262 0.313 -0.074 0.047 0.152 1
No_bus_car
d -0.044 0.661 -0.333 -0.293 0.106 -0.003 -0.262 -0.261 1
informality 0.502 -0.246 0.758 0.411 -0.677 -0.007 0.561 0.246 -0.373 1
Registration 0.357 -0.316 0.513 0.426 -0.418 -0.014 0.447 0.225 -0.493 0.629 1
Ngong -0.336 -0.478 -0.214 -0.014 0.379 0.012 -0.159 0.103 -0.692 -0.350 0.047 1
Gikomba 0.003 -0.282 -0.190 -0.185 0.089 -0.029 -0.163 -0.098 0.475 -0.206 -0.286 -0.400 1
Kibuye -0.039 1.000 -0.214 -0.157 0.052 0.019 -0.137 -0.232 0.661 -0.246 -0.316 -0.478 -0.282 1
247
CHAPTER 9 : CONCLUSION
9.0 Introduction
This chapter concludes all the discussions in this thesis. It first presents a summary of all the
discussions in the previous chapters after which the optimality of choice in favour of any of
the technologies studied in this research are discussed in the light of Kenya’s development
imperatives. The chapter also discusses the policy implications of the findings. Moreover, the
implications of the findings for the literature in the subject area of the thesis are also
discussed. Lastly, the author’s reflections on the whole research process are outlined
including ideas for further research.
9.1 Summary
Chapter 1 noted that China has emerged as the leading source of the importation of capital
goods into Kenya and Sub Saharan Africa as a whole, which before the noughties depended
largely on advanced economies for capital goods. Thus, there is a disruption of the pattern of
technology transfer to Sub Saharan Africa including Kenya. A significant aspect of this
disruption is that capital goods are being developed within a developing country (China) and
for other developing countries. This disruption is however only one aspect of the diverse and
global, economic and geopolitical implications of China’s phenomenal rise in economic
power. It was further noted that while research into several aspects of the implications of
China’s rise are no longer trailblazing, very little is known about the impact of the transfer of
technologies, and in particular capital goods, from China to other developing countries.
Filling such a research gap is very critical for industrial and development policy in developing
countries, particularly against the backdrop that a section of the literature emphasises the
inappropriateness of technologies from advanced countries for operating conditions in
developing countries. The literature argues that advanced country technologies are
inappropriate for developing countries because they target high income consumers, are
highly capital and skill intensive offering limited opportunities for employment and are for

248
realising scale economies with great reliance on sophisticated infrastructure. Hence, they are
less amenable for promoting poverty reduction and equitable distribution of income. At the
same time, the theory of induced technical change asserts that demand, factor endowment,
path dependence and other socioeconomic factors influence the direction of technical
change. The implication is that technologies produced in different contexts may possess
different characteristics and their application may lead to different development trajectories.
Given this background, the key issue that motivated this research was whether the impact of
Chinese technology on development in other developing countries would differ from that of
the advanced country technologies. In order to explore this issue, three main research
questions were posed in Chapter 1, and for the sake of empirical tractability, the furniture-
manufacturing industry in Kenya was strategically chosen to find answers to the research
questions, which were:
1. How distinctive are Chinese technologies used in Kenya’s furniture making industry
with respect to their technical and economic/social characteristics?
2. How are the Chinese technologies transferred from China to the Kenyan firms
compared to the advanced country technologies?
3. To what extent have the firms adopted the Chinese technologies, compared to those
from advanced countries and Kenya and what factors influence the adoption?
Having narrowed the scope of the study to Kenya, Chapter 2 sought to provide an overview
of Kenya’s development situation. The overview depicted the recent development state of
Kenya while highlighting the historical antecedents. It was noted in the chapter that Kenya is
a low income economy whose per capita GDP has stagnated over most of the years of
political independence, negatively affecting socioeconomic conditions in the country. High
levels of unemployment particularly among the youth, poverty and inequality have become
attendant features of the economy. The informal sector of the economy is very large
accounting for about 80.5% of employment in Kenya. Infrastructure especially power supply
is poorly developed. At the same time, indigenous technology and innovative capacity is
generally low leading to high dependence on imported technology. The chapter further

249
alluded to the fact that the undesirable state of affairs cannot be disassociated from the
general lack of robust political institutions that are responsible for policy configuration, thus,
affecting the socioeconomic development of the country.
Chapter 3 reviewed literature related to the subject matter of the three research questions. It
was shown in the chapter that technology has been variously defined in the literature and
that various authors have used the term to refer to different but related concepts in time.
Generally, the term can stand for an artefact (or collection of artefacts), techniques (or
process), organisation and even network forms between organisations.
The rest of the discussion in the Chapter 3 centred around three main themes: technology
choice; sources of technical change, under which biases in technical change and the theory
of induced innovations were discussed; and technology transfer. The review on technology
choice highlighted the neoclassical framework for technology choice and its shortcomings,
which gave impetus to the evolution of appropriate technology as a development paradigm.
The basic conclusion from the neo classical framework is that with a given production
function, relative factor price solely determines technology choice such that capital-endowed
countries will select capital-intensive techniques while labour-endowed countries will select
labour- intensive techniques. The literature review however showed that while relative factor
price is an important determinant of technology choice, there are other important factors such
as scale, income levels, characteristic of the decision maker, the type of products/services to
be produced, access to finance, and imperfect product and factor markets. These other
factors are important because they can significantly alter the choice based just on the relative
factor price. Thus, the choice determined in the neoclassical framework can be inappropriate
in the presence of efficient and appropriate ones.
Chapter 3 also showed that path dependence in technical change and differences in market
demand and relative factor prices across different countries can explain the existence of
inappropriate technologies. These factors can produce bias in technical change with the
implication that technologies produced in a given socioeconomic context may be

250
inappropriate for a different socioeconomic context. The same factors underpin the theory of
induced innovation/technical change. This theory suggests that technical change does not
only result from independent activities that take place in the arms of science but market
demand, relative factor prices and the path-dependent nature of technical change are more
important.
The literature review also highlighted the different channels by which technology can be
transferred. The major channels identified in the literature were arm’s length trade, direct
investment and governed network structures that characterise value chains. It was also
noted the factors that influence the choice of a transfer mode include the characteristics of
the technology being transferred, and the characteristics of the transferor and transferee and
the socioeconomic and political conditions of their countries.
Based on the literature reviewed in Chapter 3, Chapter 4 presented a conceptual framework
that guided the analyses of the empirical data. The meaning of technology in the framework
was restricted to artefacts, that is, machines and equipment. A salient aspect of the
framework also worth reiterating here is that the factors, which influence technology choice,
can also determine the choice of a transfer mode. Moreover, the choice of technology can
influence the choice of the transfer mode whereas the availability or accessibility of a
particular mode can also influence technology choice.
Chapter 4 also dealt with the research method/approach adopted for the study. The mixed
research methods approach, which combines elements of both quantitative and qualitative
research methods, was used. The approach for answering each research question however
differed with regards to the degree of reliance on quantitative and qualitative data. The
approach for the third question was largely quantitative compared to the approach for the first
question and more so when compared to the approach for the second question, which was
qualitative to a great extent. The data collection was done in two rounds: The first largely
involved collecting quantitative data using a questionnaire from 131 firms operating in four
clusters in Nairobi and Kisumu. The clusters were Industrial Area, Ngong’, Gikomba and
251
Kibuye. The second involved collecting largely qualitative data about the technologies and
their transfer modes from 41 firms who were purposively selected from those interviewed in
the first round. Four main types of woodworking machines were considered in the second
round of the interviews, that is, the planer, band saw, saw bench and lathe. Other
respondents who were also interviewed included sales and distribution firms of the
technologies and fabricators of the Kenyan machines who also repair the other machines.
Chapters 5 to 8 presented information based on the analyses of the field data. However,
unlike Chapters 6 to 8, the analysis in Chapter 5 did not directly answer any of the three
research questions. The chapter examined in detail the entrepreneurial and business profile
of the firms interviewed which involved exploring the characteristics of the firms and their
operators and the clusters in which they operate. Among the many factors considered were
business registration and tax obligation status of the firms, the age of the firms, ownership
structure, products and target markets, linkages with other firms, employment, and housing
and infrastructural conditions in the clusters. The chapter also discussed the characteristics
of the operators such as the age, sex, education and the ethnic background of the operators.
An important conclusion from Chapter 5 was that the Industrial Area firms are distinctive from
the others and could be described as formal sector firms while the degree of informality is
high for firms in the other clusters especially the Gikomba and Kibuye clusters. However, the
Ngong’ cluster tends to exhibit (though to a limited extent) some of the characteristics of the
formal sector firms especially with respect to middle income consumer’s patronage for their
products and education level of the operators. However, the firms in the Ngong’ cluster are
more similar to those in Gikomba and Kibuye clusters than they are to the formal sector firms
(Industrial Area firms). Hence, the discussions in Chapters 6 to 8 largely used a
categorisation of the firms in which the Industrial Area firms and the remaining three clusters
(Ngong’, Gikomba and Kibuye) were respectively considered as formal and informal sectors.
It was however noted in Chapter 5 that the difference between the Ngong’ cluster and the
other two informal sector clusters lend credence to the belief in the literature that informality
252
is a continuum with varying degrees among firms, highlighting the heterogeneous nature of
firms operating in informal sector. It was emphasised that such heterogeneity can occur
among firms in the same line of activity as in the case of the furniture-manufacturing firms
studied in this research. The subsections that follow summarise the main findings of the
research for each of the three basic research questions.
Research question 1
The information presented in Chapter 6 and parts of Chapter 7 sought to provide the answer
to research question 1, which is about the distinctiveness of Chinese technologies in terms of
the technical and economic/ social characteristics. Chapter 6 compared the Chinese
machines to the advanced country and Kenyan machines on durability, quality (defined in
terms of precision and flexibility of functions), run and robustness, scale, acquisition and
maintenance costs, and skill requirements. It was shown that with regards to durability, run
and robustness, the Chinese machines found in Kenya’s furniture making industry lag behind
the advanced country machines. However, they are better than the Kenyan machines in the
area of precision and flexibility of the functions while the Kenyan machines last longer than
the Chinese machines.
Chapter 6 also showed that the scale of the Chinese machines found in Kenya’s furniture-
making industry is lower than the other two especially against the advanced country
machines. In order to take advantage over their precision and flexibility, the Chinese
machines particularly the planers have been locally modified by some of the informal sector
operators. The modification involves changing essential parts especially the motor, which is
done at an additional cost to the cost of acquiring the machine. Such modification improves
the run and output level but not up to those of the advanced country machines. The Chinese
machines also break down more regularly; however, the maintenance cost in addition to the
modification costs still do not make the Chinese machines financially less attractive than the
advanced country machines for the informal sector firms. The reason is that the Chinese
machines are far cheaper than the advanced country machines, which is still true even when
we control for the longer lifespan of the advanced country machines: The annual capital

253
consumption per worker for the advanced country planer, for example, is about three times
and five times those of the Chinese and Kenyan planers respectively. Thus, the Chinese
machines on the other hand are more expensive than the Kenyan machines. However, the
relatively higher precision and flexibility of the Chinese machines make them (especially the
planer) attract the informal sector firms while the advanced country machines are generally
unaffordable for the informal sector firms.
Chapter 7 presented analyses of the production coefficients for the different technologies.
Using the planer for illustration, the chapter also estimated the likely returns on investment in
these technology types. It was found that the Chinese machines (both original and modified)
may be inefficient compared to the advanced country and Kenyan machines if the machines
operate at rated capacity utilisation. Similarly, the analysis on benefit-cost ratio (BCR) – an
indicator of returns – showed that the relative returns on investment in the advanced country
machines and Kenyan machines are likely to be better than the Chinese machines at rated
capacity levels for both formal and informal sector firms.
However, it was noted in Chapter 7 that actual daily production rate is usually lower than the
rated capacity levels; hence, the production coefficients and return on investment indicators
were accordingly re-estimated for actual daily production rate. At this capacity utilisation, it
was found that the Chinese technology is likely to be as efficient as the advanced country
while the Kenyan machines still appears to be more efficient than the Chinese machines.
The BCRs at this production level showed that only the Kenyan and the modified Chinese
machines are likely to be profitable in the informal sector, justifying the need for the
modification. For the formal sector, however, all investments including the advanced country
machines are viable although the modified Chinese planer may yield higher returns
compared to the others. Given that the formal sector firms are much larger than their informal
sector counterparts, these results highlight the importance of scale considerations in a
technology choice. That is, in small markets and for small manufacturing establishments, the
advanced country technologies appear less attractive than in the formal sector or larger
markets. The relatively high profitability of investments in the formal sector also reinforces
254
the need for formalising the informal sector to the best degree possible. However, these
conclusions should be treated with caution given that the indicators were developed with
some restrictive assumptions (as was laid out in the annex to Chapter 7) because of the lack
of adequate empirical data.
Another important finding from Chapter 7 was that the Kenyan technology does not only
seem to offer relatively high efficiency and return but it is the most labour intensive, followed
by the Chinese machines. The apparent superiority of the Kenyan machines over the others
should however be hedged against the fact that they produce lower quality output than the
other machines while quality difference between the Chinese and advanced country
machines are very minimal, as Chapter 6 showed. Chapter 6 also showed that though the
advanced country machines are slightly more complicated to use and repair, the skill
intensity of the three technologies generally do not differ much. Moreover, skills are available
locally for where the little differences appear to exist.
Research question 2
Research question 2 focuses on the modes by which the technologies are transferred to the
firms. A section of the analyses in Chapter 7 sought to address this research question. Of the
modes of transfer identified in the literature (arm’s length trade, FDI, joint venture and
governed GVC network structures), it was found in Chapter 7 that arm’s length trade is the
main channel by which the three technologies reach the firms. This is a truism for the
informal sector firms because they lack the capacity to engage in any other transfer method.
For instance, no foreign direct investment could possibly go to the informal sector and they
also do not participate in global value chain of furniture manufacturing. Similarly, the formal
sector firms do not have any meaningful participation in global value chain for furniture and
only one of the 20 formal firms interviewed in the first round of the survey can be classified
as foreign direct investment.
It was however found that the mode of acquisition within the arm’s length trade differs across
the three technology types and between the informal and formal sectors. The firms acquire

255
the Chinese machines from sales and distribution firms in the domestic market while for
advanced country machines the formal sector firms may purchase them directly from foreign
markets. For second-hand advanced country machines, however, the firms buy some locally,
which is the only way by which an informal sector firm can purchase second-hand machines
from advanced countries. Obviously, the transfer processes for Chinese and advanced
country machines involve importation. For Chinese machines, the domestic sales and
distribution firms do the importation, while for advanced country machines, the formal sector
firms also buy directly from foreign markets especially in the case of brand new machines.
For Kenyan machines, the firms purchase them directly from the local fabricators.
It was also found that a closely related issue to the mode of acquisition is the financing
options and payment terms available to the firms. While the firms including those in the
formal sector mainly rely on internal funds, the payment terms available for acquiring
machines differ slightly between Kenyan machines and the imported machines. Purchasing a
Chinese or an advanced country machine mainly involves making outright payment of the
total cost of the machine. However, Kenyan machines can be purchased through a flexible
payment system where the firms are allowed to make a deposit and then pay the remaining
balance in instalments over a short period of time, usually in three months. This flexible
payment system makes the Kenyan machines attractive to informal sector firms.
Research questions 3
Chapter 8 was dedicated to finding the answer to research question three. The analysis in
the chapter showed that the penetration of the Chinese technology is relatively high in the
informal sector compared to the formal sector (over two times higher than the formal sector).
Moreover, Kenyan machines are also popular, even more than the Chinese machines
particularly in the informal sector while the formal sector firms mainly rely on advanced
country machines. The main factors that may account for this pattern of adoption include the
characteristics of the technology (particularly acquisition cost, durability and functionality), the
target market of the firms, housing and infrastructural conditions in the clusters.

256
Chapter 8 further showed that differences in the firms’ characteristics, especially with respect
to ownership structure, access to finance (of which additional and qualitative evidence was
presented in Chapter 7) and the age of the firms also have important implications for
adopting a technology from a particular source. An interesting finding was that the age of the
firms is nonlinearly related to the adoption of technologies from the three sources. An
increase in a firm’s age is initially positively associated with the probability of investing in
Chinese and Kenyan machines, but the probabilities start to decrease after a given age (4.5
years for Chinese machines and 7 years for Kenyan machines). Conversely, the probability
of investing in advanced country machines decreases with the age of the firm up to age 5
before it increases with the firm’s age. The major implication is that Chinese and Kenyan
technologies have improved the firms’ access to automated machines or reduced entry
barrier into the furniture making industry particularly for the informal sector firms. Many of the
informal sector firms especially new ones cannot afford the advanced country machines. The
study also found that investment in Chinese and Kenyan machines appear to be
complementary particularly among the informal sector firms. The complementarity is not
confined to the investment decisions of a firm but also across firms in the informal sector
operating within a cluster. The complementarity suggests that, to some degree, these two
technologies depend on each other in enhancing access to automation in the furniture
making industry in Kenya.
9.2 Optimality of technology choice and policy implications
9.2.1 Optimality of technology choice and Kenya’s development imperatives
The aim of this section is to examine the main findings of the study in the light of Kenya’s
development ills, thus, highlighting the extent to which each technology type may be
appropriate for alleviating the development problems. The different technologies offer some
advantages but with varying implications for desirable development outcomes needed for
Kenya especially in the wake of high unemployment particularly among the youth, high
inequality and extreme poverty. As was mentioned in Chapter 2, about 43% of Kenya’s
257
population still live on less than US $1.25 per day, with the Gini coefficient (an income
inequality indicator) for Kenya being as high as 0.48. Chapter 2 further showed that the
official unemployment rate is 12.7%, which shoots up to 40% when discouraged workers are
considered as part of the unemployed, with the youth constituting 64% of the unemployed.
Of the three technologies studied in this research, the one that will create more employment
would be suitable for Kenya given the high unemployment level, all things being equal. As
noted in the above summary of findings, the Kenyan (locally/jua kali fabricated) machines
tend to have the lowest capital-labour ratio, which suggests that the use of Kenyan machines
should create the highest employment opportunities compared to the Chinese machines and
the advanced country machines. The use of the Kenyan machines in the furniture industry
also creates backward linkages with or demand for the informal sector firms fabricating these
machines, which also represents an opportunity for employment creation and capacity
building in that sector.
However, the story is more complex than this especially considering the fact that the Kenyan
machines have the least precision and flexibility of functions. This disadvantage means that
using the Kenyan machines will limit the aesthetic quality of the furniture produced in Kenya,
which may shift domestic demand away from locally produced furniture to imported furniture
and limit the exportability of the furniture manufactured in Kenya. This will also negatively
affect the businesses operating in the furniture industry. As noted in Chapter 2, importation of
Chinese furniture into Kenya soared recently in response to a shift in domestic demand
towards Chinese furniture because of their high aesthetic quality. Thus, a complete reliance
on Kenyan machines may not deliver the likely employment creation especially when Kenya
is less inclined to adopt industrial protective measures in an era of a global move towards
free trade.
While the advanced country machines can produce high quality products in terms of
aesthetics, they are expensive and tend to create excess capacity raising production cost.
Moreover, the transfer process of the advanced country machines provide limited trading and
258
distribution linkages in Kenya as the firms which mostly use the advanced country machines
tend source them abroad without going through local market traders. For Chinese machines,
however, the transfer process involves elaborate sales and distribution networks in Kenya,
which represents a source of employment and wealth creation. Moreover, as noted earlier in
the summary of findings, the Chinese machines are much less expensive and more labour
intensive than the advanced country machines. They also have better precision and flexibility
of functions than the Kenyan machines. Hence, using Chinese machines may enhance the
aesthetic quality of products compared to Kenyan machines and make the domestic
manufacturing firms remain or become more competitive. Their competiveness is critical for
employment and wealth creation in Kenya.
The employment creation benefits of the Chinese machines cannot be overemphasised
particularly with respect to the youth who have grabbed opportunities in the informal sector to
develop and exploit their entrepreneurial abilities. There is an improved access of young
artisans or entrepreneurs to automation as a result of the availability of relatively cheap
Chinese machines, which offer higher precision and flexibility in terms of functions than the
locally fabricated (Kenyan) machines. This can be seen in the fact that Chapter 5 showed
that about 42% of the entrepreneurs in the informal sector who were involved in this study
were below 35 years of age compared to none for the formal sector firms.
The story about optimality has additional complexities. Over reliance on Chinese machines
may also leave domestic capabilities needed for building improved versions of the Kenyan
machines underdeveloped. The long-term benefits of developing such capabilities may be
substantial for both employment creation and industrial development of Kenya especially if
the fabrication is improved to the extent that the precision and flexibility of those machines
are comparable to those from China and advanced countries. This will create forward
linkages with the wholesale and retail sector in Kenya while delivering the required capital
inputs needed for making the furniture manufacturing firms competitive on the local markets
and enhancing their export potential. Such potential benefits emphasise the importance of
the complementarity between the use of Chinese and Kenyan machines (which was

259
discussed in Chapter 8), of which some evidence were identified in the empirical data
particularly the qualitative data used for this research.
The implications of the findings on employment are similar to those for inequality and poverty
reduction. The advent of the Chinese technology has paved the way for poor entrepreneurs
to start their own businesses with a relatively high degree of automation they would not be
able to afford if the only available technology were the advanced country technology. Thus,
the poor entrepreneur is being offered the opportunity to take part in financing economic
growth process, job and wealth creation through the availability and use of the Chinese
technology. It should be noted that this poverty reduction impact of the Chinese technology
also generally characterises the use of Kenyan machines.
The poverty reduction implications together with the employment creation effect highlight the
fact that the Chinese and Kenyan machines represent an inclusive innovation. The reason is
that they allow relatively poor people access to automation helping them participate
meaningfully in economic growth and development while creating employment particularly for
the youth, of whom most are not able to find jobs in the corporate and government sectors.
Another important dimension of the findings with regards to inclusion is worth-noting. That is,
the formal manufacturing sector of Kenya’s economy is dominated by Kenyan Indians while
indigenous Kenyans dominate the ownership of businesses in the informal sector, as was
evidenced in Chapter 5. Chapter 2 showed that this situation has roots in colonisation in
Kenya where Africans in Kenya were barred from agricultural plantation and commerce. The
relatively high access of the informal sector firms to automation, made possible by the advent
of Chinese and Kenyan technological innovations presents an opportunity for including more
indigenous Kenyans in wealth and employment creation in the manufacturing sector.
The findings also point to the fact that the choice of Chinese and Kenyan machines over
advanced country machines may produce greater socioeconomic benefits within the informal
sector than the formal sector. These categories of firms generally serve demand from
different segments of the domestic market. As Chapter 5 showed, while the informal sector

260
generally serves relatively poor households and the furniture needs of micro and small
enterprises, the formal sector firms target rich households, the corporate and public sectors.
Thus, the use of the Chinese and Kenyan machines is pro poor or inclusive not only in terms
of production but also in terms of producing goods to meet the consumption needs of the
poor. It should be noted however that serving the consumption needs of a few consumers
who tend to place more emphasis on quality, differentiation and timely delivery of products
may require the formal sector firms to rely mostly on advanced country technology even
when they are relatively less efficient in the combination of labour and capital in the context
of small markets in developing countries.
9.2.2 Policy implications
The forgoing discussions lead to the conclusion that Chinese technological innovations are
more amenable for inclusive development and poverty reduction strategies in Kenya than
those from advanced countries. The availability of such innovations in China (most likely for
many years) may be part of the reasons why, as was indicated in Chapter 1, China has lifted
a significant number of her people from poverty while absolute poverty cases for the rest of
the world have increased over the last decade. Via increasing trade (specifically, arm’s
length trade) between China and most other developing countries including Kenya, these
inclusive innovations are being increasingly made available to the rest of the world’s poor
which were hitherto excluded from much of production and consumption. The exclusion can
be associated with the predominance of advanced country technologies in developing
countries. As Chapters 6 and 7 showed, the advanced country technologies are relatively
large scale in nature requiring high sunk cost for investment amid restricted financing options
or underdeveloped financial markets, hence, restricting availability and viability to formal
production sectors that target high income consumers.
It must be emphasised that the opportunity for the poor and the excluded to participate in the
growth process represents an approach which distributes income in a more equitable and
justifiable way, compared to other social protection measures which pay little or no attention

261
to who generates economic growth but seeks to redistribute incomes and improve access to
social services through taxation and government transfers. This is especially true in a context
like Kenya where corruption, tribalism, and patron-clientele relationship compromise the
efficiency of the public service system in delivering public goods and social safety nets for
the poor and the excluded. Moreover, social protection via government transfers may only
create limited and unsustainable opportunities for upward mobility on the income ladder for
the poor since increases in real benefits over time can be rare and it also depends a lot on
the government’s commitment in the long term. The limitations of the latter approach
underpin the importance of the need to support the former, especially in the face of growing
inequality and absolute poverty in Kenya, as discussed in Chapter 2.
Support from various actors particularly government that will enhance the penetration and
use of the Chinese machines along with the Kenyan machines especially in the informal
sector will yield major social and economic benefits for Kenya, and for that matter,
developing countries in sub Saharan Africa. Any support should tackle the main problems
that inhibit the diffusion of the technologies or prevent the technology or capital goods market
in Kenya from functioning properly. This study shows (in Chapter 7) that one of the major
reasons why some of the informal sector firms have no investment in machines including the
relatively cheaper ones from China and Kenya is the lack of access to finance. Generally, the
firms in the informal sector are not able to meet the loan application requirements of the
formal financial sector, particularly commercial banks. Loans from microfinance companies
which have lower requirements also have high interest cost and limited or no grace period for
repayment. The formal sector firms also complain about high interest cost of borrowing from
the commercial banks.
Additionally, policy interventions that will support the provision of flexible payment
arrangement, where the firms especially those in the informal sector can acquire the
technologies on hire purchases can enhance the diffusion of the inclusive technologies.
262
Another reason why the technology market in Kenya appears to fail is the limited availability
of machines parts needed for maintenance and repair. As indicated in Chapter 6, while
usable parts of both China and advanced country machines are relatively easy to find on the
Kenyan market, their machine parts are difficult to find. Particularly for the informal sector,
this problem causes the firms to prefer the Kenyan machines to the Chinese machines.
Hence, policy interventions that will lead to an increase in the availability of machine parts for
the Chinese technology will enhance its adoption/diffusion.
Another factor that influences the diffusion of the machines especially in the informal sector
is related to the limited demand for their products. As Chapter 8 showed, some of informal
sector firms find investment in machines economically unviable because of the excess
capacity it may create; hence, they depend on others for machining services. For constraints
associated with limited market size, Kenyan government’s recent directive to public sector
offices to channel all public sector procurement of furniture to local manufacturers including
those operating in the informal sector is worthwhile and more policy interventions of that
nature should be encouraged.
Particularly for the formal sector, other important reasons why the inclusive technologies
from China and Kenya are unattractive are the limited durability and robustness of the
Chinese machines and the poor functionality of the Kenyan machines. This means that
attention should be given to how to enhance the durability, robustness and functionality of
the inclusive technological innovations, without significantly compromising their affordability.
Although imperfect market information is one of the major reasons for market failure, it does
not appear to be a factor affecting the diffusion of the technologies. Knowledge about the
relative availability of Chinese machines and imported items from China on the Kenyan
market is extensive. The lower quality or the cheapness of the Chinese machines is also a
commonplace.
Finally, it is also important to note that industrial policies for developing countries aimed at
reducing unemployment and poverty, and enhancing local technological capabilities should

263
take into consideration the critical issue of technology choice. Thus, unlike what happened
during Kenya’s import substitution regime, technology choice should take centre stage of
industrial and development policies. The policies should have a focus on technologies that
will mainstream the production and consumption needs of those at the lower part of the
income pyramid. Given the development objectives, the policies should recognise the various
constraints that can affect the social optimality of technology choice such as the lack of well-
functioning financial markets, limited local technological capabilities, limited domestic market
size, infrastructural deficits, the heterogeneity of firms particularly between the formal and
informal sectors as well as the factor endowments of the country concerned.
9.3 Contribution to the literature
The rise of China to economic and global influence has had many socioeconomic
implications for the world but particularly for developing countries and especially for sub
Saharan African economies. From trade to foreign direct investment and migration to
development finance, Chinese presence in these developing countries is much felt to the
extent that China has become a major player or an alternative economic cooperation partner
for these developing countries. In response, many attempts have been made at studying the
effects of China’s rise with literature around trade, FDI and migration particularly empirical
work becoming abundant.
Nevertheless, not much attention has been given to the impact of the transfer of technologies
including capital goods from China to other developing countries in spite of the fact that
China’s technological capability building has been phenomenal, particularly in the last three
decades. Against this background, this research aimed to contribute to filling the gap in the
literature, of which the findings significantly attest to the realisation of this aim. It has become
obvious from the thesis that Chinese capital goods have different but more desirable impact
in terms of inclusive industrial development of SSA economies than the capital goods from
advanced countries. Thus, this thesis represents a significant contribution to the literature
264
given that little was known about the potential impact of Chinese capital goods on SSA
economies and developing countries more generally.
Moreover, the findings of the study have important implications for theory especially those
that underpinned the conceptual framework, which guided the research. The study has
provided empirical evidence supporting the theory of induced technical change. This theory
emphasises the importance of market demand in determining the supply of knowledge and
technology so that high income markets tend to stimulate the development of technologies
that meet the needs of the rich consumers while the reverse is true for low income markets.
The technologies from China (and also Kenya) studied in this research are relatively labour
intensive and small in scale requiring low capital investment compared to those from
advanced countries. This is consistent with the fact that China is a developing country, and
by and large, a low-income market, giving rise to the nature of demand that has stimulated
the development of such technologies. This implication stresses the idea that technical
change can exhibit biases in terms of scale and factor use. This evidence provides a strong
justification for the need to give adequate attention to technology choice and it related
concept of appropriate technology in the development literature.
Three further implications of the research for technology choice or appropriate technology
are also worth mentioning. The first is that the study brings to the fore the need for
appropriate technology as a development concept to pay more attention to finance as a
constraint to technology choice. Although the literature on appropriate technology emphasise
the need for technology choice to be economically appropriate in terms of investment cost
and scale, it does not place much emphasis on the role financial markets play. However, the
study has shown that the lack of external financing is an important reason why some of the
informal sector firms have not invested in automated machines but either rely on hand tools
and/or the services of other firms that have invested in automated machines. It is also one of
the reasons why the informal sector firms generally do not invest in advanced country
machines. Thus, the lack of external financing which is associated with the existence of poor
or underdeveloped financial markets can be an important determinant of technology choice.
265
This is consistent with argument put forward by Hicks (1969) and Bencivenga et al. (1995),
as noted in Chapter 3.
Second, the analysis of a technology’s appropriateness should encapsulate the choice or
availability of technology transfer channels, particularly for technologies being transferred
from abroad. Among the different transfer channels identified in the literature and
represented in the conceptual framework shown in Chapter 3 of this thesis, the most popular
mode used for transferring the technologies studied in this research is the arm’s length trade.
Within the arm’s length transfer mode, there are various modes of acquisition, which were
identified in Chapter 7. It has been shown that these different modes of acquisition have
different development implications, particularly with respect to employment creation as has
been discussed under section 9.2 of this chapter. Moreover, although FDI was not identified
as a major means of transfer for the technologies studied in this research, the development
implications of FDI as a channel of transfer would also be different from the arms’ length
trade especially since FDI is destined for formal production sectors. Thus, in terms of
appropriateness of technology choice, the existence or accessibility of the different channels
is also important and the literature should recognise this. It should be noted here that Stewart
(1982) mentioned the nature of communication between a country and the rest of the world
as a factor that influence technology choice, but this only represents a hint on technology
transfer channels. Stewart’s analysis also failed to highlight the taxonomy of the transfer
channels and their differing implication for technology choice and development.
Third, the appropriateness of a technology for a nation should not be viewed only from a
national or macro perspective but more importantly it should be examined in a more
disaggregated context. This is implication is derived from the finding that the advanced
country technology is economically viable in the formal sector while it was not for the informal
sector given the level of actual capacity utilisation. Moreover, the formal sector firms target
the high end of the market, whose demand may require them to adopt advanced country
technologies instead of the Chinese and Kenyan technologies. Thus, the extent to which the
advanced country technology may be inappropriate differs between formal and informal

266
sectors firms. This is very crucial especially when the dynamics within the political economy
of technology choice is considered. If such disaggregation is absent then the issue about
whose interest is paramount gains prominence in technology choice and the politics around
it. This is a critical issue for consideration given that the poor are the voiceless and it is
harder for them to have their way at the expense of the rich and powerful than ‘for a camel to
go through the eye of a needle’.
Although less related to the findings on technology choice in this study, another significant
aspect of other findings of the study is its contribution to the debate about how to adequately
define informality as a feature of a firm. This is a debate that has lingered on for about four
decades since Hart (1973) first used the term. Recent studies have indicated that the lack of
a generally accepted definition arises because firms that may be collectively described as
informal are intrinsically heterogeneous. A significant contribution of this study to this debate
lies in the empirical evidence that such heterogeneity can exist even between firms operating
in the same industry in such a way that informality should be best described as a continuum.
An important implication for any empirical work is that a firm’s informality status should be
determined on the basis of an extensive list of characteristic indicators, instead of the
recourse to a single indicator such as the business registration status of the firm. A more
interesting fact is that the analysis in Chapter 5 showed that the Ngong’ informal sector
cluster appears to be dynamic, persistent, and exhibit relatively high growth potential
compared to the other two informal sector clusters. This contradicts the
conceptual/theoretical view that represents all informal sector activities as survivalist.
9.4 Reflections and further research
A journey into the unknown is a pure adventure and only the courageous can venture and
remain on course. This is how I would describe the whole PhD research process if I were
asked to do so. I was very excited when I received my admission letter into this PhD
programme especially when the admission came with full funding. With support and
guidance from my supervisors, I was able to fine-tune my research questions and protocols

267
with relative ease. However, what was never clear to me was how to handle operational
difficulties during data collection. The key issue was about whether the needed data could be
generated to find answers to the research questions and what to do in the event that the data
could not be generated. These issues haunted me as I went to do the data collection.
Collecting the data took much longer time than expected, as many new strategies different
from what were initially thought of had to be developed to overcome various operational
challenges, which were discussed in Chapter 4. Moreover, a lot of other data which were not
in the initial plan were collected, all in an attempt to avoid leaving out anything important for
answering the research questions.
Then, the time for data analysis came. It became obvious I collected more data than I
needed. However, deciding on what to leave out was more difficult than the day to day
running around in the streets and obscure places of Nairobi and Kisumu for respondents.
Many months of mental work and inputs from my supervisors saw me through the analysis
stage and finally the writing stage. I feel a little spent but the whole process has helped to put
back in me a significant portion of what I lost growing up, that is, a good deal of my
inquisitiveness.
Though the PhD research has ended, I look around where I am on my research journey in
general and I find more reasons to continue into the unknown. It can be daunting but at the
same time it is a lot of fun! Particularly, there are several areas around the subject matter of
this thesis that I have identified through this research, which inspire my curiosity. These
areas converge around the following questions or issues:
1. How does the influx of Chinese technologies to other developing countries affect the
capabilities or potentials of these countries to produce their own technologies (that is,
indigenous technological capability building)? In the context of Kenya, the relevant
question is about the influence of technology import from China on the capabilities of
the local fabricators of Kenyan (jua kali) machines. Relatedly, other important
questions are: What is the scope of upgrading opportunities in Kenya’s jua kali capital
goods sector; and what role are the institutions (such as research institutes,
268
universities and technical colleges) in Kenya’s national innovation system playing or
can play to harness the opportunities?
2. The findings of this thesis show that the informal sector firms may have invested in
cheap Chinese technologies while they hope to switch to advanced country
technologies as their businesses develop. This suggests a dynamic relationship
between the adoption of Chinese technologies and advanced country technologies at
the firm level, which could not be fully explored using a cross sectional data collected
for this research. It will therefore be interesting to do a follow-up research at a later
date, say after five years, to explore this relationship in detail. An opportunity to
interview the firms used in this thesis for a second (and probably a third) time will
provide data to explore this dynamic relationship.
3. In addition to the dynamic relationship, it will also be interesting to find out if the major
findings of this thesis are also true for other subsectors of the manufacturing sector in
Kenya and even for broad sectors such as agriculture and industry. Moreover, cross
country comparisons for the same sector and across different sectors also arouse a
lot of interest.
4. Another area for further research is to find out whether in the context of globally
dispersing innovation capabilities, there are also prospects that some technology
niches in developing countries particularly Sub Saharan African countries may be
filled by other emerging markets such as India, Brazil and South Africa. Further
research that studies other sectors of Kenya’s economy and even other countries can
incorporate this research question.
5. The study found that GVC is not one of the channels by which the technologies
studied in this research are transferred to the furniture manufacturing firms in Kenya
because the Kenyan firms have weak linkages with foreign furniture manufacturers
and markets. Given that participation in GVC has evolved as a means by which
domestic firms can maintain their competitiveness, further research should examine

269
the challenges affecting the firms’ involvement in GVCs and come up with strategies
to deal with the challenges.
If I am to do the research for answers to the above questions, the lessons from the PhD
experience will matter a lot. The major lesson to be learnt from the PhD research is related to
the data collection, specifically the samples sizes used for the two round of data collection.
The first round, of which the data was mainly used for quantitative analyses including
regression, involved interviews with 131 firms. This number was relatively small which limited
the number of regressors that could be included the regression models. However, the
second round of data collection involved generating qualitative data from the respondents, of
which 41 were interviewed. This number was relatively large for the qualitative data that was
collected so that the data transcription and data management became very laborious.
Consequently, If I were to do everything again, I would probably increase the number of
respondents for the first round of interviews to, say, 200 but cut down the number of
respondents for the second round of interviews to, say, 25. I would make these changes
based on the assumption that the main constraints (such as limited time and funds) on the
scope of the PhD research remain unchanged. Moreover, I conducted every single interview
myself which was very exhausting. Next time, I will train research assistants to conduct some
of the interviews particularly interviews like the first round of the survey.
It is also important to note that the guidance of academic supervisors will be absent from my
next research onward. However, the PhD process has also taught me how to be an
independent researcher and I am convinced that I can undertake independent research as
well as being able to play a meaningful role in any research team.
In the meantime, let me drop my pen for a respite!
270
REFERENCES
Acemoglu, D. (2001), “Factor Prices and Technical Change: From Induced Innovations to Recent Debates”, MIT Department of Economics Working Paper No. 01-39, Massachusetts Institute of Technology.
Acemoglu, D. (2002), “Directed Technical Change”, The Review of Economic Studies, vol. 69(4) pp. 781-809.
Acemoglu, D. (2007), “Equilibrium Bias of Technology”, Econometrica, vol. 75(5) pp. 1371-1409.
Acemoglu, D. and Finkelstein, A. (2008), “Input and Technology Choices in Regulated Industries: Evidence from the Health Care Sector”, Journal of Political Economy, vol. 116 (5) pp. 837-880.
African Development Bank et al. (2011), “African Economic Outlook”, Available at: www.africaneconomicoutlook.org, Accessed on 6th March 2012
Akubue, A. (2000), “Appropriate technology for socioeconomic development in third world countries”, Available at: http://scholar.lib.vt.edu/ejournals/JOTS/Winter-Spring-2000/akabue, accessed on 7th December 2011
Al-Ghailani, H. H. and Moor, W. C. (1995), “Technology transfer to developing countries”, International Journal of Technology Management, vol. 10 (7/8) pp. 687-703.
Altman, M. (2008), “Formal-Informal Economy Linkages”, Human Sciences Research Council, Available at: via www.hsrc.ac.za/en/research-data/ktree-doc/1398, Accessed on 21st August 2012
Amsden A. H. (1989), “Asia’s Next Giant: South Korea and Late Industrialization”, New York: Oxford University Press.
Anderson E. and Gatignon, H. (1986), “Modes of Foreign Entry: A transaction cost analysis and propositions”, Journal of International Business Studies, vol. 17 (3), pp. 1-26.
Apollos, M. (2001), “Ethnicity, Violence and Democracy”, Africa Development, vol. 26 (1&2) pp. 99-144.
Ardener, S. (1964), “The Comparative Study of Rotating Credit Associations,” Journal of the Royal Anthropological Institute of Great Britain and Ireland, vol. 94(2) pp. 201-229.
Atieno, R. (2009), “Linkages, Access to Finance and the Performance of Small-Scale Enterprises in Kenya”, WIDER working Papers, No. 2009/06, UN-WIDER
Atkinson, R. (2012), “Assessing China’s Efforts to Become an Innovation Society: A Progress Report”, Testimony before the U.S.-China Economic and Security Review Commission, Available at: http://www2.itif.org/2012-assessing-china-innovation-society.pdf, Accessed on 25th March 2014

271
Atkinson, R. and Ezell, S. (2012), Innovation Economics: The Race for Global Advantage, New Haven and London: Yale University Press.
Banda, G. (2013) “Finance as a ‘forgotten technological capacity’ for promoting African local pharmaceutical manufacture”, International Journal of Technology Management and Sustainable Development, vol. 12(2) pp. 117-135
Barro, R. J. and Sala-i-Martin, X. (1995), Economic Growth, New York: McGraw-Hill, Inc.
Becker, K. F. (2004), “The Informal Sector”, SIDA Fact Finding Study, Available at: http://www.rrojasdatabank.info/sida.pdf, Accessed on 21st March 2012
Bell, M. and Albu, M. (1999), “Knowledge Systems and Technological Dynamism in Industrial Clusters in Developing Countries”, World Development, Vol. 27(9) pp. 1715-1734.
Bencivenga V. R., Smith, B. R. and Starr, R. M. (1995), “Transaction cost, Technological choice and Endogenous Growth”, Journal of Economic Theory, vol. 67(1) pp. 153-177.
Bertschek, I., Hogrefe, J. and Rasel, F. (2013), “Trade and Technology: New Evidence on the Productivity Sorting of Firms”, ZEW Discussion Paper No. 13-042, http://ftp.zew.de/pub/zew-docs/dp/dp13042.pdf
Bhalla, A. S. (1985), “Concept and Measurement of labour intensity”, In: Bhalla, A. S. (ed.), Technology and Employment in Industry: A case study approach, 3rd Edition, Geneva: International Labour Organization
Bhattacharya, S., Cjatterkee, K., and Samuelson, L. (1986), “Sequential research and the adoption of innovation”, Oxford Economic Papers, vol. 38(sup) pp. 219-243
Bigsten, A. (2001), “History and Policy of Manufacturing in Kenya”, In Bigsten and Kimuyu (2001) (eds.), Structure and Performance of Manufacturing in Kenya, London: Palgrave
Bigsten, A., Kimuyu, P. and Lundvall, K. (2000), “Are formal and Informal Small Firms Really Different? Evidence from Kenyan Manufacturing”, Available at: http://www.csae.ox.ac.uk/conferences/2000-oia/pdfpapers/bigsten.PDF, Accessed on 9th April 2014
Bigsten, A., Kimuyu, P. and Söderbom, M. (2011), “Chapter 10: The Manufacturing Sector,” In: Adam, C., Collier, P. and Ndung’u, N. (2011) (eds.), “Kenya: Policies for Prosperity” Oxford: Oxford University Press.
Binswanger, H. P. (1974), “The Measurement of Technical Change Biases with Many Factors of Production”, American Economic Review, vol. 64(6) pp. 964-76.
Binswanger, H. P. (1978), “Induced Technical Change: Evolution of Thought”, In: Binswanger, H. and Ruttan, V. (eds.), Induced Innovation: Technology Institutions and Development, Baltimore: Johns Hopkins University Press, pp. 13-43
Blaike, N. (2000), Designing Social Research: The Logic of Anticipation, Cambridge: Polity Press.

272
Böhme, M. and Thiele, R. (2012), “Informal-formal Linkages and Informal Enterprise Performance in Urban West Africa”, World Economy working papers No. 1751, Kiel Institute
Bouman, F. J. A., and Harteveld, K. (1976), “The Djanggi: A Traditional Form of Saving and Credit in West Cameroon”, Sociologia Ruralis, vol.16(1) pp. 103-19.
Bowen, M., Morara, M. and Mureithi, S. (2009), “Management of Business Challenges among Small and Micro Enterprises in Nairobi-Kenya”, KCA Journal of Business Management, vol. 2(1) pp. 16-31.
Brach J. and Kappel, R. (2009), “Global Vlaue Chains, Technology Transfer and Local Firm Upgrading in Non-OECD countries”, GIGA Working Papers, No. 110
Brand, V. (1986), “One Dollar Workplaces: A Study of Informal Sector Activities in Magaba, Harare”, Journal of Social Development in Africa vol. 1, pp. 53-74
Brandt, L. and Zhu, S. (2005), “Technology Adoption and Absorption: The Case of Shanghai Firms”, Available at: https://www.msu.edu/~zhuc/China.pdf, Accessed on 30th December 2013
Bratton, M. and Kimenyi, M. S. (2008), “Voting in Kenya: Putting Ethnicity in Perspective”, Afrobarometer Working Papers, No. 95
Brautigam, D. (2009), The Dragon’s Gift: The Real Story of China in Africa, New York: Oxford University Press Inc.
Briceño-Garmendia, C. M. and Shkaratan, M. (2011), “Kenya’s Infrastructure: A Continental Perspective”, The World Bank Africa Region Sustainable Development Department Policy Research Working Papers No. 5596.
Brighouse Echo (2012), “Dominion’s rise and fall”, Available at: http://www.brighouseecho.co.uk/community/echoes-of-the-past/dominion-s-rise-and-fall-1-4138105, accessed on 23rd July 2013
Bryman, A. (2006), “Integrating quantitative and qualitative research: how is it done?” Qualitative Research, vol. 6(1) pp. 97-113.
Buckley, P. J., (1985), “New Forms of International Industrial Co-operations”, In: Buckley, P. J. and Casson, M., (eds.), The Economic Theory of the Multinational Enterprise, London: Macmillan, pp. 39-59.
Buis, M. L. (2011), “The Consequence of Unobserved Heterogeneity in a Sequential Logit Model”, Research in Social Stratification and Mobility, vol. 29(3) pp. 247-262.
Burgess, R.G (1984), “In the field: an introduction to field research”, In: Bulmer, M. (ed.), Contemporary Social Research, London: Unwin Hyman Ltd.
Cahill, M. B., and. Sánchez, N. (2001), “Using principal components to produce an economic and social development index: An application to Latin America and the US”, Atlantic Economic Journal, vol. 29(3) pp. 311-329.

273
Cain, L. P. and Paterson, D. G. (1986), “Biased Technical Change, Scale, and Factor Substitution in America Industry, 1850-1919”, The Journal of Economic History, vol. 46(1) pp. 153-164
Cameron, S. V. and Heckman, J. J. (1998), “Life cycle schooling and dynamic selection bias: Models and evidence for five cohorts of American males”, The Journal of Political Economy, vol. 106(2) pp. 262–333.
Cappellari, L., and S. Jenkins (2003): “Multivariate probit regression using simulated maximum likelihood”, The Stata Journal, vol. 3 pp. 278–294
Caselli, F., and Coleman II, W. (2001), “Cross-country Technology Diffusion: The Case of Computers”, American Economic Review, vol. 91(2) pp. 328-335.
Castillo, L. L., Salem, D. S. and Velez, A. (2012), “Second hand machinery and technical efficiency: An empirical analysis in the South African manufacturing industry”, African Journal of Business Management, vol. 6(6) pp. 2361-2374.
Caves, R. E. (1971), “International Corporations: The Industrial Economics of Foreign Investment”, Economica, vol. 38 (149) pp. 1-27.
Central Bank of Kenya (undated), “Interest rates – commercial bank weighted average”, available at: http://www.centralbank.go.ke/index.php/interest-rates/commercial-banks-weighted-av?yr=2012, accessed on 5th September 2013.
Central Intelligence Agency (2012), “The World Fact Book”, Available at: https://www.cia.gov/library/publications/the-world-factbook, Accessed on 15th March 2012
Chataway, J., Hanlin, R. and Kaplinsky, R. (2013), “Inclusive Innovation: An Architecture for Policy Development”, IKD Working Papers, No.65, The Open University, UK.
Chege, J., Ngui, D. M. and Kimuyu, P. (2013), “Industrialisation in Kenya: What went wrong and why?”, A paper presented at 2013 UNU-Wider Conference on a theme: Learning to Compete: Industrial Development and Policies in Africa, Helsinki, Finland.
Chen R., Cannice, M. V. and Daniels, J. D. (2001), “Market entry and international technology transfer: A case analysis of ten U.S. high-tech firms in China and Southeast Asia”, In: Axinn, C. N., Matthyssens, P. (eds.), “Reassessing the Internationalization of the Firm”, Advances in International Marketing, vol. 11, Emerald Group Publishing Limited, pp. 133 -155.
Chen, S. S. (2005), “Extending Internalisation Theory: A New Perspective on International Technology Transfer and Its Generalization”, Journal of International Business Studies, vol. 36(2), pp. 231-245.
Chen, S., and Ravallion, M. (2013), “More Relatively‐Poor People in a Less Absolutely‐Poor
World”, Review of Income and Wealth, vol. 59(1) pp. 1-28.
Cherryholmes, C. H. (1992), “Notes on pragmatism and scientific realism”, Cited in Creswell J. (2003), Research Design: Qualitative, Quantitative and Mixed Method Approach, 2nd Edition, California: Sage Publication, Inc.
274
Clark J. S. and Youngblood, C. E. (1992), “Estimating Duality Models with Biased Technical Change: A time series Approach”, American Journal of Agricultural Economics, vol. 74(2) pp. 353-360.
Clark, N.G. (1985), The Political Economy of Science and Technology, Oxford: Blackwell.
Cling, J. P., Razafindrakoto, M. and Roubaud, F. (2011), The Informal Economy in Vietnam, Hanoi: ILO.
Colourbox.com, Republic of Kenya – vector map, Available at: http://www.colourbox.com/vector/republic-of-kenya-vector-map-vector-6223370, accessed on 2nd July, 2014.
Contractor, F. J. and Sagafi-Nejad, T. (1981), “International Technology Transfer: Major Issues and Policy Response”, Journal of International Business Studies, vol. 12(2) pp. 113-135
Contractor F.J. (1984), “Choosing between Direct Investment and Licensing: Theoretical considerations and empirical tests”, Journal of International Business Studies, vol. 15(3) pp. 167-188
Cooper, C. and Sercovitch, F. (1971), “The Channels and Mechanisms for the Transfer of Technology from Developed to Developing countries”, UNCTAD Report No.TD/B/AC.11/5, Geneva: United Nations Conference on Trade and Development.
Cooper, C., Kaplinsky, R., Bell, R. and Satyarakwit, W. (1981a), “Choice of techniques for can making in Kenya, Tanzania and Thailand” In: Bhalla, A. S. (ed.), Technology and Employment in Industry, 2nd Edition, Geneva: International Labour Organisation, pp. 91 -124
Cooper, C., Kaplinsky, R. and Turner, R. (1981b), “Second-hand equipment in developing countries: Jute processing machinery in Kenya” In: Bhalla, A. S. (ed.), Technology and Employment in Industry, 2nd Edition, Geneva: International Labour Organisation, pp. 129-153
Coughlin, P. and Ikiara, G. (1988) (eds.), Industrialisation in Kenya: In Search of a Strategy, Nairobi: East Africa Educational Publisher Ltd.
Cozzens, S. and Sutz, J. (2012), Innovation in Informal Settings: A Research Agenda, Ottawa: IDRC.
Crespi, F. (2004), “Notes on the Determinants of Innovation: A Multi-Perspective Analysis”, Nota Di Lavoro 42.2004, Available at: http://www.feem.it/Feem/Pub/Publications/WPapers/default.htm, Accessed on 11th May 2014
Creswell J. (2003), Research Design: Qualitative, Quantitative and Mixed Method Approach, 2nd Edition, California: Sage Publication, Inc.
Creswell, J. W. and Plano Clark, V. L. (2011), Designing and Conducting Mixed Methods Research, 2nd Edition, California: Sage Publications, Inc.
275
Dahlam, C. J. and Westphal, L. E. (1981), “The Meaning of Technological Mastery in Relation to Transfer of Technology”, The ANNALS of the American Academy of Political and Social Science, vol. 458(1) pp. 12-26.
Daltons Ltd (2013), “About us: Company profile”, Available at: http://www.daltonsmachines.com/about-us.html, accessed on 23 July 2013
Daniels, D. (2010), Making Do: Innovations in Kenya’s Informal Sector, Available at: http://issuu.com/steveddaniels/docs/makingdo, Accessed on 3rd May 2013
Daniels, J. D. and Robles, F. (1982), “The Choice of Technology and Export Commitment: The Peruvian Textile Industry” , Journal of International Business Studies, vol. 13(1) pp. 67-87
Das, G. G. (2000) “Embodied Technology Transfer via International Trade and Disaggregation of Labour Payments by Skill Level: A Quantitative Analysis in GTAP Framework”, A paper prepared for the 3rd Annual GTAP Conference in Global Economic Analysis, organised jointly by Centre for Policy Studies , Monash Univeristy, Australia and the Centre for Global Trade Analysis, Purdue University, USA.
Dasgupta, A. K. and Pearce, D. W. (1972), Cost-Benefit Analysis: Theory and Practice, London and Basingstoke: The Macmillan Press Ltd.
David, P. A. (1975), Technical Choce, Innovation and Economic Growth, Cambridge: Cambridge University Press.
David, P. A. (1985), “Clio and the Economics of QWERTY”, American Economic Review, vol. 76 (2) pp. 332-337.
David, P. A. (1986), “Understanding the Economics of QWERTY: The necessity of History”, In: W. N. Parker (ed.), “Economic History and the Modern Economist”, New York: Basil Blackwell, pp. 30-49.
Davidson, W. H. and McFetridge, D. G. (1985), “Key Characteristics in the Choice of International Technology Transfer Mode”, Journal of International Business Studies, vol. 16(2) pp. 5-21.
Davies H. (1977), “Technology transfer Through Commercial Transactions”, Journal of Industrial Economics, vol. 26 (2) pp. 161-175.
De La Tour, A., Glachant, M., and Ménière, Y. (2011), “Innovation and international technology transfer: The case of the Chinese photovoltaic industry”, Energy Policy, vol. 39(2) pp. 761-770.
Dent, C. M. (2011) (ed.), China and African Development Relations, Oxen: Routledge
Depken II, C. A., Redmount, E. and Snow, A. (2001), “Shirking and the Choice of Technology: A theory of production inefficiency with empirical application”, Journal of Economic Behavior and Organization, vol. 44 (4) pp. 383-402.

276
Dinh, H. T., Palmade, V., Chandra, V. and Cossar, F. (2012), “Light Manufacturing in Africa: Targeted Policies to Enhance Private Investment and Create Jobs”, World Bank, Available at: http://siteresources.worldbank.org/DEC/Resources/LightManufacturingInAfricaFullReport.pdfAccessed on 25 March 2014
Djeflat, A. (1988), “The management of technology transfer: Views and experience of developing countries”, International Journal of Technology Management, vol. 3(1/2) pp. 149-165.
Dorfman, N. (1987), Innovation and Market Structure: Lessons from the Computer and Semiconductor Industries, Ballinger Publishing Company, Cambridge, Massachusetts.
Dosi, G., and Grazzi M. (2009), “On the nature of technologies: knowledge, procedures, artifacts and production inputs”, Cambridge Journal of Economics: bep041, vol. 34(1) pp. 173-184
Eckaus R. S., (1955), “The Factor Proportions Problem in Underdeveloped Areas”, American Economic Review, vol. 45(4) pp. 539-565.
Edwards, L. and Jenkins, R. (2014), “The margins of export competition: A new approach to evaluating the impact of China on South African exports to Sub-Saharan Africa”, Journal of Policy Modeling, vol. 36(1) pp. S132-S150.
Ellul, J. (1964), The Technological Society, New York: Vintage Books
Ely, A. and Bell, M. (2009), “The Original ‘Sussex Manifesto’: Its Past and Future Relevance”, STEPS Working Paper 27, Brighton: STEPS Centre
Emmanuel, A. (1982), Appropriate Technology and Underdevelopment, Chichester: J. Wiley.
Encyclopaedia Britannica online, “Lathe”, Available at: http://www.britannica.com/EBchecked/topic/331624/lathe, accessed on 22 July, 2013.
Eneh O. C. (2010), “Technology Transfer, Adoption and Integration: A Review”, Journal of Applied Sciences, vol. 10(16) pp. 1814 -1819.
Fellner, W. (1961), “Two Propositions in the Theory of Induced Innovations”, The Economic Journal, vol. 71(282) pp. 305-308
Foster, C. and Heeks, R. (2014), “Nurturing user–producer interaction: inclusive innovation flows in a low income mobile phone market”, Innovation and Development, http://dx.doi.org/10.1080/2157930X.2014.921353
Frankel, J. (1997), Regional Trading Blocs in the World Economic System, Washington DC: Institute for International Economics.
Fundenberg, D. and Tirole, J. (1985), “Pre-emption and Rent Equalization in the Adoption of New Technology”, Review of Economic Studies, 52(3) pp. 383-401.

277
Gachino, G. (2009) “Industrial Policy, Institutions and Foreign Direct Investment: The Kenyan Context”, African Journal of Marketing Management, vol. 1(6) pp. 140-160.
Gatignon, H. and Anderson, E. (1988), “The Multinational Corporation’s Degree of Control over foreign Subsidiaries: An Empirical Test of a Transaction cost explanation”, Journal of law, economics and organization, vol. 4(2) pp. 425-440.
George, G., McGahan, A. M. and Prabhu, J. (2012), “Innovation for inclusive growth: towards a theoretical framework and research agenda”, Journal of Management Studies vol. 49(4), 661-683.
Gereffi, G. (1994), “Capitalism, development and global commodity chains. In: Sklair, L. (ed.), Capitalism and Development, Routledge: London.
Geroski, P. A. and Walters, C. F. (1995), “Innovative Activity over the Business Cycle”, The Economic Journal, vol. 105(431) pp. 916-928.
Gibbons, M, C. et al. (1994), The new production of knowledge: The dynamics of science and research in contemporary societies, London: Sage.
Godkin, L. (1988), “Problems and Practicalities of Technology Transfer”, International Journal of Technology Management, vol. 3(5) pp. 587-603.
Granovetter, M. (1985), “Economic Action and Social Structure: The Problem of Embeddedness”, The American Journal of Sociology, vol. 91(3) pp. 481-510.
Granström, S. (2009), “The Informal Sector and Formal Competitiveness in Senegal”, Department of Economics at the University of Lund, Minor Field Study Series, No. 194
Gray R. K. et al., (1996), “Entrepreneurship in Micro-Enterprises: A Strategic Analysis of Manufacturing Industries in Kenya”, Maryland: University Press of America.
Gray, W., and Shadbegian, R. (1998) “Environmental Regulation, Investment Timing, and Technology Choice” Journal of Industrial Economics, vol. 46(2), pp. 235- 256
Greene, J. C., Caracelli, V. J., and Graham, W. F. (1989), “Toward a Conceptual Framework for Mixed-Method Evaluation Designs”, Educational and Policy Analysis, vol. 11(3) pp. 255-274.
Greene, W. H. (2003), Econometric Analysis, 5th edition, New Jersey: Prentice Hall.
Greene, W. (Undated), “Discrete Choice Modelling Part: Bivariate and Multivariate Binary Choice Models”, A PowerPoint Presentation, Available at: http://pages.stern.nyu.edu/~wgreene/DiscreteChoice/Lectures/Part5Bivariate&MultivariateProbit.ppt, Accessed on 11th August 2013.
Greene, W. H. (2012), Econometric Analysis, 7th Edition, Essex: Pearson Education Ltd.
Greenwood, J. and Jovanovic, B. (2001) “Accounting for Growth”, In: Hulten, C. R., Dean, E. R. and Harper, M. J. (eds.), New Developments in Productivity Analysis, Chicago: University of Chicago Press, pp. 179 -224

278
Griliches, Z. (1957), “Hybrid Corn: An Exploration of the Economics of Technical Change”, Econometrica, vol. 25 (4) pp. 247-269.
Grimm, M., Lay, J., Roubaud, F., and Vaillant, J. (2011), “Informal Sector Dynamics in Times of Fragile Growth: The Case of Madagascar”, Document de Travail DT/2011-10 UMR DIAL.
Groizard, J. L. (2002) “On the Determinants of the International Embodied Technology Diffusion, Available at: http://dea.uib.es/digitalAssets/123/123545_groizard.pdf, Accessed on 28th October 2013.
Grosse, R. (1996), “International Technology Transfer in Services”, Journal of International Business Studies, vol. 27(4) pp. 781-800.
Gumo, S., A. Akuloba, and S. G. Omare (2012), “Religion and Politics in Contemporary Kenya”, European Scientific Journal, vol. 8(18) pp. 29-41.
Gutiérrez-Romero, R. (2010), “The Role of Ethnic Identity and Economic Issues in the 2007 Kenyan Elections”, CSAE WPS/2010-06, Oxford: Centre for the Study of African Economies
Habibie, B. J. (1990) “Sophisticated Technologies: Taking Root in Developing Countries” International Journal of Technology Management, vol. 10(1) pp. 489-497.
Hall, B. H. and B. Khan (2002), “Adoption of Technology”, New Economy Hand book, Available at: http://eml.berkeley.edu/~bhhall/papers/HallKhan03%20diffusion.pdf, Accessed on 21 August 2013
Hall, B. H. and Khan, B. (2003), “Adoption of New Technology”, NBER Working Paper Series 9730, Available at: http://www.nber.org/papers/w9730
Hameri, A. P. (1996), “Technology Transfer between Basic Research and Industry”, Technovation, vol. 16(2) pp. 51-67
Handley, G., Higgins, K. and Sharma, B. (2009), “Poverty and Poverty Reduction in Sub-Saharan Africa: An Overview of Key Issues”, ODI Working Paper 299.
Hannan, T., and McDowell, J. (1984), “The Determinants of Technology Adoption: The Case of the Banking Firm”, Rand Journal of Economics, vol. 15(3), pp. 328-335
Harrison, P. (1980), The Third World tomorrow, Harmondsworth: Penguin Books.
Hart, K. (1973), “Informal income opportunities and urban employment in Ghana”, The Journal of Modern African Studies, vol. 11(1) pp. 61-89
Hasan, S. and Sheldon, I. (2013), “Credit Constraints, Technology Choice and Exports – A Firm Level Study for Latin American Countries”, Available at: http://aede.osu.edu/sites/aede/files/publication_files, Accessed on 3 October 2014.
Hayami, Y, and Ruttan, V. W. (1970), “Factor Prices and Technical Change in Agricultural Development: The United States and Japan, 1880-1960”, Journal of Political Economy, vol. 78(5) pp. 1115-1141.

279
He, P., Ding, H. and Hua, Z. (2012), “Strategic Choice of Flexible Production Technology using Game Theory Approach”, Robotics and Computer-Integrated Manufacturing, vol. 28(3) pp. 416-424.
Heeks, R., Amalia, M., Kintu, R. and Shah, N. (2013), “Inclusive Innovation: Definition, Conceptualisation and Future Research Priorities”, Development Informatics Working Paper Series Paper No. 53
Heertje, A. (1977), Economics and Technical Change, London: Weidenfeld and Nicolson
Helper, S. (1995), “Supplier Relations and Adoption of New Technology: Results of Survey Research in the U.S. Auto Industry” National Bureau of Economic Research Working Paper 5278.
Hennart, J. F. (1988), “A Transaction Cost Theory of Equity Joint Ventures”, Strategic Management Journal, vol. 9 (4) pp. 361-374
Hevener, C. (2006), “Alternative Financial Vehicles: Rotating Savings and Credit Associations (ROSCAs)”, A Discussion Paper of the Federal Reserve Bank of Philadelphia.
Hicks, J. (1932), The Theory of Wages, 1st Edition, London: Macmillan
Hicks, J. (1969), A Theory of Economic History, Oxford: Clarendon Press
Hienberg, R. (2011), The End of Growth: Adapting to Our New Economic Reality, Forest Row: Clairview Books.
Hoekman, B. M., Maskus, K. E. and Saggi, K. (2004), “Transfer of Technology to Developing Countries: Unilateral and Multilateral Policy Options”, Institute of Behavioural Science Working Paper PEC2004-0003
Holmquist, F. W., Weaver, F. S., and Ford, M. D. (1994), “The structural Development of Kenya’s Political Economy”, African Studies Review, Vol. 37 No. 1, pp 69 – 105
Hosier, R. H. (1987), “The Informal Sector in Kenya: Spatial Variation and Development Alternatives”, The Journal of Developing Areas, vol. 21(4) pp. 383-402.
Hosmer, D. W. and Lemeshow, S., Applied logistic regression, 1st edition, New York: Wiley.
Hsu, M. H., and Chang, C. M. (2014), “Examining interpersonal trust as a facilitator and
uncertainty as an inhibitor of intra‐organisational knowledge sharing”, Information Systems
Journal, vol. 24(2) pp. 119-142.
Ikiara, G. K. (1984), “Social Indicator and Integrated Social Planning: The Case of Kenya”, UNESC Working Paper Series, No. SHS-84/WS/53
Ikiara, G. K., J. Olewe-Nyunya, and W. Odhiambo (2004) “Kenya: Formulation and Implementation of Strategic Trade and Industrial Policies”, In: Soludo, C. C., Ogbu, O., and Chang, H. (eds.), The Politics of Trade and Industrial Policy in Africa. Forced Consensus?, Ottawa: International Development Research Centre.

280
International Labour Organisation (1972), Employment, Incomes and Inequality: A Strategy for Increasing Productive Employment in Kenya, Geneva: ILO
International Labour Organisation (2002), Decent work and the informal economy, International Labour Conference 90th Section Report VI, Geneva: ILO.
Ireland, N. and Stoneman, P. (1985), “Order effects, Perfect Foresight and Interterporal Price Discrimination.” Recherches Economiques de Louvain, vol. 51(1) pp. 7-20.
Jafarieth, H. (2001), Technology Transfer to developing countries: A quantitative approach, PhD thesis, University of Salford.
Janischweski, J., M. P. Henzler and W. Kahlenborn (2003), “The Export of Second-Hand Goods and the Transfer of Technology: An Obstacle to Sustainable Development in Developing countries?”, German Council for Sustainable Development, Text No. 2 (2003)
Jenkin, R. and Edwards, C. (2006), “The Economic Impact of China and India on sub Saharan Africa: Trends and Prospects”, Journal of Asian Economics, vol. 17(2) pp. 207-225
Jequier, N. (1976) (ed.), Appropriate Technology: Problems and Promises, Paris: OECD Development Centre.
Jequier, N. and Blanc, G. (1983), The World of Appropriate Technology, Paris: Organization for Economic Cooperation and Development.
Johnson, B. R., Onwuegbuzie, A. J. and Turner, L. A. (2007), “Toward a Definition of Mixed Methods Research”, Journal of Mixed Methods Research, vol. 1(2) pp. 112-133
Joshi, H. and Joshi, V. (1976) “Surplus Labour and the City: A Study of Bombay”, Cited in Swaminathan, M. (1991), “Understanding the “informal sector: A Survey”, WIDER Working Papers No. WP 95, UN-WIDER
Juma, V. (2011), “China, India Replaces Britain as Kenya’s Top sources of FDI”, Business Daily, September 7, Available at: http://www.businessdailyafrica.com, Accessed on 2nd April, 2012
Kabecha, W. W. (1999), “Technological Capacity of the Micro-enterprises in Kenya’s Informal Sector”, Technovation, vol. 19 (2), pp. 117-126
Kaplinsky R. (1990), The Economies of Small: Appropriate Technology in a Changing World, London: Intermediate Technology Publications.
Kaplinsky, R. (2011a), “What Contribution Can China Make To Inclusive Growth In SSA?”, Paper prepared for The China Rising Conference, Bristol, 5-6th December, 2011
Kaplinsky, R. (2011b), “Schumacher meets Schumpeter: Appropriate technology below the radar”, Research Policy, 40(2) pp. 193–203
Kaplinsky, R. (2013), “Inclusive Innovation: Definition and Importance”, A Draft, Milton Keynes: Development Policy and Practice, Open University.
281
Kaplinsky, R. and Morris, M. (2001), A Handbook for Value Chain Research, Available at: http://asiandrivers.open.ac.uk/documents/Value_chain_Handbook_RKMM_Nov_2001.pdf, Accessed on 12th April 2002
Kaplinsky, R. and Morris, M. (2009), “Chinese FDI in Sub-Saharan Africa: Engaging with Large Dragons”, European Journal of Development Research, vol. 21(4) pp. 551–569
Kaplinsky, R., Chataway, J., Hanlin, R., Clark, N., Kale, D., Muraguri, L., Papaioannou, T., Robbins, P., and Wamae, W. (2009), “Below the radar: What does innovation in emerging economies have to offer other low-income economies?”, International Journal of Technology Management and Sustainable Development, vol. 8(3) pp. 177 -197
Kaplinsky, R., McCormick, D. and Morris, M. (2007), “The Impact of China on Sub Saharan Africa”, Available at: http://asiandrivers.open.ac.uk/documents/china_and_ssa_dfid_agenda_paper_v3_%20feb_%2007.pdf, Accessed on 25th March 2014
Kaplinsky, R., O. Memedovic, M. Morris And J. Readman (2003), “The Global Wood Furniture Value Chain: What Prospects for Upgrading By Developing Countries, The Case of South Africa”, Sectorial Studies Series, United Nations Industrial Development Organization, Vienna.
Karshenas, M. and Stoneman, P. L. (1993) “Rank, Stock, Order, and Epidemic Effects in the Diffusion of New Process Technologies: An Empirical Model”, The Rand Journal of Economics, vol. 24(4) pp. 503-528
Kawagoe T., Otsuka, T., and Hayami, Y. (1987), “Induced Bias of technical change in Agriculture: The United States and Japan, 1880-1980”, Journal of Political Economy, vol. 94 (3) pp. 523-544
Kennedy, C. (1964), “Induced Bias in Innovation and the Theory of Distribution”, The Economic Journal, vol. 74 (295) pp. 541-547.
Kennickell, A., and Kwast, M. (1997), “Who Uses Electronic Banking? Results from the 1995 Survey of Consumer Finances”, Paper presented at the Annual Meetings of the Western Economic Association Seattle, Washington, Available at: http://www.federalreserve.gov/econresdata/scf/files/elbank.pdf, Accessed on 27th June 2013
Kenya Association of Manufacturers (2006), “Manufacturing in Kenya: A survey of Kenya’ Manufacturing Sector – 2006”, Kenya: Accent Ltd.
Kenya Law (National Council for Law Reporting) (2012), “Regulation for Wages Amendment General Order, 2012”, Available at: http://kenyalaw.org/kl/index.php?id=786, accessed on 3rd June, 2014
Kenya National Bureau of Statistics (undated), Consumer Price Index, Available at: http://www.knbs.or.ke/cpi/cpi122012.pdf, accessed on 19th December 2013.
Kenya Yellow Pages (2012), “Furniture Manufacturers”, available at: http://www.yellowpageskenya.com/

282
Khan, S. A., Baye, F. M. and Tange, G. K. (2009), “The Impact of China-Africa Relations: Case Study of Cameroon”, AERC Report, Nairobi: African Economic Research Consortium (AERC)
Kim, L. (1991), “Pros and Cons of International Technology Transfer: A Developing Country
View”, In: Agmon T. and von Glinow, M. (eds.), Technology Transfer in International
Business, OUP, Oxford, England: Oxford University Press, pp. 223-239.
Kim, Y. (2014), “China-Africa Technology Transfer: A Matter of Technology Readiness”, CCS Commentary, Stellenbosch: Centre for Chinese Studies, Available at: http://www.ccs.org.za/wp-content/uploads/2014/02/CCS_Commentary_China_Africa_Tech_2014_YK1.pdf, Accessed on 24th March, 2014
Kimenyi, M. (1997), Ethnic Diversity, Liberty and the State: The African Dilemma, Cheltenham: Edward Elgar Ltd.
Kimenyi, M. (1997), Ethnic Diversity, Liberty and the State: The African Dilemma, Cheltenham: Edward Elgar.
Kline, S. J. and Rosenberg, N. (1986) “An Overview of Innovation”, In: Landau, R. and Rosenberg, N. (eds.), The Positive Sum Strategy: Harnessing Technology for Economic Growth, Washington D.C.: National Academy Press, pp. 275-304
Knowledge Wharton (2012), “China’s Manufacturers and the Quality Control Conundrum” available at: http://www.knowledgeatwharton.com.cn/index.cfm?fa=viewArticle&articleID=2548&languageid=1, accessed on 26 July 2013
KOMAZA (2011), “Understanding Kenya’s Logging Ban”, KOMAZA Blogg, Available at:
http://komaza.org/blog/?p=740 accessed on 2nd
November 2014
Krugman, P. (2012a), “The Conscience of a Liberal – Capital-biased Technological Progress: An Example (Wonkish)”, The Opinion Pages – New York Times, Available at: http://krugman.blogs.nytimes.com/2012/12/26/capital-biased-technological-progress-an-example-wonkish/, Accessed on 25th May 2014
Krugman, P. (2012b), “The Conscience of a Liberal – Rise of Robots”, The Opinion Pages – New York Times, Available at: http://krugman.blogs.nytimes.com/2012/12/08/rise-of-the-robots/?_php=true&_type=blogs&_r=0, Accessed on 25th May 2014
Kuang, E. M. (2008), “The new Chinese migration flows to Africa”, Social Science Information (Special issue: Migrants and clandestinity), vol. 47(4) pp. 643–659
Kumar, B. N. (1995), “Partner selection criteria and success of technology transfer: A model based on learning theory applied to the case of Indo-German technical collaborations”, Academy of Management Review, vol. 35(1) pp. 65-78.
Kuuya, P. M. (2010), “Adoption of Adapted Imported Technology and the MDGs: The Case of Kenya’s Informal Sector”, Paper presented at the Expert Group Meeting on Harnessing Knowledge to Achieve Millennium Development Goals, organized by the Economic

283
Development and NEPAD Division of the United Nations Economic Commission for Africa, in Addis Ababa, Ethiopia
Lambert, D. K. and Shonkwiler, J. S. (1995), “Factors Bias under Stockastic Technical Change”, American Journal of Agricultural Economics, vol. 77(3) pp. 578-590.
Lampert, B. and Mohan, G. (2014), “Sino-African encounters in Ghana and Nigeria: from conflict to conviviality and mutual benefit”, Journal of Current Chinese Affairs, vol. 43(1) (In press).
Le, H. Q. (2008) “The Theories of Trade, FDI and Technology Transfer: A Survey” DEPOCEN Working Paper Series No. 2008/13, Development Policies Research Centre: Hanoi. Available at: http://www.depocen.org/, Accessed on 30th July 2013
Legovini, A. (2002), “Kenya: Macro Economic Evolution since Independence”, Work financed by UNDP, Available at: http://www.docstoc.com/docs/27739328/KENYA-MACRO-ECONOMIC-EVOLUTION-SINCE-INDEPENDENCE, Accessed 19th February 2012
Leys, C. (1975), Underdevelopment in Kenya: The Political Economy of Neo-Colonialism 1964-1971, London: Heinemann Education Books Ltd
Liu, Q. and Shumway, C. R. (2003) “Induced Innovation Test on Western American Agriculture: A Cointegration Analysis”, Paper presented at the American Agricultural Economics Association Annual Meeting, Montreal, Canada, July 27-30, 2003.
MacDonald, S. (1983), “Technology Beyond Machines”, In: MacDonald, et al. (eds.), The Trouble with Technology, London: Frances Pinter.
Macmillan dictionary online, “Grain – Definition”, http://www.macmillandictionary.com/dictionary/british/grain, accessed on 22nd July, 2013
Maddala, G. (1983), Limited Dependent and Qualitative Variables in Econometrics, Cambridge: Cambridge University Press.
Majumdar, S. and Venkataraman, S. (1998), “Network Effects and the Adoption of New Technology: Evidence from the U.S. Telecommunications Industry”, Strategic Management Journal, vol. 19(11) pp. 1045-1062.
Malthus, T. (1798), “An Essay on the Principle of Population”, London: Printed for J. Johnson, in St. Paul’s Church-Yard, Electronic Scholarly Publishing Project, 1998, Available at: http://www.esp.org/books/malthus/population/malthus.pdf, Accessed online on 2nd December 2013
Mansfield, E. (1961), “Technical Change and the Rate of Imitation”, Econometrica, vol. 29(4) pp. 741-765.
Mansfield, E. (1975), “International Technology Transfer: Forms, Resource Requirements, and Policies” American Economic Review, vol. 65(2) pp. 372-376.
Marti, D. F. and Ssenkubuge, I. (2009), “Industrialisation and Industrial Policy in Africa: Is It A Policy Priority?”, The South Centre-Research Paper 20.
284
Marx, K. (1887), Capital: A Critique of Political Economy, English edition, Moscow: Progress Publishers, Translated: S. Moore and E. Aveling, edited by Frederick Engels; Transcribed: Zodiac, Hinrich Kuhls, Allan Thurrott, Bill McDorman, Bert Schultz and Martha Gimenez (1995-1996); Proofed: and corrected by Andy Blunden and Chris Clayton (2008), Mark Harris (2010), Available at: http://www.marxists.org/archive/marx/works/download/pdf/Capital-Volume-I.pdf, Accessed on 24th October 2013
Maskus, K. E. (2004), “Encouraging international technology transfer”, UNCTAD-ICTSD Project on Intellectual Property Rights and Sustainable Development Issue Paper No. 7.
MATRADE-Nairobi (2005), “Product Market Study: Office Furniture”, Available at: http://www.docstoc.com/docs/33522467/MARKET-FOR-FURNITURE-IN-KENYA, Accessed on 20th March 2012
Mayanja, A. B. (2003), “Is FDI the most important source of international technology transfer? Panel Data evidence from the UK”, MPRA Paper No. 2027, Available at: http://mpra.ub.uni-muenchen.de/2027/, Accessed on 2nd May 2012
McCormick, D. (1999), “African Enterprise Clusters and Industrialization: Theory and Reality”, World Development, vol. 27(9) pp. 1531-1551.
McKinsey & Company (2012), “Manufacturing the Future: The Next Era of Global Growth and Innovation”, Available at: http://www.mckinsey.com/insights/manufacturing/the_future_of_manufacturing, Accessed on 25 March 2014
McRobie, G. (1981), Small is Possible, New York: Harper and Row
McSherry, B. and Brass, J. N. (2007), “The Political Economy of Pro-Poor Livestock Policy Reform in Kenya”, IGAD LPI Working Papers No. 04 – 08
Meadows, D. H., Meadows, D. L., Randers, J. and Behrens Ill, W. W. (1972), “The Limits to Growth”, Report for the Club of Rome’s Project on the Predicament of Mankind, Available at: http://www.donellameadows.org/wp-content/userfiles/Limits-to-Growth-digital-scan-version.pdf, Accessed on 2nd December 2013
Meilink, H. A. (1982), “The Effect of Import-Substitution: The Case of Kenya’s Manufacturing Sector”, IDS Discussion Paper No. 276, Nairobi: Institute for Development Studies, University of Nairobi.
Metcalfe, J. S. (1988), “The Diffusion of Innovation: An Interpretive Survey”, In: Dosi et al., (eds.), Technical Change and Economic, London and New York: Pinter Publishers, pp. 560-587.
Mishan, E. J. (1972), Elements of Cost-Benefit Analysis, London: George Allen and Unwin Ltd.
Mockler R. J. (1995), “Underlying Theories of Practical Value in Technology Transfer Across Cultural Boundaries: An Application Study”, In: Proceedings of the 28th Hawii International Conference on System Sciences.
285
Mohan, G. and Tan-Mullins, M. (2009), “Chinese migrants in Africa as new agents of development? An analytical framework”, European Journal of Development Research, vol. 21(4) pp. 588–605.
Mohan, G., Lampert, B., Tan-Mullins, M. and Chang, D. (2014), “Chinese Migrants and Africa's Development: New Imperialists or Agents of Change?” London: Zed Books (forthcoming).
Mokyr, J. (2005), “Long-term Economic growth and the History of Technology”, Handbook of Economic Growth, vol. 1(Part B) pp. 1113-1180
Morawetz, D. (1974), “Employment implications of industrialization in developing countries: A survey” The Economic Journal, vol. 84(333) pp. 491-542.
Morris, M. and Einhorn, G. (2008), “Globalisation, Welfare and Competitiveness: The Impacts of Chinese Imports on the South African Clothing and Textile Industry”, Competition and Change, vol. 12(4) pp. 355-376.
Moser, C. O. N. (1978) “Informal Sector or Petty Commodity Production: Dualism or Dependence in Urban Development?”, World Development, vol. 6(9/10) pp. 1041-64.
Munemo, J. (2013) “Examining Imports of Capital Goods From China as a Channel for Technology Transfer and Growth in Sub-Saharan Africa”, Journal of African Business, vol. 14(2) pp. 106–116
Munro, L. T. (1989) “Technology Choice in Bhutan: Labour Shortage, Aid Dependence, and a Mountain Environment”, Mountain Research and Development, vol. 9(1) pp. 15-23
Mutai, R. (2011), “Micro and Small Enterprise Sector and Existing Support System with emphasis on High-Tech oriented Entrepreneurship in Kenya”, Journal of Language, Technology & Entrepreneurship in Africa, vol. 3(1) pp. 99-108
Mwega, F. M. and Ndung’u, N. S. (2004), “Explaining African Economic Growth Performance: The Case of Kenya”, AERC Working Papers No. 3.
Nadvi, K. (1999), “Collective Efficiency and Collective Failure: The Response of the Sialkot Surgical Instrument Cluster to Global Quality Pressures”, World Development, vol. 27(9) pp. 1605 – 1626.
Nagakura, D. and Kobayashi, M. (2009), “Testing The Sequential Logit Model Against The Nested Logit Model”, The Japanese Economic Review, vol. 60(3) pp. 345-361.
Namale, D. (2012), “Imported Furniture Pushing Carpenter out of Market in Kenya”, Business Daily, April 13, Available at: http://www.businessdailyafrica.com, Accessed on 27th April 2012
Nattrass, N. J. (1987), "Street Trading in Transkei: A Struggle Against Poverty, Persecution and Prosecution", World Development, vol.15(7) pp. 861-75.
Negri, D. H. and Brooks, D. H. (1990), “Determinants of Irrigation Technology Choice”,
Western Journal of Agricultural Economics, vol. 15(2) pp. 213-223
286
Nelson, R. (1980) "Production Sets, Technological Knowledge, and R & D: Fragile and Overworked Constructs for Analysis of Productivity Growth?" American Economic Review, Papers and Proceedings, vol. 70 pp. 62-71.
Nichols, K. L. (undated), “Technology Transfer and Diffusion”, Available at: http://www.eolss.net/Sample-Chapters/C14/E1-34-06-01.pdf, Accessed on 27th October 2013
Niosi, J. and Zhegu, M. (2010), “Multinational Corporations, Value Chains and Knowledge Spillovers in the Global Aircraft Industry”, International Journal of Institutions and Economies, vol. 2(2) pp. 109-141
Nordling, L. (2012) “Africa Analysis: Directing Technology Transfer from China”, SciDev.Net web blog, Available at: http://www.scidev.net/global/funding/analysis-blog/africa-analysis-directing-technology-transfer-from-china.html, Accessed on 25th March 2014
Nyerere, J. (2009), “Technical & Vocational Education and Training (TVET) Sector Mapping in Kenya”, Draft paper prepared for The Dutch Schokland TVET Programme Edukans Foundation
Nyong’o, P. A. (1988) “The Possibilities and Historical Limitations of Import-substitution Industrialisation in Kenya”, In: Coughlin, P. and Ikiara, G. (1988) (eds.), Industrialisation in Kenya: In Search of a Strategy, Nairobi: East Africa Educational Publisher Ltd, pp. 6-50
Obeng, B., R. Blundel and A. Agyapong (2012), “Enterprise education for small artisanal businesses: A case study of Sokoban Wood Village, Ghana”, In: Thai, M. T. and Turkina, E. (eds.), Entrepreneurship in the Informal Economy: Models, Approaches and Perspectives for Economic Development, Routledge (forthcoming).
OECD (2007), OECD Review of Innovation Policy: China Synthesis Report, Paris: Organisation of Economic Cooperation and Development
Ogonda, R. T. (1992), “Kenya’s Industrial Progress in the Post-Independence Era: An Overview of Kenya’s Industrial Performance up to 1980”, In: Chieng’ W. R. and Maxon, R. M. (eds.), An Economic History of Kenya, Nairobi: East Africa Educational Publishers Ltd, pp. 279-312
Omolo, J. (2010), “The Dynamics and Trends of Employment in Kenya”, IEA Research Paper No. 1/2010, Kenya: Institute of Economic Affairs.
Omolo, J. (2012), “Youth Unemployment: Analysis of labour markets and policy interventions”, FES Occasional Paper No.1.
Oniki, S. (2000) “Testing the Induced Innovation Hypothesis in a Cointegrating Regression Model”, The Japanese Economic Review, vol. 51(4) p 544 – 554.
Onjala, J. (2008), “A Scoping Study on China- Africa Economic Relations: The Case of Kenya”, Report submitted to African Economic Research Consortium (AERC), Nairobi
Ophem, H. V. and Schram, A. (1997), “Sequential and Multinomial Logit: A Nested Model”, Empirical Economics, vol. 22(1) pp. 131-152.
287
Orr, G. and Roth, E. (2012), “A CEO’s Guide to Innovation in China”, McKinsey Quarterly, Available at: http://www.mckinsey.com/insights/asia-pacific/a_ceos_guide_to_innovation_in_china, Accessed on 25th March 2014
Orvis, S. (2001), “Moral Ethnicity and Political Tribalism in Kenya’s ‘Virtual Democracy’.” African Issues, vol. 29(1/2) pp. 8-13.
Pack, H. (1981), “The Choice of Technique and Employment in the Textile Industry”, In: Bhalla, A. S. (ed.), Technology and Employment in Industry: A Case Study Approach, 2nd Edition, Geneva: International Labour Organisation.
Palit A. (2006), “Technology Upgradation through Global Value Chain: Challenges before BIMSTEC Nations”, Discussion Paper 13/2006, CSIRD.
Papaconstantinou, G., Sakurai, N. and Wyckoff, A. (1996), “Embodied Technology Diffusion: An Empirical Analysis for 10 OECD Countries”, OECD Science, Technology and Industry Working Papers, 1996/01, OECD Publishing. http://dx.doi.org/10.1787/686654085563
Park, Y. J. (2009), “Chinese Migration in Africa”, SAIIA Occasional Paper No. 24, Johannesburg: South Africa Institute of International Affairs.
Patroba, H. (2012), “China in Kenya: Addressing Counterfeit Goods and Construction Sector Imbalances”, SAIIA Occasional Paper No. 110, Johannesburg: South African Institute of International Affair.
Pavitt, K. (1984), “Sectoral Patterns of Technical Change: Towards a Taxonomy and a Theory”, Research Policy, vol. 13(6) pp. 343-373.
Pellegrini, U. (1979), “The problem of appropriate technology” In: De Giorgio, A. and Roveda, C. (eds.), Criteria for selecting appropriate technologies under different cultural, technical and social conditions, New York: Pergamon Press, pp. 1-5
People’s Republic of China (2013), “China-Africa Economic and Trade Cooperation”, China: Information Office of the State Council, Available at: http://www.safpi.org/sites/default/files/publications/ChinaAfricaEconomicandTradeCooperation.pdf, Accessed on 31th March 2014
Pieters, J., Moreno-Monroy, A., and Erumban, A. (2010), “Formal-Informal Linkages and Informal Sector Dynamics: Evidence from India”, Paper Prepared for the 31st General Conference of The International Association for Research in Income and Wealth St. Gallen, Switzerland, August 22-28, 2010
Pietrobelli, C. and Rabellotti, R. (2011), “Global Value Chains meet Innovation Systems: Are there Learning Opportunities for Developing countries?”, World Development, Vol. 39(7) pp. 1261 – 1269.
Pollin, R., Githinji, M. W. and Heintz, J. (2008), An Employment targeted Economic Programme for Kenya, Cheltenham: Edward Elgar.
Popp, D. (2002), “Induced Innovation and Energy Prices”, The American Economic Review, vol. 92 (1) pp. 160-180.
288
Portes, A., Castells, M. and Benton, L. A. (1989), The Informal Economy: Studies in Advanced and Less Developed Countries, Baltimore and London: Johns Hopkins University Press.
Potter, S. (2006), Doing Postgraduate Research, 2nd Edition, London: Sage Publications and The Open University, UK.
Quirmbach, H. (1986), “The Diffusion of New Technology and the Market for an Innovation”, Rand Journal of Economics, vol. 17(1) pp. 33-47.
Rabellotti, R. (1999), “Recovery of a Mexican Cluster: Devaluation Bonanza or Collective Efficiency?”, World Development, vol. 27(9) pp. 1571-1585.
Ram, R. (1982), "Composite Indices of Physical Quality of Life, Basic Needs Fulfilment, and Income: A Principal Component Representation," Journal of Development Economics, vol. 11(2) pp. 227-47.
Ramanathan, K. (undated) “An Overview of Technology Transfer and technology transfer models” Available at: https://tto.boun.edu.tr/files/1383812118_An%20overview%20of%20TT%20and%20TT%20Models.pdf, Accessed online on 3rd May 2003
Ray of Solaris (undated), “Electricity Cost in Kenya: Calculate your bill”, Available at: http://rayofsolaris.net/misc/kenya-electricity/, accessed on 2nd September 2013.
Reddy, A. (1979), “Nations and Regions Technology Group and Institutions: An Assessment”, Cited in Kaplinsky, R. (1995), Economies of Small: Appropriate technology in a changing world, London: Intermediate Technology Publications.
Republic of Kenya (1996), Industrial Transformation to the Year 2020, Sessional Paper No. 2 of 1996, Nairobi: Government Printer.
Republic of Kenya (2005a), “The Background Report of Kenya”, UNESCO/OECD Early Childhood Policy Review Project, ED/BAS/EIE/7
Republic of Kenya (2005b), Development of Micro and Small Enterprise for Wealth and Employment Creation for Poverty Reduction, Sessional Paper No. 2 of 2005, Nairobi: Government Printer.
Republic of Kenya (2007), Kenya Vision 2030, Nairobi: Government Printer.
Republic of Kenya (2008a), Sector Plan for Manufacturing 2008-2012, Nairobi: Government Printer.
Republic of Kenya (2008b), Science, Technology and Innovation Strategy and Policy, Nairobi: Government Printer.
Republic of Kenya (2009), Economic Survey 2009, Nairobi: Government Printers.
Rhee, Y. W. and Westphal, L. E. (1977), “A Micro, Econometric Investigation of Technology Choice”, Journal of Development Economics, vol. 4(3) pp. 205-237
289
Robinson, J. (1953-1954), “The Production Function and the Theory of Capital”, The Review of Economic Studies, vol. 21(2) pp. 81-106.
Ronge, E. E. and Nyangito, H. O. (2000), “A Review of Kenya’s Current Industrialisation Policy”, KIPPRA Discussion Paper No. 3, Nairobi: Kenya Institute for Public Policy Research and Analysis.
Rorty, R. (1983), “Consequences of pragmatism”, Cited in Creswell J. (2003), “Research Design: Qualitative, Quantitative and Mixed Method Approach”, 2nd Edition, California: Sage Publication, Inc.
Rosenberg, N. (1976), Perspectives on Technology, New York: Cambridge University Press.
Rugman, A. M. and Verbeke, A. (2003), “Extending the Theory of the Multinational Enterprise: Internalization and Strategic Management Perspectives”, Journal of International Business Studies, vol. 34(2) pp. 125-137.
Ruttan, V. W. (2001), Technology Growth and Development: An Induced Innovation Perspective, New York: Oxford University Press.
Ryan, B. & Gross, N. (1943), 'The diffusion of hybrid seed corn in two Iowa communities', Rural Sociology, vol. 8(1) pp. 15-24
Ryan, B. and N. C. Cross (1950), “Acceptance and Diffusion of Hybrid Corn Seed in Two Iowa Communities”, Iowa Agricultural Experiment Station Research bulletin 372
Saggi, K. (2002) “Trade, Foreign Direct Investment, and International Technology Transfer: A Survey”, World Bank Research Observer, vol. 17(2) pp. 191 – 236
Saggi, K. (2004) International technological transfer to developing countries, London: Commonwealth Secretariat
Saliola, F. and Zanfei, A. (2007), “Multinational firms, global value chains and the organization of technology transfer”, WP-EMS Working Papers Series in Economics Mathematica and Statistics WP-EMS No. 2007/10
Salter, W. (1960), Productivity and Technical Change, Cambridge: Cambridge University Press.
Sauder School of Business (2009), “Social Entrepreneurship 101: Africa”, Course module for Sauder School of Business Initiative in Kenya, University of British Columbia, Available at: http://www.sauder.ubc.ca/Global_Reach/Sauder_Africa_Initiative/Social_Entrepreneurship_101_Africa, Accessed on 5th April 2012
Scherer, F. M. (1982), “Demand-Pull and Technological Invention: Schmookler Revisted”, The Journal of Industrial Economics, vol. 30(3) pp. 225-237.
Schmitz, H and Nadvi, K. (1999), “Clustering and Industrialization: Introduction”, World Development, vol. 27(9) pp. 1503-1514.
290
Schmitz, H. (1999), “Global Competition and Local Cooperation: Success and Failure in the Sinos Valley, Brazil”, World Development, vol. 27(9) pp. 1627- 1650.
Schmookler, J. (1962), “Changes in Industry and in the state of Knowledge as Determinants of Industrial Invention” In: Nelson, R. R. (ed.), The Rate and Direction of Inventive Activity: Economic and Social Factors, Princeton: Princeton University Press, pp. 195-232
Schmookler, J. (1966) “Changes in industry and in the state of knowledge as determinants of industrial invention” In: Nelson, R. R. (ed.) The Rate of and Direction Inventive Activity: Economic and Social Factors, Princeton: Princeton University Press, pp. 195-232.
Schneider, D. (1999), “The Role of Buyers in the Development of the Hotel Furniture Industry in Kenya”, IDS Working Papers 93, Sussex: IDS
Schumacher, D. (2011), small is beautiful in the 21st century, Devon: Green Books Ltd
Schumacher, F. (1973), Small is Beautiful: A Study of Economics as if People Mattered, London: Blond and Briggs.
Sethi, A.K. and Sethi, S.P. (1990), "Flexibility in Manufacturing: A survey", The International Journal of Flexible Manufacturing Systems, vol. 2(4) pp. 289-328.
Seyfang, G. and Smith, A. (2007), “Grassroots Innovations for Sustainable Development: Towards a New Research and Policy Agenda”, Environmental Politics, vol. 16(4) pp. 584 – 603.
Shanmugam, B. “Development Strategy and Mobilising Savings through ROSCAs: The Case of Malaysia,” Savings and Development, vol. 13(4) pp. 351-368.
Shlens, J. (2009), “A tutorial on Principal Component Analysis (Version 3.01)”, Available at: http://www.snl.salk.edu/~shlens/pca.pdf, Accessed on 9th August 2013
Singer, H., et al. (1970), The Sussex Manifesto: Science and Technology for Developing Countries during the Second Development Decade, IDS Reprints No. 101, Brighton: Institute of Development Studies.
Soderbom, M. (2001), “Constraints and Opportunities in Kenyan Manufacturing: Report on the Kenyan Manufacturing Enterprise Survey 2000”, Report prepared for United Nations Industrial Development Organization and Centre for the Study of African Economies, Oxford University
Souder, W.E. (1987), Managing New Product Innovation, New York: D.C. Heath.
Staritz, C. and Reis, J. G. (2013) (eds.), “Global Value Chains, Economic Upgrading, and Gender: Case Studies of the Horticulture, Tourism, and Call Centre Industries”, Washington DC: World Bank.
StataCorp (2009), Stata: Release 11 Statistical Software, College Station, TX: StataCorp LP.

291
Steenhuis H. and de Bruijn, E. (2005), “International Technology Transfer: Building Theory from a Multiple Case-Study in the Aircraft Industry”, Paper presented at the Academy of Management Annual Meeting: A New Vision of Management in the 21st Century, no. 1360
Stewart, F. (1982), Technology and Underdevelopment, 2nd edition (Reprinted) London: Macmillan.
Stewart, F. (1987), “Macro-policies for Appropriate Technology: An Introductory Classification” In: Stewart, F. (ed.), Macro-Policies for Appropriate Technology in Developing Countries, Clorado: Westview Press, Inc. pp. 1-21.
Stewart, F. and Ranis, G. (1990), “Macro-policies for Appropriate Technology” In: F. Stewart et. al. (eds.), The Other Policy, London: Intermediate Technology Publications pp. 1-43
Strange, A., Parks, B., Tierney, M. J., Fuchs, A., Dreher, A., and Ramachandran, V. (2013) “China’s Development Finance to Africa: A Media-Based Approach to Data Collection”, CGD Working Papers 323, Washington DC: Centre for Global Development.
Sundet, G., and Moen, E. (2009), “Political Economy Analysis of Kenya”, Norad Report 19/2009
Swaminathan, M. (1991), “Understanding the “informal sector: A Survey”, WIDER Working Papers No. WP 95, UN-WIDER
Takahashi, Y., Ohno, A. and Matsuoka, S. (2007), “Alternative Exported-Oriented Industrialization in Africa: Extension from “Spatial Economic Advantage” in the Case of Kenya”, Discussion Paper Series vol. 2006-7, Graduate School of International Development and Cooperation, Hiroshima University
Teece, D. J. (1977), “Technology Transfer by Multinational Firms: The Resource Cost of Transferring Technological Know-how”, Economic Journal, vol. 87(346) pp. 242-261.
Thirtle, C. G. and Ruttan, V. W. (1987), “The Role of Demand and Supply in the Generation and Diffusion of Technical Change”, Chur, Switzerland: Harwood Academic Publisher.
Tongco, M. C. (2007), “Purposive Sampling as a Tool for Informant Selection”, Ethnobotany Research and Applications, vol. 5 pp. 147-158.
Uebersax J.S. (2006), “The Tetrachoric and Polychoric Correlation Coefficients”, Statistical Methods for Rater Agreement web site, Available at: http://john-uebersax.com/stat/tetra.htm Accessed on 9th August 2013.
UN COMTRADE, Trade database, accessed via World Integrated Trade Solutions at: http://wits.worldbank.org/
United Nations Conference on Trade and Development (2005), Investment Policy Review Kenya, New York and Geneva: United Nations.
United Nations Conference on Trade and Development (2012), Technology and Innovation
Report 2012: Innovation, Technology and South-South Collaboration, United Nations Publication UNCTAD/TIR/2012, New York and Geneva: United Nations.

292
USAID (1976), Proposal for a Program on Appropriate Technology, Washington: US Government Printing Office
Uzzi, B. (1997), “Social Structures and Competition in the Interfirm Networks: The Paradox of Embeddedness”, Administrative Science Quarterly, vol. 42(1) pp. 35-67
Verma, S., Tsephalb, S. and Josec, T. (2004), “Pepsee Systems: Grassroots Innovation Underground Water Stress”, Water Policy, vol. 6 pp. 303–318
Vernon, R. (1979), “The product Cycle Hypothesis in a New International Environment” Oxford Bulletin of Economics and Statistics, vol. 40(4) pp. 255-267
von Hippel, E. (2005), Democratizing Innovation, Cambridge, MA: MIT Press.
von Hippel, E., (1994), Technological Innovations, New York: Oxford University Press
Wadkin Ltd (Undated), “30” BZB 360 Bandsaw”, Leaflet No B.392/4, Available at: http://www.wadkin.com/wadkin-library, Accessed on 12th July 2013
Wadkin Ltd (Undated), “Circular Saw Benches”, Leaflet No. B426/3, Available at: http://www.wadkin.com/wadkin-library, Accessed on 12th July 2013
Wadkin Ltd (Undated), “Combined Surfacer and Thicknesser, FM 18 and 24 sizes”, Leaflet No. 953, Available at: http://www.wadkin.com/wadkin-library, Accessed on 12th July 2013
Wadkin Ltd (Undated), “Wood Turning Lathe (B.Z.L.)”, Leaflet No. B.321/4, Available at: http://www.wadkin.com/wadkin-library, Accessed on 12th July 2013
Wall M. M. (2006), “Latent variable measurement models and path analysis”, Available at: http://www.columbia.edu/~mmw2177/LVcourse/slides1handout.pdf, Accessed on 11th August 2013.
Walsh, V. (1984), “Invention and Innovation in the Chemical Industry: Demand-Pull or Discovery-Push?” Research Policy, vol. 13(4) pp. 211-234.
Wambugu A., Munga, B. and Onsomu, E. (2009), “Unemployment in Kenya: The Situational Analysis”, Report on a project of the Kenya Institute for Public Policy Research and Analysis in conjunction with the National Economic and Social Council, United Nations Development Program and the Royal Danish Embassy, Available at: http://s3.amazonaws.com/zanran_storage/www.ke.undp.org/ContentPages/23571374.pdf, accessed on 9th May 2013.
Wicklein R. C. and Kachmar, C. J. (2001), “Philosophical Rationale for Appropriate Technology”, In: Wicklein, R. C. (ed.) Appropriate Technology for Sustainable Living, New York: Glencoe/McGraw-Hill, pp. 3-17.
Willoughby, K. W. (1990), Technology Choice: A Critique of the Appropriate Technology Movement, Boulder: Westview

293
Wilson, I. (2005), “Some Practical Sampling Procedure for Development Research”, In: Holland, J. and Campbell, J. (2005), Methods in Development Research, Warwickshire; ITDG Publishing.
Winiecki, J. (2008), “Assessing Infrastructure Constraints on Business Activity in Kisumu, Kenya”, MCI and VCC Working Paper Series No 05/2008
Winner, L. (1978), Autonomous Technology: Technics-out-of-Control as a Theme in Political Thought, Cambridge, Mass.: Massachusetts Institute of Technology Press
World Bank (2010), Kenya’s Infrastructure: A Continental Perspective, Washington DC: World Bank.
World Bank (2011), World Development Indicators, Washington DC: World Bank.
World Bank (2013), World Development Indicators, Washington DC: World Bank.
World Wide Fund (2012), A summary report of the Regional study on timber movement and
trade in Eastern Democratic republic of Congo and destination Markets in the region,
Kampala: WWF Uganda
Wu, W. L., Lin, C. H., Hsu, B. F. and Yeh, R. S. (2009) “Interpersonal Trust and Knowledge Sharing: Moderating Effects of Individual Altruism and a Social Interaction Environment”, Social Behavior and Personality, vol. 37(1) pp. 83-94
Xu, B., & Wang, J. (1999) “Capital goods trade and R&D spillovers in the OECD” Canadian Journal of Economics, vol. 32(5) pp. 1258-1274
Zweig, D. (2008), “China and the World Economy: The Rise of A New Trading Nation”, Paper presented at the World International Studies Association, Ljubljana, Slovenia, 24 July 2008
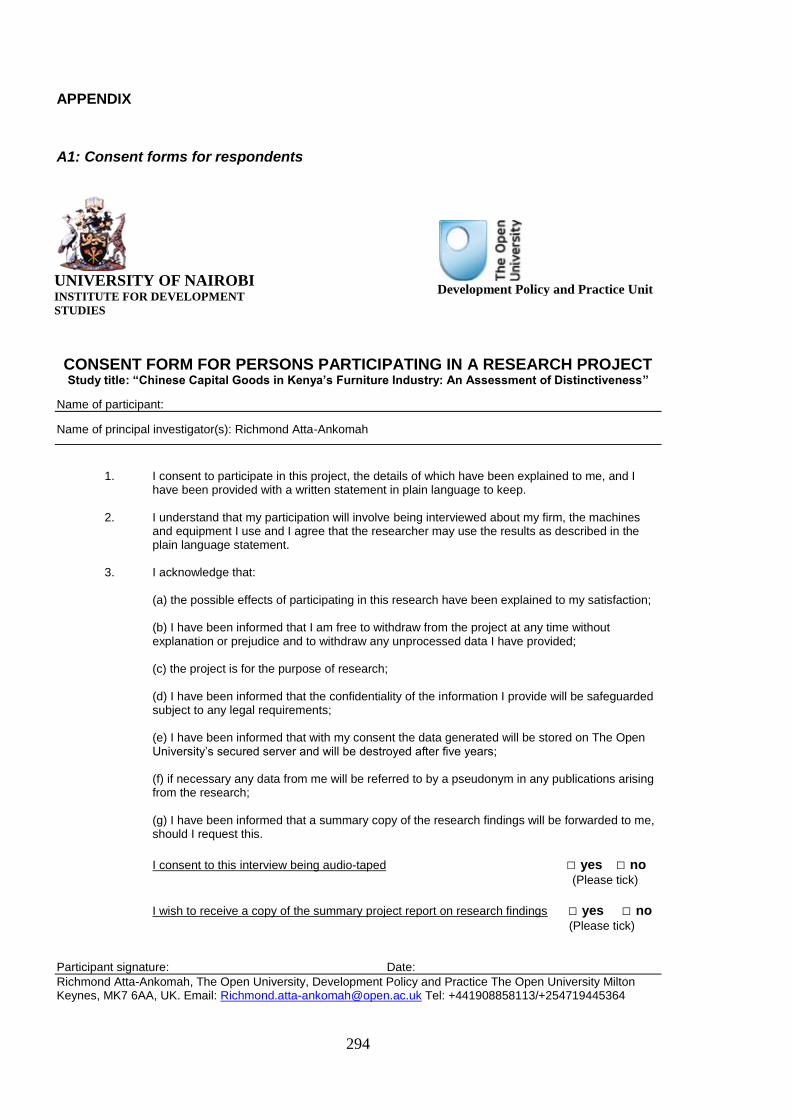
294
APPENDIX
A1: Consent forms for respondents
CONSENT FORM FOR PERSONS PARTICIPATING IN A RESEARCH PROJECT Study title: “Chinese Capital Goods in Kenya’s Furniture Industry: An Assessment of Distinctiveness”
Name of participant:
Name of principal investigator(s): Richmond Atta-Ankomah
1. I consent to participate in this project, the details of which have been explained to me, and I
have been provided with a written statement in plain language to keep.
2. I understand that my participation will involve being interviewed about my firm, the machines and equipment I use and I agree that the researcher may use the results as described in the plain language statement.
3. I acknowledge that:
(a) the possible effects of participating in this research have been explained to my satisfaction; (b) I have been informed that I am free to withdraw from the project at any time without explanation or prejudice and to withdraw any unprocessed data I have provided; (c) the project is for the purpose of research; (d) I have been informed that the confidentiality of the information I provide will be safeguarded subject to any legal requirements; (e) I have been informed that with my consent the data generated will be stored on The Open University’s secured server and will be destroyed after five years; (f) if necessary any data from me will be referred to by a pseudonym in any publications arising from the research; (g) I have been informed that a summary copy of the research findings will be forwarded to me, should I request this.
I consent to this interview being audio-taped □ yes □ no
(Please tick)
I wish to receive a copy of the summary project report on research findings □ yes □ no
(Please tick) Participant signature: Date:
Richmond Atta-Ankomah, The Open University, Development Policy and Practice The Open University Milton Keynes, MK7 6AA, UK. Email: [email protected] Tel: +441908858113/+254719445364
UNIVERSITY OF NAIROBI INSTITUTE FOR DEVELOPMENT
STUDIES
Development Policy and Practice Unit

295
A2: Questionnaire for first round of interviews with the furniture making firms
RESEARCH INSTRUMENT INTRODUCTION This survey forms part of my PhD research, which broadly aims to assess the various ways in which Chinese technological innovations (embodied in capital goods) used in Kenya’s furniture making industry differ from those from developed countries and the implications for poverty reduction and development. SECTION A: BASIC INFORMATION ABOUT THE FIRM
1 Name of firm __________________
2 Location of firm __________________
3 (a) Nature of furniture manufacturing activity [ ] Wood work
[ ] Metal work
[ ] Wood and metal work
(b) Which of the following specific activities is your firm involved in? [ ] Furniture making only
[ ] Machining services only
[ ] Both furniture making and machining services work
4 Nature of ownership [ ] State-owned
[ ] Publicly listed firm
[ ] Partnership
[ ] Family owned
[ ] Solely owned by an individual
5 Source of ownership [ ] Foreign

296
[ ] Local
[ ] Foreign and local
6 If foreign owned firm, what is the origin of the owners? [ ] China
[ ] India
[ ] Other developing countries
[ ] Advanced countries
7 For how many years has your firm been operating __________
8 If you consider your firm to be a formal sector firm, has it operated in the informal sector before? __________
9 How many years did your firm operate in the informal sector before moving into the formal sector _______________________
10 Is your firm registered? ________________________
11 Does your firm belong to any association? Name it. ________________________ 12 Do you regularly pay taxes to the city council/ government? ________________________ 13 (a) Does your firm have a bank account or save with a micro finance
institution? ________________________
(b) How many of such accounts does your firm have? ________________________
(c) Have you applied for loan for your business in the last two years? ________________________
(d) Have you received any loan for your business from a bank or micro finance institution in the last two years?
________________________
(e) How many times in the last two years have you received such loans? ________________________
(f) On a scale of 1-7 (where 1 means no access to finance and 7 means very high access to finance), how do you rate your access to finance?
________________________

297
SECTION B: TYPE AND USES OF MACHINES/EQUIPMENT
14 Do you have (light-duty) machines? _______________
15 Which of the following countries do your (light-duty) machines you have come from? [ ] China
(Tick all that applies) [ ] India
[ ] Kenya
[ ] Other developing countries
[ ] Advanced countries
16 (a) Please, list the major (light-duty) machines and equipment you have that come from these sources
China _______________________________ India _______________________________ Kenya (jua kali) _______________________________ Other developing countries _______________________________ Advanced countries _______________________________
(b) Please, list the major power tools you have that come from these sources
China _______________________________ India _______________________________ Kenya (jua kali) _______________________________ Other developing countries _______________________________ Advanced countries _______________________________ (c) Please, list the major hand (manual) tools you have that come from
these sources China _______________________________ India _______________________________ Kenya (jua kali) _______________________________
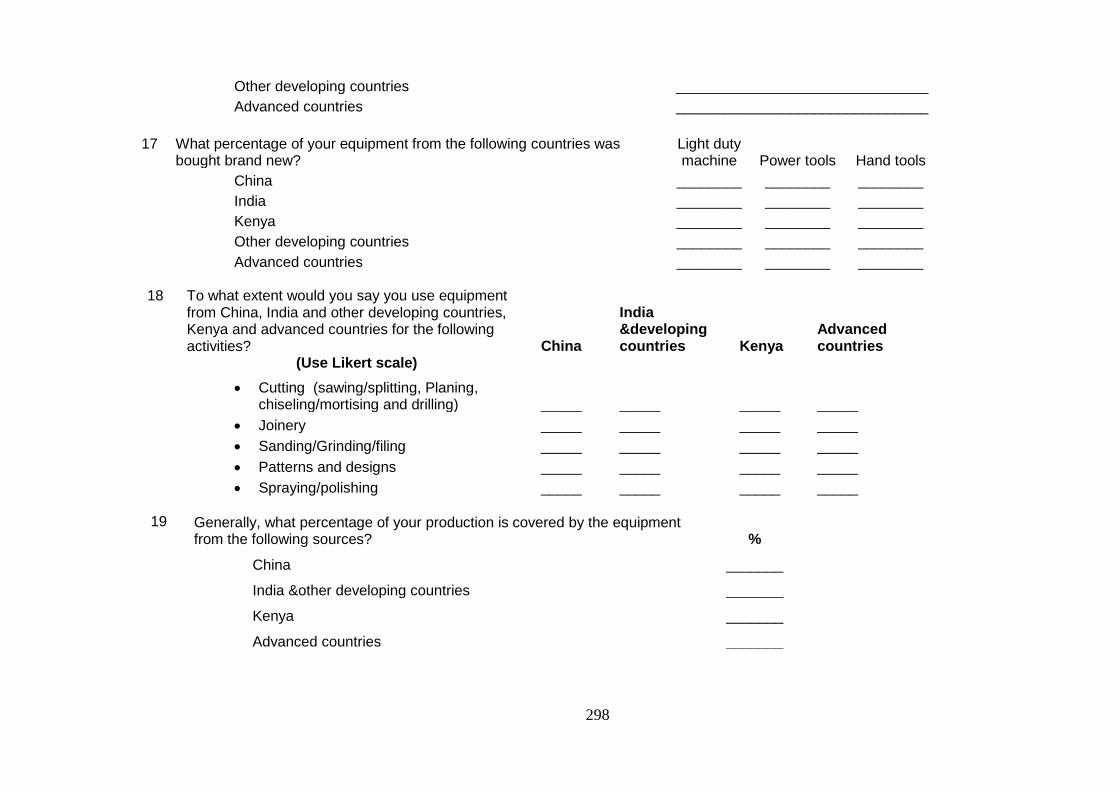
298
Other developing countries _______________________________ Advanced countries _______________________________
17 What percentage of your equipment from the following countries was bought brand new?
Light duty machine Power tools Hand tools
China ________ ________ ________ India ________ ________ ________ Kenya ________ ________ ________ Other developing countries ________ ________ ________ Advanced countries ________ ________ ________
18 To what extent would you say you use equipment
from China, India and other developing countries, Kenya and advanced countries for the following activities? China
India &developing countries Kenya
Advanced countries
(Use Likert scale)
Cutting (sawing/splitting, Planing, chiseling/mortising and drilling) _____ _____ _____ _____
Joinery _____ _____ _____ _____ Sanding/Grinding/filing _____ _____ _____ _____ Patterns and designs _____ _____ _____ _____ Spraying/polishing _____ _____ _____ _____
19 Generally, what percentage of your production is covered by the equipment
from the following sources? %
China _______
India &other developing countries _______
Kenya _______
Advanced countries _______
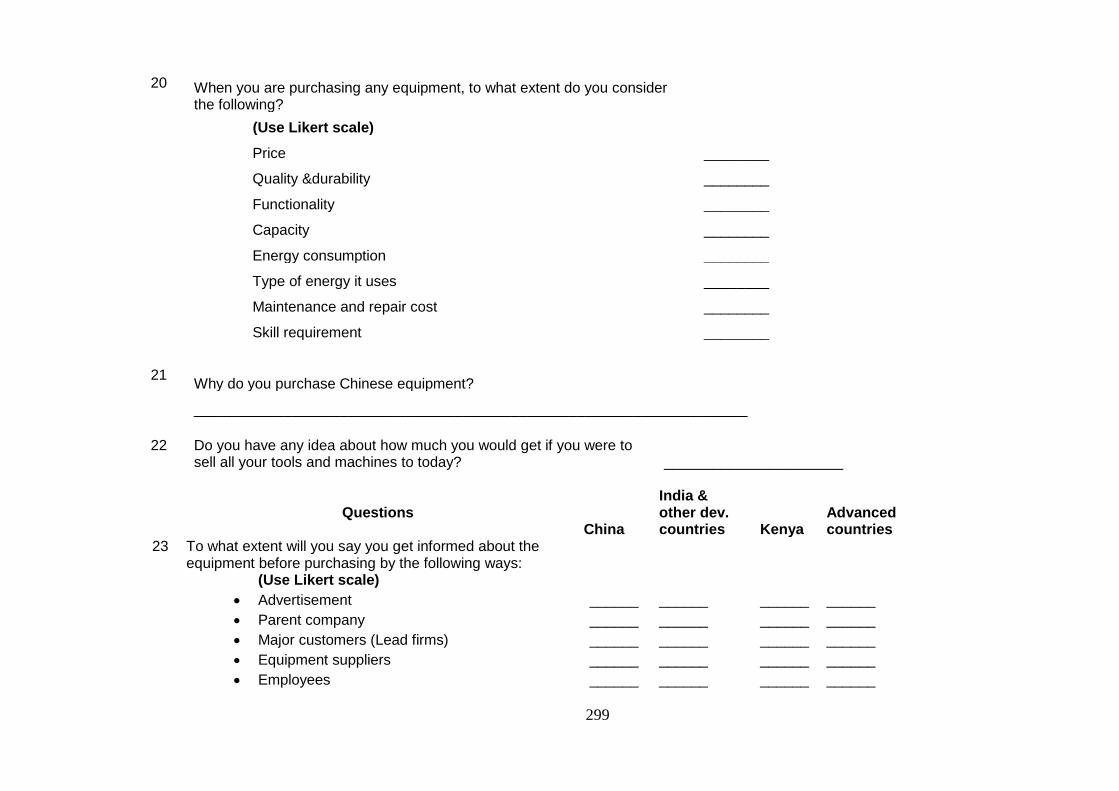
299
20 When you are purchasing any equipment, to what extent do you consider the following?
(Use Likert scale)
Price ________
Quality &durability ________
Functionality ________
Capacity ________
Energy consumption ________
Type of energy it uses ________
Maintenance and repair cost ________
Skill requirement ________
21 Why do you purchase Chinese equipment?
____________________________________________________________________
22 Do you have any idea about how much you would get if you were to sell all your tools and machines to today? ______________________
Questions China
India & other dev. countries Kenya
Advanced countries
23 To what extent will you say you get informed about the equipment before purchasing by the following ways:
(Use Likert scale) Advertisement ______ ______ ______ ______
Parent company ______ ______ ______ ______ Major customers (Lead firms) ______ ______ ______ ______ Equipment suppliers ______ ______ ______ ______ Employees ______ ______ ______ ______

300
Other input suppliers ______ ______ ______ ______ A competitor firm ______ ______ ______ ______ Firms that give you subcontracts ______ ______ ______ ______ Firms we give subcontracts to ______ ______ ______ ______ Friends &family ______ ______ ______ ______
24 (a) How do you get your equipment? (Tick all that applies) Purchased from a market dealer ______ ______ ______ ______
A joint venture partner provides them ______ ______ ______ ______ Parent company of the firm provide them ______ ______ ______ ______ Another firm purchased them ______ ______ ______ ______ Others (specify) ______ ______ ______ ______ _______ (b) If another firm purchased the machine, what kind of
relationship exists between your firm and that firm? ______________________________________ SECTION C: LABOUR SUPPLY AND WORKFORCE
25 Number of employees Full time___________________
Part time/casuals____________
26 What is (do you have any idea about) the average age of your workforce __________________________
27 What is the average schooling years of your workforce __________________________
28 How many (what percentage) of your workers have received training from the following sources?
University ____________ Polytechnic ____________ High school ____________ Apprenticeship ____________

301
29 Are your workers registered with the social security office or are they on any pension scheme? _____________
30 Do your social security registered workers include
casual/part time workers? _____________ SECTION D: SUBCONTRACTING (FINAL PRODUCTS)
Questions
Subcontract you receive
Subcontracts you give
31 How often do you do subcontracts?
No subcontracts _______________ _______________ Not often _______________ _______________ Often _______________ _______________ Very often _______________ _______________
32 How many (or what percentage) of the firms you do subcontracts with would say are micro and small enterprises? _______________ _______________
33 What percentage of all the firms that you do subcontract with are foreign firms _______________ _______________
34 What percentage of the local firms you do subcontract with would say operate in the informal sector? _______________ _______________
35 What percentage of your output/sales per annum involves subcontracting? _______________ _______________
SECTION E: PRODUCTS, MARKET AND CUSTOMERS
QUESTIONS
Final Products
Components
36 a. Which of the following categories of products do you produce? (Tick all
302
that applies)
Office ___________ ___________ Domestic
b. If you produce both office and domestic artefacts, what share of the products you manufacture constitute office artefacts? ___________ ___________
c. Please, list the major variety of office artefacts you produce. ___________ ___________
d. Please, list the major variety of domestic artefacts you produce. ___________ ___________
37 What percentage of your total production constitutes components making? __________________
38 Which of the following categories of consumers constitute the main target market of your firm? (Tick all that applies)
High income consumers ___________ ___N/A____ Middle income consumers ___________ ___N/A____ Low income consumers ___________ ___N/A____ Other firms ___________ ___________
39 If other firms purchase your products, how many of the firms would you say are medium and large scale firms ___________ ___________
40 Which of the following is the major market for your firm? Foreign, domestic or
both? ___________ ___________
41 What proportion of the local firms that buy your products operate in the formal sector? ___________ ___________
42 To what extent do you think your customers consider the following when
purchasing from you? (Use Likert scale) Price ___________ ___________
Prompt delivery ___________ ___________ Quality & durability ___________ ___________ Design & aesthetics ___________ ___________

303
Opportunities for repair/maintenance ___________ ___________ Warrantee /guarantee ___________ ___________
SECTION F: ABOUT THE ENTREPRENEUR/MANAGER
43 Sex ___________
44 Age in completed years ___________
45 Number of years of formal schooling ___________
46 Level of education [ ] Basic or primary
[ ] High school
[ ] Polytechnic
[ ] University
47 Do you have a business card? ___________
48 a. Did you work in the informal sector any time before starting your current business? ___________
b. For how many years did you do such work? ___________
c. What was the area of your previous business/employment in the informal sector? ___________
d. Did you own that business? ___________
e. Why did you stop doing this work? ______________________________
f. Would you like to go back and work in the informal sector? _____________
49 a. Did you work in the formal sector any time before starting your current business? ____________

304
b. For how many years did you do such work? ____________
c. What was the area of your previous business/employment in the formal sector? ____________
d. Did you own that business? ____________
e. Why did you stop doing this work? ______________________________
f. Would you like to be employed again in the formal sector? _____________
50 What is your view of Chinese presence in Kenya? _____________________________
51 In what ways do you think Chinese presence in Kenya is helping you in your business? _____________________________
52 What is your view of Chinese equipment? _____________________________
53 Would you be interested in being part of this research further? _____________________________
Thank you for your time!
A3: Questions for second round of interviews with the furniture making firms
Questions Machine 1 Machine 2 Machine 3
1 Basic information about machine:
(a) Type of machine (Planing, bandsaw, saw bench or lathe)
(b) In what year did you purchase the machine?
(c) From which country does the machine come from?
(d) Was it new when you purchased it?

305
(e) How much did it cost to purchase the machine?
(f) How much does it sell now on the market
(g) Why did you buy the machine from this source?
2 Scale:
)a) Size of machine (width of thicknesser planer, size of tilting table for band saw, length
of lathe, size of working table for saw bench)
(b) What is the horse power of the machine?
(c) How many electrical phases does the machine have?
3 The run of the machines:
(a) How long do you expect to use your machine?
(b) How many hours is the machine designed to work?
4 Breakdown, motor rewinding and overhauling:
(a) How often do you get breakdowns within a year?
(b) Have you rewound the motor?
(c) How long did you use the motor before your rewinding?
(d) How many times have you rewound the motor?
(e) How much did it cost to rewind each time?
(f) Have you ever replaced the motor?
(g) Why did you replace it?
(h) How many months did you use the old motor before you replaced it?
(i) Horse power of new motor?
(j) How many phases does the new motor have?

306
(k) Is the "new" motor second hand or brand-new?
(l) How much did you buy the new motor?
(m) From which country does the new motor come from?
(n) How many times have you replaced the motor?
(o) Do you think the new motor is better than the old?
(p) Is there any other thing you have changed on the planing machine? (e.g. Rollers,
capacitors, cutterblock, bushes etc.)
(q) How many hours is this machine able to work after changing the motor?
5 Is it easy to find repairers? On average, how much do you spend to repair this machine?
6 (a) Output when motor had not been changed?
(b) Output after changing motor/overhauling?
7 How ease is it to operate this machine?
8 Are there any safety problems associated with using this machine?
9 Are you happy with the quality of output of the machine? How does it compare with other
machines?
10 Transfer/ purchasing process and financing
(a) From where or how did you buy the machine?
(b) Did you get guarantee?
(c) Did they provide any after sales service?

307
(d) How do you raise money to buy the machines? Do you use bank/microfinance loans?
(e) Apart from getting the machine from the supplier, do you have any other business
relationship with the suppliers? Could you describe this relationship? Does this
relationship help you any way in getting the equipment?
11 How many people normally operate this machine? How are they paid? How much do
you pay them?
12 How easy is it to get both machine and usable parts for this machine?
13 How do you get electricity supply? On average, how much do you spend per month on
electricity?
14 How much do you spend per month on rent?
15 (a) If you do machining services work, how much revenue are you able to make in month
on machine services?
(b) What percentage does this constitute out of all your monthly revenue
16 What challenges are you facing in your business?

308
A4: Questions for interviews with firms trading/supplying the machines
No. Questions
1 Name of the firms
2 Location/address of the firms
3 For how long has this business been in operation?
4 How many people work for you?
5 How many outlets do you operate in Kenya?
6 Please, describe the spread of your outlets across the country?
7 Is your firm a subsidiary of larger international firms? In which country is the head
company based? Who are the owners of the firm?
8 To what extent does your firm deal in metal and wood working equipment or
machines? (Ask for a rough proportion)
9 For how long have been selling Chinese equipment?
10 To what extent does your company deal in Chinese metal and wood working
equipment as compared to those from advanced countries? (Ask for a rough
proportion of the wares)
11 Apart from the Chinese equipment, do you also deal in equipment from other countries
including advanced countries?
12 Compared to equipment from advanced countries, to what extent would you say that
Chinese equipment has better demand than those from advanced countries?
13 Do you sell Chinese equipment (particularly metal and wood working equipment) in all
your outlets?
14 Do you provide after sales services to your customers? Please, can you describe
them?
15 How much guarantee (if any) are you able to provide on Chinese equipment? How
does this compare with advance countries' equipment?
16 How do you get your supplies?
17 Under what conditions do you get your supplies? What kind of agreement exits
between you and your suppliers?
18 Is your firm a subsidiary of the supplier? What kind of business relationship exists
between you and your supplier?
19 Is your supplier the manufacturer of the equipment? Do you have any idea about how
your supplier obtained the equipment?
20 Generally, to what extent do you advertise Chinese equipment compared to those from
advanced countries?
21 What problems do you encounter in purchasing your supplies locally or abroad?

309
22 Is there anything the government is doing to help you deal with these problems?
23 To what extent will you say that selling Chinese equipment brings more profit than
those from advanced countries?
24 Would say that selling Chinese equipment has enhanced your business? Has it helped
you to employ more people?