Ontario Low Water Response Groundwater Indicator Pilot ... · Ontario Low Water Response...
83
Ontario Low Water Response Groundwater Indicator Pilot Project Final Report By Rideau Valley Conservation Authority March 2009
Transcript of Ontario Low Water Response Groundwater Indicator Pilot ... · Ontario Low Water Response...

Ontario Low Water Response
Groundwater Indicator Pilot Project
Final Report
By
Rideau Valley Conservation Authority
March 2009

ii
Acknowledgements
This report was prepared by the Rideau Valley Conservation Authority in partnership with the
Province of Ontario, Ministry of Natural Resources, and Conservation Ontario.
The Rideau Valley conservation acknowledges and thanks the project team for their efforts in
preparation of this report. Special thanks are extended to the members of the technical
coordination and review team for their time and efforts. The project team also wishes to
acknowledge the contributions from the Ministry of Natural Resources, Ministry of
Environment, Ministry of Agriculture, Food and Rural Affairs, and Conservation Ontario staff.

iii
Table of Contents
ACKNOWLEDGEMENTS .......................................................................................................................................II
1. INTRODUCTION .............................................................................................................................................. 7
1.1. BACKGROUND ............................................................................................................................................. 7 1.2. STUDY OBJECTIVES ..................................................................................................................................... 8 1.3. SCOPE OF THE STUDY .................................................................................................................................. 8
2. GROUNDWATER TRIGGERS AND CALCULATION APPROACHES ................................................ 10
2.1. JACQUES WHITFORD (JW) METHOD .......................................................................................................... 10 2.2. PERCENTILE METHOD ............................................................................................................................... 11
3. GROUNDWATER MONITORING STATIONS ......................................................................................... 13
3.1. SELECTION OF MONITORING WELLS ......................................................................................................... 13 3.2. WELL-81 (W.A. TAYLOR PARK) ............................................................................................................... 17
3.2.1. Well Description .................................................................................................................................. 17 3.2.2. Geology & Hydrogeology .................................................................................................................... 17
3.3. WELL-83 (OMYA INDUSTRIAL PLANT SITE) ............................................................................................ 17 3.3.1. Well Description .................................................................................................................................. 17 3.3.2. Geology & Hydrogeology .................................................................................................................... 17
3.4. WELL-86 (LONG ISLAND PARK) ................................................................................................................ 18 3.4.1. Well Description .................................................................................................................................. 18 3.4.2. Geology & Hydrogeology .................................................................................................................... 18
3.5. WELL-156-2 (TWIN ELM BRIDGE) ............................................................................................................ 18 3.5.1. Well Description .................................................................................................................................. 18 3.5.2. Geology & Hydrogeology .................................................................................................................... 19
3.6. WELL-252 (CHRISTIE LAKE CAMP SITE) ................................................................................................... 19 3.6.1. Well Description .................................................................................................................................. 19 3.6.2. Geology & Hydrogeology .................................................................................................................... 19
4. GROUNDWATER LEVELS AND WEATHER TRENDS .......................................................................... 26
4.1. WELL-81 (W.A. TAYLOR PARK) ............................................................................................................... 26 4.1.1. Historical Water Levels and Rainfall Trends ...................................................................................... 26 4.1.2. Water Levels and Weather Conditions in 2008 ................................................................................... 26 4.1.3. Water Level Data Issues ...................................................................................................................... 27
4.2. WELL-83 (OMYA INDUSTRIAL PLANT SITE) ............................................................................................ 27 4.2.1. Historical Water Levels and Rainfall Trends ...................................................................................... 27 4.2.2. Water Levels and Weather Conditions in 2008 ................................................................................... 28 4.2.3. Water Level Data Issues ...................................................................................................................... 28
4.3. WELL-86 (LONG ISLAND PARK) ................................................................................................................ 29 4.3.1. Historical Water Levels and Rainfall Trends ...................................................................................... 29 4.3.2. Water Levels and Weather Conditions in 2008 ................................................................................... 29 4.3.3. Water Level Data Issues ...................................................................................................................... 30
4.4. WELL-156-2 (TWIN ELM BRIDGE) ............................................................................................................ 30 4.4.1. Historical Water Levels and Rainfall Trends ...................................................................................... 30 4.4.2. Water Levels and Weather Conditions in 2008 ................................................................................... 31 4.4.3. Water Level Data Issues ...................................................................................................................... 31
4.5. WELL-252 (CHRISTIE LAKE CAMP SITE) ................................................................................................... 31 4.5.1. Historical Water Levels and Rainfall Trends ...................................................................................... 32 4.5.2. Water Levels and Weather Conditions in 2008 ................................................................................... 32 4.5.3. Water Level Data Issues ...................................................................................................................... 33
5. DETERMINATION AND COMPARISON OF GROUNDWATER TRIGGERS .................................... 42
5.1. WELL-81 (W.A. TAYLOR PARK) ............................................................................................................... 42 5.1.1. Indicators and Triggers ....................................................................................................................... 42

iv
5.1.2. Application ........................................................................................................................................... 42 5.2. WELL-83 (OMYA INDUSTRIAL PLANT SITE) ............................................................................................ 46
5.2.1. Indicators and Triggers ....................................................................................................................... 46 5.2.2. Application ........................................................................................................................................... 46
5.3. WELL-86 (LONG ISLAND PARK) ................................................................................................................ 50 5.3.1. Indicators and Triggers ....................................................................................................................... 50 5.3.2. Application ........................................................................................................................................... 50
5.4. WELL-156 (TWIN ELM BRIDGE) ................................................................................................................ 54 5.4.1. Indicators and Triggers ....................................................................................................................... 54 5.4.2. Application ........................................................................................................................................... 54
5.5. WELL-252 (CHRISTIE LAKE CAMP SITE) ................................................................................................... 58 5.5.1. Indicators and Triggers ....................................................................................................................... 58 5.5.2. Application ........................................................................................................................................... 58
5.6. COMPARISON OF TRIGGERS, INDICATORS AND CALCULATION APPROACHES ............................................ 62 5.6.1. Triggers and Indicators ....................................................................................................................... 62 5.6.2. Calculation Approaches ...................................................................................................................... 64
6. CONCLUSIONS AND RECOMMENDATIONS ......................................................................................... 66
7. REFERENCES ................................................................................................................................................. 69
APPENDICES Appendix A – PGMN Well Logs ................................................................................................................ 66
Appendix B – Well Photos ......................................................................................................................... 72
Appendix C – Budget and Expenses ........................................................................................................... 78

v
List of Figures Figure 3-1: Rideau Valley Watershed and locations of PGMN Stations...................................... 20 Figure 3-2: Location of Well-81 close to Rideau River at W.A.Taylor Park. .............................. 21 Figure 3-3: Location of Well-83 close to Tay River at OMYA site. ............................................ 22 Figure 3-4: Location of Well-86 on Rideau River at Long Island Park. ...................................... 23 Figure 3-5: Location of Well-156 on Jock River at Twin Elm Bridge. ........................................ 24
Figure 3-6: Location of Well-252 on Christy Lake at Christy Lake Camp site. .......................... 25 Figure 4-1: Yearly rainfall variations for 2001-2008. ................................................................. 35 Figure 4-2: Comparison of monthly rainfall for the year 2001-2008 ........................................... 36 Figure 4-3: Water level trends in Well-81. ................................................................................... 37
Figure 4-4: Water Level Trends in Well-83. ................................................................................ 38 Figure 4-5: Water level trends in Well-86. ................................................................................... 39 Figure 4-6: Water level trends in Well-156. ................................................................................. 40
Figure 4-7: Water level trends in Well-252. ................................................................................. 41 Figure 5-1: Comparison of groundwater indicators based on Jacques Whitford and Percentile
methodologies for Well-81. .......................................................................................................... 45 Figure 5-2: Comparison of groundwater Jacques Whitford & Percentile indicators with water
levels form Well-81. ..................................................................................................................... 45 Figure 5-3: Comparison of groundwater indicators based on Jacques Whitford and Percentile
methodologies for Well-83. .......................................................................................................... 49
Figure 5-4: Comparison of groundwater Jacques Whitford & Percentile indicators with water
levels form Well-83. ..................................................................................................................... 49 Figure 5-5: Comparison of groundwater indicators based on Jacques Whitford and Percentile
methodologies for Well-86. .......................................................................................................... 53
Figure 5-6: Comparison of groundwater Jacques Whitford & Percentile indicators with water
levels form Well-86. ..................................................................................................................... 53
Figure 5-7: Comparison of groundwater indicators based on Jacques Whitford and Percentile
methodologies for Well-156-2. ..................................................................................................... 57 Figure 5-8: Comparison of groundwater Jacques Whitford & Percentile indicators with water
levels form Well-156-2. ................................................................................................................ 57 Figure 5-9: Comparison of groundwater indicators based on Jacques Whitford and Percentile
methodologies for Well-252 ......................................................................................................... 61
Figure 5-10: Comparison of groundwater Jacques Whitford & Percentile indicators with water
levels form Well-252. ................................................................................................................... 61

vi
List of Tables Table 2-1: On-Set and Recovery of Low Water Conditions. ........................................................ 11 Table 2-2: Percentiles Based Triggers and associated groundwater Conditions (MOE 2008)..... 12 Table 3-1: Wells Characteristics and Rationale for Selection. ..................................................... 15 Table 3-2: Well Locations and Elevations. ................................................................................... 16 Table 4-1: Monthly rainfall for the years 2001 to 2008................................................................ 34
Table 4-2: Monthly water level for low rainfall years. ................................................................. 34 Table 4-3: Monthly water levels for 2008. ................................................................................... 34 Table 5-1: Percentile Method Results for Well-81. ...................................................................... 44 Table 5-2: Comparison of JW & Percentile Indicators with Water Levels from Well-81. .......... 44
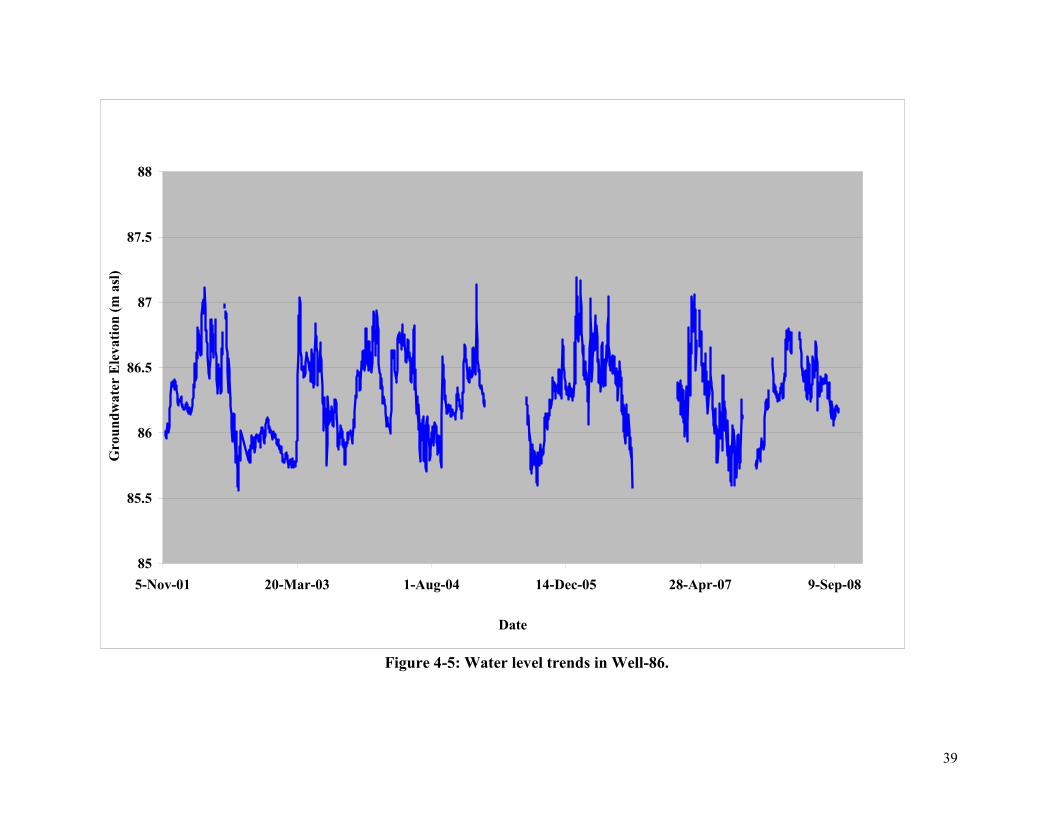
Table 5-3: Percentile Method Results for Well-83. ...................................................................... 48 Table 5-4: Comparison of JW & Percentile Indicators with Water Levels from Well-83. .......... 48 Table 5-5: Percentile Method Results for Well-86. ...................................................................... 52
Table 5-6: Jacques Whitford Method Results for Well-86. .......................................................... 52 Table 5-7: Percentile Method Results for Well-156-2. ................................................................. 56 Table 5-8: Jacques Whitford Method Results for Well-156-2...................................................... 56 Table 5-9: Percentile method Results for Well-252. .................................................................... 60
Table 5-10: Jacques Whitford Method Results for Well-252 ....................................................... 60

7
1. Introduction
This report presents the results of a study for the use of Provincial Groundwater Monitoring
Network (PGMN) wells as indicators of climate change and low water conditions (Level I, II and
III indictors) for applicability to the Ontario Low Water Response (OLWR) program. The report
also presents an overview of the information that has been collected and used by Rideau Valley
Conservation Authority (RVCA) in assessing the utility of the indicators such as water levels,
description and characteristics of the selected wells, methods used to determine the groundwater
indicators and issues associated with the groundwater data used in the project. The report also
presents a comparison of the groundwater triggers based on two methodologies, namely the
Jacques Whitford methodology described in their report titled “Groundwater Indicator Study”
and the percentile based methodology proposed by the Ministry of Environment (MOE).
This study, which tests the use of wells and groundwater levels as potential indicators of low
water conditions, has been funded by the Ontario Ministry of Natural Resources (MNR). A
project budget and expense report is attached in Appendix C.
1.1. Background
Changing weather patterns associated with climate change can result in periods of drought, heat
waves, and more frequent storm events. Both drought and storm events can be fairly localized,
resulting in local impacts on water supplies, agriculture, wetlands etc. Extremely dry conditions
in 1998 and 1999 in Ontario resulted in the development of the OLWR- Ontario Low Water
Response Plan (revised July 2003). OLWR is intended to ensure provincial preparedness, to
assist in coordination and to support local response in the event of drought. The advisories issued
under the OLWR protocols also keep the public informed of the developing drought conditions
within a watershed. Currently OLWR uses precipitation and flow as indicators for drought
events. However, the need for baseflow, groundwater and aquifer level indicators have also been
identified in OLWR Program (revised July 2003).
Since groundwater is impacted by changes in the weather conditions to varying degrees, it can be
a useful indicator in addition to precipitation and stream flow. The MNR commissioned Jacques
Whitford to conduct a study for the use of groundwater as an indicator and to develop a
methodology for determining groundwater trigger levels at PGMN wells for potential use as
Level I, II and III indicators for OLWR. This study resulted in a report, the Jacques Whitford
Groundwater Indicator Report (2008), which defined two trigger levels and described how to use
these to determine when a watershed is at a Level I, II or III condition. A number of conservation
authorities were involved in the Groundwater Indicator study, supplying data and information.
One of the outcomes of the project was the development of a spreadsheet tool used to calculate
the groundwater indicator values at groundwater well sites. The tool was used to calculate the
indicator values for five specific sites. These sites are located in the Ganaraska, Long Point,
Rideau, South Nation, and Upper Thames conservation authorities.
The Jacques Whitford method is based on statistical diagnostics (mean and standard deviation)
of the groundwater levels collected from the PGMN monitoring wells. The Ministry of
Environment has developed another method for calculating groundwater indicators using the
percentile methodology. Applying this method to groundwater levels, triggers or conditions for

8
low water response is based on setting the triggers at specified percentiles (e.g. 5th, 10th or 50th
percentiles). In general, the 25th to 75th percentile range is considered as normal to above
normal, the 10th
to 25th
percentile range is considered dry (or drought watch), and below the 10th
or 5th percentile is considered extremely dry conditions in a water well.
In the current study, the approaches for developing groundwater indicators and triggers are not a
focus of discussion. Rather, the direct application of the noted approaches has been undertaken to
determine the indicators for selected wells. Further details on the two methods can be found in
the following two reports:
1. Guidance Document for Using the Percentile Method for Calculating Trigger Levels for
Groundwater for the Ontario Low Water Response Plan., Ministry of Environment,
March 2008 (MOE 2008).
2. FINAL REPORT: Develop a Groundwater Indicator for Ontario Low Water Response,
Ontario Ministry of Natural Resources, 2008 (JW 2008).
The above mentioned documents are also used in the preparation of this report to provide
conceptual background for the methods used.
The source of the groundwater level data used for calculating groundwater indicators and
triggers (based on the two methodologies mentioned above) in the study were the groundwater
monitoring wells that form the Provincial Groundwater Monitoring Network (PGMN) in
Ontario. In the Rideau Valley Conservation Authority, there are 15 groundwater monitoring
stations (Figure 3-1) and five of these stations were selected for the purpose of this study.
1.2. Study Objectives
The purpose of the study is to evaluate the utility of the groundwater indicators for the Ontario
Low Water Response Program and to assess whether these can be used to report on developing
low water conditions in an area represented by water well or an aquifer in Rideau Valley
Watershed.
1.3. Scope of the Study
The study will determine groundwater triggers and indicators using two approaches and apply
the results to establish if low level water conditions are developing in the monitoring wells. More
specifically the study will:
1. Present an overview of the two approaches used for developing the groundwater triggers.
2. Identify the PGMN wells for use in the study.
3. Discuss the characteristics of the selected well sites.
4. Analyze the groundwater level data and calculate the triggers based on the JW approach
and the Percentile approach.
5. Collect the water levels from the selected wells between July-October 2008.
6. Compare the collected water levels to the indicators and triggers to establish whether low
water conditions are developing in selected wells. If the observed water levels in 2008
are representative of normal aquifer conditions, then historical water levels observed in a

9
low rainfall year (2001, 2003 or 2007) will be used to establish whether low water level
conditions are developing based on groundwater indicators inferred by the two
approaches.
7. Evaluate the utility of the groundwater indicators to the Ontario Low Water Response
Program, and whether these can be used to report on the developing low water conditions
in areas represented by water wells or aquifers (as per Ontario Low Water Response
(OLWR) Level I, II and III indicators for groundwater).
8. Compare the two approaches in terms of ease of use, data requirements, level of effort
required and requirements of expertise for undertaking the analysis.
9. Identify the limitations in implementing the approaches, if any.
10. Document the data gaps, issues, etc. with groundwater data.
Following completion of the above mentioned tasks, study findings and recommendations will
be presented.

10
2. Groundwater Triggers and Calculation Approaches
This section briefly discusses the groundwater triggers and associated conditions based on the
Jacques Whitford approach and the Percentile approach. The groundwater levels from the
monitoring wells were compared with the triggers developed through the two approaches to
assess the development of low water conditions in aquifers or in areas represented by monitoring
wells.
2.1. Jacques Whitford (JW) Method
The proposed groundwater low water indicator is based on the recognition that groundwater
levels fluctuate on a seasonal cycle under normal conditions. Triggers are specific groundwater
indicator values (i.e., monthly average groundwater levels) for activating the Ontario Low Water
Response Program (OLWR) condition levels (i.e., Level I, Level II, and Level III). Two Trigger
values have been developed for this method, which act as specific groundwater indicator values
for activating the OLWR levels. The Triggers (i.e. Trigger 1 and 2) are based on monthly
average groundwater levels. The JW approach assumes that groundwater levels follow a seasonal
pattern that occurs every 12 months and that variation in daily groundwater levels are
symmetrically distributed about the mean value, i.e. in a distribution that resembles the normal
distribution. The triggers are described below.
The Trigger 1 value for a well is defined as the mean groundwater level in a month minus the
standard deviation of daily-average water levels for that month. The Trigger 2 value for a well is
defined as the extreme low groundwater level below which environmental, social and economic
impacts are expected to occur. This value must be selected for each monitoring well based on
the terminating depth of the well, properties of the aquifer, and characteristics of the groundwater
users that depend on the resources monitored by the well. If this information is unavailable, a
default value for the Trigger 2 level can be taken as the value of the lowest daily average level
that has been observed in the well.
The Table 2-1 shown below highlights the application of Trigger levels, and demonstrates the
circumstances that must take place in order to activate a Level I, Level II or Level III Low Water
Condition, and also the circumstances for recovery from Low Water Conditions. In all cases, the
term “30-day average” refers to the 30-day average groundwater level for a particular well, and
the term “Daily average” refers to the daily average groundwater level for all measurements
recorded on the same day, for a particular well.
The indicators and triggers calculated using the JW methodology are discussed in Section 5 of
this report.

11
Table 2-1: On-Set and Recovery of Low Water Conditions.
OLWR Level Conditions for On-Set Conditions for Recovery
“No Advisory” 30-day average remains above
Trigger 1
30-day average remains above
Trigger 1
Level I – the first indication of
a potential water supply
problem.
30-day average falls below
Trigger 1
30-day average rises above
Trigger 1 for three months in a
row
(and)
Daily average rises above
Trigger 2 for all of the days in
the previous month
Level II – indicates a
potentially serious problem.
30-day average falls below
Trigger 1 for three months in a
row
(or)
Daily average falls below
Trigger 2 for at least one day
in the previous month
30-day average rises above
Trigger 1
(and)
Daily average rises above
Trigger 2 for all of the days in
the previous month
Level III – indicates the failure
of the water supply to meet the
demand, resulting in
progressively more severe and
widespread socioeconomic
effects.
30-day average falls below
Trigger 2
30-day average rises above
Trigger 2
2.2. Percentile Method
The percentile approach for establishing groundwater triggers is consistent with the kind of
approach taken to establish other OLWR triggers based on precipitation and streamflow
indicators. A percentile is a value on a scale of 0 to 100 that indicates the percent of the number
of observations that is equal to or below it. For example, the 50th
percentile is the value (or score)
below which 50 percent of the observations may be found. The groundwater triggers and
associated conditions based on this approach are given in the following table:

12
Table 2-2: Percentiles Based Triggers and associated groundwater Conditions (MOE 2008).
Percentile
(percentage of values
below)
Trigger or Condition Description
100 Maximum Maximum water level
75 Above normal Above normal or wet
conditions
50 Normal or median Normal conditions
25 Trigger 1 Below normal or drought
watch
10 Trigger 2 Dry conditions or drought
warning
5 Trigger 3 Very dry
0 Minimum Minimum water level
The measured water levels are compared to the 25th
percentile to determine Trigger 1 (OLWR
Level I), 10th
percentile to determine Trigger 2 (OLWR Level II) and 5th
percentile to determine
Trigger 3 (OLWR Level III). A well will be considered normal if the measured water levels
are between 25th
to 75th
percentile range, in Level I or under drought watch if the levels are
between 10th
to 25th
percentile range, in Level II or in dry conditions if levels are between 5th
to
10th
percentile, and in level III or very dry conditions if the levels fall below the 5th
percentile.
As an example, if the measured water levels for a particular period are above the 25th
percentile,
the comparison with percentile and trigger levels (Table 2-2) will indicate that normal
groundwater conditions exist within the well during the period under consideration and the
aquifer is not suffering from low water conditions as a result of climate change or other factors.
The indicators and triggers calculated using the percentile approach are discussed in Section 5 of
this report.

13
3. Groundwater Monitoring Stations
In the Rideau Valley Conservation Authority, there are 15 wells (Figure 3-1) being monitored
(for groundwater levels and water quality) as part of the Provincial Groundwater Monitoring
Network (PGMN) in Ontario. Five of these stations have been selected for testing the Jacques
Whitford (JW) approach and the Percentile approach, for applicability to the Ontario Low Water
Response program. A brief description of each monitoring well, site characteristics and rationale
for their selection has been discussed in this section. The well logs and photos for the selected
wells are attached in Appendix A and B of the report.
3.1. Selection of Monitoring Wells
Out of fifteen (15) wells being monitored within the Rideau Watershed, only five (5) were
selected for the purposes of this study. This selection was based on the following factors:
1. Length of the water level record available from the wells. Selected well should have
continuous long term (3 to 5 years) water level measurements to better reflect the
behavior of the aquifer in response to the changing weather patterns (to establish
normals and extremes).
2. Water levels during a reference dry year(s) or drought year(s) are available for
comparison. It is critical that the available water level data be representative of a dry
year(s) or a season(s) during which drought conditions were observed (and caused
economical, environmental, social etc. impacts) in an aquifer (as shown by
monitoring wells or area wells going dry, or exhibiting extremely low water levels
etc.). This will ensure the correct interpretation of the triggers, and support the
manipulation of the trigger values, if required.
3. Quality of collected data is good and gaps in the data records are minimal. There
should be minimal gaps in the data record so that the seasonal water level fluctuations
are accurately represented. Also, the water levels collected by the automatic data
loggers such as those used in the PGMN may include some inaccuracies (outliers
etc.). It is necessary that the manual water level measurements also be available (from
the wells) in order to capture the inaccuracies and to ensure that the data is reliable.
Also, any unexplainable water level fluctuations such as spikes etc. due to equipment
malfunctions, equipment replacements should be explainable.
4. Well or water levels are responsive to the seasonal weather changes. There should be
good correlation between the water level fluctuations in the well and the rainfall
events in order to ensure that the well is suitable to register extreme climate change
events such as drought etc. It is critical to understand the degree of “lag” between a
rainfall event and corresponding water level fluctuation in a well to make an
assessment of the groundwater conditions and the application of triggers.
5. Geology and hydrogeology of the well site is known. The selected well should at least
have a well log, well record etc. This will ensure accurate understanding of the
groundwater dynamics for interpreting the aquifer response and for application of the
groundwater triggers.

14
6. Hydraulic interconnectivity and surface influences are understood. The influences on
wells from rivers, streams, wetlands, etc. and recharge-discharge characteristics of the
site need to be clearly understood so that well (aquifer) behavior is accurately
interpreted. The comparison with stream flows records (from the gauge stations
located nearby) could provide a useful insight into the potential of hydraulic
interconnectivity with the surface influences. However, this analysis was not
undertaken in the current study.
7. Type of the well is known. Deeper wells, such as those drilled into regional aquifers
(Sandstone aquifer etc.), may not show any response to the changing weather
patterns, or may show the impacts of climate change in terms of lower water levels
but due to ample storage, they are able to better withstand the drought or low water
conditions. On the other hand, shallower wells may be prune to more frequent water
shortages due to even slight water level changes as they have far less borehole storage
as compared to the deeper wells. Such wells (too deep or too shallow) were not
considered suitable for this study since the water level changes in these well will not
necessarily translate into the impacts (drought etc.) on the surroundings environment.
8. The well is representative of the aquifer in use in the area so that the well or aquifer
users can be informed of the developing low water conditions.
9. Information on the surrounding land use is available. The inventory of the
surrounding land use around the well site is necessary for understanding whether
factors other than the weather changes (water takings, etc.) are impacting the water
levels.
10. Well is accessible. The selected well should be readily accessible so that manual
water level measurements etc. can be performed or other site investigations could be
undertaken, if required, to better understand the local aquifer.
The characteristics of the selected wells are discussed individually in the following paragraphs
along with additional details on the rationale for their selection (Table 3-1 and Table 3-2).
15
Table 3-1: Wells Characteristics and Rationale for Selection.
Well ID New/
Existing
Geology Owner-
ship
Location Rationale
General Municipality
Well-81 Existing Clay
overlying
dolostone
(Oxford
Formation)
RVCA W.A.
Taylor
Park
Ottawa This well is tapping a contact
zone aquifer and is located
between two branches of the
Rideau River. By comparing the
groundwater levels with the
Rideau water levels/flows,
recharge conditions between the
shallow and deep aquifers and
their interconnections with the
Rideau could be deciphered, if
any. If there is direct hydraulic
interconnection, then this well
will reflect the effects of climate
change on river flows and
recharge to the aquifers. This
well is not considered to be under
any water taking influences.
Well-83 Existing Precambrian
bedrock
underlying
sandstone
(Nepean
Formation)
RVCA OMYA Tay Valley A substantial amount of
groundwater is being extracted
from wells at OMYA.
Groundwater quantity is an issue
in the surrounding area, which
could be worsened by droughts
and dry seasons. Therefore,
information regarding impacts of
weather changes on ambient
groundwater levels would be
valuable to determine whether
drought conditions can develop in
this well and the area represented
by this well.
Well-86 Existing Clay and
gravel
overlying
dolostone
(Oxford
Formation)
RVCA Long
Island
Park
Ottawa The groundwater quantity of the
private wells along Long Island is
in question. Water levels from
this well could help to detect
potential groundwater shortages
as a result of climate change.
Well-156-
2
New Champlain
Sea deposits
(marine clay
and gravel
layers)
overlying
dolostone
(Oxford
RVCA Twin
Elm
Bridge
Ottawa During the dry season, the
shallow groundwater from the
agricultural area north of the Jock
River contributes to the baseflow
of the river. From the water level
readings, it may be possible to
forecast the effect of climate
change on the shallow aquifer and

16
Formation) the river water level/discharge.
Well-252 New Precambrian
Granite
RVCA Christie
Lake
Club
Tay valley This well is located very close to
a lake, where population is
scattered along valleys between
tectonic ridges. Water level
observations will help to
understand groundwater supply
behavior as well as potential
climate change impacts in low-
yielding Precambrian rocks.
Table 3-2: Well Locations and Elevations.
Well
ID
MOE
Well ID Location Easting Northing
Top of
Casing
Elevation
(m.a.s.l)
Ownership
(Well/
Land)
Lot Conc.
Current
(Former)
Township
Well-81 W0000081
W.A.
Taylor
Park
450190 4998110 91 RVCA 28 Broken
Front
City of
Ottawa
(Osgoode)
Well-83 W0000083
OMYA
Industrial
Plant Site
395523 4969770 146 Private 18 3 Tay Valley
Well-86 W0000086
Long
Island
Park
444923 5010463 93 RVCA City of
Ottawa
Well-
156-2
(shallow)
W0000156-
2
Twin Elm
Bride 436497 5009067 107
RVCA/City
of Ottawa 12 5
City of
Ottawa
Well-252 W0000252
Christie
Lake
Camp Site
386698 4961094 180 RVCA/
Private 19 2 Tay Valley

17
3.2. Well-81 (W.A. Taylor Park)
3.2.1. Well Description
This well is located in the W.A. Taylor Conservation Area (owned by the RVCA) along the east
bank of the Rideau River, approximately 1.5 km west of the community of Osgoode (Figure
3-2). The distance between the well and the river to the west is approximately 100 m. A park
area surrounds the well, while the land use fewer than 100 m to the east is agricultural. The well
was pre-existing when it was selected as a PGMN well. A well photo is provided in Appendix B.
This well was a part of the Jacques Whitford 2008 Groundwater Indicator Study. The
groundwater triggers calculated by the mentioned study for this well have been updated based on
the recently available water level data.
A summary of well characteristics and rationale for including this well in the groundwater
indicator study has been provided in Table 3-1. Well location description has been summarized
in Table 3-2.
3.2.2. Geology & Hydrogeology
The well (Log 1, Appendix A) was assumed to correspond to the MOE Well Record ID
1516562. The well record described Well-81 as having approximately 14 m of clay, underlain
by 7 m of material (“hardpan”) interpreted to be glacial till, all of which overlies the dolostone of
the Oxford Formation. The fine-grained overburden materials are inconsistent with geology
maps which suggest the presence of fine- to-medium-grained glaciomarine sand deposits;
however, glaciomarine clay, silt and till deposits have been mapped nearby.
The well record indicates that the water-bearing zone of the bedrock aquifer was encountered at
approximately 36 m below the top of the dolostone unit. The PGMN well reaches 54.3 m depth
below ground surface (bgs) and well construction consists of a steel casing through the
overburden to 21.6 m and an open hole in the bedrock.
3.3. Well-83 (OMYA Industrial Plant Site)
3.3.1. Well Description
This well is located 6 km southwest of the town of Perth near the fabrication plant of OMYA, a
producer of calcium carbonate and talc (Figure 3-3). The OMYA plant is approximately 500 m
northwest of the well; otherwise the surrounding land use is a combination of forest, agriculture
and rural settlement. The Tay River passes approximately 800 m southeast of the well, while a
tributary stream to the river flows 250 m north of it. The well was pre-existing when it was
selected as a PGMN well and is located on land owned by OMYA. A well photo is provided in
Appendix B.
A summary of well characteristics and rationale for including this well in the groundwater
indicator study has been provided in Table 3-1. Well location description has been summarized
in Table 3-2.
3.3.2. Geology & Hydrogeology
The well (Log 2, Appendix A) was assumed to correspond to MOE Well Record ID 3511815
since the original well record was not available. The stratigraphy described in that record

18
consisted of approximately 1.2 m of topsoil underlain by 19.5 m of sandstone (Nepean
Formation). Below the sandstone, the material was interpreted to be 25.0 m of Precambrian
granite bedrock (described in the well record as black sandstone and grey-red sandstone).
The well was constructed with a steel casing to 6.7 m and an open hole to 45.7 m in the granite.
According to the well record, water-bearing zones were encountered at around 21.9 m (near the
interface of the sandstone and granite units) and 43.0 m. As a result, the groundwater in the well
may represent the characteristics of both units.
3.4. Well-86 (Long Island Park)
3.4.1. Well Description
This well is located on Long Island in the community of Manotick, which is incorporated in the
City of Ottawa. More specifically, the well is located in the 35-acre David Bartlett Park (Long
Island Park) on the northern tip of the island, which is on the Rideau River (Figure 3-4). Beyond
the limits of the park, the island is populated by suburban settlement. The west channel of the
Rideau River is within 90 m of the well. The well is located on land owned by the City of
Ottawa and was pre-existing when it was selected as a PGMN well. A well photo is provided in
Appendix B.
A summary of well characteristics and rationale for including this well in the groundwater
indicator study has been provided in Table 3-1. Well location description has been summarized
in Table 3-2.
3.4.2. Geology & Hydrogeology
Since the log of the PGMN well was not available, its stratigraphy (Log 3, Appendix A) was
assumed from the water well record for a nearby well (MOE Well Record ID 1505910). The
nearby well’s stratigraphy was described as approximately 17.7 m of clay underlain by gravel to
18.3 m. The well depth is 18.9 m, and the well construction consists of a steel casing through the
overburden and an open hole in the bedrock below the gravel formation. Geological mapping
shows that the local overburden consists of glaciomarine silt and clay deposits, and the bedrock
is dolostone of the Oxford Formation.
3.5. Well-156-2 (Twin Elm Bridge)
3.5.1. Well Description
This well is located on the west bank of the Jock River approximately 900 m downstream of the
Twin Elm bridge (Cambrian Road) and 5 km northeast of the community of Richmond (Figure
3-5). The well is located approximately 15 m from the river on land owned by the City of
Ottawa, and was drilled in 2002 in conjunction with the PGMN program. The dominant land use
in the area surrounding the well is agriculture. A well photo is provided in Appendix B.
A summary of well characteristics and rationale for including this well in the current study has
been provided in Table 3-1. The well location description has been summarized in Table 3-2.

19
3.5.2. Geology & Hydrogeology
This is a multi-level monitoring well, however only the overburden level (shallow well) has been
incorporated into this study. A borehole log (Log 4) is provided in Appendix A. The geologic
materials recorded at the site consist of approximately 18.3 m of clay (described in geological
maps as glaciomarine deposits), underlain by gravel with sand and boulders to 26.2 m bgs
followed by dolostone bedrock of the Oxford Formation. The well record indicates that water
was encountered during drilling at approximately 26 m bgs (at the overburden-bedrock interface)
and 46 m bgs (in the bedrock). A metal casing was installed through clay, and a multi-level
monitoring well was installed in the water-yielding units below, with screen of the shallow well
(Well 156-2, shallow) from approximately 18.3 to 25.9 m bgs in the gravel and another from
33.5 m to 42.7 m bgs in the dolostone (Well 156-3, deep). Most wells in the area tap either the
overburden/contact aquifer or the dolostone aquifer, both of which are represented by this
PGMN well.
3.6. Well-252 (Christie Lake Camp Site)
3.6.1. Well Description
This well is located on private land along the south shore of Christie Lake (Figure 3-6), 18 km
southwest of Perth, and was drilled in 2002 in conjunction with the PGMN program. The lake is
approximately 300 m from the well. The dominant land cover in the area is forest, although
there is a concentration of permanent or seasonal residences along the lakeshore. A well photo is
provided in Appendix B.
A summary of well characteristics and rationale for including this well in the groundwater
indicator study has been provided in Table 3-1. Well location description has been summarized
in Table 3-2.
3.6.2. Geology & Hydrogeology
The well (Log 5, Appendix A) corresponds to MOE Well Record ID 3513962 which describes a
thin layer (1 m) of topsoil overlying Precambrian granite bedrock to 31 m. Well construction
consisted of a steel casing to 6.7 m, below which was an open hole in the bedrock. The well
record indicates that water was encountered during drilling at approximately 23 and 26 m bgs,
suggesting that the fractured, water-yielding portion of the bedrock aquifer is confined by the
less-fractured material above.

20
Figure 3-1: Rideau Valley Watershed and locations of PGMN Stations.

21
Figure 3-2: Location of Well-81 close to Rideau River at W.A.Taylor Park.

22
Figure 3-3: Location of Well-83 close to Tay River at OMYA site.

23
Figure 3-4: Location of Well-86 on Rideau River at Long Island Park.

24
Figure 3-5: Location of Well-156 on Jock River at Twin Elm Bridge.

25
Figure 3-6: Location of Well-252 on Christy Lake at Christy Lake Camp site.

26
4. Groundwater Levels and Weather Trends
The water level data from five groundwater monitoring wells that are a part of the Provincial
Groundwater Monitoring Network (PGMN) in Ontario has been used for testing the Jacques
Whitford approach and the Percentile approach, for applicability to the Ontario Low Water
Response program. This section discusses the water level data collected from the selected wells,
data issues, and rainfall trends.
4.1. Well-81 (W.A. Taylor Park)
This well is located approximately 100 m from Rideau River. The well encountered 14 m of
clay and 7 m of glacial till overlying dolostone bedrock of the Oxford Formation. The well is
about 57 m deep and terminates in the bedrock. The well steel casing extends into the bedrock
therefore this well is considered a bedrock monitoring well. A borehole log (Log 1) is provided
in Appendix A of the report.
4.1.1. Historical Water Levels and Rainfall Trends
This station became operational in 2001. Water level data from Nov. 2001 to Mar. 2008 (Figure
4-3) collected from this well was used to determine the indicators and triggers as per the two
approaches discussed in section 2 of the report. Seasonal water level trends are consistent with
weather related events, and generally include a marked increase in mid-March to early April,
followed by a slow but progressive decline from mid-June to September/October, moderate
increases in the autumn, and another slow decline from January to March.
Accounting for the historical rainfalls for years 2001 to 2008, lower than average rainfall
conditions for the months of April to October were observed in 2001 and to some degree in 2003
and 2007. The water level trend observed during these years especially for months of April to
October is considered to be reflective of the dry weather conditions or low water conditions in
the aquifer. Monthly rainfalls for the years 2001-2008 are shown in Table 4-1. A graphic
comparison of the rainfall data is shown in Figure 4-1 and Figure 4-2.
As the Table 4-1 shows, the year 2001 was relatively drier than the years 2003 and 2007 (for
April to October). However, water level data between April and October for the year 2001 was
not available from this well as the monitoring station was not operational. Therefore, the water
levels observed in year 2007 were considered to be reflective of the low water conditions (Table
4-2). The year 2003 water level data was not used in comparisons as the cumulative rainfall for
the months of April to October was higher than the year 2007 rainfall for the same months.
4.1.2. Water Levels and Weather Conditions in 2008
The monthly averages of daily water level data from April 2008 to mid of August 2008 (Table
4-3) were used for comparison with the indicators and to determine if the well was developing
dry or low water conditions. The level logger malfunctioned in August 2008 and therefore the
daily water level data was not available. However, the manual water level data (bi-weekly
manual measurement of water levels) collected between July and October 2008 was available.
Therefore, the manual water levels for September and October were used in testing of triggers
and indicators.

27
The water level trend between the months of April to October 2008 is consistent with the
weather events and seasonal variations. Based on the monthly rainfalls noted in the months of
April to October 2008 (Table 4-1) and comparing with the 2001 rainfalls for the same months,
dry weather conditions or low water conditions in the aquifer were not encountered in 2008. The
daily water levels (Table 4-3) also did not show any indication of stress or unusually low values,
indicating that levels in the noted months are representative of a normal or above normal water
level trend (i.e. water levels are not impacted by dry weather conditions such as those observed
in 2001). In fact, the water levels observed in the month of April were the highest ever noted.
Therefore, it was not possible to test the groundwater indicators and triggers determined for this
well on the 2008 groundwater levels for use as the OLWR indicator. However, as discussed
earlier, the water levels observed for the year 2007 for the April to October months (Table 4-2)
from this well are considered to be representative of low water conditions in aquifers, and were
used for testing the suitability of inferred groundwater triggers and indicators.
The comparison of 2008 and 2007 water levels with the indicators and triggers (based on two
approaches) is presented in Section 5 of this report.
4.1.3. Water Level Data Issues
The following issues were noted in the water level data for this well:
1. Water level data between April and October 2001 is not available as the well was not in
operation.
2. The water levels in 2006 and 2007 were affected by the barometric pressure-related error.
3. Missing water level data in June/July 2005 and Oct/Nov 2007 due to logger failure.
4. Unexplainable “spikes and lows” in the water levels which do not correspond to seasonal
variations, maintenance activities, pumping events, instrument malfunctions etc.
5. Water levels between August and October 2008 are missing as the level logger
malfunctioned in August 2008.
4.2. Well-83 (OMYA Industrial Plant Site)
This is a bedrock monitoring well. This well is 45.7 m deep and terminates in the Granite
bedrock. About 1.2m of overburden and 19.5m of Sandstone bedrock overlies the Granite
bedrock. A borehole log (Log 2) is provided in Appendix A of the report.
4.2.1. Historical Water Levels and Rainfall Trends
Water level measurement made during years 2001-2007 were used in the analysis. Water level
trends are shown in Figure 4-4. The seasonal trends in water levels were relatively inconsistent
from year to year. An offset of approximately 2.8 m in the 2005 and onwards water level data
(relative to previous years’ data) suggested that the depth of the water level datalogger in the
monitoring well had been changed on January 17, 2005 without the appropriate adjustment to the
raw data. As a result, a correction factor was estimated using available manual water level
measurements from before and after the datalogger depth change. This factor was applied to all
data collected after January 17, 2005. All water level data shown in Figure 4-4 has undergone
this correction.

28
There were several instances in 2003 through early 2008 in which the water level readings in the
well were beyond the range of the datalogger. The out-of-range data were omitted from the
analysis.
Accounting for the historical rainfalls for years 2001 to 2008, lower than average rainfall
conditions for the months of April to October were observed in 2001 and to some degree in 2003
and 2007. The water level trends observed during these years, especially for the months of April
to October are considered to be reflective of dry weather conditions or low water conditions in
the aquifer. Monthly rainfalls for the years 2001-2008 are shown in Table 4-1. A graphic
comparison of the rainfall data is shown in Figure 4-1 and Figure 4-2. As Table 4-1 shows, the
year 2001 was relatively drier than the years 2003 and 2007 (for April to October months). The
cumulative rainfall for the months of April to October for year 2003 is slightly higher than the
year 2007 rainfall for the same months. However, water level data between April and October
for the year 2001 was not available as the well was not in operation. A large part of the water
level data for the year for 2007 were missing due to equipment malfunctions. Therefore, year
2003 water levels (Table 4-2) are considered to be reflective of the low water conditions in the
aquifer and are used in the comparisons.
4.2.2. Water Levels and Weather Conditions in 2008
The monthly averages of daily water level data from July 2008 to September 2008 (Table 4-3)
were used for comparison with the indicators and to determine if the well was developing dry or
low water conditions. A major portion of the 2008 water level data is missing from January to
July due to “level logger out of range” error. The manual water level data (bi-weekly manual
measurement of water levels) was also not available for this well. Therefore, the available data
between July and September 2008 was used in the analysis.
The water level trends between the months of July and September 2008 (Table 4-3) did not show
any indication of stress or unusually low values, indicating that levels in the noted months are
representative of a normal or above normal water level trend (i.e. water levels are not impacted
by low rainfall conditions such as those observed in 2001, 2003 or 2007). Based on the monthly
rainfalls noted in the months of April to October 2008 (Table 4-1) and comparing with the 2001
rainfalls for the same months, dry weather conditions or low water conditions in the aquifer were
not encountered. The daily water levels in 2008 (Table 4-3) are actually higher than those noted
in 2003 for the same months. Therefore, it was not possible to test the groundwater indicators
and triggers determined for this well on the 2008 groundwater levels for use as the OLWR
indicator. However, as discussed earlier, the water levels observed in the year 2003 for the April
to October months (Table 4-2) from this well are considered to be representative of low water
conditions in the aquifer and were used for testing the suitability of inferred groundwater triggers
and indicators.
The comparison of 2008 and 2003 water levels with the indicators and triggers (based on the two
approaches) is presented in Section 5 of this report.
4.2.3. Water Level Data Issues
The following issues were noted in the water level data for this well:

29
1. Major portion of data missing due to “level logger out of range” error.
2. Missing water level data between Oct. 2006 and May 2007 due to logger failure.
3. Unexplainable “spikes and lows” in the water levels which do not correspond to seasonal
variations, maintenance activities, pumping events, instrument malfunctions etc.
4.3. Well-86 (Long Island Park)
This well is 18.9 m deep, and terminates in dolostone bedrock of the Oxford Formation. A thick
overburden of about 18.3 m overlies the bedrock. This well is considered to be a contact zone
well as the well casing does not extend into the bedrock. A borehole log (Log 3) is provided in
Appendix A of the report.
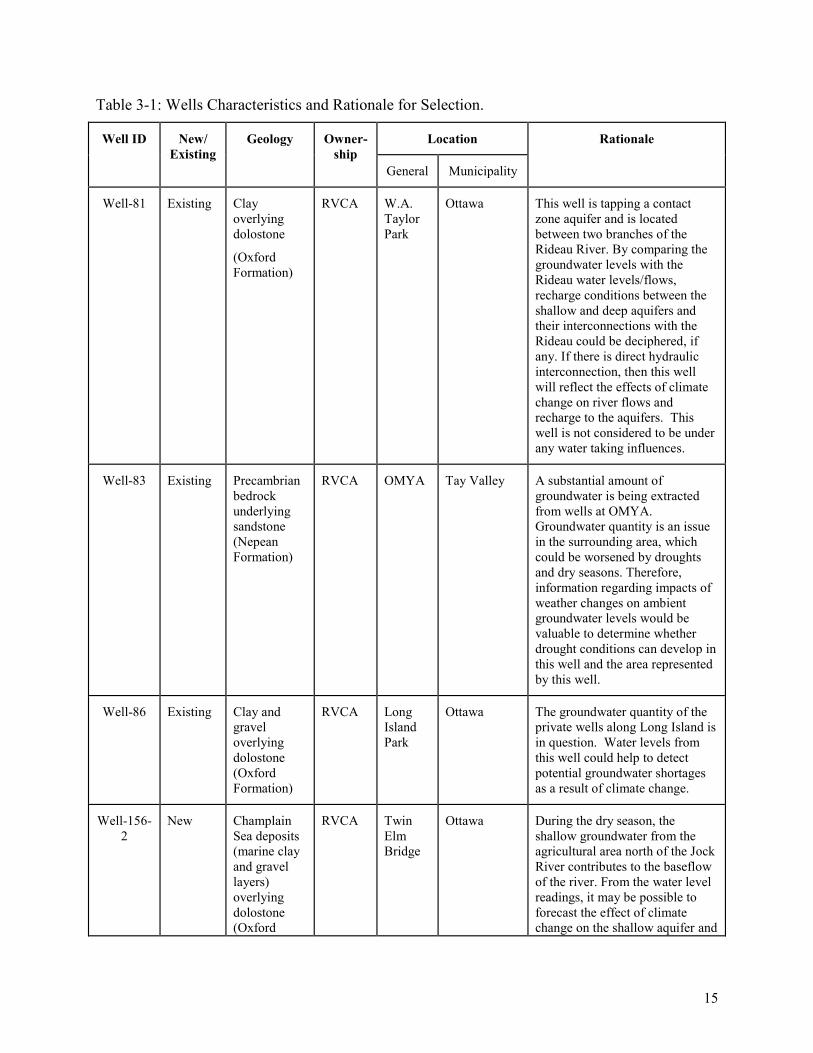
4.3.1. Historical Water Levels and Rainfall Trends
Water level trends in the well are shown in Figure 4-5 for years 2001-2008. Raw water level data
from the well indicated four instances in 2004 to 2006 in which the water level datalogger depth
appeared to change by more than one metre without a corresponding adjustment to the water
level data. Manual water level readings recorded during that period were insufficient to be of use
in the correction of the water level. As a result, data correction was conducted based on the
magnitude of the water level change observed at each of the four instances described above.
This method yielded sufficiently accurate water level data to observe general trends, but all the
data should be considered with caution. Furthermore, a large portion of 2006 and some 2007
water level data was affected by a barometric pressure-related error, and was therefore not used
in the calculations for groundwater triggers.
The resulting graph (Figure 4-5) shows that periods of relatively high water levels are observed
annually from April to June, and from November to January, with the exception of the winter of
2002-03 during which water levels were consistently low.
Accounting for the historical rainfalls for years 2001 to 2008, lower than average rainfall
conditions for the months of April to October were observed in 2001 and to some degree in 2003
and 2007. The water level trends observed during these years, especially for the months of April
to October are considered to be reflective of the dry weather conditions or low water conditions
in the aquifer. Monthly rainfalls for the years 2001-2008 are shown in Table 4-1. A graphic
comparison of the rainfall data is shown in Figure 4-1 and Figure 4-2. As Table 4-1 shows, the
year 2001 was relatively drier than the years 2003 and 2007 (for April to October months).
However, water level data between April and October of the year 2001 is not available from this
well as the monitoring station was not operational. Therefore, the water levels observed in year
2007 (Table 4-2) were considered to be reflective of the low water conditions. The year 2003
water level data was not used for comparisons, as the cumulative rainfall for the months of April
to October is higher than the year 2007 rainfall for the same months.
4.3.2. Water Levels and Weather Conditions in 2008
The monthly averages of daily water level data from April 2008 to September 2008 (Table 4-3)
were used for comparison with the indicators and to determine if the well is developing dry or
low water conditions.

30
The water level trends between the months of April and September 2008 (Table 4-3) did not
show any indication of stress or unusually low values indicating that levels in the noted months
are representative of a normal or above normal water level trend (i.e. water levels are not
impacted by low rainfall conditions such as those observed in 2001, 2003 or 2007). Based on the
monthly rainfalls noted in the months of April to October 2008 (Table 4-1) and comparing with
the 2001 rainfalls for the same months, dry weather conditions or low water conditions in aquifer
were not encountered in 2008. The daily water levels in 2008 are actually higher than those
noted in 2007 for the same months. Therefore, it was not possible to test the groundwater
indicators and triggers determined for this well on the 2008 groundwater levels for potential use
as the OLWR indicator. However, as discussed earlier, the water levels observed in the year
2007 (Table 4-2) for the April to October months from this well were considered to be
representative of low water conditions in aquifer and were used for testing the suitability of
inferred groundwater triggers and indicators.
The comparison of 2008 and 2007 water levels with the indicators and triggers (based on two
approaches) is presented in Section 5 of this report.
4.3.3. Water Level Data Issues
The following issues were noted in the water level data for this well:
1. Large portion of 2006-2007 data not useable due to barometric pressure-related error in
the water levels.
2. Unexplainable “spikes and lows” in the water levels which do not correspond to seasonal
variations, maintenance activities, pumping events, instrument malfunctions etc.
4.4. Well-156-2 (Twin Elm Bridge)
This is a multi-level monitoring well, however only the overburden level (shallow well) has been
incorporated into this study. The overburden material consists of clay followed by a gravel and
sand layer. The overburden water bearing zone was encountered at bedrock and overburden
interface around 26m which is being monitored by this level. The well is located approximately
15 m from the river. A borehole log (Log 4) is provided in Appendix A of the report.
4.4.1. Historical Water Levels and Rainfall Trends
Water level trends for this well are shown in Figure 4-6 for years 2005-2008. The analysis of
automated water level readings from Well-156 was problematic due to frequent unexplained
“highs and lows” and data jumps. Therefore, although the trends and relative changes in water
level from 2005 to 2007 may be considered accurate, the absolute value of the water level is not.
The seasonal trends in water levels were relatively inconsistent from year to year. Noticeable
springtime increases in water levels were not seen in 2006 and 2007, perhaps due to higher
winter temperatures which allowed gradual snow melt rather than a large spring melt. A steady
decrease from May to September/October was observed every year.
Accounting for the historical rainfalls for years 2001 to 2008, lower than average rainfall
conditions for the months of April to October were observed in 2001, and to some degree in
2003 and 2007. The water level trends observed during these years especially for the months of
April to October are considered to be reflective of dry weather conditions or low water
conditions in the aquifer. Monthly rainfalls for the years 2001-2008 are shown in Table 4-1. A

31
graphic comparison of the rainfall data is shown in Figure 4-1 and Figure 4-2. As Table 4-1
shows, the year 2001 was relatively drier than the years 2003 and 2007 (for April to October
months). However, water level data between April 2001 and July 2002 is not available from this
well as the monitoring station was not operational. Therefore, the water levels observed in year
2007 (Table 4-2) are considered to be reflective of the low water conditions. The year 2003
water level data was not used for comparisons, as the cumulative rainfall for the months of April
to October is higher than the year 2007 rainfall for the same months, and the water levels in this
well showed inconsistent trends in comparison to water levels observed in other years.
4.4.2. Water Levels and Weather Conditions in 2008
The monthly averages of daily water level data from April 2008 to September 2008 (Table 4-3)
were used for comparison with the indicators and to determine if the well is developing dry or
low water conditions.
The water level trends between the months of April to September 2008 did not show any
indication of stress or unusually low values, indicating that levels in the noted months are
representative of a normal or above normal water level trend (i.e. water levels are not impacted
by low rainfall conditions such as those observed in 2001, 2003 or 2007). Based on the monthly
rainfalls (Table 4-1) noted in the months of April to October 2008, and comparing with the 2001
rainfalls for the same months, dry weather conditions or low water conditions in the aquifer were
not encountered in 2008. The daily water levels in 2008 (Table 4-3) are actually higher than
those noted in 2007 (Table 4-2) for the same months. Therefore, it was not possible to test the
groundwater indicators and triggers determined for this well on the 2008 groundwater levels for
potential use as the OLWR indicator. However, as discussed earlier, the water levels observed in
the year 2007 (Table 4-2) for the April to October months from this well are considered to be
representative of low water conditions in the aquifer and were used for testing the suitability of
inferred groundwater triggers and indicators.
The comparison of 2008 and 2007 water levels with the indicators and triggers (based on the two
approaches) is presented in Section 5 of this report.
4.4.3. Water Level Data Issues
The following issues were noted in the water level data for this well:
1. Some of the data from July 2002 to 2005 was not used in the study due to inconsistencies
caused by logger being out of range, data spikes and missing data due to frequent logger
malfunctions.
2. Unexplainable “spikes and lows” in the water levels which do not correlate to the
seasonal fluctuations, pumping events or usual maintenance activities.
3. Inconsistencies between water level trends and seasonal events.
4.5. Well-252 (Christie Lake Camp Site)
This well is located on the south shore of a Lake. The well (Log 5, Appendix A) encountered a
thin layer (1 m) of topsoil overlying Precambrian Granite bedrock. This is a bedrock monitoring
well and is 31 m deep.

32
4.5.1. Historical Water Levels and Rainfall Trends
Water level trends in this well are shown in Figure 4-7 for year 2003-2008. Annual water level
fluctuations in this well were relatively large, ranging from 2.07 m in 2004 to 3.37 m in 2005.
There was generally a 1.1 to 2.3 m increase in water levels in March, followed by a gradual
decrease until September. The well also exhibited greater daily water level fluctuations (average
0.09 m) than at most other PGMN wells in this study, which may reflect the effect of nearby
supply wells. The average annual water level variations seem consistent with seasonal changes.
Accounting for the historical rainfalls for years 2001 to 2008, lower than average rainfall
conditions for the months of April to October were observed in 2001 and to some degree in 2003
and 2007. The water level trends observed during these years especially for the months of April
to October are considered to be reflective of dry weather conditions or low water conditions in
the aquifer. Monthly rainfalls for the years 2001-2008 are shown in Table 4-1. A graphic
comparison of the rainfall data is shown in Figure 4-1 and Figure 4-2.
As the Table 4-1 shows, the year 2001 was relatively drier than the years 2003 and 2007 (for
April to October months). The cumulative rainfall for the months of April to October for year
2003 is slightly higher than the year 2007 rainfall for the same months. The water level data
starting from 2001 to February 2003 is not available as the well was not in operation. Despite
higher rainfall in 2007 than 2003, the water levels for year 2003 (Table 4-2) are slightly lower
than those observed in 2007 for the months of April to June. Therefore, year 2003 water levels
are considered to be reflective of low water conditions in the aquifer and are used in the
comparisons.
4.5.2. Water Levels and Weather Conditions in 2008
The monthly averages of daily water level data from April 2008 to September 2008 (Table 4-3)
were used for comparison with the indicators and to determine if the well is developing dry or
low water conditions.
The water level trends between the months of April and September 2008 (Table 4-3) did not
show any indication of stress or unusually low values, indicating that levels in the noted months
are representative of average or normal water level trend (i.e. water levels are not impacted by
low rainfall conditions such as those observed in 2001, 2003 or 2007). Based on the monthly
rainfalls noted in the months of April to October 2008 and comparing with the 2001 rainfalls for
the same months, dry weather conditions or low water conditions in the aquifer were not
encountered in 2008. The daily water levels in 2008 are actually higher than those noted in
2003(Table 4-2) for the same months. Therefore, it was not possible to test the groundwater
indicators and triggers determined for this well on the 2008 groundwater levels for potential use
as the Ontario Low Water Response (OLWR) indicator. However, as discussed earlier, the water
levels observed in the year 2003 for the April to October months from this well are considered to
be representative of low water conditions in aquifer and were used for testing the suitability of
inferred groundwater triggers and indicators.
The comparison of 2008 and 2003 water levels with the indicators and triggers (based on two
approaches) is presented in Section 5 of this report.

33
4.5.3. Water Level Data Issues
The following issues were noted in the water level data for this well:
1. Water levels showed a wide range of daily fluctuations which may be due to the use of
nearby wells or effect of the lake water levels.
2. Water level data between April 2001 and January 2003 is not available as the well was
not in operation.
3. Unexplainable “spikes and lows” in the water levels which do not correspond to seasonal
variations, maintenance activities, pumping events, instrument malfunctions etc.

34
Table 4-1: Monthly rainfall for the years 2001 to 2008.
Monthly Rainfall (mm)
Month 2001 2002 2003 2004 2005 2006 2007 2008
Jan 0.6 3.8 1.8 19 52.2 27.2 36
Feb 31.6 20.3 9.8 0.6 10 36.2 11
Mar 9.1 28.2 39.6 51.8 8 25.4 30.2 35
Apr 11.2 61.3 32.6 62.8 143.8 63.8 78.6 68
May 81.1 91.5 129.4 72.2 48 114.6 50.8 91.8
Jun 98 224.8 57 76.4 125.4 112.6 49.2 106.6
Jul 38.6 47.8 93.6 65.2 106.2 100.8 138.6 64.8
Aug 68.6 39.4 63.6 111 82.2 72.2 107.4 74
Sep 78.4 71.6 65.2 142.8 104 154.8 40.8 79
Oct 95.2 77.8 148 60.4 100.4 125.1 86.6 74.8
Nov 77.6 28.8 95.8 87.4 92.2 99 33.2
Dec 38.6 9.2 91 41.2 28.8 44 28.8
Table 4-2: Monthly water level for low rainfall years.
Monthly Water Levels (masl)
Month Well- 81 Well-83 Well-86 Well-152-2 Well-252
Year 2007 2003 2007 2007 2003
Apr 87.67 142.44 86.80 103.39 175.64
May 87.67 142.41 86.42 103.06 175.64
Jun 87.56 142.41 86.18 102.94 175.66
Jul 87.48 141.72 86.09 102.71 174.92
Aug 87.35 141.23 85.88 102.54 175.09
Sep 87.30 141.29 85.87 102.24 174.70
Oct 87.536 141.99 86.12 102.12 175.67
Table 4-3: Monthly water levels for 2008.
Monthly Water Levels (masl) for 2008
Month Well- 81 Well-83 Well-86 Well-152-2 Well-252
Apr 88.08 86.71 103.53 176.63
May 87.72 86.48 103.26 175.72
Jun 87.70 86.43 103.09 175.94
Jul 87.64 142.25 86.41 103.08 175.88
Aug 87.45 142.15 86.31 102.92 175.57
Sep 87.46 141.84 86.15 102.68 175.18
Oct 87.4

35
0
50
100
150
200
250
Jan Feb Mar Apr May Jun Jul Aug Sep Oct Nov DecR
ain
fall
(mm
)2001
2002
2003
2004
2005
2006
2007
2008
Figure 4-1: Yearly rainfall variations for 2001-2008.

36
0
50
100
150
200
250
2001 2002 2003 2004 2005 2006 2007 2008R
ain
fall
(mm
)JanFebMarAprMayJunJulAugSepOctNovDec
Figure 4-2: Comparison of monthly rainfall for the year 2001-2008

37
86.8
87
87.2
87.4
87.6
87.8
88
88.2
5-Nov-01 20-Mar-03 1-Aug-04 14-Dec-05 28-Apr-07 9-Sep-08
Date
Grou
nd
wate
r E
levati
on
(m
asl
)
Figure 4-3: Water level trends in Well-81.

38
139.5
140
140.5
141
141.5
142
142.5
143
143.5
144
5-Nov-01 20-Mar-03 1-Aug-04 14-Dec-05 28-Apr-07 9-Sep-08
Date
Grou
nd
wate
r E
levati
on
(m
asl
)
Figure 4-4: Water Level Trends in Well-83.
39
85
85.5
86
86.5
87
87.5
88
5-Nov-01 20-Mar-03 1-Aug-04 14-Dec-05 28-Apr-07 9-Sep-08
Date
Gro
un
dw
ate
r E
lev
ati
on
(m
asl
)
Figure 4-5: Water level trends in Well-86.

40
Figure 4-6: Water level trends in Well-156.

41
173.5
174
174.5
175
175.5
176
176.5
177
177.5
29-Jan-03 12-Jun-04 25-Oct-05 9-Mar-07 21-Jul-08
Date
Gro
un
dw
ate
r E
lev
ati
on
(m
asl
)
Figure 4-7: Water level trends in Well-252.

42
5. Determination and Comparison of Groundwater Triggers
This section presents the results of the groundwater indicators and triggers calculated from the
water levels (Section 4) observed in the wells described in Section 3 of this report. The
groundwater triggers have been calculated by both Percentile and Jacques Whitford (JW)
approaches. The trigger values have been presented in tabular form in the following sections. A
comparison of Percentile and JW groundwater triggers has been presented in graphic form
(Figure 5-1to Figure 5-10) to illustrate the differences in trigger values as calculated by the two
approaches. The comparison of triggers and indicators with the water levels observed in the
monitoring wells between months of April and October 2008 is also shown in these charts.
Further application of triggers to evaluate their utility for the OLWR, and to determine whether
low water conditions are developing in a monitoring well or in an aquifer, has been undertaken
by comparing the water level data for the year 2003 or 2007 with the inferred indicators and
triggers (Table 5-1 to Table 5-10). These two years were selected because the water levels
observed in these years were lower as compared to the water levels from other years (2001 to
2008). This comparison is presented in Figure 5-1 to Figure 5-10 in this section. This section
also presents comparison of two approaches, accounting for the ease of application, time spent
on the analysis, level of expertise required to undertake the analysis, and which approach is
better representative of the aquifer behavior (Level I, II or III) in terms of the indicators.
5.1. Well-81 (W.A. Taylor Park)
5.1.1. Indicators and Triggers
The historical water levels collected between November 2001 and March 2008 were used to
determine indicators and triggers. The indicators determined by the JW and Percentile
approaches are shown in the Table 5-1 and Table 5-2. A comparison of the indicator values
calculated by the two approaches is shown in Figure 5-1 and Table 5-2.
Generally, the JW Trigger 1 (Level 1- First indication of a potential water supply problem)
values are lower than the Percentile Trigger 1 (25th
Percentile-Below normal or drought watch)
values in this well Table 5-1. This means that Percentile based Trigger 1 will always declare the
below normal water level conditions in an aquifer or well before JW Trigger 1 can detect Level I
conditions in the well (Figure 5-1, Table 2-1 and Table 2-2). This is expected when the water
levels are declining. However, if the water levels are recovering after a period of low water
conditions, then JW Trigger 1 conditions for Level I will be met first.
5.1.2. Application
The water level data collected between April and October 2008 was used to establish whether the
indicators (JW and Percentile) are showing that low water level conditions are developing in this
well. The indicators determined by the JW and Percentile approaches are shown in Table 5-2
along with the monthly water levels for 2008. A graphical comparison of the observed water
levels with indicators is shown in Figure 5-2. Additional comparison undertaken for the year
2007 water levels, which were deemed to be representative of historical low water conditions in
the aquifer, is also presented in the already mentioned figures and tables.

43
According to Figure 5-2, the observed water levels in 2008 did not reach the 25th
Percentile
(Trigger 1). As the figure shows, the water levels did not show that any low water conditions are
developing in this well. Rather, the water levels rose in the month of April, which is more
reflective of above normal conditions (Figure 5-2). The measured water levels were above the
50th
Percentile or median (normal conditions) and as high as the maximum percentile indicator
level (100th
Percentile) except in the month of October 2008. Similarly, in comparison with JW
indicators, the monthly water levels during 2008 did not drop below the JW Trigger 1 (Figure
5-2). All levels were higher than the JW Trigger 1 and Trigger 2 (Table 5-2).
As indicated above, the water levels in April 2008 were above the 100th
Percentile. However,
this is not considered to indicate that the current 100th
Percentile (Table 5-1, Figure 5-2) is too
conservative (stringent) or sensitive. Since the 2008 water levels were only used for comparison
and not included in determination of the indicators values, the 100th
Percentile value is estimated
lower than it would have been if the 2008 water levels were included in determining the
indicators. Since the 2008 water levels were higher than all the previous years, this trend would
have been reflected in the higher value of this indicator if 2008 data was included in the analysis.
Also, in the perspective of aquifers, it does not really matter whether the water levels are above
normal (75th
Percentile), at maximum levels (100th
Percentile) or beyond maximum since the
aquifer will be able to meet the demand in either case (unless the well is a shallow well and does
not have sufficient borehole storage so even minor changes in water levels will have an impact).
The impacts may only be experienced when the water levels start to drop below the 50th
Percentile. Therefore, in terms of interpretation of indicators, the 75th
and 100th
Percentile are
conveying the same indication i.e. water levels are in normal or above normal range. Even if the
indicator values are refined, these indicators will interpret the aquifer behavior in the same way.
However, these indicators are useful to establish whether the observed water levels are within the
normal or above normal ranges of historical water levels.
A comparison of indicators with historical water levels for the year 2007 (same months as 2008),
representing low water conditions, is shown in the Figure 5-2. According to this figure, the
measured water levels were below the 50th
Percentile or median (normal conditions) in June and
August, and sometimes as low as the Percentile Trigger 1 level in the month of September. This
represents above normal to below normal conditions in these months. In consideration of the
September 2007 below normal conditions, as shown by the Percentile Trigger 1 (Table 2-2),
potential water supply problems did develop in the aquifer in 2007, but did not reach the dry
conditions indicator level (10th
Percentile). The appropriate action plan under the OLWR
Program for this indicator level (if developed in 2007) would have been implemented in this
month. The water levels jumped to the 50th
Percentile levels in the following month, indicating
that normal conditions returned to the aquifer.
In comparison to the JW Triggers (Figure 5-2), the measured water levels in 2007 (April to
October) remained above the Trigger 1 (Table 5-2). Therefore, according to JW criteria (Table
2-1), no action would have required in 2007 on part of the OLWR program.
For this well, the JW Trigger 1 seems less sensitive as compared to Percentile Trigger 1, since
water levels in September 2007 did reach Level I (drought watch) according to the Percentile
criteria but not as per JW approach.

44
Table 5-1: Percentile Method Results for Well-81.
Trigger or
Condition
Minimum Trigger 3 Trigger 2 Trigger 1 Normal Above
normal
Very wet
Percentile 0th
Percentile
5th
Percentile
10th
Percentile
25th
Percentile
50th
Percentile
75th
Percentile
100th
Percentile
January 86.99 87.06 87.11 87.26 87.32 87.49 87.96
February 86.97 87.00 87.04 87.17 87.26 87.37 87.85
March 86.99 87.01 87.08 87.21 87.39 87.46 87.81
April 87.41 87.52 87.55 87.60 87.65 87.73 88.08
May 87.49 87.55 87.59 87.62 87.66 87.71 87.96
June 87.35 87.43 87.44 87.50 87.61 87.67 87.87
July 87.33 87.36 87.38 87.41 87.45 87.51 87.73
August 87.26 87.28 87.31 87.33 87.36 87.40 87.50
September 87.13 87.24 87.27 87.31 87.36 87.41 87.64
October 87.26 87.27 87.28 87.36 87.42 87.49 87.84
November 87.09 87.16 87.18 87.24 87.39 87.49 87.89
December 87.12 87.14 87.16 87.25 87.36 87.49 87.84
Table 5-2: Comparison of JW & Percentile Indicators with Water Levels from Well-81.
Trigger or
Condition
Minimum
0
Percentile
Trigger 1
25th
Percentile
JW
Trigger
1
Normal
50th
Percentile
Above
Normal
75th
Percentile
Very wet
100th
Percentile
JW
Trigger
2
Water
Levels
2008
Water
Levels
2007
January 86.99 87.26 87.16 87.32 87.49 87.96 86.97
February 86.97 87.17 87.09 87.26 87.37 87.85
March 86.99 87.21 87.15 87.39 87.46 87.81
April 87.41 87.60 87.51 87.66 87.74 88.08 88.09 87.67
May 87.49 87.62 87.60 87.66 87.71 87.96 87.72 87.67
June 87.35 87.50 87.48 87.61 87.67 87.87 87.71 87.57
July 87.33 87.41 87.39 87.45 87.51 87.73 87.64 87.49
August 87.26 87.33 87.32 87.36 87.40 87.50 87.45 87.35
September 87.13 87.31 87.28 87.36 87.41 87.64 87.47 87.31
October 87.26 87.36 87.32 87.42 87.49 87.84 87.40 87.54
November 87.09 87.24 87.23 87.39 87.49 87.89
December 87.12 87.25 87.20 87.36 87.49 87.84

45
Figure 5-1: Comparison of groundwater indicators based on Jacques Whitford and Percentile
methodologies for Well-81.
Figure 5-2: Comparison of groundwater Jacques Whitford & Percentile indicators with water
levels form Well-81.

46
5.2. Well-83 (OMYA Industrial Plant Site)
5.2.1. Indicators and Triggers
The historical water levels collected between November 2001 and January 2008 were used to
determine indicators and triggers. The indicators determined by the JW and Percentile
approaches are shown in the Table 5-3 and Table 5-4. A comparison of the indicator values
calculated by the two approaches is shown in the Figure 5-3, Figure 5-4 and Table 5-4.
Generally, the JW Trigger 1 (Level 1- First indication of a potential water supply problem)
values are lower than the Percentile Trigger 1 (25th
Percentile-Below normal or drought watch)
values in this well for the months April to October, except in the month of August when they are
higher (compared to Percentile Trigger 1). This means that Percentile based Trigger 1 (Figure
5-4) will always declare the below normal water level conditions in an aquifer or a well before
the JW Trigger 1(Table 5-4) can detected if Level 1 conditions are developing. This is expected
when the water levels are declining. However, if the water levels are recovering after a period of
low water conditions, then JW Trigger 1 criteria for Level 1 will be satisfied first. This process
will be reversed in the month of August.
In the months of November to December, the JW Indicator I value is higher than the 25th
Percentile (Figure 5-3). This might be due to the fact that the JW trigger 1 calculation is based on
the standard deviation of daily-average water levels for that month from the mean water level
(assuming normal distribution of water levels), and in these months, the mean monthly levels
were unusually high (the water levels in these months are not symmetrically distributed and have
high standard deviation as the observed water levels are far from the mean water levels ) or had
far greater variations in water levels giving rise to higher trigger value. Greater than average
water level variations or non-symmetrical distribution of water levels will skew the trigger
values relative to percentile indicator which only accounts for the number of water level
observation below a certain percentile. As can be seen from the water levels chart for well-83
(Table 4-2), the water levels in months of November to December for some years (2005, 2007)
were consistently higher and this trend is reflected in the higher value of the JW Trigger 1.
5.2.2. Application
The water level data collected between July and September 2008 was used to establish whether
the indicators (JW and Percentile) are showing that low water level conditions are developing in
this well. The indicators determined by the JW and Percentile approaches are shown in Table 5-4
along with monthly water levels for 2008. A graphical comparison of the observed water levels
with indicators is shown in Figure 5-4. Additional comparison undertaken with year 2003 water
levels, which were deemed to be representative of historical low water conditions in the aquifer,
is also presented in the mentioned figures and tables.
According to Figure 5-4, the observed water levels in 2008 did not drop below the 25th
Percentile
(Percentile Trigger 1). As the figure shows, the water levels did not show that any low water
conditions are developing in this well. The measured water levels were within the 50th
Percentile
or median (normal conditions) in July and as high as the 75th
Percentile or above normal
percentile indicator level in the months of August and September. Similarly, in comparison with

47
JW indicators, the monthly water levels during 2008 did not drop below the JW Trigger 1
(Figure 5-4). All levels were higher than the JW Trigger 1 and Trigger 2 (Table 5-4).
A comparison of indicators with historical water levels for the year 2003 (same months as 2008)
representing low water conditions is shown in the Figure 5-4. According to this figure, the
measured water levels were below the 50th
Percentile or median (normal conditions) and as low
as the Trigger 1 level in the months of April to August. Although the water levels did not reach
Trigger 2 (Level II), this represents below normal conditions in the well. In consideration of the
2003 below normal conditions in the noted months as shown by the Percentile Trigger 1 (Table
2-2), potential water supply problems did develop in the aquifer in 2007 in the mentioned months
but did not reach the dry conditions indicator level (Level II, 10th
Percentile). Therefore, the
appropriate actions plans under the OLWR Program for this indicator level (if developed in
2007) would have been implemented in the noted months. The water levels jumped to normal
levels in the month of September indicating that the aquifer returned to the normal conditions.
In comparison to the JW Triggers (Figure 5-4), the measured water levels in 2003 in the months
of April to August remained below the JW Trigger 1 (Table 5-4). As the 30-day average fell
below the Trigger 1 in the first month (April 2003), the well was in Level-1 which is the first
indication of potential water supply problem as per JW criteria (Table 2-1). The well was in
Level-II between May to July as the 30-day average water level remained below Trigger 1 in
three months in a row (May to July 2003). Level-II indicates a potential serious problem in
aquifer according to the JW criteria (Table 2-1).
It is to be noted that as per Percentile Triggers, this well did not reach Level II. Therefore, it
seems that the JW Trigger 2 is more sensitive as compared to Percentile Trigger 2. This is
because the declaration of Level II for JW criteria is dependent on how persistent the Level 1
condition in a well is over the months being monitored. On the other hand, if the JW Trigger 2
alternate criteria of historic lowest water level (daily average falls below the lowest noted water
level in a well) is applied, then Level II will not be reached in this well. This well remained in
Level-II in August as the 30-day average for this month did not fall below Trigger 2 (lowest
daily average level observed in the well). The water levels in September rose above Trigger 1,
indicating that recovery had started. The recovery in the well followed in the same manner as
described above when low water conditions were developing (Table 2-1). The appropriate
actions plan under the OLWR Program for indicator Level I and II (if developed in 2003) would
have been implemented during both on-set of low water conditions and recovery.
As shown by the above discussion, the JW Trigger 2 is more sensitive as compared to the
Percentile Trigger 2. However, this is dependent on how persistent the Level 1 condition is in a
well over the period being monitored. Also, as per JW Triggers , the Level I or II conditions
may be persistent over many months whereas in the case of Percentile Triggers, the well may be
out of Level I or Level II as soon the water levels recover to their noted values for each
percentile. On the other hand, if the JW Trigger 2 alternate criteria of historic lowest water level
(daily average falls below the lowest noted water level in a well) is applied, then Level II will not
be reached in this well. In fact, if historic lowest water level is used as Trigger 2 (or to declare
Level II), then the JW Trigger becomes less sensitive than Percentile Trigger 2.

48
Table 5-3: Percentile Method Results for Well-83.
Trigger or
Condition
Minimum Trigger 3 Trigger 2 Trigger 1 Normal Above
normal
Very wet
Percentile 0th
Percentile
5th
Percentile
10th
Percentile
25th
Percentile
50th
Percentile
75th
Percentile
100th
Percentile
January 140.62 140.66 140.73 141.69 142.66 143.02 143.56
February 140.52 140.62 140.65 141.79 142.51 142.89 143.61
March 140.34 140.52 140.62 142.52 142.69 143.00 143.57
April 142.36 142.39 142.42 142.65 142.99 143.41 143.74
May 142.18 142.35 142.39 142.60 142.93 143.14 143.55
June 142.09 142.27 142.34 142.49 142.77 143.01 143.19
July 141.26 141.41 141.52 141.85 142.41 142.64 143.22
August 140.52 140.81 141.12 141.24 142.09 142.60 143.10
September 139.99 140.17 140.31 141.27 141.64 142.35 142.98
October 139.93 140.04 140.14 141.67 142.16 142.52 143.00
November 139.98 140.07 140.11 140.50 142.50 142.75 143.42
December 140.64 140.73 140.74 140.87 141.98 142.93 143.46
Table 5-4: Comparison of JW & Percentile Indicators with Water Levels from Well-83.
Trigger or
Condition
Minimum
0
Percentile
Trigger 1
25th
Percentile
JW
Trigger
1
Normal
50th
Percentile
Above
Normal
75th
Percentile
Very wet
100th
Percentile
JW
Trigger
2
Water
Levels
2008
Water
Levels
2003
January 140.62 141.69 141.21 142.66 143.02 143.56 139.93 143.06
February 140.52 141.79 141.33 142.51 142.89 143.61
March 140.34 142.52 141.61 142.69 143.00 143.57
April 142.36 142.65 142.63 142.99 143.41 143.74 142.44
May 142.18 142.60 142.54 142.93 143.14 143.55 142.41
June 142.09 142.49 142.45 142.77 143.01 143.19 142.41
July 141.26 141.85 141.77 142.41 142.64 143.22 142.25 141.72
August 140.52 141.24 141.27 142.09 142.60 143.10 142.15 141.23
September 139.99 141.27 140.87 141.64 142.35 142.98 141.84 141.29
October 139.93 141.67 140.96 142.16 142.52 143.00 141.99
November 139.98 140.50 140.74 142.50 142.75 143.42
December 140.64 140.87 140.99 141.98 142.93 143.46

49
Figure 5-3: Comparison of groundwater indicators based on Jacques Whitford and Percentile
methodologies for Well-83.
Figure 5-4: Comparison of groundwater Jacques Whitford & Percentile indicators with water
levels form Well-83.

50
5.3. Well-86 (Long Island Park)
5.3.1. Indicators and Triggers
The historical water level data collected between November 2001and March 2008 was used to
determine indicators and triggers. The indicators determined by the JW and Percentile
approaches are shown in the Table 5-5 and Table 5-6. A comparison of the indicator values
calculated by the two approaches is shown in the Figure 5-5, Figure 5-6 and Table 5-6.
For this well, JW Trigger 1 and Percentile Trigger 1 values are comparable (Table 5-5, Figure
5-5) for months of April to October. The JW Trigger 1 (Level 1- first indication of a potential
water supply problem) values are slightly lower than the Percentile Trigger 1 (25th
Percentile-
below normal or drought watch) values for the months of April to October. Due to the minor
difference in trigger values of both approaches, it is expected that the Percentile based Trigger 1
and JW Trigger 1 will detect the below normal water level conditions in an aquifer at the same
time.
5.3.2. Application
The water level data collected between April and September 2008 was used to establish whether
the indicators (JW and Percentile) are showing that low water level conditions are developing in
this well. The indicators determined by the JW and Percentile approaches are shown in Table 5-6
along with monthly water levels for 2008. A graphical comparison of the observed water levels
with indicators is shown in Figure 5-6. Additional comparison undertaken with year 2007 water
levels, which were deemed to be representative of historical low water conditions in the aquifer,
is also presented in the already mentioned figures and tables.
According to Figure 5-6, the observed water levels in 2008 did not drop below the 25th
Percentile
(Percentile Trigger 1). As the figure shows, the water levels did not show that any low water
conditions are developing in this well. The measured water levels were above the 50th
Percentile
or median (normal conditions) and as high as the maximum percentile indicator level (100th
Percentile). In the month of August 2008, water levels rose above the maximum percentile
indicator level (Table 5-6). In comparison with JW indicators, the monthly water levels did not
drop below the JW Trigger 1 (Figure 5-6). All levels were higher than the JW Trigger 1 and
Trigger 2 (Table 5-6).
As indicated above, the water levels in August 2008 were above the 100th
Percentile. However,
this is not considered to indicate that the current 100th
Percentile (Table 5-5,Figure 5-6) is too
conservative (stringent) or sensitive. Since the 2008 water levels were only used for comparison
and not included in determination of the indicators values, the 100th
Percentile value is estimated
lower than would have been if the 2008 water levels were included in determining the indicators.
Since the 2008 water levels were higher than all the previous years, this trend would have been
reflected in the higher value of this indicator if 2008 data was included in the analysis. Also, in
the perspective of aquifers, it does not really matter whether the water levels are above normal
(75th
Percentile), at maximum levels (100th
Percentile) or beyond maximum since the aquifer will
be able to meet the demand in either case (unless the well is a shallow well and does not have
sufficient borehole storage so even minor changes in water levels will have an impact). The
impacts may only be experienced when the water levels start to drop below the 50th
Percentile.
Therefore, in terms of interpretation of indicators, the 75th
and 100th
Percentile are conveying the

51
same indication i.e. water levels are in normal or above normal range. Even if the indicator
values are refined, these indicators will interpret the aquifer behavior in the same way. However,
these indicators are useful to establish whether the observed water levels are within the normal or
above normal ranges of historical water levels.
A comparison of indicators with water levels for year 2007 (same months as 2008) representing
low water conditions is shown in Figure 5-6. According to this figure, the measured water levels
in the month of April were in the above normal range (100th
and 75th
percentiles). However, the
water levels were below the 50th
Percentile or median (normal conditions) and as low as the
Trigger 1 level in the month of May. This represents below normal conditions in this month. In
consideration of the below normal conditions, as shown by the Percentile Trigger 1 (Table 2-2),
water supply problems did develop in the aquifer in May 2007 but did not reach the dry
conditions indicator level (10th
Percentile). Therefore, the appropriate actions plan under the
OLWR Program for this indicator level (if developed in 2007) would have been implemented in
this month. The water levels jumped above the 50th
Percentile level in the following month
indicating that normal levels had returned to the aquifer.
In comparison to the JW Triggers (Figure 5-6) the measured water levels in 2007 (April to
October) remained above the JW Trigger 1 (Table 5-6). Therefore, according to JW criteria
(Table 2-1), no action would have required in 2007 on part of the OLWR program.
For this well, the JW Trigger 1 seems less sensitive as compared to Percentile Trigger 1, since
water levels in May 2007 did reach Level I (drought watch) according to the Percentile criteria
but not as per JW approach.
52
Table 5-5: Percentile Method Results for Well-86.
Trigger or
Condition
Minimum Trigger 3 Trigger 2 Trigger 1 Normal Above
normal
Very wet
Percentile 0th
Percentile
5th
Percentile
10th
Percentile
25th
Percentile
50th
Percentile
75th
Percentile
100th
Percentile
January 85.77 85.84 85.90 86.20 86.34 86.59 87.19
February 85.73 85.77 85.81 86.14 86.25 86.35 87.17
March 85.74 85.77 85.93 86.30 86.57 86.70 87.04
April 86.31 86.41 86.45 86.51 86.67 86.77 87.11
May 86.15 86.30 86.34 86.43 86.53 86.65 87.04
June 85.77 85.94 86.02 86.16 86.38 86.50 86.99
July 85.70 85.82 85.90 86.00 86.10 86.20 86.79
August 85.56 85.64 85.71 85.82 85.92 86.01 86.26
September 85.60 85.74 85.76 85.83 85.90 86.01 86.59
October 85.85 85.92 85.95 85.98 86.12 86.18 86.48
November 85.89 85.95 85.98 86.04 86.28 86.41 86.73
December 85.87 85.93 85.97 86.11 86.36 86.50 86.93
Table 5-6: Jacques Whitford Method Results for Well-86.
Trigger or
Condition
Minimum
0
Percentile
Trigger 1
25th
Percentile
JW
Trigger 1
Normal
50th
Percentile
Above
Normal
75th
Percentile
Very wet
100th
Percentile
JW
Trigger 2
Water
Levels
2008
Water
Levels
2007
January 85.77 86.20 86.04 86.34 86.59 87.19 85.56
February 85.73 86.14 85.96 86.25 86.35 87.17
March 85.74 86.30 86.14 86.57 86.70 87.04
April 86.31 86.51 86.49 86.67 86.77 87.11 86.71 86.80
May 86.15 86.43 86.38 86.53 86.65 87.04 86.48 86.42
June 85.77 86.16 86.09 86.38 86.50 86.99 86.43 86.18
July 85.70 86.00 85.93 86.10 86.20 86.79 86.41 86.09
August 85.56 85.82 85.77 85.92 86.01 86.26 86.31 85.88
September 85.60 85.83 85.76 85.90 86.01 86.59 86.15 85.87
October 85.85 85.98 85.96 86.12 86.18 86.48 86.12
November 85.89 86.04 85.98 86.28 86.41 86.73
December 85.87 86.11 86.04 86.36 86.50 86.93

53
Figure 5-5: Comparison of groundwater indicators based on Jacques Whitford and Percentile
methodologies for Well-86.
Figure 5-6: Comparison of groundwater Jacques Whitford & Percentile indicators with water
levels form Well-86.

54
5.4. Well-156 (Twin Elm Bridge)
5.4.1. Indicators and Triggers
The historical water levels collected between August 2002 and March 2008 were used to
determine indicators and triggers. The indicators determined by the JW and Percentile
approaches are shown in the Table 5-7 and Table 5-8. A comparison of the indicator values
calculated by the two approaches is shown in the Figure 5-7, Figure 5-8 and Table 5-8.
For this well, JW Trigger 1 and Percentile Trigger 1 values are shown in Table 5-8 and Figure
5-8. The JW Trigger 1 (Level 1- first indication of a potential water supply problem) values are
slightly lower than the Percentile Trigger 1 (25th
Percentile-below normal or drought watch)
values for the months of April, May and July while they are higher in the months of June, and
September. Due to the mentioned variations in trigger values of both approaches, it is expected
that the Percentile based Trigger 1 and JW Trigger 1 will detect the below normal water level
conditions in an aquifer at different times depending on the month under consideration.
5.4.2. Application
The water level data collected between April and September 2008 was used to establish whether
the indicators (JW and Percentile) are showing that low water level conditions are developing in
this well. The indicators determined by the JW and Percentile approaches are shown in Table 5-8
along with monthly water levels for 2008. A graphical comparison of the observed water levels
with indicators is shown in Figure 5-8. Additional comparison undertaken with year 2007 water
levels, which were deemed to be representative of historical low water conditions in the aquifer,
is also presented in the figures and tables already mentioned.
According to Figure 5-8, the observed water levels in 2008 did not drop below the 25th
Percentile
(Percentile Trigger 1). As the figure shows, the water levels did not show that any low water
conditions are developing in this well. The measured water levels remained within the 50th
Percentile or median (normal conditions) and as high as the above normal indicator level (75th
Percentile). Similarly, in comparison with JW indicators, the monthly water levels did not drop
below the JW Trigger 1 (Figure 5-8). All levels were higher than the JW Trigger 1 and Trigger 2
(Table 5-8).
A comparison of indicators with historical water levels for year 2007 (same months as 2008)
representing low water conditions is shown in the Figure 5-8. According to this figure, the
measured water levels were below the 50th
Percentile or median (normal conditions) and as low
as the Trigger 1 level in the months of May, June, August and September. However, they did not
reach the Trigger 2 level (Table 2-2) between April and October. This represents below normal
conditions in the months mentioned above. In consideration of the below normal conditions, as
shown by the Percentile Trigger 1 (Table 2-2), potential water supply problems did develop in
the aquifer in 2007 but did not reach the dry conditions indicator level (10th
Percentile). The
appropriate actions plan under the OLWR Program for this indicator level (if developed in 2007)
would have been implemented in these months. The water levels jumped to the 50th
Percentile
levels in the month of November indicating that aquifer was in normal conditions.

55
In comparison to the JW Triggers (Figure 5-8), the measured water levels in 2007 remained
below the JW Trigger 1 (Table 5-8) for most of the year excluding the months of January,
March, April, and August. Since the 30-day water level average fell below Trigger 1 in the
months of February, May, June, July, and September, this indicates that water supply problems
were potentially developing (Table 2-1) in these months. The 30-day average fell below Trigger
1 level for three months in a row starting from November 2007. Therefore, according to JW
criteria (Table 2-1), the well was in Level-II (potentially serious problems) condition. The well
remained in Level-II (and did not reach Level-III) from November 2007 onwards as the 30-day
average for any of the following months did not fall below Trigger 2 (lowest daily average level
observed in the well). The well started to show recovery in February of 2008 as water levels rose
above Trigger 1 level. The appropriate actions plan under the OLWR Program for indicator
Level I and II (if developed in 2007) would have been implemented during both on-set of low
water conditions and recovery starting from September 2007. However, once in the winter
months, there might have been no need of water conservation measures due to decline in the
groundwater.
As shown by the above discussion, the JW Trigger 2 is more sensitive as compared to Percentile
Trigger 2 as it is dependent on how persistent the Level I condition is in a well over the period
being monitored. Also, as per JW Triggers, the Level II conditions persisted over many months
whereas in the case of Percentile Triggers, the well was in Level I in May, June, August and
September and never reached Level II condition. However, in the case of Percentile approach,
the cycle of shifting between recovery and low water conditions (Level I in one month and
Level II in the next or vice versa) seems far more quick and frequent which means that rapidly
changing weather conditions or water level changes in the aquifer will impact the Percentile
Triggers more frequently and may result in far more frequent advisories etc.

56
Table 5-7: Percentile Method Results for Well-156-2.
Trigger or
Condition
Minimum Trigger 3 Trigger 2 Trigger 1 Normal Above
normal
Very wet
Percentile 0th
Percentile
5th
Percentile
10th
Percentile
25th
Percentile
50th
Percentile
75th
Percentile
100th
Percentile
January 102.93 103.02 103.19 103.25 103.37 103.68 103.91
February 102.83 102.92 103.02 103.12 103.21 103.74 103.83
March 102.81 102.87 102.91 103.11 103.27 103.70 104.23
April 103.05 103.29 103.32 103.35 103.41 104.28 104.42
May 102.64 102.89 102.96 103.21 103.56 104.36 104.46
June 102.75 102.83 102.89 103.03 103.59 104.21 104.44
July 102.57 102.63 102.66 102.81 103.02 103.34 104.25
August 102.26 102.35 102.38 102.47 102.90 103.06 104.16
September 102.10 102.16 102.22 102.27 102.94 103.62 103.84
October 102.05 102.07 102.09 102.43 103.17 103.60 104.21
November 102.28 102.32 102.35 103.04 103.30 103.69 104.21
December 102.39 102.56 102.71 103.20 103.52 103.90 103.93
Table 5-8: Jacques Whitford Method Results for Well-156-2.
Trigger or
Condition
Minimum
0
Percentile
Trigger 1
25th
Percentile
JW
Trigger
1
Normal
50th
Percentile
Above
Normal
75th
Percentile
Very wet
100th
Percentile
JW
Trigger
2
Water
Levels
2008
Water
Levels
2007
January 102.93 103.25 103.18 103.37 103.68 103.91 102.05 103.18 103.4867
February 102.83 103.12 103.02 103.21 103.74 103.83
103.16 103.0194
March 102.81 103.11 102.99 103.27 103.70 104.23 103.026
April 103.05 103.35 103.25 103.41 104.28 104.42 103.53 103.39
May 102.64 103.21 103.08 103.56 104.36 104.46 103.26 103.06
June 102.75 103.03 103.04 103.59 104.21 104.44 103.09 102.94
July 102.57 102.81 102.72 103.02 103.34 104.25 103.08 102.71
August 102.26 102.47 102.38 102.90 103.06 104.16 102.92 102.54
September 102.10 102.27 102.34 102.94 103.62 103.84 102.68 102.24
October 102.05 102.43 102.40 103.17 103.60 104.21 102.12
November 102.28 103.04 102.72 103.30 103.69 104.21 102.35
December 102.39 103.20 102.99 103.52 103.90 103.93 102.63

57
Figure 5-7: Comparison of groundwater indicators based on Jacques Whitford and Percentile
methodologies for Well-156-2.
101.00
101.50
102.00
102.50
103.00
103.50
104.00
104.50
105.00
1 2 3 4 5 6 7 8 9 10 11 12
Month
Gro
un
dw
ate
r E
lev
ati
on
(m
asl
)
Very wet 100th Percentile Above Normal 75th PercentileNormal 50th Percentile Trigger 1 25th PercentileMinimum 0 Percentile JW Trigger 1Water Levels 2008 Water Levels 2007
Figure 5-8: Comparison of groundwater Jacques Whitford & Percentile indicators with water
levels form Well-156-2.

58
5.5. Well-252 (Christie Lake Camp Site)
5.5.1. Indicators and Triggers
The historical water levels collected between February 2003 and March 2008 were used to
determine indicators and triggers. The indicators determined by the JW and Percentile
approaches are shown in the Table 5-9 and Table 5-10. A comparison of the indicator values
calculated by the two approaches is shown in the Figure 5-9, Figure 5-10 and Table 4-10.
Generally, the JW Trigger 1 (Level I- First indication of a potential water supply problem) values
are lower than the Percentile Trigger 1 (25th
Percentile-Below normal or drought watch) values
in this well as shown in Table 5-9 and Figure 5-9. This means that Percentile based Trigger 1
will always declare the below normal water level conditions in an aquifer or well before JW
Trigger 1 can detect Level 1(Table 2-1,Table 2-2). This is expected when the water levels are
declining in the well. However, if the water levels are recovering after a period of low water
conditions, then JW Trigger 1 conditions for Level I will be met first.
5.5.2. Application
The water level data collected between April and September 2008 was used to establish whether
the indicators (JW and Percentile) are showing that low water level conditions are developing in
this well. The indicators determined by the JW and Percentile approaches are shown in Table
5-10 along with monthly water levels for 2008. A graphical comparison of the observed water
levels with indicators is shown in Figure 5-10. Additional comparison undertaken with year 2003
water levels, which were deemed to be representative of historical low water conditions in the
aquifer, is also presented in the already mentioned figures and tables.
According to Figure 5-10, the observed water levels in 2008 did not drop below the 25th
Percentile (Percentile Trigger 1) except in the month of May when water levels did fall below the
Trigger 1 indicating that low water conditions developed in this well. However, the water levels
rose in the month of June and were reflective of normal conditions. For remainder of the months,
the water levels did not show that any low water conditions are developing in this well as the
measured water levels were above the 50th
Percentile or median (normal conditions) and as high
as the maximum percentile indicator level (100th
Percentile) in the months of July and August
2008. In comparison with JW indicators, the monthly water levels did not drop below the JW
Trigger 1 (Figure 5-10). All levels were higher than the JW Trigger 1 and Trigger 2 (Table 5-10).
As indicated above, the water levels in July and August 2008 were above the 100th
Percentile.
However, this is not considered to indicate that the current 100th
Percentile (Table 5-9,Figure
5-10) is too conservative (stringent) or sensitive. Since the 2008 water levels were only used for
comparison and not included in determination of the indicators values, the 100th
Percentile value
is estimated lower than would have been if the 2008 water levels were included in determining
the indicators. Since the 2008 water levels were higher than all the previous years, this trend
would have been reflected in the higher value of this indicator if 2008 data was included in the
analysis. Also, in the perspective of aquifers, it does not really matter whether the water levels
are above normal (75th
Percentile), at maximum levels (100th
Percentile) or beyond maximum
since the aquifer will be able to meet the demand in either case (unless the well is a shallow well
and does not have sufficient borehole storage so even minor changes in water levels will have an

59
impact). The impacts may only be experienced when the water levels start to drop below the 50th
Percentile. Therefore, in terms of interpretation of indicators, the 75th
and 100th
Percentile are
conveying the same indication i.e. water levels are in normal or above normal range. Even if the
indicator values are refined, these indicators will interpret the aquifer behavior in the same way.
However, these indicators are useful to establish whether the observed water levels are within the
normal or above normal ranges of historical water levels.
A comparison of indicators with historical water levels for year 2003 (same months as 2008)
representing low water is shown in the Figure 5-10. According to this figure, the measured water
levels during the months of April, May and July were below the 50th
Percentile or median
(normal conditions) and as low as the Trigger 1 level but did not reach the Trigger 2 level (Table
5-10). This represents below normal conditions in the aquifer. For remainder of the months, the
water levels were in the normal to above normal indicator levels. In consideration of the 2003
below normal conditions for some months, as shown by the Percentile Trigger 1 (Table 2-2),
water supply problems did start to develop in the aquifer in the noted months but did not reach
the dry conditions indicator level (10th
Percentile). Therefore, the appropriate actions plan under
the OLWR Program for this indicator level (if developed) would have been implemented in these
months. The water levels jumped to above normal levels in the month of August indicating that
aquifer had returned to normal conditions.
In comparison to the JW Triggers (Figure 5-10), the measured water levels in 2003 remained
below the JW Trigger 1 (Table 5-10) for April and July while they were above the Trigger 1
levels in the remaining months. In April and July, the well was in Level I (the first indication of a
potential water supply problem) according to the JW criteria (Table 2-1). However, the 30-day
average did not fall below Trigger 1 for three months in a row. Therefore, according to JW
criteria (Table 2-1), Level II was not reached. The appropriate actions plan under the OLWR
Program for indicator Level I (if developed in 2007) would have been implemented in both
months during on-set of low water conditions and recovery.
As shown by the above discussion, both Percentile and JW Trigger 1 found the water levels in
April and July 2003 to be in Level I water conditions. However, in the case of Percentile
approach, the cycle of shifting between normal and low water conditions seems far more
frequent which means that rapidly changing weather conditions or water level changes in the
aquifer will impact the Percentile Trigger 1 more frequently and may result in far more frequent
advisories etc.

60
Table 5-9: Percentile method Results for Well-252.
Trigger or
Condition
Minimum Trigger 3 Trigger 2 Trigger 1 Normal Above
normal
Very wet
Percentile 0th
Percentile
5th
Percentile
10th
Percentile
25th
Percentile
50th
Percentile
75th
Percentile
100th
Percentile
January 175.52 175.66 175.73 175.93 176.23 176.50 177.06
February 174.49 174.74 175.15 175.44 175.66 175.88 176.68
March 174.40 174.65 175.04 175.57 175.97 176.48 176.89
April 175.13 175.33 175.54 175.99 176.55 176.79 177.14
May 175.01 175.40 175.57 175.73 175.90 176.24 176.81
June 175.07 175.28 175.35 175.53 175.72 175.98 176.70
July 174.67 174.79 174.84 175.10 175.28 175.63 176.03
August 174.32 174.45 174.54 174.71 174.99 175.27 176.20
September 174.08 174.22 174.36 174.49 174.67 175.33 176.66
October 174.10 174.27 174.35 175.25 175.52 176.14 176.67
November 174.44 174.62 174.72 175.73 176.17 176.34 176.71
December 175.17 175.35 175.49 175.86 176.27 176.51 176.82
Table 5-10: Jacques Whitford Method Results for Well-252
Trigger or
Condition
Minimum
0
Percentile
Trigger 1
25th
Percentile
JW
Trigger
1
Normal
50th
Percentile
Above
Normal
75th
Percentile
Very wet
100th
Percentile
JW
Trigger
2
Water
Levels
2008
Water
Levels
2003
January 175.52 175.93 175.85 176.23 176.50 177.06 174.08
February 174.49 175.44 175.22 175.66 175.88 176.68
March 174.40 175.57 175.30 175.97 176.48 176.89
April 175.13 175.99 175.83 176.55 176.79 177.14 176.63 175.64
May 175.01 175.73 175.56 175.90 176.24 176.81 175.72 175.64
June 175.07 175.53 175.42 175.72 175.98 176.70 175.94 175.66
July 174.67 175.10 174.97 175.28 175.63 176.03 175.88 174.92
August 174.32 174.71 174.60 174.99 175.27 176.20 175.57 175.09
September 174.08 174.49 174.32 174.67 175.33 176.66 175.18 174.70
October 174.10 175.25 174.85 175.52 176.14 176.67 175.67
November 174.44 175.73 175.27 176.17 176.34 176.71
December 175.17 175.86 175.73 176.27 176.51 176.82

61
Figure 5-9: Comparison of groundwater indicators based on Jacques Whitford and Percentile
methodologies for Well-252
Figure 5-10: Comparison of groundwater Jacques Whitford & Percentile indicators with water
levels form Well-252.

62
5.6. Comparison of Triggers, Indicators and Calculation Approaches
5.6.1. Triggers and Indicators
In terms of effectiveness of a particular method in detecting level I or level II conditions, since
JW Trigger 1 value is generally lower than the Percentile Trigger 1, therefore it will always take
longer to reach the Level I conditions as per JW Approach. Hence Level I condition will be
declared first by the Percentile Trigger 1 during the on-set of the low water conditions in a well
or in an aquifer. Therefore, during the on-set, the Percentile Trigger 1 is considered to be more
sensitive as compared to JW Trigger 1. On the other hand during the recovery from the low
water conditions, the JW Trigger 1 requirements may be met first in ending the Level I
declaration while a well may still be in below normal or drought watch status as per Percentile
Trigger 1.
It seems that the JW Trigger 2 is more sensitive as compared to Percentile Trigger 2 (Well-83,
Well-156 ) since it is dependent on how persistent the Level I is in a well over the monitoring
period. On the other hand, if the JW Trigger 2 alternate criteria of historic lowest water level
(daily average falls below the lowest noted water level in a well) is applied, then Level II will be
declared less frequently. In fact, if historic lowest water level is used as Trigger 2 (or to declare
Level II), then JW Trigger 2 becomes less sensitive than Percentile Trigger 2.
It has to be recognized that as per the JW Triggers, the Level I and Level II conditions (both for
on-set and recovery of the low water conditions) can persist for long periods of time whereas in
the case of Percentile Triggers, the aquifer or well may be out of Level I or Level II conditions
as soon the water levels recover to their noted values for each percentile (Well-83, Well-252). In
other words, the JW Approach will result in Level I or II being declared for much longer
durations once it is entered, as compared to the Percentile Method. However, the Percentile
approach will result in frequent declaration of Level I or Level II especially if weather conditions
are changing or water levels are cycling rapidly.
The persistence of Level I, II or III conditions in case of JW Approach may be problematic for
watershed residents, especially if they have to implement groundwater conservation measures
(lower domestic use, decrease water takings etc.) for long periods of time. Implementing the
conservation measures for a long time as advised by JW triggers may not sit well with the well
users. The Percentile approach on the other hand does not require the declaration of Levels (I,
II or III) to continue for months during on-set or in recovery cycle. Although, this may result in
groundwater conservation measures being implemented for shorter period of time, the
declaration of Level I or II between on-set to recovery or recovery to on-set can vary from
month to month (depending on the water levels encountered) and may become rather frequent
especially if the weather conditions or water levels are cycling rapidly. In terms of advisories or
implementation of conservation measures (as per each declared level), the communications on
frequently changing conditions (as per Percentile approach) may become confusing or too
strenuous for the watershed residents.
For the Percentile approach, the frequent shift between triggers or levels may be solved by
refining the range of Triggers (increasing or perhaps eliminating/combining some of the
Triggers) especially those above the 75th
Percentile since it does not really matter whether
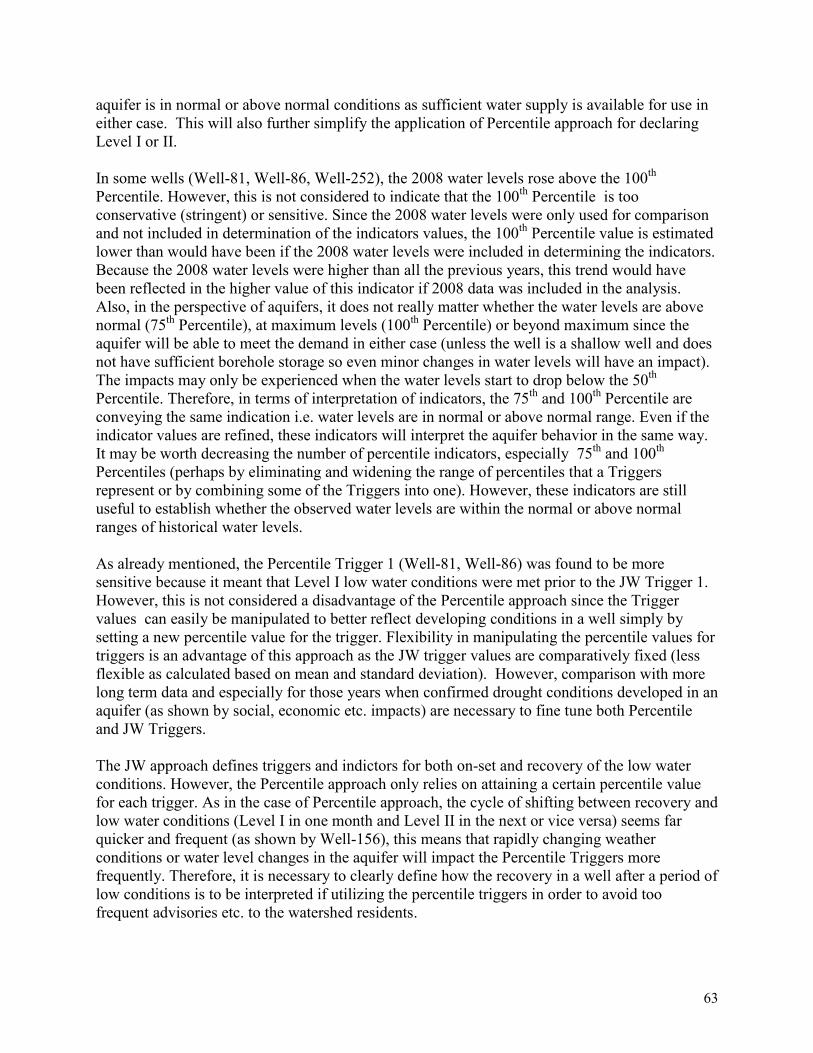
63
aquifer is in normal or above normal conditions as sufficient water supply is available for use in
either case. This will also further simplify the application of Percentile approach for declaring
Level I or II.
In some wells (Well-81, Well-86, Well-252), the 2008 water levels rose above the 100th
Percentile. However, this is not considered to indicate that the 100th
Percentile is too
conservative (stringent) or sensitive. Since the 2008 water levels were only used for comparison
and not included in determination of the indicators values, the 100th
Percentile value is estimated
lower than would have been if the 2008 water levels were included in determining the indicators.
Because the 2008 water levels were higher than all the previous years, this trend would have
been reflected in the higher value of this indicator if 2008 data was included in the analysis.
Also, in the perspective of aquifers, it does not really matter whether the water levels are above
normal (75th
Percentile), at maximum levels (100th
Percentile) or beyond maximum since the
aquifer will be able to meet the demand in either case (unless the well is a shallow well and does
not have sufficient borehole storage so even minor changes in water levels will have an impact).
The impacts may only be experienced when the water levels start to drop below the 50th
Percentile. Therefore, in terms of interpretation of indicators, the 75th
and 100th
Percentile are
conveying the same indication i.e. water levels are in normal or above normal range. Even if the
indicator values are refined, these indicators will interpret the aquifer behavior in the same way.
It may be worth decreasing the number of percentile indicators, especially 75th
and 100th
Percentiles (perhaps by eliminating and widening the range of percentiles that a Triggers
represent or by combining some of the Triggers into one). However, these indicators are still
useful to establish whether the observed water levels are within the normal or above normal
ranges of historical water levels.
As already mentioned, the Percentile Trigger 1 (Well-81, Well-86) was found to be more
sensitive because it meant that Level I low water conditions were met prior to the JW Trigger 1.
However, this is not considered a disadvantage of the Percentile approach since the Trigger
values can easily be manipulated to better reflect developing conditions in a well simply by
setting a new percentile value for the trigger. Flexibility in manipulating the percentile values for
triggers is an advantage of this approach as the JW trigger values are comparatively fixed (less
flexible as calculated based on mean and standard deviation). However, comparison with more
long term data and especially for those years when confirmed drought conditions developed in an
aquifer (as shown by social, economic etc. impacts) are necessary to fine tune both Percentile
and JW Triggers.
The JW approach defines triggers and indictors for both on-set and recovery of the low water
conditions. However, the Percentile approach only relies on attaining a certain percentile value
for each trigger. As in the case of Percentile approach, the cycle of shifting between recovery and
low water conditions (Level I in one month and Level II in the next or vice versa) seems far
quicker and frequent (as shown by Well-156), this means that rapidly changing weather
conditions or water level changes in the aquifer will impact the Percentile Triggers more
frequently. Therefore, it is necessary to clearly define how the recovery in a well after a period of
low conditions is to be interpreted if utilizing the percentile triggers in order to avoid too
frequent advisories etc. to the watershed residents.

64
Overall, both approaches proved to be useful tools for analyzing the water level trends. However,
they must be applied with caution, especially when translating the indictors to represent the
aquifer behavior. This is because the aquifer may be slow to respond to climate changes, or the
aquifer response may be highly localized depending on the type of well, type of aquifer, recharge
and other factors such as density of well users in an area, pumping effects etc. These factors will
impact the water levels, which may not be reflected in the indicator value directly. If the
indictors are to be used at local scale, then it is suggested that a suitable network of monitoring
wells be established which properly represents the aquifer in the area, and the factors affecting
the aquifer behavior must be clearly understood. Also, there should be very reliable baseline
water level data available for an aquifer (or an area) when extreme water conditions (well doing
dry, etc.) developed as this will help to confirm how the water levels behave drying extreme
events and to set indicator values which are more reflective of the aquifer conditions.
The groundwater triggers as indicators for the Ontario Low Water Response Program have their
utility, as these can be used to report on the developing low water conditions in an area
represented by a water well or in an aquifer. Both the JW and Percentile indicators seem
suitable, and the use of both can complement each other by fully capturing the water level trends
and aquifer behavior in response to climate changes or anthropogenic activities. However,
considering that Percentile Triggers are simpler to apply, do not require the Level I or Level II
water conditions to be declared for a long period of time, and that the percentile triggers are
relatively flexible (values can be easily redefined to better represent an aquifer behavior), the
Percentile Approach has an advantage over the JW Approach.
5.6.2. Calculation Approaches
Calculation of both JW and Percentile triggers was done using the spreadsheets tools. Although
the spreadsheets were automated for the most part, it still involved a lot of pasting and copying
operations especially for raw water level data. In consideration of the huge amount of data used
in the analysis, the percentiles approach proved to be more time consuming and cumbersome.
However, JW indicator calculations were found to be more complicated (compared to percentile
formulas) as they required more advanced understanding of worksheet functionality (complex
macros etc.) to manipulate data and calculate means, standard deviation etc. However, both
approaches were prone to errors during pasting, copying, etc. while the analysis was in progress.
In terms of graphic representation (charts etc.), the JW indicators are simpler to display and
visually interpret being fewer in number as compared to the five percentile indicators.
In terms of level of expertise required to undertake the analysis, neither approach seemed to be
very demanding. Both methods were considered to be simple and did not require high levels of
expertise or familiarization with complex mathematical and statistical methods. The actual
difficulty lies in interpretation of the results and when a comparison is undertaken. The
Percentile approach, with its five indicators, may be more confusing to interpret than the three
indicators of the JW approach. On the other hand, the JW approach is at a disadvantage due to
the use of standard deviations and mean water levels which are hard to explain conceptually or
understand in terms of behavior of the actual water levels.
Both approaches required extensive QA/QC on the raw data prior to the actual analysis stage
when indicators were calculated. The Percentile method seemed more sensitive to outlier data or

65
spikes in water levels; therefore the data needed to be more intensively scrutinized. Depending
on the length of the data record, the outliers, spikes etc. seem to impact the JW calculations as
well (as standard deviation is miscalculated) to some degree. The most critical was the value of
zero in the raw data which may significantly alter the outcome of the JW triggers.
The JW approach may introduce relatively higher degree of inaccuracy for interpreting aquifer
conditions where the water levels are not following symmetrical seasonal variations (normal
distribution of the data). This is because the greater the variations in water levels, which are far
from the mean water levels, the higher the deviation from the actual water levels which will
reflect on the indicator value and may not be representative of actual aquifer conditions.
Accounting for the simpler mathematical formulas for percentiles and easier understanding of the
percentile concept, the Percentile Approach has an advantage over the JW Approach.

66
6. Conclusions and Recommendations
The groundwater trigger levels were calculated for selected wells. These wells were monitored
during the summer of 2008 (April to October) to determine when water levels in a well fell
below the JW triggers (Trigger 1 and II) and met the Level I (indication of potential water supply
problems), Level II (potentially serious problems) and level III (failure of the water supply to
meet the demand) thresholds as set out in the Jacques Whitford Groundwater Indicator Report
(JW 2008). The collected water level data was also used to determine when the water levels in a
well dropped below the 25th
Percentile (Trigger 1 - below normal water levels), 10th
Percentile
(Trigger 2-dry conditions) or 5th
Percentile (very dry conditions), to assess whether these wells
would identify the state of an aquifer in response to climate change based on the Percentile
methodology. The results of the analysis are presented and discussed in Section 5 of the report.
The water levels in 2008 remained consistently higher than the triggers and indicators of both
approaches. Therefore, two years (2003 and 2007) which showed low water level trends were
selected and used to test the utility of the indicators and triggers. The results of this exercise are
documented in Section 5 of this report.
Based on the analysis and comparison undertaken, it is concluded that:
1. The accuracy of the indicators is greatly dependent on length of the available water level
records and the number of wells being monitored. This accuracy can be greatly increased
by incorporating more wells and collecting more water level data that captures a wider
range of seasonal variations.
2. It is critical that there is very reliable water level data available from a well (an aquifer)
when extreme conditions (well going dry, etc.) developed in an area and caused
economical, environmental, social, etc. impacts. This will help to confirm how the water
levels behave during extreme events and to identify the water levels where the impacts
are anticipated. This reference dry year data will further help to refine indicator values
which are more representative of the aquifer conditions.
3. Both approaches for calculating indicators apply simple statistical and mathematical
techniques. Therefore, high levels of expertise and familiarization with complex
mathematical or statistical methods is not required. Both approaches use spreadsheet
tools and involve huge amounts of data which makes the analysis and calculations
cumbersome and prone to mistakes. Both approaches require a high degree of QA/QC for
proper analysis. However, because the mathematical formulas are easier for percentiles
and the concept is simpler, the Percentile approach has an advantage.
4. In some wells, the JW Trigger 1 and Percentile Trigger 1 did not correlate very well.
Those are the wells which showed water level variations which are inconsistent with
seasonal changes, or where the water levels had wider variations. The JW triggers are
calculated based on statistical analysis i.e. normal distribution and mean deviations.
Therefore, it seems that the JW indicator may describe the groundwater levels in a
reasonable degree for wells where the variations in groundwater levels follow a
symmetric distribution about the mean. However, percentile indicators seem to better
reflect the water levels in wells with wider variations since the percentile technique is
based on accounting for the actual amount of variation in a well. However, these

67
differences are not considered to be critical and may not be significant if a lengthy data
record is available. Both approaches need to be applied with caution accounting for the
type of well, range of water level variations, amount of data available, factors affecting
water level behavior and whether the basic assumptions of a technique (normal
distribution of data as assumed for JW approach) being applied are met. It is recognized
that the percentile indicators have advantage over the JW triggers in the sense that the
percentile values can be easily manipulated so that the triggers are more or less sensitive
to the developing conditions. This manipulation should be undertaken carefully and
should be based on the water levels observed in dry years and especially those when the
impacts on aquifers (wells going dry etc.) were evident.
5. The Percentile Trigger 1 is more sensitive than the JW Trigger 1. On the other hand, JW
Trigger 2 was found to be more sensitive than the Percentile Trigger 2.
6. In case of JW Triggers, the Level I and Level II conditions (both for on-set and recovery
of the low water conditions) can persist for long periods of time whereas with Percentile
Triggers, the aquifer or well may be out of Level I or Level II conditions as soon as the
water levels recover to their noted values for each percentile. In other words, the JW
Approach will result in Level I or II being declared for much longer durations once it is
entered, as compared to the Percentile Approach. However, the Percentile Approach will
result in frequent declaration of Level I or Level II, if weather conditions are changing or
water levels are cycling rapidly.
7. In the perspective of aquifers, it does not really matter whether the water levels are above
normal (75th
Percentile), at maximum levels (100th
Percentile) or beyond maximum since
aquifer will be able to meet the demand in either case (unless the well is a shallow well
and does not have sufficient borehole storage so even minor changes in water levels will
have an impact). The impacts may only be experienced when the water levels start to
drop below 50th
Percentile. Therefore, in terms of interpretation of indicators, the 75th
and
100th
percentile are conveying the same indication i.e. water levels are in normal or above
normal range. Even if the indicator values are refined, these indicators will interpret the
aquifer behavior in the same way. It may be worth decreasing the number of percentile
indicators, especially the 75th
and 100th
percentiles (perhaps by eliminating and widening
the range of percentiles that a trigger represents or by combining some of the triggers into
one). However, these indicators are still useful to establish whether the observed water
levels are within the normal or above normal ranges of historical water levels.
8. The Percentile approach does not differentiate how the triggers and indicators are to be
applied during the on-set of low conditions or in recovery cycle. Under certain conditions
(rapidly fluctuating water levels), this may result in frequent advisories regarding the low
water conditions in watershed.
9. Water level indicators are a useful tool to quickly establish whether the observed water
levels are falling below the historical low water levels on record. This can be combined
with further analysis (rainfall etc.) to determine whether the climate changes (low rainfall
etc.) are causing these impacts on the aquifers. However, they must be applied with
caution, especially when translating the indicators to represent or explain the aquifer
behavior in an area. This is because the aquifer behavior is impacted by a whole range of

68
factors other than the weather events which may not be directly reflected by the
indicators.
10. The groundwater triggers as indicators for the Ontario Low Water Response Program
have their utility as these can be used to report on the developing low water conditions in
an area represented by a water well or in an aquifer. Both the JW and Percentile
indicators seem suitable, and the use of both can complement each other by fully
capturing the water level trends and aquifer behavior in response to climate changes or
anthropogenic activities. However, considering easier mathematical formulas for
percentiles, simpler understanding of the percentile concept, and that the percentile
triggers are flexible (values can be easily redefined to better represent aquifer response to
the climate changes), Percentile approach is at an advantage.

69
7. REFERENCES
1. Guidance Document for Using the Percentile Method for Calculating Trigger Levels for
Groundwater for the Ontario Low Water Response Plan., Ministry of Environment,
March 2008 (MOE 2008).
2. Final Report: Develop a Groundwater Indicator for Ontario Low Water Response,
Ontario Ministry of Natural Resources, 2008 (JW 2008).
3. Ontario Low Water Response Plan, revised July 2003 (OLWR).
4. Provincial Groundwater Monitoring Network Information System (PGMIS). Ministry of
Environment.
5. MOU between Ministry of Natural Resources and Rideau Valley Conservation Authority
for Ontario Low Water Response Groundwater Indicator Pilot Project, March 2008.

70
Appendix A
(Logs)

71

72

73

74

75

76
Appendix B
(Well Photos)
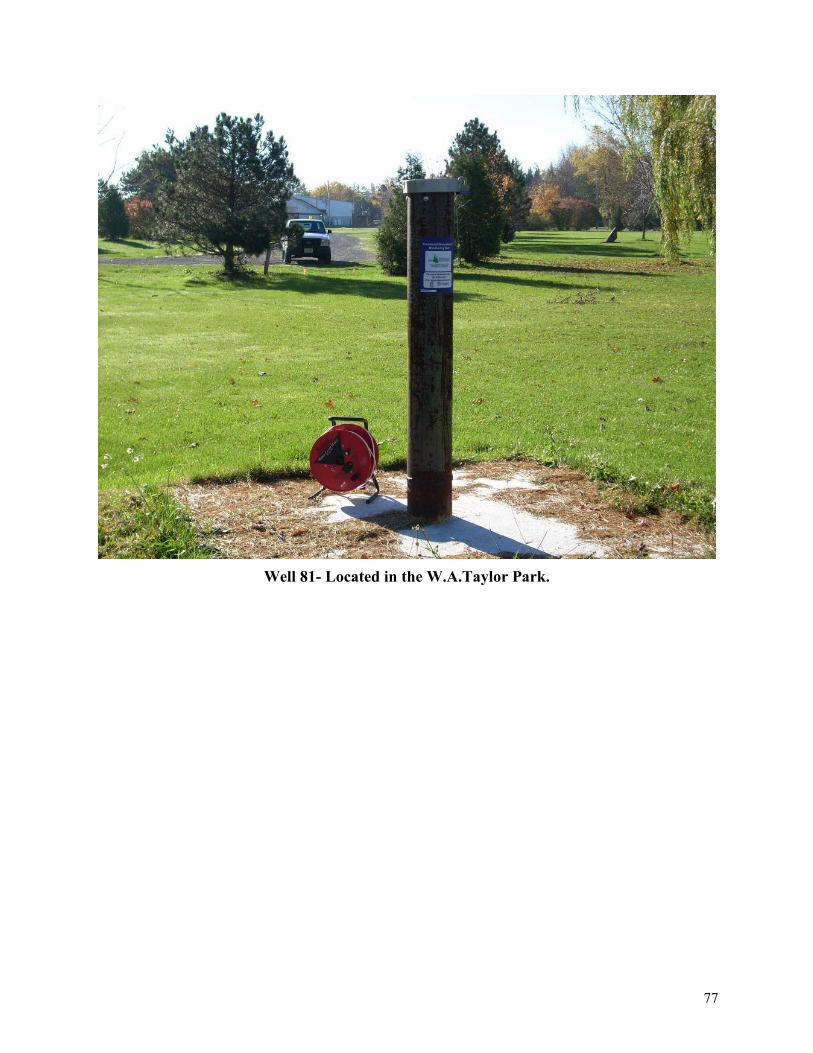
77
Well 81- Located in the W.A.Taylor Park.

78
Well 83- Located in the OMYA Industrial Plant site.
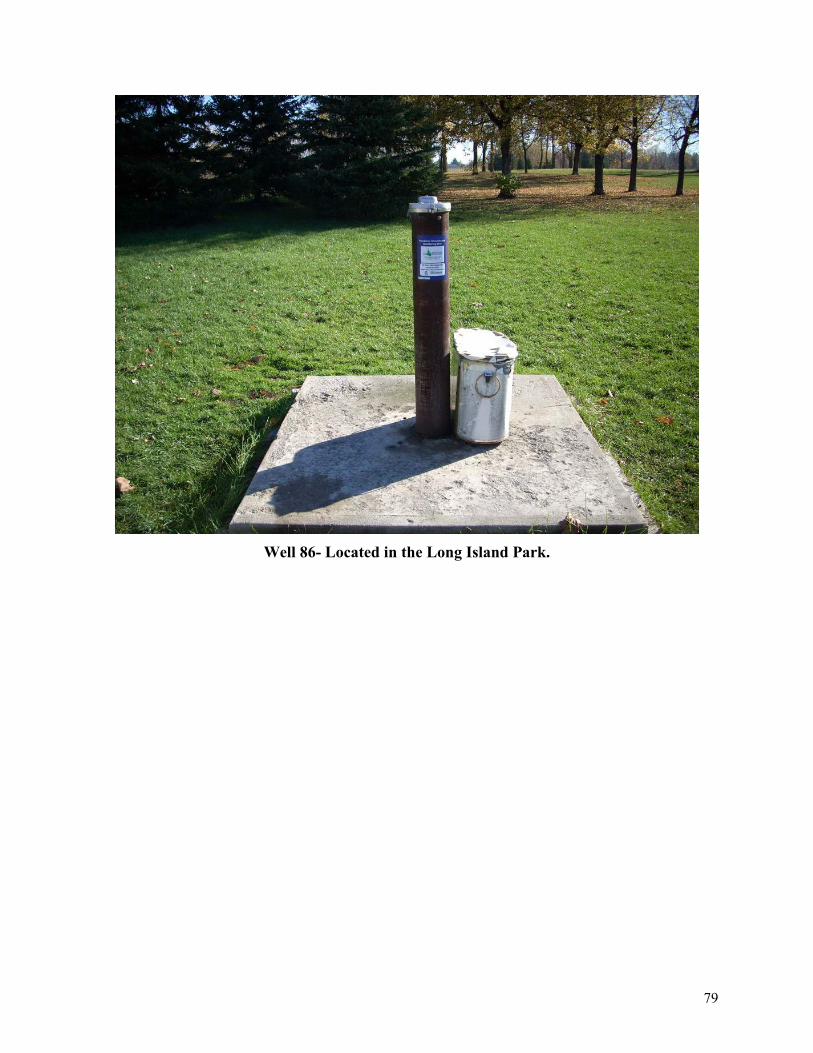
79
Well 86- Located in the Long Island Park.

80
Well- 156-2- Located along the Twin Elm Bridge.
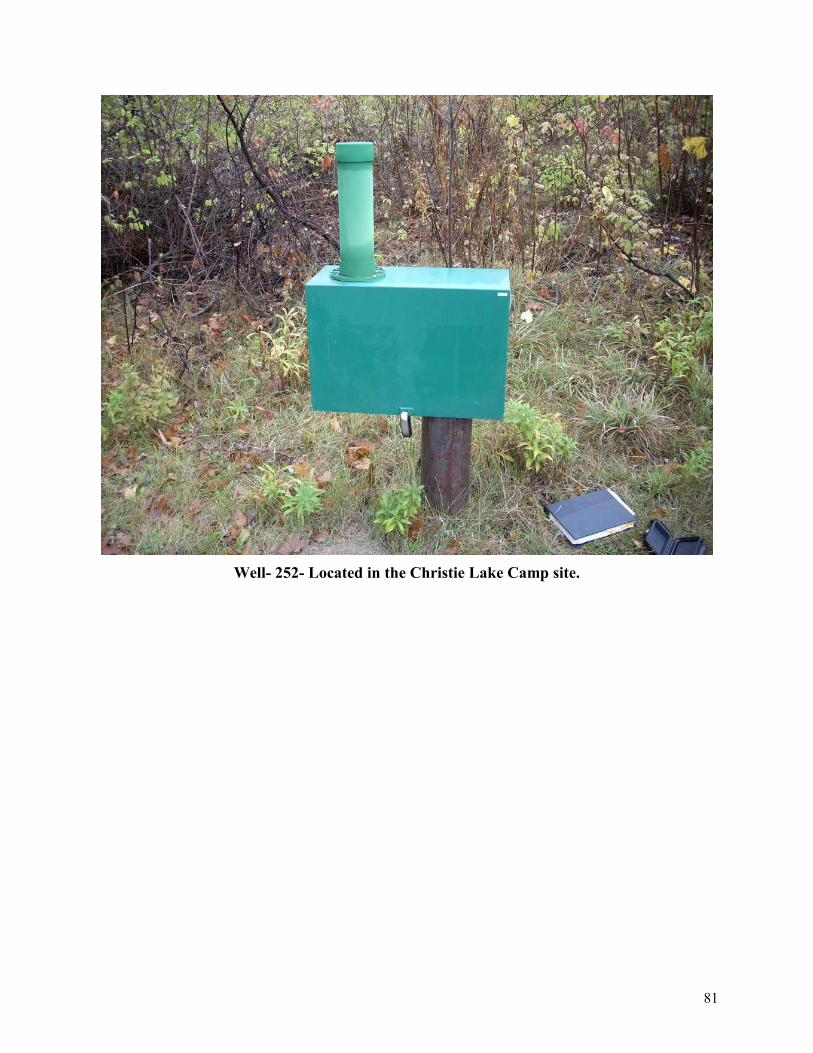
81
Well- 252- Located in the Christie Lake Camp site.

82
Appendix C
(Budget and Expenses)

83
Budget and Expense Report
Personnel Costs
Person Activity Person days Cost
Hydrogeologist - Project supervision, coordination
-Percentile analysis
-QA/QC
-Reporting
23
$9,935
Water Resources
Technician
- Fieldwork
- Data compilation
-QA/QC
11
$3,528
Engineering
Assistant
-JW analysis
-QA/QC
-Report review and editing
6 $1,809
Total: $15,272.00
Expenses
Item Cost
Vehicle use – 1600 km at $0.44/km $704
Printing, information management etc. $1,000
Equipment (computer etc.) in-kind
Total Expenses: $1,704
Total Costs: $16,976.00
Grant Funding Allocation: $10,606.38