
ON THE TEXTURE PROFILE ANALYSIS TEST - Tactical · PDF fileON THE TEXTURE PROFILE ANALYSIS...
12
ON THE TEXTURE PROFILE ANALYSIS TEST Trinh , Khanh Tuoc and Steve Glasgow Institute of Food Nutrition and Human Health Massey University ABSTRACT The texture profile analysis or TPA has been widely used for food products characterisation and quality control since it was invented by the General Foods Corporation Technical Centre in 1963. However not all the textural parameters defined in the original test are correct and useful. In addition, the results can be very misleading if the test is not conducted with the proper operational settings. This paper describes a number of key considerations for a successful textural analysis. Introduction Texture profile analysis (TPA) is an instrumental test originally developed at the General Foods Corporation Technical Centre (1963) to provide objective measurements of texture parameters, a major factor of food acceptability. It was designed as a two cycle compression performed to simulate successive “chews”. The test was originally designed to be performed through the reciprocating action of a specially designed instrument: the General Foods Texturometer. Brenan et al. (1975) have analysed the mechanical action of the Texturometer in some detail. Bourne adapted it to the Instron Universal Testing Machine and Bourne’s paper (1978) remains according to Szczesniak, one of the originators of the tests, as the key reference to TPA (Szczesniak, 1996) with more than 950 citations. The Instron is a relatively large machine used for testing the mechanical properties of materials and components and in recent years smaller commercial texture analysers have been designed especially for food TPA. Because the test is simple and the textural parameters deduced intuitively understandable, it has become very popular. However, Breene (1975) noted that changes to the original definition of the parameters have been quite disorganised and “major shortcomings of studies involving TPA include poor experimental design, absence or improper use of statistical analysis and incomplete description of experimental materials and testing conditions. Recently, Szczesniak pointed to ‘misuse’ of the method, and a poor understanding of the meaning of the parameters and the manner in which the method should be executed citing for example the use of a penetrating needle (rather than a compressing plate): penetrating the sample twice in the same spot leads to meaningless data and the test should not be called TPA. She argued that time is ripe to have a 'round table' discussion (either face-to-face or on the Internet) of how TPA should be executed. This paper discusses a number of issues related to the definitions of the TPA parameters and important considerations for the test operating conditions.
Transcript of ON THE TEXTURE PROFILE ANALYSIS TEST - Tactical · PDF fileON THE TEXTURE PROFILE ANALYSIS...
ON THE TEXTURE PROFILE ANALYSIS TEST
Trinh, Khanh Tuoc and Steve Glasgow
Institute of Food Nutrition and Human Health Massey University
ABSTRACT The texture profile analysis or TPA has been widely used for food products characterisation and quality control since it was invented by the General Foods Corporation Technical Centre in 1963. However not all the textural parameters defined in the original test are correct and useful. In addition, the results can be very misleading if the test is not conducted with the proper operational settings. This paper describes a number of key considerations for a successful textural analysis.
Introduction Texture profile analysis (TPA) is an instrumental test originally developed at the General Foods Corporation Technical Centre (1963) to provide objective measurements of texture parameters, a major factor of food acceptability. It was designed as a two cycle compression performed to simulate successive “chews”. The test was originally designed to be performed through the reciprocating action of a specially designed instrument: the General Foods Texturometer. Brenan et al. (1975) have analysed the mechanical action of the Texturometer in some detail. Bourne adapted it to the Instron Universal Testing Machine and Bourne’s paper (1978) remains according to Szczesniak, one of the originators of the tests, as the key reference to TPA (Szczesniak, 1996) with more than 950 citations. The Instron is a relatively large machine used for testing the mechanical properties of materials and components and in recent years smaller commercial texture analysers have been designed especially for food TPA.
Because the test is simple and the textural parameters deduced intuitively understandable, it has become very popular. However, Breene (1975) noted that changes to the original definition of the parameters have been quite disorganised and “major shortcomings of studies involving TPA include poor experimental design, absence or improper use of statistical analysis and incomplete description of experimental materials and testing conditions. Recently, Szczesniak pointed to ‘misuse’ of the method, and a poor understanding of the meaning of the parameters and the manner in which the method should be executed citing for example the use of a penetrating needle (rather than a compressing plate): penetrating the sample twice in the same spot leads to meaningless data and the test should not be called TPA. She argued that time is ripe to have a 'round table' discussion (either face-to-face or on the Internet) of how TPA should be executed.
This paper discusses a number of issues related to the definitions of the TPA parameters and important considerations for the test operating conditions.
T.K.Trinh
2
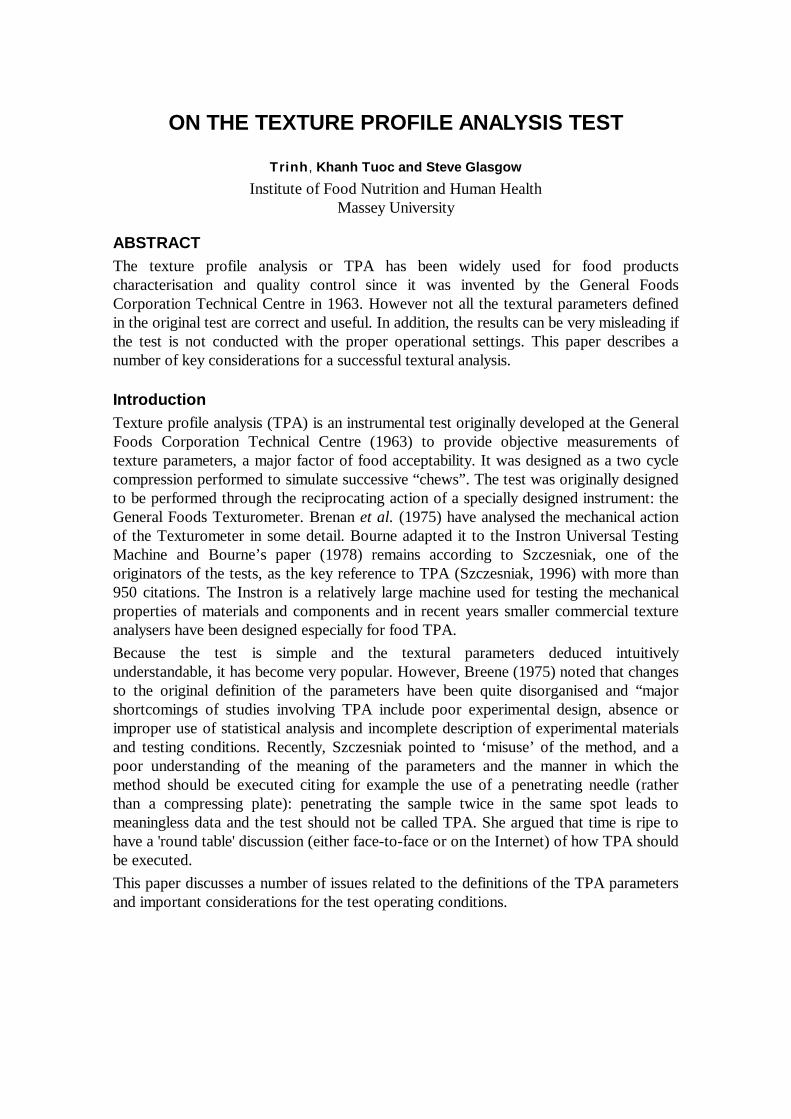
Original TPA parameters A force-time plot for a two bite test TPA performed on a cylinder of Brie cheese of original diameter 15.7 mm and height 15.605 mm is shown in Figure 1.
Figure 1 Force-time curves for a two bite test on Colby cheese.
Szczesniak (1963) and Brandt et. al. (1963) grouped the textural properties as initial (on first bite: hardness, viscosity, brittleness), masticatory (during chewing: gumminess, chewiness, adhesiveness) and residual (rate of breakdown, type of breakdown). The original TPA parameters defined by the General Foods Corporation group are
TPA parameter (SI unit)
Definition How measured
Hardness (N) Force required for a pre-determined deformation
Force at P1
Fracturability (N) Force at the first significant break in the curve
Force at F1
Cohesiveness (no unit)
Strength of internal bonds in the sample
Adhesiveness (J) Work required to overcome the sticky forces between the sample and the probe
Gumminess (N) Energy needed to disintegrate a semisolid food until it is ready to swallow
Hardness*Cohesiveness
Chewiness (J) Energy needed to chew a solid food until it is ready for swallowing
Hardness*Cohesiveness*Springiness

T.K.Trinh
3
Springiness (m) Originally called “Elasticity”: rate at which a deformed sample returns to its original size and shape
Stringiness (m) Distance travelled by the probe during the negative force area
Table 1. Definition of different textural parameters in the TPA. Adapted from Guinee (2003).
Interpretations of- and modifications to the TPA parameters The textural definitions in Table 1 are, in many ways, self-explanatory but empirical, and not all authors have the same interpretations. In our view meaningful textural parameters must be independent of the size and shape of the samples tested. Many of the original TPA parameters do not satisfy this requirement. In addition, it is important to describe correctly the physical significance of the parameters defined. The key TPA parameters are discussed below.
Hardness
The hardness was originally identified by Friedman et al. (1963) with the force .
Clearly, it will vary with the size of the contact area between the sample and the probe as well as the amount of compression stipulated by the operator. In the original TPA test, the specimen size and probe travel of the Texturometer were standardised and therefore comparison of forces for different samples made some sense but in present applications where operators randomly choose sample size and test conditions then this value is quite meaningless and should be ignored. If an indication of firmness is required, Young’s modulus should be calculated.
Cohesiveness
There are three alternative definitions of cohesiveness, all of them dimensionally correct. Friedman et al (1963, op. cit.) defined the cohesiveness as the ratio of energies expanded in the first and second cycles
1
2
w1c1
w2c2
A
A
AA
AAssCohesivene =
++= (1)
Bourne (2002, 1978) argued that only the energies expanded in the compression (biting) phase of the cycles should be considered
c1
c2
A
AssCohesivene = (2)
Olkku and Rha (1975) and Peleg (1976) suggested a further modification to the formulation
w1c1
w2c2
AA
AAssCohesivene
−−=
(3)
These definitions can be further detailed as follows. Equation (1) represents the total amount of energy required in mastication: both closing (biting) and opening (releasing) the jaws. Equation (2) measures the resistance of the food to the bite (energy required

T.K.Trinh
4
for biting but not releasing the jaws). However, some of the energy expanded during biting is stored in the food as elastic energy and released again during the withdrawal (releasing) phase and therefore should not be counted as energy required to break the bonds in the food. Therefore equation (3) estimates more closely the energy contained in the bonds.
Elasticity
This is one of several TPA parameters where the original definition is, in our view, incorrect either conceptually or dimensionally. Szczesniak (1963) defined elasticity as “the rate at which a deformed material goes back to its un-deformed condition after the deforming force is removed” but this was identified by Friedman et. al. (1963) as the length 2d . This is not really a rate which would have units of m/s but a distance. Bourne calls it springiness. In the first cycle, the distance 1d represents the maximum travel of the probe set by the user. After this first cycle, the top surface of the sample has shifted and for the same travel of the probe, the distance measured from the top surface of the deformed sample in the second bite is2d . Obviously the distance2d is a function of the user defined
distance 1d as well as the dimensions of the original sample. In our view elasticity should be a dimensionless parameter defined as
1
2
d
dsSpringinesElasticity == (4)
Resilience, defined by www.texturetechnologies.com as “a measure of how well a product fights to regain its original position” is a parameter similar to elasticity. But it is expressed as a ratio of energies instead of a ratio of distance
(5)
Most consumers are likely to sense recoverable distance more easily than recoverable energy when tasting foods. For this reason equation (4) will be more useful than equation (5). Stringiness When a material adheres strongly to the surface on which it rests, it will stretch when it is pulled out. This property called Stringiness is important in some products like Mozzarella cheese used in pizza toppings because of a texture favoured by customers. Szczesniak (2006) calls it stretchability. The distance 3d is again a function of the user
defined distance 1d as well as the dimensions of the original sample. Thus it should be a dimensionless parameter defined as
1
3
d
dsStringines = (6)
Gumminess
The concept of Gumminess (hardness x cohesiveness) is one that we have found difficult to visualise. It is clearly dimensionally incorrect. It is expressed as a force and therefore cannot be described as the energy needed to disintegrate a semi-solid food until it is ready for swallowing.
T.K.Trinh
5
Peleg’s formula, equation (3), is much more representative of that energy and may be relabelled as gumminess and Bourne’s formula, equation (2) used to define cohesiveness because it more truly represents how much internal bonding energy remains in the sample after the first bite.
Chewiness and its alternatives
As it stands, the definition of chewiness in Table 1 involves the force 1P in the first bite,
the cohesiveness and the distance2d in the second bite. While it is dimensionally correct, we struggle to visualise what energy term the product of a force developed in the first bite 1P by a deformation 2d in the second bite represents physically.
To decide when the food is ready for swallowing we should first decide on the particle size of the food at that junction. This swallowing size will vary between different social groups and must be determined through customer surveys. Then chewiness can be defined as the number of bites required to break the food down to this swallowing size or as a rate of breakdown.
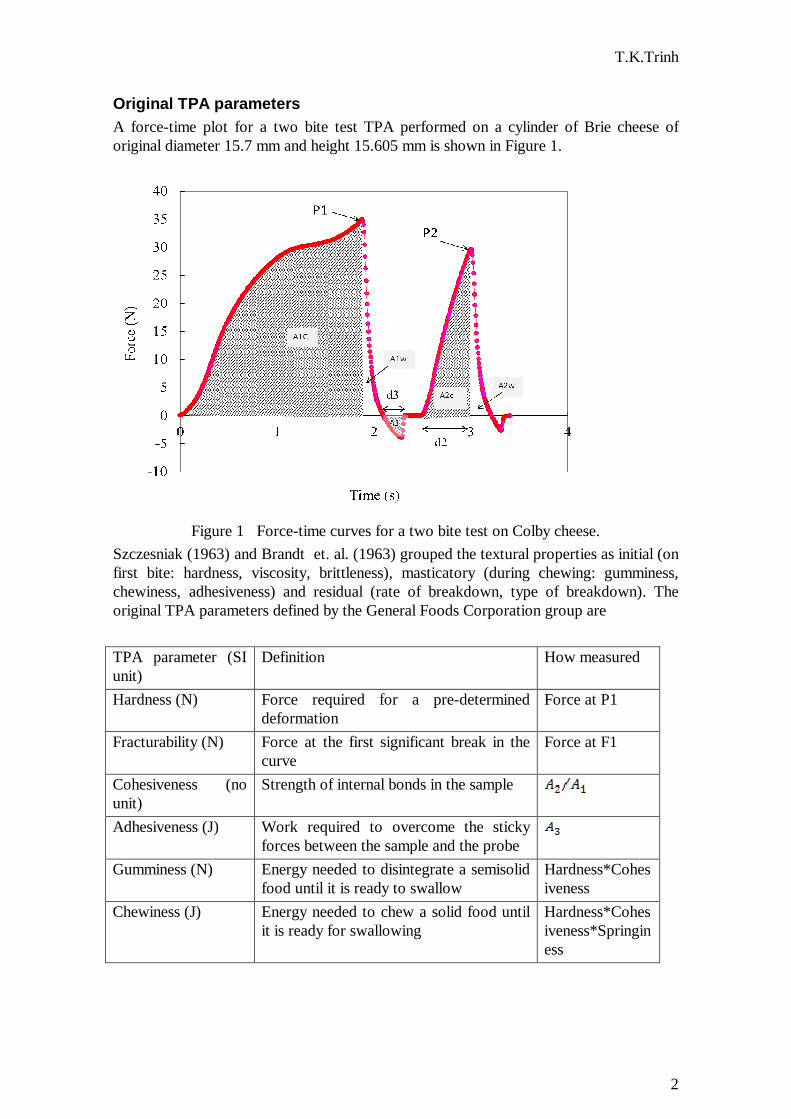
Figure 2. Five cycle compression of a cylinder of hard butter
The rate of breakdown cannot be obtained effectively from a two bite test. Most likely the instantaneous rate of breakdown will not be a constant but will change between bites. A simple way to obtain this information is to perform a multiple, e.g. five-bite test. The average rate of breakdown can be expressed, for example, as change in dimension e.g. height per bite or as bonding energy lost per bite. Consider the five cycle compression of a cylinder of hard butter in Figure 2.
The average rate of breakdown may be defined as ( ) ( )
1
51
4A
AAbreakdownofRate
−= (7)
Or more accurately

T.K.Trinh
6
( )
1
4
11
4A
AAbreakdownofRate i
ii∑ −= =
+
(8)
The energies represented by the areas under the force-time curves for the five cycles in Figure 2 are shown in Table 2. We have shown here the areas defined by Friedman et al (equation 1) in preference to the definitions of Bourne (equation 2) and Peleg (equation 3) because it is not possible to define the break force for the second and subsequent cycles. The average rate of breakdown per cycle is
24.0157.804
7.516-157.80 =×
=breakdownofrateAverage
However, an average rate of breakdown is not as revealing as a plot of rate of breakdown against cycle number shown in Figure 3. Rate of breakdown in five cycle compression of hard butterFigure 3. It shows that most of the breakdown occurs after the first cycle of compression. Further breakdown in subsequent cycles is marginal.
Table 2. Areas under 5 cycle compression graph in Figure 2.
cycle A(i) A(i)-A(i+1)
Rate of breakdown
1 157.8007
2 36.49242 121.3083 0.76874364
3 21.51565 14.97677 0.09490941
4 11.51288 10.00277 0.06338862
5 7.516363 3.996513 0.02532633
0
0.1
0.2
0.3
0.4
0.5
0.6
0.7
0.8
0.9
1 2 3 4 5 6
Cycle
Rat
e o
f bre
akd
on
Figure 3. Rate of breakdown in five cycle compression of hard butter
T.K.Trinh
7
The rate of breakdown is a very useful parameter even with a two bite test. For example when comparing two products a very fast rate of breakdown would relate to crispiness and a very slow rate of breakdown with toughness. Within this observation, we may offer an alternative to the definition of chewiness proposed by Friedman et al. in Table 1.
breakdownofRateChewiness = (9)
Then the energy required to disintegrate the food until it is ready to swallow is the sum of the energies expanded in each successive bite
( )∑ +=ns
1nwn AAstrengthChewing ) (10)
Where ns is the number of bites required to reach the breakdown to swallowing particle size. For semisolid foods a five bite test should be sufficient to determinens . Materials with high chewing strengths are clearly tough. This discussion illustrates the power of the simple compression test when the data is analysed logically and the flexibility that the users have in defining their own measures of food texture. In addition the parameters derived in the TPA will have more general application if based on the stress-strain graph, not the force-distance graph. The area under the curve then represents and energy per unit volume of sample material and becomes independent of sample size.
Experimental settings for the TPA
Test speed
Many of the TPA properties are based on energy considerations as shown in Table 1. The area under the force-displacement curve represents energy since
DistanceForceEnergy ×=
When energy parameters are evaluated by using the force-time curve we simply divide the results by the value of the speed of travel of the probe to obtain the distance travelled
TimeVelocityDistance ×=
It is essential therefore to conduct the TPA with the same speed of compression and withdrawal to compare energies during the compression and withdrawal phases of the cycle.
Compression distance
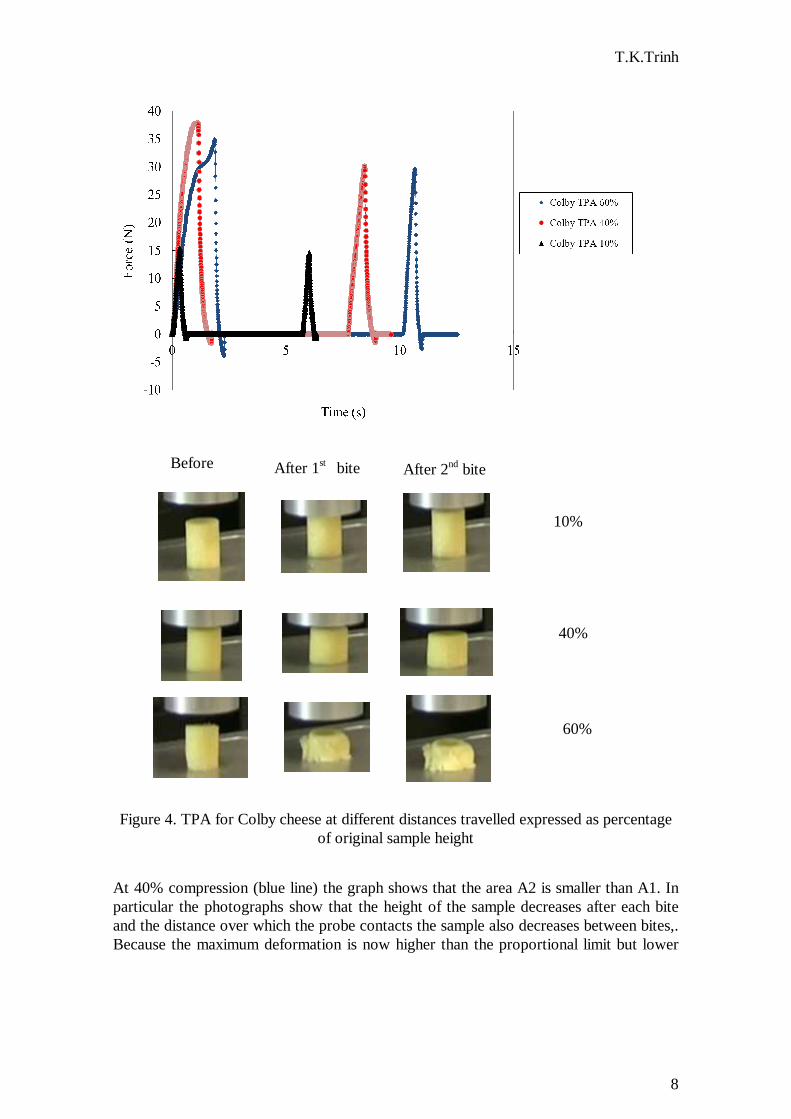
The maximum distance of compression (or deformation) should also be considered. Figure 4 shows three TPA runs using samples of commercial Colby cheese where the maximum distance travelled by the probe has been set at 10%, 40% and 60% of the original sample height.
At 10% (black line), the maximum deformation is smaller than proportional limit (PL): the material behaves as a perfectly elastic body and the cohesiveness will always be one. The photographs show that the sample retained its original shape after the first and second bite.
T.K.Trinh
8
Figure 4. TPA for Colby cheese at different distances travelled expressed as percentage of original sample height
At 40% compression (blue line) the graph shows that the area A2 is smaller than A1. In particular the photographs show that the height of the sample decreases after each bite and the distance over which the probe contacts the sample also decreases between bites,. Because the maximum deformation is now higher than the proportional limit but lower
Before After 1st bite After 2nd bite
10%
40%
60%
T.K.Trinh
9
than the break point, permanent deformation is achieved between bites, plastic flow has occurred.
At 60% (red line) the graph shows that the area A1 is much greater than at 10% and 40% because the distance over which the probe contacts the sample is increased. But the photographs show that the reduction in height between the first and second bite is small because the distance of contact in the second bite is short. Thus when the maximum deformation is greater than the break point, the second cycle is basically compressing the pieces left after breakup and the cohesiveness obtained under these conditions does not really represent “the strength of the internal bonds” as stated in Table 1.
Therefore the preferred maximum distance of compression is best chosen between two limits: the elastic limit and the break point. These limits are determined by preliminary uniaxial compressions. This is not often realised, especially by new users of the TPA. Some experienced users have claimed that they can obtain good correlations between experimental and sensory assessments of cheese firmness irrespective of the compression ratio (maximum deformation to sample height). Guinee (op. cit.) discusses the issue in some details.
Comparative TPA tests
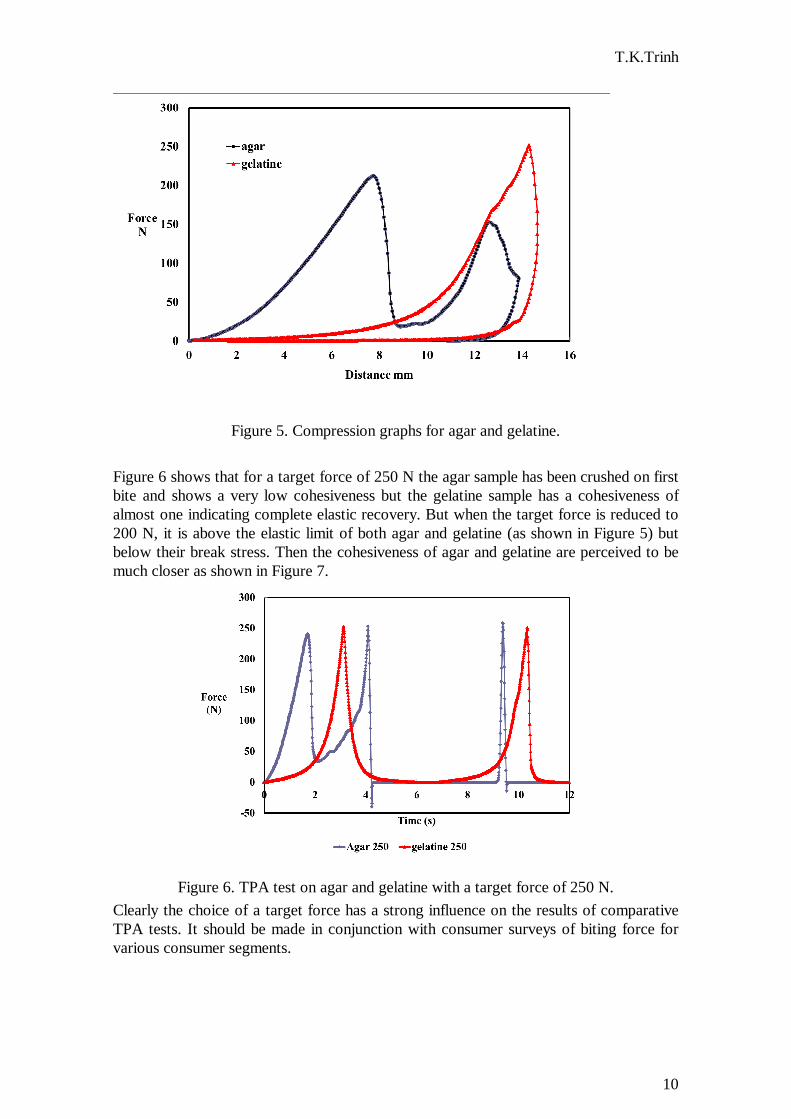
An important use of texture tests is for comparison between different food products. Unfortunately, very little information is available on the instrument settings most suitable for this purpose. We will base our discussion on a case study of agar and gelatine cylindrical samples approximately 20 mm in height and 30 mm in diameter. Figure 5 shows the force-displacement optimisation tests for these two types of gel. The data shows that the agar sample is harder: it breaks at a smaller deformation and higher compression force than gelatine. To compare the texture of these two materials TPA runs must be made on the two sets of sample with exactly the same settings in particular the same temperature, test speed, trigger force and target mode.
The most common target mode is percentage deformation (distance travelled by the probe in the first bite). Examination of Figure 5 shows that if the target distance is set between 8mm and 12 mm (40%-60%) then the agar sample will be broken on the first bite (low cohesiveness) but the gelatine sample will remain completely elastic (cohesiveness of one). On the other hand if the target distance is 16 mm (80%) then both materials will be broken on first bite and show low cohesiveness. If it is 4mm (20%) then the cohesiveness of both materials will be one. How can we then set a target mode that gives a meaningful comparison?
The key point to remember here is that instrumental texture tests are designed to provide objective measurements that reflect sensory evaluation by taste panels. Szczesniak and Hall (1975) stated even more clearly that “our experience has shown that it is highly desirable (almost mandatory) for the operator to be a trained sensory texture profiler when establishing instrumental test conditions for a product that has not been tested before on the Texturometer (TPA).” In our view the jaw movement in food mastication is defined by the force exerted, not the distance travelled. The stress applied by elderly customers is certainly lower than that exerted by the teen-age segment of the population. The former will thus perceive the sensation of hardness at a lower stress threshold.
T.K.Trinh
10
Figure 5. Compression graphs for agar and gelatine.
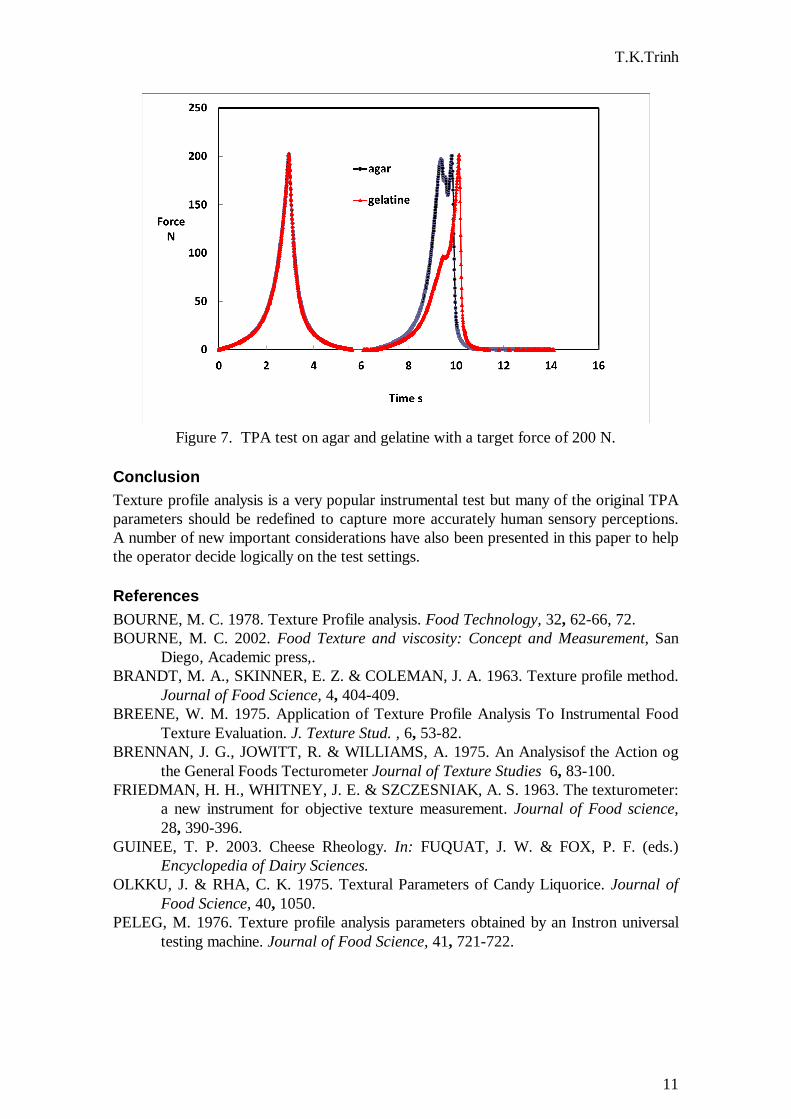
Figure 6 shows that for a target force of 250 N the agar sample has been crushed on first bite and shows a very low cohesiveness but the gelatine sample has a cohesiveness of almost one indicating complete elastic recovery. But when the target force is reduced to 200 N, it is above the elastic limit of both agar and gelatine (as shown in Figure 5) but below their break stress. Then the cohesiveness of agar and gelatine are perceived to be much closer as shown in Figure 7.
Figure 6. TPA test on agar and gelatine with a target force of 250 N.
Clearly the choice of a target force has a strong influence on the results of comparative TPA tests. It should be made in conjunction with consumer surveys of biting force for various consumer segments.
T.K.Trinh
11
Figure 7. TPA test on agar and gelatine with a target force of 200 N.
Conclusion Texture profile analysis is a very popular instrumental test but many of the original TPA parameters should be redefined to capture more accurately human sensory perceptions. A number of new important considerations have also been presented in this paper to help the operator decide logically on the test settings.
References BOURNE, M. C. 1978. Texture Profile analysis. Food Technology, 32, 62-66, 72. BOURNE, M. C. 2002. Food Texture and viscosity: Concept and Measurement, San
Diego, Academic press,. BRANDT, M. A., SKINNER, E. Z. & COLEMAN, J. A. 1963. Texture profile method.
Journal of Food Science, 4, 404-409. BREENE, W. M. 1975. Application of Texture Profile Analysis To Instrumental Food
Texture Evaluation. J. Texture Stud. , 6, 53-82. BRENNAN, J. G., JOWITT, R. & WILLIAMS, A. 1975. An Analysisof the Action og
the General Foods Tecturometer Journal of Texture Studies 6, 83-100. FRIEDMAN, H. H., WHITNEY, J. E. & SZCZESNIAK, A. S. 1963. The texturometer:
a new instrument for objective texture measurement. Journal of Food science, 28, 390-396.
GUINEE, T. P. 2003. Cheese Rheology. In: FUQUAT, J. W. & FOX, P. F. (eds.) Encyclopedia of Dairy Sciences.
OLKKU, J. & RHA, C. K. 1975. Textural Parameters of Candy Liquorice. Journal of Food Science, 40, 1050.
PELEG, M. 1976. Texture profile analysis parameters obtained by an Instron universal testing machine. Journal of Food Science, 41, 721-722.
T.K.Trinh
12
SZCZESNIAK, A. S. 1963. Classification of textural characteristics. Journal of Food science, 28, 385-389.
SZCZESNIAK, A. S. 1996. Texture Profile Analysis - Methodology Interpretation Clarifed. Journal of Texture Studies, 27, vi-vii.
SZCZESNIAK, A. S. 2006. Letter to the Editor. Journal of Texture Studies. SZCZESNIAK, A. S. & HALL, B. J. 1975. Application of the General Foods
Texturometer to Specific Food Products. Journal of Texture Studies, 6, 117-138.


![Introduction to Picture Profile - Sony · PDF fileIntroduction to Picture Profile What is Picture Profile? [1] Gamma and Knee [2] ... you can match the image texture with other types](https://static.fdocuments.us/doc/165x107/5aaecb637f8b9a3a038c9439/introduction-to-picture-profile-sony-to-picture-profile-what-is-picture-profile.jpg)
