
On the Role of River Systems in the Global Carbon Cycle (with a Twist) J. Richey March 12.
14
On the Role of River Systems in the Global Carbon Cycle (with a Twist) J. Richey March 12
-
date post
21-Dec-2015 -
Category
Documents
-
view
217 -
download
0
Transcript of On the Role of River Systems in the Global Carbon Cycle (with a Twist) J. Richey March 12.

On the Role of River Systems in the Global Carbon Cycle (with a Twist)
J. RicheyMarch 12

RIVERS IN THE GLOBAL CONTEXT
Riverine C Cycle The River Continuum
… a strategy for taking basic science information and translating it into water resource information and
management at regional scales

GLOBAL RIVER C CYCLE
VEGETATION
SOILS (+)
ATMOSPHERIC CO2
Active SOM,NP (1-2y)
Int. SOM,NP (20-40y)
Pass, SOM,NP (1000y)
Litter
COASTALOCEAN
SHELF SEDIMENTS
~.4 aw
DOC UV Ox?
.1 cw, ~.4aw
.1 cw,~.4aw
.2
.2
MCO3
.2S&S
gigatons/ycw = conventional wisdomaw = alternate wisdomS&S = sensu Sarmiento & Sundquist(+) anthro. effect
RIVERS
ESTUARIE
S
ANTHROPOGENICN,P, Toxics
(+:1.8+1.1)
(P Desorp)
PPR
PPT->Q
DAMSRIP
ARIAN
(1)CO2+H20+M(C,Si)O3->M+2HCO3(2) SOM->CO2
erosion, PPr
leaching
DIC (pCO2,HCO3)
POC (.5uM - 1mm)
DOC (%s < .5uM) Q (N,P,Toxics)
.4 (+)
.2 cw .5aw(++)
.2 (~)
.1 cw, ~.4aw
COASTALOCEAN

POC Loading by Geographic Region (Tg/y)
Oce
AsE
AsSE
SA NE
SA W
SA SE
NA WNA At
NA EGEA At
Eur
Afr W
Afr E
Aust
0
50
100
150
200
250
300
350"Traditional": 200
Area-loading: 350
Calc. Yield: 800
"Best Guess: ~500 ish"
A
SEAs
Discharge1.3 M m3/s
Ocn
Sediment Transport31,000 MT/y
A
SEAs

Are the Humid Tropics a Source or Sink of C?
Uptake (Towers)3-8 Mg C ha-1 y-1
Biomass Accumulation (long-term plots) .7 ± .4
Soil Accumulation (long-term plots) .6 ± .3
Deforestation 1-2 Pg y-1(?)
“…that leaks out of the forest in forms that are not usually measured, … Although this C leakage is thought to be relatively small, surprises cannot be ruled out.” Malhi and Grace (2000)
VOC (??)
Dissolved C
TOC Export (to the Sea)Global .4 - .8 Pg y-1
Amazon 36 Tg y-1 (.06 Mg C ha-1 y-1)
CO2 EVASION Amazon Mainstem 15 Tg y-1
River Corridors ?????

NPP
Evasion(i,t) = km2 * D(pCO2‑Ceq)/z
Richey et al. (in press). Nature.

$
$
$
$$
$
$
$$
$
$
$
$$$
PB-1
PB-2
JaruJIP-3
COM-1
COM-2
JIP-1
Rolim
UrupáJIP-2
JIP-4
JIP-5Preto
Machadinho
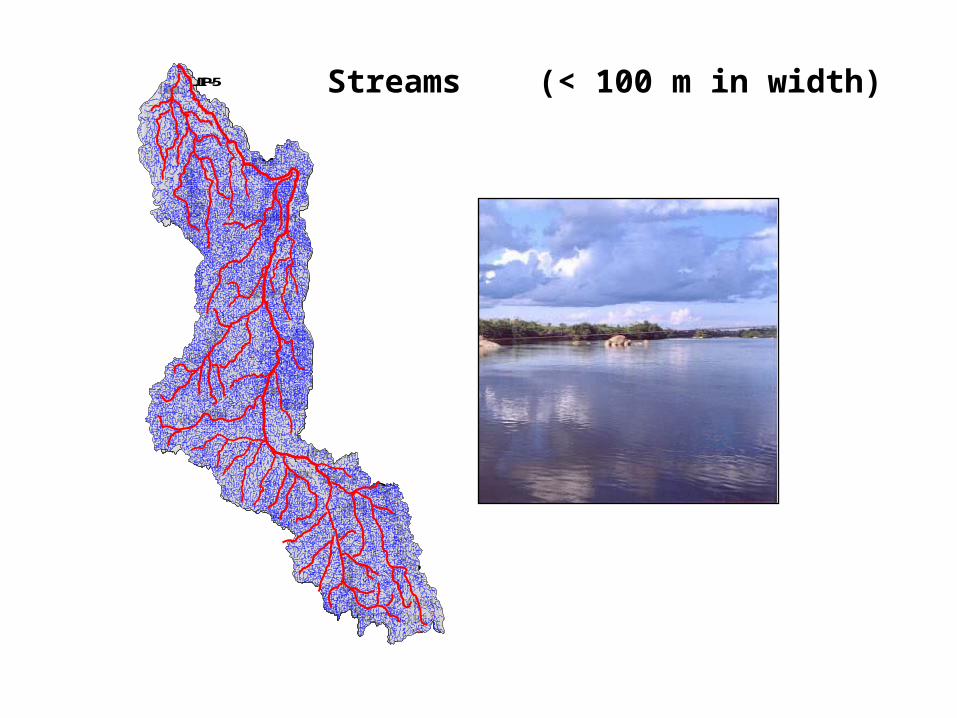
Streams (< 100 m in width)

15
0
5
10
20
25
J F M A M J J A S O N D
Flo
od
ed A
rea
(x 1
04 km
2 )
T (>100m)
MC
S (<100 m) MF
Inundation in Amazon Rivers
10
15
20
25
%
1.77 x 10⁶ km2

J F M A M J J A S O N D
0
4
8Man
pC
O2
(x 1
03 a
tm)
Dissolved Carbon Dioxide in Amazon Rivers
0
4
8
12
Man
Jt
Jr
Sol
IcMd
Pr
Ng
Jp
atm
15
0
5
10
20
25
30
J F M A M J J A S O N D
CO
2 E
vasi
on
(T
g C
mo
-1)
T (>100m)
S (<100 m)MF
MC
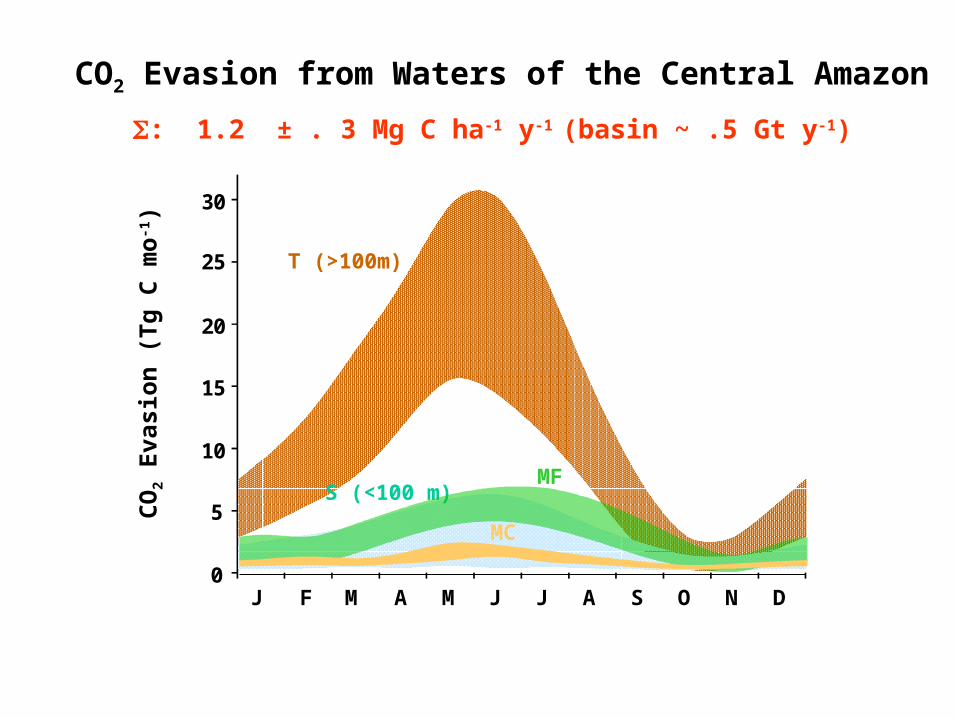
: 1.2 ± . 3 Mg C ha-1 y-1 (basin ~ .5 Gt y-1)
CO2 Evasion from Waters of the Central Amazon

POTENTIAL CO2 SOURCES
~ 1. 2 Mg C ha-1 y-1
0.0
0.4
0.6
Litterfall Plankton MacrophytesSoil DOCSoil CO2
0.2

Extrapolation to Humid Tropics:~0.9 Gt y-1
(3x > previous global)

Schimel et al. (2001) Gurney et al. (2002)
Zonal distribution of terrestrial and oceanic C (deduced from inverse models using different techniques and sets
of atmospheric data, corrected for anthropogenic emissions)
“… A return flux from water to the atmosphere of this (0.9) magnitude comes closer to reconciling independent carbon budgets for the tropics.”